Digital Holographic Capture and Optoelectronic Reconstruction for 3D Displays
15
Hindawi Publishing Corporation International Journal of Digital Multimedia Broadcasting Volume 2010, Article ID 759323, 14 pages doi:10.1155/2010/759323 Review Article Digital Holographic Capture and Optoelectronic Reconstruction for 3D Displays Damien P. Kelly, 1 David S. Monaghan, 1 Nitesh Pandey, 1 Tomasz Kozacki, 2 Aneta Michalkiewicz, 2 Grzegorz Finke, 2 Bryan M. Hennelly, 1 and Malgorzata Kujawinska 2 1 Department of Computer Science, National University of Ireland, Maynooth, Co. Kildare, Ireland 2 Institute of Micromechanics and Photonics, Warsaw University of Technology, 8 A. Boboli St., 02525 Warsaw, Poland Correspondence should be addressed to Bryan M. Hennelly, [email protected] Received 27 April 2009; Revised 29 September 2009; Accepted 8 December 2009 Academic Editor: Georgios Triantafyllidis Copyright © 2010 Damien P. Kelly et al. This is an open access article distributed under the Creative Commons Attribution License, which permits unrestricted use, distribution, and reproduction in any medium, provided the original work is properly cited. The application of digital holography as a viable solution to 3D capture and display technology is examined. A review of the current state of the field is presented in which some of the major challenges involved in a digital holographic solution are highlighted. These challenges include (i) the removal of the DC and conjugate image terms, which are features of the holographic recording process, (ii) the reduction of speckle noise, a characteristic of a coherent imaging process, (iii) increasing the angular range of perspective of digital holograms (iv) and replaying captured and/or processed digital holograms using spatial light modulators. Each of these challenges are examined theoretically and several solutions are put forward. Experimental results are presented that demonstrate the validity of the theoretical solutions. 1. Introduction 3D display systems generate a great deal of public interest. The idea that any event, ranging from the trivial to the momentous, could somehow be fully recorded and the 3D scene replayed at a later time for an audience in another location is highly desirable. However, current technologies are far from this futuristic conception of 3D technology. Nevertheless recent improvements in 3D display and capture technologies have led the way for plausible pseudo-3D scenes to be recorded allowing the user to avail of a realistic 3D experience. Consider for example the development of cin- ema, film, TV and computer gaming over the past 30 years. Entertainment industries are constantly pushing for better 3D experiences. Whether new technologies or approaches provide a suitably realistic 3D experiences, one must consider the human perception dimension to the problem, for a more complete account we refer the reader to Chapter 17 of [1]. The consistent and continuous improvement in the quality of the sound and special effects in films is noticeably apparent. Perhaps this is even more dramatically underlined in computer gaming when one compares the improvement in graphics over the past three decades. Future improvements in 3D technology are being prepared by major players in the industry; Both Dreamworks Animation and Pixar have stated their intention to release all future films in 3D; there is an increase in the number of 3D cinemas being constructed; public screenings of 3D football matches, and so forth, are being shown in an attempt to increase public awareness of 3D technology [2]. So the question arises, how will 3D cinema translate to 3D TV? It is a problem of content, in part, however as more people experience 3D cinema the demand for a similar 3D experience at home increases, which in turn drives the demand for 3D television content. There is a precedent for this, the changeover from black and white TV to colour TV. Several major technology companies such as Phillips and Holografika, currently have proto-types of 3D televisions that produce a convincing 3D experience. Although the current 3D technology may sometimes appear revolutionary, the fundamental science behind it is as old as film itself [3]. The central idea underpinning the 3D experience is that of stereoscopic vision [3, 4]: an observer viewing a scene sees two similar but slightly displaced versions of that scene with
Transcript of Digital Holographic Capture and Optoelectronic Reconstruction for 3D Displays

Hindawi Publishing CorporationInternational Journal of Digital Multimedia BroadcastingVolume 2010, Article ID 759323, 14 pagesdoi:10.1155/2010/759323
Review Article
Digital Holographic Capture and OptoelectronicReconstruction for 3D Displays
Damien P. Kelly,1 David S. Monaghan,1 Nitesh Pandey,1 Tomasz Kozacki,2
Aneta Michałkiewicz,2 Grzegorz Finke,2 Bryan M. Hennelly,1 and Malgorzata Kujawinska2
1 Department of Computer Science, National University of Ireland, Maynooth, Co. Kildare, Ireland2 Institute of Micromechanics and Photonics, Warsaw University of Technology, 8 A. Boboli St., 02525 Warsaw, Poland
Correspondence should be addressed to Bryan M. Hennelly, [email protected]
Received 27 April 2009; Revised 29 September 2009; Accepted 8 December 2009
Academic Editor: Georgios Triantafyllidis
Copyright © 2010 Damien P. Kelly et al. This is an open access article distributed under the Creative Commons AttributionLicense, which permits unrestricted use, distribution, and reproduction in any medium, provided the original work is properlycited.
The application of digital holography as a viable solution to 3D capture and display technology is examined. A review of the currentstate of the field is presented in which some of the major challenges involved in a digital holographic solution are highlighted. Thesechallenges include (i) the removal of the DC and conjugate image terms, which are features of the holographic recording process,(ii) the reduction of speckle noise, a characteristic of a coherent imaging process, (iii) increasing the angular range of perspectiveof digital holograms (iv) and replaying captured and/or processed digital holograms using spatial light modulators. Each of thesechallenges are examined theoretically and several solutions are put forward. Experimental results are presented that demonstratethe validity of the theoretical solutions.
1. Introduction
3D display systems generate a great deal of public interest.The idea that any event, ranging from the trivial to themomentous, could somehow be fully recorded and the 3Dscene replayed at a later time for an audience in anotherlocation is highly desirable. However, current technologiesare far from this futuristic conception of 3D technology.Nevertheless recent improvements in 3D display and capturetechnologies have led the way for plausible pseudo-3D scenesto be recorded allowing the user to avail of a realistic 3Dexperience. Consider for example the development of cin-ema, film, TV and computer gaming over the past 30 years.Entertainment industries are constantly pushing for better3D experiences. Whether new technologies or approachesprovide a suitably realistic 3D experiences, one must considerthe human perception dimension to the problem, for amore complete account we refer the reader to Chapter 17of [1]. The consistent and continuous improvement in thequality of the sound and special effects in films is noticeablyapparent. Perhaps this is even more dramatically underlinedin computer gaming when one compares the improvement
in graphics over the past three decades. Future improvementsin 3D technology are being prepared by major players in theindustry; Both Dreamworks Animation and Pixar have statedtheir intention to release all future films in 3D; there is anincrease in the number of 3D cinemas being constructed;public screenings of 3D football matches, and so forth, arebeing shown in an attempt to increase public awareness of 3Dtechnology [2]. So the question arises, how will 3D cinematranslate to 3D TV?
It is a problem of content, in part, however as morepeople experience 3D cinema the demand for a similar3D experience at home increases, which in turn drives thedemand for 3D television content. There is a precedent forthis, the changeover from black and white TV to colour TV.Several major technology companies such as Phillips andHolografika, currently have proto-types of 3D televisionsthat produce a convincing 3D experience. Although thecurrent 3D technology may sometimes appear revolutionary,the fundamental science behind it is as old as film itself [3].The central idea underpinning the 3D experience is that ofstereoscopic vision [3, 4]: an observer viewing a scene seestwo similar but slightly displaced versions of that scene with

2 International Journal of Digital Multimedia Broadcasting
the left and right eye. This information is processed by thebrain and the viewer perceives a 3D scene. For a detailedintroduction to some of these approaches to 3D displaydevices we refer the reader to [1].
Looking further into the future, another technologycould potentially offer more realistic 3D capture and display:Digital Holography (DH) [5–12]. This imaging processallows the full wavefield information; amplitude and phase,to be recorded. With this information it is possible, usingdevices known as Spatial Light Modulators (SLM), toreconstruct the optical wavefield in another place and atanother time [11–13]. Recreating the full wavefield is theonly method by which an observer would be exposed to thesame scene that had been recorded. While there are obstaclesto achieving this goal, digital holographic capture displaytechnology does work as shall be demonstrated by theoreticaland experimental results presented in this paper.
Some of the major challenges are:
(i) the removal of the DC and conjugate image terms,which are features of the holographic recordingprocess,
(ii) the reduction of speckle noise, a characteristic of acoherent imaging process,
(iii) increasing the angle of perspective of digital holo-grams, and
(iv) replaying captured and/or processed digital holo-grams using spatial light modulators.
In the following sections we will discuss each of theseobstacles along with several different approaches that are cur-rently being investigated to minimize their impact on imagequality. While many of these issues have been addressedover the years in many different contexts, here we use acombination of these approaches in an attempt to improveholographic display techniques.
Each of the obstacles noted above must be addressed inorder to capture and replay a single holographic frame. Forreal-time imaging however it will be necessary to capture,transmit and replay a series of frames. Real-time imagingwill therefore bring challenges in additon to those alreadyoutlined. For convincing real time imaging it will be neces-sary to be able to replay approximately 50 frames (cinemascurrently have 25 frames per second) per second. There areseveral potential bottlenecks to achieving this frame rate:(a) the time it takes to capture and process a frame, (b)sending data over transmission lines and finally (c) therefresh rate of the SLM devices must have a sufficiently quickto display∼50 frames per second. We note that as technologyimproves these timing and transmission difficulties may wellrecede.
In this research presented here the complex wavefield iscaptured in the National University of Ireland, Maynooth(NUIM), processed and transmitted to the Warsaw TechnicalUniversity (WUT) where the hologram is loaded onto anSLM and reconstructed optoelectronically.
M
P
P
BS
Mirror A
M
M
X
BS1LPh
MO
M
Object
Laser CCD
Figure 1: Schematic depicting a typical inline DH setup. M: Mirror,P: Polarizer, BS: Beam Splitter, Ph: Pinhole, and MO: MicroscopeObjective.
2. DC Terms and the Conjugate Image Term
In this section we examine some fundamental propertiesof a holographic imaging system. In Figure 1 we presenta schematic of a typical DH setup. Laser light is spatiallyfiltered using a microscope objective and a pinhole. Thediverging spherical wave that emerges from the pinhole iscollimated using a lens to form an approximately flat planewave that is split into two beams, the reference beam andobject beam, by the beam splitter BS1, see Figure 1. Afterreflection from several mirrors the object beam illuminatesthe object of interest. We refer to the field scattered fromthe object at Plane X as u(X). For the remainder of themanuscript we use the space variable x to refer to thecoordinate space in the capture plane and use X variableto refer to the coordinate space in the reconstruction orobject plane. The object wavefield u(X) now propagatesto the camera face where an interference pattern betweenthe object and the reference wavefields is formed and theresulting intensity is recorded. Using the expressions uz(x)and ur(x) to refer to the object and reference wavefields,respectively, in the camera plane we can write the resultingintensity distribution as [14–17]
I = |ur(x) + uz(x)|2, (1a)
I = Ir + Iz + uz(x)u∗r (x) + u∗z (x)ur(x), (1b)
I = Ir + Iz + |uz(x)||ur(x)| cos[φ(x)− α
], (1c)
where
ur(x) = exp(jα), (2a)
and where
uz(x) = |uz(x)| exp[jφ(x)
],
uz(x) =√
1jλz
∫∞
−∞u(X) exp
[jπ
λz(x − X)2
]dX.
(2b)

International Journal of Digital Multimedia Broadcasting 3
We note that Iz = |uz(x)|2 and Ir = |ur(x)|2. In (2b), λrefers to the wavelength of the laser light and z, the distancebetween Plane X and the camera face, see Figure 1. Wealso note that the relationship between uz(x) and u(X)defined in (2b) is the well known Fresnel transform [17].Examining (1b) we can see that the recorded interferogramI(x) contains four terms, the DC terms: Iz and Ir , the realimage term: uz(x)u∗r (x), and finally the conjugate imageterm, u∗z (x)ur(x). We will assume that our reference waveis flat and therefore is constant for all values of x. Thisallows us to ignore the effect of the reference wave forthe conjugate and real image terms as it now represents aconstant phase. If we apply an inverse Fresnel transformon (1b), our image in the reconstruction plane will containcontributions from the conjugate image, the real image andthe DC terms. Ideally we would like to isolate the real imageterm from the other terms thereby improving the quality ofthe reconstruction. Since the Fresnel transform is a linearoperation, it is easier to understand the contribution ofthe different terms by considering them individually. Bysimulating free space propagation numerically in a computerwe may back-propagate uz(x) to the object plane to recoverour desired field u(X). Applying an inverse Fresnel transformto the conjugate image term produces another field inthe object plane which overlaps with u(X), distorting theimage. The DC terms, Ir and Iz will also play a negativerole, distorting the reconstructed field in Plane X . Wenote however that if ur(x) is a flat unit amplitude planewave, then Ir(x) is constant across the capture plane andtherefore is mapped by a Fourier transform to a Dirac deltafunction centred at zero frequency [17, 18]. This deleteriouscontribution may thus be filtered relatively easily usingnumerical techniques. Alternatively it is possible to recordseparately both DC terms; Ir and Iz, and to numericallysubtract these from the interferogram I using a computer.In Figure 2 we present a captured and reconstructed DH of aStarwars character. The setup is an inline setup very similarto that depicted in Figure 1. In the experiment we use anAVT Dolphin camera with 1392 by 1048 pixels each of pitch6.45 μm to record the interferogram while the parameters λand z are given by λ = 785 nm, z = 108 mm, respectively.Performing a numerical inverse Fresnel transform on thenon-processed interferogram generates the reconstructedhologram in Figure 2 [19, 20]. The DC terms and theconjugate image image noise are clearly evident. In Figure 3we present the same reconstruction where the Iref DC termhas been removed using a filtering technique. We reducethe power in our object arm to a low level and ignore thecontribution of the Iz term. From experimental experiencewe have found that this does not overly degrade thequality of the reconstructed hologram. Note the subsequentimprovement in the reconstruction quality. Once the DCterms have been removed (and assuming a flat referencewave) we may rewrite (1c) as
I = uz(x) + u∗z (x) (3)
On inspection of Figure 3, however it is clear that theconjugate image is still present and that it contributes to
Figure 2: Reconstructed DH of a Starwars schart. Note the presenceof the both the DC terms and the conjugate image term.
Real termTwin term
Figure 3: Same as Figure 2 however the DC terms have beenremoved using numerical processing techniques.
a significant deterioration of the reconstructed hologram.Therefore we now turn our attention to several techniquesfor removing this troublesome term.
2.1. Numerical Removal of the Conjugate Image Term. Herewe describe a technique for removing the conjugate imageterm numerically and refer the reader to [21] for a morecomplete description of the process. The basic idea behindthis numerical conjugate image removal technique is to bringthe conjugate image term into focus (where its featuresare sharp) and then to use edge detection techniques toremove the conjugate image term. We can achieve thisby performing a forward numerical Fresnel transform onthe interferogram. Performing a forward Fresnel transformon our previously captured hologram produces the resultpresented in Figure 4(a). Note that now the conjugate imageterm is in-focus. One can see by comparing Figures 2 and4(a) that the conjugate and real image terms are invertedwith respect to each other. In this particular example wewish to demonstrate the robustness of this approach. By

4 International Journal of Digital Multimedia Broadcasting
Real term
Twin term
(a)
(b)
Figure 4: (a) This reconstruction is processed using the samehologram as that used to produce Figures 2 and 3. In this instancewe forward propagate the hologram by a distance + z. In thisinstance the conjugate image is in focus and the real image termis out of focus. (b) This is the filter we use to remove the in-focusconjugate image.
simply setting to zero most of the in-focus term, seeFigure 4(b), we may examine how much of the conjugateimage has been removed. Clearly we have also removedinformation pertaining to the real image term; however wehave attempted to discriminate more strongly against the in-focus conjugate image term. This approach can be furtherimproved using sophisticated edge detection techniques. Wenow perform an inverse Fresnel transform on this processedhologram, a distance 2z to get back to the real image plane.In Figure 5 we present the result. While we note that theconjugate image term has not been completely removed,it has been nevertheless been significantly reduced. Thereare many different numerical techniques for removing theconjugate image term; see, for example, [22]. The mainadvantage of a numerical procedure for removing both theDC and conjugate image terms is that only one interferogramis then needed to capture our field u(X). In the next sectionwe will look at another technique for removing the conjugate
Figure 5: This reconstruction is the same as Figure 2, however boththe conjugate image term and the DC terms have been removedusing numerical processes described in the text.
image term that is generally more effective than the techniquejust described. This approach is known as phase shiftinginterferometric technique; however its main disadvantage isthat several holograms need to be captured which may limitits application in real-time imaging [23–25].
2.2. Phase Shifting Interferometer to Remove the ConjugateImage Term. In this section we examine another techniquefor removing the conjugate image term. This approach,Phase Shifting Interferometry (PSI), is a technique in whichthe phase of one of the interfering beams in the setup isprecisely changed and a set of phase shifted interferogramsare recorded. These interferograms are then processed toextract the real object wavefield. In holography this meansthat the zero-order and the conjugate image noise can beremoved. The advent of accurate piezo electric actuatortechnology has enabled this technique to become very usefulin optical interferometry. Phase shifting applied to digitalholography was applied to opaque objects by Yamaguchi andZhang [23]. In the lab in NUIM, we have implementedcontrolled phase shifting to remove the zero-order andconjugate image reconstructions. A mirror (see Mirror A inFigure 1) is attached to a piezo-actuator (Piezosystem Jena,PZ38CAP) and placed in the object beam arm [23]. Thismirror can be moved in a controlled and repeatable mannerthrough very small displacements ∼1 nm. This allows us tointroduce a controlled phase shift between the object andreference arms of the digital holographic setup. To ensurethat we introduce the intended phase shift it is necessaryto calibrate the piezo-actuated mirror. To perform thiscalibration we replace the object in Figure 1 with a planemirror and observe the interference pattern in the cameraplane. With ideal lenses and aligned optics we would expectto observe a uniform intensity pattern across the camera face.As the piezo-actuated mirror is subject to a displacementwe expect the uniform intensity to vary from a maximum(when the object and reference plane waves exhibit totalconstructive interference) to minimum when the two beamsexhibit destructive interference. We note however that with

International Journal of Digital Multimedia Broadcasting 5
misaligned optical elements and imperfect lenses we do notachieve this type of interference pattern. To perform ourexperiment we examined a region of the interferogram,summing the intensity of all the pixels therein. We thenobserved the variation in the intensity in this region as thepiezo-actuated mirror was stepped in small increments byapplying a known voltage. In Figure 6 we present the results.With this information we are now able to use PSI techniquesto remove the DC and conjugate image terms. We proceedusing the 4-step technique discussed by Yamaguchi et al. andcapture a series of four digital holograms where the phasedifference between each successive capture is π/2. From [25]we can now express the phase of the real image term as
φ(x) = I3π/2 − Iπ/2I0 − Iπ
, (4)
where Iα refers to a captured hologram where the object andreference fields have been shifted α radians with respect toeach other. We note that |uz(x)| = √
Iz may be recoveredby blocking the reference arm and recording the intensity ofthe object field. Using this procedure we can thus separatethe real image term from the other contributions of theholographic imaging process. The result of reconstructingthe data produced by applying (4) can be seen in Figure 7.It is interesting to compare the results presented in Figures5 and 7. These seem to indicate that PSI-based approachyields superior results; however this should be further qual-ified. Capturing PSI type holograms has several significantdisadvantages that may limit its application for real timeimaging: (i) several captures are required, (ii) it is veryimportant that the scene remains motionless during theentire capture process. In practice this latter constraint canbe difficult to achieve and by its very nature interferometry isparticularly sensitive to any type of motion. We are currentlytrying to improve numerical techniques for conjugate imageterm removal and are using PSI holograms as benchmark todetermine their effectiveness.
We would to briefly comment on what is called off-axis reference holography. In this instance an off-axis planewave is used as a reference wave. This has the effect ofspatially separating the real and conjugate image so that thetwo terms may be isolated and separated from each otherusing numerical techniques. This technique has applicationfor real-time imaging application, [26, 27]; however itimposes restrictive constraints on the recording device.Recording using an off-axis architecture may reduce thespatial resolution of the resulting hologram by up to fourfold in contrast with an inline approach. For this reasonwe concentrate primarily on inline recording setups in thismanuscript.
3. Speckle Noise Reduction
When light that is fairly coherent (both temporally andspatially) is reflected from an optically rough surface, theresulting intensity pattern has a random spatial intensityvariation. This is known as speckle pattern. Although oneof the first observations of the speckle phenomenon was
1
1.5
2
2.5
3
3.5
4
4.5
5×10⁴
Sum
ofpi
xels
14 14.5 15 15.5 16 16.5 17
Voltage (V)
Figure 6: Calibration curve for PiezoJena actuator (PiezosystemJena, PZ38CAP) driven using controller: NV401CLE. The intensityvaries from a maximum at ∼14.6 V, to a minimum at ∼15.5 V,corresponding to a π/2 phase shift.
Figure 7: This reconstruction is the same as Figure 5, where boththe conjugate image term and the DC terms have been removed.Unlike in the numerical procedure used in Figure 5, we have applieda PSI technique to separate out the real image term.
made by Exner in 1878 and discussed widely at the timein the literature, it was the invention of the laser that ledresearchers to “re-discover” speckle in the 1960s. As lasersbecame more widely available, the speckle effect was soonput to good use in nondestructive, noncontact metrologyapplications. Nevertheless speckle is a significant hindrancein imaging applications and acts to severely degrade theperformance of coherent optical systems. For imaging appli-cations, particularly those that involve display or projectionsystems, the effect is striking, uncomfortable and irritatingdue in large part to the high contrast (unity contrast)associated with a speckle distributions. Thus speckle is botha fundamental property of a coherent imaging process anda significant hindrance for imaging applications. Over theyears many different techniques for reducing speckle havebeen developed, unfortunately however these techniques

6 International Journal of Digital Multimedia Broadcasting
tend to reduce the resolution of the imaging system [28–30]. For example we have examined using mean filtering toreduce the appearance of speckles in reconstructed digitalholograms. This approach reduces the speckle contrast atthe expense of effectively low-pass filtering our image. Thereis therefore a corresponding reduction in higher spatialfrequency content. Alternatively if several speckle fields aresummed on an intensity basis the speckle contrast canbe reduced significantly, see for example the discussion inChapter 5 of [29]. It is of fundamental importance to realisethat speckle fields added on a complex amplitude basis willnot reduce the speckle contrast [30], they must be addedon an intensity basis. Calculating the expected reduction inspeckle contrast by summing different speckle fields on anintensity basis requires an involved theoretical investigationinto the statistical temporal and spatial correlations betweeneach of the different speckle intensity patterns. Furthermore,if the device detecting these intensity fields spatially andtemporally integrates the instantaneous intensity, then thestatistical properties of integrated speckle fields must alsobe considered. Again we refer the reader to [29] for moredetail. However a good rule of thumb as to the expectedreduction in speckle contrast is given by assuming that thespeckle intensity patterns are statistically independent. Withthis assumption the speckle contrast, C is given by
C = 1√N
, (5)
where N is the number of statistically independent speckleintensity patterns.
In this section, we are going to examine two differentapproaches to speckle reduction. We will first examine howto reduce speckle using convenient numerical techniquesbefore examining how to reduce speckle by capturingmultiple holograms of the same scene.
3.1. A Numerical Approach to Speckle Reduction. Here weinvestigate a numerical technique for reducing the specklecontrast in a reconstructed digital hologram. We do thisby summing together multiple intensity images, each ofwhich contains a statistically independent speckle patternlying on top of an unchanging object intensity distribution.Therefore from one captured hologram we need to somehowgenerate a relatively constant object intensity distributionand several statistically independent speckle fields. To do thiswe adopt a digital version [31] of an old technique proposedin the 1970’s by Dainty and Welford [32], where the Fouriertransform of the hologram is repeatedly spatially filteredand the resulting intensities are added together. Each spatialfilter corresponds to a different rectangular band in thefrequency domain. By moving the spatial filter in the Fourierdomain we allow different parts of the hologram’s Fourierspectrum to contribute to the holographic reconstruction.We note that by removing spatial frequencies we will reducethe resolution of our reconstructed hologram, however wewill also reduce the speckle contrast in the reconstructedimage. In Figure 8 we present our results. Figure 8(a) is thereconstructed hologram resulting from one intensity from
only a single bandpass filter. This bandpass filter correspondsto a 348 × 348 pixel region in the frequency domain. InFigures 8(b)–8(f) we show the resulting image when 1, 3,5, 7, 10 and 14 band pass filtering operations have beenperformed and the resulting intensities have been averaged.It is clear from examining Figure 8 that while the specklecontrast has been reduced it comes with the price of reducingthe spatial resolution of the reconstructed image.
It is noticeable that in Figure 8(a) we clearly see darkhorizontal and vertical fringes that overly the image of theobject. These unwanted terms are due to the square bandpassfiltering operation that created this image. Multiplicationwith a displaced rectangular function (one quarter thebandwidth of the fully reconstructed image) in the frequencydomain amounts to convolution with a Sinc function [18] inthe image plane. Furthermore this Sinc function is multipliedby a linear phase factor that relates to the displacement of therectangular function. Convolution of the fully reconstructedimage with this tilted Sinc function brings about the darkhorizontal and vertical fringes that are shown in Figure 8(a).As we add together the intensities of different bandpassedversions of the image these fringes are averaged away sincethey are different for each bandpass. In Figure 8(b), afterthree filtered image intensities have been added togetherit is observed that the horizontal fringes have been visiblyreduced but the vertical one remains in the image. This isdue to the fact that the three bandpass filters were locatedvertically with respect to one another in the frequencydomain. In Figure 8(c) after five intensities are added we seesome reduction in the vertical fringe. This is due to the factthat the five band pass filters were composed of a column offour vertically shifted rectangular functions of size 348× 348pixels. For the fifth bandpass filter we move horizontally tothe next column. This latter filter brings about the reductionin the vertical filter. As we move across all the columns androws all the fringes are reduced.
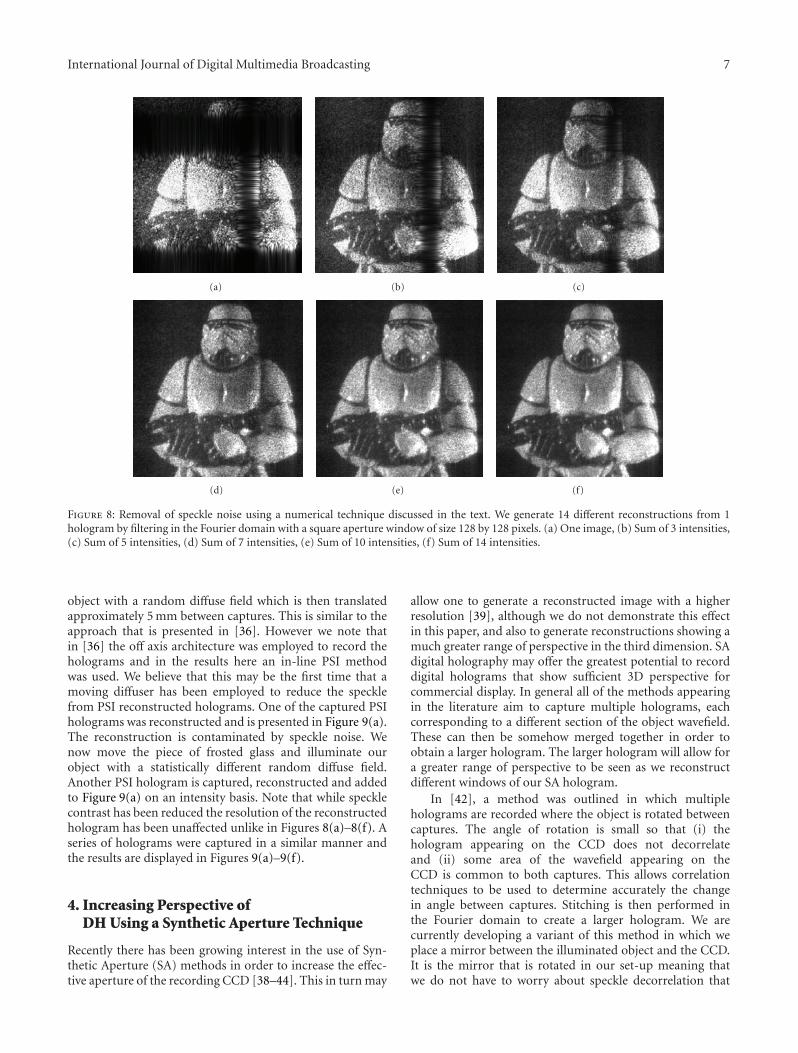
3.2. A Multiple Capture Approach to Speckle Reduction. Wenote that the addition of the intensity of multiple hologramreconstructions has been previously demonstrated in theliterature [33–37]. In [33] the illuminating source wasrotated between captures in order to generate a series ofreconstructions of the same static object with statisticallyindependent speckle noise terms. The superposition of theintensity profiles reinforces the object image while the overly-ing speckle noise is averaged away. In [34] a similar method isused, this time the wavelength of the source is varied betweencaptures. In [35] the angle of incidence upon the object of theilluminating source is varied between captures and in [36] arandom diffuser, placed just after the source illuminating theobject, is moved between captures. In [37] the authors set outto improve a Fourier Digital holography metrology system.The unwrapped phase (showing deformation topology) isaveraged for multiple captures where there is a slight changein the CCD position between captures.
In our experiment, we introduce a piece of frosted glass(diffuser) into the object arm of our digital holographicsetup. Standard PSI techniques are used to remove the DCand conjugate image terms. We are able to illuminate our
International Journal of Digital Multimedia Broadcasting 7
(a) (b) (c)
(d) (e) (f)
Figure 8: Removal of speckle noise using a numerical technique discussed in the text. We generate 14 different reconstructions from 1hologram by filtering in the Fourier domain with a square aperture window of size 128 by 128 pixels. (a) One image, (b) Sum of 3 intensities,(c) Sum of 5 intensities, (d) Sum of 7 intensities, (e) Sum of 10 intensities, (f) Sum of 14 intensities.
object with a random diffuse field which is then translatedapproximately 5 mm between captures. This is similar to theapproach that is presented in [36]. However we note thatin [36] the off axis architecture was employed to record theholograms and in the results here an in-line PSI methodwas used. We believe that this may be the first time that amoving diffuser has been employed to reduce the specklefrom PSI reconstructed holograms. One of the captured PSIholograms was reconstructed and is presented in Figure 9(a).The reconstruction is contaminated by speckle noise. Wenow move the piece of frosted glass and illuminate ourobject with a statistically different random diffuse field.Another PSI hologram is captured, reconstructed and addedto Figure 9(a) on an intensity basis. Note that while specklecontrast has been reduced the resolution of the reconstructedhologram has been unaffected unlike in Figures 8(a)–8(f). Aseries of holograms were captured in a similar manner andthe results are displayed in Figures 9(a)–9(f).
4. Increasing Perspective ofDH Using a Synthetic Aperture Technique
Recently there has been growing interest in the use of Syn-thetic Aperture (SA) methods in order to increase the effec-tive aperture of the recording CCD [38–44]. This in turn may
allow one to generate a reconstructed image with a higherresolution [39], although we do not demonstrate this effectin this paper, and also to generate reconstructions showing amuch greater range of perspective in the third dimension. SAdigital holography may offer the greatest potential to recorddigital holograms that show sufficient 3D perspective forcommercial display. In general all of the methods appearingin the literature aim to capture multiple holograms, eachcorresponding to a different section of the object wavefield.These can then be somehow merged together in order toobtain a larger hologram. The larger hologram will allow fora greater range of perspective to be seen as we reconstructdifferent windows of our SA hologram.
In [42], a method was outlined in which multipleholograms are recorded where the object is rotated betweencaptures. The angle of rotation is small so that (i) thehologram appearing on the CCD does not decorrelateand (ii) some area of the wavefield appearing on theCCD is common to both captures. This allows correlationtechniques to be used to determine accurately the changein angle between captures. Stitching is then performed inthe Fourier domain to create a larger hologram. We arecurrently developing a variant of this method in which weplace a mirror between the illuminated object and the CCD.It is the mirror that is rotated in our set-up meaning thatwe do not have to worry about speckle decorrelation that
8 International Journal of Digital Multimedia Broadcasting
(a) (b) (c)
(d) (e) (f)
Figure 9: Removal of speckle noise by adding multiple reconstructed digital hologram captures together on an intensity basis. For eachcapture a different diffuse and random field is used to illuminate our object. (a) One image, (b) Sum of 3 intensities, (c) Sum of 5 intensities,(d) Sum of 7 intensities, (e) Sum of 10 intensities, (f) Sum of 14 intensities.
arises due to rotation of the object. However, the mirrorcreates the need for a correlation and stitching in the spatialdomain. Therefore, we stitch our holograms together in fourdimensions, in space (x and y) and spatial frequency ( fx andfy). The shift between the two discrete hologram matrices isresolved to subpixel accuracy. We do this by applying a phaseshift (corresponding to less than the pixel size, e.g., 1/5th ofthe pixel size) to one of the matrices in the Fourier domain.Since a phase shift in the Fourier domain corresponds to ashift in space in the space domain the matrix is said to besubpixel shifted in the space domain. This is equivalent tointerpolating the discrete object wavefield “in-between” thepixels. We perform the correlations on each such subpixelshifted matrix and identify the best shifted matrix whichgives the highest correlation peak value. This is furtherdone for different values of the subpixel shift, for example,(1/5th of pixel, 1/8th of pixel, etc.). The best shift d is chosenand thus resolved to subpixel accuracy. The steps taken forstitching are described in the schematic in Figure 10. We referthe reader to [42] for a thorough analysis of the method.
In Figures 11 and 12 we show some preliminary results.In Figure 11 we show a digital hologram of a resolution chartand the reconstruction. In Figure 12, we capture five holo-grams of the same static object, while rotating a mirror in theset-up. Each new hologram allows us to add approximately300 new pixels to the hologram. In future work we expect
to use this method to record 3D macroscopic objects with arange of perspective of approximately 10–15 degrees.
5. Optical Reconstruction ofDigital Holograms Using with a LiquidCrystal Spatial Light Modulator
As we have seen in the previous sections in order to inspectthe visual information encoded in a digital hologram wecan apply numerical reconstruction algorithms. While thisapproach is suitable for many different applications, inparticular metrology or microscopy, it is not appropriatefor 3D display systems. If we wish to view the hologramin real 3D space, then the information contained in thedigital hologram must be replayed using optoelectronictechniques. Briefly, some of the information contained inthe captured hologram is loaded onto an SLM device. Aplane wave is then reflected off the surface of the device,and an approximation to the original object wavefield iscreated. In our display system we use a reflective liquidcrystal Spatial Light Modulator (SLM): HoloEye (model:HEO 1080 P) with 1920 × 1080 pixels, each with a pitchof Δrec = 8μm to approximately reconstruct the originalobject wavefield optically. A single SLM allows us to displayeither a phase (phase mode) or an amplitude (amplitude

International Journal of Digital Multimedia Broadcasting 9
Capturing phase shifted holograms
Algorithm for stitching two holograms obtained by rotating the object wave field
Step 1 Hologram A
0
π/2
π
3π/2 Phase shifts
A = o(x, y)ei(p(x,y))
4 step phase shifting
Holograms A and B are cross
correlated to obtain the spatial shift d.This shift is resolved to sub-pixel accuracy.We perform the correlationson each sub-pixel shiftedmatrix and identify the best shifted matrix whichgives the highest correlation peak value.
Using this shift d, the common parts,Ca and Cb are extracted.Let’s call the “extra parts” as Ea andEb . We are only interested in joining Eb to A.
These common parts have a linear phase shiftbetween them and this shift is found outcorrelating the Fourier transforms of Ca and Cb .Again this phase shift is extracted to subpixelaccuracy.
Now we have both the linear shift in thespatial and the frequency domain. It is amatter of joining the correct phase shiftedEb to A to get our synthetic aperturehologram.
Using the phase shift t calculated above, we “shiftback” hologram Eb by multiplying it with thenegative linear phase shift.
We take the shifted part Eb and append it to Ato give S, our synthetic aperture digitalhologram.
A third hologram C obtained by phase shifting can bestitched to the above synthesized hologram by followingthe same procedure. Iteratively, a number of hologramscan be stitched together.
Step 2Object wave field
Reference wave
CameraBeam splitterrotation
Step 3 Hologram B
0
π/2
π
3π/2
Phase shifts
B = o(x − d, y)ei(p(x,y)−αx)
4 step phase shifting
Step 1: sub-pixelcorrelation inspace domain
Step 2: sub-pixelcorrelation in
frequency domain
Step 3: correct phasealignment ofholograms
Step 4: stitching ofcorrectly aligned
hologramsStep 5: iterative
stitching of holograms
Figure 10: Schematic showing the various steps taken in the stitching process. The beam splitter in Step 2 on the left-hand side correspondsto BS in Figure 1. It is rotated in order to rotate the object wave field.
mode) distribution. Displaying both amplitude and phaseis not straight-forward, as two modulators working indifferent modes (amplitude or phase) are required. Thesetwo SLM’s would then need to be carefully aligned andfurthermore would also be very sensitive to errors introducedby relative mechanical motions or vibrations between thesetwo devices. Also, whether we use amplitude or phase modedepends on the data we load onto our SLM. We notefor example that an actual interferogram (our unprocesseddigital holograms that are captured in NUIM) contain onlyreal positive numbers and therefore can be replayed usingour SLM in amplitude mode. As we shall see however the
resulting optoelectronic reconstruction is contaminated byboth the DC terms and the conjugate image term. If weuse numerical techniques to process our hologram, therebyobtaining the complex field information associated with ourobject distribution, we obtain both amplitude and phasedata. For the alignment issues identified above we must nowopt to load either the phase or amplitude data onto our SLM.From experimental experience we have found that moreconvincing optical reconstructions are obtained when thephase data is loaded onto our SLM and the device is operatedin phase mode only, see also [17, Section 9.9.3]. Before weturn our attention to discussing some of our experimental

10 International Journal of Digital Multimedia Broadcasting
1000
900
800
700
600
500
400
300
200
100
Original wavefield × size (1392 pixels)
200 400 600 800 1000 1200
(a)
1000
900
800
700
600
500
400
300
200
100
Reconstruction from the original wavefield × size (1392 pixels)
200 400 600 800 1000 1200
(b)
Figure 11: (a) Amplitude of a PSI hologram of a transparent USAF resolution chart having been illuminated through a diffuser. Thehologram has 1040 × 1392 pixels. In (b) we show the reconstruction of the digital hologram.
1000900800700600500400300200100
5 holograms stitched togther × size (2223 pixels)
200 400 600 800 1000 1200 1400 1600 1800 2000 2200
(a)
1000900800700600500400300200100
Reconstruction from larger hologram× size (2223 pixels)
200 400 600 800 1000 1200 1400 1600 1800 2000 2200
(b)
Figure 12: (a) Amplitude of a Synthetic Aperture digital hologram. Five recordings have been stitched together. The resultant hologramhas clear discontinuities that would not be visible in the ideal case. Stitching has also been implemented in the spatial frequency domain.Approximately 300 pixels are added with each addition capture. The SA DH has 2223 pixels in the x direction. In (b) we show thereconstruction of SA DH.
results, we note that the camera used by NUIM to capturethe original hologram has 1392 × 1048 pixels, with a pixelpitch Δreg = 6.45μm. The mismatch between the dimensionsof captured hologram and our replay device (see Section 2)effects optical reconstruction in two ways: (i) It modifies thedistance of reconstruction plane to SLM plane according tothe following formula:
zrec = zregλregΔ2
rec
λrecΔ2reg
, (6a)
where the zreg is the distance between detector and objectplanes, and (ii) A transverse magnification of
M = Δrec
Δreg, (6b)
is now introduced to the reconstruction image. In Figure 13we present a schematic to illustrate the physical optical setupthat is used by WUT to optoelectronically reconstruct thecaptured holograms. We note that the wavelengths used to
capture the original wavefield and the wavelength used forreconstruction differ, that is, λrec = 532 nm, while λreg =785 nm. Using (6a) and (6b) we thus find that zrec =281.48, zreg = 638.95 mm and M = 1.24. In Figure 14we present an optoelectronic reconstruction of the captureddigital hologram that was used to generate Figure 2. Sincethis unprocessed hologram is real, it could be replayed usinga single SLM operating in amplitude mode. Experimentallyhowever we have found that a good optical reconstruction,with a higher diffraction efficiency, is obtained when we useour SLM in phase mode and refer the reader to Sections4.4.3 and 4.4.4 of [17] for a more complete discussionof this issue. This behavior has also been verified withsome preliminary numerical simulations. One of the mostdisturbing terms in our optoelectronic reconstruction is theIref DC term, see (1a)–(1c) and Figure 14, which can beremoved numerically. The DC term covers valuable space ofthe holographic display. This is especially significant sinceSLM devices have limited viewing angles (∼2 ◦) and themajority of the reconstructed image will be located within

International Journal of Digital Multimedia Broadcasting 11
PL
Ph
MO
λ/2
LCSLMBS
Reconstructedobject
Laser
Figure 13: Scheme of setup for optical reconstruction with SLM,P: Polarizer, BS: Beam Splitter, Ph: Pinhole, and MO: MicroscopeObjective, L: Collimator lens, λ/2: Half-Wave Plate.
Figure 14: Optical reconstruction of holographic data with SLM:reconstruction of intensity hologram.
the zero order area, again we refer the reader to Figure 14.Also we have found that the DC term removal is especiallysignificant for holographic reconstructions at small distancesor for reconstructions of specimens with fine features.
We now turn our attention to removing the DC termsand the conjugate image term. In Section 2 we have presentedtwo techniques for extracting the real image term fromthe hologram. In Section 2.1 we have presented numericalmethod of filtering the object field from a single hologram.The application of the method on a hologram gives us anapproximation to the real image term; some features of theobject field are filtered as well as the twin image term. Afterprocessing our hologram we obtain the complex informationassociated with the object wavefield. As we have previouslynoted we now discard the amplitude information displayingonly the phase data on our SLM. The result of optoelectronicholographic reconstruction is presented in Figure 15(a).
Estimating our real object field can be achieved moreaccurately using PSI techniques, as discussed in Section 2.2.
Ideally the PSI technique returns the exact object field.Errors can be introduced due to system instability duringthe capture or the phase step error. In Section 2.2 we usedthe four frames PSI technique to recover our object field.In Figure 15(b) optoelectronic reconstruction from phaseof real holographic image obtained with PSI technique ispresented.
Another disturbing feature of holographic imagingtechnique is speckle noise. Section 3 presents a review ofmethods that can be used to reduce this speckle noise.The most promising is a multiple capture approach tospeckle reduction. Here we apply this technique to ouroptoelectronic reconstruction. For our numerical recon-structions, the processing and propagation of our hologramsare performed numerically. Finally the calculated intensitydistributions are added together. Here however the last twosteps (propagation and intensity summation) are performedoptically by diffraction and then by an intensity detector,that is, our eyes or the camera we use to image our opticalreconstruction. We use set of ten real object waves, filteredusing our PSI technique, as described in Section 3.2. Theseten phase distributions were loaded sequentially onto ourSLM, at a refresh rate of 60 Hz, in a continuous manner.By adjusting the exposure time of our camera we get theCCD to average (integrate) the intensity distributions of all10 images. The result is presented in Figure 16. Figure 16(a)shows the optoelectronic reconstruction from a single holo-gram, while Figure 16(b) is the reconstruction obtained fromten image set. It is clearly visible that the speckle pattern hasbeen significantly suppressed demonstrating the usefulnessof this approach for optoelectronic reconstruction.
As noted previously the spatial resolution of digital holo-grams may be increased using SA techniques. In Figure 17we present some preliminary experimental results. Using SAtechniques we captured a series of digital holograms thatwere then stitched together, see Section 4 to form a largerhologram. A section of this hologram was then selected anddisplayed on the SLM. When replayed optoelectronically itproduces the result shown in Figure 17(a). A different sectionof the hologram was then loaded onto the SLM and replayedto produce Figure 17(b).
6. Conclusion
In this manuscript we have examined the feasibility ofusing digital holographic techniques to record and replay 3Dscenes. We have investigated some fundamental difficultiesassociated with this imaging technique and suggested severaltheoretical solutions to overcome them. We have demon-strated the effectiveness of our solutions with experimentalresults. In Section 2 we examined how to remove the DCand conjugate image terms that arise due to the holographicrecording process using a numerical approach and a multiplecapture approach based on Phase Shifting Interferometry. InSection 3 we focused on eliminating/reducing the disturbingeffect of speckle so as to minimize its negative impacton image quality. Two different approaches were againdiscussed, one numerical and another based on a multiple

12 International Journal of Digital Multimedia Broadcasting
(a) (b)
Figure 15: Optoelectronic reconstruction from phase of real object beam obtained with: (a) numerical method of real object beam filteringfrom single hologram, (b) 4 frames PSI technique of real object beam filtering.
(a) (b)
Figure 16: Removal of speckle noise in optoelectronic reconstruction by CCD integration of reconstructed images: (a) reconstruction fromone image, (b) reconstruction from ten images.
Figure 17: Reconstruction of synthetic aperture hologram.
International Journal of Digital Multimedia Broadcasting 13
capture technique. We do note that there are many othertechniques for reducing speckle which we are continuing toinvestigate. In Section 4 we attempted to address the limitedangular perspective of digital holograms using a syntheticaperture approach. Multiple holograms, slightly displacedfrom each other were recorded and stitched together usingnumerical techniques that we have developed. Finally inSection 5 we examined the replay or display of digitalholograms using liquid crystal Spatial Light Modulators(SLM). We demonstrated experimentally that it is possible tooptoelectronically replay digital holograms in one location(Poland) that have been captured elsewhere (Ireland). Wehave replayed synthetic aperture holograms, experimentallydemonstrating the increased perspective that follows fromthis approach for the first time. We hope to shortly investigatethe live broadcasting of 3D scenes from Ireland to Polandwhich may also have applications in metrology [45].
Much work remains to be done. We envisage a continuedimprovement in both CCD cameras and their pixel countwhich is essential for capturing high resolution digitalholograms. We also expect to see continual improvementsin spatial light modulators, both their pixel count and theirease of use and flexibility. From this collaborative researchexercise we can conclude that while several major obstaclesstill stand in the way of real-time holographic captureand display systems, a lot of these issues will become lesssignificant as current SLM and CCD/CMOS technologiesimprove. In the design of future 3D systems it will beessential to consider how the human perception effects thequality of the 3D experience. Already there are preliminaryinvestigations underway [46]. Improvements in these areaswill dramatically alter the landscape perhaps making digitalholography a more feasible approach for future 3D displayand capture systems.
Acknowledgment
This research is funded from the European Community’sSeventh Framework Programme FP7/2007 2013 under Grantagreement 216105 “Real 3D.”
References
[1] H. M. Ozaktas and L. Onural, Three-Dimensional Television,Springer, Berlin, Germany, 2008.
[2] R. Millman, “3D digital imax cinemas open for business,”December 2008.
[3] N. A. Dodgson, “Autostereoscopic 3D displays,” Computer, vol.38, no. 8, pp. 31–36, 2005.
[4] N. A. Dodgson, “Analysis of the viewing zone of the Cam-bridge autostereoscopic display,” Applied Optics, vol. 35, no.10, pp. 1705–1710, 1996.
[5] D. Gabor, “A new microscopic principle,” Nature, vol. 161, no.4098, pp. 777–778, 1948.
[6] T. M. Kreis, M. Adams, and W. P. O. Juptner, “Methods ofdigital holography: a comparison,” in Optical Inspection andMicromeasurements II, vol. 3098 of Proceedings of SPIE, pp.224–233, Munich, Germany, June 1997.
[7] T. M. Kreis, “Frequency analysis of digital holography,” OpticalEngineering, vol. 41, no. 4, pp. 771–778, 2002.
[8] T. M. Kreis, “Frequency analysis of digital holography withreconstruction by convolution,” Optical Engineering, vol. 41,no. 8, pp. 1829–1839, 2002.
[9] T. M. Kreis and W. P. O. Juptner, “Suppression of the DC termin digital holography,” Optical Engineering, vol. 36, no. 8, pp.2357–2360, 1997.
[10] D. P. Kelly, B. M. Hennelly, N. Pandey, T. J. Naughton, and W.T. Rhodes, “Resolution limits in practical digital holographicsystems,” Optical Engineering, vol. 48, no. 9, Article ID 095801,13 pages, 2009.
[11] A. Michalkiewicz, M. Kujawinska, J. Krezel, L. Sałbut, X.Wang, and P. J. Bos, “Phase manipulation and optoelectronicreconstruction of digital holograms by means of LCOS spatiallight modulator,” in Eighth International Symposium on LaserMetrology, vol. 5776 of Proceedings of SPIE, pp. 144–152,Merida, Mexico, February 2005.
[12] U. Gopinathan, D. S. Monaghan, B. M. Hennelly, et al., “Aprojection system for real world three-dimensional objectsusing spatial light modulators,” Journal of Display Technology,vol. 4, no. 2, pp. 254–261, 2008.
[13] D. S. Monaghan, U. Gopinathan, D. P. Kelly, T. J. Naughton,and J. T. Sheridan, “Systematic errors of an optical encryptionsystem due to the discrete values of a spatial light modulator,”Optical Engineering, vol. 48, Article ID 027001, 7 pages, 2009.
[14] O. Schnars and W. P. Juptner, “Direct recording of hologramsby a CCD target and numerical reconstruction,” AppliedOptics, vol. 33, no. 2, pp. 179–181, 1994.
[15] U. Schnars and W. P. Juptner, “Digital recording and numer-ical reconstruction of holograms,” Measurement Science andTechnology, vol. 13, no. 9, pp. R85–R101, 2002.
[16] U. Schnars and W. P. Juptner, Digital Holography: DigitalRecording, Numerical Reconstruction and Related Techniques,Springer, Berlin, Germany, 2005.
[17] J. Goodman, Introduction to Fourier Optics, McGraw-Hill,New York, NY, USA, 2nd edition, 1966.
[18] R. Bracewell, The Fourier Transform and Its Applications,McGraw-Hill, New York, NY, USA, 1965.
[19] D. P. Kelly, B. M. Hennelly, W. T. Rhodes, and J. T. Sheridan,“Analytical and numerical analysis of linear optical systems,”Optical Engineering, vol. 45, no. 8, Article ID 088201, 12 pages,2006.
[20] B. M. Hennelly and J. T. Sheridan, “Generalizing, optimizing,and inventing numerical algorithms for the fractional Fourier,Fresnel, and linear canonical transforms,” Journal of theOptical Society of America A, vol. 22, no. 5, pp. 917–927, 2005.
[21] C. McElhinney, B. M. Hennelly, L. Ahrenberg, and T. J.Naughton, “Removing the twin image in digital holographyby segmented filtering of in-focus twin image,” in Optics andPhotonics for Information Processing II, vol. 7072 of Proceedingsof SPIE, San Diego, Calif, USA, August 2008.
[22] T. Latychevskaia and H.-W. Fink, “Solution to the twin imageproblem in holography,” Physical Review Letters, vol. 98, no.23, Article ID 233901, 4 pages, 2007.
[23] I. Yamaguchi and T. Zhang, “Phase-shifting digital hologra-phy,” Optics Letters, vol. 22, no. 16, pp. 1268–1270, 1997.
[24] Y.-Y. Cheng and J. C. Wyant, “Phase shifter calibration inphase-shifting interferometry,” Applied Optics, vol. 24, pp.3049–3052, 1985.
[25] I. Yamaguchi, J.-I. Kato, S. Ohta, and J. Mizuno, “Image for-mation in phase-shifting digital holography and applicationsto microscopy,” Applied Optics, vol. 40, no. 34, pp. 6177–6186,2001.

14 International Journal of Digital Multimedia Broadcasting
[26] T. Colomb, F. Montfort, J. Kuhn, et al., “Numerical parametriclens for shifting, magnification, and complete aberrationcompensation in digital holographic microscopy,” Journal ofthe Optical Society of America A, vol. 23, no. 12, pp. 3177–3190,2006.
[27] S. Grilli, P. Ferraro, S. De Nicola, A. Finizio, G. Pierattini, andR. Meucci, “Whole optical wavefields reconstruction by digitalholography,” Optics Express, vol. 9, no. 6, pp. 294–302, 2001.
[28] J. W. Goodman, Statistical Optics, John Wiley & Sons, NewYork, NY, USA, 1985.
[29] J. W. Goodman, Speckle Phenomena in Optics, Roberts,Englewood, Colo, USA, 2007.
[30] J. W. Goodman, “Some fundamental properties of speckle,”Journal of the Optical Society of America, vol. 66, pp. 1145–1150, 1976.
[31] J. Maycock, B. M. Hennelly, J. B. McDonald, et al., “Reductionof speckle in digital holography by discrete Fourier filtering,”Journal of the Optical Society of America A, vol. 24, no. 6, pp.1617–1622, 2007.
[32] J. C. Dainty and W. T. Welford, “Reduction of speckle in imageplane hologram reconstruction by moving pupils,” OpticsCommunications, vol. 3, no. 5, pp. 289–294, 1971.
[33] X. Kang, “An effective method for reducing speckle noise indigital holography,” Chinese Optics Letters, vol. 6, no. 2, pp.100–103, 2008.
[34] T. Nomura, M. Okamura, E. Nitanai, and T. Numata, “Imagequality improvement of digital holography by superpositionof reconstructed images obtained by multiple wavelengths,”Applied Optics, vol. 47, no. 19, pp. D38–D43, 2008.
[35] L. Ma, H. Wang, W. Jin, and H. Jin, “Reduction of specklenoise in the reconstructed image of digital hologram,” inHolography and Diffractive Optics III, vol. 6832 of Proceedingsof SPIE, Beijing, China, November 2008.
[36] J. Garcia-Sucerquia, J. H. Herrera Ramırez, and R. Castaneda,“Incoherent recovering of the spatial resolution in digitalholography,” Optics Communications, vol. 260, no. 1, pp. 62–67, 2006.
[37] T. Baumbach, E. Kolenovic, V. Kebbel, and W. Juptner,“Improvement of accuracy in digital holography by use ofmultiple holograms,” Applied Optics, vol. 45, no. 24, pp. 6077–6085, 2006.
[38] L. Martınez-Leon and B. Javidi, “Synthetic aperture single-exposure on-axis digital holography,” Optics Express, vol. 16,no. 1, pp. 161–169, 2008.
[39] V. Mico, Z. Zalevsky, P. Garcıa-Martınez, and J. Garcıa,“Synthetic aperture superresolution with multiple off-axisholograms,” Journal of the Optical Society of America A, vol.23, no. 12, pp. 3162–3170, 2006.
[40] F. Le Clerc, M. Gross, and L. Collot, “Synthetic-apertureexperiment in the visible with on-axis digital heterodyneholography,” Optics Letters, vol. 26, no. 20, pp. 1550–1552,2001.
[41] R. Binet, J. Colineau, and J.-C. Lehureau, “Short-rangesynthetic aperture imaging at 633 nm by digital holography,”Applied Optics, vol. 41, no. 23, pp. 4775–4782, 2002.
[42] B. M. Hennelly, T. J. Naughton, J. B. McDonald, Y. Frauel,and B. Javidi, “A method for superresolution in digitalholography,” in Optical Information Systems IV, vol. 6311 ofProceedings of SPIE, San Diego, Calif, USA, August 2006.
[43] J. H. Massig, “Digital off-axis holography with a syntheticaperture,” Optics Letters, vol. 27, no. 24, pp. 2179–2181, 2002.
[44] C. Yuan, H. Zhai, and H. Liu, “Angular multiplexing in pulseddigital holography for aperture synthesis,” Optics Letters, vol.33, no. 20, pp. 2356–2358, 2008.
[45] W. Osten, T. Baumbach, and W. Juptner, “Comparative digitalholography,” Optics Letters, vol. 27, no. 20, pp. 1764–1766,2002.
[46] T. M. Lehtimaki, K. Saaskilahti, R. Nasanen, and T. J.Naughton, “Visual perception of digital holograms onautostereoscopic displays,” in Three-Dimensional Imaging,Visualization, and Display, vol. 7329 of Proceedings of SPIE,Orlando, Fla, USA, April 2009.

Submit your manuscripts athttp://www.hindawi.com
VLSI Design
Hindawi Publishing Corporationhttp://www.hindawi.com Volume 2014
International Journal of
RotatingMachinery
Hindawi Publishing Corporationhttp://www.hindawi.com Volume 2014
Hindawi Publishing Corporation http://www.hindawi.com
Journal ofEngineeringVolume 2014
Hindawi Publishing Corporationhttp://www.hindawi.com Volume 2014
Shock and Vibration
Hindawi Publishing Corporationhttp://www.hindawi.com Volume 2014
Mechanical Engineering
Advances in
Hindawi Publishing Corporationhttp://www.hindawi.com Volume 2014
Civil EngineeringAdvances in
Acoustics and VibrationAdvances in
Hindawi Publishing Corporationhttp://www.hindawi.com Volume 2014
Hindawi Publishing Corporationhttp://www.hindawi.com Volume 2014
Electrical and Computer Engineering
Journal of
Hindawi Publishing Corporationhttp://www.hindawi.com Volume 2014
Distributed Sensor Networks
International Journal of
The Scientific World JournalHindawi Publishing Corporation http://www.hindawi.com Volume 2014
SensorsJournal of
Hindawi Publishing Corporationhttp://www.hindawi.com Volume 2014
Modelling & Simulation in EngineeringHindawi Publishing Corporation http://www.hindawi.com Volume 2014
Hindawi Publishing Corporationhttp://www.hindawi.com Volume 2014
Active and Passive Electronic Components
Hindawi Publishing Corporationhttp://www.hindawi.com Volume 2014
Chemical EngineeringInternational Journal of
Control Scienceand Engineering
Journal of
Hindawi Publishing Corporationhttp://www.hindawi.com Volume 2014
Antennas andPropagation
International Journal of
Hindawi Publishing Corporationhttp://www.hindawi.com Volume 2014
Hindawi Publishing Corporationhttp://www.hindawi.com Volume 2014
Navigation and Observation
International Journal of
Advances inOptoElectronics
Hindawi Publishing Corporation http://www.hindawi.com
Volume 2014
RoboticsJournal of
Hindawi Publishing Corporationhttp://www.hindawi.com Volume 2014