
N-Ocular Volume Holographic Imaging
12
N-ocular volume holographic imaging Arnab Sinha and George Barbastathis Volume holographic imaging utilizes Bragg selectivity to optically slice the object space of the imaging system and measure four- three spatial and one spectral dimensional object information. The N-ocular version of this method combines multiple-volume holographic sensors and digital postprocessing to yield high-resolution three-dimensional images for broadband objects located at long working distances. We discuss the physical properties of volume holography pertinent to imaging performance and describe two computational algorithms for image inversion based on filtered backprojection and least-squares opti- mization. © 2004 Optical Society of America OCIS codes: 090.7330, 110.0110, 110.6770. 1. Introduction Volume holographic imaging VHI is a fairly new imaging technique 1 that exploits the Bragg selectiv- ity 2,3 of volumetric diffraction gratings 4 to optically slice the object space of the imaging system. A VHI system consists of one or more volume holograms placed in the optical train in addition to other optical elements such as lenses and apertures. The volume hologram diffracts the Bragg-matched components of the illumination incident upon it. Thus it is possible to obtain as much as four-dimensional object infor- mation by monitoring the diffracted beam, using a detector or a detector array. 1,5 VHI systems offer great flexibility in building imag- ing systems for several diverse imaging applications. To date, VHI systems have been demonstrated in a confocal microscope with the volume hologram re- placing the pinhole, 6 a real-time scan-free four- dimensional hyperspectral microscope, 7 a long-range surface profilometer, 8,9 and a volume holographic spectrometer. 10 The volume hologram that we use is the recorded three-dimensional 3D interference pattern of two mutually coherent light beams: a planar signal and a reference beam. During imaging, the volume ho- logram is read out with illumination from the object of interest that is collimated by appropriate objective optics. 5,8 We refer to this imaging system as planar reference PR VHI. 5 It was previously shown that a combination of long working distance 5,11 and large illumination band- width 10 results in poor depth-resolving ability for a 3D PR VHI system. In this paper we present a method that uses multiple VHI sensors and digital postprocessing to enhance the depth resolution for broadband objects at long working distances. This paper is arranged as follows: In Section 2 we discuss the resolution of PR VHI and study the effect of increasing object distance and illumination band- width on the depth resolution of the system. In Sec- tions 3 and 4 we discuss an N-ocular VHI system and present digital postprocessing methods to combine the multiple VHI images. We conclude in Section 5 with some directions for future research. 2. Resolution of PR VHI Systems Figure 1 shows a simplified schematic of a PR VHI system. The volume hologram is recorded by use of two planar beams: a normally incident reference beam and an oblique signal beam incident at an angle s 1 rad, as shown in Fig. 1. The recording wave- length is f . All angles and wavelengths are mea- sured inside the volume hologram, which is assumed to have refractive index n and to be L units thick. After recording is complete, the hologram is fixed and does not change during the imaging process. For resolution studies we discuss two cases: 1. Imaging is done under conditions of monochro- matic illumination with imaging–readout wave- length p f . The authors are with Department of Mechanical Engineering, Massachusetts Institute of Technology, Room 3-466, 77 Massachu- setts Avenue, Cambridge, Massachusetts 02139. Received 1 March 2004; revised manuscript received 1 August 2004; accepted 18 August 2004. 0003-693504315784-12$15.000 © 2004 Optical Society of America 5784 APPLIED OPTICS Vol. 43, No. 31 1 November 2004
-
Upload
independent -
Category
Documents
-
view
1 -
download
0
Transcript of N-Ocular Volume Holographic Imaging

N
A
1
Viisspehttmd
iTapdss
tmalo
Ms
2
5
-ocular volume holographic imaging
rnab Sinha and George Barbastathis
Volume holographic imaging utilizes Bragg selectivity to optically slice the object space of the imagingsystem and measure four- �three spatial and one spectral� dimensional object information. The N-ocularversion of this method combines multiple-volume holographic sensors and digital postprocessing to yieldhigh-resolution three-dimensional images for broadband objects located at long working distances. Wediscuss the physical properties of volume holography pertinent to imaging performance and describe twocomputational algorithms for image inversion based on filtered backprojection and least-squares opti-mization. © 2004 Optical Society of America
OCIS codes: 090.7330, 110.0110, 110.6770.
or
ww3mpb
dowtptw
2
Fstb�lstAdr
m
. Introduction
olume holographic imaging �VHI� is a fairly newmaging technique1 that exploits the Bragg selectiv-ty2,3 of volumetric diffraction gratings4 to opticallylice the object space of the imaging system. A VHIystem consists of one or more volume hologramslaced in the optical train in addition to other opticallements such as lenses and apertures. The volumeologram diffracts the Bragg-matched components ofhe illumination incident upon it. Thus it is possibleo obtain as much as four-dimensional object infor-ation by monitoring the diffracted beam, using a
etector or a detector array.1,5
VHI systems offer great flexibility in building imag-ng systems for several diverse imaging applications.o date, VHI systems have been demonstrated inconfocal microscope with the volume hologram re-
lacing the pinhole,6 a real-time �scan-free� four-imensional hyperspectral microscope,7 a long-rangeurface profilometer,8,9 and a volume holographicpectrometer.10
The volume hologram that we use is the recordedhree-dimensional �3D� interference pattern of twoutually coherent light beams: a planar signal andreference beam. During imaging, the volume ho-
ogram is read out with illumination from the objectf interest that is collimated by appropriate objective
The authors are with Department of Mechanical Engineering,assachusetts Institute of Technology, Room 3-466, 77 Massachu-
etts Avenue, Cambridge, Massachusetts 02139.Received 1 March 2004; revised manuscript received 1 August
004; accepted 18 August 2004.0003-6935�04�315784-12$15.00�0
l© 2004 Optical Society of America
784 APPLIED OPTICS � Vol. 43, No. 31 � 1 November 2004
ptics.5,8 We refer to this imaging system as planareference �PR� VHI.5
It was previously shown that a combination of longorking distance5,11 and large illumination band-idth10 results in poor depth-resolving ability for aD PR VHI system. In this paper we present aethod that uses multiple VHI sensors and digital
ostprocessing to enhance the depth resolution forroadband objects at long working distances.This paper is arranged as follows: In Section 2 we
iscuss the resolution of PR VHI and study the effectf increasing object distance and illumination band-idth on the depth resolution of the system. In Sec-
ions 3 and 4 we discuss an N-ocular VHI system andresent digital postprocessing methods to combinehe multiple VHI images. We conclude in Section 5ith some directions for future research.
. Resolution of PR VHI Systems
igure 1 shows a simplified schematic of a PR VHIystem. The volume hologram is recorded by use ofwo planar beams: a normally incident referenceeam and an oblique signal beam incident at an angles �� 1 rad, as shown in Fig. 1. The recording wave-ength is �f. All angles and wavelengths are mea-ured inside the volume hologram, which is assumedo have refractive index n and to be L units thick.fter recording is complete, the hologram is fixed andoes not change during the imaging process. Foresolution studies we discuss two cases:
1. Imaging is done under conditions of monochro-atic illumination with imaging–readout wave-
ength �p � �f.

bw
A
T�efuupcottofb
Imal
pisB
ttprPifd
Wl
IsPitsttqtoB
Flsgo
F
2. The illumination used for imaging is broad-and, with a spectral profile S���p� defined over aavelength range �c � �.
. PR VHI with Monochromatic Illumination
he readout–imaging setup for monochromatic ��p �
f � PR VHI is shown in Fig. 2. A point-source ref-rence is collimated by an objective optical system ofront focal length f and aperture a before it is incidentpon the hologram as shown in the figure. The vol-me hologram diffracts only the Bragg-matched com-onents of the reference source, and a CCD cameraaptures the Fourier transform of the diffracted beamn the detector plane. This is the PR VHI image ofhe point source. Sinha et al. previously5 derivedhe diffracted intensity on the detector plane for ann-axis point source defocused by a small distance rom the front focus of the objective lens I�x�, y�; � toe
I� x�, y�; �
I��s F, 0; �� circ��� x� � �s F�2 � y�2�1�2
Fa�f 2 �� sinc2�L�s
�f�x�
F� �s�� . (1)
n Eq. �1�, I�x� � �sF, y� � 0; � is the peak �Bragg-atched� intensity observed at the detector plane
nd F is the focal length of the Fourier transformingens in front of the detector plane. The diffraction
ig. 1. Schematic for recording of volume holograms in PR VHI.
Fig. 2. Imaging set
attern contains two components: A disk represent-ng the defocus that is due to the lens and a sinc-quared term that defines the slit imposed by theragg selectivity �we refer to this as the Bragg slit�.We then use Eq. �1� to calculate the depth resolu-
ion of the PR VHI system. We have chosen to usehe full width at half-maximum of the longitudinaloint-spread function �PSF� to quantify the depthesolution of the PR VHI system. The longitudinalSF is calculated as in Ref. 5, pp. 1544–1546, by
ntegration of the diffracted intensity pattern I�x�, y�;� over the detector plane to produce the total dif-racted power corresponding to a particular value ofefocus , i.e.,
I�� � I� x�, y�; �dx�dy�. (2)
e estimated5 the full width at half-maximum of theongitudinal PSF to be
zFWHM �5.34�f d
2
�s aL. (3)
n Eq. �3�, d � f is the working distance of the PR VHIystem. We can see that the depth resolution of theR VHI system degrades quadratically with increas-
ng object distance.8 It was previously shown thathe resolution can be optimized5 by appropriately de-igned objective optics for a particular working dis-ance. However, beyond this, one is still subject tohe quadratic degradation of resolution. A similaruadratic degradation is observed in most systemshat resolve longitudinal features.11 The lateral res-lution of the system corresponds to the width of theragg slit, which is given by
xB �2�f d�s L
. (4)
rom Eq. �4� we see that the lateral resolution scalesinearly with object distance and hence the PR VHIystem can resolve lateral features better than lon-itudinal features. This is also a common propertyf most 3D imaging systems.11
up for PR VHI.
1 November 2004 � Vol. 43, No. 31 � APPLIED OPTICS 5785

B
Tanamtt
pvu3sTumi
mldptKptalmt
TccstpcI
Tc
wi
rtffwpxdsirislPl
bEFcseuv4faTmsontstdtottT
Fm
5
. PR VHI with Broadband Illumination
he imaging setup for broadband PR VHI is the sames the setup shown in Fig. 2. However, the objectow is broadband, with a spectral profile S���p� overrange of wavelengths �c � �. We define a nor-alized wavelength parameter � � �p��f to simplify
he notation. The spectral profile after transforma-ion to this normalized wavelength scale is S���.
The volume hologram disperses the spectral com-onents of the broadband source onto different trans-erse �x�� locations on the detector.7,10 This can benderstood by use of the k-sphere formulation of Fig.. The circle with the solid circumference repre-ents the k sphere for Bragg-matched wavelength �f.he radius of the sphere is �2���f �. When PR vol-me hologram grating vector Kg is read out by Bragg-atched probe kp��f �, the resultant diffracted beam
s kd��f � � Kg � kd��f �.The grating vector can also be read out by Bragg-ismatched wavelengths. We consider a wave-
ength �p � �f. The k sphere for �p is shown by theashed circle. From Fig. 3 we can see that it isossible to find a new probe wave vector kp��p� suchhat the resultant diffracted wave vector kd��p� �
g � kd��p� still lies on the k sphere for �p. Both therobe and the diffracted field vectors have to be ro-ated from their initial Bragg-matched locations tochieve this. As a rotation corresponds to a trans-ation in the Fourier plane, different wavelengths are
apped to different transverse locations on the de-ector plane.
The out-of-plane y direction is still degenerate.hus the Bragg slit that corresponds to each spectralomponent is mapped onto a different transverse lo-ation on the detector plane. For a broadbandource defocused by a distance , the diffraction pat-ern observed on the detector is an incoherent super-osition of the Bragg slits of the various spectralomponents. In other words, diffracted patternBB�x�, y�; � observed for a broadband source is
ig. 3. Use of the k-sphere formulation to explain the lateralapping of several spectral components.
IBB� x�, y�; � � I� x�, y�; , ��S���d�. (5) B
786 APPLIED OPTICS � Vol. 43, No. 31 � 1 November 2004
he observed diffraction pattern10 for one spectralomponent � is
I� x�, y�; , ��
Ib� circ� �r��
Fa�f 2�sinc2�L�s
�p�x�
F
��s�1 � ��
2 �� , (6)
here Ib � I�x� � �sF, y� � 0; , �� is the peakntensity produced by the probe and
�r��2 � �x� � F��s�1 � ��
2�
�s�1 � ��
2f ��2
� � y��2
(7)
epresents the geometrical image of the aperture ofhe objective optical system �or equivalently the de-ocused image of the probe� outside which the dif-racted power is approximately zero. From Eq. �6�e can see that the Bragg slit for each spectral com-onent is mapped onto a different transverse location� � F�s�1 � ���2. Consequently, the Bragg win-ow, which is a superposition of several slits corre-ponding to different values of � present in thellumination spectrum, is wider than the single nar-ow Bragg slit in the monochromatic case.10 It isntuitive to expect that this broadening of the windowhould lead to some deterioration of the depth reso-ution as it becomes more difficult for the broadbandR VHI system to reject out-of-focus light. Thus the
ongitudinal PSF, which is calculated as
I�� � IBB� x�, y�; �dx�dy�, (8)
roadens when broadband illumination is used. Inq. �8�, IBB�x�, y�; � can be calculated from Eq. �5�.igure 4 compares the diffraction patterns of a mono-hromatic and a broadband fluorescent source for theame PR VHI system. The fluorescent probe wasmitting at a bandwidth of 580 � 20 nm. The vol-me hologram was a 200-�m-thick photopolymer de-eloped by Aprilis, Inc. It was prerecorded at �f �88 nm and provided to us by Ondax, Inc. The dif-raction efficiency was � � 50%. Both the objectivend the Fourier lenses had focal lengths of 50.2 mm.he images were captured by a JAI Industrial CV 235onochrome camera. Figure 4�a� shows the ob-
erved intensity for � 0 when the hologram is readut by use of a monochromatic laser source �p � 532m and a broadband source � � 580 � 20 nm. Notehat both give rise to focused images. Figure 4�b�hows the diffraction pattern on the detector whenhe broadband probe is translated in the lateralirection. The broadband nature of the illumina-ion increases the lateral range over which the flu-rescent probe remains visible. Figure 4�c� showshe diffraction pattern for defocus � 2 mm for bothhe monochromatic and the broadband probes.he monochromatic probe gives rise to a single
ragg slit specified by Eq. �1�. The broadband
sattbwrb
3o
Icmlpcfsrasw
Fo source is wider than the laser’s Bragg slit. Source: Ref. 10.
Fb
ource, however, produces a wider Bragg slit onccount of the superposition of several spectralerms as described in Eq. �5�. Figure 5 compareshe depth resolution of the monochromatic and theroadband sources. As expected, the wider Braggindow for the fluorescent probe results in poorer
ejection of out-of-focus light and results in a muchroader longitudinal PSF for the fluorescent probe.
. Overcoming Depth-Resolution Degradation by Usef Multiple PR VHI Sensors and Digital Postprocessing
n Section 2 we saw that for a PR VHI system aombination of long working distance and large illu-ination bandwidth results in a loss of depth reso-
ution. We now discuss one way to solve thisroblem by using multiple PR VHI sensors that areonfigured to look at the object of interest from dif-erent perspectives. The image from each PR VHIensor is then combined digitally to produce a high-esolution 3D image of the object. We refer to thispproach as N-ocular VHI, and it was inspired bytereo vision,12 which is found in many animals asell as in artificial machine vision systems.
ig. 4. Diffraction pattern observed experimentally for a broadbaf a Bragg-matched laser, �p � 532 nm, and a fluorescent source.x� � 3 mm. �c� The Bragg slit at � 2 mm for the fluorescent
nd fluorescent object emitting at �p � 580 � 20 nm. �a� Comparison�b� The fluorescent source stays visible for a large lateral translation,
However, there are several important differences b
ig. 5. Comparison of depth resolution for monochromatic androadband illumination. The broadband PSF �dashed curve� is
roader than the monochromatic PSF �solid curve�.1 November 2004 � Vol. 43, No. 31 � APPLIED OPTICS 5787
balamttsvePmlNcNwi
ftatsl�ksittoop
PbwP
istPispsHaapr�Dtt
upntrpitds
FP
5
etween triangulation as it is used in computer visionnd in the multiple PR VHI sensor setup. Triangu-ating systems need to establish correspondence13
mong locations of particular object features on theultiple acquired images. �Many active triangula-
ion schemes do not need correspondence,14,15 buthey require structured illumination�. The Braggelectivity and wavelength degeneracy properties ofolume holograms2,16 ensure that there is no need tostablish correspondence as long as the location of theR VHI system is known precisely. Moreover, asultiple �N � 2� sensors can be configured to be
ooking at the same object, it is possible to achieve-ocular imaging. Researchers previously17 built
amera-based N-ocular systems in which as many as� 200 cameras were used for 3D imaging. Below,
e describe the working principle involved in improv-ng the depth resolution of a multisensor system.
If two sensors, with their respective optical axesorming an angle �, are observing the same object,heir PSFs are also inclined relatively by the samengle. Provided that the sensors are oriented suchhat their optical axes intersect, the location of theource of the diffracted light is actually constrained toie at the intersection of the volumes of the two PSFsassuming that the optical axis orientations arenown�. This means that the 3D location of the lightource is triangulated without the need for establish-ng correspondence. A simple ad hoc way to charac-erize the constrained system is to define its PSF ashe product of the individual PSFs. Hence the res-lution of a combined system is better than the res-lution of each individual sensor. The use of a
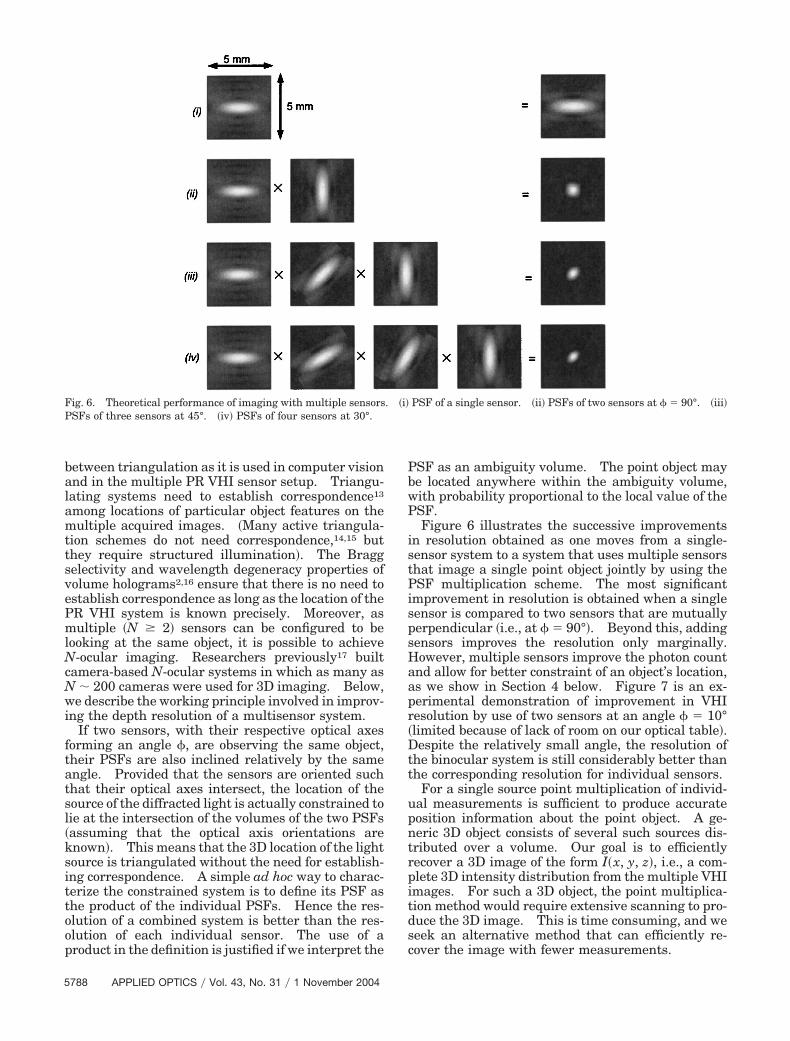
ig. 6. Theoretical performance of imaging with multiple sensorsSFs of three sensors at 45°. �iv� PSFs of four sensors at 30°.
roduct in the definition is justified if we interpret the c
788 APPLIED OPTICS � Vol. 43, No. 31 � 1 November 2004
SF as an ambiguity volume. The point object maye located anywhere within the ambiguity volume,ith probability proportional to the local value of theSF.Figure 6 illustrates the successive improvements
n resolution obtained as one moves from a single-ensor system to a system that uses multiple sensorshat image a single point object jointly by using theSF multiplication scheme. The most significant
mprovement in resolution is obtained when a singleensor is compared to two sensors that are mutuallyerpendicular �i.e., at � � 90°�. Beyond this, addingensors improves the resolution only marginally.owever, multiple sensors improve the photon countnd allow for better constraint of an object’s location,s we show in Section 4 below. Figure 7 is an ex-erimental demonstration of improvement in VHIesolution by use of two sensors at an angle � � 10°limited because of lack of room on our optical table�.espite the relatively small angle, the resolution of
he binocular system is still considerably better thanhe corresponding resolution for individual sensors.
For a single source point multiplication of individ-al measurements is sufficient to produce accurateosition information about the point object. A ge-eric 3D object consists of several such sources dis-ributed over a volume. Our goal is to efficientlyecover a 3D image of the form I�x, y, z�, i.e., a com-lete 3D intensity distribution from the multiple VHImages. For such a 3D object, the point multiplica-ion method would require extensive scanning to pro-uce the 3D image. This is time consuming, and weeek an alternative method that can efficiently re-
PSF of a single sensor. �ii� PSFs of two sensors at � � 90°. �iii�
. �i�over the image with fewer measurements.

4
Fttwasg
elsnt
ittedcmeHth
sdwdtsewowp
fiodapc
eO
Ft
Fp
. N-Ocular VHI for Three-Dimensional Objects
igure 8 is a schematic of an N-ocular PR VHI sys-em. For the purpose of this paper we assume thathe sensor can image the entire 3D object of interestithout any defocus blur. For a simple camera thisssumption is equivalent to using an objective opticalystem whose depth of field18 is larger than the lon-itudinal extent of the 3D object.The Bragg slit of the PR VHI system automatically
liminates the defocus blur in the x direction andeaves only the degenerate out-of-plane y directionusceptible to defocus effects. Thus, for VHI, theo-defocus assumption is equivalent to assuminghat the objective optical system is chosen such that
ig. 7. Experimental PSFs for two individual sensors oriented athe sensor: �a� 29 cm, �b� 45 cm, �c� 72 cm.
ig. 8. Schematic of an N-ocular VHI system. For illustration
surposes we have depicted N � 3.t eliminates the y defocus. Consequently we ignorehe degenerate y direction in our discussion. Al-hough this assumption may not be strictly true, ourxperimental results demonstrate that the effect of yefocus is negligible in practice. Alternatively, oneould incorporate a cubic or logarithmic phaseask19,20 into the volume hologram to deliberately
xtend the depth of field and eliminate defocus.owever, a detailed discussion of wave-front coding
echniques to extend the depths of field of volumeolograms is beyond the scope of this paper.From Fig. 5 we can see that a broadband VHI
ystem has little Bragg selectivity in the longitudinalirection; i.e., the longitudinal PSF is almost flat,ith little drop in diffracted power observed withefocus. Consequently it is not possible to recoverhe longitudinal position of a broadband object byimply monitoring the diffraction intensity on a pow-rmeter. Thus the broadband VHI image is some-hat similar to an image from a lens with large depthf field in the sense that an object remains in focusith little change in image intensity over a long dis-lacement.However, the volume hologram and the lens differ
undamentally in the way they form images. A lenss a linear shift-invariant system21 that can map anbject plane to an image, provided that certain con-itions are satisfied �the lens law, for example�. Forn achromatic lens, the imaging operation is inde-endent of the wavelength of the illumination, and noolor dispersion is observed in the image plane.
The Bragg selectivity of the volume hologram, how-ver, makes the hologram strongly shift variant.nly Bragg-matched sources are imaged in a PR VHI
10° for point sources located at the following distances in front of
� �ystem. Consider a point emitting at a relative
1 November 2004 � Vol. 43, No. 31 � APPLIED OPTICS 5789

wc
twst
Aaa
T�
wi
w
FbtStmasmtpmswn
smsP
VTw
e are
5
avelength �. The point source has to satisfy a lo-ation constraint10
x �f�s�1 � ��
2(9)
o be Bragg matched and visible to the hologram,hich follows from Eq. �6�. This Bragg-matched
ource is then imaged by the PR volume hologram tohe detector location
x� �F�s�1 � ��
2. (10)
lternatively, one can say that a point sensor locatedt x� measures contributions from all point sourceslong the line
x � f�s�1 �x�
F�s� . (11)
hese contributions are dispersed according to Eq.10�, as shown schematically in Fig. 9.
Consider a broadband object emitting over a band-idth �c � �. The broadband illumination results
n a band of lines
xc � x �f�s�1 � �c�
2�
f�s�
2, (12)
Fig. 9. All voxels located along a line in the object spac
Fig. 10. Several point sources that satisfy Eq. �12� are simultaneou
790 APPLIED OPTICS � Vol. 43, No. 31 � 1 November 2004
hich are mapped to the detector locations
xc� � x� � F�s�1 �xc
f�s� �
Fxf
. (13)
rom Eqs. �12� and �13� we can see that the broad-and PR VHI has a larger lateral field of view thanhe corresponding monochromatic PR VHI sensor.everal lines similar to Eq. �11�, each correspondingo a different wavelength, are simultaneouslyapped to the detector to form a Bragg rainbow. Asresult of this, the broadband PR VHI images show
ignificant color dispersion as different colors areapped to different detector locations.7 Further,
his unique mapping method restricts the locus ofossible locations that can contribute to a particulareasurement point x� to a single line in the object
pace according to Eq. �11�, as is shown in Fig. 10,here three different wavelengths are simulta-eously imaged by the volume hologram.However, triangulating the location of a point
ource requires at least two lines. Thus to deter-ine a source location we need at least two PR VHI
ensors. We now discuss a general system with NR VHI sensors available for imaging.Figure 11 is a simplified schematic of N-ocular
HI. We depict N � 3 for illustrative purposes.he object is assumed to be two-dimensional �2D�,ith intensity distribution I�x, z�. We reiterate here
mapped onto the same lateral location on the detector.
sly imaged by the PR volume hologram according to Eq. �13�.
ttrw
doasnttdtao
ItiIVft
A
IrbdAvas1pemsdcRs
tt
oiuitibsmittpijmowbwbbasVnt
igfiptscv
F2
Ffs
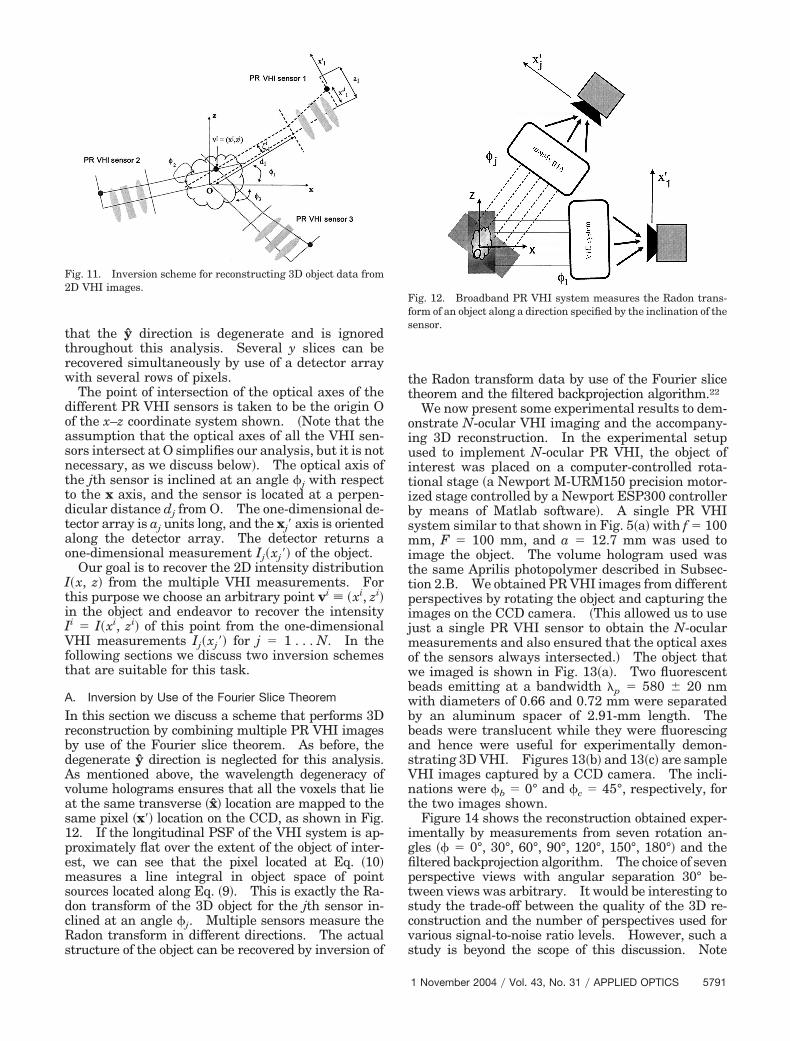
hat the y direction is degenerate and is ignoredhroughout this analysis. Several y slices can beecovered simultaneously by use of a detector arrayith several rows of pixels.The point of intersection of the optical axes of the
ifferent PR VHI sensors is taken to be the origin Of the x–z coordinate system shown. �Note that thessumption that the optical axes of all the VHI sen-ors intersect at O simplifies our analysis, but it is notecessary, as we discuss below�. The optical axis ofhe jth sensor is inclined at an angle �j with respecto the x axis, and the sensor is located at a perpen-icular distance dj from O. The one-dimensional de-ector array is aj units long, and the xj� axis is orientedlong the detector array. The detector returns ane-dimensional measurement Ij�xj�� of the object.Our goal is to recover the 2D intensity distribution
�x, z� from the multiple VHI measurements. Forhis purpose we choose an arbitrary point vi � �xi, zi�n the object and endeavor to recover the intensityi � I�xi, zi� of this point from the one-dimensionalHI measurements Ij�xj�� for j � 1 . . . N. In the
ollowing sections we discuss two inversion schemeshat are suitable for this task.
. Inversion by Use of the Fourier Slice Theorem
n this section we discuss a scheme that performs 3Deconstruction by combining multiple PR VHI imagesy use of the Fourier slice theorem. As before, theegenerate y direction is neglected for this analysis.s mentioned above, the wavelength degeneracy ofolume holograms ensures that all the voxels that liet the same transverse �x� location are mapped to theame pixel �x�� location on the CCD, as shown in Fig.2. If the longitudinal PSF of the VHI system is ap-roximately flat over the extent of the object of inter-st, we can see that the pixel located at Eq. �10�easures a line integral in object space of point
ources located along Eq. �9�. This is exactly the Ra-on transform of the 3D object for the jth sensor in-lined at an angle �j. Multiple sensors measure theadon transform in different directions. The actual
ig. 11. Inversion scheme for reconstructing 3D object data fromD VHI images.
tructure of the object can be recovered by inversion of s
he Radon transform data by use of the Fourier sliceheorem and the filtered backprojection algorithm.22
We now present some experimental results to dem-nstrate N-ocular VHI imaging and the accompany-ng 3D reconstruction. In the experimental setupsed to implement N-ocular PR VHI, the object of
nterest was placed on a computer-controlled rota-ional stage �a Newport M-URM150 precision motor-zed stage controlled by a Newport ESP300 controllery means of Matlab software�. A single PR VHIystem similar to that shown in Fig. 5�a� with f � 100m, F � 100 mm, and a � 12.7 mm was used to
mage the object. The volume hologram used washe same Aprilis photopolymer described in Subsec-ion 2.B. We obtained PR VHI images from differenterspectives by rotating the object and capturing themages on the CCD camera. �This allowed us to useust a single PR VHI sensor to obtain the N-ocular
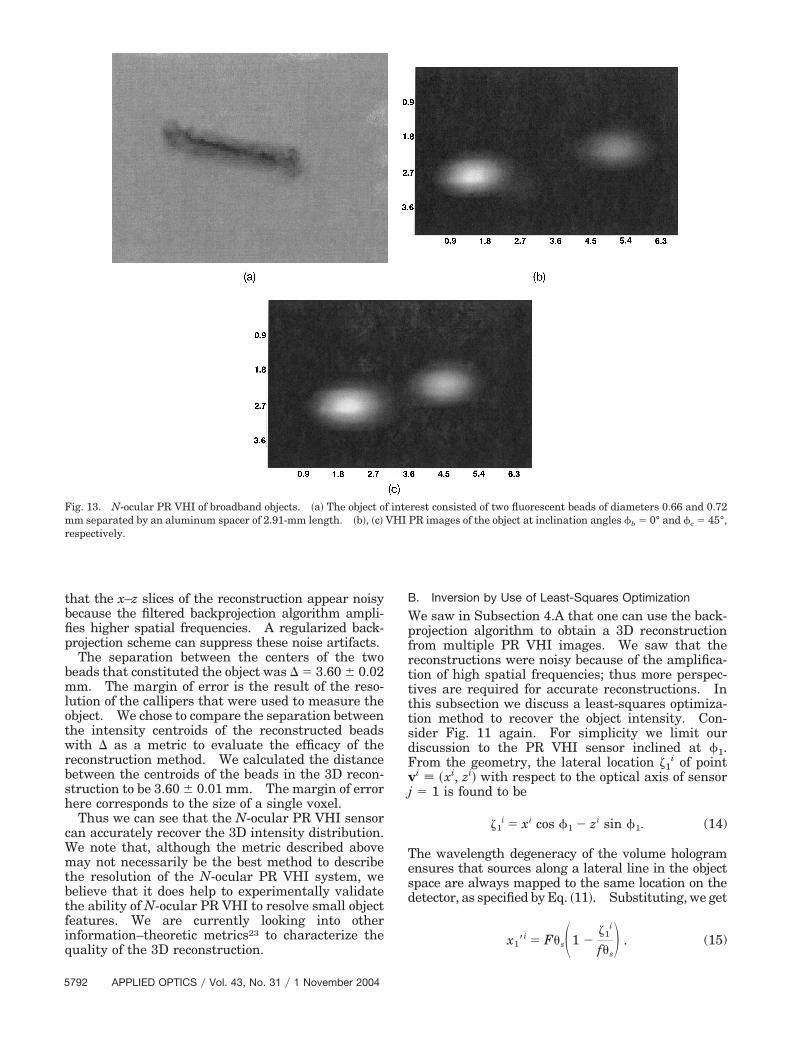
easurements and also ensured that the optical axesf the sensors always intersected.� The object thate imaged is shown in Fig. 13�a�. Two fluorescenteads emitting at a bandwidth �p � 580 � 20 nmith diameters of 0.66 and 0.72 mm were separatedy an aluminum spacer of 2.91-mm length. Theeads were translucent while they were fluorescingnd hence were useful for experimentally demon-trating 3D VHI. Figures 13�b� and 13�c� are sampleHI images captured by a CCD camera. The incli-ations were �b � 0° and �c � 45°, respectively, forhe two images shown.
Figure 14 shows the reconstruction obtained exper-mentally by measurements from seven rotation an-les �� � 0°, 30°, 60°, 90°, 120°, 150°, 180°� and theltered backprojection algorithm. The choice of sevenerspective views with angular separation 30° be-ween views was arbitrary. It would be interesting totudy the trade-off between the quality of the 3D re-onstruction and the number of perspectives used forarious signal-to-noise ratio levels. However, such a
ig. 12. Broadband PR VHI system measures the Radon trans-orm of an object along a direction specified by the inclination of theensor.
tudy is beyond the scope of this discussion. Note
1 November 2004 � Vol. 43, No. 31 � APPLIED OPTICS 5791
tbfip
bmlotwrbsh
cWmtbtfiq
B
WpfrttttsdFvj
Tesd
Fmr
5
hat the x–z slices of the reconstruction appear noisyecause the filtered backprojection algorithm ampli-es higher spatial frequencies. A regularized back-rojection scheme can suppress these noise artifacts.The separation between the centers of the two
eads that constituted the object was � 3.60 � 0.02m. The margin of error is the result of the reso-
ution of the callipers that were used to measure thebject. We chose to compare the separation betweenhe intensity centroids of the reconstructed beadsith as a metric to evaluate the efficacy of the
econstruction method. We calculated the distanceetween the centroids of the beads in the 3D recon-truction to be 3.60 � 0.01 mm. The margin of errorere corresponds to the size of a single voxel.Thus we can see that the N-ocular PR VHI sensor
an accurately recover the 3D intensity distribution.e note that, although the metric described aboveay not necessarily be the best method to describe
he resolution of the N-ocular PR VHI system, weelieve that it does help to experimentally validatehe ability of N-ocular PR VHI to resolve small objecteatures. We are currently looking into othernformation–theoretic metrics23 to characterize the
ig. 13. N-ocular PR VHI of broadband objects. �a� The object om separated by an aluminum spacer of 2.91-mm length. �b�, �c�
espectively.
uality of the 3D reconstruction.
792 APPLIED OPTICS � Vol. 43, No. 31 � 1 November 2004
. Inversion by Use of Least-Squares Optimization
e saw in Subsection 4.A that one can use the back-rojection algorithm to obtain a 3D reconstructionrom multiple PR VHI images. We saw that theeconstructions were noisy because of the amplifica-ion of high spatial frequencies; thus more perspec-ives are required for accurate reconstructions. Inhis subsection we discuss a least-squares optimiza-ion method to recover the object intensity. Con-ider Fig. 11 again. For simplicity we limit ouriscussion to the PR VHI sensor inclined at �1.rom the geometry, the lateral location �1
i of pointi � �xi, zi� with respect to the optical axis of sensor� 1 is found to be
�1i � xi cos �1 � zi sin �1. (14)
he wavelength degeneracy of the volume hologramnsures that sources along a lateral line in the objectpace are always mapped to the same location on theetector, as specified by Eq. �11�. Substituting, we get
i �1i
rest consisted of two fluorescent beads of diameters 0.66 and 0.72PR images of the object at inclination angles �b � 0° and �c � 45°,
f inteVHI
x1� � F�s�1 �f�s
� . (15)

Tl
Wcs
Wmm
TIr
aiwwcv
onyctad
FteTt
F�b ted to
he intensity measurement that corresponds to thisocation is
I1i � I1� x1�
i�. (16)
e can calculate the measurement point and theorresponding intensity for each of the other � j � 1�ensors as
xj�i � F�s�1 �
xi cos �j � zi sin �j
f�s� , (17)
Iji � Ij� xj�
i�. (18)
e take the desired intensity Ii to be the value thatinimizes the mean-square error22 of the differenteasurements:
Ii � arg min��j
�I � Iji�2� . (19)
his operation results in a least-squares estimate for�xi, zi�. This procedure is repeated for all points toecover the entire 2D intensity distribution I�x, z�.
ig. 14. 3D image of the object shown in Fig. 13 obtained by the ib�, �c�, �d�, �e�, �f � The same slices at y � 0, 0.25, 0.5, 0.75, 1 metween the centroids of the two reconstructed beads was calcula
It is useful to reiterate here that Eqs. �17� and �18� c
re valid only because the volume hologram automat-cally establishes correspondence by virtue of theavelength degeneracy. This approach would notork for a simple lens system without establishing
orrespondence among multiple images before the in-ersion.As we mentioned above, the assumption that the
ptical axes of the multiple sensors intersect is notecessary. Sensors with nonintersecting axes stillield equations similar to Eq. �17�; however, in thisase we need to modify xj�
i by taking the actual loca-ion of the optical axis into account. If the opticalxis of the VHI sensor is located at a perpendicularistance � from O, Eq. �17� is rewritten as
xj�i � F�s�1 �
� � � xi cos �j � zi sin �j�
f�s� . (20)
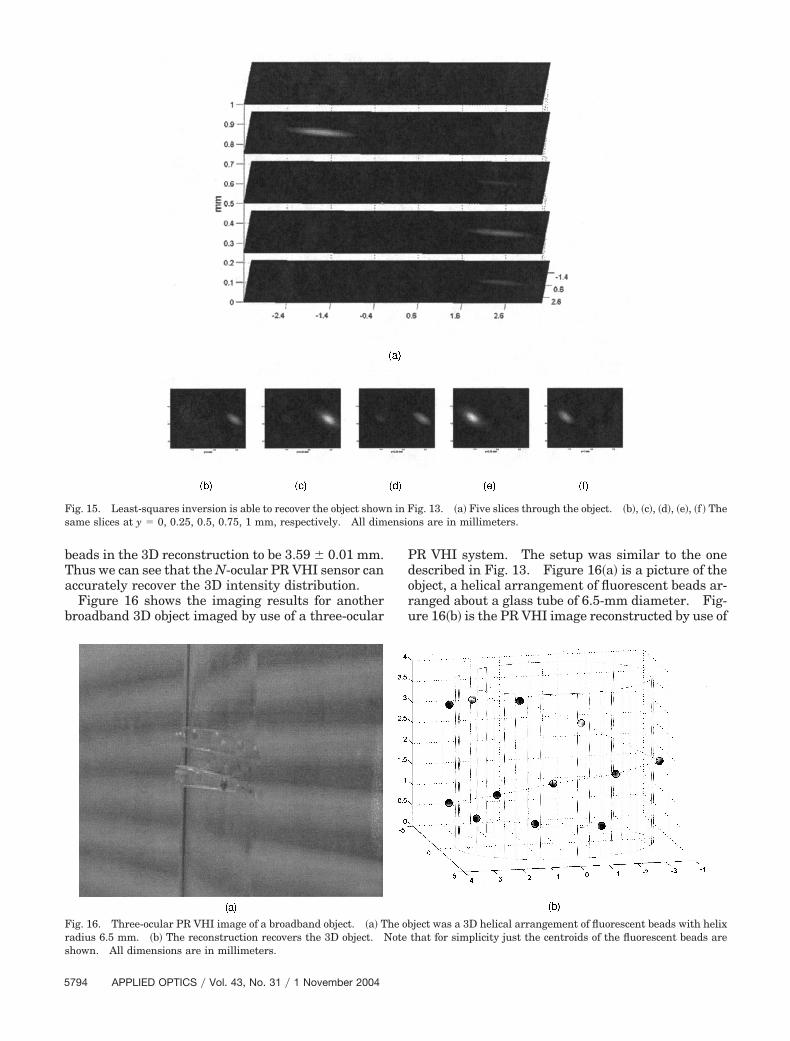
Figure 15 shows the reconstruction of the object ofig. 13�a� obtained experimentally by use of five ro-
ation angles �� � 0°, 30°, 45°, 60°, 90°�. The differ-nt perspectives were obtained by angular scanning.he separation between the centers of the two beadshat constituted the object was 3.60 � 0.02 mm. We
se Radon transform approach. �a� Five slices through the object.spectively. All dimensions are in millimeters. The separationbe 3.60 � 0.01 mm.
nverm, re
alculated the distance between the centroids of the
1 November 2004 � Vol. 43, No. 31 � APPLIED OPTICS 5793
bTa
b
Pdor
Fsame slices at y � 0, 0.25, 0.5, 0.75, 1 mm, respectively. All dimensions are in millimeters.
Frs
5
eads in the 3D reconstruction to be 3.59 � 0.01 mm.hus we can see that the N-ocular PR VHI sensor canccurately recover the 3D intensity distribution.Figure 16 shows the imaging results for another
roadband 3D object imaged by use of a three-ocular u
hown. All dimensions are in millimeters.
794 APPLIED OPTICS � Vol. 43, No. 31 � 1 November 2004
R VHI system. The setup was similar to the oneescribed in Fig. 13. Figure 16�a� is a picture of thebject, a helical arrangement of fluorescent beads ar-anged about a glass tube of 6.5-mm diameter. Fig-
ig. 15. Least-squares inversion is able to recover the object shown in Fig. 13. �a� Five slices through the object. �b�, �c�, �d�, �e�, �f � The
re 16�b� is the PR VHI image reconstructed by use of
ig. 16. Three-ocular PR VHI image of a broadband object. �a� The object was a 3D helical arrangement of fluorescent beads with helixadius 6.5 mm. �b� The reconstruction recovers the 3D object. Note that for simplicity just the centroids of the fluorescent beads are

tcAm
5
WaoliNaaonNlffithW3oi
fcipdsiortfbboAasfsmmtcco
eRcFaB
tm
R
1
1
1
1
1
1
1
1
11
2
2
2
2
2
hree views �� � 0°, 45°, 90°�. Note that just theentroid of each fluorescent bead has been shown.gain, we can see that the original helical arrange-ent is accurately recovered.
. Discussion and Conclusions
e have shown that N-ocular VHI can potentially beuseful tool with which to recover accurately 3D
bject information when a single VHI system hasimited depth resolution as a result of its long work-ng distance or high illumination bandwidth or both.-ocular VHI is particularly useful because it doesway with the need to establish correspondencemong multiple images. Moreover, we recover thebject in Cartesian rather than projective coordi-ates. We have discussed two methods to invert the-ocular VHI data to reconstruct the 3D object:
east-squares optimization and inverse Radon trans-orm. The least-squares method does not scale wellor objects that have large numbers of voxels becauset is computationally expensive. The inverse Radonransform method is computationally more efficient;owever, it is more susceptible to noise artifacts.e have presented experimental results for simple
D fluorescent objects that we fabricated in the lab-ratory. Next, we plan to image translucent biolog-cal specimens such as marine plankton.
This paper was intended to introduce the uniqueusion of smart optical sensing and digital postpro-essing afforded by N-ocular VHI. There are severalnteresting issues that we did not examine in thisaper. For instance, we assumed that the longitu-inal PSF was approximately flat over the range ofources in the 3D object that contribute to the linentegral. Whereas this assumption was valid forur experimental setup �Fig. 5�, we plan to incorpo-ate the dip of the longitudinal PSF in the Radonransform formulation and arrive at a slightly dif-erent backprojection scheme in the future. Weelieve that further improvement can be obtainedy incorporation of diffraction tomography24 meth-ds to correct for y defocus in future experiments.dditionally, the illumination conditions also playn important role in VHI. We plan in the future totudy different illumination schemes and their ef-ect on imaging performance. We also plan totudy the effect of object motion on imaging perfor-ance. Finally, the optimal number of Radoneasurements required under specific noise condi-
ions is not known, but identifying that number willonstitute an important step in understanding theomplexity and information–theoretic efficiency ofur imaging scheme.
We are grateful to Wenhai Liu, Chris Moser, Dem-tri Psaltis, Tina Shih, Wenyang Sun, Kehan Tian,obert Murphey, and Brian H. Miles for helpful dis-ussions. This project was funded by the U.S. Airorce Research Laboratories �Eglin Air Force Base�nd the Charles Stark Draper Laboratory. George
arbastathis acknowledges the support of the Na-ional Science Foundation through a CAREER �for-erly Young Investigator� Award.
eferences1. G. Barbastathis and D. J. Brady, “Multidimensional tomo-
graphic imaging using volume holography,” Proc. IEEE 87,2098–2120 �1999�.
2. E. N. Leith, A. Kozma, J. Upatnieks, J. Marks, and N. Massey,“Holographic data storage in three-dimensional media,” Appl.Opt. 5, 1303–1311 �1966�.
3. P. Yeh, Introduction to Photorefractive Nonlinear Optics�Wiley, New York, 1993�.
4. P. J. van Heerden, “Theory of optical information storage insolids,” Appl. Opt. 2, 393–400 �1963�.
5. A. Sinha, W. Sun, T. Shih, and G. Barbastathis, “Volume ho-lographic imaging in the transmission geometry,” Appl. Opt.43, 1–19 �2004�.
6. G. Barbastathis, M. Balberg, and D. J. Brady, “Confocal mi-croscopy with a volume holographic filter,” Opt. Lett. 24, 811–813 �1999�.
7. W. Liu, D. Psaltis, and G. Barbastathis, “Real time spectralimaging in three spatial dimensions,” Opt. Lett. 27, 854–856�2002�.
8. A. Sinha and G. Barbastathis, “Volume holographic telescope,”Opt. Lett. 27, 1690–1692 �2002�.
9. A. Sinha and G. Barbastathis, “Volume holographic imagingfor surface metrology at long working distances,” Opt. Express11, 3202–3209 �2003�, http:��www.opticsexpress.org.
0. A. Sinha, W. Sun, and G. Barbastathis, “Broadband volumeholographic imaging,” Appl. Opt. 43, 5214–5221 �2004�.
1. M. Born and E. Wolf, Principles of Optics, 7th ed. �Pergamon,Cambridge, UK, 1998�.
2. O. Faugeras and Q.-T. Luong, The Geometry of Multiple Im-ages �MIT Press, Cambridge, Mass., 2001�.
3. U. R. Dhond and J. K. Aggarwal, “Structure from stereo: areview,” IEEE Trans. Syst. Man. Cybern. 14, 1489–1510�1989�.
4. J. Aloimonos, I. Weiss, and A. Bandyopadhyay, “Active vision,”in Proceedings of IEEE First International Conference on Com-puter Vision (Institute of Electrical and Electronics Engineers,New York, 1987), pp. 35–54.
5. N. Ahuja and A. Abbott, “Active stereo: integrating disparity,vergence, focus, aperture, and calibration for surface estima-tion,” IEEE Trans. Pattern Anal. Mach. Intell. 15, 1007–1029�1993�.
6. D. Psaltis, F. Mok, and H. Y.-S. Li, “Nonvolatile storage inphotorefractive crystals,” Opt. Lett. 19, 210–212 �1994�.
7. H. Martin and T. Kanade, “Incremental reconstruction of 3Dscenes from multiple, complex images,” Artif. Intell. 30, 289–341 �1986�.
8. M. V. Klein and T. E. Furtak, Optics �Wiley, New York, 1986�.9. E. R. Dowski and W. T. Cathey, “Extended depth of field
through wave-front coding,” Appl. Opt. 34, 1859–1866�1994�.
0. N. George and W. Chi, “Extended depth of field using a loga-rithmic asphere,” J. Opt. A Pure Appl. Opt. 5, S157–S163�2003�.
1. J. W. Goodman, Introduction to Fourier Optics, 2nd ed.�McGraw-Hill, New York, 1996�.
2. M. Bertero and P. Boccacci, Introduction to Inverse Problems inImaging �Institute of Physics, London, 1998�.
3. G. Barbastathis and A. Sinha, “Information content of volumeholographic imaging,” Trends Biotechnol. 19, 383–392 �2001�.
4. A. C. Kak and M. Slaney, Principles of Computerized Tomo-
graphic Imaging �IEEE Press, New York, 1999�.1 November 2004 � Vol. 43, No. 31 � APPLIED OPTICS 5795