THREE-DIMENSIONAL HOLOGRAPHIC VIDEO DISPLAY ...
151
THREE-DIMENSIONAL HOLOGRAPHIC VIDEO DISPLAY SYSTEMS USING MULTIPLE SPATIAL LIGHT MODULATORS a dissertation submitted to the department of electrical and electronics engineering and the graduate school of engineering and science of bilkent university in partial fulfillment of the requirements for the degree of doctor of philosophy By Fahri Yara¸ s May 2011
-
Upload
khangminh22 -
Category
Documents
-
view
1 -
download
0
Transcript of THREE-DIMENSIONAL HOLOGRAPHIC VIDEO DISPLAY ...

THREE-DIMENSIONAL HOLOGRAPHIC VIDEO
DISPLAY SYSTEMS USING MULTIPLE SPATIAL
LIGHT MODULATORS
a dissertation
submitted to the department of electrical and electronics
engineering
and the graduate school of engineering and science
of bilkent university
in partial fulfillment of the requirements
for the degree of
doctor of philosophy
By
Fahri Yaras
May 2011

I certify that I have read this thesis and that in my opinion it is fully adequate,
in scope and in quality, as a thesis for the degree of Doctor of Philosophy.
Prof. Dr. Levent Onural (Supervisor)
I certify that I have read this thesis and that in my opinion it is fully adequate,
in scope and in quality, as a thesis for the degree of Doctor of Philosophy.
Prof. Dr. Haldun M. Ozaktas
I certify that I have read this thesis and that in my opinion it is fully adequate,
in scope and in quality, as a thesis for the degree of Doctor of Philosophy.
Prof. Dr. Hakan Urey
I certify that I have read this thesis and that in my opinion it is fully adequate,
in scope and in quality, as a thesis for the degree of Doctor of Philosophy.
Prof. Dr. Orhan Arıkan
I certify that I have read this thesis and that in my opinion it is fully adequate,
in scope and in quality, as a thesis for the degree of Doctor of Philosophy.
Assoc. Prof. Dr. Ugur Gudukbay
Approved for the Graduate School of Engineering and Science:
Prof. Dr. Levent OnuralDirector of Graduate School of Engineering and Science
ii

ABSTRACT
THREE-DIMENSIONAL HOLOGRAPHIC VIDEO
DISPLAY SYSTEMS USING MULTIPLE SPATIAL
LIGHT MODULATORS
Fahri Yaras
Ph.D. in Electrical and Electronics Engineering
Supervisor: Prof. Dr. Levent Onural
May 2011
Spatial light modulators (SLMs) are commonly used in electro-holographic display sys-
tems. Liquid crystal on silicon, liquid crystal, mirror-based, acousto-optic and optically
addressed devices are some of the SLM types. Most of the SLMs are digitally driven
and pixelated; therefore, they are easy to use. We use phase-only SLMs in our experi-
ments. Resolution and size of currently available SLMs are inadequate for satisfactory
holographic reconstructions. Space-bandwidth product (SBP) is a good metric for the
quality assessments. High SBP is needed when lateral or rotational motion is allowed for
the observer. In our experiments 2D images whose sizes are even larger than the SLM
size are reconstructed using single SLM holographic displays. Volume reconstructions
are also obtained by using such displays. Either LED or laser illumination is used in our
experiments. After the experiments with the single SLM holographic displays, some lab-
oratory prototypes of multiple SLM holographic systems are designed and implemented.
In a real-time color holographic display system, three SLMs are used for red, blue and
green channels. GPU acceleration is also used to achieve video rates. Beam-splitters
and micro-stages are used for the alignments in all multiple SLM designs. In another
multiple SLM configuration, SLMs are tiled side by side to form a three by two matrix to
increase both vertical and horizontal field of view. Larger field of view gives flexibility to
iii

the observer to move and rotate around the reconstructed images of objects. To further
increase the field of view, SLMs are tiled in a circular configuration. A single large beam-
splitter is used to tile the SLMs side by side without any gap. A cone mirror is used
to direct incoming light toward all SLMs. Compared to planar configuration, circularly
configured multiple SLMs increase the field of view, significantly. With the help of such
configurations holographic videos of ghost-like 3D objects can be observed binocularly.
Experimental results are satisfactory.
Keywords: Holographic Displays, Holographic Video, 3DTV, Digital Holography, Com-
puter Generated Holography, Real-time Holography, Spatial Light Modulators, Phase
Holograms
iv

OZET
BIRDEN COK UZAMSAL ISIK MODULATORLU HOLOGRAFIK
UC-BOYUTLU VIDEO GOSTERIM SISTEMLERI
Fahri Yaras
Elektrik ve Elektronik Muhendisligi Bolumu Doktora
Tez Yoneticisi: Prof. Dr. Levent Onural
Mayıs 2011
Uzamsal ısık modulatorleri, elektro-holografik gosterim sistemlerinde yaygın olarak kul-
lanılmaktadır. Silikon uzerine sıvı kristal, sıvı kristal, mikro-aynalı, akusto-optik ve optik
olarak adreslenebilir aygıtlar uzamsal ısık modulatoru cesitlerinden bazılarıdır. Uzamsal
ısık modulatorlerinin cogu sayısal olarak kontrol edilebilir ve pikselli bir yapıya sahiptir-
ler. Dolayısıyla kullanımları kolaydır. Deneylerimizde, ısıgın sadece evresini module eden
uzamsal ısık modulatorleri kullandık. Mevcut uzamsal ısık modulatorlerinin cozunurlugu
ve boyutları tatmin edici kalitede holografik geri catımların elde edilmesinde yetersiz
kalmaktadır. Uzam-bant genisligi carpımı kalite degerlendirmesinde iyi bir olcuttur.
Gozlemciye yanal ve donel hareket serbestisi verildiginde yuksek uzam-bant genisligi
carpımına ihtiyac duyulmaktadır. Deneylerimizde, tek uzamsal ısık modulatorlu holo-
grafik gosterim sistemleri ile, modulatorunun boyundan bile buyuk iki-boyutlu goruntuler
holografik olarak olusturuldu. Bu gibi gosterim sistemleri ile hacimli goruntuler de holo-
grafik olarak olusturuldu. Deneylerimizde LED ya da lazer aydınlatması kullanıldı. Tek
uzamsal ısık modulatorlu holografik gosterim sistemleriyle yapılan deneylerden sonra bir-
den cok uzamsal ısık modulatorlu holografik gosterim sistemleri tasarlandı ve gerceklesti-
rildi. Gercek-zamanlı renkli bir holografik gosterim sisteminde kırmızı, yesil ve mavi
kanallar icin uc adet uzamsal ısık modulatoru kullanıldı. Video hızlarına ulasmak icin
ise grafik isleme unitesi (GPU) kullanıldı. Butun cok uzamsal ısık modulatoru kullanılan
v

sistemlerde hizalama islemleri icin huzme-boluculer ve mikro-konumlayıcılar kullanıldı.
Diger bir cok modulatorlu tasarımda, dikey ve dusey gorus alanını arttırmak icin mod-
ulatorler uce ikilik bir matris olusturacak sekilde yan yana dosendi. Daha fazla gorus
alanı, gozlemciye holografik olarak olusturulmus goruntulerin etrafında dolasma esnekligi
tanımaktadır. Bu gorus alanını daha da arttırmak icin uzamsal ısık modulatorleri dairesel
konumda yerlestirildi. Modulatorleri aralarında bosluk kalmayacak sekilde yerlestirmek
icin tek ve buyuk bir huzme-bolucu kullanıldı. Gelen ısıgı tum uzamsal ısık modulatorlerine
yonlendirebilmek icin ise koni seklinde bir ayna kullanıldı. Duzlemsel olanlara kıyasla
dairesel tasarımların gorus alanını belirli bir sekilde arttırdıgı goruldu. Bu yapıdaki
tasarımlar sonucunda, hayalete benzeyen uc-boyutlu nesnelerin holografik videoları iki
gozle birden izlenebilmektedir. Deneysel sonuclar tatmin edicidir.
Anahtar Kelimeler: Holografik Ekranlar, Holografik Video, 3-Boyutlu Televizyon, Sayısal
Holografi, Bilgisayarla Uretilmis Holografi, Gercek Zamanlı Holografi, Uzamsal Isık Modu-
latorleri
vi

ACKNOWLEDGMENTS
Foremost, I would like to gratefully and sincerely thank my supervisor, Prof. Dr.
Levent Onural, whose guidance, encouragement, supervision and continuous support from
the preliminary to the concluding level enabled me to develop an understanding of the
subject.
Besides my advisor, I also would like to thank my thesis committee: Prof. Dr. Haldun
M. Ozaktas, Prof. Dr. Hakan Urey, Prof. Dr. Orhan Arıkan and Assoc. Prof. Dr. Ugur
Gudukbay for their encouragement and insightful comments. I would like to thank the
Department of Electrical and Electronics Engineering at Bilkent University for their sup-
port throughout my thesis study. This work is supported by EC within FP6 under Grant
511568 with acronym 3DTV and within FP7 under Grant 216105 with the acronym Real
3D. I also would like to thank to TUBITAK (The Scientific and Technological Research
Council of Turkey) for financial support.
I thank my fellow friends and labmates, especially to Dr. Metodi Kovachev, Dr.
Rossitza Ilieva, Dr. Hoonjong Kang and Dr. Elena Stoykova for all the discussions and
their support. I also would like to thank Dr. Claas Falldorf for fruitful discussions.
Last but not the least, I would like to thank my wife, Ferda, for her support, en-
couragement and patience during the preparation of this thesis. I thank my parents,
Necdet and Arife, for giving birth to me in the first place and supporting me spiritually
throughout my life. Special thanks goes to my sister, Melike, for her endless joy and
support.
vii

Contents
1 Introduction 1
1.1 Organization of the dissertation . . . . . . . . . . . . . . . . . . . . . . . 3
2 Scalar Diffraction Theory 4
2.1 A Historical Overview of Diffraction and Holography . . . . . . . . . . . 4
2.2 Scalar Diffraction Theory . . . . . . . . . . . . . . . . . . . . . . . . . . . 5
3 State-Of-The-Art In Holographic Displays 10
3.1 Technical Issues in Electro-Holography . . . . . . . . . . . . . . . . . . . 10
3.1.1 An Overview . . . . . . . . . . . . . . . . . . . . . . . . . . . . . 10
3.1.2 Liquid Crystal Devices . . . . . . . . . . . . . . . . . . . . . . . . 13
3.1.3 LCoS Devices . . . . . . . . . . . . . . . . . . . . . . . . . . . . . 15
3.1.4 Optically Addressed Liquid Crystal Devices . . . . . . . . . . . . 15
3.1.5 Mirror-based Devices . . . . . . . . . . . . . . . . . . . . . . . . . 16
3.1.6 Acousto-Optic Modulators (AOMs) . . . . . . . . . . . . . . . . . 16
3.2 Current Electro-holographic Display Systems . . . . . . . . . . . . . . . . 17
3.2.1 Holo-video . . . . . . . . . . . . . . . . . . . . . . . . . . . . . . . 17
3.2.2 SeeReal . . . . . . . . . . . . . . . . . . . . . . . . . . . . . . . . 17
3.2.3 QinetiQ . . . . . . . . . . . . . . . . . . . . . . . . . . . . . . . . 18
3.2.4 Horn . . . . . . . . . . . . . . . . . . . . . . . . . . . . . . . . . . 20
3.2.5 Image Hologram . . . . . . . . . . . . . . . . . . . . . . . . . . . 20
3.2.6 Coherent Stereogram . . . . . . . . . . . . . . . . . . . . . . . . . 21
viii

3.2.7 NICT . . . . . . . . . . . . . . . . . . . . . . . . . . . . . . . . . 23
4 Design Parameters for Satisfactory Holographic Displays 26
4.1 Size and bandwidth specifications for a satisfactory electro-holographic
display . . . . . . . . . . . . . . . . . . . . . . . . . . . . . . . . . . . . . 27
4.1.1 Space-bandwidth product of electro-holographic displays . . . . . 28
4.1.2 Pixel period . . . . . . . . . . . . . . . . . . . . . . . . . . . . . . 32
4.2 Space-bandwidth product as a quality metric for holographic reconstructions 38
4.3 Noise and Quantization . . . . . . . . . . . . . . . . . . . . . . . . . . . . 40
4.4 SLM tilting and polarization effect . . . . . . . . . . . . . . . . . . . . . 42
4.5 Off-axis case . . . . . . . . . . . . . . . . . . . . . . . . . . . . . . . . . . 43
4.6 Cylindrically arranged electro-holographic display system . . . . . . . . . 44
4.7 Extension to a spherical or other surface geometry designs . . . . . . . . 45
5 Experimental Setup And Results For The Holographic Displays Using
Single Phase-only SLM 48
5.1 Phase-only Holograms . . . . . . . . . . . . . . . . . . . . . . . . . . . . 48
5.2 Setup and Results . . . . . . . . . . . . . . . . . . . . . . . . . . . . . . . 51
6 Experimental Setup And Results For The Holographic Displays Using
Multiple Phase-only SLMs 58
6.1 Color holographic reconstruction using multiple SLMs and LED illumination 58
6.2 Real-time multiple SLM color holographic display using multiple GPU
acceleration and LED illumination . . . . . . . . . . . . . . . . . . . . . 63
6.2.1 The Algorithm . . . . . . . . . . . . . . . . . . . . . . . . . . . . 64
6.2.2 The Client . . . . . . . . . . . . . . . . . . . . . . . . . . . . . . . 66
6.2.3 The Server . . . . . . . . . . . . . . . . . . . . . . . . . . . . . . . 66
6.2.4 Optics . . . . . . . . . . . . . . . . . . . . . . . . . . . . . . . . . 67
6.2.5 Results . . . . . . . . . . . . . . . . . . . . . . . . . . . . . . . . . 68
6.3 Multi-SLM holographic display system with a planar configuration . . . . 76
ix

6.3.1 Advantages of using multiple SLMs . . . . . . . . . . . . . . . . . 76
6.3.2 The Gap Problem . . . . . . . . . . . . . . . . . . . . . . . . . . . 79
6.3.3 Setup and Hologram Generation . . . . . . . . . . . . . . . . . . . 80
6.3.4 Experimental Results . . . . . . . . . . . . . . . . . . . . . . . . . 80
6.4 Circular Holographic Video Display System . . . . . . . . . . . . . . . . 88
6.4.1 Field of View in Circular Holographic Displays . . . . . . . . . . . 88
6.4.2 Some Laboratory Prototypes . . . . . . . . . . . . . . . . . . . . . 89
7 Conclusions 106
Bibliography 109
x

List of Figures
2.1 Illustration of a planar surface and a point of interest. . . . . . . . . . . . 9
3.1 Pictures of the dynamic holographic stereogram: (a) the curved array of
SLMs mounted without upper arms and (b) whole system with electronic
controllers. (J. Hahn, H. Kim, Y. Lim, G. Park, and B. Lee, “Wide view-
ing angle dynamic holographic stereogram with a curved array of spatial
light modulators,” Opt. Express 16, 12372-12386 (2008), c⃝2008 OSA.
Reprinted with permission ) . . . . . . . . . . . . . . . . . . . . . . . . . 13
3.2 Illustration of one channel of the Active Tiling modulator concept of Qine-
tiQ (Slinger, C., Cameron, C., Stanley, M., “Computer-Generated Holog-
raphy as a Generic Display Technology,” Computer , vol.38, no.8, pp.
46-53, Aug. 2005. c⃝2009 IEEE. Reprinted with permission) . . . . . . . 14
3.3 Holographic display with a reconstructed 3D scene that is composed of ob-
ject points. Each object point is encoded in a sub-hologram. The position
and the size of a sub-hologram is determined by the object point position
and the position of the virtual viewing window. The total hologram is
generated by a summation of the sub-holograms. The 3D scene is visible
through the virtual viewing window which is tracked to the eye position.
The virtual viewing window contains the wavefront that would be gener-
ated by a real 3D scene at the eye position. ( c⃝2009 SeeReal. Reprinted
with permission) . . . . . . . . . . . . . . . . . . . . . . . . . . . . . . . 18
3.4 Illustration of SeeReal’s holographic display prototype with a screen diag-
onal of 20 inch. ( c⃝2009 SeeReal. Reprinted with permission) . . . . . . 19
xi

3.5 Replay of a spatial-multiplexed, 3 × 8 billion-pixel, full-parallax, full-color,
3D image. (Slinger, C., Cameron, C., Stanley, M., “Computer-Generated
Holography as a Generic Display Technology,” Computer , vol.38, no.8,
pp. 46-53, Aug. 2005. c⃝2009 IEEE. Reprinted with permission) . . . . . 20
3.6 Virtual window for image hologram calculation (“Real-time image plane
full-color and full-parallax holographic video display system,” T. Yam-
aguchi, G. Okabe, and H. Yoshikawa; Opt. Eng. 46, 125801 (2007). c⃝2009
SPIE. Reprinted with permission) . . . . . . . . . . . . . . . . . . . . . . 21
3.7 Reconstructed images of five letters from different viewpoints in depth:
(a) focused on letters W and D, and (b) focused on R. (“Real-time image
plane full-color and full-parallax holographic video display system,” T.
Yamaguchi, G. Okabe, and H. Yoshikawa; Opt. Eng. 46, 125801 (2007).
c⃝2009 SPIE. Reprinted with permission) . . . . . . . . . . . . . . . . . . 22
3.8 A perspective image of the used 3D model and reconstructed images (“Qual-
ity improvements of the coherent holographic stereogram for natural 3D
display and its applications,” H. Kang, in PhD. Thesis, Nihon University,
2008. Reprinted with permission) . . . . . . . . . . . . . . . . . . . . . . 22
3.9 Real object and IP micro-lens array c⃝2009 NICT. Reprinted with permis-
sion. . . . . . . . . . . . . . . . . . . . . . . . . . . . . . . . . . . . . . . 23
3.10 Real object acquisition system by using integral photographic camera c⃝2009
NICT. Reprinted with permission. . . . . . . . . . . . . . . . . . . . . . . 24
3.11 Electro-holographic display system with three lasers and three LCoS c⃝2009
NICT. Reprinted with permission. . . . . . . . . . . . . . . . . . . . . . . 25
3.12 Reconstruction captured by a camcorder c⃝2009 NICT. Reprinted with
permission. . . . . . . . . . . . . . . . . . . . . . . . . . . . . . . . . . . 25
xii

4.1 Simple schematic for an electro-holographic display (“Digital holographic
Three-dimensional video displays,” L. Onural, F. Yaras, and H. Kang,
Proceedings of the IEEE, vol.99, no.4, pp.576-589, April 2011. c⃝2011
IEEE. Reprinted with permission.) . . . . . . . . . . . . . . . . . . . . . 28
4.2 The “space” and “bandwidth” to compute the space-bandwidth product
(“Digital holographic Three-dimensional video displays,” L. Onural, F.
Yaras, and H. Kang, Proceedings of the IEEE, vol.99, no.4, pp.576-589,
April 2011. c⃝2011 IEEE. Reprinted with permission.) . . . . . . . . . . 29
4.3 Hologram size for a stationary observer. (DH : Distance between hologram
and eye. Smin: Hologram extent) (“Digital holographic Three-dimensional
video displays,” L. Onural, F. Yaras, and H. Kang, Proceedings of the
IEEE, vol.99, no.4, pp.576-589, April 2011. c⃝2011 IEEE. Reprinted with
permission.) . . . . . . . . . . . . . . . . . . . . . . . . . . . . . . . . . . 31
4.4 Hologram size and bandwidth modification for eye rotation. (DH : Distance
between hologram and eye. Smin: Hologram extent for a stationary ob-
server. SR: Additional hologram extent as a result of eye rotation. θR: Ro-
tation angle in lateral direction.) (“Digital holographic Three-dimensional
video displays,” L. Onural, F. Yaras, and H. Kang, Proceedings of the
IEEE, vol.99, no.4, pp.576-589, April 2011. c⃝2011 IEEE. Reprinted with
permission.) . . . . . . . . . . . . . . . . . . . . . . . . . . . . . . . . . . 32
4.5 (a) Minimum hologram size for a stationary observer. (b) Example for the
allowed transverse motion range AO = SOx × SOy. (c) The shape of the
minimum hologram is found as AH = Amin ⊕ AO where ⊕ denotes the
morphological dilation (“Digital holographic Three-dimensional video dis-
plays,” L. Onural, F. Yaras, and H. Kang, Proceedings of the IEEE, vol.99,
no.4, pp.576-589, April 2011. c⃝2011 IEEE. Reprinted with permission.) 33
xiii

4.6 Effect of pixel period on the angular distribution of diffracted light from
a pixelated SLM and recovery by an optical low-pass filter. (“Digital
holographic Three-dimensional video displays,” L. Onural, F. Yaras, and
H. Kang, Proceedings of the IEEE, vol.99, no.4, pp.576-589, April 2011.
c⃝2011 IEEE. Reprinted with permission.) . . . . . . . . . . . . . . . . . 36
4.7 High diffraction orders in reconstruction field and their separation (“Digital
holographic Three-dimensional video displays,” L. Onural, F. Yaras, and
H. Kang, Proceedings of the IEEE, vol.99, no.4, pp.576-589, April 2011.
c⃝2011 IEEE. Reprinted with permission.) . . . . . . . . . . . . . . . . . 37
4.8 (a) Orthographic illumination (b) Tilted illumination (“Digital holographic
Three-dimensional video displays,” L. Onural, F. Yaras, and H. Kang,
Proceedings of the IEEE, vol.99, no.4, pp.576-589, April 2011. c⃝2011
IEEE. Reprinted with permission.) . . . . . . . . . . . . . . . . . . . . . 38
4.9 Quality metric of reconstruction by the hologram on the SLM as a func-
tion of distance of the reconstructed image (white: high quality, black:
low quality) (“Digital holographic Three-dimensional video displays,” L.
Onural, F. Yaras, and H. Kang, Proceedings of the IEEE, vol.99, no.4,
pp.576-589, April 2011. c⃝2011 IEEE. Reprinted with permission.) . . . 39
4.10 Variation of “space” and “bandwidth” with respect to reconstruction dis-
tance z. (a) When z is small, “space” is also small and the “band” is limited
by the maximum band supported by the SLM. (b) As z moderately in-
creases, “space” also increases and “band” is still limited by the maximum
band supported by the SLM. (c) Transition (d) For larger z, “space” does
not change anymore, but “band” decreases since the supported diffraction
angle (and therefore the spatial frequency) decreases. (e) For very large
z, “space” does not change, but “band” decreases even further (“Digital
holographic Three-dimensional video displays,” L. Onural, F. Yaras, and
H. Kang, Proceedings of the IEEE, vol.99, no.4, pp.576-589, April 2011.
c⃝2011 IEEE. Reprinted with permission.) . . . . . . . . . . . . . . . . . 40
xiv

4.11 Variation of normalized quality metric for a reconstructed image from a fi-
nite size SLM along the optical axis (“Digital holographic Three-dimensional
video displays,” L. Onural, F. Yaras, and H. Kang, Proceedings of the
IEEE, vol.99, no.4, pp.576-589, April 2011. c⃝2011 IEEE. Reprinted with
permission.) . . . . . . . . . . . . . . . . . . . . . . . . . . . . . . . . . 41
4.12 Vertically tilted SLM. . . . . . . . . . . . . . . . . . . . . . . . . . . . . 42
4.13 Effect of polarization on tilting. Red arrows denote the modulated light. 43
4.14 Reconstructions by tilted SLM. . . . . . . . . . . . . . . . . . . . . . . . 46
4.15 Space variation of the quality metric for piecewise planar circular SLM
configuration with multiple planar SLMs. The bright region at the center is
the highest quality reconstruction zone. SLMs are at the left end of bright
bands. Observer is at the right hand side. (white: high quality, black:
low quality) (“Digital holographic Three-dimensional video displays,” L.
Onural, F. Yaras and H. Kang, Proceedings of the IEEE, vol.99, no.4,
pp.576-589, April 2011. c⃝2011 IEEE. Reprinted with permission.) . . . . 47
4.16 Spherically arranged electro-holographic display design (“Current research
activities on holographic video displays,” L. Onural, F. Yaras and H. Kang,
Proc. SPIE 7690, 769002, (2010). c⃝2010 SPIE. Reprinted with permis-
sion. ) . . . . . . . . . . . . . . . . . . . . . . . . . . . . . . . . . . . . . 47
5.1 Hologram and Object planes (“Holographic reconstructions using phase-
only spatial light modulators,” F. Yaras, M. Kovachev, R. Ilieva, M. Agour
and L. Onural, in 3DTV Conference: The True Vision - Capture, Trans-
mission and Display of 3D Video, IEEE, 2008. c⃝2008 IEEE. Reprinted
with permission.) . . . . . . . . . . . . . . . . . . . . . . . . . . . . . . . 49
xv

5.2 Block diagram of the Gerchberg-Saxton algorithm for calculating phase
holograms (“Holographic reconstructions using phase-only spatial light
modulators,” F. Yaras, M. Kovachev, R. Ilieva, M. Agour and L. Onural, in
3DTV Conference: The True Vision - Capture, Transmission and Display
of 3D Video, IEEE, 2008. c⃝2008 IEEE. Reprinted with permission.) . . 50
5.3 Photograph of a Holoeye HEO-1080P phase-only spatial light modulator.
(courtesy of www.holoeye.com) . . . . . . . . . . . . . . . . . . . . . . . 51
5.4 Illustration of the optical setup for single SLM holographic display exper-
iments. . . . . . . . . . . . . . . . . . . . . . . . . . . . . . . . . . . . . . 52
5.5 (a) 2D picture of a die, (b) phase hologram, computed in 10 iterations, (c)
optical reconstruction from the phase hologram (“Holographic reconstruc-
tions using phase-only spatial light modulators,” F. Yaras, M. Kovachev,
R. Ilieva, M. Agour and L. Onural, in 3DTV Conference: The True Vision
- Capture, Transmission and Display of 3D Video, IEEE, 2008. c⃝2008
IEEE. Reprinted with permission.) . . . . . . . . . . . . . . . . . . . . . 54
5.6 (a) 3DTV Lab photograph as a 2D grayscale object, (b) numerical and (c)
optical reconstructions from the phase hologram computed in 20 iterations
(“Holographic reconstructions using phase-only spatial light modulators,”
F. Yaras, M. Kovachev, R. Ilieva, M. Agour and L. Onural, in 3DTV
Conference: The True Vision - Capture, Transmission and Display of 3D
Video, IEEE, 2008. c⃝2008 IEEE. Reprinted with permission.) . . . . . . 55
5.7 Optical reconstruction of the 1920 × 2160 size object from a 1920x1080
phase-only hologram computed in 200 iterations. The SLM size is visi-
ble due to diffraction from its edges (“Holographic reconstructions using
phase-only spatial light modulators,” F. Yaras, M. Kovachev, R. Ilieva,
M. Agour and L. Onural, in 3DTV Conference: The True Vision - Cap-
ture, Transmission and Display of 3D Video, IEEE, 2008. c⃝2008 IEEE.
Reprinted with permission.) . . . . . . . . . . . . . . . . . . . . . . . . . 56
xvi

5.8 Optical reconstruction of the three objects at different depths (450mm,
500mm and 500mm from the SLM) (“Holographic reconstructions using
phase-only spatial light modulators,” F. Yaras, M. Kovachev, R. Ilieva,
M. Agour and L. Onural, in 3DTV Conference: The True Vision - Cap-
ture, Transmission and Display of 3D Video, IEEE, 2008. c⃝2008 IEEE.
Reprinted with permission.) . . . . . . . . . . . . . . . . . . . . . . . . . 57
6.1 Optical setup. (BE: Beam Expander, BS: Beam Splitter, D: Driver Module.) 59
6.2 2D picture of 3DTV logo (courtesy of www.3dtv-research.org). . . . . . . 60
6.3 Color phase hologram (“Color holographic reconstruction using multiple
SLMs and LED illumination,” F. Yaras and L. Onural, Proc. SPIE 7237,
72370O, (2009). c⃝2009 SPIE. Reprinted with permission.) . . . . . . . . 61
6.4 Computer reconstruction from color phase hologram (“Color holographic
reconstruction using multiple SLMs and LED illumination,” F. Yaras and
L. Onural, Proc. SPIE 7237, 72370O, (2009). c⃝2009 SPIE. Reprinted
with permission.) . . . . . . . . . . . . . . . . . . . . . . . . . . . . . . . 62
6.5 Optical reconstruction from color phase hologram (“Color holographic re-
construction using multiple SLMs and LED illumination,” F. Yaras and L.
Onural, Proc. SPIE 7237, 72370O, (2009). c⃝2009 SPIE. Reprinted with
permission.) . . . . . . . . . . . . . . . . . . . . . . . . . . . . . . . . . . 62
6.6 Overall setup (BE: Beam expander, R: Red SLM, B: Blue SLM, G: Green
SLM, D: Driver unit of SLMs, N: Network, BS: Non-polarized beam split-
ter.) (“Real-time phase-only color holographic video display system using
LED illumination,” F. Yaras, H. Kang and L. Onural, Appl. Opt. 48,
H48-H53 (2009). c⃝2009 OSA. Reprinted with permission.) . . . . . . . 70
6.7 Hologram calculation algorithm. (“Real-time phase-only color holographic
video display system using LED illumination,” F. Yaras, H. Kang and L.
Onural, Appl. Opt. 48, H48-H53 (2009). c⃝2009 OSA. Reprinted with
permission.) . . . . . . . . . . . . . . . . . . . . . . . . . . . . . . . . . . 71
xvii

6.8 Illustration of N-point DFT as a weighted sum of complex sinusoids. (“Real-
time phase-only color holographic video display system using LED illumi-
nation,” F. Yaras, H. Kang and L. Onural, Appl. Opt. 48, H48-H53
(2009). c⃝2009 OSA. Reprinted with permission.) . . . . . . . . . . . . . 71
6.9 Pipelined computation using GPUs (“Real-time color holographic video
display system,” F. Yaras, H. Kang and L. Onural, in 3DTV Conference:
The True Vision - Capture, Transmission and Display of 3D Video, IEEE,
2009. c⃝2009 IEEE. Reprinted with permission.) . . . . . . . . . . . . . . 72
6.10 The end-to-end system (“Real-time color holographic video display sys-
tem,” F. Yaras, H. Kang and L. Onural, in 3DTV Conference: The True
Vision - Capture, Transmission and Display of 3D Video, IEEE, 2009.
c⃝2009 IEEE. Reprinted with permission.) . . . . . . . . . . . . . . . . . 72
6.11 A rigid color 3D object (“Real-time phase-only color holographic video
display system using LED illumination,” F. Yaras, H. Kang and L. Onural,
Appl. Opt. 48, H48-H53 (2009). c⃝2009 OSA. Reprinted with permission.) 73
6.12 Computer reconstruction using the ACPAS algorithm (“Real-time phase-
only color holographic video display system using LED illumination,” F.
Yaras, H. Kang and L. Onural, Appl. Opt. 48, H48-H53 (2009). c⃝2009
OSA. Reprinted with permission.) . . . . . . . . . . . . . . . . . . . . . . 73
6.13 Single color reconstruction (a) by green laser (b) by green LED (“Real-
time phase-only color holographic video display system using LED illu-
mination,” F. Yaras, H. Kang and L. Onural, Appl. Opt. 48, H48-H53
(2009). c⃝2009 OSA. Reprinted with permission.) . . . . . . . . . . . . 74
6.14 Optical reconstruction of a single frame of the 3D object (“Real-time phase-
only color holographic video display system using LED illumination,” F.
Yaras, H. Kang and L. Onural, Appl. Opt. 48, H48-H53 (2009). c⃝2009
OSA. Reprinted with permission.) . . . . . . . . . . . . . . . . . . . . . . 75
xviii

6.15 Increase in the field of view when multiple SLMs are used (“Multi-SLM
holographic display system with planar configuration,” F. Yaras, H. Kang
and L. Onural, in 3DTV Conference: The True Vision - Capture, Trans-
mission and Display of 3D Video, IEEE, 2010. c⃝2010 IEEE. Reprinted
with permission.) . . . . . . . . . . . . . . . . . . . . . . . . . . . . . . . 77
6.16 Increase in the reconstruction space when multiple SLMs are used (“Multi-
SLM holographic display system with planar configuration,” F. Yaras,
H. Kang and L. Onural, in 3DTV Conference: The True Vision - Cap-
ture, Transmission and Display of 3D Video, IEEE, 2010. c⃝2010 IEEE.
Reprinted with permission.) . . . . . . . . . . . . . . . . . . . . . . . . . 78
6.17 Increase in the quality when multiple SLMs are used. Only those SLM
pixels within the dotted cone contributed to the image (“Multi-SLM holo-
graphic display system with planar configuration,” F. Yaras, H. Kang and
L. Onural, in 3DTV Conference: The True Vision - Capture, Transmis-
sion and Display of 3D Video, IEEE, 2010. c⃝2010 IEEE. Reprinted with
permission.) . . . . . . . . . . . . . . . . . . . . . . . . . . . . . . . . . . 82
6.18 Illustration of larger object reconstruction with a single SLM (“Circularly
configured multi-SLM holographic display system,” F. Yaras, H. Kang and
L. Onural, in 3DTV Conference: The True Vision - Capture, Transmis-
sion and Display of 3D Video, IEEE, 2011. c⃝2011 IEEE. Reprinted with
permission.) . . . . . . . . . . . . . . . . . . . . . . . . . . . . . . . . . . 83
6.19 Illustration of larger object reconstruction with multiple SLMs (“Circularly
configured multi-SLM holographic display system,” F. Yaras, H. Kang and
L. Onural, in 3DTV Conference: The True Vision - Capture, Transmis-
sion and Display of 3D Video, IEEE, 2011. c⃝2011 IEEE. Reprinted with
permission.) . . . . . . . . . . . . . . . . . . . . . . . . . . . . . . . . . . 83
6.20 Discontinuous field of view due the mount of the SLM. . . . . . . . . . . 84
xix

6.21 Removing the gaps by using a beam-splitter (“Circularly configured multi-
SLM holographic display system,” F. Yaras, H. Kang and L. Onural, in
3DTV Conference: The True Vision - Capture, Transmission and Display
of 3D Video, IEEE, 2011. c⃝2011 IEEE. Reprinted with permission.) . . 84
6.22 Field of view increases when object gets closer to the SLM (“Multi-SLM
holographic display system with planar configuration,” F. Yaras, H. Kang
and L. Onural, in 3DTV Conference: The True Vision - Capture, Trans-
mission and Display of 3D Video, IEEE, 2010. c⃝2010 IEEE. Reprinted
with permission.) . . . . . . . . . . . . . . . . . . . . . . . . . . . . . . . 85
6.23 (a) Top view of the setup, (b) front view of the tiled SLMs (“Multi-SLM
holographic display system with planar configuration,” F. Yaras, H. Kang
and L. Onural, in 3DTV Conference: The True Vision - Capture, Trans-
mission and Display of 3D Video, IEEE, 2010. c⃝2010 IEEE. Reprinted
with permission.) . . . . . . . . . . . . . . . . . . . . . . . . . . . . . . . 86
6.24 Rigid 3D model of a square pyramid (“Multi-SLM holographic display
system with planar configuration,” F. Yaras, H. Kang and L. Onural, in
3DTV Conference: The True Vision - Capture, Transmission and Display
of 3D Video, IEEE, 2010. c⃝2010 IEEE. Reprinted with permission.) . . 86
6.25 Optical reconstructions: (a) left, (b) front and (c) right view (“Multi-SLM
holographic display system with planar configuration,” F. Yaras, H. Kang
and L. Onural, in 3DTV Conference: The True Vision - Capture, Trans-
mission and Display of 3D Video, IEEE, 2010. c⃝2010 IEEE. Reprinted
with permission.) . . . . . . . . . . . . . . . . . . . . . . . . . . . . . . . 87
6.26 Field of view for (a) single SLM, (b) multiple SLMs in planar configuration,
(c) multiple SLMs in circular configuration. (“Circular Holographic Video
Display System,” F. Yaras, H. Kang and L. Onural, Optics Express vol.
19, no. 10, pp.9147-9156, 2011. c⃝2011 OSA. Reprinted with permission.) 95
xx

6.27 Schematic of the setup (“Circularly configured multi-SLM holographic dis-
play system,” F. Yaras, H. Kang and L. Onural, in 3DTV Conference: The
True Vision - Capture, Transmission and Display of 3D Video, IEEE, 2011.
c⃝2011 IEEE. Reprinted with permission.) . . . . . . . . . . . . . . . . . 96
6.28 Front view of the display (“Circularly configured multi-SLM holographic
display system,” F. Yaras, H. Kang and L. Onural, in 3DTV Conference:
The True Vision - Capture, Transmission and Display of 3D Video, IEEE,
2011. c⃝2011 IEEE. Reprinted with permission.) . . . . . . . . . . . . . . 97
6.29 Top view of the display (“Circularly configured multi-SLM holographic
display system,” F. Yaras, H. Kang and L. Onural, in 3DTV Conference:
The True Vision - Capture, Transmission and Display of 3D Video, IEEE,
2011. c⃝2011 IEEE. Reprinted with permission.) . . . . . . . . . . . . . . 98
6.30 Computer generated wire-frame 3D model of a cube (“Circularly config-
ured multi-SLM holographic display system,” F. Yaras, H. Kang and L.
Onural, in 3DTV Conference: The True Vision - Capture, Transmission
and Display of 3D Video, IEEE, 2011. c⃝2011 IEEE. Reprinted with per-
mission.) . . . . . . . . . . . . . . . . . . . . . . . . . . . . . . . . . . . . 99
6.31 Optical reconstruction of 3D wire-frame model of a cube. (a) Left, (b)
center, and (c) right views (“Circularly configured multi-SLM holographic
display system,” F. Yaras, H. Kang and L. Onural, in 3DTV Conference:
The True Vision - Capture, Transmission and Display of 3D Video, IEEE,
2011. c⃝2011 IEEE. Reprinted with permission.) . . . . . . . . . . . . . . 99
6.32 Optical reconstructions from a curved array of SLMs: (a) left, (b) front and
(c) right view (“Digital holographic Three-dimensional video displays,” L.
Onural, F. Yaras and H. Kang, Proceedings of the IEEE , vol.99, no.4,
pp.576-589, April 2011. c⃝2011 IEEE. Reprinted with permission.) . . . . 100
xxi

6.33 Discontinuous field of view due the frame of the SLMs. (“Circular Holo-
graphic Video Display System,” F. Yaras, H. Kang and L. Onural, Optics
Express vol. 19, no. 10, pp.9147-9156, 2011. c⃝2011 OSA. Reprinted with
permission.) . . . . . . . . . . . . . . . . . . . . . . . . . . . . . . . . . . 101
6.34 Top view of the laboratory prototype (“Circular Holographic Video Display
System,” F. Yaras, H. Kang and L. Onural, Optics Express vol. 19, no.
10, pp.9147-9156, 2011. c⃝2011 OSA. Reprinted with permission.) . . . . 101
6.35 (a) Side view of the experimental setup. (b) Vertical and horizontal il-
lumination (“Circular Holographic Video Display System,” F. Yaras, H.
Kang and L. Onural, Optics Express vol. 19, no. 10, pp.9147-9156, 2011.
c⃝2011 OSA. Reprinted with permission.) . . . . . . . . . . . . . . . . . 102
6.36 Pictures of (a) SLMs and SLM Modules, (b) side view of the setup, (c)
cone mirror and (d) SLMs and beam splitter (“Circular Holographic Video
Display System,” F. Yaras, H. Kang and L. Onural, Optics Express vol.
19, no. 10, pp.9147-9156, 2011. c⃝2011 OSA. Reprinted with permission.) 103
6.37 Single frame of the video of the 3D horse model (“Circular Holographic
Video Display System,” F. Yaras, H. Kang and L. Onural, Optics Ex-
press vol. 19, no. 10, pp.9147-9156, 2011. c⃝2011 OSA. Reprinted with
permission.) . . . . . . . . . . . . . . . . . . . . . . . . . . . . . . . . . . 103
6.38 Writing nine holograms on a single bitmap image (“Circular Holographic
Video Display System,” F. Yaras, H. Kang and L. Onural, Optics Ex-
press vol. 19, no. 10, pp.9147-9156, 2011. c⃝2011 OSA. Reprinted with
permission.) . . . . . . . . . . . . . . . . . . . . . . . . . . . . . . . . . . 104
6.39 Optical reconstructions for a single frame for (a) 0 degree, (b) 12 degrees
and (c) 24 degrees. (The business card with the rectangular aperture is
placed both as a size reference and to block distracting optical component
views.) (“Circular Holographic Video Display System,” F. Yaras, H. Kang
and L. Onural, Optics Express vol. 19, no. 10, pp.9147-9156, 2011. c⃝2011
OSA. Reprinted with permission.) . . . . . . . . . . . . . . . . . . . . . . 105
xxii

List of Tables
6.1 Overall System Specifications (“Real-time phase-only color holo-
graphic video display system using LED illumination,” F. Yaras,
H. Kang and L. Onural, Appl. Opt. 48, H48-H53 (2009). c⃝2009
OSA. Reprinted with permission.) . . . . . . . . . . . . . . . . . . . 67
6.2 Characteristics of LEDs . . . . . . . . . . . . . . . . . . . . . . . . . 68
6.3 Performance analysis of the system for two Megapixel hologram
output (“Real-time color holographic video display system,” F.
Yaras, H. Kang and L. Onural, in 3DTV Conference: The True
Vision - Capture, Transmission and Display of 3D Video, IEEE,
2009. c⃝2009 IEEE. Reprinted with permission.) . . . . . . . . . 69
xxiii

List of PublicationsThis dissertation is based on the following publications.
[Publication-I] F. Yaras, H. Kang, and L. Onural, “Circular Holographic Video Display
System,” Optics Express, Vol. 19, No. 10, pp.9147-9156, 2011.
[Publication-II] L. Onural, F. Yaras, and H. Kang, “Digital Holographic Three-dimensional
Video Displays,” Proceedings of the IEEE , vol.99, no.4, pp.576-589, April 2011 (3D Me-
dia and Displays Special Issue - Invited Paper).
[Publication-III] F. Yaras, H. Kang, and L. Onural, “State of the Art in Holographic
Displays: A Survey,” IEEE/OSA Display Technology, Journal of, 3-D Displays and Vi-
sualization (Special Issue) vol.6, no.10, pp.443-454, Oct. 2010.
[Publication-IV] F. Yaras, H. Kang, and L. Onural, “Real-time phase-only color holo-
graphic video display system using LED illumination,” Appl. Opt. 48, H48-H53 (2009).
[Publication-V] H. Kang, F. Yaras, and L. Onural, “Graphics processing unit accelerated
computation of digital holograms,” Appl. Opt. 48 , H137-H143 (2009).
[Publication-VI] F. Yaras, H. Kang, and L. Onural, “Circularly configured multi-SLM
holographic display system,” in Proceedings of 3D TV Conference: The True Vision–
Capture, Transmission and Display of 3D Video (IEEE, 2011).
[Publication-VII] F. Yaras, H. Kang, and L. Onural, “Multi-SLM holographic display sys-
tem with planar configuration,” in Proceedings of 3D TV Conference: The True Vision–
Capture, Transmission and Display of 3D Video (IEEE, 2010).
xxiv

[Publication-VIII] F. Yaras, H. Kang, and L. Onural, “Real-time color holographic video
display system,” in Proceedings of 3D TV Conference: The True Vision–Capture, Trans-
mission and Display of 3D Video (IEEE, 2009).
[Publication-IX] H. Kang, F. Yaras, and L. Onural, “Quality comparison and acceleration
for digital hologram generation method based on segmentation,” in Proceedings of 3DTV
Conference: The True Vision–Capture, Transmission and Display of 3D Video, (IEEE,
2009).
[Publication-X] F. Yaras, H. Kang, and L. Onural, “Real-time multiple SLM color holo-
graphic display using multiple GPU acceleration,” in Digital Holography and Three-
Dimensional Imaging (Optical Society of America, 2009), paper DWA4.
[Publication-XI] H. Kang, F. Yaras, L. Onural, and H. Yoshikawa, “Real-time fringe pat-
tern generation with high quality,” in Digital Holography and Three-Dimensional Imaging
(Optical Society of America, 2009), paper DTuB7.
[Publication-XII] F. Yaras and L. Onural, “Color holographic reconstruction using multi-
ple SLMs and LED illumination,” Proc. SPIE 7237, 72370O (2009).
[Publication-XIII] F. Yaras, M. Kovachev, R. Ilieva, M. Agour, and L. Onural, “Holo-
graphic reconstructions using phase-only spatial light modulators,” in Proceedings of 3DTV
Conference: The True Vision-Capture, Transmission and Display of 3D Video (2008), pa-
per PD-1-PD-4.
The contributions of the author to publications are as follows. As the first author
in Publication-I, -IV, -VI, -VII, -VIII, -X, -XII and -XIII, the author designed and im-
plemented the optical setups, performed experiments and prepared the manuscript. The
author designed and implemented the optical systems and performed the experiments in
xxv

Publication-V, -IX and -XI. In Publication-II, the author performed the derivations and
experiments and prepared the related manuscript. The author performed the literature
survey for the Publication-III and prepared the manuscript for Sections-I, -II and -IV.
xxvi

Dedicated to My Beloved Wife and Family . . .

Chapter 1
Introduction
Holographic three-dimensional display is one of the exciting technologies that attract
public attention. What makes people curious about this technology is the imagination of
the ghost-like motion pictures. When holographic displays were shown in science-fiction
movies, they were perceived just as an impossible dream. However, as a consequence
of the developments in display technologies, electronics, signal processing, optics, nano-
technology, computer science and other related fields, commercial three-dimensional dis-
plays that produce ghost-like images may be available within a decade. When a method
is able to reproduce all relevant physical properties of the volume filling light, it is called
a “True-3D” technique. Holography is one of the sophisticated true-3D techniques. Us-
ing holographic techniques, we can record and then replay a 3D-scene with all relevant
physical properties. Since holographic reconstructions aim the physical duplication of
light, such displays can provide 3D content independent of the observer properties’. Not
only humans but also animals or 2D camcorders can see the same scene as if it is re-
ally there. The 3D televisions or 3D movie theaters that operate based on stereoscopic
techniques cannot provide such true-3D content. Stereoscopic techniques are dependent
on the human-visual system, and since they cannot duplicate the physical light, the
resultant 3D images are highly artificial and disturbing. A 3D scene is recorded by a
stereoscopic camcorder (i.e. two side by side conventional 2D video recorders); and then,
the recorded videos are projected to the corresponding eyes. The 3D scene is formed
1

by the brain. For example, the 3D images that are formed by stereoscopic techniques
can not be seen or captured by the camcorders or cameras as 3D. Volumetric displays
also provide good-looking 3D experience. However, they usually have moving parts and
form transparent objects. Even though the state of the holographic displays are not yet
mature as the stereoscopic technologies, holographic displays are superior and desirable;
however the technology is more challenging. More research on holographic displays are
needed. This dissertation is dedicated to overcome such challenges and to contribute to
the development of future holographic display systems.
In order to develop such holographic displays, we first need to understand the relevant
physical properties of the light. When we look at a physical 3D object, what we actually
see is the light that scatters from the object. The light that is reflected from the objects
carries the geometry and optical information of the objects and fills the 3D space. Then,
such volume filling light field enters through our eye pupils and we see the objects. The
quality of the 3D experience is related to the closeness of the generated light field to the
original. We can extent our 3D object to the entire room that we are in, or to any other
setting. The key issue is to know all relevant physical properties of the volume filling light
field, and to regenerate the same volume filling light field at another place and maybe
at another time; therefore the same light field will enter through our pupils. Since the
same light field will enter through our pupils, we will see the same scene as if it is real.
Although the idea is simple, there are severe problems and bottlenecks in both recording
and displaying of the volume filling light field. Even though recording of the holograms
is also an important task for the holographic systems, we deal only with the display part
in this work. In this thesis the problems and bottlenecks for the holographic displays are
first examined and then possible solutions are given together with the experiments and
the laboratory prototypes.
In this thesis, we deal with display of dynamic holograms to display holographic
3D videos. The display of dynamic holograms is usually called “electro-holography”.
In electro-holography, mostly electrically controlled pixelated spatial light modulators
(SLMs) are used. SLMs modulate the light by changing the magnitude and/or the phase
2

of it at each pixel. They are quite convenient for electro-holography. Although, the
SLMs are good candidates for holographic displays, they currently have many bottlenecks,
related to their size, pixel number and geometry. Thus, a single SLM can not provide
an adequate 3D experience. Therefore, a need for multiple SLM designs is obvious. In
addition, the geometry of multiple SLM designs is also crucial for quality of the resultant
holographic display system. This thesis is devoted to novel designs of multiple SLM 3D
holographic video displays. The conducted work covers different holographic video display
system designs using multiple SLMs. The designed and implemented holographic display
systems generate ghost-like 3D reconstructions of physical and synthetically generated
3D content.
We believe that the developments in technology and scientific research will increase
the demand for the holographic display systems in the future. Developments in the size,
resolution and geometry of the SLMs are expected and we believe that such improvements
will boost the subsequent research. In the future, the holographic images of the Jedi’s
may not be just as a dream; however, it may turn out to be a reality.
1.1 Organization of the dissertation
The organization of the dissertation is as follows. In the following chapter, after the
historical overview of diffraction and holography, a synopsis of the scalar diffraction the-
ory is given. In Chapter 3, a survey of holographic displays is presented. In addition,
some technical issues of the electro-holography and some examples of electro-holographic
displays are given. In Chapter 4, design parameters for satisfactory holographic displays
are presented. In Chapter 5, an experimental setup and the results for the holographic
displays using single phase-only spatial light modulator are given. Multiple spatial light
modulator holographic display systems are presented in Chapter 6. Conclusions are drawn
in Chapter 7.
3

Chapter 2
Scalar Diffraction Theory
2.1 A Historical Overview of Diffraction and Holog-
raphy
Diffraction was first mentioned by Francesco Maria Grimaldi (1618–1663) in his posthu-
mous work in 1665 [1]. Robert Hooke (1635–1703) experienced the interference and
reported it in his book also in 1665 [2]. In 1666 Isaac Newton (1642–1727) conducted
experiments about composition of light and published a letter in 1672 by stating that
the white light can be split into different colors as in the rainbow [3]. Christian Huygens
(1629–1695) formulates the wave theory of light in 1678 and published his work in 1690
[4]. He also discovered the polarization of light. Thomas Young (1773–1829) reported
the interference principle in 1801 [5] and revived the wave theory of light again. Augustin
Jean Fresnel (1788–1827) used the Huygens principle and calculated diffraction patterns
for different objects. Michael Faraday (1791–1867) studied the relationship between mag-
netism and electricity [6]. Then, James Clark Maxwell (1831–1879) gathered together all
research results in this field into a set of equations [7]. Albert Abraham Michelson (1852–
1931) proved that the waves do not need ether to propagate [8]. Albert Einstein’s special
theory of relativity also supported Michelson’s work [9]. Gustav Kirchhoff (1824–1887)
4

was the first person who put the Huygen’s and Fresnel’s ideas into a mathematical foun-
dation and showed that the amplitude and the phase are properties of the wave nature
of the light [10]. Kirchhoff used two assumptions about the boundary conditions and
those were proved by Henri Poincare (1854–1912) and Arnold Sommerfeld (1868–1951)
independently from each other. Later Sommerfeld modified the Kirchhoff’s formulation
and waived one of his assumptions by using Green’s functions [10]. The new theory of
wave propagation is called Rayleigh-Sommerfeld diffraction theory.
Holography was first presented by Dennis Gabor (1900–1979) in 1948 [11–13]. Al-
though the ideas of Gabor was supported by many scientists [14–16], interest in hologra-
phy faded later because of the low quality holographic reconstructions. Together with the
invention of the laser, holography started to attain its popularity again. Emmett N. Leith
(1927–2005) and Juris Upatnieks (1936–) introduced the off-axis reference beam method
by using the idea of Gabor’s holography [17–19]. Yuri Nikolaevich Denisyuk (1927–2006)
invented the thick reflection hologram in 1962 [20].
Digital holography first appeared in 1960s. Goodman and Lawrence proposed the
basic idea of digital holography in 1967 [21]. However the fundamental theory was de-
veloped by Yaroslavsky and Merzlyakov in 1980 [22]. Computer generated holography
for electro-holographic applications are reported by Onural [23, 24]. Digital recording of
the holograms by CCD were discussed by Schnars and Juptner [25]. The detailed history
of the digital holography can be found in the book by T. Kreis [26] and more extensive
history of the optics can be found in [27].
2.2 Scalar Diffraction Theory
In this thesis, we use propagating optical waves to compute holograms and to perform
numerical reconstructions from the holograms. Although the scalar diffraction theory
is well discussed in the literature [10, 27–30], it is beneficial to revisit the subject and
clarify the notation for the sake of completeness. In the literature, scalar optical diffrac-
tion theory deals with diffraction field relation between a planar surface and a point in
5

space. Such relation is depicted in Fig. 2.1, where SO defines a planar surface, PO is
the observation point in space, rO is the position vector of the observation point, rS is
the position vector of a point on the planar surface SO and rOS is the difference vector
defined by rO − rS. The planar surface SO is placed at z = 0 plane. By definition, the
diffraction field on SO is known. The light disturbance at position PO, i.e. ψ(rO), due to
the contributions of all the points on surface SO is expressed as [10,27]:
ψ(rO) = − 1
2π
∫SO
ψ(rS)(jk −1
|rOS|)exp(jk|rOS|)
|rOS|cos θdS , (2.1)
where, cos θ = z/|rOS|, k = 2π/λ (monochromatic propagating plane waves), dS =
dxSdyS and,
|ros| = [(xO − xS)2 + (yO − yS)
2 + z2O]1/2 . (2.2)
Here the “disturbance at position PO” should be interpreted as the light amplitude at the
point PO on an infinitesimal planar patch parallel to input plane. If we write an impulse
response h(r) as:
h(r) = − 1
2π(jk − 1
|r|)exp(jk|r|)
|r|cos θ , (2.3)
then we can write the Eq. 2.1 in the form of a convolution integral as:
ψ(rO) =
∫SO
ψ(rS)h(rO − rS)dS . (2.4)
Please note that, we can write the term exp(jk|r|)/|r| as:
exp(jk|r|)|r|
=j
2π
∫ +∞
−∞
exp[j(kxx+ kyy + kzz)]
kzdkxdky for z ≥ 0 (2.5)
as expressed in [27,31]. Here kx and ky represent the spatial frequencies of the propagating
plane wave along x and y axes, respectively. Due to the monochromatic propagating wave
constraint, kz = (k − k2x + k2y)1/2. Positive values of kz denotes propagation in positive z
direction and negative values of it denotes propagation in negative z direction. Then if
we take the derivative of the expression in Eq.2.5, we obtain:
∂
{exp(jk|r|)
|r|
}∂z
= (jk − 1
|r|)exp(jk|r|)
|r|cos θ
= − 1
2π
∫ +∞
−∞exp[j(kxx+ kyy + kzz)]dkxdky for z ≥ 0 .
(2.6)
6

Please note that, Eq. 2.6 can be written as an inverse Fourier transform,
∂
{exp(jk|r|)
|r|
}∂z
= − 1
2π
∫ +∞
−∞exp(jkzz) exp[j(kxx+ kyy)]dkxdky for z ≥ 0
= −2πF−12D
{exp(jkzz)
}.
(2.7)
Note that F2D, which denotes the 2D Fourier transform from the domain (x, y) to the
domain (kx, ky), is defined as:
F2D{f(x, y)} =
∫ +∞
−∞f(x, y) exp[−j(kxx+ kyy)]dxdy , (2.8)
and, F−12D is the inverse Fourier transform. If we substitute Eq. 2.6 into Eq. 2.1, we get:
ψ(rO) =1
(2π)2
∫SO
ψ(rS)
∫ +∞
−∞exp{j[kx(xO − xS) + ky(yO − yS) + kzzO]}dkxdkydS ,
=1
(2π)2
∫ +∞
−∞Ψ(kx, ky) exp[j(kxxO + kyyO + kzzO)]dkxdky .
(2.9)
Please note that Ψ(kx, ky) is the Fourier transform of ψ(rS) over the surface SO at z = 0.
The Fourier transform relation is denoted as:
Ψ(kx, ky) =
∫SO
ψ(rS) exp[−j(kxxS + kyyS)]dS . (2.10)
The expression in Eq. 2.9 is called plane wave decomposition (PWD). Note that the
solution is valid for parallel planes and can also be written as [27,31]:
ψ(x, y, z) = F−12D{F2D[ψ(x, y, 0)] exp[j(k
2 − k2x − k2y)1/2z]} . (2.11)
Here ψ(x, y, 0) denotes the field on the planar surface at z = 0. If we take the Fourier
transform of the input field (i.e. ψ(x, y, 0) ), we obtain the complex coefficients of the
plane waves that form the entire complex field as [28,30]:
(2π)2A(kx, ky) = F2D[ψ(x, y, 0)] ; (2.12)
and thus the PWD is expressed as:
ψ(x, y, z) =
∫ +∞
−∞A(kx, ky) exp[j(kxx+ kyy + kzz)]dkxdky . (2.13)
7

Please note that, PWD and Rayleigh-Sommerfeld diffraction integral gives the same
result if the condition r ≫ λ is satisfied [30,31]. This condition eliminates the evanescent
modes; and thus, only propagating waves exists. As a result, the impulse response of the
RS diffraction integral becomes [30,31]:
hz(x, y) =1
jλ
exp[jk(x2 + y2 + z2)1/2]
(x2 + y2 + z2)1/2cos θ , (2.14)
and the frequency response is [30, 31]:
hz(x, y) = F−12D{exp[jz(k
2 − k2x − k2y)1/2]} , k2x + k2y ≤ k2. (2.15)
Furthermore, if we take the inverse Fourier transform of the evanescent part of the diffrac-
tion field, we get [30,31]:
1
2π
exp[jk(x2 + y2 + z2)1/2]
(x2 + y2 + z2)cos θ = F−1
2D{exp[jz(k2 − k2x − k2y)
1/2]} , k2x + k2y ≥ k2.
(2.16)
As mentioned in this section, however, we are dealing with propagating waves; therefore,
evanescent part of the diffraction field is eliminated.
8

SO
y
x
z
rs
ro
ros
PO
Figure 2.1: Illustration of a planar surface and a point of interest.
9

Chapter 3
State-Of-The-Art In Holographic
Displays
3.1 Technical Issues in Electro-Holography
This chapter is mainly based on our publication in Journal of Display Technology, titled
as State of the Art in Holographic Displays: A Survey.
3.1.1 An Overview
Several electro-holographic reconstruction approaches are reported in the literature. Liq-
uid crystal devices are commonly used in electro-holography. Advances in liquid crystal
SLMs are reported by Bauchert et al. [32]. In their study, these advances are summa-
rized as smaller pixel periods, improved optical efficiency, higher pixel density and higher
speed operation. Frauel et al. also reviewed digital holography applications [33]. Holo-
graphic reconstructions by using SLMs and three-dimensional (3D) imaging are some of
the reported applications. Several problems associated with 3D imaging are also dis-
cussed in their study. Yet in another review was published by Michalkiewicz et al. [34].
In their report, advances in liquid crystal on silicon (LCoS) SLMs, their applications to
digital holography and several issues related to electro-holographic reconstructions by
using LCoS devices are discussed. Ito et al. reported holographic reconstructions by
10

using reflective type liquid crystal devices and light-emitting diode (LED) illumination
in [35]. Setup and results for electo-holographic reconstructions by using LED illumi-
nation are reported in their paper. Temporal and spatial multiplexing of spatial light
modulators are important approaches for electro-holography applications. An electro-
holographic reconstruction method using time multiplexed illumination is discussed by
Shimobaba et al. A color 3D object first divided into red, green and blue components
then three computer generated holograms (CGHs) are computed from those color com-
ponents. Calculated holograms are then written sequentially on a LCD at 100 Hz. Yet in
another study, a different time multiplexing method is proposed by Ohmura et al. [36].
In this method a single spatial light modulator is driven by a mirror module to increase
the viewing angle of the holographic reconstruction. Mirror module is used to divide the
SLM into two horizontal parts and to tile them side by side. Since the resolution along
the horizontal direction is doubled, the horizontal viewing angle is also approximately
doubled. A color holographic display system is developed by Takano, Minami and Sato
[37–40]. In their system, three SLMs and a metal halide lamp illumination is used. Their
system is compared with systems that use laser illumination. In their subsequent pa-
pers, Sato and Takano presented a full-color electro-holographic 3D display system that
uses LED illumination [41, 42]. In addition, they reported the ease of LED illumination
while adjusting the white balance. Also in their study, a virtual image reconstruction
is discussed. Tudela et al. combined two LCDs and used them to display full complex
Fresnel holograms [43–45]. Ito and Okano reported another color holographic display sys-
tem in [46]. Different from systems mentioned above, they use three color illumination
and a single SLM and control the illumination by using an electronic shutter. Another
color holographic display system is proposed by Sato et al. [47–49]. In their system, a
time-multiplexed method is carried out by using a high-resolution reflective type LCD
display that consists of 1920 × 1080 square pixels with the pixel period of 8.1µm. Red,
green and blue lasers are used in their prototype. Yamaguchi et al. reported a full-color
holographic projection system [50,51]. They used original parts of a commercially avail-
able projector to have a holographic display system. Fresnel holograms are used to speed
11

up their system. Yet in another color holographic system, proposed by Moon and Kim,
full color holographic reconstructions are achieved by using three reflective type LCoS
SLMs and a color wheel [52, 53]. We also used LCoS technology and LED illumination
in our holographic display systems [54–59]. Phase-only spatial light modulators are used
in our holographic display systems. Real-time holographic displays, circularly configured
holographic displays and color holographic displays are some of the research topics of our
group. In a recent prototype, we developed a curved holographic display with a viewing
angle of 24◦. Those systems will be discussed in the following chapters.
A method of enlarging the viewing angle is reported by Mishina et al. [60]. In their
study, they combined the high diffraction orders to enlarge the viewing zone. Further-
more, in another work, they reported a single-sideband holography method by using a
half-zone plate [61]. With the help of this method they managed to eliminate the con-
jugate beams in the Fresnel region. In holographic reconstructions, undiffracted beam
may disturb the resultant image. Palima et al. established a method to suppress the
undiffracted beam. In their proposed method, they performed some adjustments to the
phase-only computer generated holograms. One of the adjustments is using a correction
beam that destructively interferes with the undiffracted beam. A group from Korea re-
ported full-parallax holographic display system [62]. The group is specialized for integral
imaging and they combine a micro-lens array and phase-only spatial light modulators.
The proposed system has a full-parallax viewing angle of about ±6◦. The same research
group proposed another horizontal-parallax-only holographic display system [63]. The
system works with holographic stereograms and contains curved array of spatial light
modulators (Fig.3.1). In their system, they used a mirror-module to divide the image of
the SLM surface into three equal horizontal regions and tile them side by side. As a result,
the resolution in horizontal direction is tripled. The total viewing angle of this system
is about 22.8◦. However, since they used a horizontal parallax only (HPO) holographic
diffuser the system can not provide vertical parallax.
QinetiQ project developed a holographic display system by using so called “Active
Tiling” system [64]. As shown in Fig.3.2, a high speed electrically addressed SLM
12

(a) (b)
Figure 3.1: Pictures of the dynamic holographic stereogram: (a) the curved array ofSLMs mounted without upper arms and (b) whole system with electronic controllers. (J.Hahn, H. Kim, Y. Lim, G. Park, and B. Lee, “Wide viewing angle dynamic holographicstereogram with a curved array of spatial light modulators,” Opt. Express 16, 12372-12386 (2008), c⃝2008 OSA. Reprinted with permission )
(EASLM) projects the tiles of a hologram on an optically addressed SLM (OASLM).
The size of the proposed system in horizontal direction is about 14cm.
Kohler et al. reported the SLM properties and their settings [65]. In their paper,
they stated that the reconstruction quality depends on the SLM’s properties such as
flatness of the reflective surfaces. They showed that those deviations may degrade the
quality of the holographic reconstructions. Putten et al. presented another development
related to spatial light modulators [66]. They combined four neighboring pixels to form
a superpixel. With the help of the superpixel, any complex amplitude can be generated.
They presented that the proposed system can modulate the phase in 2π range while
keeping the magnitude constant. Oton et al. developed another calibration technique for
spatial light modulators [67]. In order to compensate the thickness variations of the SLM
surfaces, they presented a multi-point calibration technique by using a look-up table.
3.1.2 Liquid Crystal Devices
The liquid crystal first discovered by an Austrian botanist Friedrich Reinitzer in 1888
[68]. Due to the unique characteristics of the liquid crystal, it is very suitable for display
applications. The properties of the liquid crystal may change under electric or magnetic
13

Figure 3.2: Illustration of one channel of the Active Tiling modulator concept of QinetiQ(Slinger, C., Cameron, C., Stanley, M., “Computer-Generated Holography as a GenericDisplay Technology,” Computer , vol.38, no.8, pp. 46-53, Aug. 2005. c⃝2009 IEEE.Reprinted with permission)
field; and therefore, by applying proper time varying electric/magnetic field dynamic
interference patterns can be displayed by LC SLMs. Twisted nematic and ferroelectric
versions are two of the main types of LC SLMs. LC SLMs modulate the amplitude or the
phase of the incoming light. Type of modulation is chosen according to the application.
Since the diffraction efficiency is higher in phase-only SLMs, often they are prefered over
amplitude-only SLMs.
Twisted nematic cells in LC SLMs that are formed in a matrix structure can be
individually addressed. Orientation of the liquid crystal molecules, which are sandwiched
between two glass substrates, gradually twisted to 90◦ [69]. Polarization of the outgoing
beam is controlled by the electric field applied to the cells. If the resultant polarization
of the outgoing light is perpendicular to the transmission axis of the output polarizer, no
light emanates from the cell. On the other hand, all light emanates from the cell if the
polarization of the outgoing light is parallel to the transmission axis of the polarizer. By
controlling the polarization of the light inside the cell, amplitude modulation is achieved.
The liquid crystal molecules can also be used for phase modulation. When molecules
are not twisted, LC cell modulates the phase. Each pixel in the LC SLM consists of an
14

active and a passive area. In the passive area, there is a transistor to control the pixel.
Therefore, due to the physical limitations (e.g. limitation of the transistor size) pixel size
can not be reduced indefinitely. When the pixel size is reduced, the fill factor (ratio of
the active area to the passive area) may degrade.
3.1.3 LCoS Devices
Liquid crystal on silicon devices (LCoS) use liquid crystal molecules and a mirror to
modulate light. The mirror at the end of the liquid crystal layer controls the electric
field. Therefore there is no transistor beside each pixel, and this yields a higher fill factor
(up to 93 percent) [70, 71]. As in the transmissive LC SLMs, light passes through the
liquid crystal molecules. However in LCoS SLMs, light passes through it twice. Some
commercially available LCoS SLMs have 1920× 1080 pixels and pixel size is about 8µm
[71]. Optical efficiency of the LCoS SLMs are better than the transmissive type LC SLMs.
Moreover, the pixel size is smaller. Therefore, for holography applications, LCoS SLMs
have advantages over transmissive type SLMs.
3.1.4 Optically Addressed Liquid Crystal Devices
Optically addressed liquid crystal devices (OALCDs) modulate the phase or the ampli-
tude of light. There are two sides of the SLM; the writing side and the reading side.
When the writing side is illuminated by an intensity pattern, refractive index in the liq-
uid crystal changes [72]. As a result, the reading side modulates the light corresponding
to the refractive index change. One of the important advantages of the OALCDs is the
absence of pixels. Thus, higher efficiency is achieved and high diffraction orders does not
exist. However due to the physical limitations of the photo-conductors, the resolution of
the displays is rather low (50 lines/mm) [73].
15

3.1.5 Mirror-based Devices
Compared to devices above, digital micro-mirror device (DMD) is a different type of spa-
tial light modulator. DMDs consist of a 2D array of micro-mirrors which are individually
controllable [74]. An electro-mechanical technique is used to control each micro-mirror.
Two types of DMDs are commonly used: first one is a binary modulator; therefore, the
pixels are either “on” or “off”. Grayscaling is achieved by a time-averaging technique.
A pixel stays “on” for a longer period relative to “off” position, to achieve brighter in-
tensity and vice versa. The other one modulates the phase of the light by performing
an out-of-plane linear translation. High optical efficiency is one of the advantages of the
DMDs. In liquid crystal devices, some of the light power is lost while passing through
the substrate by absorption. Furthermore, since the absorption of the light is low, DMDs
can operate under high intensity light without running into thermal problems.
3.1.6 Acousto-Optic Modulators (AOMs)
Acousto-optic (AO) SLMs have been used for real time holography since 1989 [75–77].
Benton used an acousto-optic (AO) device as an SLM in computer generated holography.
To modulate the light, AO SLMs use the interaction of traveling acoustic waves and a
coherent light source. The acoustic wave acts like a “phase grating” when a RF signal
is applied to the medium. The wave travels through the cell at the acoustic velocity.
This phase grating diffracts the incident coherent light. However, AO SLMs operate in
one-dimension. To generate 2D modulation a scan mechanism is required.
An acousto-optical holographic display device is proposed by Onural et al. [78]. Trav-
eling surface acoustic waves (SAW) are used to produce a hologram as a surface pattern.
An acoustical wave is generated on the surface of the crystal by applying an electric signal
to the electrodes of the surface acoustic wave device. If the electric signal is applied to
all electrodes simultaneously, a time-varying SAW pattern can be achieved.
16

3.2 Current Electro-holographic Display Systems
3.2.1 Holo-video
The Spatial Imaging Group at MIT Media Lab developed the first practical electro-
holographic display in 1989 and named it as Mark-I [79–86]. The system is capable of
rendering 25 × 25 × 25mm3 color images at a rate of 20 frames per second. The total
viewing angle of the Mark-I is 15 degrees. An acousto-optic modulator (AOM) is used for
the holographic reconstructions. To generate color reconstructions, a three-channel AOM
is used. The second Mark system, Mark-II, was developed by the same group in 1992.
The second prototype was capable of rendering 150 × 75 × 150mm3 images at rates of
around 2.5 frames per second with a 36 degrees of viewing angle. In Mark-II, 18-channel
AOM and bank of scanning mirrors are used instead of a three-channel AOM. The latest
version of the Mark series (Mark-III) was reported in 2007 [87]. In this prototype, they
used a surface acoustic wave (SAW) device. The SAW device, so called guided-wave
optical scanner, uses acoustic waves traveling along the surface of the crystal. Instead
of horizontal bank of scanning mirrors a holographic optical element (HOE) is used for
horizontal scanning. Mark-III is capable of rendering 80 × 60 × 80mm3 images at rates
of around 30 frames per second with a 24 degrees of viewing angle.
3.2.2 SeeReal
A new approach for the holographic displays was developed by SeeReal Technologies. The
main idea of the system is to reconstruct only a part of the light field originating from the
object that actually enters from the eye pupils of the observer [88–92]. A wavefront in
this small region is called the observer window. Separate observer windows are generated
for each eye of the observer. If the observer moves, the observer window is shifted to the
actual position of the eye by moving the light source. The system tracks the position of
the eyes and calculates only the so called “subhologram”. Two object points at different
locations and corresponding subholograms in different sizes are shown in Fig. 3.3. The
17

Figure 3.3: Holographic display with a reconstructed 3D scene that is composed of objectpoints. Each object point is encoded in a sub-hologram. The position and the size of asub-hologram is determined by the object point position and the position of the virtualviewing window. The total hologram is generated by a summation of the sub-holograms.The 3D scene is visible through the virtual viewing window which is tracked to the eyeposition. The virtual viewing window contains the wavefront that would be generated bya real 3D scene at the eye position. ( c⃝2009 SeeReal. Reprinted with permission)
volume of the reconstruction region is quite large. The reconstructions can be located
between the display and the observer, and also fully or partially behind the display.
Fig. 3.4 shows a monochrome prototype that was demonstrated in 2007. Although the
illustrated system is monochrome, a color version is also available. As mentioned above,
the holographic reconstruction is formed only at the observer’s eye position. With the
help of this configuration, relatively large pixel periods are sufficient for a satisfactory
holographic reconstruction. A state-of-the-art high-resolution LCD display is used for
the 20 inch prototype. Although the pixel periods of the LCD panel is quite large, since
the size of the LCD panel is large and an eye-tracking method is used, a clear large
holographic reconstruction can be observed with a large depth of field (approximately 4
meters). All adjustments and calculations are done in real-time.
3.2.3 QinetiQ
QinetiQ group developed a system, so called “Active Tiling” [64] in 2003. The system uses
a high speed electrically addressed spatial light modulator (EASLM) and a comparatively
18

Figure 3.4: Illustration of SeeReal’s holographic display prototype with a screen diagonalof 20 inch. ( c⃝2009 SeeReal. Reprinted with permission)
large optically addressed spatial light modulator (OASLM) [93]. With the help of the
developed system, large size holograms are generated at video rates. The EASLM acts
as a “image engine”. It can display images or fringe patterns quite fast. However the size
of the SLM is small. After a large hologram is calculated, it is divided into 5 × 5 tiles.
Those tiles are then projected onto the OASLM one-by-one using a replication optics
(Fig. 3.2). The OASLM stores those projected tiles of the computer generated hologram.
A readout optics is used to reconstruct the 3D objects. The described system forms a
single channel. Multiple channels are used to increase the size of the display.
A single Active Tiling channel consists of a ferroelectric crystal on silicon (FLCoS)
EASLM which has 1024× 1024 binary pixels refreshed at 2.5 kHz frame rate, refractive
optics with a binary-phase diffractive optical element to perform 5 × 5 replication, an
optically addressed SLM, a dielectric mirror, a ferroelectric liquid crystal (FLC) output
layer and light blocking layers [94]. Each channel has 26 million pixels. The pixel density
of the Active Tiling system is about 2.2× 106 pixels per cm2. Pixel period of the FLCoS
is about 6.6µm. The overall system has 1 × 4 channels (5120 × 20480 pixels = 104
megapixels). A color full-parallax holographic reconstruction is shown in Figure 3.5.
19

Figure 3.5: Replay of a spatial-multiplexed, 3 × 8 billion-pixel, full-parallax, full-color,3D image. (Slinger, C., Cameron, C., Stanley, M., “Computer-Generated Holography asa Generic Display Technology,” Computer , vol.38, no.8, pp. 46-53, Aug. 2005. c⃝2009IEEE. Reprinted with permission)
3.2.4 Horn
Ito et al. developed a system, so called Horn (HOlographic ReconstructioN), that calcu-
lates computer generated holograms at high speeds using field programmable gate arrays
(FPGAs) [95–101]. The first system named as HORN-1 and was developed in 1993. The
latest version is called HORN-6 and has four FPGA chips on it and DDR-SDRAM to
increase the computation performance. In addition, an approximated Fresnel hologram
generation algorithm is utilized by using a look-up table. As a result, objects that have
around 10000 object points can be reconstructed in real-time.
3.2.5 Image Hologram
As the name implies, it is a method to record the image of the object instead of the object
itself [50, 102, 103]. The method is realized by using a large lens to project the image of
the object on a photographic plate. A color holographic display by using an image-type
digital hologram was reported in 2007.
The object point, calculated fringe area and the viewing zone are shown in Figure 3.6.
If the distance between the object point and the hologram plane is decreased and the
distance between the virtual plane and hologram plane is increased, the calculation time
20

Figure 3.6: Virtual window for image hologram calculation (“Real-time image plane full-color and full-parallax holographic video display system,” T. Yamaguchi, G. Okabe, andH. Yoshikawa; Opt. Eng. 46, 125801 (2007). c⃝2009 SPIE. Reprinted with permission)
decreases. The developed system has 1408 × 1058 × 3(RGB) pixels with a pixel period
of 10.4 µm. For an object which has 3000 object points, the computing time is about 60
msec. Fig. 3.7 shows the optically reconstructed images.
3.2.6 Coherent Stereogram
Coherent stereogram (CS) technique yields fast calculation of holograms [104]. The speed
up stems from the segmentation of the fringe patterns and approximating the effect of the
object points as a single 2D complex sinusoid to the hologram plane over one segment.
Such complex sinusoids in a segment are superposed in the Fourier domain and an inverse
fast Fourier transform completes the fringe pattern generation. The same procedure
is repeated for all segments. Some improved versions of the coherent stereogram are
reported in [105–110].
The accurate compensated phase-added stereogram (ACPAS) is one of those improved
21

Figure 3.7: Reconstructed images of five letters from different viewpoints in depth: (a)focused on letters W and D, and (b) focused on R. (“Real-time image plane full-colorand full-parallax holographic video display system,” T. Yamaguchi, G. Okabe, and H.Yoshikawa; Opt. Eng. 46, 125801 (2007). c⃝2009 SPIE. Reprinted with permission)
versions of the coherent stereogram. ACPAS is a combination of compensated phase-
added stereogram (CPAS) and accurate phase-added stereogram (APAS). The ACPAS
generates more accurate results which are close to the Fresnel hologram. Fig. 3.8 shows
the 3D model and the reconstructed images.
Figure 3.8: A perspective image of the used 3D model and reconstructed images (“Qual-ity improvements of the coherent holographic stereogram for natural 3D display and itsapplications,” H. Kang, in PhD. Thesis, Nihon University, 2008. Reprinted with permis-sion)
Since the CS algorithm uses segments, it is suitable for parallel computing. Thus,
ACPAS can significantly benefit from GPU based programming. The applications of the
ACPAS in real-time holographic reconstructions by using GPUs are reported in [56–58,
111–113].
22

3.2.7 NICT
Japan’s National Institute of Information and Communications Technologies (NICT)
demonstrated an electro-holographic display system [114]. The system has three parts, a
capturing system, a computing system and an electro-holographic display system. The
capturing system uses integral imaging methods to capture 3D scene. It has an ultra-
high-definition integral photography camera (8K × 4K). The captured image processed
by the computing system to calculate a digital hologram. Then the resultant hologram is
displayed by three spatial light modulators (4K×2K). Three color lasers (red, green and
blue) are used to illuminate those SLMs. All operations are done in real-time. Since the
SLMs are small in size, holographic reconstructions are also small. However, end-to-end
system operates successfully. Fig. 3.9 shows the developed system.
Figure 3.9: Real object and IP micro-lens array c⃝2009 NICT. Reprinted with permission.
23

Figure 3.10: Real object acquisition system by using integral photographic camera c⃝2009NICT. Reprinted with permission.
24

Figure 3.11: Electro-holographic display system with three lasers and three LCoS c⃝2009NICT. Reprinted with permission.
Figure 3.12: Reconstruction captured by a camcorder c⃝2009 NICT. Reprinted withpermission.
25

Chapter 4
Design Parameters for Satisfactory
Holographic Displays
This chapter is mainly based on our publication in Proceedings of the IEEE, titled as
Digital Holographic Three-dimensional Video Displays.
The design and implementation of electronically controllable dynamic displays to sup-
port holographic video are significant topics for the accomplishment of the true 3D dis-
plays. Since currently available devices have quite limited capabilities, they have not
provided satisfactory performance, yet. However, those features are expected to be sig-
nificantly improved in the future. In order to achieve satisfactory quality 3D reconstruc-
tions from digital holographic display systems, one should find the requirement related to
various physical parameters. Electronically controlled pixelated spatial light modulators
are potential candidates and thus form the basis for such systems. Here in this chapter,
we present various specifications with the help of associated analysis and experiments. As
a result, we use those specifications to understand and design multiple SLM holographic
display systems. Our analysis is based on human visual system properties and limita-
tions. They are then used to final the features of satisfactory 3D reconstructions. Finally
subsequent association of these reconstructed image properties to the SLM parameters
completes the analysis.
It is informative to look at some relevant features of classical analog photographic
26

films to facilitate the discussions about satisfactory still holographic displays. In order
to have a satisfactory reproduction of the 3D image of a physical object, the holographic
recording material is required to be highly sensitive and high in resolution. The spatial
resolution of the finest hologram material goes up to many thousands of lines per mil-
limeter. The diffraction efficiency of such photographic materials is approximately 98%.
Still holograms may go up to many tens of centimeters in size, or even larger. In order to
reproduce high quality 3D images of physical objects in natural color and texture such
size and resolution properties are sufficient.
4.1 Size and bandwidth specifications for a satisfac-
tory electro-holographic display
For the rest of the chapter our discussion will be based on the space-bandwidth product
that should be supported by a holographic display device and by propagating optical
waves that emanate from such a device. The capabilities of the human visual system
will be our starting point in our analysis. The physical parameters of the human visual
system are naturally limited. Field of view, visible spectrum, spatial resolution, temporal
resolution are some of these limitations. Therefore, an electro-holographic device may
also be limited in terms of spatial bandwidth because of the corresponding limitations of
the human visual system. Fig. 4.1 shows a simple schematic for an electro-holographic
display system. The hologram is illuminated by a plane wave. The area of the hologram
is denoted by SH . The incident beam is diffracted by the SLM. The outgoing beam
diffracted towards multiple directions within an angle 2θmax. DH denotes the distance
between the observer and the hologram. The angular field of view of the observer is 2ϕv.
27

vφ2Lightillumination
SLM
Observer
HS
HD
max2θViewing zone
Figure 4.1: Simple schematic for an electro-holographic display (“Digital holographicThree-dimensional video displays,” L. Onural, F. Yaras, and H. Kang, Proceedings of theIEEE, vol.99, no.4, pp.576-589, April 2011. c⃝2011 IEEE. Reprinted with permission.)
4.1.1 Space-bandwidth product of electro-holographic displays
We start with the discussion of the space-bandwidth product (SBP). For the quality as-
sessment of the holographic displays SBP may be a good metric [63, 115]. As shown in
Fig. 4.2, at each point of the hologram plane we assume a local frequency bandwidth, yet
it is an idealization. Furthermore, we assume a constant local frequency band throughout
the SLM surface [63]. Higher SBP provides higher reconstruction quality. The analysis
and the figures are in 1D for convenience and final results are for 2D holograms. The limi-
tations on the bandwidth and the size of the holographic displays should be investigated.
Bandwidth restriction results in propagation angle restriction of the plane waves that
are emerging from the hologram. Higher bandwidth means higher propagation angles of
the plane waves. Since high propagation angles carry the high frequency contents of the
reconstructions, they affect the “sharpness” of the reconstructed object. This restriction
is equivalent to low-pass filtering the reconstructed image. If we assume that the pixel
periods of the SLMs are not the limiting factor for the bandwidth of the hologram and
thus the high propagation angles, then the human visual system restricts the bandwidth.
According to studies, the field of view, 2ϕv, is between 2◦ and 5◦ [116–118]. In our anal-
ysis we choose the field of view in which the maximum resolution on the retina as 3◦
and circularly symmetric. The resolution of the image degrades away from the maximum
28

resolution field of view. However this does not mean that we can not see if the incoming
light is outside of this region. Up to 100 - 140 degrees, a low resolution image can be
seen and it is called the peripheral vision [116,118]. Therefore, in order to have realistic
holographic reconstructions we still need high propagation angles (i.e. larger bandwidth)
in our electro-holography display systems. Being aware of this fact, we still start with
a stationary observer whose field of view is restricted by 3◦. This restriction is similar
to tunnel-vision. However we will loosen our restriction when we deal with moving and
rotating observers.
Space
Bandwidth
Figure 4.2: The “space” and “bandwidth” to compute the space-bandwidth product(“Digital holographic Three-dimensional video displays,” L. Onural, F. Yaras, and H.Kang, Proceedings of the IEEE, vol.99, no.4, pp.576-589, April 2011. c⃝2011 IEEE.Reprinted with permission.)
To start our analysis we first assume that the observer is stationary and the the viewing
angle of the observer is restricted to 3◦. This restriction is equivalent to low-pass filtering
of the 2D cross section of any transversal image along the propagation direction, since the
wave propagation between parallel 2D planes is a linear shift invariant operation [119].
The hologram and reconstruction planes are also subsets of those transversal images.
Therefore, for a stationary observer propagation angles higher than the limit supported
by the field of view are not needed and thus, the maximum local diffraction angle of
the electro-holographic display system should be chosen as equal to the field of view
(θmax = ϕv). Then the maximum spatial frequency of the hologram can be calculated as:
fmax = sin(θmax)/λ. (4.1)
29

The needed hologram size for a stationary observer can be calculated by using the distance
between the eye and the hologram. The relation between the maximum local diffraction
angle and the hologram size is shown in Fig. 4.3. The size of the hologram in one
dimension is:
Smin = 2 tan(θmax)DH . (4.2)
Therefore for the stationary observer, the required space-bandwidth product of a 1D
SLM is 2fmaxSmin, where, fmax and Smin are as given by Eq. 4.1 and Eq. 4.2. If we have
a holographic display system with the specified size and the bandwidth we obtain the
highest resolution for holographically reconstructed 3D image for a stationary observer.
For the next step we will analyze the space bandwidth product of the holographic
display system that supports lateral movement of the observer. Let us assume that the
observer is free to move along the lateral direction by SO. Then the needed hologram
size to support such a movement will be:
SH = Smin + SO. (4.3)
Furthermore, if the observer is free to rotate around the holographically reconstructed
3D object by θR, we need to modify the hologram size together with the bandwidth of
the hologram (See Fig. 4.4). The resultant hologram size should be SH = Smin + 2SR
where SR = tan(θR+θmax)DH −Smin/2. The new maximum frequency is then calculated
as fmax = sin(θR + θmax)/λ. To sum up, for free movement along the lateral direction
by SO and rotation up to an angle of ±θR, the final hologram size should be SH =
Smin+SO+2SR and the maximum frequency will be fmax = sin(θR+ θmax)/λ. Therefore
the resultant bandwidth will be 2fmax. Then the needed space-bandwidth product will
be {(Smin + SO + 2SR)[2 sin(θR + θmax)/λ]}. As a conclusion, if we insist on using a
planar holographic display we will need significantly higher bandwidth to support eye
rotations. However we do not need to use planar holograms. High diffraction angles
can be supported by using curved holograms or circularly/spherically configured planar
holograms or oblique incident light sources. The detailed analysis of curved holographic
displays will be given in Section 4.6. When we are able to support higher propagation
30

angles, a more realistic 3D vision will be achieved for a stationary observer due to the
support also in peripheral view.
SLM Plane
DH
Smin
Eye
max
max
Figure 4.3: Hologram size for a stationary observer. (DH : Distance between hologram andeye. Smin: Hologram extent) (“Digital holographic Three-dimensional video displays,” L.Onural, F. Yaras, and H. Kang, Proceedings of the IEEE, vol.99, no.4, pp.576-589, April2011. c⃝2011 IEEE. Reprinted with permission.)
2D hologram 3D image reconstruction case
In the previous section the discussion is for the 1D hologram case. However, 2D holo-
grams are used for our multiple SLM holographic display system. Therefore, extension
of the analysis to the 2D hologram case (3D reconstruction) is needed. For a circularly
symmetric resolution property of the human eye (stationary), a circular hologram with
a shape Amin is sufficient. (See Fig. 4.5 (a)) Furthermore, if the observer has a freedom
to move with a 2D transversal motion in a parallel plane within an area of shape AO
(Fig. 4.5 (b)), the minimum hologram shape and the size can be calculated by using mor-
phological dilation of Amin with AO: AH = Amin⊕AO as shown in Fig. 4.5(c). (Please see
[120] for the morphological dilation.) For the observer with a freedom of 2D rotation, the
sufficient spatial extent and the maximum frequency along the rotation direction can be
calculated as in the 1D case. The space-bandwidth product can be found by multiplying
the area and the resultant 2D bandwidth.
31

SLM PlaneDH
Smin
Eye
max
max
SR
R
R
Figure 4.4: Hologram size and bandwidth modification for eye rotation. (DH : Dis-tance between hologram and eye. Smin: Hologram extent for a stationary observer. SR:Additional hologram extent as a result of eye rotation. θR: Rotation angle in lateral di-rection.) (“Digital holographic Three-dimensional video displays,” L. Onural, F. Yaras,and H. Kang, Proceedings of the IEEE, vol.99, no.4, pp.576-589, April 2011. c⃝2011IEEE. Reprinted with permission.)
4.1.2 Pixel period
Commonly used spatial light modulators consist of pixels. Liquid crystal (LC) devices,
liquid crystal on silicon (LCoS) devices, digital micro-mirror devices (DMDs) are some
of them. The pixelated function gp(x, y) of the bandlimited 2D signal, g(x, y), on a SLM
with 2N × 2M pixels can be expressed as:
gp(x, y) =
(N−1∑n=−N
M−1∑m=−M
g(x, y)δ(x− n∆px, y −m∆py)
)
∗ ∗[rect
(x
∆pax
)rect
(y
∆pay
)]=
(N−1∑n=−N
M−1∑m=−M
g(n∆px,m∆py)
×[rect
(x− n∆px∆pax
)rect
(y −m∆py
∆pay
)]),
(4.4)
where ∆px and ∆py are the pixel periods on the SLM at the (x, y) plane, and ∆pax and
∆pay are the active pixel sizes along x and y, respectively [121]. The 2D convolution is
represented by ∗∗ and δ(·, ·) is the 2D impulse function. Rectangular function, rect(·) is
32

Smin
Amin
(a)
SOx
SOy
(b)
Smin + SOy
(c)
AO
Smin + SOx
AH
Figure 4.5: (a) Minimum hologram size for a stationary observer. (b) Example for theallowed transverse motion range AO = SOx × SOy. (c) The shape of the minimumhologram is found as AH = Amin ⊕ AO where ⊕ denotes the morphological dilation(“Digital holographic Three-dimensional video displays,” L. Onural, F. Yaras, and H.Kang, Proceedings of the IEEE, vol.99, no.4, pp.576-589, April 2011. c⃝2011 IEEE.Reprinted with permission.)
defined as:
rect (x) =
0 for |x| > 1/2
1/2 for |x| = 1/2
1 for |x| < 1/2
(4.5)
To avoid aliasing during the recovery of the original image by simple low-pass filtering,
samples have to be chosen dense enough. With the help of dense sampling, overlapping
replicas in the spectral regions of Gp(kx, ky) (it is the Fourier transform of gp(x, y)) are
33

separated. To find how dense we should take those samples, we first assume that the
rectangular frequency band is centered around the origin and the maximum frequencies
along the x and y directions are kxmax and kymax , respectively. The centers of the replicas
in the Fourier domain, i.e. Gp(kx, ky) are separated by 2π/∆px and 2π/∆py along the
kx and ky directions, respectively. Therefore in order to avoid aliasing the pixel periods
have to be chosen as:
∆px ≤ 2π
2kxmax
and ∆py ≤2π
2kymax
. (4.6)
For an infinite extent pixelated band limited function gp(x, y), to recover the original
function by low-pass filtering, the maximum spacings of the sampling lattice are (π/kxmax)
and (π/kymax). These are the maximum sampling intervals according to the Nyquist
criteria. Fig 4.6 shows the effect of sampling to the waves propagating away from the
SLM.
Recovering the original function by low-pass filtering (i.e. Shannon recovery) is only
one of the possible techniques. Other recovery techniques may relieve the Nyquist rate
requirement and we may not need that much dense sampling. Full recovery of the severely
undersampled (undersampled below the Nyquist rate) Fresnel diffraction patterns is re-
ported by Onural [122]. The full recovery condition for undersampled diffraction patterns
is different than the band-limitedness, like the space-limitedness of the original function.
Therefore, when the diffraction pattern of a finite size object is sampled, higher diffrac-
tion orders (replicas of the original image) will also fall onto the reconstruction. If we
increase the sampling rate, those image replicas will further separate from each other.
Therefore we start with a higher sampling rate and we decrease it until the image replicas
just overlap [28, 122, 123]. Then just by filtering out the replicas by windowing in the
space domain we obtain the original function. In real-life applications, space-limitedness
is more common rather than band-limitedness. Therefore, we can conclude that full
recovery from samples that are below the Nyquist rate is possible.
If we go back to Shannon recovery case, we can use the Nyquist criteria to find out the
maximum pixel period. For example, for a observer (stationary) looking directly to the
34

hologram from a distance DH = 1m (λ = 633nm and θmax = ϕv = 1.5◦), the maximum
pixel period is ∆p =λ
2 sin(θmax)≈ 12µm and Smin = 5cm from Eq. 4.1, Eq. 4.2 and
Eq. 4.6.
As mentioned in the previous section, when the observer is allowed to move along the
lateral direction and rotate around the reconstruction the required bandwidth and size of
the hologram should be modified. For example, if the distance between the observer and
the holographic display is one meter (DH = 1m), and the observer is free to move 20cm
(SO = 20cm) along the lateral direction and free to rotate ±15◦ (θR =15◦) around the
reconstruction, the diffraction angle is θR+θmax = 17◦ (where θmax = 2◦) and the display
size is 0.80m (SH = SO + 2tan(θR + θmax)DH). For the holographic display whose size
and pixel period are 0.80m and 1.1µm, respectively, the total number of pixels along one
direction will be more than 860000.
In addition to the sampling of the hologram due to the pixelated structure of the
SLMs, recovery of the original 3D object from the sampled hologram is also an issue. For
this purpose, as mentioned before, full recovery of the original signal can be obtained by
low-pass filtering. Since the wave propagation between two parallel planes is a linear shift
invariant operation, low-pass filtering can be performed at any transversal plane along
the propagation direction. Thus, we can perform it also at the reconstruction plane. We
can use an optical low-pass filter which blocks the high-order diffractions and moves along
the transversal direction together with the observer (See Fig. 4.6(d)). However the filter
imposes a key-hole effect due to the associated narrow viewing angle.
As an alternative way to avoid overlapping of the higher diffraction orders, sampling
density can be increased and this yields smaller pixel periods. High diffraction orders at
the reconstruction plane are shown in Fig. 4.7. DR is the distance between the hologram
plane and the reconstruction plane, and SRec is the reconstruction size (SRec = SH +
2 tan(θmax)DR from the previous discussions). The angle of the mth high diffraction order
is θOm = sin−1(mλ/Λ), where λ is wavelength Λ is period of the diffraction grating and
m is the index of the diffraction order [124]. As shown in Fig. 4.7, to avoid overlapping of
the high diffraction orders tan(γ) should be larger than SRec/DR, where γ = θO1 − θmax.
35

(a) Local bandwidth(propagation angle)associated with a hy-pothetical continuous(non-pixelated) SLM.Diffracted light propa-gates within a cone fromeach location on the SLM.
(b) Consequence of thepixelated structure (sam-pling) to the propaga-tion angle distribution (noaliasing case). Many wellseparated cones of lightpropagate from each SLMlocation.
(c) Aliasing due to largerpixel size (coarse sam-pling). Propagating conesfrom each SLM locationoverlap. (Please notethat cones propagatealong the horizontalaxis, indefinitely; only aportion is shown not toclutter the drawings. Theextent of the cones has norelevance.)
(d) Optical low-pass filter to recover the original im-age observed in (a). Only low angle propagationpasses through the filter at each SLM point (and low-pass filter) location.
Figure 4.6: Effect of pixel period on the angular distribution of diffracted light from apixelated SLM and recovery by an optical low-pass filter. (“Digital holographic Three-dimensional video displays,” L. Onural, F. Yaras, and H. Kang, Proceedings of the IEEE,vol.99, no.4, pp.576-589, April 2011. c⃝2011 IEEE. Reprinted with permission.)
36

O1
max
SLM
DR
SRec
Reconstruction field
SLM Plane
O1
Figure 4.7: High diffraction orders in reconstruction field and their separation (“Digitalholographic Three-dimensional video displays,” L. Onural, F. Yaras, and H. Kang, Pro-ceedings of the IEEE, vol.99, no.4, pp.576-589, April 2011. c⃝2011 IEEE. Reprinted withpermission.)
As an example, if the observer is free to move along lateral direction by 15cm (SO =
15cm) and the distance between the observer and the hologram is 1m (DH = 1m), the
required hologram size is 20.2cm (SH = 20.2cm and θmax = 1.5◦). For DR = 0.5m (the
distance between the reconstruction and the SLM), the maximum reconstruction size will
be 22.8cm (SRec = 22.8cm). To avoid overlapping of the high diffraction orders for the
hologram whose frequency content is fixed, γ should be larger than tan−1(SRec/DR) ≈
24.5◦, which gives θO1 = 26◦. Since θO1 = sin−1(λ/2∆p), the pixel period ∆p should be
smaller than 0.72µm (for λ = 633nm).
This example shows that even without the eye rotation (i.e. θR = 0), the required pixel
period may be less than the wavelength of the light. If the observer can rotate around the
reconstruction, pixel periods will decrease rapidly. Such pixel periods may not be feasible
37

due to physical constraints. As a result, we may conclude that planar configurations may
not be the ultimate solution for the satisfactory holographic display systems. With the
help of the analysis in this section we understand that other geometrical configurations
(i.e. non-planar cases) or adaptive systems may relieve the large space-bandwidth product
(see Fig. 4.8). Therefore the narrower bandwidth can be used as shifted around the center
frequency imposed by the oblique illumination. As a result, instead of a space-bandwidth
of BW ×Smax, a space-bandwidth product of BW ×SH at a time may still be sufficient.
(a) (b)
SLM SLM
Figure 4.8: (a) Orthographic illumination (b) Tilted illumination (“Digital holographicThree-dimensional video displays,” L. Onural, F. Yaras, and H. Kang, Proceedings of theIEEE, vol.99, no.4, pp.576-589, April 2011. c⃝2011 IEEE. Reprinted with permission.)
4.2 Space-bandwidth product as a quality metric for
holographic reconstructions
The discussion until this point is about space-bandwidth product of the SLMs to have
satisfactory quality holographic reconstructions. In this section we want to find out how
the information is distributed in space during the reconstruction. First we start with the
single planar SLM case.
When a plane wave is modulated by a planar SLM, it is diffracted depending on
the pattern written on the SLM. This propagation after the diffraction is in a limited
angle and the limit is related to the bandwidth of the pattern written on the SLM. For
38

a given SLM, the quality metric can be illustrated as a function of distance with respect
to the SLM. Fig. 4.9 is an illustration of the variation of the profile of such a quality
metric. Note that the figure does not show the diffraction pattern. Quality metric is used
to determine the optimum location for a holographic reconstruction in terms of quality.
The solid angle in which the diffracted light propagates is equal to the frequency band
of the system. We first set a variable z, denoting the distance of a focused point on the
optical axis. When we move away from the SLM, as shown in Fig. 4.10 (a) and (b) the
bandwidth of the system is restricted by the capabilities of the SLM until z = z0. Up to
this point the bandlimited quadratic phase pattern (i.e. the Fresnel lens) remains entirely
in the SLM, thus the bandwidth is constant. However in this region the area that the
bandlimited quadratic phase pattern sits increases with z2. As a result, quality metric
increases proportional to z2 in 0 < z < z0.
SLM
SH=16 mm
850 mm
Figure 4.9: Quality metric of reconstruction by the hologram on the SLM as a functionof distance of the reconstructed image (white: high quality, black: low quality) (“Digitalholographic Three-dimensional video displays,” L. Onural, F. Yaras, and H. Kang, Pro-ceedings of the IEEE, vol.99, no.4, pp.576-589, April 2011. c⃝2011 IEEE. Reprinted withpermission.)
After a certain distance (i.e. z = z1), the quadratic phase pattern covers the entire
SLM and the 2D frequency band, so the quality metric, will decrease with z2. Between
those two points, z0 < z < z1 is the transition region.
Fig. 4.11 shows the variation of the quality metric along the optical axis. For example,
if we have a SLM with a size of 16mm and pixel period 9µm (i.e. θmax = 2◦) and for the
wavelength λ = 633nm, optimum distance corresponding to the highest quality metric,
DR, is approximately 228mm (Fig. 4.11). The extension of this analysis to a circularly
configured planar SLMs will be presented in Sec. 4.6.
39

Figure 4.10: Variation of “space” and “bandwidth” with respect to reconstruction dis-tance z. (a) When z is small, “space” is also small and the “band” is limited by themaximum band supported by the SLM. (b) As z moderately increases, “space” also in-creases and “band” is still limited by the maximum band supported by the SLM. (c)Transition (d) For larger z, “space” does not change anymore, but “band” decreasessince the supported diffraction angle (and therefore the spatial frequency) decreases. (e)For very large z, “space” does not change, but “band” decreases even further (“Digitalholographic Three-dimensional video displays,” L. Onural, F. Yaras, and H. Kang, Pro-ceedings of the IEEE, vol.99, no.4, pp.576-589, April 2011. c⃝2011 IEEE. Reprinted withpermission.)
4.3 Noise and Quantization
Information about a 3D object is carried and distributed to the space via diffraction.
For common objects, this information is well spread all over the holographic pattern.
Therefore, such holograms are immune to quantization noise to some extent. In this
section, noise sources and the effect of the quantization to holograms will be investigated.
Common spatial light modulators and other display devices usually have 256 quanti-
zation levels. For example, most of the commercially available phase-only spatial light
modulators quantize the phase interval (0 − 2π) to 256 levels. According to Mills and
Yamaguchi, even 4-bit quantization is enough for phase hologram quantization and the
difference between 6-bit and 8-bit quantization is unnoticeable [125]. Since commercially
40

Figure 4.11: Variation of normalized quality metric for a reconstructed image from a finitesize SLM along the optical axis (“Digital holographic Three-dimensional video displays,”L. Onural, F. Yaras, and H. Kang, Proceedings of the IEEE, vol.99, no.4, pp.576-589,April 2011. c⃝2011 IEEE. Reprinted with permission.)
available SLMs have usually 8-bit quantization, they are adequate, in terms of quanti-
zation properties, for holographic display systems. Moreover, optical elements such as
prisms, beam-splitters and lenses may also introduce some distortion to the holographic
reconstructions.
Yet another noise source is the speckle. If coherent light passes through or reflected
from an optically rough surface, its phase is randomized. Superposition of random phase
light contributions result in the speckle [126]. There are several methods to eliminate
the speckle noise [127–131]. Using LED illumination is an alternative way of reducing
speckle. Although LEDs have some degree of temporal and spatial coherence, since they
are not perfectly coherent speckle may not exist in the reconstruction. Furthermore, LED
illumination is not harmful to human eye, if it is not too bright [132]. Thus, holographic
reconstructions obtained by LED illumination can be observed by naked eye [55–59]. In
addition, LEDs are low-cost and easy-to-use devices. However, since they exhibit low
coherence, the reconstructions may be somewhat blurred.
41

Side view of center SLM
SLM
Laser BE
P Aθ
θ
θθθθ
φ
Side view of center SLM
SLM
Laser BE
P Aθ
θ
θθθθ
φ
Figure 4.12: Vertically tilted SLM.
4.4 SLM tilting and polarization effect
In our multiple SLM holographic display systems, we usually tilt the SLMs vertically to
move the holographic reconstructions above the setup. With the help of this technique,
observers have a clear sight without any obstacles. Therefore, in this section we examined
the reconstruction quality when the SLM is illuminated by an oblique incident light. First
of all, based on our experiments and subjective evaluations, 10 degrees of tilt along the
vertical direction allows the observer to see the reconstructions without any obstacles
such as beam expanders, beam splitters and so on. Fig. 4.12 shows that the optical setup
of the vertically tilted SLM.
The quality of the reconstructions from a commercially available SLM under oblique
illumination was not known. Therefore we conducted some experiments and recorded the
reconstructions for 0, 10, 25 and 33 degrees of tilted illumination as shown in Figs. 4.14
(a) - (j). Figures indicate that up to 25 degrees of tilting, the results are satisfactory.
However at 33 degrees the reconstructions significantly degrade.
There are also polarization issues for tilted reconstructions. In the manual of the
HoloEye 1080 P, it is shown that SLM modulates best when polarization of the incident
light is along the vertical direction. We used such a vertical polarization for our exper-
iment. Since the polarization of the incident light is 90 degrees (perpendicular to the
42

Decomposition of polarization vector
(a) (b)
Figure 4.13: Effect of polarization on tilting. Red arrows denote the modulated light.
ground), more degradation is observed when there is a vertical tilt (Fig. 4.13) compared
to horizontal tilt. For larger tilt angles if the tilting direction and the polarization is in
the same direction (e.g. vertical tilt - vertical polarization), scalar diffraction calculations
fail. Based on our reconstructions we can conclude that up to 25 degrees of tilting the
reconstructions are still satisfactory and thus we can use this result during the design of
a cylindrical holographic display.
4.5 Off-axis case
Since we use off-axis holography in our circular holographic displays, the related design pa-
rameters should also be investigated. Holographic reconstructions from inline holograms
may suffer from the undiffracted beam. When the object beam and the undiffracted beam
overlap the observer may not see the reconstructed image. In order to separate the ob-
ject beam and the undiffracted beam, a tilted reference beam may be used. However this
procedure may increase the maximum spatial frequency of the holographic pattern since
it is equivalent to a modulation of a signal by a carrier frequency which is determined by
the direction of the reference wave. If the tilt of the reference wave is θT along the vertical
direction, the maximum spatial frequency will increase by an additional sin(θT )/λ. For
a stationary observer, as in the example given in Section 4.1.2, if the angle between the
43

object beam and the undiffracted beam is chosen as 2◦ along the vertical direction, the
resultant spatial frequency will be fmax = sin(1.5◦)/λ + sin(2◦)/λ = 96cycles/mm, the
maximum diffraction angle, θmax, will be approximately 3.5◦, and finally the pixel period
will be ∆p ≈ 5µm, instead of 12µm (as given in Section 4.1.2). Therefore we can conclude
that off-axis holography affects the pixel period, significantly.
4.6 Cylindrically arranged electro-holographic display
system
Commercially available spatial light modulators are generally planar. In the literature,
planar holographic display systems consist of multiple SLMs are reported [59,64,88,103,
133]. However, as presented in Section 4.1.1 a problem related to the planar configuration
is the necessary high space-bandwidth product to support rotational movements. There-
fore, as also discussed in Section 4.1.2 the need for circular configuration of planar SLMs is
obvious. Some of the circularly configured holographic display systems will be discussed
in the following sections and this thesis mainly focuses on such configurations. With
the help of such designs, the necessity for too small pixel periods is relieved. Fig. 4.15
shows the space variation of the quality metric when multiple planar SLMs are config-
ured circularly. The bright region shows the highest quality region of the holographic
reconstruction. By increasing the total number of SLMs higher propagation angles are
supported and, thus the space-bandwidth product increases. The gaps between the SLMs
yield discontinuous regions at the observer side. However solutions for this problem will
also be presented in the following chapters.
44

4.7 Extension to a spherical or other surface geom-
etry designs
In the previous sections we dealt with circularly configured holographic display arrange-
ments. However, extensions to spherical or other more general configurations are rather
straightforward. Instead of tiling the SLMs on a cylindrical surface, planar SLMs should
be tiled on a spherical surface. Such a configuration will also increase the vertical parallax.
A spherical electro-holographic display design is shown in Fig. 4.16.
45

(a) No tilting
(b) 10 degrees vertical (c) 25 degrees vertical (d) 33 degrees vertical
(e) 10 degrees horizontal (f) 25 degrees horizontal (g) 33 degrees horizontal
(h) 10 degrees diagonal (i) 25 degrees diagonal (j) 33 degrees diagonal
Figure 4.14: Reconstructions by tilted SLM.
46

Figure 4.15: Space variation of the quality metric for piecewise planar circular SLMconfiguration with multiple planar SLMs. The bright region at the center is the highestquality reconstruction zone. SLMs are at the left end of bright bands. Observer is at theright hand side. (white: high quality, black: low quality) (“Digital holographic Three-dimensional video displays,” L. Onural, F. Yaras and H. Kang, Proceedings of the IEEE,vol.99, no.4, pp.576-589, April 2011. c⃝2011 IEEE. Reprinted with permission.)
Spherically arranged array of planar SLMs
Reconstruction
Figure 4.16: Spherically arranged electro-holographic display design (“Current researchactivities on holographic video displays,” L. Onural, F. Yaras and H. Kang, Proc. SPIE7690, 769002, (2010). c⃝2010 SPIE. Reprinted with permission. )
47

Chapter 5
Experimental Setup And Results For
The Holographic Displays Using
Single Phase-only SLM
In order to design and implement multiple SLM holographic displays, first we need to
investigate the single SLM holographic reconstructions. Therefore in this chapter, we
present the properties of phase holograms and some single SLM holographic display ex-
amples. Some parts of this chapter is based on our publication in 2008 3DTV Conference,
titled as Holographic reconstructions using phase-only spatial light modulators [54] . In
Chapter 6, we will extent our discussion and analysis to multiple SLM configurations.
5.1 Phase-only Holograms
As discussed in Chapter 3, phase-only spatial light modulators (SLMs) have some ad-
vantage over amplitude-only SLMs. One of the most important properties is the high
diffraction efficiency. Theoretically phase-only holograms may have up to %100 diffrac-
tion efficiency. Phase-only holograms modulate the phase of the incident wave either by
changing the path length of the incident wave or changing the refractive index of the
medium. Phase-only SLMs perform phase variations by altering the refractive index.
48

Uniaxial birefringent liquid crystal layer has an extraordinary refractive index, ne, and
an ordinary refractive index, no [134]. When an alternating electric-field is applied to the
birefringent liquid crystal layer, LC molecules tend to align with the electric field and
thus, the extraordinary refractive index decreases.
To define the phase hologram, we first start with a 2D complex distribution f(x, y) =
a(x, y) exp[jϕ(x, y)]. Then we assume that ψz(x, y) = A(x, y) exp[jp(x, y)] is the diffrac-
tion pattern of the given 2D complex function, f(x, y), under the coherent illumination
at a distance z. If the hologram has the form ψz(x, y) = A exp[jp(x, y)] (i.e. constant
amplitude) then exp[jp(x, y)] is called the phase hologram. For common objects (i.e.
for most f(x, y)), the phase hologram can only be obtained as an approximation since
A(x, y) is not a constant.
Throwing away the magnitude of a complex field is a non-linear operation and such
process degrades the quality of the reconstruction by enhancing the edges and suppressing
the intensity in smooth areas. However based on our subjective test, the quality of the
optical reconstructions from such phase holograms are satisfactory for casual observers.
Furthermore, we can increase the quality if we perform some iterative processes to the
phase holograms.
Figure 5.1: Hologram and Object planes (“Holographic reconstructions using phase-onlyspatial light modulators,” F. Yaras, M. Kovachev, R. Ilieva, M. Agour and L. Onural, in3DTV Conference: The True Vision - Capture, Transmission and Display of 3D Video,IEEE, 2008. c⃝2008 IEEE. Reprinted with permission.)
49

One of the iterative algorithms is the Gerchberg-Saxton algorithm [54,55,135,136]. 2D
phase holograms of 2D objects are computed with the help of this algorithm (See Fig. 5.1).
We first start with the object plane where the initial phase distribution, ϕinitial(x, y), is
chosen randomly and the magnitude, a(x, y) is the real valued 2D target image. Then the
complex distribution at the object plane is propagated to the hologram plane by using
the Fresnel wave propagation kernel. Let us denote the resultant complex field at the
hologram plane as A1(x, y) exp(jψ1(x, y)), where subscript 1 denotes the first iteration
step. Then, the magnitude, A1(x, y) is replaced by 1 assuming that the hologram will
be illuminated by a plane wave parallel to the hologram plane. The resultant complex
distribution is back-propagated to the object plane, again by using the Fresnel propaga-
tion. Here, the magnitude of the resultant field, say a1(x, y), is replaced by the target
object, i.e. a(x, y). If the desired iteration number is reached or the error between the
target and the resultant intensity distribution drops below a certain point, the iteration
is stopped and the phase distribution at the hologram plane, ψfinal(x, y), become our
phase hologram. Fig. 5.2 shows the block diagram of the Gerchberg-Saxton algorithm.
Figure 5.2: Block diagram of the Gerchberg-Saxton algorithm for calculating phaseholograms (“Holographic reconstructions using phase-only spatial light modulators,” F.Yaras, M. Kovachev, R. Ilieva, M. Agour and L. Onural, in 3DTV Conference: The TrueVision - Capture, Transmission and Display of 3D Video, IEEE, 2008. c⃝2008 IEEE.Reprinted with permission.)
50

5.2 Setup and Results
In our both single and multiple SLM experiments, we used Holoeye phase-only SLMs
[71]. It has 1920 × 1080 pixels and the pixels are square with a period of 8µm in both
directions. The panel size of the spatial light modulator is about 16mm× 8mm. The fill
factor of the SLM is reported as %87. Refresh rate is 60 Hz and an 8-bit quantization is
used. Picture of the Holoeye HEO-1080P is shown in Fig. 5.3.
Figure 5.3: Photograph of a Holoeye HEO-1080P phase-only spatial light modulator.(courtesy of www.holoeye.com)
Illustration of the optical setup for the single SLM experiments is shown in Fig. 5.3.
Laser light is first passed through a spatial filter to clean up the beam, since there
may exist abberations due to dust or imperfection in optics, or even defects in the laser
medium. The filtered light is then re-shaped by the lenses (grouped under the name
of “beam expender” in the figure) to have a plane wave illumination. The generated
plane wave illumination is passed directly across the beam-splitter and illuminates the
phase hologram on the spatial light modulator. The modulated light from the SLM is
reflected by the beam-splitter to the observation region. Without the beam-splitter it
would be difficult to observe the reconstruction. With the help of a camera, a focused
reconstruction is captured at the reconstruction plane.
51

Laser BE
SF
BS
Phase-only SLM
SF: Spatial FilterBE: Beam ExpanderBS: Beam Splitter Reconstruction
Figure 5.4: Illustration of the optical setup for single SLM holographic display experi-ments.
Although iterative algorithms are quite slow due to demanding computational com-
plexity, we obtained successful results even after a low number of iterations. Fig. 5.5(a)
shows the 2D intensity distribution of the target image. Since our phase-only SLM is de-
signed for monochromatic applications, we use a grayscale image. The phase hologram of
the target image is shown in Fig. 5.5(b). Hologram is calculated by using the Gerchberg-
Saxton algorithm and only 10 iterations are performed. The optical reconstruction from
the phase hologram under coherent plane wave illumination is illustrated in Fig. 5.5(c).
The wavelength of the illuminating light source is 633nm.
Phase holograms of more complicated 2D intensity distributions are also calculated.
Fig. 5.6(a) shows the photograph of the Bilkent 3DTV Laboratory. Phase hologram of
the image (the 2D gray level photograph) is calculated by performing 20 iterations. The
numerical and optical reconstructions from the resultant phase hologram is shown in
Fig. 5.6(b) and Fig. 5.6(c), respectively.
Above reconstructions have the same size as the SLM. However, larger holographic
reconstructions compared to SLM size is possible. As illustrated in Figure 4.7, the maxi-
mum reconstruction size is defined as SRec = SH + 2 tan(θmax)DR, where SH is the SLM
size in this case. (Note that, higher diffraction orders are eliminated by windowing at
the reconstruction plane and size of the reconstructions can be increased until the higher
52

diffraction orders overlap. See Section 4.1.2.) In order to reconstruct larger size images,
the same Gerchberg-Saxton algorithm is used. Now we take a larger window size to
propagate back and forth. At the hologram plane, the amplitude should be replaced by
zeros except within the SLM window. The amplitude at the SLM window is replaced by
the magnitude of the illuminating wave. Figure 5.7 shows the optical reconstruction of a
16mm×16mm size object from a 16mm×8mm size phase-only hologram. The hologram
is computed by 200 iterations. The size of the hologram, i.e. SLM, is visible in the figure
due to the diffraction from edges of the SLM and can be used as a size reference.
Up until here in this chapter, we dealt with 2D single plane holographic reconstruc-
tions. However, to understand the potentials of phase holograms in future 3D holographic
display systems, we also performed 3D display experiments using a single phase-only
SLM. We generated phase holograms of three planar objects (“3DTV”, “BILKENT” and
“BIAS” words) at different depths. First, three separate phase-only holograms are gen-
erated by using the Gerchberg-Saxton algorithm for each object. Then all three complex
fields at the hologram plane are superposed as:
exp(jψ3DTV (x, y))+exp(jψBilkent(x, y))+exp(jψBias(x, y)) = A(x, y) exp(jψFinal(x, y)) .
(5.1)
The resultant phase, ψFinal(x, y) is written onto the SLM and the same setup is used for
the optical reconstructions. Figure 5.8 shows the optical reconstruction of three objects
that are captured at 450mm, 500mm and 550mm. Note that there is no occlusions or
overlaps since the objects are separate enough. Therefore the effect of mutual interactions
of the objects to the hologram is negligible.
Several holographic display experiments for a single phase-only spatial light mod-
ulators are conducted. We saw that even for a low number of iterations, satisfactory
holographic reconstructions are possible. Although the iterative algorithms are slow due
to demanding computational complexity, results indicate that phase-only holograms are
strong candidates for future 3DTV applications. This concludes our discussion on single
SLM holographic reconstructions and phase holograms and leads us to multiple SLM
holographic display systems.
53

Figure 5.5: (a) 2D picture of a die, (b) phase hologram, computed in 10 iterations,(c) optical reconstruction from the phase hologram (“Holographic reconstructions usingphase-only spatial light modulators,” F. Yaras, M. Kovachev, R. Ilieva, M. Agour and L.Onural, in 3DTV Conference: The True Vision - Capture, Transmission and Display of3D Video, IEEE, 2008. c⃝2008 IEEE. Reprinted with permission.)
54

Figure 5.6: (a) 3DTV Lab photograph as a 2D grayscale object, (b) numerical and (c)optical reconstructions from the phase hologram computed in 20 iterations (“Holographicreconstructions using phase-only spatial light modulators,” F. Yaras, M. Kovachev, R.Ilieva, M. Agour and L. Onural, in 3DTV Conference: The True Vision - Capture, Trans-mission and Display of 3D Video, IEEE, 2008. c⃝2008 IEEE. Reprinted with permission.)
55

Figure 5.7: Optical reconstruction of the 1920×2160 size object from a 1920x1080 phase-only hologram computed in 200 iterations. The SLM size is visible due to diffraction fromits edges (“Holographic reconstructions using phase-only spatial light modulators,” F.Yaras, M. Kovachev, R. Ilieva, M. Agour and L. Onural, in 3DTV Conference: The TrueVision - Capture, Transmission and Display of 3D Video, IEEE, 2008. c⃝2008 IEEE.Reprinted with permission.)
56

Figure 5.8: Optical reconstruction of the three objects at different depths (450mm,500mm and 500mm from the SLM) (“Holographic reconstructions using phase-only spa-tial light modulators,” F. Yaras, M. Kovachev, R. Ilieva, M. Agour and L. Onural, in3DTV Conference: The True Vision - Capture, Transmission and Display of 3D Video,IEEE, 2008. c⃝2008 IEEE. Reprinted with permission.)
57

Chapter 6
Experimental Setup And Results For
The Holographic Displays Using
Multiple Phase-only SLMs
In this chapter, we present the experimental setups and results for the multiple SLM holo-
graphic display systems. All those experiments and designs serve for the sake of designing
the satisfactory quality holographic display system. For this purpose, we present several
multi-SLM configurations including color holographic display, real-time holographic dis-
play, planar and circularly configured holographic displays. This chapter is mainly based
on our publications [55,56,58,59,115,137,138].
6.1 Color holographic reconstruction using multiple
SLMs and LED illumination
As discussed in Chapter 5, phase-only holograms have advantageous properties for holo-
graphic display systems. High diffraction efficiency, low-power higher diffraction orders
and low-power undiffracted-beam are some of these advantageous properties [139]. Here
in this section, experimental color holographic reconstruction results using multiple SLMs
and LED illumination are reported. In the experiments in this section, phase holograms
58

were calculated by using the Gerchberg-Saxton algorithm. The iterative algorithm is
described in Section 5.1. In addition, LED illumination is used instead of laser illumina-
tion. For the laboratory prototype, we used three monochromatic phase-only spatial light
modulators and three color LEDs (red, green and blue). Those separate phase-only SLMs
are synchronized by the SLM driver module and also each SLM is connected to a color
channel (red, green and blue) in the driver module. The driver module is connected to
the graphics card of a computer by a digital visual interface (DVI) cable. For example, if
a signal of a RGB color image is sent to the SLM driver module by the computer graphics
card, the driver module first separates the red, green and blue components of the RGB
image and sends each color component to the corresponding color channel and, then to
the associated SLM.
BS
D
BE BE BE
R
B
G
CCD
Figure 6.1: Optical setup. (BE: Beam Expander, BS: Beam Splitter, D: Driver Module.)
59

For the color holographic reconstruction experiment, we first calculate the phase holo-
gram of a color 2D object. For this purpose, we first separate the color components of
the color image. For each color, a phase hologram is separately calculated by using
the Gerchberg-Saxton algorithm. Reconstruction distances are chosen equal for all color
components. Note that, wavelength of each color is different. After calculating all three
phase holograms, they are then saved in a RGB image to obtain a color hologram. The
resultant color phase hologram is then sent to the SLM driver module by the computer
graphics card. As described above, the color components of the color phase hologram is
separated by the SLM diver module and sent to the associated SLM. Then those SLMs are
illuminated by a plane wave generated by LED illumination setup. Optical reconstruc-
tions from each phase hologram is aligned to obtain the final optical color holographic
reconstruction.
Figure 6.2: 2D picture of 3DTV logo (courtesy of www.3dtv-research.org).
The diagram of the optical setup is shown in Fig. 6.1. The wavelengths of the LEDs
are around 625nm, 520nm and 460nm for red, green and blue, respectively. The emitted
light from the LED first passes through a spatial filter to increase the spatial coherence
by cleaning up the beam. Beam expenders (BEs) that are used to obtain the plane wave
and the optical reconstructions for each color are combined with the help of beam split-
ters (BS). The original 2D color object and the resultant color phase hologram are shown
in Figs. 6.2 and 6.3, respectively. We used a lensless CCD array to capture the optical
60

reconstructions. The reconstructed image size is about 16mm × 10mm and the recon-
struction distance is 60cm. 250 iterations are performed to obtain the phase holograms.
The digital (computer based) and the optical color holographic reconstructions are shown
in Figs. 6.4 and 6.5, respectively.
The results show that the color holographic reconstructions are possible by using
multiple SLMs. However, the reconstruction sizes and the angle of view are quite small.
Therefore, observers can not see the reconstructions with both eyes. In addition, since the
iterative algorithms are rather slow due to demanding computational complexity, such
a procedure may not be suitable for future 3DTV applications. We present a real-time
multiple SLM holographic display system, which solves this problem, in the next section.
Figure 6.3: Color phase hologram (“Color holographic reconstruction using multipleSLMs and LED illumination,” F. Yaras and L. Onural, Proc. SPIE 7237, 72370O, (2009).c⃝2009 SPIE. Reprinted with permission.)
61

Figure 6.4: Computer reconstruction from color phase hologram (“Color holographicreconstruction using multiple SLMs and LED illumination,” F. Yaras and L. Onural,Proc. SPIE 7237, 72370O, (2009). c⃝2009 SPIE. Reprinted with permission.)
Figure 6.5: Optical reconstruction from color phase hologram (“Color holographic recon-struction using multiple SLMs and LED illumination,” F. Yaras and L. Onural, Proc.SPIE 7237, 72370O, (2009). c⃝2009 SPIE. Reprinted with permission.)
62

6.2 Real-time multiple SLM color holographic dis-
play using multiple GPU acceleration and LED
illumination
Real-time holographic display systems are being investigating for future 3DTV applica-
tions. Real-time holographic fringe pattern generation is an important issue for 3D display
technologies and will have a significant impact. However there are some severe problems
in fast calculation of the computer generated holograms. There are several methods for
fast computation of holograms [140–142]. Some prototypes of the real-time holographic
display systems are already demonstrated. SeeReal, QinetiQ and MIT’s Holo-video are
some of the examples of real-time holographic display systems [64, 79, 87, 88] (See Chap-
ter 3). Some parts of this section is based on our publications [56] and [58].
In our real-time holographic video display system we used Accurate Compensated
Phase-Added Stereogram (ACPAS) [110]. This algorithm is proposed by Kang in his
thesis and can be used as a real-time color holographic fringe generation method. AC-
PAS is an improved version of Compensated Phase-Added Stereogram (CPAS) [106].
ACPAS is a slightly slower algorithm than CPAS algorithm but resultant holograms
from the ACPAS algorithm produce better reconstructions which are similar to that of
Fresnel holograms. Here we again used phase-only spatial light modulators (SLMs) to
display holograms and we benefited from the desirable properties of phase holograms.
These properties are listed in previous sections. We used light emitting diodes (LEDs) to
illuminate those SLMs. By the help of LED illumination, unwanted properties of laser
illumination, such as speckle noise and eye hazard, is eliminated. As mentioned in the
previous sections, LEDs are somewhat coherent. They have some degree of both time and
space coherence. However, since they are not fully coherent, the reconstructions might
be somewhat blurred.
We used multiple graphics processing units (GPUs) to increase the hologram gener-
ation speed and to achieve real-time hologram generation. GPUs are commonly used as
63

parallel processing devices [143–145] and they are quite powerful. ACPAS algorithm is
suitable for parallel processing and when multiple GPUs are used the overall performance
of the hologram generation increased significantly. The designed system has three major
parts. These are the client, server and the optics. The client stores a video of a rigid 3D
object. The object consists of a point cloud. Each point in the point cloud has 3D coor-
dinate and color information. Coordinate and the color information of all points in the
3D scene are sent to the server by the TCP/IP protocol in real-time. Upon receiving the
data, server calculates three holograms associated with red, green and blue components
of the 3D scene by using a multi-GPU architecture. Resultant holograms are merged
into a single RGB image and sent to the driver module of the phase-only spatial light
modulators. As mentioned in the previous section, the driver module splits and directs
the red, green and the blue channel holograms to associated SLMs. After the holograms
are loaded to the SLMs, they are illuminated by plane waves obtained from red, green
and blue LEDs (See Fig. 6.6). The propagated light that hits on the surface of the SLMs
is modulated and reflects back. Holographic reconstructions from each SLM are over-
lapped by the help of beam splitters and micro-stages. The resultant reconstructions are
captured by a lensless CCD array.
6.2.1 The Algorithm
For a real-time holographic display system, we need a fast algorithm to generate the
holograms. The so called, coherent stereogram generation method (CS) is one of the fast
algorithms [106]. An improved version of the coherent stereogram algorithm which is
called “accurate compensated phase-added stereogram (ACPAS)” method, is proposed
by Kang [56–58,110,112,113]. The reconstruction from the holograms that are calculated
by ACPAS algorithm closely resembles the reconstructions from the Fresnel hologram.
The computation time for ACPAS is much faster than that of the Fresnel hologram. As
a result, the ACPAS algorithm is suitable for real-time hologram generation.
Fig. 6.7 shows the geometry of coherent stereogram calculation. The ACPAS algo-
rithm first takes a blank 2D plane and partitions it into suitable square size segments.
64

Contribution of each point in the point cloud is approximated as a weighted single com-
plex sinusoid within a segment. The weights are calculated by (ai/ri) exp(jkri) exp(jϕc).
For a single segment in (ξ, η) plane, the holographic fringe pattern of a point cloud in
(x, y, z) volume is found as [110],
IACPAS(ξ, η) =N∑i=1
airi
exp{j2π[(ξ − ξc)fiξcint + (η − ηc)fiηcint] + jkri + jϕc}, (6.1)
where ai is the intensity of an object point, N is the number of object points, k is
the wave number and defined as 2π/λ, where λ is the wavelength of the coherent light.
The distance ri between the i-th object point and the point on the hologram (ξc, ηc) is
[(ξc−xi)2+(ηc−yi)2+z2i ]1/2, where (ξc, ηc) is the center of each segment on the hologram
plane. The spatial phase error compensation ϕc is then expressed as [110]:
ϕc = 2π{(fiξc − fiξcint) (ξc − xi) + (fiηc − fiηcint) (ηc − yi)}, (6.2)
where fiξcint and fiηcint are discrete spatial frequencies and fiξc and fiηc are the continuous
spatial frequencies in cycles per unit length on ξ and η axes, respectively. We can simplify
Eq. 6.1 for a given segment as:
IACPAS(ξ, η) =N∑i=1
Ai(ξ, η) exp(j2πΦi(ξ, η)), (6.3)
where,
Ai(ξ, η) =airi
exp(jkri) exp(jϕc), (6.4)
and,
Φi(ξ, η) = (ξ − ξc)fiξcint + (η − ηc)fiηcint. (6.5)
After this simplification, we observe that Eqn. 6.3 is an N -point inverse discrete Fourier
transform (IDFT). For the computation part we use inverse fast Fourier transform (IFFT).
There are some computer program libraries that calculate FFT, such as “fftw”. FFTW
is a free subroutine library for C. Each segment is processed independently and after that
they are combined to have the resultant fringe pattern. Since the calculation of each
segment is independent of others, they can be handled in parallel. Therefore the algo-
rithm is suitable for parallel processing. The hologram computation algorithm is shown
65

in Figs. 6.7 and 6.8. The resultant fringe pattern is a 2D complex field. Since we use
phase-only spatial light modulators, we extract the phase and discard the amplitude.
6.2.2 The Client
The client computer stores a movie of the 3D model (see Fig. 6.6). The rigid model
consists of a point cloud (discrete points floating in space). In the movie, our model
moves and rotates within a volume. Its track and rotation direction is random and
determined at real-time. To display the model in the client computer we use OpenGL.
The coordinates of the points in the point cloud is being updated at real-time while the
object moves and/or rotates. Then the updated information (3D coordinates and color
information associated with each point) is sent to the server through the internet. There
is not any computational processes running on the client, therefore an average PC is
adequate for this stage.
6.2.3 The Server
The server computer calculates the computer generated holograms (CGHs) in real-time
(see Fig. 6.6). Server receives the 3D coordinate and the color information that is sent
by the client. After the data is received, the holographic fringe pattern for each segment
is calculated as described in Section 6.2.1. GPU architecture is used to take the Inverse
Fast Fourier Transform for each segment in parallel. By this method the calculation
time decreases significantly. In addition, we use multiple GPUs to increase the overall
frame rate of the system. A pipelined real-time computation is achieved by using three
GPU boards. Fig. 6.9 shows the pipelined computation using three GPU boards. As a
consequence of this scheme, while the first GPU calculates the nth frame of the scene,
(n+1)st and (n+2)nd frames are calculated by the second and third GPUs, respectively.
As a result, the frame rate is tripled. The entire hologram generation process is the
same for each color. Holograms for red, green and blue components of the 3D model
is calculated separately and then the phase holograms are extracted from the resultant
66

complex fringe patterns. Then for each frame, three phase holograms (red, green and
blue) are merged into a single RGB bitmap image at real-time and the phase values (0 to
2π radians) are mapped to grayscale (0 to 255). Then the resultant RGB image is sent to
the driver module of the SLMs. The overall system specifications are shown in Table 6.1.
Table 6.1: Overall System Specifications (“Real-time phase-only color holo-graphic video display system using LED illumination,” F. Yaras, H. Kangand L. Onural, Appl. Opt. 48, H48-H53 (2009). c⃝2009 OSA. Reprintedwith permission.)
CPU Two Intel(R) Xeon(R) CPU 2GHzComputing system Main memory 8 GByte
GPU Three NVIDIA GeForce GTX 280Operating system Linux 64 bit (Ubuntu 8.10)
Programming environment Programming language Standard C and CUDALibraries CUFFTW
6.2.4 Optics
Optics and the setup is the last major part of the system (see Fig. 6.10). In this part
there are phase-only SLMs, driver module of the SLMs, a CCD array, beam splitters (half
mirrors), beam expanders, LEDs and spatial filters. The light emerging from the LED
first passes through a spatial filter. Spatial filter contains an objective lens and a pinhole.
The objective lens has 40×magnification factor and the diameter of the pinhole is 200µm.
Incoming light is first focused by the objective lens. Pinhole is then placed at the focal
point of the objective. With the help of this spatial filter high frequency components
including noise is eliminated significantly. In addition, this method increases the spatial
coherence of the illuminating light. The experimental results show that, using a pinhole
with a diameter between 50 and 500µm gives satisfactory results. After passing through
an objective lens and a pinhole, the light becomes divergent. To collect the light and to
have a somewhat uniform plane wave we use beam expanders. Beam expanders can either
expand or shrink the beam by adjusting distance between lenses inside of the expander.
This setup is the same for all color LEDs (red, green and blue) and the resultant plane
67

waves illuminate the phase-only SLMs. The light is modulated and reflected back. At the
reconstruction distance, holographic reconstructions from all three SLMs are overlapped.
Alignments are done by using micro-stages. For this system we again used Holoeye’s
HEO1080P phase-only spatial light modulators [71]. To record the color holographic
reconstruction of the 3D object we used a CCD array. Characteristics of LEDs are shown
in Table 6.2.
Table 6.2: Characteristics of LEDs
Part Number Color Emission Angle∗ Wavelength
EDER-1LA3 Red 120◦ 620 - 630 nm.EDET-1LA2 Green 150◦ 515 - 535 nm.EDEB-1LA5 Blue 150◦ 455 - 475 nm.
∗Emission Angle is the full angle where the intensity of light falls to the half of theon-axis intensity. ( c⃝2009 Edison Opto Corporation. Reprinted with permission)
6.2.5 Results
Table 6.3 shows the performance analysis of the system for a size of two-megapixel holo-
graphic fringe patterns. Results show that when three GPU boards are used in the
system, 3D objects that contain 10000 object points can be displayed in real-time. In
addition, as the number of GPUs increases, the frame rate also increases proportionally.
Therefore, if we add more GPUs we can increase the frame rate accordingly. Figs. 6.11
and 6.12 show a 3D model and the computer reconstruction from the hologram computed
using ACPAS, respectively. We used Rayleigh-Sommerfeld wave propagation algorithm
to obtain the numerical reconstructions from the computer generated holograms. More-
over, we compared the optical reconstructions for laser and LED illumination. Fig. 6.13
shows the results for monochromatic reconstructions (green light). For the laser illumi-
nation case, high speckle noise is observed in the optical reconstruction (see Fig. 6.13(a)).
Reconstruction seems sharper even though the speckle noise degrades the quality. For
the LED illumination case, there is no observable speckle noise in the reconstruction. Al-
though optical reconstructions are slightly blurred, there is no speckle and the quality of
68

the reconstructions is satisfactory (see Fig. 6.13(b)). In our experiments we used Edixeon
1 Watt point type LEDs by Edison Opto Corporation. Fig. 6.14 shows a 2D photograph
of the optical reconstruction taken by a CCD array.
Table 6.3: Performance analysis of the system for two Megapixel hologram out-put (“Real-time color holographic video display system,” F. Yaras, H. Kangand L. Onural, in 3DTV Conference: The True Vision - Capture, Transmis-sion and Display of 3D Video, IEEE, 2009. c⃝2009 IEEE. Reprinted withpermission.)
No of One GPU Two GPUs Three GPUsObj. Points
1 15.8 fps 31.6 fps 47.5 fps10 15.7 fps 31.4 fps 47.2 fps100 15.3 fps 30.7 fps 46.1 fps1000 13.5 fps 27.0 fps 40.5 fps10000 6.8 fps 13.6 fps 20.5 fps
In this section, we presented a real-time multiple SLM color holographic display sys-
tem. It is a promising step for future 3DTV applications. However, we still need to
increase the hologram size to have a more comfortable 3D observation experience. For
this purpose we present a wide viewing angle multiple SLM holographic display systems
in Sec. 6.3 and Sec. 6.4.
69

BS
D
BE BE BE
R
B
G
CCD
N
Figure 6.6: Overall setup (BE: Beam expander, R: Red SLM, B: Blue SLM, G: GreenSLM, D: Driver unit of SLMs, N: Network, BS: Non-polarized beam splitter.) (“Real-timephase-only color holographic video display system using LED illumination,” F. Yaras, H.Kang and L. Onural, Appl. Opt. 48, H48-H53 (2009). c⃝2009 OSA. Reprinted withpermission.)
70

IFFT
IFFT
IFFT
IFFT
IFFT
Point cloud
Hologram HologramSpectrum
Figure 6.7: Hologram calculation algorithm. (“Real-time phase-only color holographicvideo display system using LED illumination,” F. Yaras, H. Kang and L. Onural, Appl.Opt. 48, H48-H53 (2009). c⃝2009 OSA. Reprinted with permission.)
+
=
),( ηξ1A
),( ηξ2A
),( ηξNA
Resultant holographic fringe pattern for a segment
+
+
Figure 6.8: Illustration of N-point DFT as a weighted sum of complex sinusoids. (“Real-time phase-only color holographic video display system using LED illumination,” F.Yaras, H. Kang and L. Onural, Appl. Opt. 48, H48-H53 (2009). c⃝2009 OSA. Reprintedwith permission.)
71

Frame #1
Frame #2
Frame #3
Frame #4
Frame #5
Frame #6
Frame #7
Frame #8
Frame #9
GPU #1
GPU #2
GPU #3
Time
#1 #2 #3 #4 #5 #6 #7 #8Displaying frame number
#9
Figure 6.9: Pipelined computation using GPUs (“Real-time color holographic video dis-play system,” F. Yaras, H. Kang and L. Onural, in 3DTV Conference: The True Vision- Capture, Transmission and Display of 3D Video, IEEE, 2009. c⃝2009 IEEE. Reprintedwith permission.)
Generationof
3D object points
Generationof
fringe pattern
TCP/IPHolographic
display
3D points
Video
Fringe pattern
Lap-Top Desk-Top OpticsLap-Top Desk-Top OpticsClient Server
Figure 6.10: The end-to-end system (“Real-time color holographic video display system,”F. Yaras, H. Kang and L. Onural, in 3DTV Conference: The True Vision - Capture,Transmission and Display of 3D Video, IEEE, 2009. c⃝2009 IEEE. Reprinted with per-mission.)
72

Figure 6.11: A rigid color 3D object (“Real-time phase-only color holographic videodisplay system using LED illumination,” F. Yaras, H. Kang and L. Onural, Appl. Opt.48, H48-H53 (2009). c⃝2009 OSA. Reprinted with permission.)
Figure 6.12: Computer reconstruction using the ACPAS algorithm (“Real-time phase-only color holographic video display system using LED illumination,” F. Yaras, H. Kangand L. Onural, Appl. Opt. 48, H48-H53 (2009). c⃝2009 OSA. Reprinted with permis-sion.)
73

(a)
(b)Figure 6.13: Single color reconstruction (a) by green laser (b) by green LED (“Real-timephase-only color holographic video display system using LED illumination,” F. Yaras,H. Kang and L. Onural, Appl. Opt. 48, H48-H53 (2009). c⃝2009 OSA. Reprinted withpermission.)
74

Figure 6.14: Optical reconstruction of a single frame of the 3D object (“Real-time phase-only color holographic video display system using LED illumination,” F. Yaras, H. Kangand L. Onural, Appl. Opt. 48, H48-H53 (2009). c⃝2009 OSA. Reprinted with permis-sion.)
75

6.3 Multi-SLM holographic display system with a
planar configuration
As mentioned in Chapter 4, if the hologram size is increased, the 3D viewing comfort
will also be enhanced. In order to increase the hologram size, we need larger size spatial
light modulators. However, commercially available spatial light modulators have limited
size due to various physical restrictions. Therefore, we propose a multi-SLM holographic
display system. A laboratory prototype is implemented. In this prototype, we used six
phase-only SLMs, each having 1920 × 1080 pixels with a pixel period of 8µm. Those
six SLMs are tiled in a three by two setup. With the help this scheme, we can display
larger size holograms. All SLMs are aligned by using some optical elements and micro-
stages. After the alignment we calculate the computer generated holograms for the larger
display. The calculated large hologram is then partitioned into six sub-holograms in order
to match with the tiled SLMs. As discussed in the previous sections, driver module of the
SLMs directs the sub-holograms to the associated SLMs. SLMs are illuminated by plane
waves obtained from LEDs. Therefore, reconstructions can be observed by the naked
eye. Since we have a larger hologram size, the field of view is also increased. Thus, the
observer can see the optical reconstructions binocularly. Reconstructions are ghost-like
3D images floating in the space.
6.3.1 Advantages of using multiple SLMs
The spatial frequency that can be supported by the spatial light modulators is limited
because of their pixelated structures. If we denote the maximum spatial frequency of
the hologram as fmax, the local maximum diffraction angle for Shannon type recovery
(low-pass filtering) can be calculated as:
θmax = sin−1(λfmax), (6.6)
76

Lig
ht il
lum
inat
ion
Field of view for three SLMs
Reconstruction of a single point
HS
Field of view for a single SLM
θ ′
SLMs
Figure 6.15: Increase in the field of view when multiple SLMs are used (“Multi-SLMholographic display system with planar configuration,” F. Yaras, H. Kang and L. Onural,in 3DTV Conference: The True Vision - Capture, Transmission and Display of 3D Video,IEEE, 2010. c⃝2010 IEEE. Reprinted with permission.)
where;
fmax =1
2∆p
. (6.7)
Here ∆p denotes the pixel period of the SLM. The reconstruction of a single point in the
reconstruction plane is shown in Fig. 6.15. Here in the figure, the field of view denotes an
area on the observation plane. Therefore, within the field of view the entire object can be
seen while the full bandwidth of the SLM is utilized. As we move outside of the field of
view, either some parts of the reconstruction will not be visible or the bandwidth used for
reconstruction decreases. Reduction in bandwidth affects the quality and sharpness of the
reconstruction. As the figure depicts, field of view increases when multiple spatial light
modulators are used in planar configuration. Please note that the full bandwidth of some
of the SLMs are not utilized in this configuration (i.e. θ′ < θmax for centered SLMs). As
mentioned in Chapter 4, we need larger hologram sizes to support higher diffraction angles
for moving observers. For small size holograms, binocular vision may not be possible and
this leads to an insufficient parallax for the holographic reconstructions. Such small size
77

holograms are inevitable if we use a single spatial light modulator. However if we use
multiple SLMs, we can increase the holograms size; thus, the field of view. In addition,
since hologram size is increased, we can reconstruct larger size objects compared to the
single SLM case (see Fig. 6.16). If we use N spatial light modulators side by side, the
space for the holographic reconstruction can be calculated as:
SR = N × SSLM + 2DR tan(θmax), (6.8)
where DR is the distance between the SLMs and the reconstruction, and SSLM is the size
of a single SLM. It is shown that each addition SLM increases the available space for the
reconstruction.
Lig
ht il
lum
inat
ion
Reconstruction space for a single SLM
HS
maxθ
maxθ
maxθ
maxθReconstruction space for three SLMs
RD
Figure 6.16: Increase in the reconstruction space when multiple SLMs are used (“Multi-SLM holographic display system with planar configuration,” F. Yaras, H. Kang and L.Onural, in 3DTV Conference: The True Vision - Capture, Transmission and Display of3D Video, IEEE, 2010. c⃝2010 IEEE. Reprinted with permission.)
Another advantage of multiple SLM configurations is related to the quality of the re-
constructions. When multiple SLMs are used, quality of the reconstructions significantly
increases. Fig. 6.17 illustrates the effect of using multiple SLMs on the quality of the
78

reconstruction. The number of pixels that contributes to the reconstruction of a single
point in Fig. 6.17b is significantly larger than that of the one in Fig. 6.17a. In the figures,
the zone whose corners are the point P and the two ends of the display denotes the field
where all the pixels can contribute to the reconstruction. We use the point P as a refer-
ence point for the size of the reconstructions. Since both objects in Fig. 6.17 (a) and (b)
are equally distant from the point P and the apical angles at the point P are the same,
we assure that the reconstruction size of both objects are the same. Although the size of
the reconstructed objects are the same, the number of pixels contributed to the recon-
struction is different. As in Chapter 4, we can also discuss the reconstruction quality in
terms of space-bandwidth product (SBP). Here the bandwidth is limited by the maximum
band supported by the SLM. In other words full band is used for the reconstructions.
Therefore, the limiting factor of the quality of the reconstruction is the number of pixels
that are used for the reconstructions. Therefore, if we use more SLMs, we can obtain
higher quality holographic reconstructions. There is also a trade off between the number
of pixels used for reconstruction and the field of view. If we sacrifice from the quality a
little, we can increase the field of view (see Fig. 6.22).
Yet another advantage of multiple SLM configurations is ability to reconstruct 3D
objects larger than the SLM size [54]. Such methods are discussed in Section 5. Those
reconstructions can be totally visible if we use a diffuser or a screen at the reconstruction
plane. However, if we try to look at the reconstructions directly by the naked eye, we can
only see a part of it (see Fig. 6.18). The reconstructions can only be seen totally if the
reconstruction is in the viewable area. One possible way to increase the reconstruction
size is therefore to increase the hologram size (see Fig. 6.19).
6.3.2 The Gap Problem
Although tiling the SLMs side by side is advantageous, it may not be possible due to
some physical difficulties. As shown in Fig. 5.3, there is a metallic mount around the
spatial light modulators. Therefore, if we put them side by side, the mount yields gaps
in the field of view. The ideal system depicted in Fig. 6.15 may be no longer feasible and
79

it may turn out to be as in Fig. 6.20. To solve this problem we propose a method that
uses a beam splitter (half-mirror) to fill the gap between two SLMs by an image of the
third one (see Fig. 6.21). For other multiple SLM designs and prototypes we use similar
approaches to solve this gap problem. The usage of the beam splitters to eliminate the
gap between SLMs in the holographic display systems reported in [59,146,147].
6.3.3 Setup and Hologram Generation
For our laboratory prototype, we used six phase-only spatial light modulators manufac-
tured by HoloEye [71]. The top view of the setup is shown in Fig. 6.23(a). As in the
previous experiments, we used a spatial filter to filter out the noise in the illuminat-
ing beam. After the spatial filter, the divergent beam collimated by lenses to obtain a
uniform plane wave illumination. Here we use a LED as the light source. The plane
wave illumination is directed to the SLMs with the help of optics, such as half-mirrors
and mirrors. We calculate the large hologram by using the Rayleigh-Sommerfeld wave
propagation algorithm [10]. The number of pixels in the large hologram is 5760 × 2160
(the same size with the display, see Fig. 6.23(b)). Then we partition the hologram into
sub-holograms with a size of 1920 × 1080 pixels each. Upper row and the lower row
are constructed by different beam-splitters, separately. Then the resultant two rows are
combined by the third beam-splitter.
6.3.4 Experimental Results
We used a square pyramid as a 3D model for our experiments. The model is shown in
Fig. 6.24. The optical reconstruction obtained from the developed system is shown in
Fig. 6.25. The photographs are taken by a Canon 5D Mark-II camera. The reconstruc-
tion distance is 0.5m. Fig. 6.25 (a), (b) and (c) show the left, front and right view of
the reconstructed 3D object, respectively. As depicted by the figures, the field of view
increases when the hologram size increases, as expected. Thus, if use more SLMs, we
80

can improve the 3D perception. We conclude that even with three SLMs along the hor-
izontal direction, the field of view is increased, significantly. Results motivated us to
further increase the field of view by increasing the number of SLMs and also try different
configurations. Therefore this leads us to next step which is the circularly configured
phase-only SLMs.
81

Lig
ht il
lum
inat
ion
HS
Lightillumination
SLM
HS
D′
D′
maxθ
maxθ
P
P
(a)
(b)
Observer
D ′′
Observer
D ′′
Figure 6.17: Increase in the quality when multiple SLMs are used. Only those SLM pixelswithin the dotted cone contributed to the image (“Multi-SLM holographic display systemwith planar configuration,” F. Yaras, H. Kang and L. Onural, in 3DTV Conference: TheTrue Vision - Capture, Transmission and Display of 3D Video, IEEE, 2010. c⃝2010 IEEE.Reprinted with permission.)
82

Figure 6.18: Illustration of larger object reconstruction with a single SLM (“Circularlyconfigured multi-SLM holographic display system,” F. Yaras, H. Kang and L. Onural, in3DTV Conference: The True Vision - Capture, Transmission and Display of 3D Video,IEEE, 2011. c⃝2011 IEEE. Reprinted with permission.)
Figure 6.19: Illustration of larger object reconstruction with multiple SLMs (“Circularlyconfigured multi-SLM holographic display system,” F. Yaras, H. Kang and L. Onural, in3DTV Conference: The True Vision - Capture, Transmission and Display of 3D Video,IEEE, 2011. c⃝2011 IEEE. Reprinted with permission.)
83

Lig
ht il
lum
inat
ion
Field of view for three SLMs
Reconstruction of a single point
HS
θ ′
SLMs
Gaps
Visible
Figure 6.20: Discontinuous field of view due the mount of the SLM.
Figure 6.21: Removing the gaps by using a beam-splitter (“Circularly configured multi-SLM holographic display system,” F. Yaras, H. Kang and L. Onural, in 3DTV Conference:The True Vision - Capture, Transmission and Display of 3D Video, IEEE, 2011. c⃝2011IEEE. Reprinted with permission.)
84

Lig
ht il
lum
inat
ion
HSmaxθmaxθ
Observation plane
Field of view for the red object
Field of view for the blue object
Figure 6.22: Field of view increases when object gets closer to the SLM (“Multi-SLMholographic display system with planar configuration,” F. Yaras, H. Kang and L. Onural,in 3DTV Conference: The True Vision - Capture, Transmission and Display of 3D Video,IEEE, 2010. c⃝2010 IEEE. Reprinted with permission.)
85

LED or Laser
Spatial Filter
Beam Expander
Plane WaveSLMs for upper row
SLMs for lower row
Half Mirror
MirrorMirror
Upper row
Lower rowFront View
(a) (b)
Half Mirror
5760 pixels
2160
pix
els
1920x1080 1920x1080 1920x1080
1920x1080 1920x1080 1920x1080
Figure 6.23: (a) Top view of the setup, (b) front view of the tiled SLMs (“Multi-SLMholographic display system with planar configuration,” F. Yaras, H. Kang and L. Onural,in 3DTV Conference: The True Vision - Capture, Transmission and Display of 3D Video,IEEE, 2010. c⃝2010 IEEE. Reprinted with permission.)
Figure 6.24: Rigid 3D model of a square pyramid (“Multi-SLM holographic display systemwith planar configuration,” F. Yaras, H. Kang and L. Onural, in 3DTV Conference: TheTrue Vision - Capture, Transmission and Display of 3D Video, IEEE, 2010. c⃝2010 IEEE.Reprinted with permission.)
86

(a) (b) (c)
Figure 6.25: Optical reconstructions: (a) left, (b) front and (c) right view (“Multi-SLMholographic display system with planar configuration,” F. Yaras, H. Kang and L. Onural,in 3DTV Conference: The True Vision - Capture, Transmission and Display of 3D Video,IEEE, 2010. c⃝2010 IEEE. Reprinted with permission.)
87

6.4 Circular Holographic Video Display System
In the previous section, we demonstrate the advantages of using multiple SLMs in the
planar configuration. The results motivated us to build better holographic video display
configurations. As discussed in Chapter 4, in order to reduce the bandwidth requirements
a circular configuration is needed. Some parts of this section is based on our publications
[138] and [137].
6.4.1 Field of View in Circular Holographic Displays
Field of view is an important feature for all types of displays. Larger field of view values
bring more freedom to the location of the observers. This is also true for commercially
available 2D LCD displays (e.g. PC monitors and TVs). However those kind of displays
use diffused light sources at the back of the LCD panels; therefore, they have a wide field
of view. For the holographic displays, diffused light sources may not be suitable, since
they randomize the phase information; and therefore, the output light is spread to all
directions equally. As a result, there would not be any directional variation. Since the
directional information is crucial for 3D visualization, such commercial systems can not be
used in 3D display systems. Therefore, we need to use somewhat coherent light sources in
holographic display systems. We used either laser or LED illumination in our holographic
display prototypes. Temporal coherence of the LEDs and their efficiency has been already
discussed in previous sections and in our publications [56]. The field of view is restricted
by the size and the pixel period of the SLMs. For a single SLM, the relation between the
field of view, the size and the diffraction angle is depicted in Fig. 6.26a. In this figure,
the field of view denotes an area on the observation plane. Note that if observer is inside
the field of view, the entire object can be seen while the full bandwidth of the SLM is
used. If the observer moves outside of the borders of the field of view, some parts of the
reconstruction may not be seen. In addition since the bandwidth is not used fully, the
quality and therefore the sharpness of the reconstructions may degrade. As discussed in
the previous section, since the field of view for a single SLM is not enough for comfortable
88

3D perception, one alternative is to use multiple SLMs in planar configuration. Although
such configuration has advantages over the single SLM case, it may be inadequate in
some circumstances. For example, as depicted in Fig. 6.26b, if the full bandwidth of only
the middle SLM is used for the reconstruction, then there is no contribution from other
SLMs to the reconstruction. Therefore we propose a circular configuration of SLMs to
increase the field of view in holographic display systems, see Fig. 6.26c. As shown in the
figure, the field of view is increased significantly. As a consequence of this configuration,
the observer can move and rotate around the reconstructions and this will yield a better
3D perception. Meanwhile, for the illustration purposes, in the figures we discard the
effect of the mount of the SLMs. The gap problem that results from the mount will be
discussed in the Section 6.4.2.
6.4.2 Some Laboratory Prototypes
In the first prototype, we used several beam-splitters (half-mirrors) to combine six phase-
only spatial light modulators in a circular configuration. Fig. 6.27 shows the schematic
of the setup. Here in this setup, we use cube beam-splitters to solve the gap problem. As
a consequence of this method three SLMs are tiled side by side. (Fig. 6.21 shows how a
beam-splitter is used to combine three SLMs without any gap between them.) Although
Fig. 6.21 demonstrates an example of a planar configuration, we can use the same idea for
a circular configuration, as well. All we have to do is to rotate the SLMs appropriately.
After we have two sets of SLMs (three SLMs for each set), they are combined by a large
half-mirror. The resultant display size becomes 11520 × 1080 pixels and the increase in
the field of view illustrated in Fig. 6.27. The observer can move and rotate around the
reconstruction within the limits of the resultant field of view.
In this system, each SLMs is rotated by 1◦ with respect to the next SLM. SLMs can
support rotations up to 3◦. Alignments and adjustments are crucial while assembling
the setup. Fine adjustments may be needed for a better 3D perception. Therefore it
is better first to mount SLMs onto micro-stages. Heights of the SLMs from the optic
table should be the same and the vertical edges of the SLMs should be parallel to the
89

surface of the optical table. In addition, direction of the normal vectors of the SLM
surfaces should be the same. Centers of the SLMs should be on the same circle and there
should not be any gap between the SLMs. After all adjustments are done carefully, the
alignment is checked by holographic reconstruction of a single point object. An optimum
distance should be calculated. First find the intersection point of all normal vectors of
the SLMs. The optimum distance is the distance between the middle point of the surface
of an SLM and the intersection point. After we find the optimum distance, we should
calculate a hologram of a point and the reconstruction distance should be equal to the
optimum distance. If all adjustments are correct, reconstructions from all SLMs (from
hologram of a single point) should overlap at the same location in space, i.e. at the
optimum distance. If they do not overlap properly, subsequent fine adjustments should
be done. The optimum distance in this prototype is 400mm. The front view of the
holographic display is shown in Fig. 6.28. The continuous array of six phase-only spatial
light modulators can be seen in Fig. 6.27. The total number of pixels of the resultant
system is 11520 × 1080. Fig. 6.29 shows a photograph of the top view of the setup. In
the figure, we can see two beam-splitters and a large half-mirror.
For this prototype, we used two different computer generated 3D model. One of
them is a wire-frame cube shaped object (see Fig. 6.30). The model is a point cloud.
The computer generated holograms are calculated by using the Rayleigh-Sommerfeld
light propagation algorithm [10]. Each point in the point cloud first is propagated to the
hologram plane and then the resultant 2D complex fields are superposed. Then we discard
the amplitude (since our SLMs are phase-only) and save the phase values as a bitmap
grayscale image by mapping the range [−π : π] to [0 : 255]. We perform this procedure
for all SLMs just by rotating the 3D object by the corresponding rotation angle. When
we rotate the object, we can use the Rayleigh-Sommerfeld light propagation algorithm for
parallel planes. Otherwise, one should use the propagation algorithms for tilted planes
[29,30,148]. Since our SLMs are rotated by 1◦ with respect to the next SLM, the rotation
angles for are chosen as: −2.5◦, −1.5◦, −0.5◦, +0.5◦, +1.5◦ and +2.5◦.
An optical reconstruction of 3D wire-frame model of a cube is shown in Fig. 6.31.
90

The pictures in (a), (b) and (c) are taken from left, center and right, respectively. Here
in this figure, reconstructions are captured when laser illumination is used. However,
to avoid eye hazard, LED illumination is also used as an alternative source and such
reconstructions are observed by naked eye. With the help of the resultant wide field of
view, reconstructions are observed binocularly. Reconstruction distance is approximately
400mm. Results show that the total field of view is significantly increased compared to
the single SLM case. Although the total field of view of this prototype is about 6◦, it can
be increased up to 18◦ since we do not use all the available rotation support of the SLMs
(i.e 3◦ for each SLM).
In another optical reconstruction we used a 3D wire-frame of a pyramid shaped object
(see Fig. 6.24). In this experiment, we also constructed a physical wire-frame pyramid.
The size and the shape of the physical pyramid and the optical reconstruction are the
same. Then we place the physical model just next to the optical reconstruction and at
the same distance to the display. Fig. 6.32 shows the optical reconstructions from left,
front and right views. The purpose of the physical wire-frame object is to show that the
parallax of the holographic display system is correct.
Yet in another circularly configured multi-SLM laboratory prototype we used nine
phase-only spatial light modulators. As in the previous prototypes, the gap problem also
exists in this setup (see Fig. 6.33). We again solved this problem by using a single beam-
splitter (half-mirror) instead of using several of them. This brings an advantage while
performing fine adjustments since each additional optical component brings complexity
to the system. The schematic of the laboratory prototype is shown in Fig. 6.34. In
addition, a cone mirror is used in the illumination part of the system. The design of
the illumination part with a cone mirror and its analysis is performed together with Dr.
Hoonjong Kang [138]. The cone mirror helps us to direct the illuminating light coming
from the light source to 360◦. Therefore, all SLMs are illuminated by using only a single
light source. However, due to the shape of the cone mirror an astigmatic illumination is
formed, i.e. the radius of curvatures of the illuminating light in vertical and horizontal
axes are not equal. Fig. 6.35b shows the cross-section of the illuminating light in vertical
91
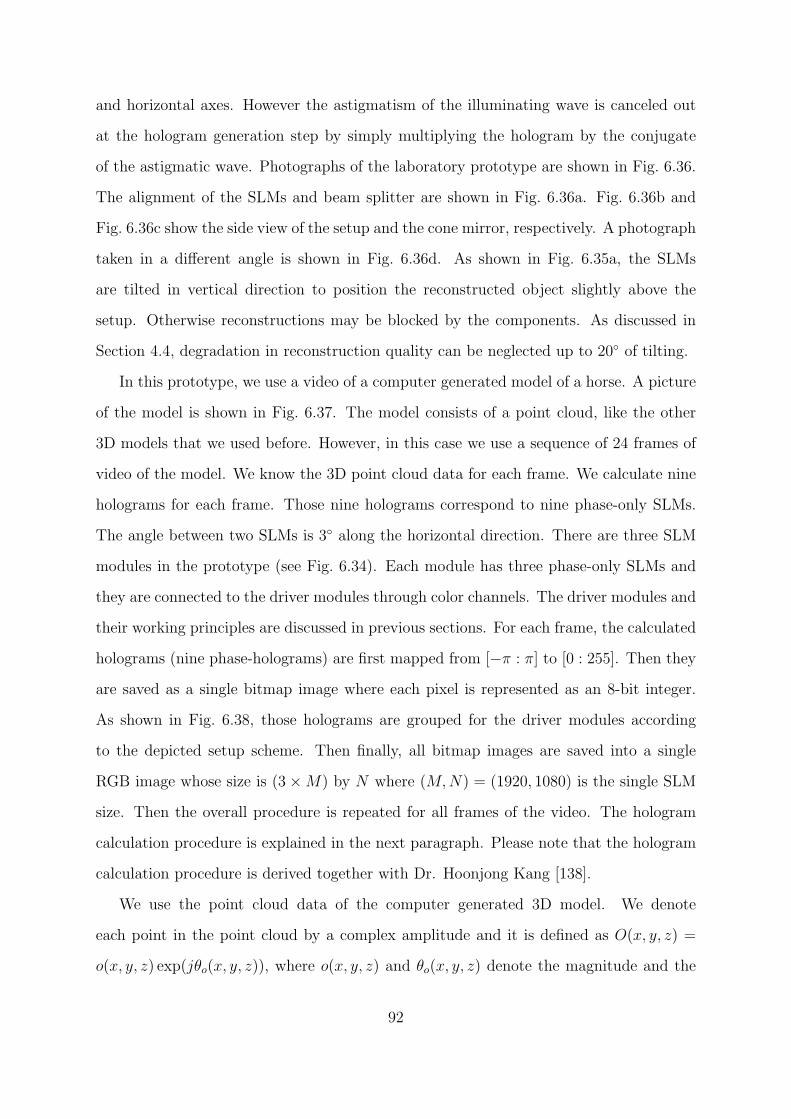
and horizontal axes. However the astigmatism of the illuminating wave is canceled out
at the hologram generation step by simply multiplying the hologram by the conjugate
of the astigmatic wave. Photographs of the laboratory prototype are shown in Fig. 6.36.
The alignment of the SLMs and beam splitter are shown in Fig. 6.36a. Fig. 6.36b and
Fig. 6.36c show the side view of the setup and the cone mirror, respectively. A photograph
taken in a different angle is shown in Fig. 6.36d. As shown in Fig. 6.35a, the SLMs
are tilted in vertical direction to position the reconstructed object slightly above the
setup. Otherwise reconstructions may be blocked by the components. As discussed in
Section 4.4, degradation in reconstruction quality can be neglected up to 20◦ of tilting.
In this prototype, we use a video of a computer generated model of a horse. A picture
of the model is shown in Fig. 6.37. The model consists of a point cloud, like the other
3D models that we used before. However, in this case we use a sequence of 24 frames of
video of the model. We know the 3D point cloud data for each frame. We calculate nine
holograms for each frame. Those nine holograms correspond to nine phase-only SLMs.
The angle between two SLMs is 3◦ along the horizontal direction. There are three SLM
modules in the prototype (see Fig. 6.34). Each module has three phase-only SLMs and
they are connected to the driver modules through color channels. The driver modules and
their working principles are discussed in previous sections. For each frame, the calculated
holograms (nine phase-holograms) are first mapped from [−π : π] to [0 : 255]. Then they
are saved as a single bitmap image where each pixel is represented as an 8-bit integer.
As shown in Fig. 6.38, those holograms are grouped for the driver modules according
to the depicted setup scheme. Then finally, all bitmap images are saved into a single
RGB image whose size is (3×M) by N where (M,N) = (1920, 1080) is the single SLM
size. Then the overall procedure is repeated for all frames of the video. The hologram
calculation procedure is explained in the next paragraph. Please note that the hologram
calculation procedure is derived together with Dr. Hoonjong Kang [138].
We use the point cloud data of the computer generated 3D model. We denote
each point in the point cloud by a complex amplitude and it is defined as O(x, y, z) =
o(x, y, z) exp(jθo(x, y, z)), where o(x, y, z) and θo(x, y, z) denote the magnitude and the
92

phase of the object wave at the source, respectively. Since we use an astigmatic diverging
beam to illuminate the SLMs, thus holograms, we need a correction term to cancel out the
effect while computing the holograms. Since the illumination waves can be expressed as a
separable function, we can define horizontal and vertical correction terms independently.
For the horizontal direction, center of the illuminating wave is the center of the cone
mirror, due to radial reflection (see Fig. 6.35). The distance between the center of the
cone mirror and the SLM is denoted as Dl. In the horizontal direction, the illuminating
wave P (ξ), is approximately given as,
P (ξ) = exp
(jk
ξ2
2Dl
). (6.9)
Here we assume a paraxial approximation and since the SLMs are small the approximation
is valid. For the vertical direction, the cone mirror behaves like a planar mirror. Thus,
center of the incoming light is not effected. However the size of the cone mirror is smaller
than height of the SLM. If we use a plane wave illumination for the vertical direction,
illuminating wave might not cover whole SLM. Therefore we need a divergent illuminating
beam also in vertical direction. The center of the vertical illuminating wave is Dp +Dl
(see Fig. 6.35). Therefore, the vertical illuminating wave, P (η), is given by:
P (η) = exp
(jk
(η + SH/2)2
2(Dp +Dl)
), (6.10)
where, Dp is the distance between the center of the vertical illumination wave and the cone
mirror, and SH is the height of the SLM. In addition, there exists a strong undiffracted
beam at the reconstructions. We separate the reconstruction from the undiffracted beam
by using off-axis holography. Additional carrier frequency along the vertical direction is
applied and it is given by:
Pt(η) = exp(jkη sin(θt)
), (6.11)
where, sin(θt) is the angle between the reconstructed beam and the undiffracted beam.
Thus, the overall correction term becomes:
P (ξ, η) = exp
(jk
ξ2
2Dl
)exp
(jk
(η + SH/2)2
2(Dp +Dl)+ jkη sin(θt)
). (6.12)
93

As in the previous experiments, we use the Rayleigh-Sommerfeld light propagation al-
gorithm [10]. The resultant complex field for the point cloud data for larger distances,
which means evanescent waves do not exist, yields:
S(ξ, η) =N∑p=1
O(xp, yp, zp)exp(jkrp)
rp, (6.13)
where, p is the index of the points, k is the wavenumber (k = 2π/λ, where λ is the
wavelength), N is the number of points in the point cloud of the three-dimensional
computer graphic model. Here rp denotes the distance between pth point and the hologram
plane and defined as:
rp = [(ξ − xp)2 + (η − yp)
2 + z2p ]1/2 . (6.14)
The resultant complex field on the hologram plane (ξ, η plane) after multiplying by the
correction term becomes:
G(ξ, η) = P (ξ, η)N∑p=1
O(xp, yp, zp)exp(jkrp)
rp. (6.15)
Moreover, the pixelated complex field on the hologram plane is calculated by:
g(m,n) , G
((m− (M + 1)
2
)∆m,
(n− (N + 1)
2
)∆n
), (6.16)
where, m ∈ [1, 1920] and n ∈ [1, 1080], ∆m and ∆n are pixel periods and M and N are
number of columns and rows of the pixelated complex field. For our prototypeM = 1920
and N = 1080.
Fig. 6.39 shows the optical reconstruction for a single frame for different viewing
angles. The distance between the SLM and the center of the cone mirror, Dl, is 0.3m.
The distance between the SLM and the center of the illuminating wave, Dp + Dl, is
0.55m. The reconstruction distance is about 0.35m. The size of the reconstruction is
about 1cm. For the illustration purposes, we use laser illumination and the wavelength
of the green laser is 532nm. As an alternative, we use LED illumination and observers
can see the reconstructions by naked eye. The total number of pixels in the resultant
holographic video display system is 17280 × 1080. Total field of view is about 24◦ and
observer can move and rotate around the holographic reconstructions, i.e. a ghost-like
3D object floating in space.
94

Lightillumination
SLM
HS
D′
maxθ
(a)
Field of view for single SLM
D
Lig
ht il
lum
inat
ion
HS
(b)
maxθ
D
Field of view for multiple SLMs (planar array)
D′
Lig
ht il
lum
inat
ion
HS
(c)
maxθ
D
Field of view for multiple SLMs (circular array)
D′
.
maxθ
Figure 6.26: Field of view for (a) single SLM, (b) multiple SLMs in planar configuration,(c) multiple SLMs in circular configuration. (“Circular Holographic Video Display Sys-tem,” F. Yaras, H. Kang and L. Onural, Optics Express vol. 19, no. 10, pp.9147-9156,2011. c⃝2011 OSA. Reprinted with permission.)
95

Figure 6.27: Schematic of the setup (“Circularly configured multi-SLM holographic dis-play system,” F. Yaras, H. Kang and L. Onural, in 3DTV Conference: The True Vision- Capture, Transmission and Display of 3D Video, IEEE, 2011. c⃝2011 IEEE. Reprintedwith permission.)
96

Figure 6.28: Front view of the display (“Circularly configured multi-SLM holographicdisplay system,” F. Yaras, H. Kang and L. Onural, in 3DTV Conference: The TrueVision - Capture, Transmission and Display of 3D Video, IEEE, 2011. c⃝2011 IEEE.Reprinted with permission.)
97

Figure 6.29: Top view of the display (“Circularly configured multi-SLM holographicdisplay system,” F. Yaras, H. Kang and L. Onural, in 3DTV Conference: The TrueVision - Capture, Transmission and Display of 3D Video, IEEE, 2011. c⃝2011 IEEE.Reprinted with permission.)
98

Figure 6.30: Computer generated wire-frame 3D model of a cube (“Circularly configuredmulti-SLM holographic display system,” F. Yaras, H. Kang and L. Onural, in 3DTVConference: The True Vision - Capture, Transmission and Display of 3D Video, IEEE,2011. c⃝2011 IEEE. Reprinted with permission.)
Figure 6.31: Optical reconstruction of 3D wire-frame model of a cube. (a) Left, (b) cen-ter, and (c) right views (“Circularly configured multi-SLM holographic display system,”F. Yaras, H. Kang and L. Onural, in 3DTV Conference: The True Vision - Capture,Transmission and Display of 3D Video, IEEE, 2011. c⃝2011 IEEE. Reprinted with per-mission.)
99

Figure 6.32: Optical reconstructions from a curved array of SLMs: (a) left, (b) frontand (c) right view (“Digital holographic Three-dimensional video displays,” L. Onural,F. Yaras and H. Kang, Proceedings of the IEEE , vol.99, no.4, pp.576-589, April 2011.c⃝2011 IEEE. Reprinted with permission.)
100

Observer
Viewable area
SLM(active area)
Mount
Circularly tiled SLMs
Reconstruction
Figure 6.33: Discontinuous field of view due the frame of the SLMs. (“Circular Holo-graphic Video Display System,” F. Yaras, H. Kang and L. Onural, Optics Express vol.19, no. 10, pp.9147-9156, 2011. c⃝2011 OSA. Reprinted with permission.)
Beam splitterCone mirror
Image of the Cone mirror
1 35
7
92
4
6
8
SLM Module 3
SLM Module 1
SLM Module 2
Figure 6.34: Top view of the laboratory prototype (“Circular Holographic Video DisplaySystem,” F. Yaras, H. Kang and L. Onural, Optics Express vol. 19, no. 10, pp.9147-9156,2011. c⃝2011 OSA. Reprinted with permission.)
101

Figure 6.35: (a) Side view of the experimental setup. (b) Vertical and horizontal il-lumination (“Circular Holographic Video Display System,” F. Yaras, H. Kang and L.Onural, Optics Express vol. 19, no. 10, pp.9147-9156, 2011. c⃝2011 OSA. Reprintedwith permission.)
102

(a) (b)
(d)(c)
Figure 6.36: Pictures of (a) SLMs and SLM Modules, (b) side view of the setup, (c) conemirror and (d) SLMs and beam splitter (“Circular Holographic Video Display System,”F. Yaras, H. Kang and L. Onural, Optics Express vol. 19, no. 10, pp.9147-9156, 2011.c⃝2011 OSA. Reprinted with permission.)
Figure 6.37: Single frame of the video of the 3D horse model (“Circular HolographicVideo Display System,” F. Yaras, H. Kang and L. Onural, Optics Express vol. 19, no.10, pp.9147-9156, 2011. c⃝2011 OSA. Reprinted with permission.)
103

1 2 3 4 5 6 7 8 9
1
2
3
5
7
9
4
6
8
To SLM Driver Module 1
To SLM Driver Module 2
To SLM Driver Module 3
RGB Image
Red Channel (8-bit)
Green Channel (8-bit)
Blue Channel (8-bit)
RGB Image (24-bit)
Figure 6.38: Writing nine holograms on a single bitmap image (“Circular HolographicVideo Display System,” F. Yaras, H. Kang and L. Onural, Optics Express vol. 19, no.10, pp.9147-9156, 2011. c⃝2011 OSA. Reprinted with permission.)
(a)
Figure 6.39 (Continues from next page)
104

(b)
(c)
Figure 6.39: (Continues from previous page) Optical reconstructions for a single frame for(a) 0 degree, (b) 12 degrees and (c) 24 degrees. (The business card with the rectangularaperture is placed both as a size reference and to block distracting optical componentviews.) (“Circular Holographic Video Display System,” F. Yaras, H. Kang and L. Onural,Optics Express vol. 19, no. 10, pp.9147-9156, 2011. c⃝2011 OSA. Reprinted withpermission.)
105

Chapter 7
Conclusions
The commercially available spatial light modulators are not adequate for future 3DTV
applications. Their small size restricts the comfortable 3D perception in holographic
reconstructions. However, due to various physical restrictions size of the SLMs can
not be increased indefinitely. Therefore, the size problem should be solved to have a
better holographic displays. For this reason, first a quality assessment is needed for
holographic reconstructions. For the quality assessment of the holographic displays the
space-bandwidth product (SBP) is a good metric. Higher SBP provides higher recon-
struction quality. The limitations on the bandwidth and the size of the holographic
displays are investigated. The bandwidth restriction results in an equivalent propagation
angle restriction of the plane waves that are emerging from the hologram. Higher band-
width means higher propagation angles of the plane waves. Since high propagation angles
carry the high frequency contents of the reconstructions, they affect the “sharpness” of
the reconstructed object. Such a bandwidth restriction is equivalent to low-pass filtering
the reconstructed image. If we assume that the pixel periods of the SLMs are not the
limiting factor for the bandwidth of the hologram and thus the high propagation angles,
then the human visual system restricts the bandwidth. Minimum hologram size for a
stationary observer is calculated based on such a restriction. In addition, if the observer
is free to move along the lateral direction, the needed hologram size increases accordingly.
If the display system should support also the rotational motion of the human observer,
106

the bandwidth and the size of the hologram both increase. Therefore, for a comfortable
viewing angle, the space-bandwidth product has to be significantly larger than that of the
stationary observer case. Alternatively, large space-bandwidth product may be relieved
by using circularly configured multiple SLM holographic display systems.
To implement such systems, several holographic display systems are investigated. A
real-time color holographic display system prototype is implemented and tested. It is
shown that the point based 3D representation can be transmitted over internet and this
method is suitable for real-time holographic fringe pattern generation. Therefore we
conclude that it is feasible to drive a holographic display system remotely by storing the
3D information elsewhere. Moreover we show that the multi-GPU computation method
can be used in real-time holographic display systems. By using multiple GPUs we increase
the frame rate, proportionally. It is observed that LEDs can be used in color holographic
video display systems. Although the spectrum of LEDs is wider compared to lasers, the
quality of the optical reconstructions is satisfactory. In addition, optical reconstructions
can be observed by the naked eye without any eye hazard. Yet in another laboratory
prototype, six phase-only spatial light modulators are used and they are tiled in a three
by two planar configuration. All alignments are feasible and we are able to generate larger
holographic reconstructions. We conclude that even with three SLMs along the horizontal
direction, the field of view increases significantly. However, planar holographic displays
require more space-bandwidth product to satisfy motion and rotations; the necessity of
using a circular configuration of discrete SLM patches is obvious. Therefore this leads us
to move to the circular configuration of the phase-only SLMs.
In a circularly configured holographic display prototype, we used six phase-only spa-
tial light modulators that are aligned side by side to obtain a 11520 × 1080 pixel wide
circular holographic display system. All alignments are accomplished by the help of high
precision stages. System works either with a laser or a LED illumination. Optical recon-
structions show that increase in the viewing angle is significant compared to the single
SLM case. Yet in another laboratory prototype we developed a new design of a circularly
holographic video display system. In this design, there are nine phase-only spatial light
107

modulators and they are tiled side by side by using a large half-mirror. The resultant
wide circular holographic display system has 17280× 1080 pixels in total. Since both the
size of the display and the field of view is increased significantly, the ghost-like 3D recon-
structions can be observed within a quite large angle. The freedom to move around the
reconstructions with a binocular view yields a more comfortable 3D experience. The ex-
pected natural parallax is clearly observable. We conclude that the circular configuration
is superior than the previous planar configurations. Experimental results are satisfactory
and they indicate that circularly holographic display system works successfully.
108

Bibliography
[1] F. M. Grimaldi, Physico-mathesis de lumine, coloribus, et iride (Physicomathe-
matical Studies of Light, Colors, and the Rainbow), chapter Propositio I. Lumen
propagatur seu diffunditur non solum directe, refracte, ac reflexe, sed etiam alio
quodam quarto modo, diffracte.” (Proposition 1. Light propagates or spreads not
only in a straight line, by refraction, and by reflection, but also by another, certain
fourth way: by diffraction.), pp. 1–11, Bologna, 1665.
[2] R. Hooke, Micrographia, J. Martyn and J. Allestry, London, 1665.
[3] I. Newton, “A letter of mr. isaac newton, professor of the mathematicks in the
university of cambridge; containing his new theory about light and colors,” Philo-
sophical Transactions, , no. 80, pp. 3075–3087, 1672.
[4] C. Huygens, Traite de la lumiere, Leyden, 1690.
[5] T. Young, “On the theory of light and colours,” Philosophical Transactions, , no.
92, pp. 12–48, 1802.
[6] M. Faraday, Experimental Researches in Electricity, London, 1839.
[7] J. C. Maxwell, A Treatise on Electricity and Magnetism, Oxford, 1873.
[8] A. A. Michelson, ,” Am. J. Sci, vol. 22, pp. 120–129, 1881.
[9] A. Einstein, ,” Ann. d. Physik, vol. 17, pp. 891–921, 1905.
[10] J. W. Goodman, Introduction to Fourier Optics, McGraw-Hill Companies, Inc.,
New York, second edition, 1996.
109

[11] D. Gabor, “A new microscopic principle,” Nature, vol. 161, pp. 777–778, 1948.
[12] D. Gabor, “Microscopy by reconstructed wavefronts,” Proc. Royal Society A, vol.
197, pp. 454–487, 1949.
[13] D. Gabor, “Microscopy by reconstructed wavefronts: II,” Proc. Royal Society B,
vol. 64, pp. 449–469, 1951.
[14] G. L. Rogers, “Experiments in diffraction microscopy,” Proc. Roy. Soc. Edinb.,
vol. 63A, pp. 193–221, 1952.
[15] H. M. A. El-Sum and P. Kirkpatrick, “Microscopy by reconstructed wavefronts,”
Phys. Rev., vol. 85, pp. 763, 1952.
[16] A. W. Lohmann, “Optische Einseitenbandubertragung angewandt auf das Gabor-
Mikroskop,” Optica Acta, vol. 3, pp. 97–99, 1956.
[17] E. N. Leith and J. Upatnieks, “Reconstructed wavefronts and communication the-
ory,” JOSA, vol. 52, pp. 1123–1130, 1962.
[18] E. N. Leith and J. Upatnieks, “Wavefront reconstruction with continuous-tone
objects,” Journ Opt Soc Amer, vol. 53, pp. 1377–1381, 1963.
[19] E. N. Leith and J. Upatnieks, “Wavefront reconstruction with diffused illumination
and three-dimensional objects,” JOSA, vol. 54, pp. 1295–1301, 1964.
[20] Y. N. Denisyuk, “Photographic reconstruction of the optical properties of an object
in its own scattered field,” Sov. Phys. Dokl., vol. 7, pp. 543, 1962.
[21] J. W. Goodman and R. W. Lawrence, “Digital image formation from electronically
detected holograms,” Appl Phys Lett, vol. 11, pp. 77–79, 1967.
[22] L. P. Yaroslavskii and N. S. Merzlyakov, Methods of Digital Holography, Consultants
Bureau, New York, 1980.
110

[23] L. Onural, Diffraction-Specific Fringe Computation for Electro-Holography, Ph.D.
thesis, Electrical and Computer Engineering, State University of New York at Buf-
falo, 1985.
[24] L. Onural and P. D. Scott, “Digital decoding of in-line holograms,” Opt. Eng., vol.
26, pp. 1124–1132, 1987.
[25] O. Schnars and W. Juptner, “Direct recording of holograms by a CCD target and
numerical reconstruction,” Applied Optics, vol. 33, pp. 179–181, 1994.
[26] T. Kreis, Handbook of Holographic Interferometry: Optical and Digital Methods,
John Wiley, 2005.
[27] M. Born and E. Wolf, Principles of Optics: Electromagnetic Theory of Propagation,
Interference and Diffraction of Light (7th Edition), Cambridge University Press,
October 1999.
[28] L. Onural, “Exact analysis of the effects of sampling of the scalar diffraction field,”
J. Optical Soc. of America A, vol. 24, no. 2, pp. 359–367, 2007.
[29] Levent Onural, “Exact solution for scalar diffraction between tilted and translated
planes using impulse functions over a surface,” J. Opt. Soc. Am. A, vol. 28, no. 3,
pp. 290–295, Mar. 2011.
[30] G. B. Esmer, Calculation of scalar optical diffraction field from its distributed
samples over the space, Ph.D. thesis, Bilkent University Dept. of Electrical and
Electronics Engineering, Ankara TR, 2010.
[31] G. C. Sherman, “Application of the convolution theorem to Rayleigh’s integral
formulas,” J Opt Soc Am, vol. 57, pp. 546–547, 1967.
[32] K. Bauchert, S. Serati, and A. Furman, “Advances in liquid crystal spatial light
modulators,” in Optical Pattern Recognition XIII, Proc. of SPIE, 2002.
111

[33] Y. Frauel, T. J. Naughton, O. Matoba, E. Tajahueerce, and B. Javidi, “Three-
dimensional imaging and processing using computational holographic imaging,”
vol. 94, no. 3, 2006.
[34] A. Michalkiewicz, M. Kujawinska, T. Kozackia, X. Wangb, and P. J. Bosb, “Holo-
graphic three-dimensional displays with liquid crystal on silicon spatial light mod-
ulator,” in Interferometry XII: Techniques and Analysis, 2004, Proc. of SPIE, pp.
85–94.
[35] T. Ito, T. Shimobaba, H. Godo, and M. Horiuchi, “Holographic reconstruction with
a 10−µm pixel-pitch reflective liquid-crystal display by use of a light-emitting diode
reference light,” Optics Letters, vol. 27, no. 16, pp. 1406–1408, 2002.
[36] N. Ohmura, H. Kang, T. Yamaguchi, and H. Yoshikawa, “A method to increase
the hologram viewing angle by the beam reconfiguration,” in Practical Holography
XXII: Materials and Aplications, Proc. of SPIE, 2008, vol. 6912, p. 69120O.
[37] K. Takano, N. Minami, and K. Sato, “A simple method of color electro-holographic
display system using a white light source and three LCD panels,” in IEEE Inter-
national Conference on Multimedia and Expo, 2001, pp. 105–108.
[38] K. Takano and K. Sato, “Color electro-holographic display using a single white light
source and a focal adjustment method,” Opt. Eng., vol. 41, no. 10, pp. 2427–2433,
2002.
[39] K. Takano, N. Minami, and K. Sato, “Practical method for color electro-holographic
display system using a metal halide lamp and three LCD panels,” in Practical
Holography XVI and Holographic Materials VIII, Proc. of SPIE, 2002, vol. 4659,
pp. 61–68.
[40] K. Sato and K. Takano, “New type electro-holographic display system using LCDs,”
in Three-Dimensional TV, Video, and Display, Proc. of SPIE, 2002, vol. 4864, pp.
114–121.
112
[41] K. Takano and K. Sato, “Full-color electroholographic three-dimensional display
system employing light emitting diodes in virtual image reconstruction,” Opt. Eng.,
vol. 46, no. 9, pp. 095801, 2007.
[42] K. Sato and K. Takano, “Consideration about HMD-type holography 3D-TV,” in
Three-Dimensional TV, Video, and Display III, Proc. of SPIE, 2004, vol. 5599, pp.
123–134.
[43] R. Tudela, I. Labastida, E. Marti-Badosa, S. Vallmitjana, I. Juvells, and A. Car-
nicer, “A simple method for displaying fresnel holograms on liquid crystal panels,”
Optics Communications, vol. 214, pp. 107–114, 2002.
[44] R. Tudela, E. Martin-Badosa, I. Labastida, S. Vallmitjana, I. Juvells, and A. Car-
nicer, “Full complex fresnel holograms displayed on liquid crystal devices,” Journal
of Optics A: Pure Applied Optics, vol. 5, pp. 189–194, 2003.
[45] R. Tudela, E. Martin-Badosa, I. Labastida, S. Vallmitjana, and A. Carnicer, “Wave-
front reconstruction by adding modulation capabilities of two liquid crystal de-
vices,” Optical Engineering, vol. 43 (11), pp. 2650–2657, November 2004.
[46] T. Ito and K. Okano, “Color electroholography by three colored reference lights
simultaneously incident upon one hologram panel,” Opt. Express., vol. 12, no. 18,
pp. 4320–4325, 2004.
[47] K. Sato, A. Sugita, M. Morimoto, and K. Fujii, “Reconstruction of full-color images
with a RGB time-sharing holographic display system,” in Display Devices and
Systems, Proc. of SPIE, 2006, vol. 6030, pp. 603004–1–603004–6.
[48] K. Sato, A. Sugita, M. Morimoto, and K. Fujii, “Reconstruction of color images of
high quality by a holographic display,” in Practical Holography XX: Materials and
Applications, Proc. of SPIE, 2006, vol. 6136, pp. 61360V–1–61360V–9.
113

[49] A. Sugita, K. Sato, M. Morimoto, and K. Fujii, “Full-color holographic display and
recording of 3D images,” in Practical Holography XIX: Materials and Applications,
Proc. of SPIE, 2005, vol. 5742, pp. 130–139.
[50] T. Yamaguchi and H. Yoshikawa, “Real time calculation for holographic video
display,” in Practical Holography XX: Materials and Aplications, Proc. of SPIE,
2006, vol. 6136, pp. 61360T–01–61360T–10.
[51] T. Yamaguchi, G. Okabe, and H. Yoshikawa, “Full-color image-plane holographic
video display,” in Practical Holography XXI: Materials and Aplications, Proc. of
SPIE, 2007, vol. 6488, p. 64880Q.
[52] S.C. Kim, J.W. Moon, and E.S. Kim D.W. Lee, K.C. Son, “Holographic full-
color 3D display system using color-LCoS spatial light modulator,” in Practical
Holography XIX: Materials and Applications, Proc. of SPIE, 2005, vol. 5742, pp.
223–233.
[53] J.W. Moon, D.W. Lee, S.C. Kim, and E.S. Kim, “Color LCoS-based full-color
electro-holographic 3D display system,” in Cockpit and Future Displays for Defense
and Security, Proc. of SPIE, 2005, vol. 5801, pp. 294–303.
[54] F. Yaras, M. Kovachev, R. Ilieva, M. Agour, and L. Onural, “Holographic recon-
structions using phase-only spatial light modulators,” in 3DTV Conference: The
True Vision - Capture, Transmission and Display of 3D Video, IEEE, 2008.
[55] F. Yaras and L. Onural, “Color holographic reconstruction using multiple SLMs
and LED illumination,” in Proc. SPIE., 2009, vol. 7237, p. 72370O.
[56] F. Yaras, H. Kang, and L. Onural, “Real-time phase-only color holographic video
display system using led illumination,” Appl. Opt., vol. 48, no. 34, pp. H48–H53,
2009.
114

[57] F. Yaras, H. Kang, and L. Onural, “Real-time multiple SLM color holographic
display using multiple GPU acceleration,” in Digital Holography and Three-
Dimensional Imaging. 2009, p. DWA4, Optical Society of America.
[58] F. Yaras, H. Kang, and L. Onural, “Real-time color holographic video display
system,” in 3DTV Conference: The True Vision - Capture, Transmission and
Display of 3D Video, IEEE, 2009.
[59] F. Yaras, H. Kang, and L. Onural, “Multi-SLM holographic display system with
planar configuration,” in 3DTV Conference: The True Vision - Capture, Trans-
mission and Display of 3D Video, IEEE, 2010.
[60] T. Mishina, F. Okano, and I. Yuyama, “Time-alternating method based on single-
sideband holography with half-zone-plate processing for the enlargement of viewing
zones,” Appl. Opt., vol. 38-17, pp. 3703–3713, 1999.
[61] F. Okano T. Mishina, M. Okui, “Viewing-zone enlargement method for sampled
hologram that uses high-order diffraction,” Appl. Opt., vol. 41-8, pp. 1489–1499,
2002.
[62] K. Choi, J. Kim, Y. Lim, and B. Lee, “Full parallax viewing-angle enhanced
computer-generated holographic 3D display system using integral lens array,” Opt.
Express, vol. 13, no. 26, pp. 10494–10502, 2005.
[63] J. Hahn, H. Kim, Y. Lim, G. Park, and B. Lee, “Wide viewing angle dynamic
holographic stereogram with a curved array of spatial light modulators,” Opt.
Express, vol. 16, no. 16, pp. 12372–12386, 2008.
[64] M. Stanley, M. A. G. Smith, A. P. Smith, P. J. Watson, S. D. Coomber, C. D.
Cameron, C. W. Slinger, and A. D. Wood, “3D electronic holography display
system using a 100 mega-pixel spatial light modulator,” in Optical Design and
Engineering, 2004, vol. 5249 of Proc. of SPIE, pp. 297–308.
115

[65] C. Kohler, X. Schwab, and W. Osten, “Optimally tuned spatial light modulators
for digital holography,” Appl. Optics, vol. 45, no. 5, pp. 960–967, 2006.
[66] E. G. van Putten, I. M. Vellekoop, and A. P. Mosk, “Spatial amplitude and phase
modulation using commercial twisted nematic LCDs,” Appl. Optics, vol. 47, no.
12, pp. 2076–2081, 2008.
[67] J. Oton, P. Ambs, M. S. Millan, and E. Perez-Cabre, “Multipoint phase calibration
for improved compensation of inherent wavefront distortion in parallel aligned liquid
crystal on silicon displays,” Appl. Optics, vol. 46, no. 23, pp. 5667–5679, 2007.
[68] F. Reinitzer, “Beitrge zur kenntniss des cholesterins,” Wiener Monatschr, Fr
Chem.,, vol. 9, pp. 421–441, 1888.
[69] J. A. Neff, R. A. Athale, and S. H. Lee, “Two-dimensional spatial light modulators:
a tutorial,” Proceedings of the IEEE, vol. 78, no. 5, pp. 826–855, May 1990.
[70] H. Dai, K. X. Y. Liu, X. Wang, and J. Liu, “Characteristics of LCoS phase-only
spatial light modulator and its applications,” Optics Communications, vol. 238, no.
4-6, pp. 269–276, 2004.
[71] S. Osten, S. Krger, and A. Steinhoff, “Spatial light modulators based on reflective
micro-displays,” Technishes Messen, vol. 73, pp. 149–156, 2006.
[72] S. T. Tang, F. H. Yu, J. Chen, M. Wong, H. C. Huang, and H. S. Kwok, “Reflective
twisted nematic liquid crystal displays. i. retardation compensation,” Journal of
Applied Physics, vol. 81, no. 9, pp. 5924–5929, 1997.
[73] O. Trushkevych, N. Collings, W. A. Crossland, and T. D. Wilkinson, “Resolution
in optically addressed spatial light modulators based on dye-doped liquid crystals,”
Appl. Opt., vol. 45, no. 35, pp. 8889–8892, 2006.
[74] J. B. Sampsell, “Digital micromirror device and its application to projection dis-
plays,” 1994, vol. 12, pp. 3242–3246, AVS.
116

[75] J. S. Kollin, S. A. Benton, and M. L. Jepsen, “Real-time display of 3-D computed
holograms by scanning the image of an acousto-optic modulator,” in Proc. SPIE,
Holographic Optics II: Principles and Applications, 1989, vol. 1136, pp. 178–185.
[76] J. S. Kollin, S. A. Benton, and M. L. Jepsen, “Real-time display of 3-d computed
holograms by scanning the image of an acousto-optic modulator,” in Proc. SPIE,
Holographic Optics II: Principles and Applications, G. M. Morris, Ed., 1989, vol.
1136, pp. 178–185.
[77] P. S.-Hilaire, S. A. Benton, M. Lucente, and P. M. Hubel, “Color images with the
MIT holographic video display,” in Proc. SPIE, Practical Holography VI, S. A.
Benton, Ed., 1992, vol. 1667, pp. 73–84.
[78] L. Onural, G. Bozdagi, and A. Atalar, “New high-resolution display device for
holographic three-dimensional video: Principles and simulations,” Opt Eng, vol.
33, pp. 835–844, 1994.
[79] M. Lucente P. St.-Hilaire, S.A. Benton and P.M. Hubel, “Color images with the
MIT holographic video display,” in Proc. of SPIE, Practical Holography VI, 1992.
[80] P. St.-Hilaire, “Scalable optical architectures for electronic holography,” in Ph. D.
Thesis, Program in Media Arts and Sciences, MIT, 1994.
[81] P. St-Hilaire, S. A. Benton, M. Lucente, J. D. Sutter, andW. J. Plesniak, “Advances
in holographic video,” in Proc. of SPIE, Practical Holography VII, 1993.
[82] P. St.-Hillaire, M. Lucente, J.D. Sutter, R. Pappu, C.J.Sparrell, and S. Benton,
“Scaling up the MIT holographic video system,” in Proc. of the Fifth Inter. Sym-
posium on Display Holography, 1995.
[83] M. L. Jepsen, “Holographic video: design and implementation of a display system,”
in M.S. Thesis, Department of Architecture, MIT, 1989.
[84] Joel S. Kollin, “Design and information considerations for holographic television,”
in M.S. Thesis, Department of Architecture, MIT, 1988.
117

[85] M. Lucente and T. Galyean, “Rendering interactive holographic images,” in Proc.
of SIGGRAPH ’95, 1995, pp. 387–394.
[86] J. Underkoffler, “Towards accurate computation of optically reconstructed holo-
grams,” in M.S. Thesis, Program in Media Arts and Sciences, MIT, 1991.
[87] D. E. Smalley, Q. Y. J. Smithwick, and Jr. V. M. Bove, “Holographic video display
based on guided-wave acousto-optic devices,” 2007, vol. 6488, p. 64880L, SPIE.
[88] S. Reichelt, R. Haussler, N. Leister, G. Futterer, and A. Schwerdtner, “Large
holographic 3D displays for tomorrows TV and monitors - solutions, challenges,
and prospects,” IEEE Lasers and Electro-Optics Society, 2008. LEOS 2008. 21st
Annual Meeting of the, pp. 194–195, 2008.
[89] R. Haussler, A. Schwerdtner, and N. Leister, “Large holographic displays as an
alternative to stereoscopic displays,” 2008, vol. 6803, p. 68030M, SPIE.
[90] S. Reichelt, H. Sahm, N. Leister, and A. Schwerdtner, “Capabilities of diffractive
optical elements for real-time holographic displays,” 2008, vol. 6912 of Proc. of
SPIE, p. 69120P.
[91] A. Schwerdtner, R. Haussler, and N. Leister, “Large holographic displays for real-
time applications,” 2008, vol. 6912 of SPIE, p. 69120T.
[92] N. Leister, A. Schwerdtner, G. Futterer, S. Buschbeck, J.-C. Olaya, and S. Flon,
“Full-color interactive holographic projection system for large 3D scene reconstruc-
tion,” 2008, vol. 6911, p. 69110V, SPIE.
[93] M. Stanley, P. Conway, S. Coomber, J. Jones, D. Scattergood, C. Slinger, B. Ban-
nister, C. Brown, W. Crossland, and A. Travis, “A novel electro-optic modulator
system for the production of dynamic images from giga-pixel computer generated
holograms,” in Proc. SPIE, Practical Holography XIV and Holographic Materials
VI, 2000, vol. 3956, pp. 13–22.
118

[94] C. Slinger, C. Cameron, and M.Stanley, “Computer-generated holography as a
generic display technology,” Computer, vol. 38, no. 8, pp. 46–53, 2005.
[95] T. Shimobaba, S. Hishinuma, and T. Ito, “Special-purpose computer for holography
HORN-4 with recurrence algorithm,” Computer Physics Communications, vol. 148,
no. 2, pp. 160 – 170, 2002.
[96] T. Yabe, T. Ito, and M. Okazaki, “Holography machine HORN-1 for computer-
aided retrieval of virtual three-dimensional image,” Japanese journal of applied
physics. Pt. 2, Letters, vol. 32, no. 9, pp. L1359–L1361, 1993.
[97] Y. Ichihashi, T. Ito, H. Nakayama, N. Masuda, A. Shiraki, and T. Shimobaba,
“Development of special-purpose computer HORN-6 for holography,” 3D Image
Conference 2008, 2008.
[98] T. Ito, N. Masuda, K. Yoshimura, A. Shiraki, T. Shimobaba, and T. Sugie, “Special-
purpose computer HORN-5 for a real-time electroholography,” Opt. Express, vol.
13, no. 6, pp. 1923–1932, 2005.
[99] T. Shimobaba, N. Masuda, T. Sugie, S. Hosono, S. Tsukui, and T. Ito, “Special-
purpose computer for holography HORN-3 with pld technology,” Computer Physics
Communications, vol. 130, July 2000.
[100] T. Ito, T. Yabe, M. Okazaki, and M. Yanagi, “Special-purpose computer HORN-1
for reconstruction of virtual image in three dimensions,” Comp. Phys. Commun.,
vol. 82, pp. 104–110, 1994.
[101] T. Yabe T. Ito, H. Eldeib and T. Kunugi, “Special-purpose computer for holography
HORN-2,” Comp. Phys. Commun., vol. 93, pp. 13–20, 1996.
[102] T. Hamano and H. Yoshikawa, “Image-type CGH by means of e-beam printing,”
in Practical Holography XII. 1998, vol. 3293, pp. 2–14, SPIE.
119

[103] T. Yamaguchi, G. Okabe, and H. Yoshikawa, “Real-time image plane full-color and
full-parallax holographic video display system,” Optical Engineering, vol. 46, no.
12, pp. 125801, 2007.
[104] T. Yatagai, “Stereoscopic approach to 3-D display using computer-generated holo-
grams,” Appl. Opt., vol. 15, no. 11, pp. 2722–2729, 1976.
[105] H. Kang, T. Yamaguchi, and H. Yoshikawa, “Accurate phase-added stereogram to
improve the coherent stereogram,” Appl. Opt., vol. 47, no. 19, pp. D44–D54, 2008.
[106] H. Kang, T. Fujii, T. Yamaguchi, and H. Yoshikawa, “Compensated phase-added
stereogram for real-time holographic display,” Opt. Eng., vol. 46, no. 9, pp. 095802,
2007.
[107] H. Yoshikawa J. Tamai, “Faster computation of subsampled coherent stereogram
(in japanese),” in The Journal of the Institute of Television Engineers of Japan,
1996, vol. 50, pp. 1612–1615.
[108] M. Yamaguchi, H. Hoshino, T. Honda, and N. Ohyama, “Phase-added stereogram:
calculation of hologram using computer graphics technique,” in Practical Hologra-
phy VII: Imaging and Materials. 1993, vol. 1914, pp. 25–31, SPIE.
[109] H. Yoshikawa and H. Kameyama, “Integral holography,” in Practical Holography
IX. 1995, vol. 2406, pp. 226–234, SPIE.
[110] H. Kang, “Quality improvements of the coherent holographic stereogram for natural
3D display and its applications,” in PhD. Thesis, Nihon University, 2008.
[111] H. Kang, F. Yaras, and L. Onural, “Graphics processing unit accelerated compu-
tation of digital holograms,” Appl. Opt., vol. 48, no. 34, pp. H137–H143, 2009.
[112] H. Kang, F. Yaras, L. Onural, and H. Yoshikawa, “Real-time fringe pattern gen-
eration with high quality,” in Digital Holography and Three-Dimensional Imaging.
2009, p. DTuB7, Optical Society of America.
120

[113] H. Kang, F. Yaras, and L. Onural, “Quality comparison and acceleration for digital
hologram generation method based on segmentation,” in 3DTV Conference: The
True Vision - Capture, Transmission and Display of 3D Video, IEEE, 2009.
[114] “http://www.televisionbroadcast.com/article/79134,” .
[115] Levent Onural, Fahri Yaras, and Hoonjong Kang, “Digital holographic three-
dimensional video displays,” Proc. of the IEEE, vol. 99, no. 4, pp. 576–589, 2011.
[116] R. L. De Valois and K. K. De Valois, Spatial Vision, Oxford Science Publications,
1990.
[117] M. F. Deering, “The limits of human vision,” in 2nd International Immersive
Projection Technology Workshop, 1998.
[118] D. A. Atchison and G. Smith, Optics of the human eye, Elsevier Health Sciences,
2000.
[119] L. Onural, A. Gotchev, H. M. Ozaktas, and E. Stoykova, “A survey of signal
processing problems and tools in holographic three-dimensional television,” Circuits
and Systems for Video Technology, IEEE Transactions on, vol. 17, no. 11, pp. 1631–
1646, 2007.
[120] R. Gonzalez and R. Woods, Digital Image Processing, pp. 518–519, Addison-Wesley
Publishing Company, 1992.
[121] T. M. Kreis, “Frequency analysis of digital holography,” Optical Engineering, vol.
41, no. 4, pp. 771–778, April 2002.
[122] L. Onural, “Sampling of the diffraction field,” Appl Opt, vol. 39, pp. 5929–5935,
2000.
[123] F. Gori, “Fresnel transform and sampling theorem,” Opt Commun, vol. 39, pp.
293–297, 1981.
121

[124] B. E. A. Saleh and M. C. Teich, Fundamentals of Photonics, Wiley, New York,
1991.
[125] G. A. Mills and I. Yamaguchi, “Effects of quantization in phase-shifting digital
holography,” Appl. Opt., vol. 44, no. 7, pp. 1216–1225, 2005.
[126] L. I. Goldfischer, “Autocorrelation function and power spectral density of laser-
produced speckle patterns,” J. Opt. Soc. Am., vol. 55, no. 3, pp. 247–252, 1965.
[127] H. J. Gerritsen, W. J. Hannan, and E. G. Ramberg, “Elimination of speckle noise
in holograms with redundancy,” Appl. Opt., vol. 7, no. 11, pp. 2301–2311, 1968.
[128] Jr. Mark E. Myers and Andrew M. Wims, “Elimination of speckle noise in laser
light scattering photometry,” Appl. Opt., vol. 11, no. 4, pp. 947–949, 1972.
[129] M. Matsumura, “Speckle noise reduction by random phase shifters,” Appl. Opt.,
vol. 14, no. 3, pp. 660–665, 1975.
[130] J. Amako, H. Miura, and T. Sonehara, “Speckle-noise reduction on kinoform re-
construction using a phase-only spatial light modulator,” Appl. Opt., vol. 34, no.
17, pp. 3165–3171, 1995.
[131] J. M. Huntley and L. Benckert, “Speckle interferometry: noise reduction by corre-
lation fringe averaging,” Appl. Opt., vol. 31, no. 14, pp. 2412–2414, 1992.
[132] Y. Barkana and M. Belkin, “Laser eye injuries,” Survey of Ophthalmology, vol. 44,
no. 6, pp. 459 – 478, 2000.
[133] S.-C. Kim H. Kang, N. Ohmura and E.-S. Kim, “Method to enlarge the hologram
viewing window using a mirror module,” Optical Engineering, vol. 48, no. 7, pp.
075801, 2009.
[134] H. Zhang, J. Zhang, and L. Wu, “Evaluation of phase-only liquid crystal spatial
light modulator for phase modulation performance using a twymangreen interfer-
ometer,” Meas. Sci. Technol., vol. 18, no. 6, pp. 1724–1728, 2007.
122

[135] R. W. Gerchberg and W. O. Saxton, “A practical algorithm for the determination
of the phase from image and diffraction plane pictures,” Optik, vol. 35, pp. 706–713,
1972.
[136] G. Liu and P. D. Scott, “Phase retrieval and twin-image elimination for in-line
fresnel holograms,” J. Opt. Soc. Am., vol. 4, pp. 159, 1987.
[137] F. Yaras, H. Kang, and L. Onural, “Circularly configured multi-SLM holographic
display system,” in 3DTV Conference: The True Vision - Capture, Transmission
and Display of 3D Video, IEEE, 2011.
[138] F. Yaras, H. Kang, and L. Onural, “Circular holographic video display system,”
Opt. Express, vol. 19, no. 10, pp. 9147–9156, 2011.
[139] L.P. Lesem, P.M. Hirsch, and J.A Jordan Jr., “The kinoform: a new wave front
reconstruction device,” IBM J. Res. Dev., vol. 13, pp. 150155, 1969.
[140] K. Taima, H. Ueda, H. Okamoto, T. Kubota, Y. Nakamura, H. Nishida, H. Taka-
hashi, and E. Shimizu, “New approach to the interactive holographic display sys-
tem,” in Proc. SPIE., 1994, vol. 2176, pp. 23–29.
[141] J. A. Watlington, M. E. Lucente, C. J. Sparrell, Jr. V. M. Bove, and I. Tamitani,
“Hardware architecture for rapid generation of electro-holographic fringe patterns,”
in Practical Holography IX, Stephen A. Benton, Ed., 1995, vol. 2406 of Proc. SPIE,
pp. 172–183.
[142] H. Yoshikawa and T. Yamaguchi, “Fast hologram calculation for holographic video
display,” in Proc. SPIE., 2006, vol. 6027, pp. 561–566.
[143] M. Janda, I. Hanak, and L. Onural, “Hologram synthesis for photorealistic recon-
struction,” JOSA A, vol. 25, no. 12, pp. 3083–3096, 2008.
[144] N. Masuda, T. Ito, T. Tanaka, A. Shiraki, and T. Sugie, “Computer generated
holography using a graphics processing unit,” Opt. Express, vol. 14, no. 2, pp.
603–608, 2006.
123

[145] L. Ahrenberg, P. Benzie, M. Magnor, and J. Watson, “Computer generated holog-
raphy using parallel commodity graphics hardware,” Optics Express, vol. 14, no.
17, pp. 7656–7641, 2006.
[146] N. Fukaya, K. Maeno, O. Nishikawa, K. Matumoto, K. Sato, and T. Honda, “Ex-
pansion of the image size and viewing zone in holographic display using liquid
crystal devices,” in Proc. SPIE, 1995, vol. 2406, pp. 283–289.
[147] K. Maeno, N. Fukaya, O. Nishikawa, and T. Honda, “Electroholographic display
using 15-megapixel LCD,” in Proc. SPIE, Practical Holography X, 1996, vol. 2652,
pp. 15–23.
[148] G. B. Esmer, “Computation of holographic patterns between tilted planes,” M.S.
thesis, Bilkent University Dept. of Electrical and Electronics Engineering, Ankara
TR, 2004.
124