Nanostructured SnO2 films prepared from evaporated Sn and their application as gas sensors
Sri Lankan Journal of Physics, Vol. 15 (2014) 1-10
INSTITUTE OF PHYSICS – SRI LANKA
Research Article
Synthesis, characterization and ethanol vapor sensing performance of
SnO2/Graphene composite films
M.T.V.P. Jayaweera1,2, R.C.L. De Silva1, I.R.M. Kottegoda1 and S.R.D. Rosa2
1Materials Technology Section, Industrial Technology Institute, Colombo 07, Sri Lanka
2Department of physics, University of Colombo, Colombo 03, Sri Lanka
Abstract
High performing sensor consisting of SnO2/Gn nanocomposite was fabricated using a novel
one-step in-situ sonochemical method. The reducing properties of SnCl2 was used to reduce
graphite oxide (GO) so that SnCl2 could be transformed to SnO2 on the basal plane of
graphene. The combined characterizations including X-ray diffraction (XRD), scanning
electron microscopy (SEM) and Fourier Transformed Infra-Red spectroscopic data (FTIR)
indicated the successful formation of SnO2/Gn composites. Current-voltage (I-V)
characteristics of the gas sensor showed ideal ohmic behavior having low resistance. To
demonstrate the product on sensing application, gas sensors were fabricated using SnO2/Gn
composites and used in detecting ethanol vapor at room temperature (27°C).The results
indicate that the SnO2/Gn composite exhibits a considerably high sensing performance of
17.54% response at 150 ppm ethanol vapor, rapid response and reproducibility. Furthermore,
the performance of the gas sensor based on SnO2/Gn is very stable for a long period of time
under normal operating conditions. Therefore, it is suggested that SnO2/Gn can be
considered as an excellent sensing material which also has a potential for wider range of
applications on sensors.
Keywords: SnO2/Graphene; ethanol vapor sensing
1. INTRODUCTION
Throughout the world, research on electronic sensors has become an important
activity because of their importance, especially in applications involving human breath
quality, wine quality, food, oil, and coffee quality. The sensor activity in the vicinity of
Corresponding Author Email: [email protected]
M.T.V.P. Jayaweera et al., /Sri Lankan Journal of Physics, Vol. 15, (2014) 1-10 2
different gases makes the resulting output pattern to appear differently. Sensors can be
mainly classified as solid electrolyte detectors, catalytic detectors, electrochemical detectors,
infrared gas detectors, solid-state sensors, paramagnetic gas sensors etc. Out of these, the
semiconductor gas sensors provide the most promising application for the purpose of
detecting gases. The response from the semiconductor (p- or n-type) is not only a function
of the doping and material extrinsic properties, but is also dependent on the concentration of
the gas exposed to the semiconductor1.The main identification factors of these sensors are
the resistance variation of the semiconductor provided that the gas is exposed to the
semiconducting material.
Recently, graphene has evolved as an interesting material due to its unique physical
and electrical properties2. Graphene is different from the conventional semiconductors
because it is identified as a zero band-gap semiconductor2-10. Graphene based materials are
suitable for gas sensing device fabrication because of their high surface to volume ratio10,11.
Moreover, since it is a low resistance material (typically few hundred ohms~(102-103 Ω)),
gas sensors based on graphene do not require high impedance circuits. However, the
relatively poor performances such as low response, long response time and recovery times
should be further improved for effective applications16. Gas sensing applications of tin oxide
nano structured materials have been investigated for which moderate results were obtained19.
Recently, high performing sensors have been constructed using graphene and metal oxide
nanocomposite overcoming the above limitations17,18. However, the operating condition of
most of these sensors is at elevated temperatures.
The present work reveals the performance of a Graphene/ SnO2 sensor which can be
operated at room temperature. An in-situ method was followed to synthesize the composite
using graphite oxide (GO) and SnCl2, wherein, SnCl2 acts as a strong reducing agent. The
present novel one step reaction method is identified as an economical approach for mass
scale production of these sensors.
2. METHODOLOGY
2.1 Synthesis of graphite oxide
Bogala graphite flakes of 97% purity were oxidized using Modified Hummers
method15. 1.0 g of natural graphite was added to 20 cm3 of Conc. H2SO4 at 0ºC. 3.0 g of
KMnO4 was added gradually to the mixture while stirring. The mixture was then stirred at
room temperature for 30 min and 50 cm3 of water was added slowly. Subsequently, 150cm3
of distilled water was added followed by 10 cm3 of 30% H2O2 solution. The solids were
separated by centrifuging and washed repeatedly with 5% HCl until sulphate could not be
detected with BaCl2.The product was washed with acetone and dried in an oven at 90°C for
2 h.
M.T.V.P. Jayaweera et al., /Sri Lankan Journal of Physics, Vol. 15, (2014) 1-10 3
2.2 Synthesis of SnO2/Gn Composite
SnCl2.2H2O and graphite oxide (GO) were mixed at a ratio of 15:8 by weight with
water and sonicated for 3 hours. In this process, SnCl2 is used to reduce GO and concurrently
produced SnO2 on the graphene basal plane through the reaction given below:
SnCl2 + GO + H2O → SnO2/Gn +HCl (1)
The resulting reaction mixture was washed with distilled water to remove impurities and
dried at 60oC for 12 hours.
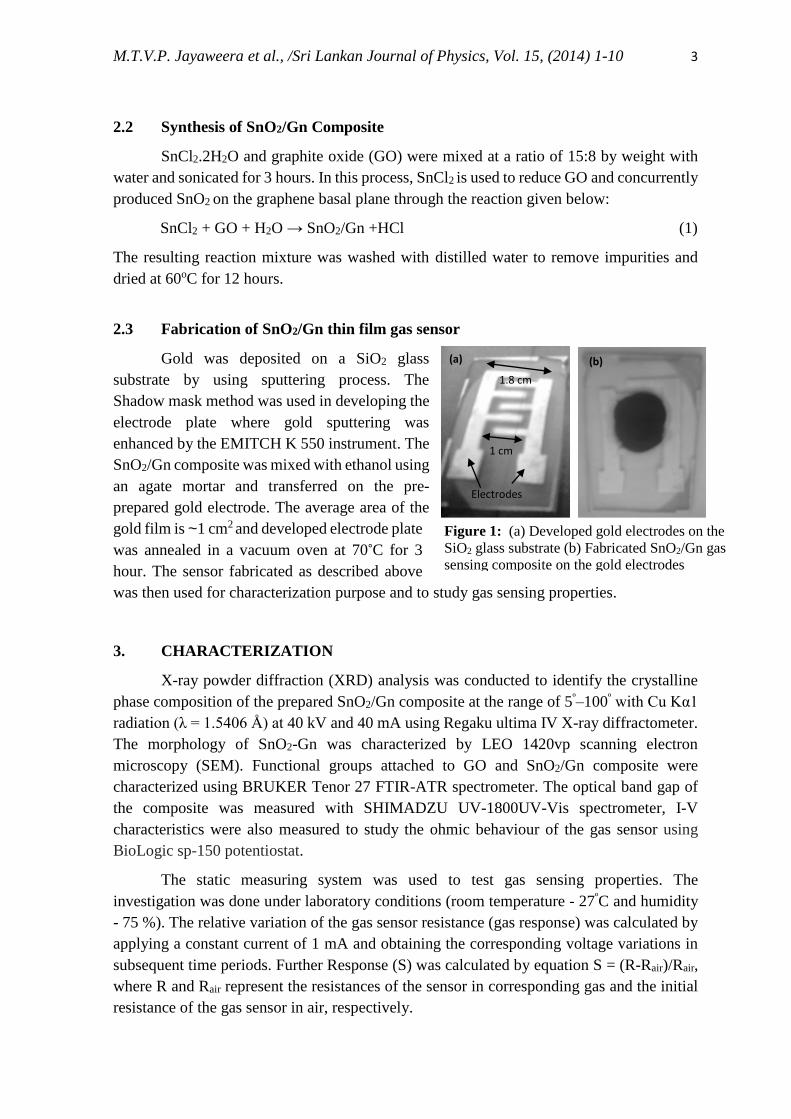
2.3 Fabrication of SnO2/Gn thin film gas sensor
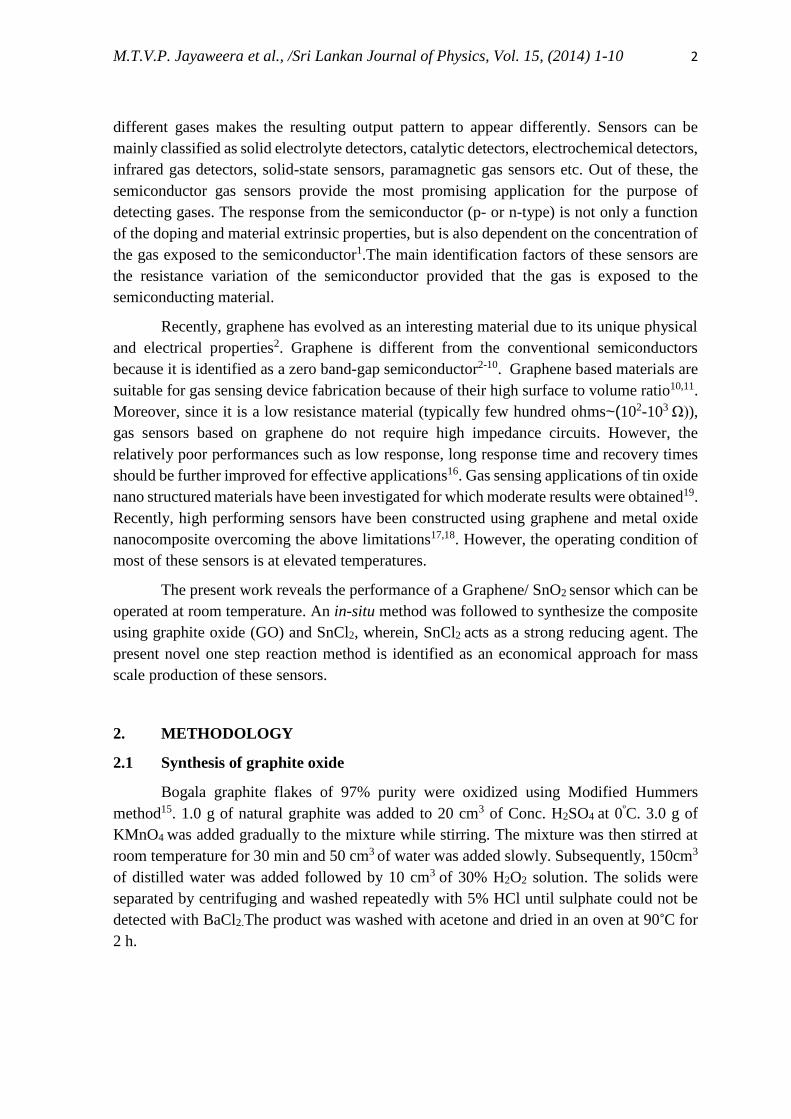
Gold was deposited on a SiO2 glass
substrate by using sputtering process. The
Shadow mask method was used in developing the
electrode plate where gold sputtering was
enhanced by the EMITCH K 550 instrument. The
SnO2/Gn composite was mixed with ethanol using
an agate mortar and transferred on the pre-
prepared gold electrode. The average area of the
gold film is ~1 cm2 and developed electrode plate
was annealed in a vacuum oven at 70°C for 3
hour. The sensor fabricated as described above
was then used for characterization purpose and to study gas sensing properties.
3. CHARACTERIZATION
X-ray powder diffraction (XRD) analysis was conducted to identify the crystalline
phase composition of the prepared SnO2/Gn composite at the range of 5º–100º with Cu Kα1
radiation (λ = 1.5406 Å) at 40 kV and 40 mA using Regaku ultima IV X-ray diffractometer.
The morphology of SnO2-Gn was characterized by LEO 1420vp scanning electron
microscopy (SEM). Functional groups attached to GO and SnO2/Gn composite were
characterized using BRUKER Tenor 27 FTIR-ATR spectrometer. The optical band gap of
the composite was measured with SHIMADZU UV-1800UV-Vis spectrometer, I-V
characteristics were also measured to study the ohmic behaviour of the gas sensor using
BioLogic sp-150 potentiostat.
The static measuring system was used to test gas sensing properties. The
investigation was done under laboratory conditions (room temperature - 27ºC and humidity
- 75 %). The relative variation of the gas sensor resistance (gas response) was calculated by
applying a constant current of 1 mA and obtaining the corresponding voltage variations in
subsequent time periods. Further Response (S) was calculated by equation S = (R-Rair)/Rair,
where R and Rair represent the resistances of the sensor in corresponding gas and the initial
resistance of the gas sensor in air, respectively.
Figure 1: (a) Developed gold electrodes on the
SiO2 glass substrate (b) Fabricated SnO2/Gn gas
sensing composite on the gold electrodes
(a) (b)
Electrodes
1.8 cm
1 cm
M.T.V.P. Jayaweera et al., /Sri Lankan Journal of Physics, Vol. 15, (2014) 1-10 4
4. RESULTS AND DISCUSSION
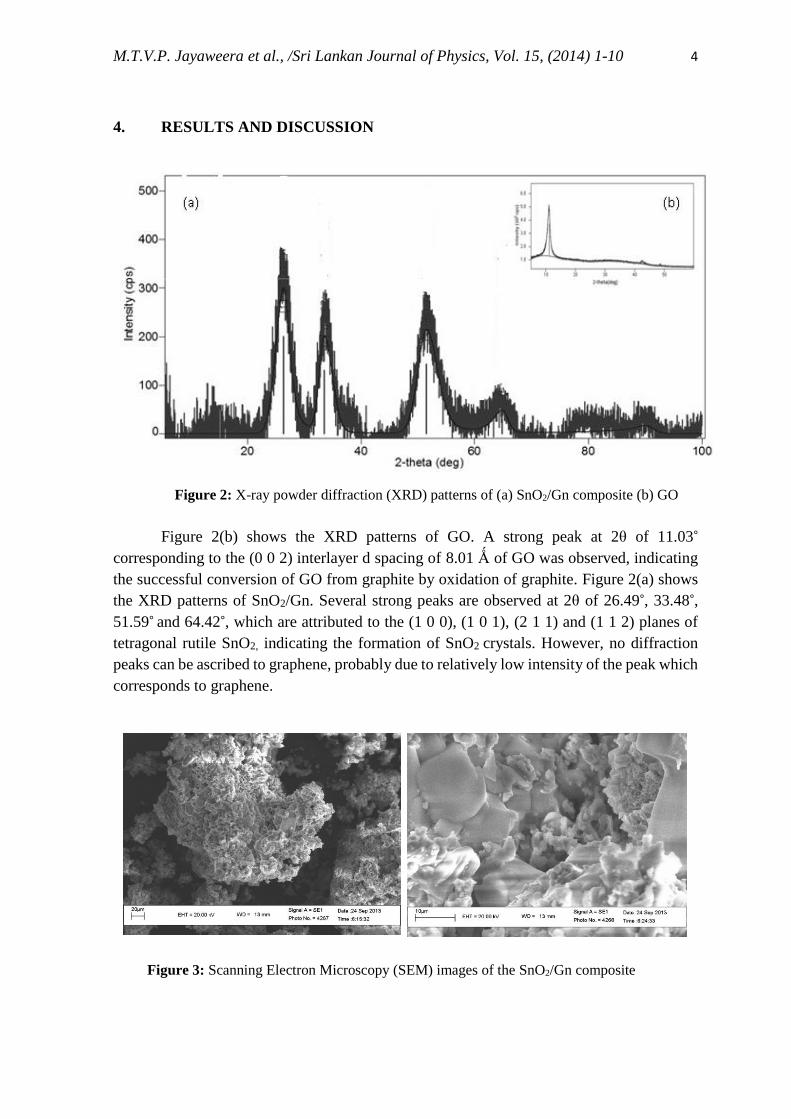
Figure 2(b) shows the XRD patterns of GO. A strong peak at 2θ of 11.03°
corresponding to the (0 0 2) interlayer d spacing of 8.01 Ǻ of GO was observed, indicating
the successful conversion of GO from graphite by oxidation of graphite. Figure 2(a) shows
the XRD patterns of SnO2/Gn. Several strong peaks are observed at 2θ of 26.49°, 33.48°,
51.59° and 64.42°, which are attributed to the (1 0 0), (1 0 1), (2 1 1) and (1 1 2) planes of
tetragonal rutile SnO2, indicating the formation of SnO2 crystals. However, no diffraction
peaks can be ascribed to graphene, probably due to relatively low intensity of the peak which
corresponds to graphene.
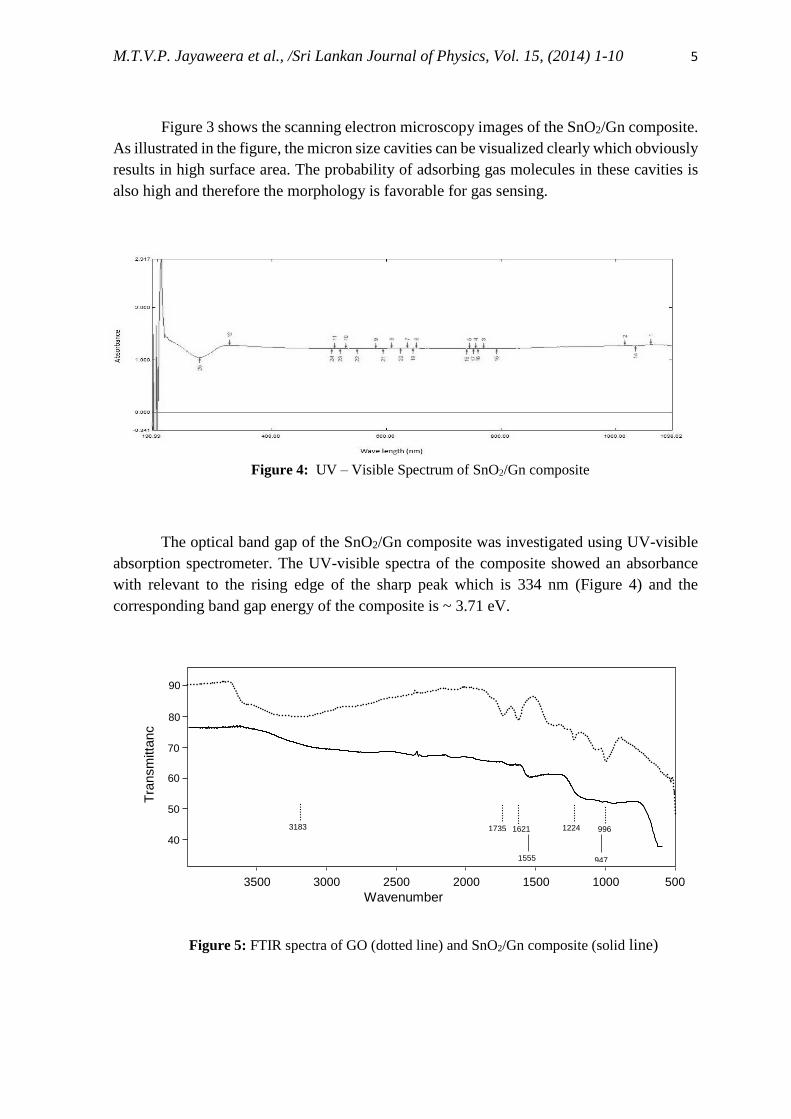
Figure 3: Scanning Electron Microscopy (SEM) images of the SnO2/Gn composite
Figure 2: X-ray powder diffraction (XRD) patterns of (a) SnO2/Gn composite (b) GO
M.T.V.P. Jayaweera et al., /Sri Lankan Journal of Physics, Vol. 15, (2014) 1-10 5
Figure 3 shows the scanning electron microscopy images of the SnO2/Gn composite.
As illustrated in the figure, the micron size cavities can be visualized clearly which obviously
results in high surface area. The probability of adsorbing gas molecules in these cavities is
also high and therefore the morphology is favorable for gas sensing.
The optical band gap of the SnO2/Gn composite was investigated using UV-visible
absorption spectrometer. The UV-visible spectra of the composite showed an absorbance
with relevant to the rising edge of the sharp peak which is 334 nm (Figure 4) and the
corresponding band gap energy of the composite is ~ 3.71 eV.
Figure 4: UV – Visible Spectrum of SnO2/Gn composite
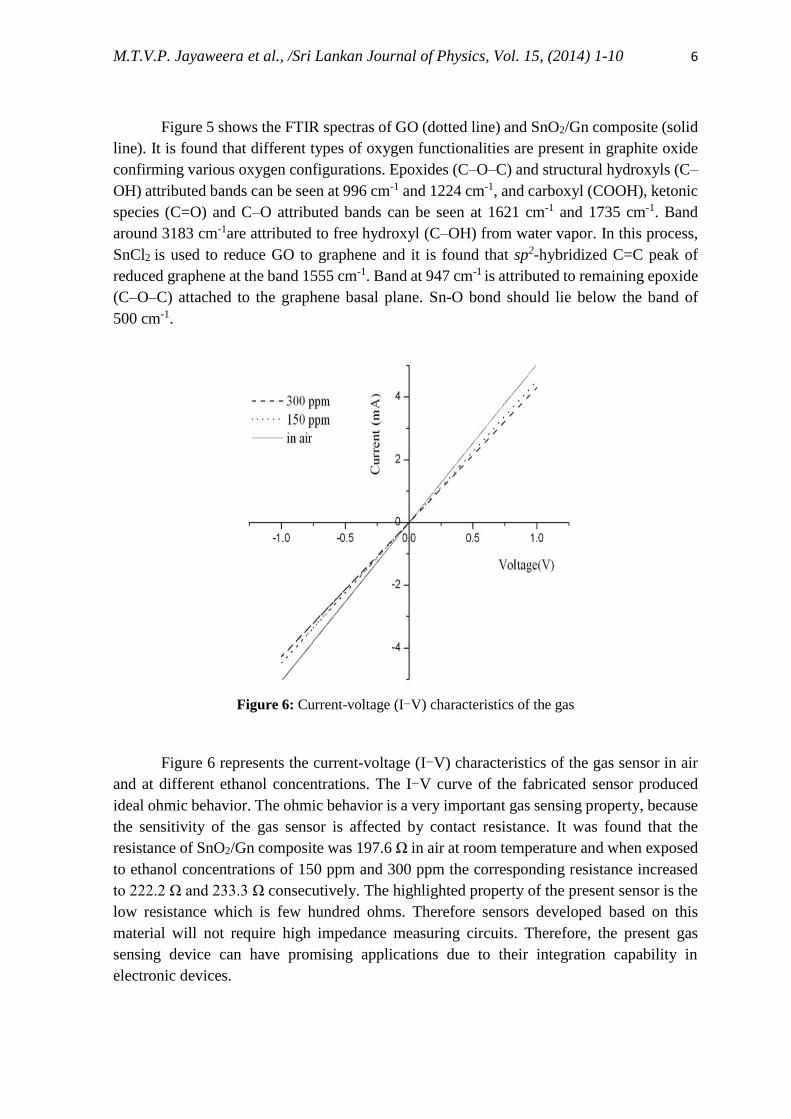
Figure 5: FTIR spectra of GO (dotted line) and SnO2/Gn composite (solid line)
3183 1735 1621
1555
1224 996
947
500 1000 1500 2000 2500 3000 3500 Wavenumber
(cm-1)
40
50
60
70
80
90
Tra
nsm
itta
nc
e [%
]
M.T.V.P. Jayaweera et al., /Sri Lankan Journal of Physics, Vol. 15, (2014) 1-10 6
Figure 5 shows the FTIR spectras of GO (dotted line) and SnO2/Gn composite (solid
line). It is found that different types of oxygen functionalities are present in graphite oxide
confirming various oxygen configurations. Epoxides (C–O–C) and structural hydroxyls (C–
OH) attributed bands can be seen at 996 cm-1 and 1224 cm-1, and carboxyl (COOH), ketonic
species (C=O) and C–O attributed bands can be seen at 1621 cm-1 and 1735 cm-1. Band
around 3183 cm-1are attributed to free hydroxyl (C–OH) from water vapor. In this process,
SnCl2 is used to reduce GO to graphene and it is found that sp2-hybridized C=C peak of
reduced graphene at the band 1555 cm-1. Band at 947 cm-1 is attributed to remaining epoxide
(C–O–C) attached to the graphene basal plane. Sn-O bond should lie below the band of
500 cm-1.
Figure 6: Current-voltage (I-V) characteristics of the gas
Figure 6 represents the current-voltage (I-V) characteristics of the gas sensor in air
and at different ethanol concentrations. The I-V curve of the fabricated sensor produced
ideal ohmic behavior. The ohmic behavior is a very important gas sensing property, because
the sensitivity of the gas sensor is affected by contact resistance. It was found that the
resistance of SnO2/Gn composite was 197.6 Ω in air at room temperature and when exposed
to ethanol concentrations of 150 ppm and 300 ppm the corresponding resistance increased
to 222.2 Ω and 233.3 Ω consecutively. The highlighted property of the present sensor is the
low resistance which is few hundred ohms. Therefore sensors developed based on this
material will not require high impedance measuring circuits. Therefore, the present gas
sensing device can have promising applications due to their integration capability in
electronic devices.
M.T.V.P. Jayaweera et al., /Sri Lankan Journal of Physics, Vol. 15, (2014) 1-10 7
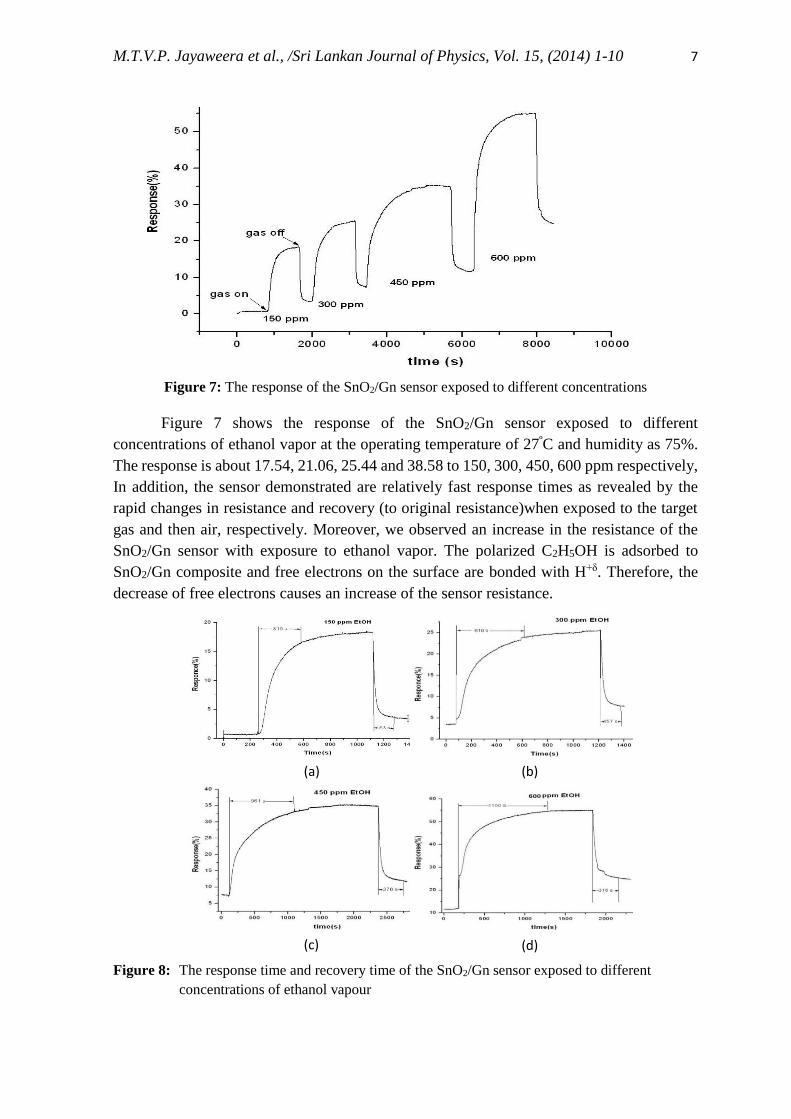
Figure 7: The response of the SnO2/Gn sensor exposed to different concentrations
Figure 7 shows the response of the SnO2/Gn sensor exposed to different
concentrations of ethanol vapor at the operating temperature of 27ºC and humidity as 75%.
The response is about 17.54, 21.06, 25.44 and 38.58 to 150, 300, 450, 600 ppm respectively,
In addition, the sensor demonstrated are relatively fast response times as revealed by the
rapid changes in resistance and recovery (to original resistance)when exposed to the target
gas and then air, respectively. Moreover, we observed an increase in the resistance of the
SnO2/Gn sensor with exposure to ethanol vapor. The polarized C2H5OH is adsorbed to
SnO2/Gn composite and free electrons on the surface are bonded with H+δ. Therefore, the
decrease of free electrons causes an increase of the sensor resistance.
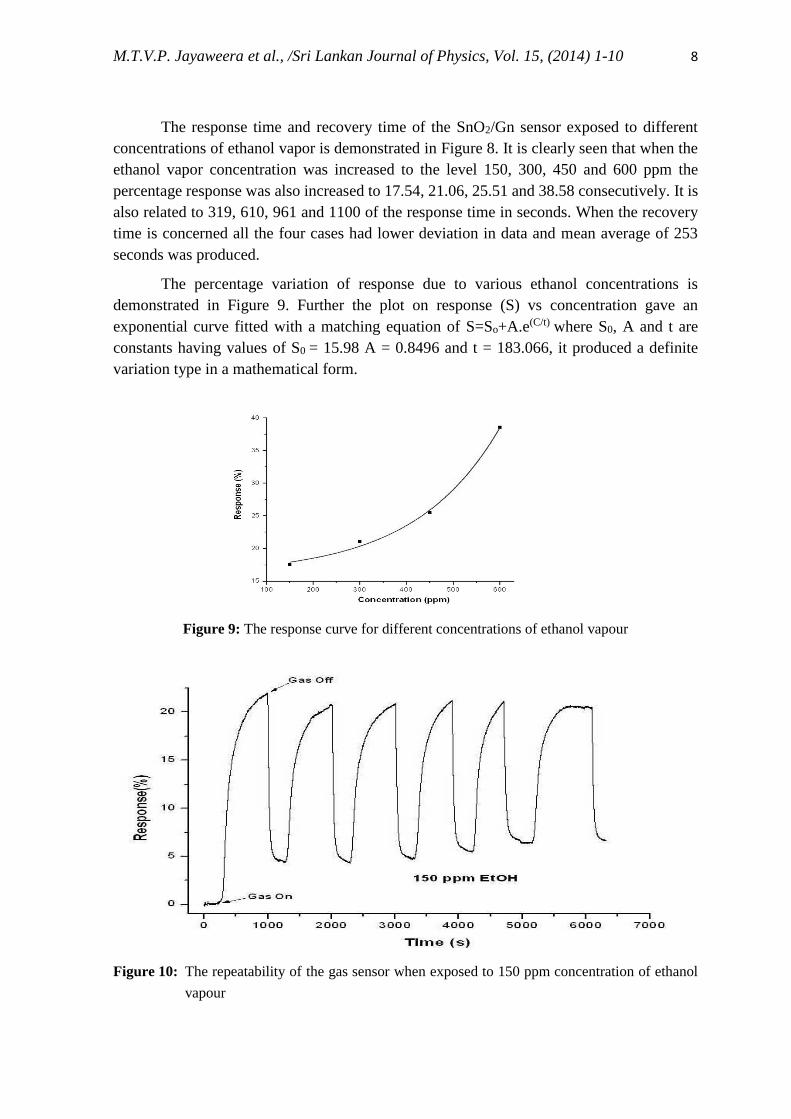
Figure 8: The response time and recovery time of the SnO2/Gn sensor exposed to different
concentrations of ethanol vapour
(a) (b)
(c) (d)
M.T.V.P. Jayaweera et al., /Sri Lankan Journal of Physics, Vol. 15, (2014) 1-10 8
The response time and recovery time of the SnO2/Gn sensor exposed to different
concentrations of ethanol vapor is demonstrated in Figure 8. It is clearly seen that when the
ethanol vapor concentration was increased to the level 150, 300, 450 and 600 ppm the
percentage response was also increased to 17.54, 21.06, 25.51 and 38.58 consecutively. It is
also related to 319, 610, 961 and 1100 of the response time in seconds. When the recovery
time is concerned all the four cases had lower deviation in data and mean average of 253
seconds was produced.
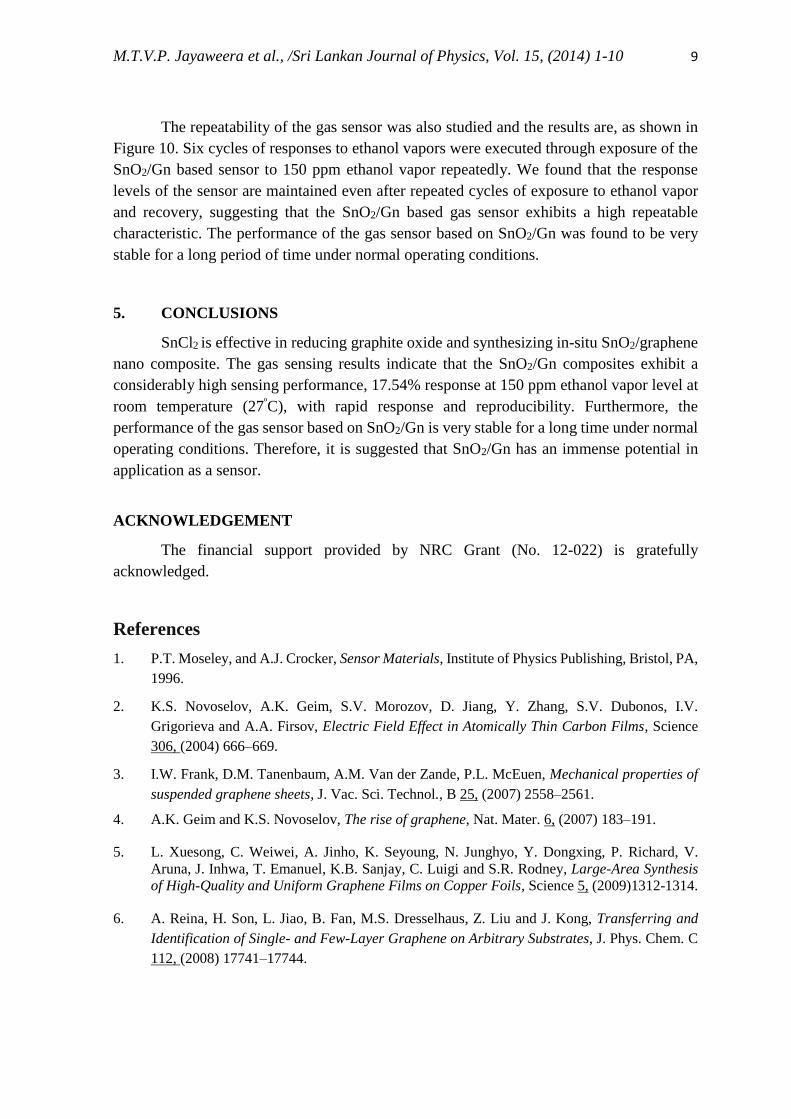
The percentage variation of response due to various ethanol concentrations is
demonstrated in Figure 9. Further the plot on response (S) vs concentration gave an
exponential curve fitted with a matching equation of S=So+A.e(C/t) where S0, A and t are
constants having values of S0 = 15.98 A = 0.8496 and t = 183.066, it produced a definite
variation type in a mathematical form.
Figure 9: The response curve for different concentrations of ethanol vapour
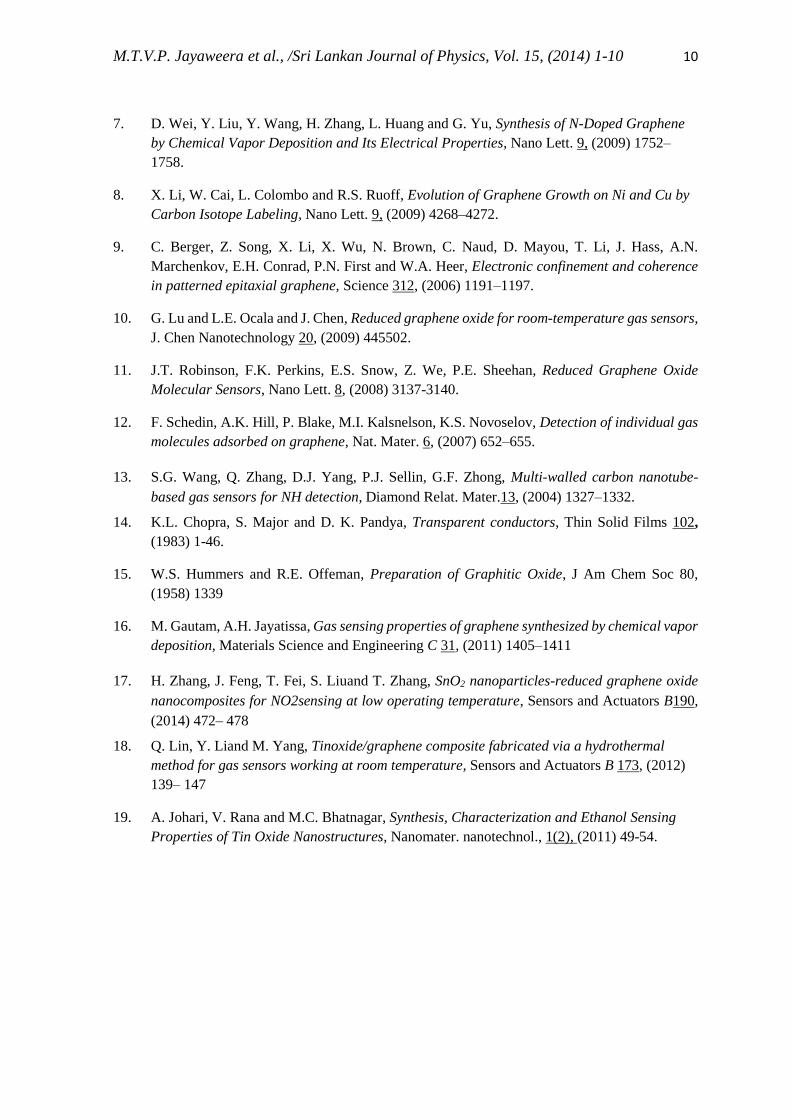
Figure 10: The repeatability of the gas sensor when exposed to 150 ppm concentration of ethanol
vapour
M.T.V.P. Jayaweera et al., /Sri Lankan Journal of Physics, Vol. 15, (2014) 1-10 9
The repeatability of the gas sensor was also studied and the results are, as shown in
Figure 10. Six cycles of responses to ethanol vapors were executed through exposure of the
SnO2/Gn based sensor to 150 ppm ethanol vapor repeatedly. We found that the response
levels of the sensor are maintained even after repeated cycles of exposure to ethanol vapor
and recovery, suggesting that the SnO2/Gn based gas sensor exhibits a high repeatable
characteristic. The performance of the gas sensor based on SnO2/Gn was found to be very
stable for a long period of time under normal operating conditions.
5. CONCLUSIONS
SnCl2 is effective in reducing graphite oxide and synthesizing in-situ SnO2/graphene
nano composite. The gas sensing results indicate that the SnO2/Gn composites exhibit a
considerably high sensing performance, 17.54% response at 150 ppm ethanol vapor level at
room temperature (27ºC), with rapid response and reproducibility. Furthermore, the
performance of the gas sensor based on SnO2/Gn is very stable for a long time under normal
operating conditions. Therefore, it is suggested that SnO2/Gn has an immense potential in
application as a sensor.
ACKNOWLEDGEMENT
The financial support provided by NRC Grant (No. 12-022) is gratefully
acknowledged.
References
1. P.T. Moseley, and A.J. Crocker, Sensor Materials, Institute of Physics Publishing, Bristol, PA,
1996.
2. K.S. Novoselov, A.K. Geim, S.V. Morozov, D. Jiang, Y. Zhang, S.V. Dubonos, I.V.
Grigorieva and A.A. Firsov, Electric Field Effect in Atomically Thin Carbon Films, Science
306, (2004) 666–669.
3. I.W. Frank, D.M. Tanenbaum, A.M. Van der Zande, P.L. McEuen, Mechanical properties of
suspended graphene sheets, J. Vac. Sci. Technol., B 25, (2007) 2558–2561.
4. A.K. Geim and K.S. Novoselov, The rise of graphene, Nat. Mater. 6, (2007) 183–191.
5. L. Xuesong, C. Weiwei, A. Jinho, K. Seyoung, N. Junghyo, Y. Dongxing, P. Richard, V.
Aruna, J. Inhwa, T. Emanuel, K.B. Sanjay, C. Luigi and S.R. Rodney, Large-Area Synthesis
of High-Quality and Uniform Graphene Films on Copper Foils, Science 5, (2009)1312-1314.
6. A. Reina, H. Son, L. Jiao, B. Fan, M.S. Dresselhaus, Z. Liu and J. Kong, Transferring and
Identification of Single- and Few-Layer Graphene on Arbitrary Substrates, J. Phys. Chem. C
112, (2008) 17741–17744.
M.T.V.P. Jayaweera et al., /Sri Lankan Journal of Physics, Vol. 15, (2014) 1-10 10
7. D. Wei, Y. Liu, Y. Wang, H. Zhang, L. Huang and G. Yu, Synthesis of N-Doped Graphene
by Chemical Vapor Deposition and Its Electrical Properties, Nano Lett. 9, (2009) 1752–
1758.
8. X. Li, W. Cai, L. Colombo and R.S. Ruoff, Evolution of Graphene Growth on Ni and Cu by
Carbon Isotope Labeling, Nano Lett. 9, (2009) 4268–4272.
9. C. Berger, Z. Song, X. Li, X. Wu, N. Brown, C. Naud, D. Mayou, T. Li, J. Hass, A.N.
Marchenkov, E.H. Conrad, P.N. First and W.A. Heer, Electronic confinement and coherence
in patterned epitaxial graphene, Science 312, (2006) 1191–1197.
10. G. Lu and L.E. Ocala and J. Chen, Reduced graphene oxide for room-temperature gas sensors,
J. Chen Nanotechnology 20, (2009) 445502.
11. J.T. Robinson, F.K. Perkins, E.S. Snow, Z. We, P.E. Sheehan, Reduced Graphene Oxide
Molecular Sensors, Nano Lett. 8, (2008) 3137-3140.
12. F. Schedin, A.K. Hill, P. Blake, M.I. Kalsnelson, K.S. Novoselov, Detection of individual gas
molecules adsorbed on graphene, Nat. Mater. 6, (2007) 652–655.
13. S.G. Wang, Q. Zhang, D.J. Yang, P.J. Sellin, G.F. Zhong, Multi-walled carbon nanotube-
based gas sensors for NH detection, Diamond Relat. Mater.13, (2004) 1327–1332.
14. K.L. Chopra, S. Major and D. K. Pandya, Transparent conductors, Thin Solid Films 102,
(1983) 1-46.
15. W.S. Hummers and R.E. Offeman, Preparation of Graphitic Oxide, J Am Chem Soc 80,
(1958) 1339
16. M. Gautam, A.H. Jayatissa, Gas sensing properties of graphene synthesized by chemical vapor
deposition, Materials Science and Engineering C 31, (2011) 1405–1411
17. H. Zhang, J. Feng, T. Fei, S. Liuand T. Zhang, SnO2 nanoparticles-reduced graphene oxide
nanocomposites for NO2sensing at low operating temperature, Sensors and Actuators B190,
(2014) 472– 478
18. Q. Lin, Y. Liand M. Yang, Tinoxide/graphene composite fabricated via a hydrothermal
method for gas sensors working at room temperature, Sensors and Actuators B 173, (2012)
139– 147
19. A. Johari, V. Rana and M.C. Bhatnagar, Synthesis, Characterization and Ethanol Sensing
Properties of Tin Oxide Nanostructures, Nanomater. nanotechnol., 1(2), (2011) 49-54.
Copyright © 2022 FDOKUMEN