Plasma-enhanced chemical vapor deposition of low-loss SiON optical waveguides at 1.5-µm wavelength

~ ) Pergamon Prog. Polym. Sci., Vol. 19, 389-438, 1994
Copyright © 1994 Elsevier Science Ltd Printed in Great Britain. All rights reserved.
0079-6700/94 $26.00
P O L Y M E R T H I N F I L M S P R E P A R E D BY V A P O R D E P O S I T I O N
ATSUSHI KUBONO a n d NORIMASA OKUI
Department of Organic and Polymeric Materials, Tokyo Institute of Technology, O-okayama, Meguro-ku, Tokyo 152, Japan
C O N T E N T S
1. Introduction 2. Vapor deposition of organic molecules
2.1. Comparison of Langrnuir-Blodgett and vapor deposition films 2.2. Molecular orientation behavior of organic molecules 2.3. Mechanisms of molecular orientation in organic thin films
3. Vapor deposition of polymers 3.1. Thermal degradation during vapor deposition 3.2. Vapor deposition of polyethylene 3.3. Vapor deposition of poly(vinylidene fluoride) 3.4. Vapor deposition of 7r-conjugated polymers
4. Vapor deposition polymerization 4.1. Historical view on vapor deposition polymerization 4.2. Epitaxial vapor deposition polymerization 4.3. Vapor deposition polymerization with self-molecular orientation 4.4. Dipole orientation during vapor deposition polymerization
5. Conclusions References
389 391 391 396 403 410 410 412 415 420 420 421 425 428 433 435 437
1. I N T R O D U C T I O N
Organic thin films with highly ordered structures are of great interest because of their potential use in the fields of electronics and optics.l'2 A number of studies have been made on the applications of such materials. Applications include chemical, physical and biological sensors, electronic devices, non-linear optical and molecular devices. These devices can be formed by assembling monomolecular layers of specified organic materials. In spite of a large number of studies in this area, only in a few cases have these materials been successfully used for electronic and optics- based applications. This is mainly because organic thin films often show poor thermal and chemical stabilities and poor mechanical toughness. It is of interest, therefore, to create polymeric thin films of high quality for a variety of technological applications. 3
Many techniques for producing polymeric thin films have been investigated 3 as shown in Fig. 1. Ultra thin organic and polymeric films can be prepared in two ways: one includes wet processes like Langmuir-Blodget t (LB), spreading, dipping or solvent casting methods. The other is dry processing, such as vapor deposition, sputtering, chemical vapor deposition, plasma polymerization or vapor deposition polymerization methods. Of these methods, solvent casting of polymeric films is one of the most common means for applying optical and electron beam resists on
389

390 A. KUBONO and N. OKUI
Preparation of Polymer Thin Films
I i,ot Procossi
I I
IPolymer SolutionJ
Dry Process I
I Polymerization
I ~-~ Elecltro -
Polymerization
I I F ¥apor Sputtering Plasma
Deposition
--1 Light
Yapor Deposition
Polymerization
FzG. 1. Preparation methods for polymeric thin films,
silicon wafers. Such films generally have a minimum 0.5 #m thickness. This technique, however, cannot control molecular orientation.
The LB method is useful for forming highly ordered thin films of amphiphilic materials and can also produce polymeric thin films having molecular orientation. The LB method can itself be classified into three different processes, 4'5 (1) polymer- ization of LB films of a monomer after deposition, (2) deposition of a polymeric monolayer polymerized from the monomeric monolayer on a water surface and (3) deposition of the polymer monolayer prepared from a polymer solution on an aqueous surface.
Physical vapor deposition (PVD), one of the most common dry processes, is classi- fied into two methods. One is vapor deposition (VD), which is sometimes called thermal evaporation, that gives polymeric thin films by evaporation of the source polymeric material with heating or an irradiating laser beam. However, the deposition process can give rise to a decrease in the molecular weight of the resulting film. The other method is sputtering, which involves decomposition and reaction to form another compound.
The chemical vapor deposition (CVD) method, such as plasma polymerization, is frequently used to make polymeric thin films. 6 The CVD method, however, generally produces some by-products which may act as contaminants in the thin film. The vapor deposition polymerization (VDP) technique, having characteristics of both the PVD and CVD methods, has been employed for the preparation of thin films ofpolyamides and polyimides. 7 The process utilizes the co-evaporation of two kinds of monomers with reactive functional groups at each of the chain ends, such as bifunctional diamines and dicarboxylic acid dichlorides.
This review will focus on a vapor deposition method which gives rise to organic thin

P O L Y M E R T H I N FILMS P R E P A R E D BY VAPOR DEPOSITION 391
3O
20
°•o,,° • 4.2 n m
I I ] lo 0 5
Fi lm thickness (nm)
15
Fie. 2. The effect of thickness on surface energy for vapor-deposited zinc stearate films. (a) On glass with a hydrophilic surface. (b) On glass with a hydrophobic surface. 8
films. Special attention will be devoted to the mechanisms by which molecular orienta- tion occurs during this process.
2. V A P O R D E P O S I T I O N OF O R G A N I C M O L E C U L E S
Physical vapor deposition has been employed widely for the production of metal and inorganic thin films. It should be noted that this method can result in organic thin films where molecular orientation is controlled by the deposition conditions. Vapor- deposited thin films of organic, long-chain compounds (e.g. paraffins and fatty acids) have a high degree of molecular order like LB thin films. Below, we will compare the structures and the properties of organic thin films prepared by the vapor deposition and LB methods.
2.1. Comparison of Langmuir-Blodgett and vapor deposition films
Figure 2 shows the effect of film thickness on the surface energy of a film as measured by a contact angle method for a vapor-deposited zinc stearate film. 8 Curves a and b show the surface energies of films deposited onto glass substrates with hydrophilic and hydrophobic surfaces, respectively. The surface energies of these films vary periodically and the periodical thickness is about 4.2nm, which coincides with twice the molecular length. This result indicates that the chains are deposited onto the substrate with a molecular orientation that is perpendicular to the substrate surface. Moreover, the phase of the periodic change in surface energy shifts by a half-period depending on whether the substrate surface is hydrophilic or hydrophobic. This suggests that the molecules at the first layer adhere with their polar end groups facing toward the hydrophilic substrate. In contrast, the hydrocarbon ends of these molecules are adsorbed on the hydrophobic substrate as shown in Fig. 3. Such alignments are similar to those for a Y-type LB film.
Figure 4 shows X-ray diffraction patterns for a cadmium stearate LB film (a) and a stearic acid VD film. 9 Both patterns show many diffraction peaks relating to (00l) spacings of each crystal. Thus both types of film possess layered structures. However, the intensities of the diffraction peaks for the VD film are smaller than those found for the LB film because of a difference in electron density between layers. In general, profiles of X-ray diffraction patterns give information about crystaUite size and crys- talline distortion on the basis of Hosemann paracrystal theory.
392 A. KUBONO and N. OKUI
4-- 4.2 nm
Hydrophilic surface
Hydrophobic surface
li 00 --00-- O0 00-- 00-- --0 0 O-- --00-- 0 0 O-- --00-- 0 O-- --0 00-- --00-- 0 0 - - 0 0 - -
O 0 O 0 ' 0 O 0 O 0 0 O 0 O 0 O 0 O 0 0 O 0 O 0 0 O 0 O 0 O 0 O 0 O 0 ..,0
Z Alkyl chain Polar group
FIG. 3. Schematic illustration of the structures of zinc stearate thin films prepared on hydro- philic and hydrophobic surfaces by vapor deposition. °
Kaj iyama et al. have investigated the crystallite size and the crystalline dis tort ion along the longitudinal direction for LB films constructed f rom several bar ium salts o f fatty acids, such as 21 monolayers of bar ium palmitate (2C16Ba), bar ium stearate (2C18Ba) and bar ium behenate (2C22Ba). 1° Table 1 gives the crystallite size (D), the crystalline dis tort ion (g), the observed bimolecular length (do) and the calculated bimolecular length (de) based on a molecular model of the mos t closed packing state. 2C16Ba, 2C18Ba and 2C22Ba were deposited at a surface pressure of 20, 30 and 35 m N / m , respectively, at which pressure each monolayer is morphological ly homo- geneous. The value o f de is calculated on the assumpt ion that the diameter of a bar ium ion is 0.8 nm on the basis of the electron density distr ibution of the 2ClsBa LB film. The difference, Ad = de - do, decreases with increasing alkyl chain length. This sug- gests that the conformat ion of alkyl chains tends to be more extended with increasing
,.o
I x
I I I
5 10 15
Bragg angle 20 (degrees)
FIG. 4. X-ray diffraction patterns of (a) an LB multilayer of cadmium stearate and (b) a thermally evaporated film of stearic acid o n glass. 9

POLYMER THIN FILMS PREPARED BY VAPOR DEPOSITION 393
TABLE 1. Crystallite size and distortion of fatty acid salts LB films with different alkyl chain length along longitudinal direction l°
Observed Calculated bimolecular bimolecular Crystal Distortion length do01 length dc Ad size Llong Dlong
Amphiphiles (nm) (nm) (nm) (nm) (%)
2C16Ba 4.46 5.07 0.61 46.8 3.7 2C18Ba 5.06 5.57 0.51 56.8 2.8 2C22Ba 6.15 6.57 0.42 59.4 2.4
alkyl chain length, because the value of dc corresponds to the length of the almost extended chain length. The value of D is almost identical to the thickness of 21 monolayers. The crystalline distortion g decreases with an increase in the alkyl chain length. These results indicate that an increase in the intermolecular aggregation force causes more perfect crystalline regularity and larger crystalline continuity along both longitudinal and lateral directions in LB films.
A similar analysis can be applied for VD films prepared from two kinds of paraffin. Table 2 gives the crystallite size and crystalline distortion along a direction normal to the substrate surface, corresponding to the [001] direction, under various deposition conditions. A high substrate temperature and/or a low deposition rate results in a large crystallite size and a small crystalline distortion. The crystal perfection tends to become poorer as chain length increases, this is in stark contrast to the results shown for the LB films earlier.
Table 3 shows the characterization of w-tricosenoic acid films prepared by both vapor deposition and LB methods. 11 The VD films were prepared at deposition rates of 0.01-0.13 nm/s. The X-ray diffraction patterns for the LB film and the VD film deposited at 0.01 nm/s exhibit only 001 reflection peaks. Thus the molecules are preferentially oriented perpendicular to the substrate surface. However, in the diffrac- tion pattern of a VD film deposited at 0.13 nm/s, the (110) diffraction peak is also observed together with the (001) peaks. Thus, the molecules tend to align with both perpendicular and parallel orientations. The chain tilt angle/~ to the substrate surface can be estimated from the layer spacing data determined by X-ray diffraction. The layer spacings in the LB films are larger than those for the powder, and they increase with increasing surface pressure applied during the deposition. The layer spacings of the VD films are nearly equal to those for the crystalline powder. These a:-tricosenoic acid films can be polymerized by electron beam (EB) exposure.
TABLE 2. Crystallite size and distortion of paraffin thin films prepared by vapor deposition (thickness: 100 nm)
Substrate Deposition Crystallite Carbon temperature Supercooling rate size Distortion number (°C) (°C) (nm/s) (nm) (%)
40 75 6.7 0.12 76.6 1.46 75 6.7 0.99 58.0 1.61 13 68.7 0.11 55.0 1.98
24 25 25.6 10.0 65.9 0.62 - 100 150.6 0.10 62.4 0.97 -100 150.6 9.4 63.5 1.47

394 A. KUBONO and N. OKUI
TABLE 3. Characterization of w-tricosenoic acid films H
Molecular In-plane 001 Sl3acing 13 orientation anisotropy (A) (deg.)
Powder - - 48.9 LB film (20 dyn/cm) - - 53.2 57 LB film (25 dyn/cm) + + 54.8 60 LB film (30 dyn/cm) + + 56.3 63 VD film (0.01 nm/s) + - 49.6 52 VD film (0.13 nm/s) - - 49.6 52
+, observed; - , not observed. 13 is the molecular tilt angle to the substrate plane.
Figure 5 shows the relationship between the molecular tilt angle and sensitivity, which is defined as the dose necessary to maintain half-thickness after development followed by EB exposure, corresponding to the polymerizability in the film. Develop- ment on the w-tricosenoic acid film is carried out using ethanol as the developer. The minimum in the curve suggests that an optimum molecular tilt angle is required for polymerization in the multilayered films. The multilayer structure with a perpen- dicular molecular orientation is an important factor for polymerization because the sensitivity of the VD film with its molecules aligned in both perpendicular and parallel orientations at the deposition rate of 0.13 nm/s is the lowest in all the films. Therefore, the polymerizability in multilayered films may be a function of both steric factors among the reactive sites and molecular mobility associated with the crystal struc- ture. These results confirm that the vapor deposition method can produce highly ordered structures similar to those obtained by the LB method for organic compounds.
Furthermore, the VD method can produce not only multilayered films but also monomolecular films on a substrate. For example, when perfluorocarboxylic acid is deposited on a hydrophilic surface, the molecule is deposited in the first layer with its polar group facing toward the substrate. 12 Further deposition of molecules onto the first layer is accompanied by successive re-evaporation of molecules because of the small surface energy associated with the small polarizablity of the constituent fluorine atoms. This process results in a monomolecular film. Such monomolecular
10
E
;;,.-.
>
>2 1.0
0.1
-", VD fi lm
0 0
0
LB films
5'0 6~0 Molecular tilt angle (degrees)
FIG. 5. Relationship between the sensitivity and the molecular tilt angle in w-tricosenoic acid films. 12

POLYMER THIN FILMS PREPARED BY VAPOR DEPOSITION 395
1 i
2000 1500 10'00 600
Wavenumber (crn -I)
FIG. 6. Infrared spectra of bulk n-perfluorodecanoic acid (a). Deposited film of n-perfluoro- decanoic acid (b) and zinc salt of n-perfluorodecanoic acid (c). 17
films of amino acids, 13 tetrathiofulvalene, 14 tetracyanoquinodimethane, 14 iron phthalocyanine 15 and merocyanine 16 have been prepared by precisely modulating vapor pressure, exposure time and the type of substrate. Of these deposition para- meters the surface energy of the substrate plays an important role in the formation of monomolecular films. That is, interactions between molecules and the substrate or among neighboring molecules strongly influence deposition characteristics. A strong interaction enhances the adsorption of molecules onto the substrate while a weak interaction accelerates the re-evaporation of molecules from the deposited surface. In other words, the strong and weak interactions can be related to chemical and physical adsorption (chemisorption and physisorption) mechanisms, respectively. For example, the carboxylic group in perfluorocarboxylic acid is adsorbed on a hydrophilic substrate forming ionized species, resulting in a strong adsorption on the substrate. Figure 6 shows infrared (IR) spectra of n-perfluorodecanoic acid depos- ited on KBr, a film of a bulk sample and a film of the zinc salt. 17 The bulk sample shows C=O stretching for R - C O O H at 1750 cm -1 . This absorption is not found in the deposited film, but a new absorption appears at 1620 cm -1 . This new peak is assigned to the asymmetric stretching mode of C O 0 - since the zinc salt also has an absorption in this region.
In LB films of stearic acid, the first adsorbed layer is ionized, forming C O 0 - ions. 18 Therefore, the first layer of the deposited film consists of an ionized perfluoro- carboxylic acid which interacts with the substrate surface. The film surface is com- posed of CF3 groups according to the surface energy as determined by contact angle measurements. The film thickness measured by an optical method and by a quartz oscillator indicate the formation of a monomolecular layer. That is, once the substrate is covered with a perfluorocarboxylic acid monolayer (strong chemical adsorption), the surface yields a low energy characteristic and another layer cannot be deposited (weak physical adsorption).

396 A. KUBONO and N. OKUI
E 2 &
1
E- o_,yn. i , 0 . 5 n m ,,
O N O F F
I I
0 1000 2000
Experimental Time (s)
Fro. 7. Amount of DAH admolecules as measured with a quartz crystal thickness monitor as a function of time. 19
The difference between chemical and physical adsorption mechanisms can be easily monitored by a quartz crystal oscillator. 19 Figure 7 shows the film thickness change during vapor deposition of 1,7-diaminoheptane (DAH) onto an azelaoyl- dichlorides (ADC) film deposited previously. Here, the two monomers DAH and ADC can be deposited alternately as controlled by monomer supply from an outside system. First, ADC monomer is deposited onto a gold-coated quartz crystal substrate with a normal molecular orientation. The monomer supply is then terminated. Next, when DAH monomer is introduced into the system as indicated by ON in Fig. 7, film thickness increases with the exposure time of DAH. Initially, DAH monomer is chemically adsorbed onto the ADC film surface with the elimi- nation of hydrochloric acid to form the first layer. Further deposition over the first DAH layer occurs by physical adsorption. The chemical adsorption is a rapid adsorption process and the following slower adsorption can be associated with physical adsorption as noted in Fig. 7. Interestingly, film thickness decreases to 0.5 nm when the input of DAH is terminated. Therefore, the physical adsorbed DAH can re-evaporate from the film surface in the vacuum system, whereas the first layer of the chemical adsorbed DAH is stabilized on the ADC surface by chemical bonding. The remaining film thickness (0.5nm) is almost identical to the molecular length of DAH.
2.2. Molecular orientation behavior of organic molecules
Organic thin films prepared by vapor deposition can exhibit molecular orientation perpendicular or parallel to the substrate surface. These two types of orientation are sometimes termed normal orientation and lateral orientation, respectively. It is inter- esting to study the mechanism of molecular orientation during the vapor deposition process. The molecular orientation of linear long chain molecules affords different vapor deposition behavior as compared with that for planar molecules like phthalo- cyanine. In this section, we focus on the mechanisms for molecular orientation in organic thin films during the vapor deposition process.

POLYMER THIN FILMS PREPARED BY VAPOR DEPOSITION 397
2.2.1. P a r a f f i n s - Molecular orientation in paraffin thin films can be either perpen- dicular or parallel to the substrate surface depending upon deposition conditions e.g. substrate temperature and deposition rate. 2° Figure 8 shows X-ray diffraction patterns and scanning electron micrographs for C40H82 paraffin films prepared at three different substrate temperatures. Low substrate temperatures give molecular orientations parallel to the substrate surface (lateral orientation) and rod-like crystals align parallel to the substrate (Fig. 8(a,d)). On the other hand, high substrate temperatures afford molecular orientations perpendicular to the substrate (normal orientation) and a smooth film surface (Fig. 8(c,f)). At intermediate substrate temperatures, the resulting films show characteristics of both film structures (Fig. 8(b,e)).
Figure 9 shows that the amount of normal orientation versus lateral orientation increases with an increase in substrate temperature. This also depends on the molecular chain length of paraffin; a longer molecular length affords a larger propor- tion of crystals with a lateral orientation. Figure 10 shows the relationship between the ratio of orientation and supercooling AT (= T m - Ts), which is defined as the difference between the melting temperature (Tin) of the sample and the substrate temperature (Ts). z° The supercooling can be influenced not only by substrate tempera- ture but also by the chain length of the paraffin. According to Fig. 10, a small super- cooling gives a normal orientation, whereas a high supercooling favors a lateral orientation.
Under the condition of large supercooling, molecular orientation is also influenced by molecular flux as shown in Fig. 11 (open circles). The molecular flux is defined as the number of molecules arriving at the substrate surface of unit area during a unit period of time. The proportion of normal oriented molecules in the film decreases with an increase in molecular flux, whereas smaller supercooling gives rise to an indepen- dence on molecular flux (closed circles in Fig. 11).
2.2.2. L i n e a r a l i p h a t i c f a t t y a c i d s - Thin films of fatty acids and fatty acid salts with normal orientation can be prepared by vapor deposition as with the LB method. When stearic acid is deposited onto alkali halides, such as KC1, mica, amorphous carbon or slide glass, the resulting films show various types of molecular orientation depending on the deposition conditions. 21 Supersaturation, defined as tr = ( P - P o ) / P o , is found to be the most important parameter for the vapor deposition of stearic acid. P and P0 are the actual vapor pressure of stearic acid and the equilibrium vapor pressure at the substrate temperature, respectively. Figure 12 shows the relationship between the concentration of lateral growth hillocks and supersaturation at different substrate temperatures. This result might be influenced by deposition conditions at a relatively large supercooling, in view of the results for paraffin deposited at large supercooling as shown in Fig. 11. In fact, the degree of supercooling under deposition conditions for stearic acid is about 35-60°C (Tin = 69.6°C, Ts = 10-35°C).
The effect of supercooling on molecular orientation for stearic acid films is further clarified by the chain length dependence of the stearic acid. The curves in Fig. 13 show the relationship between substrate temperature and the degree of parallel orientation. The curves shift to a higher temperature with an increase in carbon number for the fatty acids. Since, in general, melting points of fatty acids increase with an increase in the carbon number, the larger carbon number gives a larger supercooling. Therefore, a thin film with a higher degree of parallel orientation can be prepared under the

398 A. KUBONO and N. OKUI
I
(b)
I I
1.5 20 40
Bragg angle 20 (degrees)
(a)
2 ~ K U X 1 0 , 0 0 0 l ~ m 1 1 2 6 2 2
FIG. 8. X-ray diffraction patterns and scanning electron micrographs of C40 paraffin films prepared by vapor deposition at substrate temperatures of (a,d) -100, Co,e) 15 and (c,f) 75°C. 2°

POLYMER THIN FILMS PREPARED BY VAPOR DEPOSITION 399
100 -" "-
.0
50
0 v
- 2 0 0 -100 0 100 2 0 0
Substrate temperature (°C)
FIG. 9. Plots of the lateral orientation factor of n-C40H82 thin film vs the substrate temperature. 2°
0
0J
0
o
100
50
A 8
0 ~
0 100 200
Supercooling AT (°C)
Fm 10. Plots of the lateral orientation factor of paraffin thin films against the degree of supercooling. Closed circles (1-3) refer to changes in the melting temperature for various paraffins with carbon numbers of 20, 22 and 24 at a substrate temperature of 25°C. Open circles (4-8) refer to changes in with carbon number of 24, 26, 28, 36 and 40 at 15°C. Closed
triangle refers to changes for n-C4oH82 at 82°C. 20
100
f - ©
...~ c~
5O .r~ ©
0
12 16 ' 14 '
log ~ (tool cm -2 s - t )
FIG. 11. Plots of the lateral orientation factor against molecular flux. Open and closed circles refer to C40-paraffin layers deposited at substrate temperatures of 25 and 75°C, respectively. Closed triangle refers to a C24-paraffin layer deposited at a substrate
temperature of 25°C. 2°

400 A. KUBONO and N. OKUI
0
,...,
0
40
30
20
10
zx Ts =10"C 0 25 • 35 0
o
0 0
o
10 Supersaturation
Z~
, i
100
Fro. 12. Relationship between the concentration of lateral growth hillocks and supersatura- tion for stearic acid thin films at different substrate temperatures. 21
conditions of larger supercooling. This result for fatty acids is similar to that for paraffins as mentioned in the previous section.
Thin film structure is also strongly influenced by the interaction between the sub- strate and molecules, as detailed in Fig. 14. 22 Stearic acid films on three different substrates, indium, copper and gold, show similar diffraction patterns while their intensities differ. The peaks can be characterized in terms of (001) diffractions, whose half-widths are almost the same for the three films. These results suggest that the film on indium has the highest molecular orientation and a high degree of crystal- linity. Totally amorphous films can be prepared by vapor deposition of perfluoro-n- alkane (n-ClaF30) on a CsI substrate kept at -265°C. The amorphous film can be crystallized at temperatures between -138°C and -123°C. 23
Cadmium arachidate can be deposited on a KC1 surface with a lateral molecular orientation. The molecules are grown epitaxially along the < 110 > direction of KC1. Figure 15 shows an electron micrograph for a thin film of cadmium arachidate vapor- deposited on a KCI substrate along with its optical diffraction pattern. The micro- graph shows growth edges based on lattice fringes with a width of 5 nm corresponding to the (001) spacing of the crystal. 24 The monomolecular steps and the lateral growth
100
~ 50 e~
e- o .:.-~
5 0 t - O
-1'0 ()
C 2 2
C2o
10 20 30 40 50
Substrate temperature (°C)
FIG. 13. Relationship between substrate temperature and concentration of lateral orientated (p-oriented) crystals for several linear carboxylic acids. 2]

POLYMER THIN FILMS PREPARED BY VAPOR DEPOSITION 401
==
>. ,
I X
(c)
i i I
3 10 20 30
Bragg angle 20 (degrees)
FIG. 14. X-Ray diffraction patterns of monocarboxylic acid films (thickness in parentheses). (a) Stearic acid on indium oxide ( l l3nm), (b) copper (100nm) and (c) gold (330nm).
(d) Behenic acid on copper (104 nm). (e) Melissic acid on copper (123 nm). 22
FIG. 15. High resolution transmission electron micrograph (a) of lateral growth hillocks in a vapor-deposited cadmium arachidate film and its optical diffraction pattern (b). The sharp
crystal steps and the small nuclei are indicated by arrows. 24
402 A. KUBONO and N. OKUI
t -
.= I
10 20 30 35
Bragg angle 20 (degrees)
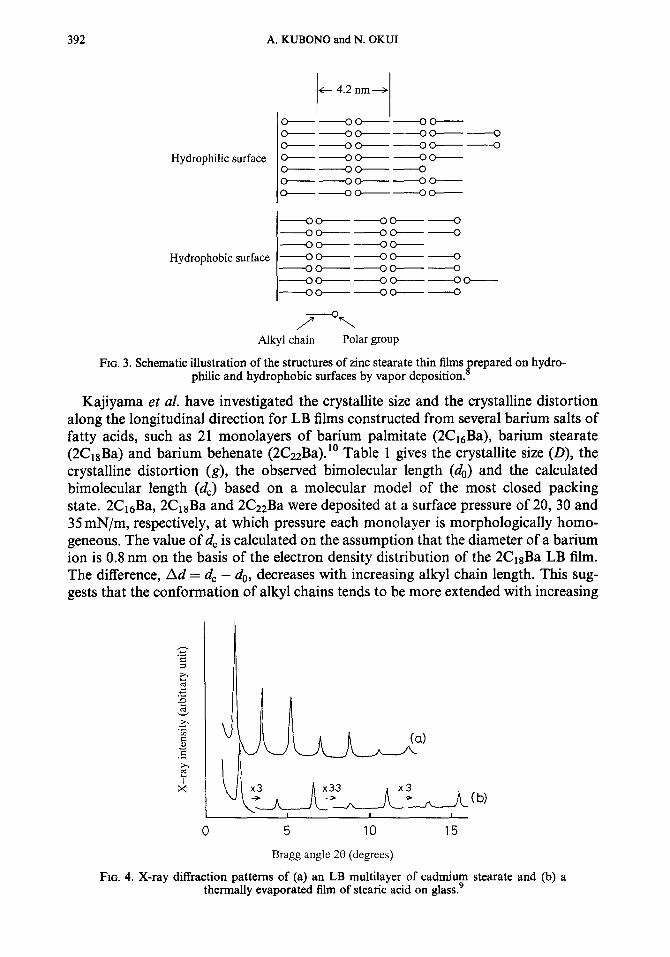
FIo. 16. X-Ray diffraction patterns of 1,10-decane-dicarboxylic acid thin films prepared on Au, glass with a hydrophobic surface and glass with a hydrophilic surface. 25
ends (Kink) are clearly found in the electron micrograph. From the thin crystal morphology, the crystal growth rate along the [110] direction (Vl10) is much faster than that along the [001] direction (V001). The ratio of Vl lo /Vool is estimated to be about 10-50, which is 2-8 times larger than that for the case of solution growth. Crystal growth parallel to the substrate surface is controlled by the generation of steps, whereas the step completion rate along the crystal surface is considerably more rapid. In other words, the crystal growth rate is controlled by the secondary nucleation on the crystal growth surface.
When a dicarboxylic acid is deposited on a glass substrate, the molecules tend to orient parallel to the substrate because of the strong interaction between the two chain ends in the molecule and the substrate via hydrogen bonding. With an increase in the interaction energies, the molecules are more difficult to crystallize on the substrate because of a loss of molecular diffusion. For example, Fig. 16 shows X-ray diffraction patterns of 1,10-decane-dicarboxylic acid deposited on three different substrates: Au- coated surface (a), glass surface (b) and hydrophobic surface (c). 25 On the hydrophobic surface, a strong (110) peak is found in the X-ray diffraction pattern, indicating a parallel molecular orientation on the substrate. On the other hand, only a small (110) peak is found on a glass surface and no peaks on a gold surface, indicating a decrease in the degree of crystallinity of the deposited films with an increase in the interaction force.
2.2.3. A r o m a t i c m o l e c u l e s - Aromatic molecules can also be deposited with a mole- cular orientation perpendicular or parallel to a substrate. For example, an aromatic molecule substituted with a long chain alkane, such as 12-(1-pyrenyl)-dodecanoic acid, is easily deposited on a substrate. 26 The structure of the deposited film is different from that of a solvent cast film and does not favor the parallel geometry of pyrenyl groups which give rise to a sandwich excimer. Co-deposition with stearic acid decreases the chromophore concentration in the film.
On the other hand, large heterocyclic organic molecules such as plate-like molecules can be deposited with molecular orientation parallel or normal to a substrate. Aro- matic molecules having localized molecular orbitals of 7r-symmetry in the chains interact with their aromatic rings and strongly with a substrate. Such strong interac- tions gives rise to the formation of a column-like structure. For example, a copper

POLYMER THIN FILMS PREPARED BY VAPOR DEPOSITION 403
A B b-axis
> 5
/ / / / / / / / / / / / / \ \ \ \ \ \ \ \ \ \ \ \ \ / / / / / / / / / / / / / \ \ \ \ \\\\\\\\\
Substrale plane
FIG. 17. Schematic illustrations of two types of orientation in vapor-deposited Cu-phthalo- cyanine ftlms. 13
phthalocyanine (CuPc) is grown heteroepitaxially on an alkali halide surface. 27'28
Epitaxial growth of CuPc is confirmed by reflection high-energy electron diffraction (RHEED). 29 In addition, two types of CuPc thin films with different column orienta- tions can be deposited on a mica surface as shown in Fig. 17. 27,30 One is a deposited film with the b axis oriented parallel to the substrate (kept at 150°C), where the molecules are aligned perpendicular to the substrate. The other is the film prepared on the substrate kept at 150°C after heating at 400°C for 1 h to remove adsorbed water. This film is constructed with the b axis tilted at about 25 ° with respect to the film plane. These results show that molecular orientation is strongly dependent on substrate conditions. Hydrophobic phthalocyanine molecules tend to align perpendicular to the hydrophilic substrate surface where water is adsorbed. On the other hand, mole- cules lay down on the substrate devoid of adsorbed water because of a strong inter- action between the molecules and the substrate.
The molecular orientation of CuPc is also strongly dependent on substrate tempera- ture. With large supercooling, the molecules are deposited randomly onto the sub- strate and are adsorbed on the substrate with strong interaction. Molecules with a lateral orientation cannot be crystallized but the smaller portion of normal oriented molecules can be crystallized, giving the film an almost amorphous state. With increases in substrate temperature, the adsorbed molecules will crystallize to form a film with a lateral molecular orientation. Further increases in substrate temperature give rise to a re-evaporation of the adsorbed molecules, affording a film with a normal molecular orientation on the substrate.
2.3. Mechanisms of molecular orientation in organic thin films
Organic molecules can be evaporated from a solid state (sublimation) or from a molten state (boiling). Figure 18 shows the logarithm of deposition rate for three different linear molecules; paraffin Cz2, stearic acid and 1,10-decamethylene- dicarboxylic acid, as a function of reciprocal evaporation temperature. Two straight, intersecting lines are observed for both the paraffÉn and stearic acid, with cross-over points that are associated with their melting points. That is, the molecules are sublimed below their melting point. On the other hand, the evaporation rate of the dicarboxylic acid suddenly increases beyond the melting point because of a loss in hydrogen bonding. Thus, the chain end effect plays an important role not only in evaporation characteristics but also in the deposition behavior on a substrate.

404 A. KUBONO and N. OKUI
E
.= t - O
©
£3
10-1
10-2
(a)
J
2.9 2.8 310
Reciprocal evaporation temperature (10 -3 K -1)
101
1 E ~=
10 -1 ©
.~_,
©
10 -2
(b)
' i ' 2.0 3 0 4.0
Reciprocal evaporation temperature (10 -3 K -1)
E
¢o
t - O
0
10 2
101
1
10-1
10-2
2.0
o
310
Cc)
4.0
Reciprocal evaporation temperature (10 -3 K -1)
Fie. 18. Temperature dependence of evaporation rate; (a) paraffin, (b) stearic acid and (c) 1,10-decane-dicarboxylic acid.2°
The evaporation rate, v, can be expressed according to the classical molecular gas thermodynamic theory as a function of the degree of supersaturation (or),
u = U o c r e x p { - A E / k T } (1)
where u0 is a constant, k is Boltzmann's constant, T is the temperature of the evapora- tion source and AE is the activation energy for the evaporation of molecules. Activa- tion energies for paraffin molecules are provided in Fig. 19 as a function of the number of carbons in the paraffin. 2°
Here, the boiling point (Tb) in a vacuum system (P) can be estimated from the Clausius-Clapeyron equation.
log P = A - A H b / R T b (2)
where AHb is the heat of evaporation, A is a constant and R is the gas constant. If we assume that the equation can be applied to boiling temperatures for paraffins in a vacuum system, phase diagrams for paraffins can be obtained as shown in Figs 20 and 21 as a function of pressure, temperature and carbon number. The line for boiling temperature is extrapolated to the sublimation line, because sublimation data are not available. Under an evaporation condition of about 10 -4 Pa, a pressure commonly

POLYMER THIN FILMS PREPARED BY VAPOR DEPOSITION 405
4O i © E
30
20
o
> U < I
20 30 z~ Number of carbon atoms (Length of alkyl chain)
FIG. 19. Activation energy of evaporation as a function of the number of carbons in a molecular chain of paraffin. 2°
employed in vapor deposition of organic molecules, paraffin C24 is evaporated through the sublimation line and paraffin C40 is evaporated through the solid-melt-vapor phase. In fact, paraffins with carbon numbers less than 26 are easily sublimed at 10 -4 Pa. These results can be related to the triple point in Fig. 21, corresponding to a carbon number of C28. In the case of long chain length (e.g. polymer chains), the molecules cannot be evaporated without thermal decomposition, which gives rise to a decrease in the molecular weight. This indicates that the boiling point is higher than the thermal decomposition temperature. Therefore, only decomposed molecules can be evaporated. A more detailed discussion will be provided in the next section of this review.
Organic molecules can be evaporated from a crucible in a vacuum system and deposited on to a substrate with a loss in their kinetic energies. These molecules are adsorbed and travel on the substrate with translation, rotation and precession modes
©
O
-5
Solid C ~ ' ~ ~ ° ~
/ ' / / / ~ • _ i I
t / , Gas
-10 0 100 200
Temperature (°C)
FIG. 20. Phase diagram of C24- and C4o-paraffins.

406 A. KUBONO and N. OKUI
150
{D o
& 50 £
-50 0
(at 2 x 10 -5 tort)
Gas
i
25 50 Carbon Number
Fro. 21. Phase d iag ram of paraffins at a cons tan t pressure of 2 x 10 -5 Torr .
as indicated in Fig. 22. When one of the chain ends sticks on the substrate, the chain performs a precession motion with an inclination of the chain from the substrate. The degree of chain inclination is dependent on the substrate temperature and the inter- action force between the molecule and the substrate. 2°'31 For example, Fig. 23 shows the total potential energy for stearic acid adsorbed on KC1 surface as a function of chain tilting angle (0) from the substrate. The potential energies are calculated for a single molecule based on the Coulomb and Lennard-Jones potential. 25 The potential energy becomes minimal when the molecule is parallel to the substrate.
The relative molecular population is related to the degree of surface coverage (O) by molecules. The relative molecular population on a substrate is associated with the ratio of the number of adsorbed molecules on the substrate and the desorbed molecules from the substrate. This depends on the degree of pressure, the substrate temperature and the interaction force. The molecular population with a normal orientation on the substrate increases with decreasing energy of interaction force and with increasing substrate temperatures. In the case of small O's, molecules adsorb just like a mono- molecular adsorption obeying the Langrnuir-type adsorption rule. On the other hand, large O's yield multi-molecular adsorption obeying the BET-type adsorption rule. On re-evaporation, the molecules will be desorbed from the substrate with a normal orientation state rather than with a lateral orientation state because of their adsorption energies. That is, most of the molecules are aligned perpendicular to the substrate via their chain ends when re-evaporation occurs.
When molecules are deposited through the gas-liquid-solid line, a large number of molecules are adsorbed on the substrate as a quasi-liquid state. A liquid state during the deposition process can be confirmed by the fact that the deposition rate of C40
(a) ~_ (b) 9
4~ Substrate
FIo. 22. Schemat ic i l lustrat ions of molecular mo t ion for a l inear chain molecule on a sub- strate: (a) t rans la t ion, (b) ro ta t ion and (c) precession. 2°

POLYMER THIN FILMS PREPARED BY VAPOR DEPOSITION 407
> &
¢..
*6 -1
f (a)
(b)
i I I I I
0 30 60 90
8
FIG. 23. Potent ia l energy of stearic acid molecules on a KCI substra te as a funct ion of molecular tilt angle 0. 3~
decreases with increasing substrate temperature and then suddenly drops beyond the melting temperature (82°C) (Fig. 24). No deposition is found above the boiling temperature (approximately 130°C at 10-STorr). This indicates that the liquid phase exists on the substrate at a temperature below the boiling point. The molecules must be crystallized from a liquid state to form a thin film. With such film formation, molecular orientation is strongly influenced by supercooling. That is, the molecules are aligned randomly, laterally and with normal orientation depending on the substrate temperature. Here, paraffin molecules can be crystallized just below their melting temperature at a small supercooling such as A T = (0.05-0.07)Tm .32 On the other hand, when molecules are deposited through the gas-solid line (on the sublimation line), the molecules are adsorbed with monomolecular order having normal orien- tation, resulting in a thin film with normal molecular orientation.
Molecular population and molecular orientation are strongly related to nucleation and crystal growth mechanisms. The adsorbed molecules will assemble to form a nucleus with a normal or lateral molecular orientation as shown schematically in Fig. 25. Here, a crystal habit (plate-like or needle-like) is a result of the ratio of crystal growth rate along three dimensional directions, Vx, Vy, Vz, as shown in Fig. 25. The order of the growth rate is Vx > Vy >> Vz. In fact, Vl10 (associated with Vx, Vy) is much faster than V001 (associated with Vz) as noted in the previous section. Once a nucleus is established on the substrate, the adsorbed molecules are incor-
2.0
;t3
1.o
O
0.0 . . . . -200 -100 0 100 200
Substrate temperature ( °C )
FIG. 24. Depos i t ion rate for C40-paraffin as a funct ion of subst ra te temperature . 2°

408 A. KUBONO and N. OKUI
vx> vy>> v z
J
Fie. 25. Schematic illustration of crystal growth of molecules with anisotropy in the crystal growth rates.
porated first at the lateral edge of the crystal, associated with the fast Vii0, and then more slowly on the crystal end surface, associated with the slow V001. When lateral crystal growth is completed on the substrate, a new nucleus is generated on the crystal surface on the basis of a secondary nucleation mechanism. These crystal growth mechanisms give rise to a plate-like crystal from the nucleus with a normal molecular orientation and a needle-like crystal from the nucleus with a lateral molecular orientation.
The mechanism for the re-orientation of molecular chains during an annealing process has been studied by time variation in the X-ray intensities of 006 and 110 reflections from C33 paraffin films deposited on a glass substrate. 33 The intensities of the 006 and 110 reflections increase and decrease, respectively, with annealing time. These results suggest that the number ofcrystallites with a normal orientation increase and those with a lateral orientation decrease as a function of time. The mechanism for the molecular re-orientation during annealing can be expressed by the following equation.
dnn( t ) / d t = k{nn(OO) - nn(/)}, (3)
where nn(t) is the number of crystallites with normal orientation at time t, nn(OC) is the total number of crystallites which can be transformed to normal orientation by thermal fluctuation at a given annealing temperature and k is the transition rate for normal orientation. Here, the reduced X-ray intensity (defined by eq. 4) is shown in Fig. 26 as a function of annealing time.
•006 = {nn(t) - n°)/(nn(CX~) - n O} (4)

POLYMER THIN FILMS PREPARED BY VAPOR DEPOSITION 409
I
;< 0
l
o
I 1 I 10 1C 10 3
Annealing time (rain)
Fro. 26. X-Ray intensity of 006 reflection for the vapor deposited C33 paraffin thin film as a function of annealing time. 33
All data at different annealing temperatures can be fitted with eq. 4. Further data analyses for the rate constant suggest that molecular re-orientation proceeds with groups consisting of about four paraffin molecules.
The film formation process in the vapor deposition of organic molecules can be summarized as indicated in Fig. 27. The supersaturation of molecules in a vacuum system is a fundamental parameter influencing film formation during vapor deposi- tion. For a small supersaturation and a weaker intermolecular force than the
~laterials
Evaporation (Sublimation. Boiling)
Low Supersaturation ttigh Supersaturation Deposition
Adsorption/Re-Evaporation
~onomolecular [ on the Substrate Adsorption
Multi-molecular Adsorption
Normal Orientation
Nucleation, Crystal Growth
Small Supercooling Large Supercooling
Normal Orientation
Lateral Orientation
Random Orientation
FIG. 27. Dependence of molecular orientation on deposition conditions, such as supercooling and supersaturation.

410 A. KUBONO and N. OKUI
interaction between the substrate and molecules, molecules adsorbed onto the sub- strate tend to form a thin layer like a monolayer at the first step of deposition. Once the molecules cover the surface of the substrate to form a monomolecular layer, a thin film is grown layer by layer. In addition, the obtained thin film exhibits a molecular orientation normal to the substrate and the substrate temperature is not dependent on the film structure. On the other hand, a large number of molecules are adsorbed in a quasi-liquid state on the substrate under a high supersaturation of the molecules. For a large supersaturation, the film structure strongly depends on the substrate tempera- ture. The molecules tend to align parallel to the substrate at a lower temperature, whereas a high substrate temperature affords a normal orientation. That is, molecular orientation can be controlled from lateral to normal orientations by decreasing the degree of supercooling. Summarizing these results, the molecular motions on the substrate play an important role in the regulation of molecular orientation lateral or normal to the substrate.
3. V A P O R D E P O S I T I O N OF P O L Y M E R S
3.1. Thermal degradation during vapor deposition
A polymer degrades via thermal energy into smaller molecules. Primary chemical bonds in a polymer chain, such as main chain or side chain bonds, are typically broken at the weakest bond associated with a given dissociation energy. Therefore, thermal degradation of polymers can be characterized by a dissociation energy, for which values are listed in Table 4. 34 There is another characteristic temperature for thermal stability. When a polymer is heated in vacuo for 30min, the weight of polymer decreases by half at a certain temperature, which is defined as T1/2. It has been found that there is generally a good linear relationship between T1/2 (K) and bond dissociation energy Edi s (KJ/mol) as follows:
T1/2 = 1.6Edi s + 140. (5)
There are two types of thermal degradation in polymer chains. These include depolymerization and random degradation. Chain depolymerization is the successive un-zipping from a chain end or a weak link, ultimately resulting in monomer forma- tion. Random degradation involves random chain scission along a polymer chain, resulting in a disperse mixture of chain fragments. Chain depolymerization and random chain scission are often found, respectively, in vinyl polymers and in conden- sation polymers. The two modes of degradation can take place separately or simulta- neously. Table 4 also lists the yield of monomer in the thermal degradation for various polymers. Large and small monomer yields generally indicate main chain scission via chain depolymerization and random degradation, respectively. In vinyl polymers, chain scission can occur at a main chain bond or at a side chain bond. If a side chain is readily eliminated from the polymer backbone, the remaining polymer usually consists of non-volatile char with a conjugated structure. Of these various degradation modes, chain depolymerization and side chain elimination are generally unfavorable for the preparation of polymer thin films by the vapor deposition method.
When a polymer is evaporated from a crucible in a vacuum system and is deposited onto a substrate to form thin polymer films, the polymer degrades randomly in the crucible as a first step. Part of the decomposing fragments are evaporated and the rest

POLYMER THIN FILMS PREPARED BY VAPOR DEPOSITION
TABLE 4. Thermal degradation of polymers 34
411
Monomer Char Td,0 Td,1/2 Ea¢t yield yield
Polymer (K) ( K ) (kJ/mol) (%) (%)
Poly(methylene) 660 687 300 0 0 Poly(ethylene) (by) 653 677 264 0 0 Poly(propylene) 593 660 243 0 0 Poly(isobutylene) - - 621 205 20 0 Poly(styrene) 600 637 230 ,,~50 0 Poly(m-methylstyrene) - - 631 234 45 0 Poly(a-methylstyrene) - - 559 230 > 95 0 Poly(vinyl fluoride) 623 663 - - - - - - Poly(vinyl chloride) 443 543 134 0 22 Poly(trifluoro ethylene) 673 685 222 ,.~1 - - Poly(chloro-trifluoro ethylene) - - 653 239 27 - - Poly(tetrafluoro ethylene) - - 782 339 > 95 0 Poly(vinyl cyclohexane) - - 642 205 0.1 0 Poly(vinyl alcohol) 493 547 - - 0 7 Poly(vinyl acetate) - - 542 - - 0 - - Poly(acrylo-nitril) 563 723 - - - - 15 Poly(methyl acrylate) - - 601 - - 0 0 Poly(methyl methacrylate) 553 610 218 95 0 Poly(butadiene) 553 680 260 2 0 Poly(isoprene) 543 596 250 - - 0 Poly(p-phenylene) > 900 > 925 - - 0 85 Poly(benzyl) - - 703 209 0 - - Poly(p-xylylene) - - 715 306 0 - - Poly(ethylene oxide) - - 618 193 0 0 Poly(propylene oxide) - - 586 147 1 0 Poly(2,6-dimethyl p-phenyleneoxide) 723 753 - - 0 25 Poly(ethylene terephthalate) 653 723 - - 0 17 Poly(dian terephthalate) 673 ~750 - - 0 20 Poly(dian carbonate) 675 ~750 117? 0 30 Poly(hexamethylene adipamide) (Nylon 66) 623 693 - - - - 0 Poly(e-caproamide) (Nylon 6) 623 703 180 - - 0 Poly(p-phenylene terephthalamide) ,,,720 ,-~800 - - - - ,,~ 40 Poly(pyromellitide) (Kapton) 723 ,,~840 - - - - 70 Poly(m-phenylene 2,5-oxadiazole) 683 ~800 - - - - 30 Cellulose 500 600 210 - - 7
(1) The temperature of initial decomposition (Ta,0), at which the loss of weight during heating is just measurable.
(2) The temperature of half decomposition (Td, l/2), at which theloss of weight during pyrolysis reaches 50% of its initial value.
(3) The average activation energy (Eaet), determined from the temperature dependence of the rate of loss of weight.
(4) The amount of char residue at the end of pyrolysis.
f o r m s n o n - v o l a t i l e m a t e r i a l s . F r a g m e n t s o f l o w m o l e c u l a r w e i g h t a r e l o s t f r o m t h e
s y s t e m w h i l e f r a g m e n t s f a l l i n g in a f a v o r a b l e m o l e c u l a r w e i g h t r a n g e a r e d e p o s i t e d
o n t o t h e s u b s t r a t e . E v a p o r a t i o n o f t h e f r a g m e n t s d e p e n d s o n t h e d e g r e e o f v a c u u m
p r e s s u r e , t h e c r u c i b l e t e m p e r a t u r e a n d o n t h e m o l e c u l a r w e i g h t o f t h e f r a g m e n t s . I n
a d d i t i o n , t h e m o l e c u l a r w e i g h t o f t h e f i lm d e p o s i t e d o n t h e s u b s t r a t e is o f t e n a f u n c t i o n
o f s u b s t r a t e t e m p e r a t u r e , s u b s t r a t e s u r f a c e e n e r g y a n d the d i s t a n c e b e t w e e n t h e s u b -
s t r a t e a n d t h e c r u c i b l e . 35 F o r e x a m p l e , a r e l a t i v e l y h i g h s u b s t r a t e t e m p e r a t u r e p r e v e n t s
t h e a d s o r p t i o n o f s m a l l m o l e c u l e s o n a s u b s t r a t e w h i l e v e r y l a r g e m o l e c u l e s c a n n o t
t r a v e l f a r f r o m t h e c r u c i b l e . I n c o n c l u s i o n , t he m o l e c u l a r w e i g h t o f a p o l y m e r in t h e

412 A. KUBONO and N. OKUI
0.1
0.01
I I I I
1.5 1.6 1.7 1.8
E &
©
G
>
Reciprocal absolute temperature (10 -3 K-l)
Fro. 28. Evaporation rate vs reciprocal source temperature for polyethylene showing straight line dependence at temperatures above 350°C. 32
films deposited on the substrate can be effectively controlled by modulating the system pressure, the crucible temperature, the substrate temperature and the distance between the crucible and the substrate.
3.2. Vapor deposition of polyethylene
Vapor deposition of polyethylene (PE) was first carried out by Madorsky 36 under vacuum conditions at about 10 -5 Pa. PE is pyrolyzed in the temperature range of 380-475°C. The products of the pyrolysis consist of a solid residue and a wax-like fraction. A two-phase evaporation process was examined by Luff and White. 37 Figure 28 shows the evaporation rate plotted as a function of reciprocal temperature, where two intersecting straight lines are found. The straight line dependencies below and above 350°C (reciprocal absolute temperature of 1.6 x 10 -3 K -1) suggest activation energies of 14 Kcal/mol and 80 Kcal/mol, respectively. At source temperatures above 350°C, a large weight loss is observed, whereas there is a small weight loss below 350°C. The activation energy of 80 Kcal/mol above 350°C coincides with a bond dissociation energy of 70 Kcal/mol for a thermal degradation of PE. 34 The value of 14Kcal/mol below 350°C coincides with the activation energy of evaporation of n-paraffin with a carbon number of about 23. 38 These results indicate that the low molecular weight fraction of PE, such as paraffinic hydrocarbons, are evaporated at crucible temperatures below 350°C. Above 350°C, PE degrades to low molecular weight fractions by thermal energy. The film deposited on the substrate possesses a relatively sharp molecular weight distribution with a molecular weight around 2300, whereas the original PE sample shows a broad distribution peak as noted in Fig. 29. 39 Here, we can estimate that the carbon number of species evaporated near 350°C, with the activation energy of 80 Kcal/mol, is about 135. This value is in good agreement with the peak molecular weight of 2300 (with the number of carbons about 164).
The evaporation rate (V) is a function of the system pressure (P) during the deposi-

POLYMER THIN FILMS PREPARED BY VAPOR DEPOSITION 413
&
A
9 ----_> 1,000 1QO00 100,000 1,000,000
Molecular weight
Fro. 29. Molecular weight distribution of evaporated polyethylene (A) and original poly- ethylene (B) by a GPC method) 9
tion, the crucible temperature (T) and the substrate-crucible distance (L). The experi- mental relationship among these parameters is as follows: 4°
V= CP/(L2T42), (6)
where C is a constant (Fig. 30). A similar relationship has also been reported by Luff and White. 37
Various shapes of crystals and molecular orientations are found in deposited PE films depending on the deposition conditions. The molecular chains in a thin film are aligned parallel to the substrate when PE is deposited at about 10 -6 Pa on the (001) cleavage faces of alkali halides single crystals kept at room temperature. 39 For the parallel molecular orientation on the substrate, the (110) plane of PE crystal grows in contact with the substrate (110) face as depicted in Fig. 31. At substrate temperatures above 100°C, an ellipse-like crystal is obtained with a molecular orientation parallel to the substrate. Above 150°C, a disk-like crystal is formed having a molecular orienta- tion perpendicular to the substrate. These molecular orientations are similar for the deposition of paraffins.
E e-
>
'7 • Q 4 E
2 i
0 5 - i / 2
P T
oJ J
I I
10 15
(10 6 Torr K -1/2)
FIG. 30. Relationship between the ratio of the growth rate V to L -2 and .PT -1/2 for poly- ethylene. 4°

[010] (CI)
8.90 .~
KC1 [11o]
(b)
b
Fro. 31. (a) Sketch of epitaxial overgrowth of evaporated polyethylene. Co) Relation between the overgrowth plane of polyethylene unit cell and the substrate surface. 39
Such molecular orientation behavior for deposited PE or paraffin can be employed for the study of polymer morphology via electron microscopy. Wittmann e t al. 41 have developed a procedure for the investigation of a fold surface on a PE single crystal. They utilized vapor-deposition of another PE sample on the PE single crystal to investigate surface morphology. Figure 32 shows a schematic illustration of the epitaxial orientation of evaporated PE crystals on a PE single crystal surface. The deposited PE molecules are oriented parallel to the (110) growth face in each sector of
O
414 A. KUBONO and N. OKUI
FIO. 32. Illustration of epitaxial crystal growth of polyethylene on a polyethylene single crystal. 41

POLYMER THIN FILMS PREPARED BY VAPOR DEPOSITION 415
the PE single crystal. A lozenge shape morphology of the PE single crystal is clearly revealed by the orientation of the vapor deposited PE. This technique can be widely applied for the study of polymer morphology.
3.3. Vapor deposition of poly(vinylidene fluoride) Thermal degradation of a fluorinated vinyl polymer strongly depends on its
chemical structure. For example, poly(tetrafluoroethylene) (PTFE) degrades via chain depolymerization to its monomer with a yield of 95%, as indicated in Table 4. On the other hand, poly(trifluoroethylene) (PTrFE) degrades randomly into smaller fragments, whereas side chain elimination of HF occurs with a fraction of 20-60%. Poly(vinylidene fluoride) (PVDF) also degrades randomly along with side chain elimination of HF. This means that a thin film of PVDF can be prepared by the vapor deposition method although the polymer degrades into low molecular weight fractions having double bonds in the main chain.
PVDF is a well-known ferroelectric polymer. Crystals from PVDF can be divided into roughly three crystal forms: a, #, 7. The/3 and 3' forms of PVDF with spon- taneous polarization exhibit piezoelectric and pyroelectric effects, whereas the a form exhibits no spontaneous polarization. 42'43 In general, the a form is obtained when PVDF is crystallized at room temperature from the melt. The/3 form can be prepared by drawing and poling the PVDF film 43 or by quenching a film from the melt. 44 The 3' form can be prepared by annealing the film at a relatively high temperature. 45 In other words, one can obtain a thin film with the a form when PVDF is deposited onto the substrate at room temperatue. The # and the 3' forms of PVDF film can be obtained by vapor deposition when substrate temperature is extremely low or relatively high, respectively. 46'47 In addition, the molecular orientation in a thin film can be controlled by deposition rate, substrate temperature, etc. Thus, the crystal form and the molecular orientation in the PVDF film can be effectively controlled by deposition conditions.
Figure 33 depicts the deposition rate onto a quartz crystal oscillator as a function of the source crucible temperature for PVDF. 46 The deposition rate of PVDF is very low up to a crucible temperature of 300°C and exhibits two abrupt increases at about 300°C and about 350°C. The deposition rate changes in two steps at crucible tempera- tures above 300°C. The initial increase in the deposition rate at about 300°C may be related to chain scission in the main polymer chain and the subsequent increase in the
E
c
0
4
i
100 200 3OO 40O
Temperature (°C)
FIG. 33. Deposition rate of PVDF as a function of the crucible temperature. 46

416 A. KUBONO and N. OKUI
r~
°~
c~
# ",,
100 1,000 I 0,000
Molecular weight
Fro. 34. Molecular weight distribution evaporated PVDF thin films: (a) evaporated at 350°C with decomposition and (b) evaporated at 300°C without decomposition. 46
deposition rate at about 350°C may be associated with scission in a side chain of PVDF. The film deposited below 350°C actually shows trace amounts of double bonds in the IR spectrum. The sample in the crucible gradually turns black above 300°C. Above 350°C, the color of the sample in the crucible is completely black and the deposition rate decreases significantly because of carbonization of the remaining PVDF. That is, at a crucible temperature above 300°C, PVDF is thermally decom- posed. Figure 34 shows molecular weight distribution curves for two types of vapor- deposited PVDF films. The distribution of molecular weight was determined by a gel permeation chromatography (GPC) method. Curve (a) indicates that the film deposited at 350°C consists of thermally decomposed molecules (Mn = 2750) and oligomers (Mw = 420). This low molecular weight fraction is almost equal to the value of Mw = 430 for the oligomer extracted by tetrahydrofuran from the original PVDF. The decomposition gives rise to a rapid drop in molecular weight from about 10 s to around 103. Below 300°C, on the other hand, the color of the sample in the crucible does not change even after 6 h of heating. The molecular weight of a film deposited from the crucible kept at 300°C is about Mn = 415, Mw = 423 (Fig. 34(b)). This means that the thermal decomposition does not take place at crucible tempera- tures below 300°C and only the oligomer included in the original PVDF is evaporated and deposited.
Figure 35 shows IR spectra of PVDF films deposited onto silicon wafer substrates kept at -100, 25 and 125°C with a deposition rate of about 2-3 nm/s and a crucible temperature of 300°C. The films prepared at 25 and 125°C exhibit characteristic absorption bands of the cz form at 770 and 1210cm -1, whereas the film obtained at -100°C exhibits characteristic absorption bands of the 13 form at 840cm -1 and 1173 cm -1. The fraction of the cz form increases and that of the/3 form decreases with an increase in the substrate temperature.
X-Ray diffraction patterns for a PVDF film obtained at a substrate temperature of -100°C show a shallow diffraction peak at 20 = 21 ° and a sharp peak at 20 = 4.8 °. The shallow peak corresponds to the (110) reflection of the/3 form crystal and the sharp peak is related to the (001) reflection of the a form. This indicates the coexistence of parallel molecular orientation of the/3 form and perpendicular molecular orienta- tion of the a form. Many peaks are found for PVDF films prepared at 25 and 125°C, corresponding to the (001) reflections of the cz form. That is, the films with the a form

POLYMER THIN FILMS PREPARED BY VAPOR DEPOSITION 417
8,
E
E- I i
1500 1000 500
Wavenumber (cm -1)
FIG. 35. Infrared spectra of PVDF thin films prepared on the substrates kept at (a) -100 , (b) 25 and (c) 125°C. 47
prepared at 25 and 125°C are assembled with almost perfect molecular orientation perpendicular to the substrate. The 7 form with molecular orientation perpendicular to the substrate is obtained when PVDF is deposited onto the substrate at 125°C at a deposition rate of 1 nm/s. On the basis of the above results, one can draw a phase diagram and illustrate the molecular orientation behavior in PVDF films, as illustrated in Fig. 36. 47 That is, the # form with a molecular orientation parallel to the substrate can be obtained at an extremely low substrate temperature and at a relatively high deposition rate. The a form, with perpendicular orientation, can be prepared at a higher substrate temperature with a relatively high deposition rate. The a form with parallel orientation can be obtained at a medium deposition rate and at a medium substrate temperature, whereas the 3' form with perpendicular orientation can be obtained at an extremely low deposition rate and at a substrate temperature close to the melting temperature of the PVDF crystal.
In addition to these molecular orientations, the dipole orientation in the thin film can be controlled by carrying out vapor deposition in the presence of an electric field along the substrate surface, where vapor-deposited aluminum or gold serve as electrodes. 47'48 For example, when a film is prepared at a substrate temperature of 125°C and a deposition rate of 1 nm/s in the presence of an electric field of 10 MV/m,
& 0.1
0
0
0.01
- 200
2 . . - " _L y - - -
" I I I
- 100 0 100 200
Substrate temperature (°C)
FIG. 36. Crystal form and molecular orientation of PVDF thin films as a function of depo- sition rate and substrate temperature. 47

418 A. KUBONO and N. OKUI
Au electrode ~ • ~ Au electrode
Quartz gloss w,bs,,te ~ / / / / / ~ / / / ~
FIG. 37. Schematic diagram of the substrate with comb-like electrodes.
the molecules in the film are oriented perpendicular to the substrate and the dipoles in the molecules are oriented parallel to the electric field in the comb-like electrode, as illustrated schematically in Fig. 37. 47 An electric field of 10MV/m during the deposition process is smaller than that used for poling (10-100MV/m) of the /3 form PVDF film. The obtained thin film exhibits piezoelectricity d31, for which a temperature dependence is given in Fig. 38 along with that for a PVDF film conven- tionally prepared by drawing and poling. The conventional PVDF film shows a large temperature dependence, especially around the glass transition temperature of about 25°C, whereas the deposited film exhibits a small temperature dependence. Piezo- electricity in polymer films strongly depends on the degree of crystallinity and on the Poisson's ratio. 49 It is reported that a half of the piezoelectric effect for PVDF is due to the Poisson's ratio of PVDF. 49 Such a large contribution of the Poisson's ratio is based on the low degree of crystallinity for polymeric materials. The Poisson ratio changes from a small value to a large value at the glass transition temperature, resulting in a large increase in piezoelectricity. In contrast, the degree of crystallinity for the deposited PVDF film is considerably high so that the temperature dependence of piezoelectricity is quite small.
A film with a ~ form can also be prepared by vapor deposition of PVDF in the presence of electric field to ionize and to accelerate the PVDF fragments in the vacuum system. The effects of ions during the vapor deposition (ionized cluster beam (ICB) method) have been extensively studied on crystal forms and the orientation of inorganic materials 36-3s and the orientation of organic and polymeric materials. 39'4° PVDF films with a fl form can be prepared by the ICB method, which gives a molecular alignment parallel to the substrate and an orientation of the CF2 dipoles perpendicular to the substrate surface and along the applied electric field. 5° The content of ~ form in the film depends on the acceleration voltage and the ionization current. The pyroelectric coefficient of the film is about 1 mC/m2K, which is one-third that for a film prepared by stretching and poling.
The dipole alignment in a PVDF film is also observed for substrate temperatures between -130 and 100°C under an electric field of 16 MV/m. The degree of dipole orientation can be estimated from the ratio of nonlinear optical susceptibility compo-

POLYMER THIN FILMS PREPARED BY VAPOR DEPOSITION 419
&
30
20
I0
o , "~%%-?" " -I 50 -I00 -50
.o
Film / ¢
/
0 /
- Deposited Film
i i
o 50 IOO
Temperature (°C)
FIG. 38. Piezoelectric constant d3x as a function of temperature. (a) A vapor-deposited P V D F film and (b) a stretched P V D F film. 42'49
nents as a function of the deposition conditions. 4s Figure 39 shows the intensity profiles of the second harmonic generation (SHG) in the deposited PVDF film pre- pared at the substrate temperature of 25°C in the presence of electric field of 16 MV/m. Such profiles are measured with the analyzer parallel (open circles) or perpendicular (closed circles) to the polarizer as a function of the rotation angle 0 of the polarizer. At 0 = 0 °, the polarization direction of the incident light is parallel to the field direction. In the figure, the radial length represents the SH intensity. The SH intensity profile indicates that the poled groups in the PVDF chain are well aligned by the electric field applied during the deposition process. On the other hand, the SH intensity is negligibly
O.
90 ° ~ 270"
180"
FIo. 39. The SH intensity profiles of PVDF films deposited on the substrate kept at 25°C in the presence of an electric field of 16 MV/m. The radial length represents the SH intensity as a function of the rotation angle of the polarizer. Open and closed circles refer to the SH
intensity with the polarizer parallel and perpendicular to the analyzer, respectively. 4s

420 A. KUBONO and N. OKUI
small for the film deposited in the absence of an electric field and then postpoled at 25°C with an electric field of 16MV/m. These results suggest that the electric field applied during the vapor deposition process is effective for the orientation of dipoles within the sample.
3.4 Vapor deposition of rc-conjugated polymers Polymers, in general, are good insulators with conductivities about eighteen orders
of magnitude smaller than those of metals. For example, polyethylene shows excellent insulating properties with good moldability and a high degree of toughness and flexibility. Polymers with no double bonds in their chemical structures do not have significant electronic conductivity, whereas 7r-conjugated polymers, which have delocalized molecular orbitals of 7r-symmetry in their chains, give rise to metal-like conduction. In fact, high conductivity is found in r-conjugated ladder-type polymers having graphite-like structures. Unfortunately, such high conductivity is often achieved at the expense of thermal and mechanical properties. Highly zr-conjugated polymers often exhibit high glass transition temperatures and do not melt because of their rigid structures, thus being infusible and insoluble in all solvents.
Their infusible and insoluble characteristics make it difficult to prepare single crystals of the It-conjugated polymers. However, the vapor deposition of r-conjugate polymers can give thin films with the highly crystalline structure. For example, poly(p- phenylene) (PPP), an electrically conductive polymer, can be evaporated to form a thin film even though PPP is a high temperature resist polymer. PPP is evaporated with pyrolysis at a relatively high temperature of 600°C under a vacuum pressure below
3 51 10- Pa. A PPP film having a 100 nm thickness is transparent and pale-yellow and has a smooth surface and uniform film thickness. Electron diffraction patterns indicat- ing many h/c0 reflections, such as 110 and 200, are obtained in the films formed on gold-coated grid, whereas electron diffraction rings are found in the film deposited on a carbon-coated grid. These results indicate that the molecular chain orients perpen- dicular to the substrate for the film deposited on gold-coated grid but not on the carbon-coated grid.
Other r-conjugated polymers, such as poly(2,5-thienylene) (PTh), 52 poly(2,2'-bi- pyridine-5,5'-diyl) (PBpy) 5z and poly(pyridine-2-5-diyl) (ppy)53 can also be evapo- rated. The degree of polymerization of PTh and PPy in the deposited films is about 20-24 and 50, respectively. Molecular orientation in films of these polymers can be perpendicular or parallel to the substrate. On a polyimide film substrate whose surface was previously stroked with a cloth along a fixed direction, molecular chains of PTh can be arranged uniaxially along the same direction as stroking. This process is some- times called a rubbing treatment, and is employed for the regulation of molecular orientation in liquid crystals. In general, rod-like molecules can be oriented along the rubbing direction of the substrate. However, on a substrate kept at a relatively high temperature, the linear rigid molecules tend to align perpendicular to the sub- strate. Thin films of 7r-conjugated polymers obtained in this way can be used for polymer batteries, solar cells and n- or p-type semiconductors.
4. V A P O R D E P O S I T I O N P O L Y M E R I Z A T I O N
Vapor deposition polymerization (VDP) utilizes free radical polymerization,

POLYMER THIN FILMS PREPARED BY VAPOR DEPOSITION 421
ionic polymerization and polycondensation in vacuum systems. 54 Reactive species for polymerization can be formed by low pressure plasmas, low pressure discharge, glow discharge, UV irradiation, thermolysis of monomer and by other means. There are some reactive monomers that require no special treatment. In this section, we focus on a polycondensation system for vapor deposition polymerization which is one of the most simple methods for the fabrication of polymeric thin films. When a polycon- densation system is employed for VDP, two types of bifunctional monomers, such as a diamine and a dicarboxylic acid chloride, are coevaporated in a vacuum chamber with each evaporator controlled thermostatically. If the vapor pressure of a monomer is too high, the monomer can be supplied from the external vacuum system. 55'56 With the VDP process, monomers are adsorbed from a vapor phase, migrated on the substrate surface for a certain period of time and then re-evaporated from the substrate. When reactive chain ends of one monomer meet the chain ends of the co-monomer on the substrate surface, both chain ends react to form an oligomer. The oligomer can also react with a monomer or another oligomer on the substrate. Through this process, polymeric thin films are formed on the substrate surface.
4.1. Historical view in vapor deposition polymerization
Polymer thin films prepared in a vacuum system were reported in 1932 for polyox- ymethylene (POM) by Kohlschiitter et al., 57 as indicated in Table 5. Trioxymethylene (1) was evaporated in a vacuum system in the presence of formaldehyde and then polymerized on a substrate to form a POM (2) film based on ring-opening polymer- ization, as shown in eq. 7.
_ _ . _ Om~-o (71 ] 2
Poly(p-xylylene) (PPX) (5), a well-known heat-stable polymer, can be prepared by deposition of di-p-xylylene (3) (eq. 8).
CH2 ~/--CH2
CH2~CH2 3
CH2==O,===CH 2
5
(8)
Di-p-xylylene is quantitatively pyrolyzed at 600°C in vacuo, which results in the formation of two p-xylylene (4) molecules. 58 The resulting p-xylylene spontaneously polymerizes to linear PPX. When PPX is prepared by deposition of di-p-xylylene on cleavage surfaces (001) of alkali halides, such as NaC1, KC1, KBr and KI, the PPX film grows epitaxially on the substrate surface. 59 The polymer molecules are oriented along the [100] and [010] directions of the substrates. The degree of orientation is the highest on KBr and the lowest on NaC1. The lattice matching requirement is important in the epitaxial polymerization.

422 A. K U B O N O and N. O K U I
TABLE 5. Vapor deposition polymerization
Year Polymers Deposition condition and properties References
1932 1966 1972 1980 1983 1985
1986 1987
1988
1989
1990
Polyoxymethylene (POM) Poly-p-xylylene (PPX) Alkyl polyamide (Nylon 6) Aromatic polyamide (Kevlar) Poly-p-xylylene (PPX) Aromatic polyamide Aromatic polyimide (Kapton) Aromatic polyimide (Kapton) Alkyl polyamide (Nylon 10-10) Aromatic polyimide (Kapton) Aromatic polyurea Alkyl-aromatic polyamide Aromatic polyimides Alkyl-aromatic polyimide Alkyl-aromatic polyimide Polyimides Aromatic polyamide (Kevlar) Polyoctadecylmethacrylate (PODM)
In the presence of formaldehyde 57 High strength, transparency 58 Spherulite Crystal 60 Gas permeable membrane 61 Epitaxy 59 Aramide 63 High resistivity 62 Photoresist 75 Molecular orientation 55 Chemical adsorption to substrate 76 Pyroelectricity 71 Molecular orientation 66 Fluoride 77 Orientation, photocurrent 78 Molecular orientation 68 Third harmonic generation 79 In-plane orientation by rubbing 80 Orientation, radicals 69
6-Aminocaproic acid (ACA) (6) can be polymerized at temperatures near 170°C on substrates at a pressure of 0.12Torr (eq. 9). 60 The polymer (7) film consists of characteristic radiating arrays of ribbon-like crystals known as spherulites.
H~N(CH~)~COOH-a~ "-[(CH~)~--C-o-H]n (9)
6 - 7
These three cases for polymer thin films can be regarded as a thermal CVD process since the polymerization is activated by thermolysis.
Vapor-phase polymerization of poly (p-phenylene-terephthalamide) (PPTA) (10) films can be performed by condensation ofp phenylene diamine (8) and terephthaloyl dichloride (9) at atmospheric pressure (eq. 10). 61
H 2 N . - - ~ N H 2 + C l O C - - ~ C O C l
8 9 - - ,H ~ , H , ,
-HCl \ ~ ~ ) ~ O / n
lO
Substrate temperature plays an important role in film formation. When substrate temperatures are kept below 170°C, the film is loosely adhered on the substrate and shows a powder like structure having low molecular weight. On the other hand, at substrate temperatures above 170°C, the film is well-adhered and transparent, and its molecular weight is generally high. Films prepared at substrate temperatures above 170°C exhibit good oxygen barrier properties.
Polymer thin films prepared by polycondensation of two kinds of monomers in a vacuum system have been widely developed by Takahashi et al. 62'63 For example,

POLYMER THIN FILMS PREPARED BY VAPOR DEPOSITION 423
4,4'-diaminodiphenyl ether (oxydianiline: ODA) (11) and pyromellitic dianhydride (PMDA) (12) are coevaporated at a stoichiometric molar ratio. Either monomer can be deposited onto the substrate and the film surface is rather rough because of its high crystallinity. On the other hand, the film prepared by coevaporation of PMDA and ODA has a smooth surface. Figure 40 shows an IR absorption spectrum of a deposited film containing polyamic acid (13) and nonreacted monomers. By annealing the as-deposited film at temperatures above 200°C for 60 min, the film is converted to the polyimide (14), as shown in eq. 11.
H2N--O--O--O--""2 + 11
o o i i i i
,c, - ~ L g - - c" o 12 o
o ,o ] HO-C...,.~-.~C-17-- 1-
0 0 .~n
13
(11)
r ,o ,o -1
-H~O I ~ ~ ',°, ~ ' " ~ ' - ' , ° , ' / L O O d n
14
The polyimide film thus obtained has good adhesion to glass and metal substrates and exhibits excellent chemical resistance, heat resistance and electric insulating characteristics.
8
F~ F--
2000 1500 1000
W a v e n u m b e r (cm -1)
FIo. 40. Infrared spectra of (a) as-deposited and (b) annealed films prepared by vapor deposition polymerization of ODA and PMDA monomers.

424 A. KUBONO and N. OKUI
Alkyl polyamide (Nylon 10-10) (17) can also be obtained by VDP, which is carried out on a silicon wafer substrate kept at 25°C by supplying sebacoyl dichloride (SDC) monomer (16) at regular intervals from an external vacuum system, while 1,10-dia- minodecane (DAD) monomer (15) is evaporated in the vacuum system at a constant rate throughout the polymerization period (eq. 12). 55,56
H2N(CH2)loNH 2 + CIOC(CH2)sCOCI
15 16
/ H H \ (12) --~-- [(CH2)Io--N-C--(CH2)8--C--N-- ~-
-HCl \ O 0 // n
17
Bifunctional monomers of diamine and dicarboxylic acid chloride react at their chain ends with the elimination of HC1. The elimination of HC1 is of great advantage in the vacuum system. Figure 41 shows IR spectra of the VDP film (thickness: ca. 400 nm) before and after annealing. The spectra of the as-deposited film and the films annealed at 90 and at 200°C are shown as curves a, b and c, respectively. The spectra are not altered by annealing, and intrinsic peaks due to the amide groups are found in the spectra but peaks due to residual monomers are not observed. The melting point of the Nylon 10-10 film obtained by the VDP method is observed to be 195°C which is in good agreement with the value for a bulk sample of Nylon 10-10 (198°C). Molecular weight of the film measured by GPC is about 11,000 and its molecular weight distribution is about 1.1.
Condensation polymerization in the vacuum system may occur on the substrate surface, where two monomers can be adsorbed and then travel around for a certain period before desorption. The molecules travelling on the substrate surface may have a chance to meet other molecules and to react with their chain ends. Namely, both the adsorption-desorption process and the condensation reaction play an important role for film formation on the substrate. Here, adsorption time and condensation time are defined, respectively, as the time for the molecules staying on the substrate before desorption and for the molecules to meet and react with each other at their chain ends. When the adsorption time is shorter than the condensation time, no polymeric
.-,.~
E
-7 13
3000 2000
b
C
I I I
1500 1000 500
Wavenumber (cm-1)
Fro. 41. Infrared spectra of Nylon 10-10 thin films prepared by vapor deposition polymeriza- o o 55 tion; (a) as-deposited, (b) annealed at 90 C and (c) annealed at 200 C.

POLYMER THIN FILMS PREPARED BY VAPOR DEPOSITION 425
"-" 800 E c
E 4O0 r ~ r ,
I 1
0 10 20
Deposition time (ruin)
FIo. 42. Fi lm thickness of Nylon 10-10 VDP film as a function of deposition time. 56
film is formed. The reaction between chain ends in their gaseous states in the vacuum system is negligible. If the adsorption time is considerably long, a polymeric film is formed on the substrate, and the film thickness increases with the amount of monomer supply which is a function of time. Figure 42 shows the film thickness of Nylon 10-10 deposited on a substrate at 25°C as a function of polymerization time.
4.2. Epitaxial vapor deposition polymerization
In order to fabricate polymer thin films with a molecular orientation perpendicular to the substrate (normal orientation), a mechanism for the vapor deposition of linear long-chain molecules, as described in Section 2.2, can be applied to the VDP process. Molecular orientation in a thin film of linear chain molecules, such as paraffin, can be controlled by the deposition rate, substrate temperature, substrate morphology, sur- face energy of the substrate and so on. Of these parameters, the substrate temperature is the most effective factor for the regulation of molecular orientation. The substrate temperature also influences the adsorpt ion-desorpt ion process and molecular motion on the substrate, such as translation, rotation and precession modes. The precession mode can play an important role in the formation of a thin film with a normal orientation to the substrate. In addition to the normal molecular orientation, two types of bifunctional monomers must be polymerized at their chain ends alternately layer by layer at a monomolecular level.
Alkyl-polyamide (Nylon 10-10) films having normal molecular orientation on a substrate can be obtained by the VDP method as follows. 55'56 First, one of the monomers, such as 1,10-diaminodecane (DAD) is deposited with a molecular orienta- tion normal to the substrate by the vapor deposition method. The chain ends of the DAD monomer in the film are concentrated on the film surface as a surface-active agent, that is, the film surface is covered with amino groups. Next, when sebacoyl dichloride (SDC) is introduced into the vacuum system, the chain ends of DAD on the film surface can easily react with the chain ends of SDC with the elimination of HC1 (chemical adsorption). The resultant film surface is covered with the chain ends of SDC. And DAD monomer is subsequently introduced into the vacuum system, DAD

426 A. KUBONO and N. OKUI
(a) (b) (c)
IIIIIIIIIIIII IIlIIIIII[[II
IlIIIIIIIIIII IIIIIIIII [IIIIfIIIIIII [IIIIIIII
I I X[
Substrate Substrate Substrate
FIG. 43. Schematic illustrations for the mechanism of the epitaxial vapor deposition pro- cess. 56 (a) The diamine thin film previously deposited on the substrate with a perpendicular molecular orientation. Open triangles refer to the chain ends of diamine. Co) The dicarboxylic acid chloride molecules cannot be adsorbed but attack the diamine film surface and react with the diamine chain ends with elimination of HCI. The dichloride molecules react preferentially with the diamine molecules. Open circles refer to the chain ends of dichloride monomer and solid circles and triangles refer to the reacted chain ends. (c) The alternate reaction of the two bifunctional monomers can yield a polyamide thin film with a molecular
orientation perpendicular to the film plane.
molecules react with the chain ends of the SDC layer in the same manner as adsorption of SDC on the DAD layer. This alternating reaction between the chain ends of the two monomers can be termed epitaxial vapor deposition polymerization. Such an alter- nating process can yield a polymeric film with a high molecular orientation perpen- dicular to the substrate. If the condensation polymerization proceeds ideally, the film thickness is equal to the fully extended chain length, and the molecular weight disper- sion may be quite narrow.
In such a polycondensation system, the coevaporation of the two monomers, DAD and SDC, at a single time (instead of alternating deposition of each monomer) can also be performed to produce a film with a molecular orientation normal to the substrate. For example, DAD and SDC monomers are coevaporated onto the sub- strate, where DAD is previously deposited with normal orientation, as shown in Fig. 43(a). Here, this DAD sublayer can be formed on a substrate kept below 8°C. At a substrate temperature of 25°C, DAD monomer cannot be deposited on the surface of DAD layer formed previously on the substrate because of its high vapor pressure and its weak physical adsorption onto the DAD film surface. However, the SDC monomer can be adsorbed and react (chemical adsorption) immediately with the amino end group of DAD packed in the substrate. At the first stage of polycondensa- tion between DAD and SDC monomers, the Nylon 10-10 oligomers are formed on the surface as schematically shown in Fig. 43(b). During the next step, DAD monomer can react preferentially with SDC chain ends as illustrated in Fig. 43(c). Therefore each monomer can attack alternately and react with the other type of monomer to eliminate HC1.
Figure 44(a) shows the X-ray diffraction pattern of as-polymerized Nylon 10-10 film (thickness: ca. 400 nm) prepared by coevaporation of DAD and SDC monomers on a substrate kept at 25°C, where DAD was previously deposited with normal orientation. There are many sharp diffraction peaks which seem to be 001 reflections from the
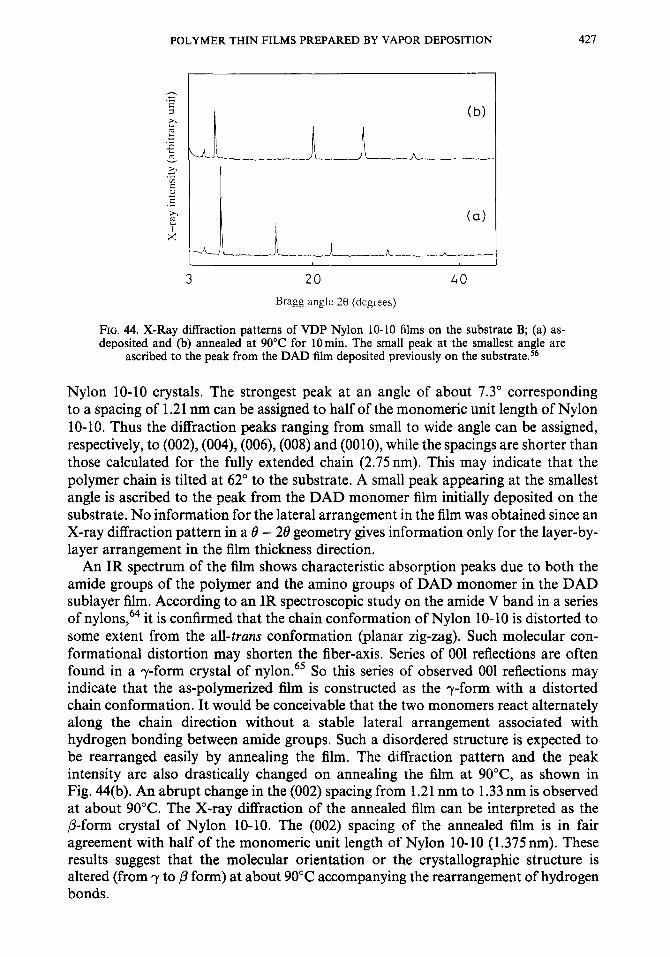
POLYMER THIN FILMS PREPARED BY VAPOR DEPOSITION 427
r ~
e -
I ;<
(b)
(a)
l i
20 40
Bragg angle 20 (degrees)
FIG. 44. X-Ray diffraction patterns of VDP Nylon 10-10 films on the substrate B; (a) as- deposited and (b) annealed at 90°C for 10min. The small peak at the smallest angle are
ascribed to the peak from the DAD film deposited previously on the substrate. 56
Nylon 10-10 crystals. The strongest peak at an angle of about 7.3 ° corresponding to a spacing of 1.21 nm can be assigned to half of the monomeric unit length of Nylon 10-10. Thus the diffraction peaks ranging from small to wide angle can be assigned, respectively, to (002), (004), (006), (008) and (0010), while the spacings are shorter than those calculated for the fully extended chain (2.75 nm). This may indicate that the polymer chain is tilted at 62 ° to the substrate. A small peak appearing at the smallest angle is ascribed to the peak from the DAD monomer film initially deposited on the substrate. No information for the lateral arrangement in the film was obtained since an X-ray diffraction pattern in a 0 - 20 geometry gives information only for the layer-by- layer arrangement in the film thickness direction.
An IR spectrum of the film shows characteristic absorption peaks due to both the amide groups of the polymer and the amino groups of DAD monomer in the DAD sublayer film. According to an IR spectroscopic study on the amide V band in a series of nylons, 64 it is confirmed that the chain conformation of Nylon 10-10 is distorted to some extent from the all-trans conformation (planar zig-zag). Such molecular con- formational distortion may shorten the fiber-axis. Series of 001 reflections are often found in a ,y-form crystal of nylon. 65 So this series of observed 001 reflections may indicate that the as-polymerized film is constructed as the ,y-form with a distorted chain conformation. It would be conceivable that the two monomers react alternately along the chain direction without a stable lateral arrangement associated with hydrogen bonding between amide groups. Such a disordered structure is expected to be rearranged easily by annealing the film. The diffraction pattern and the peak intensity are also drastically changed on annealing the film at 90°C, as shown in Fig. 44(b). An abrupt change in the (002) spacing from 1.21 nm to 1.33 nm is observed at about 90°C. The X-ray diffraction of the annealed film can be interpreted as the /3-form crystal of Nylon 10-10. The (002) spacing of the annealed film is in fair agreement with half of the monomeric unit length of Nylon 10-10 (1.375 nm). These results suggest that the molecular orientation or the crystallographic structure is altered (from 7 to/3 form) at about 90°C accompanying the rearrangement of hydrogen bonds.

428 A. KUBONO and N. OKUI
\
TTTTYTT TT T YYY TYY TYT
Itttt!tli ~, / I Substrate l / (C)
FIG. 45. Schematic illustrations of the mechanism for the self-oriented vapor deposition polymerization process. 67 (a) Monomer molecules are adsorbed from their vapor phase onto the substrate, and they react to form dimers with migration on the substrate. (b) A dimer reacts with a monomer or another dimer to form an oligomer. The oligomer is aligned perpendicular to the substrate in a manner similar to the vapor deposition of a paraffin thin film. (c) The surface of the film is occupied by the reactive functional groups at the chain ends
of the oligomer molecules aligned perpendicular to the substrate.
4.3. Vapor deposition polymerization with self-molecular orientation
In general, a linear chain molecule adsorbs onto a substrate and re-evaporates after travelling along the substrate surface for a period of time. The residence time of molecules on the substrate depends on the system pressure, the substrate temperature and the interaction force between the molecule and the substrate. For example, dia- mine and dicarboxylic acid chloride monomers adsorb on the substrate for a short period of time and they meet and react at their chain ends to form dimers, trimers and higher oligomers, as depicted in Fig. 45(a). The vapor pressure of the N-mers decreases with an increase in the number of N. The N-mers remain on the substrate for a longer period of time than the monomers and can thus react more readily with the other monomers or oligomers.
The oligomers can be aligned with a molecular orientation perpendicular to the substrate at relatively high substrate temperatures or small molecular fluxes, as shown in Fig. 45(b). The molecular orientation behavior of the oligomers is similar to that for a long chain molecule which tends to align perpendicular to the substrate

POLYMER THIN FILMS PREPARED BY VAPOR DEPOSITION 429
.~urface at relatively high substrate temperature or small molecular flux. The substrate surface is thus occupied by the reactive functional groups at the chain ends of the highly aligned oligomers as shown in Fig. 45. Therefore, both monomers can deposit and react epitaxially on the oligomer "seed" film throughout the spontaneous alter- nate deposition-reaction process in a similar manner as shown in Fig. 43. The alter- nating reaction increases the molecular weight and yields polymer thin films with molecular orientations normal to the substrate under the condition of low molecular flux of monomer.
As discussed in the previous section, the ~-form crystal of Nylon 10-10 is obtained for a film deposited at 25°C and then subsequently annealed. Thus, we can easily obtain the fl-form crystal of Nylon 10-10 with a molecular orientation perpendicular to the substrate when Nylon 10-10 films are prepared directly on the substrate kept at 90°C. In fact, several X-ray diffraction peaks associated with the 001 reflections from the fl-form crystal are observed. The (001) spacing are the same as those for the film prepared epitaxially on a normal oriented DAD film and subsequently annealed at 90°C. That is, the polymer molecules can be aligned perpendicular to the substrate surface at a substrate temperature of 90°C.
Alkyl-aromatic polyamide thin films with a molecular orientation perpendicular to the substrate can also be prepared by the VDP method. 66'67 Monomers of DAD (15) and terephthaloyl dichloride (TDC) (9) having an aromatic ring can easily be vaporized at a relatively low temperature in a vacuum chamber without any changes in their chemical structures. These monomers can react at room temperature in the absence of catalyst to form poly(decamethylene-terephthalamide)(PDTA) (18) (eq. 13).
-~',J,'CH~NH~ + C~OC ~ - - ~ / COC~
]5 9 / H ~ ~ ! \ (13)
18
~ & 1 5 ~. ,
E
= 10
0
×
A A ¢.
A
o
o
I I I
0.5 1.0 1.5
Molecular flux of DAD
(101¢' molecules cm -2 s -1)
Fio. 46. Dependence o f the ob ta ined film s t ructure on the molecular flux of D A D (JoAD) and T D C (JToc) monomers . Open circles and open triangles refer to an oriented s t ructure and a r a n d o m structure, respectively; while a cross refers to no reaction, i.e. the m o n o m e r crystals
were fo rmed on the substrate, instead of a polymer film. 67

430 A. KUBONO and N. OKUI
Figure 46 shows the relationship between film structure and molecular flux of DAD and TDC. DAD is barely sublimed at crucible temperatures below 42°C, and so no film is formed on the substrate. No polymeric film is obtained with a high evaporation rate of TDC, since TDC monomer is mainly deposited on the substrate (indicated as a cross in Fig. 46). Under deposition conditions of a slow evaporation rate of TDC and a crucible temperature of DAD above 480C, polyamide thin films are obtained and the films exhibit random molecular orientation (open triangles). Under the deposition conditions indicated as open circles in Fig. 46, thin films with a molecular orientation perpendicular to the substrate are obtained. Figure 47 shows the X-ray diffraction pattern of the film. Many sharp diffraction peaks can be associated with 00l reflections based on the repeating unit of PDTA. This may indicate that the polymer chain is tilted at about 42 ° to the substrate based on the fully extended chain conformation (2.16 nm). Therefore, the molecular flux of the monomers plays an important role in the formation of the polymer thin film.
The next example is for the case of an alkyl-aromatic polyimide. 6s DAD(15) and pyromellitic dianhydride (PMDA) (12) monomers can be easily vaporized and can react at room temperature in the absence of any catalyst to form poly(decamethyl- enepyromellitamic acid) (PDPA) (19), which is easily imidized by annealing to give poly(decamethylene-pyromellitimide) (PDPI) (20) (eq. 14).
o o • i i
H2N(CH2hoNH2 + oC~C~o "c q"
- - o 1 2 0
9, 9, ] " ,H H
-I-(CH2),o-N-C C-OH I (14) L 0 19 0 _In
-H20
I o o 1 , c . . ~ q I
( C H 2 ) l o - N , c ~ c , N - I ~ 0 0 .In
20
X
~~00 (001)
3) (ooz. C
I
3 20
(oo5)
JM. |
4O
Bragg angle 20 (degrees) FIo. 47. X-Ray diffraction pattern of the polymer thin films prepared by vapor deposition
polymerization from DAD and TDC monomers. 67

POLYMER THIN FILMS PREPARED BY VAPOR DEPOSITION 431
Q
.=
[.-
'30JO0 ' 2~)00 15'00 lOJO0
Wavenumber (cm -1)
(a) I
500 3000 2000 1500 1000 500
Wavenumber (cm-Q
= (3
b
~ C
e -
i i i i i I
3000 2000 1500 1000
Wavenumber (cm -I)
(c) I
5OO
Fro. 48. Infrared spectra of the polymer thin films prepared by vapor deposition poly- merization from D A D and PMDA monomers; (a) substrate temperature of 25, (b) 125 and (c) 175°C. Curves a, b and c in each figure refer to annealing temperature of 25, 125
and 175°C. 6s
D A D and P M D A are vaporized at 65°C and 150-180°C, respectively, and their deposition rates are approximately 0.15 nm/s. Figures 48(a and b) show IR spectra of the films prepared at substrate temperatures of 25 and 125°C, respectively, as a function of annealing temperature. As-deposited films are annealed at various temperatures in a nitrogen atmosphere for 30 min. The IR spectra of the as-deposited film prepared at the substrate temperature (Ts) of 25°C (Fig. 48(a) curve a) exhibits some characteristic peaks associated with PMDA monomer (anhydride carbonyl stretch: 1775cm -1) and polyamic acid (amide carbonyl stretch: 1640cm-1). This indicates that P M D A monomer can be deposited on the substrate at 25°C, but not D A D monomer.
In general, annealing causes reorientation and imidization of the polyamic acid. Curves b and c in Fig. 48(a), respectively, show the spectra of the films formed at Ts = 25°C after annealing at 125°C and 175°C. The intensity of the amide peak at 1640 cm -1 decreases with an increase in the annealing temperature (Ta), and the peak disappears above 175°C. In contrast, the imide peak at 1710cm -1 appears above

432 A. KUBONO and N. OKUI
b
Y X
(a)
~ (b)
. j ~ . (c)
...__._.__... j~ (d)
(e)
3 5 10
Bragg angle 20 (degrees)
FiG. 49. X-Ray diffraction patterns of the polymer thin films prepared by vapor deposition polymerization from DAD and PMDA monomers; (a) as-deposited, (b) annealed at 75, (c)
125, (d) 175 and (e) 225°C. 68
125°C. It is interesting to note that the large imide peak at 1710cm -1 and the small amide peak at 1640nm -1 are observed for the as-deposited film prepared at 175°C (Fig. 48(c) curve a). This result suggests that the polyimide film is obtained directly on the substrate by the VDP method.
Figure 49 shows the X-ray diffraction patterns of the films as-deposited at 125°C and annealed at several different temperatures. The peak at 5.5 ° corresponds to a spacing of 1.6 nm, which is smaller than the monomeric repeating unit length of the polyamide (2.0 nm) or the polyimide (1.9 nm). This difference in the spacing may be due to a tilt of the polymer chain by about 55 ° to the substrate surface. This molecular alignment is further supported by transmission and RAS IR spectra. The symmetrical carbonyl stretch of imide groups (1770 cm -1) with a transition moment parallel to the polymer chains is enhanced in the RAS spectra of the film, which indicates a molecular orientation normal to the substrate.
Another interesting VDP polymer thin film with molecular orientation has been reported in a radical polymerization system. Here, the radical is thermally produced by a tungsten filament in the vacuum system. Octadecyl methacrylate (ODMA) (21) is deposited in the presence of red-hot tungsten filament, which results in the radical of ODMA (eq. 15). 69
H / \ ',c=q ,. f fcH~-c )
0 n 2A 22
(15)
The polymer (22) yield increases with a high filament temperature, a low deposition rate and a high substrate temperature. The deposited films show no X-ray diffraction peaks. IR spectra of the films, however, reveal that the alkyl chains in the polymer are oriented perpendicular to the substrate when the films are prepared at a low deposition rate and at a high substrate temperature. By annealing the VD film at the polymer's glass transition temperature of 20°C, the film exhibits several X-ray diffraction peaks which indicate that the alkyl side chains of the polymer are rearranged to give a new orientation perpendicular to the substrate surface and the polymer main chains are

POLYMER THIN FILMS PREPARED BY VAPOR DEPOSITION 433
.E
I X
I I I t - -
0 2 4 6 8 10 12
Bragg angle 20 (degrees)
FIG. 50. X-Ray diffraction pattern of an annealed ODMA film prepared with a filament temperature of 317°C, deposition rate of 1.2nm/min and substrate temperature of 7°C
with annealing for 24 h at 20°C. 69
aligned parallel to the substrate in the same manner as in a multilayer LB film. The layer spacing in the VDP film is observed to be 2.949 nm by the X-ray diffraction pattern in Fig. 50, which is in accord with 2.945 nm for the corresponding LB film.
4.4. Dipole orientation during vapor deposition polymerization
The dipole orientation in polymeric thin films can be controlled by applying an electric field during vapor deposition polymerization. For example, nylon 7-9 films can be prepared by a VDP method in the presence of an electric field along the substrate surface. 7° Here, the odd-odd polyamides do not have a symmetrical point along the chain. Thus, the dipole moments in the polymer chain can be oriented by applying an electric field, as shown in Fig. 51, and the polymer can undergo sponta- neous polarization. Figure 52 shows the SH intensity profiles for a nylon 7-9 film measured with the analyzer parallel to the polarizer as a function of the rotation angle of the polarizer. The SH intensity profile indicates that the poled groups in the nylon 7-9 chain are well aligned by the electric field applied during the polymerization process.
applied electric field
molecular chain
i-i-i- substrate
# dipole moment
FIG. 51. Schematic illustration of orientation of molecular chain with dipoles perpendicular to the chain direction in the presence of an electric field indicated as an arrow.

434 A. KUBONO and N. OKUI
FIG. 52. SH intensity profile for a nylon 7-9 thin film prepared by vapor deposition poly- merization in the presence of an electric field. 7°
Dipoles in polymer thin films can also be oriented by poling after the VDP process. For example, both pyroelectricity and piezoelectricity in poled polyurea thin films have been observed (eq. 16). 17
23 - - 24
(16)
_ o H H_o - H_] CH2 I~-c-KI CH 2 I~-C-KI
[ ~ ~ 6 '--I "~:--,,~/ 6 J n
25
Evaporation temperatures of 95°C for 4,4'-diamino-diphenylmethane (MDA) (23) and 80°C for 4,4'-diphenylmethane-diisocyanate (MDI) (24), a substrate temperature of 25°C and a system pressure of 10 -3 Pa provide polyurea (25) thin films having 400 nm thickness at a deposition rate of 0.3 nm/s. An electric field of 200 MV/m is applied in the direction perpendicular to the film surface at a temperature of 230°C for 10 min. After this poling process, the poled films exhibit a piezoelectric constant of 15mC/m 2, pyroelectric coefficient of 1.0-2.5 x 10 -5 C/m2K and a second harmonic generation indicating a dipole orientation parallel to the electric field.
Figure 53 shows the temperature dependence of the pyroelectric constant for the polyurea. The pyroelectric constant increases with temperature. The solid line in the
E (,.)
g ,,J
d
c~
10 -3
10 -4
10 -5 i
50 1 O0
j ssSIJ I
I 150 200
Temperature (°C)
FIG. 53. Temperature dependence of the pyroelectric constant of polyurea thin films prepared by vapor deposition polymerization and a post-poling process. 71

POLYMER THIN FILMS PREPARED BY VAPOR DEPOSITION 435
figure represents the stable temperature range, where the pyroelectric constant is reversible against repeated cycles of heating and cooling. The dotted line indicates the temperature range where a certain amount of depolarization takes place and pyroelectric activity begins to decrease. The decay of pyroelectric activity is associated with the glass transition of the polymer. The glass transition temperature of the aromatic polyurea is about 120-180°C, and thermal decomposition begins at about 200-300°C. The higher limit of temperature for the piezoelectric and pyroelectric activities is related to thermal molecular motion, such as relaxation phenomena and the structural changes in the polymers. For PVDF, pyroelectric and piezoelectric effects disappear above 90°C, which is related to the relaxation mechanism in crystal- lites. 72 For the copolymer P(VDF/TrFE), the Curie temperature is at about 60-100°C, depending on the copolymer composition. 73 P(VDCN/VAc) shows the glass transition at 180°C, which is the highest temperature for sustaining the residual polarization. 74
5. C O N C L U S I O N S
In the field of metal and inorganic thin films, atomic or molecular layer epitaxy has been extensively applied for the growth of semiconductor films and multilayer struc- tures, such as superlatfice structures. The basic idea of atomic or molecular layer epitaxy is to ensure surface-controlled growth, forming a monoatomic or mono- molecular layer step by step. In such surface controlled growth, a series of processes are important. These include the adsorption of molecules (or atoms) on the substrate, surface-migration and dissociation of admolecules, incorporation of admolecules into the crystal lattice and the re-evaporation of the admolecules. In addition to these processes, molecular orientation is also an important factor in the vapor deposition of organic molecules because of steric anisotropy in their chemical structures. For example, a long chain molecule can be aligned parallel (lateral) or perpendicular (normal) to the substrate as shown in Fig. 54. Such differences in molecular orien- tation on a substrate can produce unique film properties.
In addition to the molecular orientation on the substrate surface, dipole orientation is another substantial factor in thin film formation (in-plane orientation). If there is a dipole moment perpendicular to the chain direction, such as side chain dipoles, the dipoles can be aligned by an applied electric field depending on molecular orientation as shown in Fig. 54. When the molecules are aligned parallel to the substrate and the dipoles are oriented in the film plane, the film shows a d31 piezoelectricity, whereas a d33 piezoelectricity is obtained in a film with a normal molecular orientation on the substrate and the dipole orientation in the film plane.
When two different types of organic molecules are deposited on the substrate step by step, multilayer organic thin films can be easily prepared and extended chain polymeric thin films can be obtained, as indicated in Fig. 55. Such polymeric thin films are some of the most interesting materials for use in the fields of electronics and optics. Clearly, the LB method is regarded as one of the most important deposition procedures because it can produce film systems where order can be controlled at a molecular level. Vapor deposition polymerization (VDP), however, can be superior to the LB method because the latter can have contamination by solvent, residual stress by dipping and polymerization and is generally much more time-consuming. VDP has a number of advantages for producing functional polymeric thin films with a high molecular orientation and high thermal stability.

436 A. KUBONO and N. OKUI
Metal Inorganic Organic
\ / \ / Atomic Layer Epitaxy Molecular Layer Epitaxy
Molecular Orientation
Lateral Orientation Normal Odenta~on
' " ' iiiiiiiiiTii c c ~ ~ e
i ~ e e e ~ o o o
In-plane Orienta~on
¢~ dz
,( ).
M0~O#eS
i i i i I i
FFtrr I th:4eat~s
F1o. 54. Control of film structure in vacuo.
Super-lattioe Structure in Organic Thin Films
Vaper Deposition
1 Mold ie r I_~yer Epitaxy
1 Multi-I_.ayer Org~e Thin Films
~ t e
l, Polymerization
~ "
Fia. 55. Super-lattice structure in organic thin films.

POLYMER THIN FILMS PREPARED BY VAPOR DEPOSITION 437
It should be feasible in the near future to pile up molecules layer by layer with a desired molecular orientation and then to use these materials for an array of electronic and optical applications.
R E F E R E N C E S
1. F .L . CARTER, R. E. SIATOWSKI and H. WOHLTJEN, Eds, Molecular Electronic Devices, Elsevier, Amsterdam (1988).
2. G.G. ROBERTS, Adv. Phys. 34, 475 (1985). 3. S.T. KOWEL, R. SELFRIDGE, C. ELDERING, N. MATLOFF, P. STROEVE, B. G. HIGGINS, M. P. SRINIVASAN
and L. B. COLEMAN, Thin SolidFilms 152, 377 (1987). 4. A.K. ENGEL, T. YODEN, K. SANUI and N. OGATA, J. Am. Chem. Soc. 107, 8303 (1985). 5. A.K. ENGEL, T. YODEN, K. SANUI and N. OGATA, Proc. ACS, Polym. Mat. Sci. Eng. 54, 119 (1986). 6. H. BIEDERMAN, S. M. OJHA and L. HOLLAND, Thin Solid Films 41,329 (1977). 7. Y. TAKAHASHI, M. IIJIMA, K. INAGAWA and A. ITO, J. Vac. Sci. Technol. AS, 2253 (1987). 8. M. MITSUYA, Y. TANIGUCHI and M. AKAGI, J. Colloidlnterface Sci. 92, 291 (1983). 9. R. JONES, R. H. TREDGOLD, Z. ALI-ADm, A. P. L. DAWES and P. HODGE, Thin Solid Films 200, 375
(1991). 10. T. KAJrYAMA, I. HANADA, K. SHLrro and Y. OISHI, Chem. Lett. 1989, 193 (1989). 11. H. FUKIOKA, T. SoRrrA, Y. NAKASUJI and H. NAr~IMA, Thin Solid Films 179, 59 (1989). 12. M. MITSUYA, H. OZAKI, Y. HARADA, K. SEKI and H. INOKUCHI, Langmuir 4, 569 (1988). 13. L.L. ATANASOSKA, J. C. BUCHHOLZ and G. A. SOMORJAI, Surf. Sci. 72, 189 (1978). 14. P. NIELSEN, D. J. SANDMAN and A. J. EPSTEIN, Solid St. Commun. 17, 1067 (1975). 15. Y. HARADA, H. OZAKI, K. OHNO and T. KAJIWARA, Surf. Sci. 147, 356 (1988). 16. M. MITSUVA, Langmuir 6, 432 (1990). 17. M. MITSUVA and Y. TA~GUCHI, J. Colloid Interface Sci. 107, 287 (1985). 18. N. TANI. H. YAMADE and H. ISODA, Surf. Sci. 119, 266 0982). 19. N. YUASA, J. FUJIMORI, A. KUBONO, S. UMEMOTO, T. KmUTANI and N. OKUI, Polym. Prep., Jpn 41,
687 (1992). 20. K. TANAKA, N. OKUI and T. SAKI, Thin Solid Films 196, 137 (1991). 21. F. MATSUZAKI, K. INAOKA, M. OKADA and K. SATO, J. Cryst. Growth 69, 231 (1984). 22. M. MITSUYA, Y. TAMOGICHI, N. SAITO, K. SEKI and H. INOKUCm, Chem. Phys. Lett. 119, 431 (1985). 23. S.L. Hsu, N. REYNOLDS, S. P. BOHAN, H. L. STRAUSS and R. G. SNYDER, Macromolecules 23, 4565
(1990). 24. K. YASE, T. INOUE and M. OKAOA, J. Electr. Microsc. 39, 454 (1990). 25. K. TANAKA, S. KIMURA, J. NAKAHASHI, S. UMEMOTO, N. OKuI and T. SAKAI, Koubunshi Ronbunshuu
44, 817 (1987). 26. M. MITSUYA, Y. TANIGUCHI, N. TAMAI, I. YAMAZAKI and H. MASUHARA, Thin Solid Films 129, L45
(1985). 27. M. ASHIDA, Bull. Chem. Soc. Jpn 39, 2625 (1966). 28. M. ASHIDA, N. UYEDA and E. SUITO, J. Cryst. Growth 8, 45 (1971). 29. M. HARA, H. SASABE, A. YAMADA and A. F. GARITO, Jpn. J. Appl. Phys. 28, L306 (1989). 30. M.K. DEAL, R. J. POIRER and K. K. KAM, Thin Solid Films 197, 335 (1991). 31. Y. SAITO, K. INAOKA, C. KAITO and M. OKADA, dppl. Surf. Sci. 33/34, 1298 (1988). 32. N. OKra, J. Mat. Sci. 25, 1623 (1990). 33. K. FUKAO, T. HOmUCHI and T. MATSUSHIGE, Thin Solid Films 197, 157 (1991). 34. D.W. VAN KREVELEN, Properties of Polymers, 3rd edn, Chap. 21, Elsevier (1990). 35. A. TAKENO, N. OKUI, T. HIRUMA, T. KITO, M. MURAOKA, S. UMEMOTO and T. SAKAI, Koubunshi
Ronbunshuu 48, 399 (1991). 36. S. MADORSKY, J. Polym. Sci. 9, 133 (1951). 37. P.P. LUEF and M. WHITE, Thin Solid Films 6, 175 (1970). 38. K. TANAKA, S. KIMURA, J. NAKAHASHI, S. UMEMOTO, N. OKUI and T. SAKAI, Koubunshi Ronbunshuu
44, 817 (1987). 39. Y. HAI'rORI, M. ASHIDA and T. WATANABE, Nihon Kagakukaishi 1975, 496 (1975). 40. K. MAKI, Thin Solid Films 188, 355 (1990). 41. J.C. WIT'rMAN and B. LOTZ, J. Polym. Sci., Phys. Ed. 23, 205 (1985). 42. H. KAWAI, Jpn. J. Appl. Phys. 8, 975 (1969). 43. T. TASAKA and S. MIYATA, Ferroelectrics 32, 17 (1981). 44. C.C. Hsu and P. H. GEIL, J. Appl. Phys. 56, 2404 (1984). 45. A.J. LOVINGER, Polymer 21, 1317 (1980.

438 A. KUBONO and N. OKUI
46. A. TAKENO, N. Omtn, T. Krro, M. MURAOKA, S. UMEMOTO and T. SAKAI, Thin SolidFilms 202, 205 (1991).
47. A. TAKENO, N. OKuI, T. Krro, M. MURAOKA, S. UMEMOTO and T. SAra, Thin SolidFilms 202, 213 (1991).
48. A. KUEONO, T. Krron, K. KAJIKAWA, H. TAKEZOE, A. FUKUDA and N. OKUI, Jpn. J. Appl. Phys., 31, 1195 (1992).
49. K. Tgsnmo and H. TADOKORO, Macromolecules 16, 961 (1983). 50. J. SAKATA and M. MocnIZUKI, Thin SolidFilms 1~, 123 (1990). 51. M. KOMAKINE, T. NAMIKAEA and Y. YAMAZAKI, Makromol. Chem., Rapid Commun. 7, 139
(1986). 52. T. YAMAMOTO, T. KANBARA and C. Morn, Synthetic Metals 38, 399 (1990). 53. T. YAMAMOTO, C. MORI, H. WAKAYAMA, Z. H. ZHOU, T. MARUYAMA, R. OHKI and T. KANBARA,
Chem. Lett., 1991, 1483 (1991). 54. Y. TAKArIASlnI, M. ImiA, K. INAGAWA and A. ITOH, J. Vac. Sci. Technol. AS, 2253 (1987). 55. K. TANAKA, A. KUBONO, S. UMEMOTO, N. OKUI and T. SAKAI, Rep. Progr. Polym. Phys. Jpn 30, 175
(1987). 56. A. KUBONO, N. OKUI, K. TANAKA, S. UMEMOTO and T. SAKAI, Thin Solid Films 199, 385 (1991). 57. H.W. KOHLSCHOrrER and L. SPRENGER, Z. Phys. Chem. B16, 284 (1932). 58. W.F. GOm~AM, J. Polym. Sci. A-1 4, 3027 (1966). 59. S. ISODA, Polymer 25, 615 (1984). 60. E.M. MACCm, J. Polym. Sci. A-1 10, 45 (1972). 61. R.M. IKEDA, R. J. ANGERO, F. P. BoETrCHER, R. N. BLOMBERG and M. R. SAMUELS, J. Appl. Polym.
Sci. 25, 1391 (1980). 62. Y. TAKAHASHI, M. IIJIMA, K. INAGAWA and A. Iron, Shinkuu 28, 440 (1985). 63. M. IIJIMA, Y. TAKAHASI-II, K. INAGAWA and A. Iron, Shinkuu 28, 437 (1985). 64. A. MrtAKE, J. Polym. Sci. 44, 223 (1960). 65. Y. KmOSHIrA, Macromol. Chem. 33, 21 (1959). 66. H. Kuvo, N. KANAE, K. TANAKA, A. KUBONO, S. UMEMOrO, N. OKUI and T. SAKAI, Polym. Prep.
Jpn 37, 1135 (1988). 67. A. KUBONO, N. OKra, N. KANAE, S. UMEMOrO and T. SAKAI, Thin Solid Films 215, 94 (1992). 68. A. KuBot~o, H. HmOCHI, S. UMEMOTO and N. OKOI, Thin Solid Films, 229, 133 (1993). 69. M. TAMADA, M. ASANO, M. YosnmA and M. KUMAKURA, Polymer 32, 2064 (1991). 70. N. YUASA, J. FUJIMDRI, A. KUBONO, S. UMEMOTO, T. KIKUTANI and N. OKUI, Polym. Prep. Jpn 41,
687 (1992). 71. Y. TAKAHASInI, M. hJIMA and E. FUKADA, Jpn. J. Appl. Phys. Lett. 28, 2245 (1989). 72. V.J. McBRmRrV, D. C. DOUGLASS and T. A. WEBER, J. Polym. Sci. A-2 14, 267 (1984). 73. T. YAGI, M. TATEMOTO and J. SAKO, Polym. J. 12, 209 (1980). 74. S. TASAKA, K. MIYASATO, M. YOSHIKAWA, S. MIYATA and M. Ko, Ferroelectrics 57, 267
(1984). 75. J.R. SALEM, F. O. SEQUEDA, J. DURAN, W. Y. LEE and R. M. YANG, J. Vac. Sci. Technol. A4, 369
(1986). 76. M. GRtrNZE and R. N. RAMU, Chem. Phys. Lett. 133, 283 (1987). 77. M. IIJIMA and Y. TAKAI.IASrtI, Polym. Prep. Jpn 38, 2205 (1989). 78. K. IIDA, T. NOHARA, K. TOTANI, S. MAKAMURA and G. SAWA, Jpn. J. Appl. Phys. 28, 2552 (1989). 79. M. HIKITA, S. YAMADA, T. KIMURA and T. MIZUTANI, Polym. Prep. Jpn 39, 3094 (1990). 80. J. SAKArA and M. MOCmZUKI, Polym. Prep. Jpn 39, 2956 (1990).
Copyright © 2022 FDOKUMEN