Enhanced electrochemical hydrogen storage by catalytic Fe-doped multi-walled carbon nanotubes...
7
Journal of Power Sources 188 (2009) 404–410 Contents lists available at ScienceDirect Journal of Power Sources journal homepage: www.elsevier.com/locate/jpowsour Enhanced electrochemical hydrogen storage by catalytic Fe-doped multi-walled carbon nanotubes synthesized by thermal chemical vapor deposition A. Reyhani a , S.Z. Mortazavi b , A.Z. Moshfegh a,c,∗ , A. Nozad Golikand b , M. Amiri a a Department of Physics, Sharif University of Technology, P.O. Box 11155-9161, Tehran, Iran b Institute of Materials, P.O. Box 31485-498, Karaj, Iran c Institute for Nanoscience and Nanotechnology, Sharif University of Technology, P.O. Box 14588-8969, Tehran, Iran article info Article history: Received 17 June 2008 Accepted 29 November 2008 Available online 7 December 2008 Keywords: Hydrogen storage Electrochemical TCVD Fe-doped MWCNTs abstract Hydrogen storage capacities of raw, oxidized, purified and Fe-doped multi-walled carbon nanotubes (MWCNTs) were studied by electrochemical method. Based on transmission electron microscopy and Raman spectroscopic data, thermal oxidation removed defective graphite shells at the outer walls of MWCNTs. The analysis results indicated that the acid treatment dissolved most of the catalysts and opened some tips of the MWCNTs. Thermal gravimetric analysis and differential scanning calorimetry results illustrated that by oxidation and purification of MWCNTs, the weight loss peak shifts toward a higher temperature. N 2 adsorption isotherms of the purified and oxidized MWCNTs showed an increase in N 2 adsorption below P/P o =0.05, suggesting that microporous structures exist in the purified and oxi- dized MWCNTs. The electrochemical results revealed that the Fe-doped MWCNTs produced the highest hydrogen storage capacities compared to the other samples in various sweep rates. According to elec- trochemical analyses, the peak currents of hydrogen adsorption/desorption increased by increasing the catalyst’s active surface. © 2008 Elsevier B.V. All rights reserved. 1. Introduction Nowadays, hydrogen is recognized as an ideal fuel for energy conversion because of high efficiency and its role in the reduc- tion of air pollution [1]. However, due to the existence of major scientific challenges, it has not been so far used in great extent. Further, developing a safe, effective and cheap hydrogen storage system is the main challenge [2–4]. To date, different methods of hydrogen storage have been applied but none of them have com- pletely satisfied the proposed standard by the US Department of Energy (DOE) [2]. Therefore, in order to obtain a high efficient hydrogen storage, new porous materials such as carbon nanotubes (CNTs), carbon nanofibers and active carbons have been consid- ered for this purpose [1,2,5]. Since the report of Dillon et al. [6] on a possible 5–10% hydrogen storage capacity for single-walled car- bon nanotubes (SWCNTs) due to their better electrical property, small density, high porosity and high active surface area for hydro- gen adsorption, CNTs have attracted much attention in new porous materials for safer hydrogen storage. ∗ Corresponding author at: Department of Physics, Sharif University of Technol- ogy, P.O. Box 11155-9161, Tehran, Iran. Tel.: +98 21 6600 5410; fax: +98 21 6601 2983. E-mail address: [email protected] (A.Z. Moshfegh). It has been widely reported that growth [7], synthesis condi- tions [8], structure [9–12], purification [13] and functionalization [14] of CNTs have a strong effect on hydrogen storage capac- ity. Yi et al. [15] investigated the effect of multi-walled carbon nanotubes (MWCNTs) on electrochemical properties of Ni-CNTs treated with different temperatures under nitrogen ambient and showed that the Ni-CNTs treated at 800 ◦ C have a better hydro- gen storage property as compared with other temperatures. Fazle Kibria et al. [7] investigated the hydrogen storage behavior of undoped CNTs as well as Li-, Na-, and K-doped CNTs by electro- chemical method and found that metal-doped CNTs stored higher amounts of hydrogen than the undoped CNTs. Feng et al. [16] showed that the amount of MWCNTs of Ni-MWCNT electrode prepared by composite electro-deposition method can be up to 22.45% for hydrogen storage. Hsieh et al. [17] in an investiga- tion on the electrochemical hydrogen storage characteristics of Ni-doped CNTs found that the specific current for hydrogen stor- age increases with the increasing of Ni loading. Lombardi et al. [18] found that vacuum annealing (950 ◦ C, 1 h) decreased the electro- chemical hydrogen storage capacities of the MWCNTs purified by nitric acid. There are many methods for the growth of CNTs but thermal chemical vapor deposition (TCVD) has many advantages in that it allows CNTs to be synthesized with high purity, high yield, selective growth and low cost [10,11]. Among the many supports and cata- lysts for the growth of CNTs by TCVD, MgO as support [19,20] and 0378-7753/$ – see front matter © 2008 Elsevier B.V. All rights reserved. doi:10.1016/j.jpowsour.2008.11.131
Transcript of Enhanced electrochemical hydrogen storage by catalytic Fe-doped multi-walled carbon nanotubes...

Journal of Power Sources 188 (2009) 404–410
Contents lists available at ScienceDirect
Journal of Power Sources
journa l homepage: www.e lsev ier .com/ locate / jpowsour
Enhanced electrochemical hydrogen storage by catalytic Fe-doped multi-walledcarbon nanotubes synthesized by thermal chemical vapor deposition
A. Reyhania, S.Z. Mortazavib, A.Z. Moshfegha,c,∗, A. Nozad Golikandb, M. Amiri a
a Department of Physics, Sharif University of Technology, P.O. Box 11155-9161, Tehran, Iranb Institute of Materials, P.O. Box 31485-498, Karaj, Iranc Institute for Nanoscience and Nanotechnology, Sharif University of Technology, P.O. Box 14588-8969, Tehran, Iran
a r t i c l e i n f o
Article history:Received 17 June 2008Accepted 29 November 2008Available online 7 December 2008
Keywords:Hydrogen storageElectrochemicalTCVD
a b s t r a c t
Hydrogen storage capacities of raw, oxidized, purified and Fe-doped multi-walled carbon nanotubes(MWCNTs) were studied by electrochemical method. Based on transmission electron microscopy andRaman spectroscopic data, thermal oxidation removed defective graphite shells at the outer walls ofMWCNTs. The analysis results indicated that the acid treatment dissolved most of the catalysts andopened some tips of the MWCNTs. Thermal gravimetric analysis and differential scanning calorimetryresults illustrated that by oxidation and purification of MWCNTs, the weight loss peak shifts toward ahigher temperature. N2 adsorption isotherms of the purified and oxidized MWCNTs showed an increasein N2 adsorption below P/Po = 0.05, suggesting that microporous structures exist in the purified and oxi-dized MWCNTs. The electrochemical results revealed that the Fe-doped MWCNTs produced the highest
Fe-doped MWCNTshydrogen storage capacities compared to the other samples in various sweep rates. According to elec-trochemical analyses, the peak currents of hydrogen adsorption/desorption increased by increasing the1
ctsFshpEh(eabsgm
of
0d
catalyst’s active surface.
. Introduction
Nowadays, hydrogen is recognized as an ideal fuel for energyonversion because of high efficiency and its role in the reduc-ion of air pollution [1]. However, due to the existence of majorcientific challenges, it has not been so far used in great extent.urther, developing a safe, effective and cheap hydrogen storageystem is the main challenge [2–4]. To date, different methods ofydrogen storage have been applied but none of them have com-letely satisfied the proposed standard by the US Department ofnergy (DOE) [2]. Therefore, in order to obtain a high efficientydrogen storage, new porous materials such as carbon nanotubesCNTs), carbon nanofibers and active carbons have been consid-red for this purpose [1,2,5]. Since the report of Dillon et al. [6] onpossible 5–10% hydrogen storage capacity for single-walled car-on nanotubes (SWCNTs) due to their better electrical property,
mall density, high porosity and high active surface area for hydro-en adsorption, CNTs have attracted much attention in new porousaterials for safer hydrogen storage.∗ Corresponding author at: Department of Physics, Sharif University of Technol-gy, P.O. Box 11155-9161, Tehran, Iran. Tel.: +98 21 6600 5410;ax: +98 21 6601 2983.
E-mail address: [email protected] (A.Z. Moshfegh).
378-7753/$ – see front matter © 2008 Elsevier B.V. All rights reserved.oi:10.1016/j.jpowsour.2008.11.131
© 2008 Elsevier B.V. All rights reserved.
It has been widely reported that growth [7], synthesis condi-tions [8], structure [9–12], purification [13] and functionalization[14] of CNTs have a strong effect on hydrogen storage capac-ity. Yi et al. [15] investigated the effect of multi-walled carbonnanotubes (MWCNTs) on electrochemical properties of Ni-CNTstreated with different temperatures under nitrogen ambient andshowed that the Ni-CNTs treated at 800 ◦C have a better hydro-gen storage property as compared with other temperatures. FazleKibria et al. [7] investigated the hydrogen storage behavior ofundoped CNTs as well as Li-, Na-, and K-doped CNTs by electro-chemical method and found that metal-doped CNTs stored higheramounts of hydrogen than the undoped CNTs. Feng et al. [16]showed that the amount of MWCNTs of Ni-MWCNT electrodeprepared by composite electro-deposition method can be up to22.45% for hydrogen storage. Hsieh et al. [17] in an investiga-tion on the electrochemical hydrogen storage characteristics ofNi-doped CNTs found that the specific current for hydrogen stor-age increases with the increasing of Ni loading. Lombardi et al. [18]found that vacuum annealing (950 ◦C, 1 h) decreased the electro-chemical hydrogen storage capacities of the MWCNTs purified bynitric acid.
There are many methods for the growth of CNTs but thermalchemical vapor deposition (TCVD) has many advantages in that itallows CNTs to be synthesized with high purity, high yield, selectivegrowth and low cost [10,11]. Among the many supports and cata-lysts for the growth of CNTs by TCVD, MgO as support [19,20] and

ower
bh
ioNmstBwqficc
2
2
pm
o3aw32c
2
qtiat(t9sfw
2
s6nwv1
MtMT
2
l
considered in a temperature range of 30–850 C with the heatingrate of 10 ◦C min−1 in air ambient. A high-performance volumetricphysisorption apparatus at 77 K (BET) was used to determine theeffective surface area of the MWCNTs. Pore size distribution of theMWCNTs was also obtained by BJH equation using the adsorption
A. Reyhani et al. / Journal of P
imetallic systems of transition metals as catalyst [21–26] produceigher yield CNTs.
The present study aimed at investigating and compar-ng the effects of oxidation, purification and doping of Fen the electrochemical hydrogen storage capacities of MWC-Ts. Scanning electron microscopy (SEM), transmission electronicroscopy (TEM), X-ray diffraction (XRD), X-ray photoelectron
pectroscopy (XPS), thermal gravimetric analysis (TGA), differen-ial scanning calorimetry (DSC), Brunauer–Emmett–Teller (BET),arret–Joyner–Halenda (BJH) and Raman spectroscopy techniquesere used to evaluate the size, structure, graphitization, yield,
uality and adsorption characteristics of the raw, oxidized, puri-ed and Fe-doped MWCNTs. In addition, cyclic voltammetry andhronopotentiometry were used to determine the electrochemicalharacteristics of the samples.
. Experimental
.1. Catalyst preparation
Bimetallic catalyst of Fe and Ni supported by MgO (with the pro-ortion of 1:1:8) was prepared using a wet chemical impregnationethod as follows:One gram of MgO powder (99.9%–Merck) was dispersed in 20 ml
f distilled water and the obtained suspension was sonicated for0 min in order to get a homogeneous solution. Then, appropriatemounts of metal nitrates (Fe (NO3)3·9H2O and Ni (NO3)2·6H2O)ere added to the MgO suspension and the mixture was stirred for0 min. The prepared impregnate was dried in an oven at 150 ◦C for4 h in air. After drying, the mixture was ground to fine powder asatalyst.
.2. MWCNT growth
After preparation of the catalyst, the sample was loaded into auartz tubular furnace at the atmospheric pressure. The furnaceemperature was ramped from the room temperature to 700 ◦Cn Ar flow (80 sccm) for 40 min. Then, a mixture of Ar (20 sccm)nd H2 (60 sccm) was fed into the furnace. When the tempera-ure stabilized at 900 ◦C, the mixture flow was stopped and NH380 sccm) was introduced into the furnace at the same tempera-ure for 40 min. Then, temperature of the furnace was ramped to40 ◦C in 10 min under H2 flow at 80 sccm. When the temperaturetabilized at 940 ◦C, high purity CH4 gas was introduced into theurnace at a flow of 80 sccm for 40 min. Finally, Ar gas (80 sccm)as reintroduced into the furnace for cooling.
.3. Purification and functionalization of MWCNTs
Purification of the grown MWCNTs was performed within twoteps. Initially, the MWCNTs were heated in a furnace at 450 ◦C for0 min in O2 ambient (step 1). Then, they were immersed in 0.1 Mitric acid solution for 4 h at 100 ◦C (step 2). The obtained MWCNTsere washed out several times with deionized water until the pH
alue of the solution became neutral. The sample was then dried at50 ◦C for 24 h.
For functionalization of the MWCNTs, 30 mg of the purifiedWCNTs and 1 g of Fe nitrate were immersed in distilled water and
he mixture was stirred at 50 ◦C for 1 h. Then, the ionic-adsorbedWCNTs were separated from the Fe salt solution using a filtration.
he obtained Fe-doped MWCNTs were heated at 200 ◦C for 24 h.
.4. Sample characterization
Characterization of the samples was carried out by the fol-owing techniques: SEM (Philips XL30) was used to determine
Sources 188 (2009) 404–410 405
morphology and average diameter of the MWCNTs. TEM (PhilipsXL) was carried out for the accurate determination of diameter,shape and microstructure of the MWCNTs. For TEM analysis, thesamples were prepared with dispersion of the MWCNTs in ace-tone using an ultrasonic bath. Then, one drop of the preparedsuspension was deposited on a carbon coated copper grid. Ramanspectroscopy (HR-800 Jobin-Yvon) was utilized to determine thequality of the MWCNTs. The Raman spectra were recorded from200 to 2000 cm−1. Structure and graphitization degree of the MWC-NTs were characterized by XRD using Cu K� radiation source(� = 1.541 Å). The scanning speed and step interval were 1◦ and0.02◦ min−1, respectively. TGA and DSC techniques were employedto investigate the yield and graphitization of MWCNTs using Romet-ric simultaneous thermal analysis (STA). The heating program was
◦
Fig. 1. SEM micrographs of the (a) raw, (b) oxidized and (c) purified MWCNTs.
4 ower
ib1
2
f
to(btpo
weawMwmc
06 A. Reyhani et al. / Journal of P
sotherm. Chemical composition of the MWCNTs was determinedy XPS using Al K� radiation source with the incident energy of486.6 eV.
.5. Electrode preparation and electrochemical measurements
The raw, oxidized, purified and Fe-doped MWCNTs were used toabricate the electrodes as follows:
Two milligram of the MWCNTs was added into a solu-ion of nafion (0.1 ml) and deionized water (3 ml). Then, thebtained solution was sonicated for 30 min. A stainless steel plate20 mm × 30 mm × 1 mm) was used as the cathode matrix. Afterurnishing, it was corroded in a HF solution (30%) for 20 min. Then,he sonicated solution of MWCNTs was poured dropwise on theorous stainless steel plate. Finally, the electrodes were dried in anven at 80 ◦C for 2 h.
Electrochemical hydrogen storage capacities of the MWCNTsere studied using a three-electrode system (Auto lab 302) at ambi-
nt temperature in 6 M solution of NaOH as the electrolyte. A Ni wires the counter electrode and an Ag/AgCl as the reference electrode
ere used. Cyclic voltammetric (CV) measurements of the preparedWCNT electrodes were done in a potential range of −1.5 to 0.5 Vith six sweep rates of 5, 10, 20, 30, 50, 100 mv s−1. The experi-ents of charging/discharging were carried out under the followingonditions:
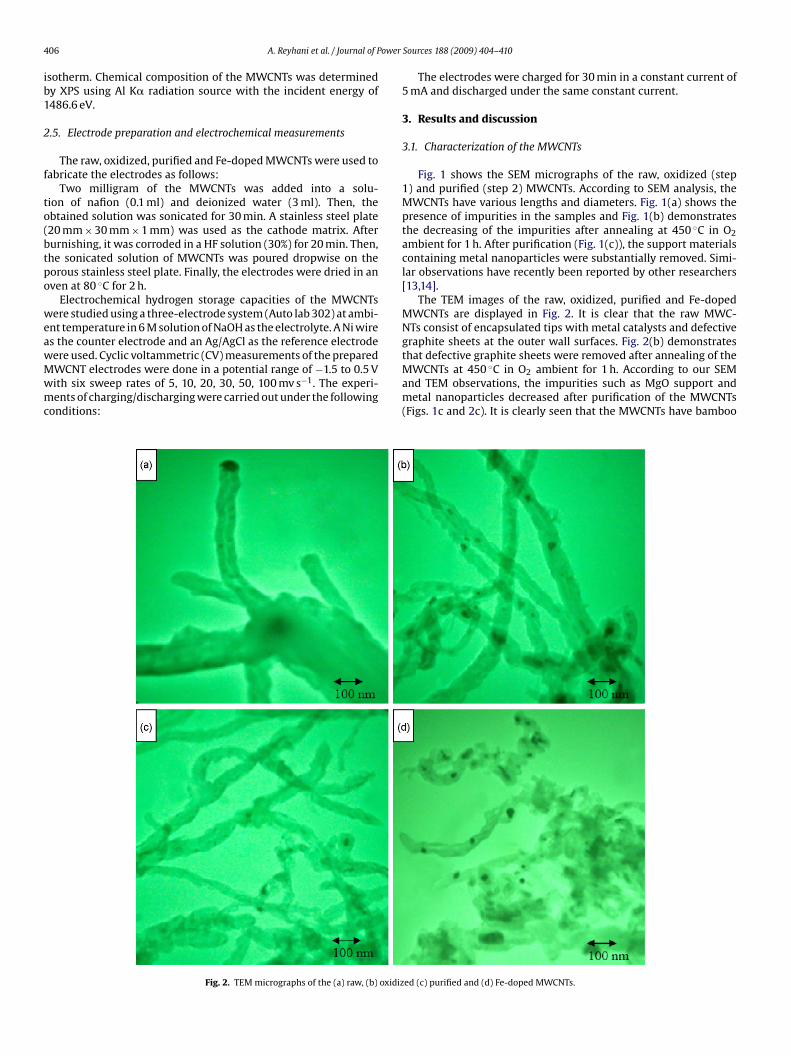
Fig. 2. TEM micrographs of the (a) raw, (b) oxidiz
Sources 188 (2009) 404–410
The electrodes were charged for 30 min in a constant current of5 mA and discharged under the same constant current.
3. Results and discussion
3.1. Characterization of the MWCNTs
Fig. 1 shows the SEM micrographs of the raw, oxidized (step1) and purified (step 2) MWCNTs. According to SEM analysis, theMWCNTs have various lengths and diameters. Fig. 1(a) shows thepresence of impurities in the samples and Fig. 1(b) demonstratesthe decreasing of the impurities after annealing at 450 ◦C in O2ambient for 1 h. After purification (Fig. 1(c)), the support materialscontaining metal nanoparticles were substantially removed. Simi-lar observations have recently been reported by other researchers[13,14].
The TEM images of the raw, oxidized, purified and Fe-dopedMWCNTs are displayed in Fig. 2. It is clear that the raw MWC-NTs consist of encapsulated tips with metal catalysts and defectivegraphite sheets at the outer wall surfaces. Fig. 2(b) demonstrates
that defective graphite sheets were removed after annealing of theMWCNTs at 450 ◦C in O2 ambient for 1 h. According to our SEMand TEM observations, the impurities such as MgO support andmetal nanoparticles decreased after purification of the MWCNTs(Figs. 1c and 2c). It is clearly seen that the MWCNTs have bambooed (c) purified and (d) Fe-doped MWCNTs.

A. Reyhani et al. / Journal of Power Sources 188 (2009) 404–410 407
Table 1TGA, DSC, Raman spectroscopy and XPS results of the raw, oxidized, purified and Fe-doped MWCNTs.
MWCNT samples IG/ID of Raman spectra STA results XPS results
Onset, inflection andoffset temperatures(◦C)
Weight loss (%) C (%) O (%) Mg (%) Fe (%) Ni (%)
R 4O 4P 9F 8
lfi(t
tfd1(vtorricaraNt
tMtp
pcpcw
F
the MgO peaks were removed in the nitric acid treated MWCNTs.Also, the intensity ratio of Fe–Ni peak to the graphite peak of thepurified MWCNTs decreased compared to the raw and oxidizedMWCNTs.
aw 1.4 520, 629 and 700xidized 2.5 542, 641 and 700urified 2.2 570, 669 and 700e-doped 2.1 548, 651 and 700
ike structure and the outer diameters of the raw, oxidized and puri-ed MWCNTs are about 80–150, 50–130 and 20–80 nm, respectivelyFig. 2). Further, Fig. 2(d) shows that Fe nanoparticles are attachedo the MWCNTs with the average diameter of about 50 nm.
Raman spectroscopy was used to determine the quality ofhe MWCNTs. Table 1 shows a summary of the results obtainedrom Raman spectra for the raw, oxidized, purified and Fe-oped MWCNTs. The Raman bands appearing in 1500–1605 and250–1450 cm−1 of the spectrum are known as G (graphitic) and Ddisorder) bands, respectively. The G band is related to the C–C bandibration frequency of the carbon material with a sp2 orbital struc-ure and the D band is attributed to the disorder-induced vibrationf the C–C band [27]. IG/ID, intensity ratio of the peaks, is used as aough measure of the sample quality [28]. This ratio is a relativeesponse of the graphitic carbons to the defective carbons orig-nated from the intrinsic defects in the CNTs or the amorphousarbons located on the CNTs. The IG/ID of the raw, oxidized, purifiednd Fe-doped MWCNTs was 1.4, 2.5, 2.2 and 2.1, respectively. Theseesults implied that defective sheets decreased after both oxidationnd purification. The decrease in the quality of the purified MWC-Ts as compared with the oxidized MWCNTs indicates that the acid
reatment destroyed some structures of the MWCNTs.TGA and DSC curves derived from STA were used to determine
he yield and the graphitization degree of MWCNTs. The yield ofWCNTs was obtained using their weight loss (%) in a tempera-
ure range of 500–800 ◦C. TGA and DSC results of the raw, oxidized,urified and Fe-doped MWCNTs are shown in Table 1.
The measured low weight loss for the raw MWCNTs in the tem-erature range of 300–400 ◦C indicates that almost no amorphous
arbon existed in the raw MWCNTs. Also, the high yield of theurified MWCNTs (93%) shows that the acid treatment decreasedatalyst particles and MgO support in the sample. These resultsere also confirmed by our TEM micrographs. The DSC results inig. 3. XRD results of the (a) raw, (b) oxidized (c) purified and (d) Fe-doped MWCNTs.
4.7 – – – – –1 74 24.6 1.4 0 03 – – – – –1 79 19.7 0 1.3 0
Table 1 illustrate that the weight loss peak shifts toward a highertemperature during the oxidation and purification of the MWCNTs.However, for the Fe-doped MWCNTs, the oxidation started at lowertemperature because the oxidation of MWCNTs is catalyzed by Fedoping as compared with the purified MWCNTs. Yoo et al. reported asimilar phenomenon by using La catalyst [29]. The higher inflectiontemperature and the smaller difference between the onset and off-set temperatures in the DSC analysis indicate that the oxidized andpurified MWCNTs have better graphitization properties comparedto the raw MWCNTs [25]. This result was confirmed by Raman spec-tra and TEM analyses. The weight loss (%) of different MWCNTs waslisted in Table 1. Comparison of the purified and Fe-doped MWC-NTs showed that the amount of Fe nanoparticles attached to theMWCNTs was about 12%.
The XRD results of the raw, oxidized, purified and Fe-dopedMWCNTs are shown in Fig. 3. Presence of a peak at around2� = 26.30◦ is characteristic of the formation of MWCNTs. The peaksat 2� = 38.14◦ and 77.90◦ indicate the presence of Fe3C. In addition,the peaks at 2� = 37.02◦, 42.93◦ and 62.35◦ are characteristic of thepresence of MgO. Moreover, the peaks at 2� = 43.86◦ and 51.05◦ areindicative of Fe–Ni alloy formation and the peak at 2� = 82.50◦ indi-cates the presence of Fe. Investigation of the XRD results in Fig. 3shows that the intensity of graphite peak (0 0 2) increases by bothoxidation and purification. These results were confirmed by ourTEM, DSC and Raman spectroscopy analyses. Fig. 3(c) shows that
Fig. 4. XPS results of the (a) oxidized and (b) Fe-doped MWCNTs.

408 A. Reyhani et al. / Journal of Power Sources 188 (2009) 404–410
FM
soisaMts[t2tt
ig. 5. N2 adsorption and desorption isotherms of the raw, oxidized and purifiedWCNTs.
The XPS results of the oxidized and Fe-doped MWCNTs arehown in Fig. 4 and Table 1. The percentages of the elements existedn the surface of the oxidized and Fe-doped MWCNTs are listedn Table 1. As Table 1 shows, there is no Fe–Ni catalyst on theurface of the oxidized MWCNTs. It can be seen from Fig. 4(a)nd (b) that the broad C (1s) peaks of the oxidized and Fe-dopedWCNTs are well-fitted by three and four components, respec-
ively. Fig. 4(a) shows a large peak at 284.5 eV (sp2 C C) and twomaller shoulders at around 286 eV (C–O) and 285.4 eV (sp3 C–C)
2
13,30,31]. Fig. 4(b) also shows a peak at 284.5 eV (sp C C) andhree smaller shoulders around 288.7 eV (C O), 286 eV (C–O) and82.4 eV (Fe–C) [13,30–32]. The XPS results confirmed the forma-ion of C O hybridization and that sp3 C–C band disappeared onhe surface of MWCNTs by acid treatment. In addition, the exis-Fig. 7. Cyclic voltammograms of the (a) raw, (b) oxidized, (c) purified and (d) Fe-do
Fig. 6. Pore size distribution of the (a) raw, (b) oxidized and (c) purified MWCNTs.
tence of Fe–C bands on the surface of MWCNTs is indicative of theattachment of Fe atoms to the surface of MWCNTs.
N2 adsorption at 77 K is known as a powerful and conve-nient method to determine the pore size distribution, pore volumeand specific surface area of porous materials. Fig. 5 depicts N2adsorption isotherms of the raw, oxidized and purified MWCNTs.Adsorption isotherms of the oxidized and purified MWCNTs exhib-ited an increase in N2 adsorption below P/Po = 0.05, confirming theexistence of the microporous structures in the oxidized and purifiedMWCNTs [33,34]. The isotherms also indicated adsorption hystere-sis behavior of the oxidized and purified MWCNTs in the P/Po > 0.3,due to capillary condensation in the mesopores (Fig. 5). The nitro-
gen adsorption increased sharply within the pressure range ofP/Po = 0.9–0.99, because of the increased adsorption in the inter-tubular pores [34].ped MWCNT electrodes at different sweep rates of 5, 20, 50 and 100 mv s−1.

A. Reyhani et al. / Journal of Power Sources 188 (2009) 404–410 409
Table 2Surface characterizations of the raw, oxidized and purified MWCNTs determined bynitrogen physisorption at 77 K.
MWCNT samples BET surfacearea (m2 g−1)
Total pore volume(cm3 g−1)
Peak pore size(nm)
ROP
apT(i
aMarg
3
teFpme
abd−FaMteor(gOM
raNtstW
TE
M
ROPF
aw 20.1 0.12 1.75xidized 91.7 0.61 1.7urified 39.4 0.24 1.3
Fig. 6 shows the porous structures (BJH) of the raw, oxidizednd purified MWCNTs. The major peaks of the raw, oxidized andurified MWCNTs were at around 1.75, 1.7 and 1.3 nm, respectively.here was a small peak at around 50 nm for the purified MWCNTsFig. 6), probably due to removal of the metal nanoparticles existingn the tips of the MWCNTs by acid treatment.
Surface characterizations of the MWCNTs based on the N2dsorption isotherms are summarized in Table 2. The oxidizedWCNTs exhibited a higher specific surface area and pore volume
s compared to the raw and purified MWCNT samples. The sameesults have been reported by Chen et al. [33] for the MWCNTsrown by La-Ni catalyst.
.2. Hydrogen storage
It is well known that cyclic voltammetry has a high potentialo determine the reaction mechanism of redox behaviors. Thus,lectrochemical characteristics of the raw, oxidized, purified ande-doped MWCNTs were studied by cyclic voltammetry over theotential range of −1.5 to 0.5 V. Fig. 7 indicates the cyclic voltam-ograms of the raw, oxidized, purified and Fe-doped MWCNT
lectrodes in various sweep rates.All the electrodes showed an anodic peak (a1) around −0.75 V
t the sweep rate of 20 mv s−1, corresponding to the oxidation ofoth Fe to Fe (II) and Fe(II) to Fe(III). Upon the reversal of the scanirection, a corresponding reduction peak (c2) appeared at around1.05 V, attributed to the reduction of Fe(II) to Fe and Fe(III) toe(II). A similar phenomenon has also been reported by Hang etl. [35] for Fe2O3-loaded carbons. Fig. 7 indicates that the Fe-dopedWCNT electrode has the highest peak currents (a1, c2) compared
o the other MWCNT electrodes. Moreover, the purified MWCNTlectrode has higher peak currents as compared with the raw andxidized MWCNT electrodes due to disappearance of Fe3C phasesesulted in the increasing of Fe interaction with the electrolyteFig. 3). The results also showed that by removing of the defectiveraphite sheets from the raw MWCNTs after annealing at 450 ◦C in2 ambient, their Fe peak currents increased compared to the rawWCNTs (Fig. 7).The cyclic voltammetry also indicated that two small peak cur-
ents appeared around the potentials of 0.28 and 0.4 V (Fig. 7(c)nd (d)), originated from the transformations of Ni(III) to Ni(II) and
i(II) to Ni(III), respectively [36]. Further, reduction (c2) and oxida-ion (a2) peaks also appeared at about −1.25 and 0.15 V for all theamples. Lombardi et al. reported that these peaks are attributedo hydrogen adsorption/desorption on the surface of MWCNTs [18].
e also observed these peaks in previous work [37] but for detailed
able 3lectrochemical hydrogen storage data of the raw, oxidized, purified and Fe-doped MWCN
WCNT samples Hydrogen storage capacity (C) at different sweep rates (mv s−1)
5 10 20 30 50
aw 0.18 0.13 0.09 0.06 0.04xidized 0.24 0.17 0.12 0.09 0.06urified 0.2 0.13 0.09 0.08 0.05e-doped 0.27 0.2 0.12 0.09 0.06
Fig. 8. Cyclic voltammograms of the Fe-doped MWCNT electrode over the potentialranges of (a) −1.5 to 0.5, (b) −1.35 to 0.5, (c) −1.2 to 0.5 and (d) −1.05 to 0.5 V at asweep rate of 20 mv s−1.
investigation, narrower potential ranges were applied for the Fe-doped MWCNT electrode (Fig. 8).
When a narrower potential range was used, the oxidation peak(a2) decreased and finally the a2 peak in the potential range of −1.05to 0.5 V completely disappeared. Hence, it can be concluded that theanodic peak was related to the oxidation of the adsorbed hydrogen.All the results obtained from the cyclic voltammetry and dischargestudies are summarized in Table 3.
As shown in Fig. 7 and Table 3, Fe-doped MWCNTs have the high-est hydrogen storage capacity among the other MWCNT samples.This result reveals that Fe is an effective catalyst for hydrogen stor-age (Eq. (1)). Accordingly, the overall reaction mechanism of theMWCNT electrodes can be obtained as follows [2]:
H2O + e− + MRDS−→M ∗ Had + OH− (1)
M ∗ Had + C � C ∗ Had + M (2)
Fe + 2OH− � Fe(OH)2 + 2e− (3)
Fe(OH)2 + OH− � Fe(OOH) + H2O (4)
Ni(OH)2 + OH− � Ni(OOH) + H2O (5)
The oxidized MWCNT electrode had higher hydrogen storagecapacity than the raw MWCNT electrode. Thus, oxidation increased
the surface area of MWCNTs. This result was also confirmed by ourBET and BJH analyses. As Fig. 7 shows, the peak current of hydrogenadsorption (decomposition of H2O) increases proportional to theactive surface of Fe nanoparticles. Therefore, based on the proposedreaction mechanism, the H2O decomposition reaction (Eq. (1)) isTs.
Discharge capacity (mAh g−1)
100
0.02 2900.04 3400.05 3450.05 510
4 ower
tb
4
tashoecpsh
A
UMta
R
[
[[
[[[
[[
[
[
[[[
[
[[
[[
[
[[
[
[
10 A. Reyhani et al. / Journal of P
he rate-determining step (RDS). This result has also been reportedy other researchers [17,2].
. Conclusions
The effects of oxidized, purified and Fe-doped MWCNTs onhe hydrogen storage capacity and peak currents of hydrogendsorption/desorption were studied. The results showed that underimilar sweep rates of cyclic voltammetry, the Fe-doped MWCNTsad the highest hydrogen storage capacity as compared to the raw,xidized and purified MWCNTs. On the other hand, according to thelectrochemical observations, with the increase in surface of theatalyst (disappearing of Fe3C phase), the adsorption/desorptioneak currents of hydrogen increased. Electrochemical analyses alsohowed that H2O decomposition on the Fe catalyst is the RDS of theydrogen storage process in the MWCNTs.
cknowledgements
The authors would like to thank the Research Council of Sharifniversity of Technology for financial support. The assistances ofr. M. Asgari and Ms. S. Mirershadi during the various stages of
he project and also Dr. Akhavan for useful discussions are greatlycknowledged.
eferences
[1] K.M. Thomas, Catal. Today 120 (2007) 389.[2] R. Strobel, J. Garche, P.T. Moseley, L. Jorissen, G. Wolf, J. Power Sources 159 (2006)
781.[3] Z. Li, Renew Sust. Energy Rev. 9 (2005) 395.[4] G. Hermosilla-Lara, G. Momen, P.H. Marty, B.L. Neidre, K. Hassouni, Int. J. Hydro-
gen Energy 32 (2007) 1542.
[5] C.Z. Wu, P. Wang, X. Yao, C. Liu, D.M. Chen, G.Q. Lu, H.M. Cheng, J. Alloys Compd.420 (2006) 278.[6] A.C. Dillon, K.M. Jones, T.A. Bekkedahl, C.H. Kiang, D.S. Bethune, M.J. Heben,
Nature 386 (1997) 377.[7] A.K.M. Fazle Kibria, Y.H. Mo, K.S. Nahm, M.H. Yum, Int. J. Hydrogen Energy 26
(2001) 823.
[[[
[
Sources 188 (2009) 404–410
[8] M. Marella, M. Tomaselli, Carbon 44 (2006) 1404.[9] G. Mpourmpakis, G.E. Froudakis, G.P. Lithoxoos, J. Samios, J. Chem. Phys. 126
(2007) 144704.10] X. Chen, Y. Zhang, X.P. Gao, G.L. Pan, X.Y. Jiang, J. Qu, F. Wu, J. Yan, D.Y. Song, Int.
J. Hydrogen Energy 29 (2004) 743.[11] H. Zhang, X. Fu, J. Yin, C. Zhou, Y. Chen, M. Li, A. Wei, Phys. Lett. A 399 (2005)
370.12] P. Benard, R. Chahine, Scripta Mater. 56 (2007) 803.13] D.Y. Kim, C.M. Yang, H. Noguchi, M. Yamamoto, T. Ohba, H. Kanoh, K. Kaneko,
Carbon 46 (2008) 611.14] S. Dag, Y. Ozturk, S. Ciraci, T. Yildirim, Phys. Rev. B 72 (2005) 155404.15] S. Yi, H. Zhang, L. Pei, Y. Zhu, X. Chen, X. Xue, J. Alloys Compd. 420 (2006) 312.16] H. Feng, Y.I. Wei, C. Shao, Y. Lai, S. Feng, Z. Dong, Int. J. Hydrogen Energy 32
(2007) 1294.17] C.T. Hsieh, Y.W. Chou, J.Y. Lin, Int. J. Hydrogen Energy 32 (2007) 3457.18] I. Lombardi, M. Bestetti, C. Mazzocchia, L. Cavallotti, U. Ducati, Eletrochem.
Solid-State Lett. 7 (5) (2004) A115.19] T. Tsoufis, P. Xidas, L. Jankovic, D. Gournis, A. Saranti, T. Bakas, M.A. Karakassid,
Diamond Relat. Mater. 16 (2007) 155.20] N. Lei, K. Keiji, Z. Ling-Ping, K. Tokushi, O. Keishin, M. Kiyaoto, N. Junji, Carbon
44 (2006) 2265.21] S.Z. Mortazavi, A. Reyhani, A. Iraji zad, Appl. Surf. Sci. 254 (2008) 6416.22] A.K.M. Fazle Kibria, Y.H. Mo, K.S. Nahm, M.J. Kim, Carbon 40 (2002) 1241.23] I.O. Hiro-aki, H. Na-oki, Y. Yasuzumi, M. Takanaori, S. Toshimitsu, Diamond Relat.
Mater. 16 (2007) 1121.24] V.Z. Mordkovich, E.A. Dolgova, A.R. Karaeva, D.N. Kharitonov, I.A. Maslov, A.A.
Kamenev, V.F. Tretjakov, Carbon 45 (2007) 62.25] C.M. Chen, Y.M. Dai, J.G. Huang, J.M. Jehng, Carbon 44 (2006) 1808.26] A. Reyhani, S.Z. Mortazavi, O. Akhavan, A.Z. Moshfegh, Sh. Lahooti, Appl. Surf.
Sci. 253 (2007) 8458.27] M.S. Dresselhaus, G. Dresselhaus, A. Jorio, F. Souza, Carbon 40 (2002) 2043.28] A. Jorio, M.A. Pimenta, A.G. Souza Filho, R. Saito, G. Dresselhaus, S. Dresselhaus,
New J. Phys. 5 (2003) 139.1.29] E. Yoo, T. Komatsu, N. Yagai, K. Arai, T. Yamazaki, K. Matsuishi, T. Matsumoto, J.
Nakamura, J. Phys. Chem. B 108 (2004) 18903.30] M. Tan, J. Zhu, J. Han, L. Niu, J. Lu, W. Chen, Mater. Res. Bull. 43 (2008) 1670.31] S. Porro, S. Musso, M. Vinante, L. Vanzetti, M. Anderle, F. Trotta, A. Tagliaferro,
Physica E 37 (2007) 58.32] J. Jiang, T. Feng, X. Cheng, L. Dai, G. Cao, B. Jiang, X. Wang, X. Liu, Sh. Zou, Nucl.
Instrum. Methods Phys. Res. B 244 (2006) 327.33] M. Chen, H.W. Yu, J.H. Chen, H.S. Koo, Diamond Relat. Mater. 16 (2007) 1110.
34] Y.Y. Fan, A. Kaufmann, A. Mukasyan, A. Varma, Carbon 44 (2006) 2160.35] B.T. Hang, S.H. Yoon, Sh. Okada, J.I. Yamaki, J. Power Sources 168 (2007) 522.36] A. Nozad Golikand, M. Asgari, M. Ghannadi Maragheh, S. Shahrokhian, J. Elec-troanal. Chem. 588 (2006) 155.37] A. Reyhani, S.Z. Mortazavi, A. Nozad Golikand, A.Z. Moshfegh, S. Mirershadi, J.
Power Sources 183 (2008) 539.