Synthesis and structural characteristics of nitrogen doped TiO 2 aerogels
Upload
independentCategory
view
0download
0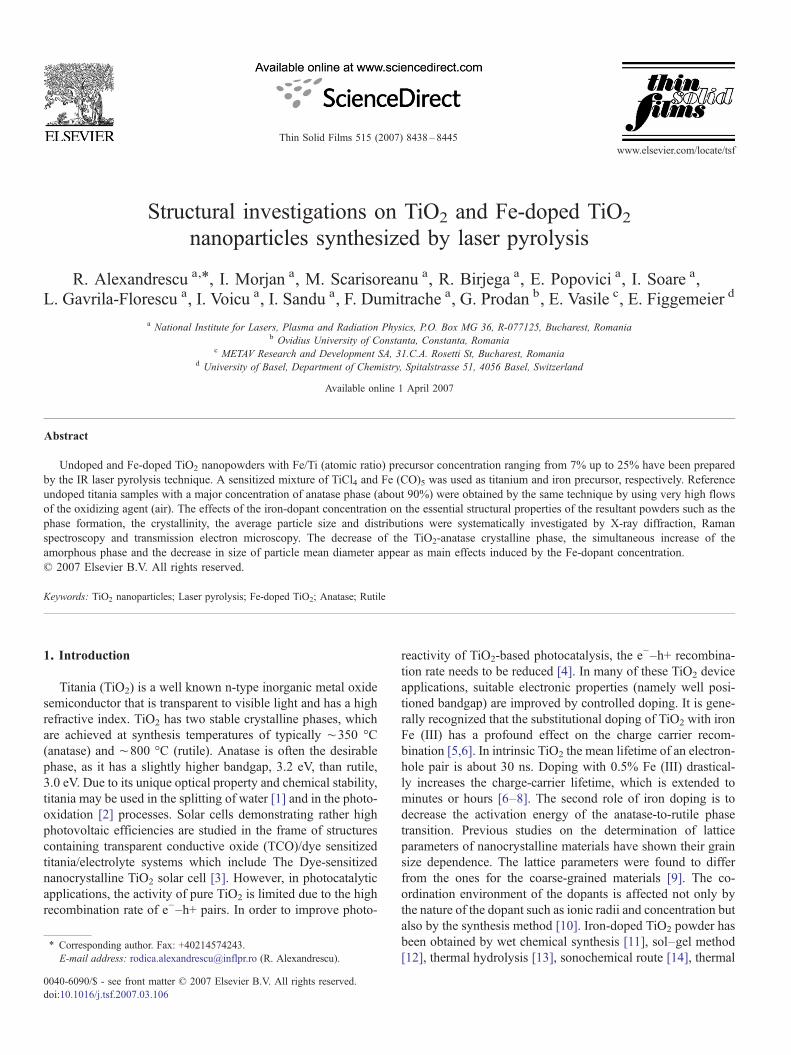
007) 8438–8445www.elsevier.com/locate/tsf
Thin Solid Films 515 (2
Structural investigations on TiO2 and Fe-doped TiO2
nanoparticles synthesized by laser pyrolysis
R. Alexandrescu a,⁎, I. Morjan a, M. Scarisoreanu a, R. Birjega a, E. Popovici a, I. Soare a,L. Gavrila-Florescu a, I. Voicu a, I. Sandu a, F. Dumitrache a, G. Prodan b, E. Vasile c, E. Figgemeier d
a National Institute for Lasers, Plasma and Radiation Physics, P.O. Box MG 36, R-077125, Bucharest, Romaniab Ovidius University of Constanta, Constanta, Romania
c METAV Research and Development SA, 31.C.A. Rosetti St, Bucharest, Romaniad University of Basel, Department of Chemistry, Spitalstrasse 51, 4056 Basel, Switzerland
Available online 1 April 2007
Abstract
Undoped and Fe-doped TiO2 nanopowders with Fe/Ti (atomic ratio) precursor concentration ranging from 7% up to 25% have been preparedby the IR laser pyrolysis technique. A sensitized mixture of TiCl4 and Fe (CO)5 was used as titanium and iron precursor, respectively. Referenceundoped titania samples with a major concentration of anatase phase (about 90%) were obtained by the same technique by using very high flowsof the oxidizing agent (air). The effects of the iron-dopant concentration on the essential structural properties of the resultant powders such as thephase formation, the crystallinity, the average particle size and distributions were systematically investigated by X-ray diffraction, Ramanspectroscopy and transmission electron microscopy. The decrease of the TiO2-anatase crystalline phase, the simultaneous increase of theamorphous phase and the decrease in size of particle mean diameter appear as main effects induced by the Fe-dopant concentration.© 2007 Elsevier B.V. All rights reserved.
Keywords: TiO2 nanoparticles; Laser pyrolysis; Fe-doped TiO2; Anatase; Rutile
1. Introduction
Titania (TiO2) is a well known n-type inorganic metal oxidesemiconductor that is transparent to visible light and has a highrefractive index. TiO2 has two stable crystalline phases, whichare achieved at synthesis temperatures of typically ∼350 °C(anatase) and ∼800 °C (rutile). Anatase is often the desirablephase, as it has a slightly higher bandgap, 3.2 eV, than rutile,3.0 eV. Due to its unique optical property and chemical stability,titania may be used in the splitting of water [1] and in the photo-oxidation [2] processes. Solar cells demonstrating rather highphotovoltaic efficiencies are studied in the frame of structurescontaining transparent conductive oxide (TCO)/dye sensitizedtitania/electrolyte systems which include The Dye-sensitizednanocrystalline TiO2 solar cell [3]. However, in photocatalyticapplications, the activity of pure TiO2 is limited due to the highrecombination rate of e−–h+ pairs. In order to improve photo-
⁎ Corresponding author. Fax: +40214574243.E-mail address: [email protected] (R. Alexandrescu).
0040-6090/$ - see front matter © 2007 Elsevier B.V. All rights reserved.doi:10.1016/j.tsf.2007.03.106
reactivity of TiO2-based photocatalysis, the e−–h+ recombina-tion rate needs to be reduced [4]. In many of these TiO2 deviceapplications, suitable electronic properties (namely well posi-tioned bandgap) are improved by controlled doping. It is gene-rally recognized that the substitutional doping of TiO2 with ironFe (III) has a profound effect on the charge carrier recom-bination [5,6]. In intrinsic TiO2 the mean lifetime of an electron-hole pair is about 30 ns. Doping with 0.5% Fe (III) drastical-ly increases the charge-carrier lifetime, which is extended tominutes or hours [6–8]. The second role of iron doping is todecrease the activation energy of the anatase-to-rutile phasetransition. Previous studies on the determination of latticeparameters of nanocrystalline materials have shown their grainsize dependence. The lattice parameters were found to differfrom the ones for the coarse-grained materials [9]. The co-ordination environment of the dopants is affected not only bythe nature of the dopant such as ionic radii and concentration butalso by the synthesis method [10]. Iron-doped TiO2 powder hasbeen obtained by wet chemical synthesis [11], sol–gel method[12], thermal hydrolysis [13], sonochemical route [14], thermal
Fig. 1. Experimental setup for the synthesis of iron-doped titania nanoparticles by the IR laser pyrolysis.
Table 1Synthesis parameters and average Fe/Ti ratio (EDAX measurements) of Fe-doped TiO2 powder samples
Run ΦAir,sccm
ΦC2H4
(TiCl4),sccm
ΦTiCl4,sccm
ΦAr (Fe(CO)5),sccm
ΦFe
(CO)5,sccm
Fe/Ti(atomicratio)
EDAX(Fe/Ti) (%)(average)
SN 10 (N2O) 100 3 – – –SA 50 100 3 – – –S0 150 100 3 – – –S25 150 100 2 10 0.5 0.25 23 (+/−3)S15 150 100 2.3 6 0.35 0.12 12 (+/−3)S7 150 100 3 3 0,2 0.07 4 (+/−2)
8439R. Alexandrescu et al. / Thin Solid Films 515 (2007) 8438–8445
plasma synthesis by DC plasma jet using TiCl4 and iron(III)acetylacetonate as precursor [15], RF plasma synthesis frommetal mixtures [16] and oxidative pyrolysis of organometallicprecursors in induction thermal plasma. [4,17], ion-implantation[18], ion beam induced chemical vapor deposition (IBICVD)[19] and oxidative pyrolysis of liquid-feed metallorganic pre-cursors in a radiation-frequency (RF) thermal plasma [20].Onecommonly encountered problem is that these methods are gen-erally at least two steps methods.
In our previous studies we have successfully reported on thesynthesis of anatase/rutile mixed nanopowders using the laserpyrolysis route as a single-step reaction route [21]. It is importantto note that the IR laser pyrolysis technique is a gas phasetechnique, which allows for the preparation of a large variety ofnanobodies with diameters ranging from a few nm to about100 nmandwith narrowly distributed sizes [22]. Simultaneous in-situ synthesis and iron co-doping of TiO2 within the pyrolysisprocess is demonstrated in this work. At the same time, we reportabout the laser synthesis of titania nanopowders with a majoranatase content (about 90%) obtained at a high concentration ofair (the reaction oxidizing agent). After our knowledge, thesynthesis of Fe-doped TiO2 by using the laser pyrolysis from gas-phase precursors is reported for the first time. Controlled Fe/Tiatomic ratios, ranging from nominal 0 to 25% were used in orderto prepare Fe-doped TiO2 nanopowders. The effects of the iron-dopant concentration on the essential structural properties of theresultant powders such as the phase formation, the crystallinity,the average particle diameters and the distributions were system-atically investigated. X-ray diffraction (XRD), Raman spectros-copy, transmission electron microscopy (TEM), high resolutiontransmission electron microscopy (HRTEM) and selected areaelectron diffraction (SAED) were used to characterize the pow-ders. The Fe/Ti ratio in the powders was estimated by X-rayenergy dispersive analyzer (EDAX).
2. Experimental details
The laser synthesis technique is based on the resonancebetween the emission of a CW CO2 laser line and the infrared
absorption band of a gas precursor. The chemical reaction istriggered by the subsequent heating of precursors by collisionalenergy transfer. In this paper the synthesis of Fe-doped TiO2
nanopowder was performed by employing a modified versionof the pyrolysis set-up [21] in which TiCl4, Fe(CO)5 and air, asgas phase precursors are simultaneously allowed to emerge intothe flow reactor (Fig. 1). Ethylene served as a carrier for theTiCl4 vapors and as an energy transfer agent. Argon was thevapor carrier for iron pentacarbonyl. A special irradiationgeometry employing a triple central nozzle system was used.Complementary Ar flows are employed for the confinement ofreactant gases/nucleated particles towards the flow axis and forflushing the windows, respectively. The focused IR radiation(400 W nominal power) was intersecting at right angles thereactant flows. The aggregation of the hot, freshly nucleatedparticles is rapidly stopped by the sudden cooling/freezingoutside the reaction zone. During all experiments the totalpressure in the reactor was held at 550 mbar.
Two sets of representative undoped and doped TiO2 powdersamples are discussed in this paper. The first series concernsundoped samples (labeled SN, SA and S0) which are studiedrelatively to the input variation of their oxygen precursors.Sample SN was obtained by replacing air with nitrous oxide. Amuch lower air flow was used to obtain sample SA as comparedto sample S0. The second series refers to three representativeFe-doped samples, which are discussed in this work according

Table 2Crystallographic and morphology parameters of the as-synthesized undoped and Fe-doped nano-TiO2 particles
Sample TiO2-phases proportion Mean crystallitesize (nm)
TiO2 relative amount(%)
Lattice parameters
A(%)
R(%)
R/A A R AaIA(101)
A+RIA(101)+IR(110)
A (JCPDS 21-1272)a=3.785 Å c=9.513 Å
R (JCPDS 21-1272)a=4.593 Å c=2.959 Å
a (Å) c (Å) V (Å3) a (Å) C (Å) V (Å3)
SN 64.1 35.9 0.56 14.4 4.2 35 47.5 3.805 9.56 138.3 4.70 2.92 64.5SA 74.6 25.4 0.34 17.8 15.0 55 65 3.81 9.57 139.0 4.64 2.965 63.8S0 92.3 7.7 0.08 18.9 21.4 100 100 3.81 9.55 138.3 4.63 2.95 62.4S7 87.4 12.6 0.14 16.8 20.6 94.5 96 3.81 9.56 138.7 4.63 2.98 63.9S15 89.0 11 0.12 19.5 20.6 85 86 3.81 9.56 139.1 4.63 2.98 63.7S25 81.7 18.3 0.22 15.1 11.2 41 45 3.80 9.52 137.6 4.62 2.98 63.5
a Normalized integrated intensity relatively to the (101) peak of the S0 sample.
Fig. 2. XRD diffraction patterns for the representative, undoped nano titaniasamples SN, SA and S0 with anatase (A) and rutile (R) peak identification.
8440 R. Alexandrescu et al. / Thin Solid Films 515 (2007) 8438–8445
to their increasing input Fe/Ti atomic ratio, as compared to thereference undoped sample S0. The Fe/Ti ratios loaded in thelaser induced reaction (Fe/Ti=0.07, 0.15 and 0.25) were ad-justed by controlling the Fe (CO)5 and TiCl4 flows, respectively.Accordingly, the samples are labeled S7, S15 and S25. Themain experimental parameters are listed in Table 1. In the lastcolumn of the table, the average values of the Fe/Ti (in at %) inpowders, as determined by EDAX measurements are displayed.
The obtained titanium oxide nanostructures were character-ized by XRD, TEM, SAED, EDAX and Raman spectroscopy.
3. Results and discussions
EDAX semi quantitative elemental analysis was used to deter-mine the Fe/Ti atomic ratios of powders (last column in Table 1).Considering the experimental errors of the measurement device,the measured values of the Fe/Ti atomic ratios in the Fe-dopedsamples can only constitute a qualitative estimation.
The XRD analysis of titania samples reveals the coexistenceof anatase (JPCDS file 21-1272) and rutile (JCPDS file 21-1276) phases. The data extracted from the XRD spectra, i.e.: thepercentage of anatase and rutile phases, the mean crystallitesizes [23], the normalized integrated intensity of the TiO2
A (101)reflection and of the sum of the integrated intensities of TiO2
A
(101) and the TiO2R (110) peaks, relatively to the reference
sample S0 as well as the lattice parameters (a, c and unit cellvolume) are gathered in Table 2. The XRD patterns exhibited inFig. 2 refer to the undoped series of samples SN, SA and S0 inwhich the variation of the experimental synthesis conditions asthe oxygen concentration in the input oxidizing gases (air ornitrous oxide) was studied. XRD phase analysis (Table 2) re-veals an overwhelming dominancy of the anatase phase (morethan about 92%) in the sample S0, obtained at the highestair precursor concentration. It was already observed [24] thatfor titania produced by RF thermal plasma, rutile formationis favored by oxygen-deficient gas-phase TiO2 clusters whileanatase tends to condense from oxygen-rich clusters. We shouldmention that for both air and nitrous oxide, at lower air flows(e.g. 10 sccm for sample SN) the powder was gray with slightblue parts. At high air input flows (150 sccm for sample S0), thecolor of the powder becomes light yellow to white. Some salientfeatures characterize the SN, SA and S0 series: i) the significant
decrease of the mean particle sizes for SN and SA relatively toS0, particularly concerning the rutile phase; ii) the decrease ofthe total amount of the TiO2 phases relatively to the S0 sample,especially in case of the anatase phase. For the undoped SATiO2
sample, anatase percentage is approximately 74%, which isquite close to the well-known Degussa P25 commercial sample.
The evolution of the diffraction patterns for the doped TiO2
specimens with Fe/Ti atomic ratios ranging from 0 to 25%(samples S0 to S25) is presented in Fig. 3. A striking feature ofthis figure is the sharp and highly intense anatase peak (101) ofsample S0, indicative of a much higher crystallinity than the otherthree Fe-doped samples. Amajor effect of iron doping seems to bea decrease of the anatase–TiO2 crystalline phase with the increaseof the iron concentration (from S7 and S15 to S25) and conse-quently an increase of the amorphous phase (see the graduallydecrease of the peak intensities in Fig. 3 and the inset of Fig. 3 inwhich the main peaks of anatase and rutile are enlarged) Accord-ing to XRD calculations (see Table 2), the decrease of the crys-talline phase with the increase of the Fe loading is accompaniedby the diminishing of the amount of the anatase phase that leads toan increase of the rutile proportion. This trend could be quantified

Fig. 4. a and b. a— The dependence on increased Fe concentration of the ratiosof both the integrated intensity of the TiO2
A (101) versus the integrated intensity ofthe same anatase-phase reflection for the iron-free sample (S0), and of the sum ofthe integrated intensities of the TiO2
A (101) and the TiO2R (110) reflections,
respectively, versus the same sum for S0; b— the variation of the crystallite sizefor anatase and rutile, respectively with increasing Fe concentration.
Fig. 3. XRD analysis for representative Fe-doped titania samples (S7, S15 andS25), as compared to the reference undoped sample S0, with anatase (A) andrutile (R) peak identification. The insert displays the XRD analysis (in the 20-322 theta domain), showing the enlarged main diffraction peaks of anatase (101)and rutile (110).
8441R. Alexandrescu et al. / Thin Solid Films 515 (2007) 8438–8445
by drawing the evolution with increasing Fe concentration of theratios of both the integrated intensity of the TiO2
A (101) versus theintegrated intensity of the same reflection for the iron-free sample(S0) and of the sum of the integrated intensities of the TiO2
A (101)and the TiO2
R (110) reflections, respectively, versus the same sumfor S0. Fig. 4a displays both the above dependencies. We shouldmention that the decrease of the strongest diffraction from anatase(101)with the increase of Fe/Ti ratio was also reported in previousstudies (see for instance Wang et al. [4]). Probably due to ourspecific synthesis conditions, the opposite effect, i.e. a significantincrease of the rutile diffraction lines with increasing Fe/Ti ratio[4] is not revealed in the present study.
A mixture of TiO2–anatase and rutile phases with anobvious predominance of the anatase phase is observed in allthe samples. No crystalline iron compounds such as Fe2O3 orFeTiO3 could be detected. This suggests that the iron dopantis partly isomorphously substituted into the TiO2 crystallinephases possibly forming a so called “amorphous to XRD”phase, i.e. a phase in which a great number of very fine anddefective crystallites are probably present. This phase is belowthe detection limit of XRD.
Fig. 4b displays the evolution of the mean crystallite size foranatase and rutile, respectively, with increased iron concentration.A general trend may be noticed, namely a decrease of the meancrystallite sizes with increased Fe loading (see also Table 2),particularly at high doping levels (sample S25). This effect ismostprobably a result of the disturbing effect induced by the out oflattice iron presence on the crystal growth. However, a partial ironsubstitution into the lattice is also suggested by the slight increaseof the unit cell volume of the rutile phase, in particular of the cparameter (sample S25 in Table 1). As observed earlier, it is morelikely that the rutile phase accommodates Fe ions due to the highertolerance towards defects of rutile over anatase [4]. This aspectexplains why the growth of rutile phase is not disturbed byincreased iron loading while the less tolerant toward defectsanatase phase is strongly affected.
The Raman spectra of iron-doped samples and of thereference S0 sample are presented in Fig. 5. Due to technicallimitation of our apparatus, characteristic bands of anatasebelow 200 cm−1 cannot be recorded. For the undoped S0sample, bands at 385, 500 and 625 cm−1 match the anatasestretches [25]. The peaks are broadened and shifted relative tothe peaks of bulk TiO2 material [26]. One reason could be theoverlapping of rutile bands, especially in the region of the highfrequency vibration of rutile (for the bulk crystal the rutile bandis centered at 612 cm− 1), finally leading to a slightlyasymmetric band. A second reason for the shifts could be thenot perfect oxygen stoichiometry. The Raman spectrum of afully oxidized sample exhibits much sharper spectral featuresand has peak positions that are in excellent agreement with bulkTiO2 material [27]. On the other hand, for nanophase TiO2, thegrain-size effect of the line broadening was often debated. Withincreasing Fe/Ti ratio, most striking features in Fig. 5 are: i) thedecreased intensity of the Raman bands and simultaneousincrease of their full widths at half maximum (FWHM) with theincrease in iron doping level (an estimation of the FWHM isdisplayed as insert in Fig. 5); ii) the observation of rutile bands(at about 610 cm−1), on the account of the quasi-disappearance
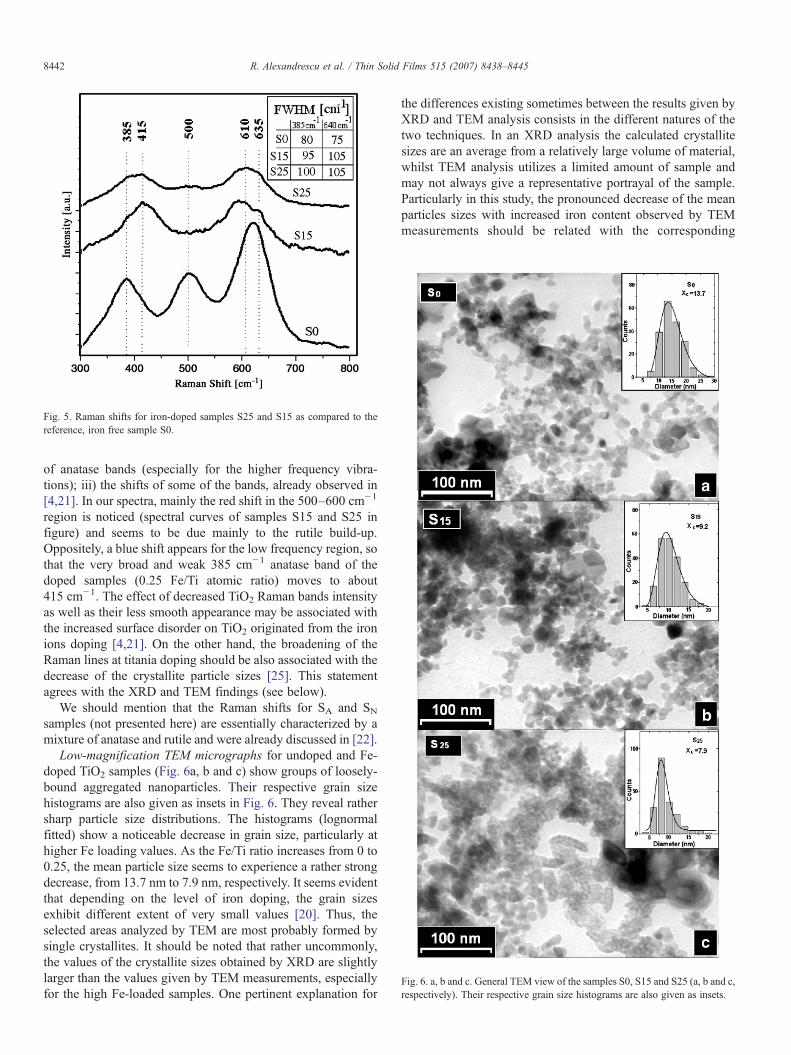
Fig. 6. a, b and c. General TEM view of the samples S0, S15 and S25 (a, b and c,respectively). Their respective grain size histograms are also given as insets.
Fig. 5. Raman shifts for iron-doped samples S25 and S15 as compared to thereference, iron free sample S0.
8442 R. Alexandrescu et al. / Thin Solid Films 515 (2007) 8438–8445
of anatase bands (especially for the higher frequency vibra-tions); iii) the shifts of some of the bands, already observed in[4,21]. In our spectra, mainly the red shift in the 500–600 cm−1
region is noticed (spectral curves of samples S15 and S25 infigure) and seems to be due mainly to the rutile build-up.Oppositely, a blue shift appears for the low frequency region, sothat the very broad and weak 385 cm−1 anatase band of thedoped samples (0.25 Fe/Ti atomic ratio) moves to about415 cm−1. The effect of decreased TiO2 Raman bands intensityas well as their less smooth appearance may be associated withthe increased surface disorder on TiO2 originated from the ironions doping [4,21]. On the other hand, the broadening of theRaman lines at titania doping should be also associated with thedecrease of the crystallite particle sizes [25]. This statementagrees with the XRD and TEM findings (see below).
We should mention that the Raman shifts for SA and SNsamples (not presented here) are essentially characterized by amixture of anatase and rutile and were already discussed in [22].
Low-magnification TEM micrographs for undoped and Fe-doped TiO2 samples (Fig. 6a, b and c) show groups of loosely-bound aggregated nanoparticles. Their respective grain sizehistograms are also given as insets in Fig. 6. They reveal rathersharp particle size distributions. The histograms (lognormalfitted) show a noticeable decrease in grain size, particularly athigher Fe loading values. As the Fe/Ti ratio increases from 0 to0.25, the mean particle size seems to experience a rather strongdecrease, from 13.7 nm to 7.9 nm, respectively. It seems evidentthat depending on the level of iron doping, the grain sizesexhibit different extent of very small values [20]. Thus, theselected areas analyzed by TEM are most probably formed bysingle crystallites. It should be noted that rather uncommonly,the values of the crystallite sizes obtained by XRD are slightlylarger than the values given by TEM measurements, especiallyfor the high Fe-loaded samples. One pertinent explanation for
the differences existing sometimes between the results given byXRD and TEM analysis consists in the different natures of thetwo techniques. In an XRD analysis the calculated crystallitesizes are an average from a relatively large volume of material,whilst TEM analysis utilizes a limited amount of sample andmay not always give a representative portrayal of the sample.Particularly in this study, the pronounced decrease of the meanparticles sizes with increased iron content observed by TEMmeasurements should be related with the corresponding

8443R. Alexandrescu et al. / Thin Solid Films 515 (2007) 8438–8445
significant increase of the “amorphous to XRD” phase. This“amorphous” phase could be rather complex, most likelyconsisting of a high number of very fine nanoparticles (below5 nm diameter), possessing not well defined (defective/amorphous) crystallographic features and having possibly anFe-rich content. This population is partly hidden to the XRDanalysis but could become visible at a TEM examination.
At a higher magnification, the TEM micrographs of samplesdiscussed in this work exhibit both round shaped and elongatedor facetted particles, with irregular shapes and sizes (Fig. 7aand b, for samples S0 and S15, respectively).
The associated SAED patterns in which the evolution of thephase transformation was also analyzed are presented as insetsin Fig. 7a and b. The identification of the interplanar distances isindicated by arrows and these qualitative results can be directlycompared with those obtained by means of XRD and Raman. Ingeneral, for both series of samples, SAED analysis confirms thatthe titania nanoparticles (either undoped or doped) are a mixtureof anatase and rutile. However, increased crystallinity anddominant anatase phase are found for the reference un-dopedsample (S0). On the other hand, the amorphicity seems to be
Fig. 8. a and b. High resolution TEM images of titania samples displayingparticle morphology and interlayer distances for pure titania samples SA and S0(a and b, respectively).
Fig. 7. a and b. TEM micrographs of the nano-TiO2 powders and thecorresponding SAED patterns (as inset in figures): a — for the reference, iron-free S0 sample and b — for sample S15 (0.15 Fe/Ti atomic ratio). Note thedifferent scale bars in the two images.
higher for sample S15 (obtained with the Fe/Ti ratio of 0.15)(see inset in Fig. 7b). We should however note that the increaseddiffusivity observed in this SAED pattern could be due not onlyto an amorphous material but also to the increased number ofcrystalline nanometer-sized particles [28]. The most intensediffraction rings can be assigned to the (101) anatase (at 3.52 Å)and (110) rutile (at 3.25 Å). Some rings may appear by asuperposition of anatase and rutile reflections, such as the ringsat 2.48 Å and 1.68 Å. In case of the better crystallinity of sampleS0, the complementary ring at 1.4 Å (corresponding to rutile(007) and anatase (204)) is identified.
Fig. 8 displays the HRTEM images for pure titania samples(SA and S0). A mixture of anatase and rutile (d=0.358 and0.320 nm interplanar distances, respectively) seems to bepresent in sample obtained with lower concentration of theoxygen precursor (sample SA) (Fig. 8a). The major anatase
8444 R. Alexandrescu et al. / Thin Solid Films 515 (2007) 8438–8445
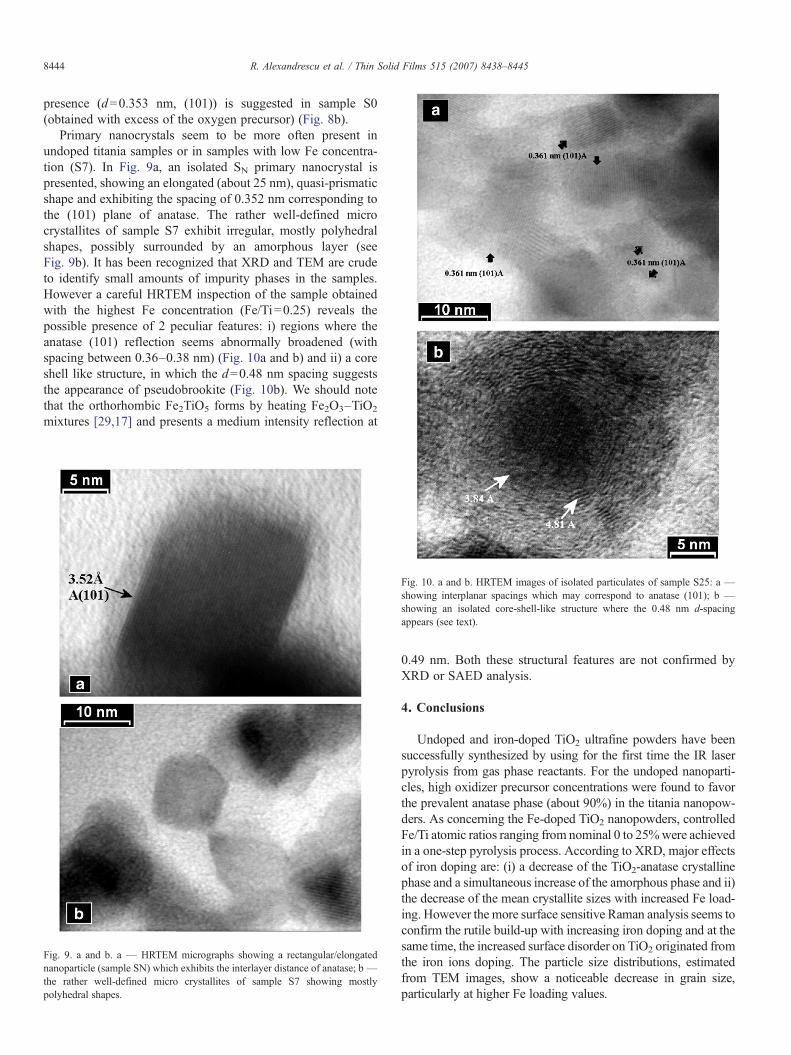
presence (d=0.353 nm, (101)) is suggested in sample S0(obtained with excess of the oxygen precursor) (Fig. 8b).
Primary nanocrystals seem to be more often present inundoped titania samples or in samples with low Fe concentra-tion (S7). In Fig. 9a, an isolated SN primary nanocrystal ispresented, showing an elongated (about 25 nm), quasi-prismaticshape and exhibiting the spacing of 0.352 nm corresponding tothe (101) plane of anatase. The rather well-defined microcrystallites of sample S7 exhibit irregular, mostly polyhedralshapes, possibly surrounded by an amorphous layer (seeFig. 9b). It has been recognized that XRD and TEM are crudeto identify small amounts of impurity phases in the samples.However a careful HRTEM inspection of the sample obtainedwith the highest Fe concentration (Fe/Ti=0.25) reveals thepossible presence of 2 peculiar features: i) regions where theanatase (101) reflection seems abnormally broadened (withspacing between 0.36–0.38 nm) (Fig. 10a and b) and ii) a coreshell like structure, in which the d=0.48 nm spacing suggeststhe appearance of pseudobrookite (Fig. 10b). We should notethat the orthorhombic Fe2TiO5 forms by heating Fe2O3–TiO2
mixtures [29,17] and presents a medium intensity reflection at
Fig. 10. a and b. HRTEM images of isolated particulates of sample S25: a —showing interplanar spacings which may correspond to anatase (101); b —showing an isolated core-shell-like structure where the 0.48 nm d-spacingappears (see text).
Fig. 9. a and b. a — HRTEM micrographs showing a rectangular/elongatednanoparticle (sample SN) which exhibits the interlayer distance of anatase; b—the rather well-defined micro crystallites of sample S7 showing mostlypolyhedral shapes.
0.49 nm. Both these structural features are not confirmed byXRD or SAED analysis.
4. Conclusions
Undoped and iron-doped TiO2 ultrafine powders have beensuccessfully synthesized by using for the first time the IR laserpyrolysis from gas phase reactants. For the undoped nanoparti-cles, high oxidizer precursor concentrations were found to favorthe prevalent anatase phase (about 90%) in the titania nanopow-ders. As concerning the Fe-doped TiO2 nanopowders, controlledFe/Ti atomic ratios ranging from nominal 0 to 25%were achievedin a one-step pyrolysis process. According to XRD, major effectsof iron doping are: (i) a decrease of the TiO2-anatase crystallinephase and a simultaneous increase of the amorphous phase and ii)the decrease of the mean crystallite sizes with increased Fe load-ing. However the more surface sensitive Raman analysis seems toconfirm the rutile build-up with increasing iron doping and at thesame time, the increased surface disorder on TiO2 originated fromthe iron ions doping. The particle size distributions, estimatedfrom TEM images, show a noticeable decrease in grain size,particularly at higher Fe loading values.
8445R. Alexandrescu et al. / Thin Solid Films 515 (2007) 8438–8445
Acknowledgements
Support of this research by the SCOPES IB7320-110854/1,2005-2008 JRP of the SNSF and by the CEEX Project No 23 ofRomanian Ministry of Education, is gratefully acknowledged.
References
[1] M.V. Rao, K. Rajeshwar, V.R. Pal Verneker, J. DuBow, J. Phys. Chem. 84(1980) 1987.
[2] L. Palmisano, M. Schiavello, A. Sclafani, C. Martin, I. Martin, V. Rives,Catal. Lett. 24 (1994) 303.
[3] B. O'Regan, M. Graetzel, Nature 73 (1991) 737.[4] X.H. Wang, J.-G. Li, H. Kamiyama, T. Ishigaki, Thin Solid Films 506/507
(2006) 278.[5] I. Djerdj, A.M. Tonejc, J. Alloys Compd. 413 (2006) 159.[6] J. Moser, M. Gratzel, R. Gallay, Helv. Chim. Acta 70 (1987) 1596.[7] A.R. Bally, E.N. Korobeinikova, P.E. Schmid, F. Lévy, F. Bussy, J. Phys.,
D, Appl. Phys. 31 (1998) 1149.[8] F.C. Gennari, D.M. Pasquevich, J. Mater. Sci. 33 (1998) 1571.[9] Th.E. Weirich, M. Winterer, S. Seifried, H. Hahn, H. Fuess, Ultramicro-
scopy 81 (2000) 263.[10] W. Li, A.I. Frenkel, J.C. Woicik, C. Ni, S. Ismat Shah, Phys. Rev., B 72
(2005) 155315.[11] C.Y. Wang, C. Bottcher, D.W. Bahnemann, J.K. Dohrmann, J. Mater.
Chem. 13 (2003) 2322.[12] Y.H. Zhang, A. Reller, J. Mater. Chem. 11 (2001) 2537.[13] M. Hirano, T. Joji, M. Inagaki, J. Am. Ceram. Soc. 87 (2004) 35.
[14] N. Perkas, O. Palchik, I. Brukental, I. Nowik, Y. Gofer, Y. Koltypin, A.Gedanken, J. Phys. Chem., B 107 (2003) 8772.
[15] S.M. Oh, S.S. Kim, J.E. Lee, T. Ishigaki, D.W. Park, Thin Solid Films 435(2003) 252.
[16] A. Takeda, T. Sato, C. Kaito, S. Kaneko, Thin Solid Films 435 (2003) 211.[17] X. Zhang, M. Zhou, L. Lei, Catal. Commun. 7 (2006) 427.[18] H. Yamashita, M. Harada, J. Misaka, M. Takeuchi, B. Neppolian, M.
Anpo, Catal. Today 84 (2003) 191.[19] F. Gracia, J.P. Holgado, F. Yubero, A.R. Gonzalez-Felipe, J. Phys. Chem.,
B 108 (2004) 17466.[20] X.H. Wang, J.-G. Li, H. Kamiyama, M. Katada, N. Ohashi, Y. Moriyoshi,
T. Ishigaki, J. Am. Chem. Soc. 127 (2005) 10982.[21] R. Alexandrescu, F. Dumitrache, I. Morjan, I. Sandu, M. Savoiu, I. Voicu,
C. Fleaca, R. Piticescu, Nanotechnology 15 (2004) 537.[22] R. Alexandrescu, I. Morjan, I. Voicu, D. Dumitrache, L. Albu, I. Soare, G.
Prodan, Appl. Surf. Sci. 248 (2005) 138.[23] R.A. Spurr, H. Myers, Anal. Chem. 29 (1957) 760.[24] J.-G. Li, H. Kamiyama, X.-H. Wang, Y. Moriyoshi, T. Ishigaki, J. Eur.
Ceram. Soc. 26 (2006) 423.[25] S.T. Martin, C.L. Morrison, M.R. Hoffmann, J. Phys. Chem. 98 (1994)
13695.[26] H.S. Mavi, A.K. Shukla, S.C. Abbi, I.P. Jain, J. Appl. Phys. 66 (1989)
5322.[27] J.C. Parker, R.W. Siegel, Appl. Phys. Lett. 57 (1990) 943.[28] J. Arbiol, J. Cerda, G. Dezanneau, A. Cirera, F. Peiro, A. Cornet, J.R.
Morante, J. Appl. Phys. 92 (2002) 853.[29] F.C. Gennari, J.J. Andrade Gamboa, D.M. Pasquevich, J. Mater. Sci. Lett.
17 (1998) 697.
Copyright © 2022 FDOKUMEN