Sol–gel doped TiO 2 nanomaterials: a comparative study
15
5TH INTERNATIONAL CONFERENCE ON SOL-GEL MATERIALS- TRZEBIESZOWICE, POLAND Sol–gel doped TiO 2 nanomaterials: a comparative study Ma ˘lina Ra ˘ileanu Maria Cris ¸an Nicolae Dra ˘gan Dorel Cris ¸an Anouk Galtayries Ana Bra ˘ileanu Adelina Ianculescu Valentin S. Teodorescu Ines Nit¸oi Mihai Anastasescu Received: 2 September 2008 / Accepted: 6 June 2009 / Published online: 6 July 2009 Ó Springer Science+Business Media, LLC 2009 Abstract Among the great number of sol–gel prepared nanomaterials, TiO 2 has attracted significant interest due to its high photocatalytic activity, excellent functionality, thermal stability and non-toxicity. The photocatalytic degradation of pollutants using un-doped and doped TiO 2 nanopowders or thin films is very attractive for applications in environmental protection, as a possible solution for water purification. The present work describes a compar- ative structural and chemical study of un-doped TiO 2 and the corresponding S- and Ag-doped materials. The photo- catalytic activity was established by testing the degradation of organic chloride compounds from aqueous solutions. Sol–gel Ag-doped TiO 2 coatings, prepared by co-gelation and sol–gel Ag-doped TiO 2 coatings obtained from nanopowders were also compared. Their structural evolu- tion and crystallization behaviour (lattice parameters, crystallite sizes, internal strains) with thermal treatment were followed by thermal analysis, X-ray diffraction, transmission electron microscopy, atomic force micros- copy and specific surface areas measurements. X-ray photoelectron spectroscopy analyses were performed to characterize the surface composition and S or Ag specia- tion, which was used to interpret the catalytic data. Keywords Sol–gel Nanopowders Coatings S-doped TiO 2 Ag-doped TiO 2 Water purification 1 Introduction Titania represents one of the most studied inorganic com- pounds in chemistry. Its preparation, physical and chemical properties together with its applications for all crystallo- graphic forms (anatase, rutile and brookite) have been the object of numerous studies. The literature supplies thou- sands of articles dedicated to TiO 2 . Let us mention at least some reviews [1–8] and books [9–13]. The explanation of such a huge interest is simple. It is well known that among the various photocatalysts, titania occupies a very impor- tant place, due to its high photocatalytic activity, excellent functionality, high chemical stability, thermal stability and non-toxicity. These properties make it useful in different fields, ranging from optics to gas sensors via solar energy. All the mentioned properties are improved in the case of nanostructured TiO 2 , which can be easily obtained by the sol–gel method. An advantage of nanometer sized materi- als stems from the changes in electrochemical potentials of the photogenerated charge carriers that accompany decreasing particle size. The sol–gel method facilitates the M. Ra ˘ileanu M. Cris ¸an (&) N. Dra ˘gan D. Cris ¸an A. Bra ˘ileanu M. Anastasescu Romanian Academy, Institute of Physical Chemistry Ilie Murgulescu, 202 Splaiul Independent ¸ei, 060021 Bucharest, Romania e-mail: [email protected]; [email protected] A. Galtayries Laboratoire de Physico-Chimie des Surfaces (UMR CNRS 7045), Ecole Nationale Supe ´rieure de Chimie de Paris, 11 rue P. et M. Curie, 75005 Paris, France A. Ianculescu Department of Oxide Materials Science and Engineering, ‘‘Politehnica’’, University of Bucharest, 1-7 Gh. Polizu, P.O. Box 12-134, 011061 Bucharest, Romania V. S. Teodorescu National Institute for Physics of Materials, Atomis ¸tilor 105 bis, P.O. Box MG 07, Bucharest, Ma ˘gurele, Romania I. Nit ¸oi INCD-ECOIND, 90-92 Sos. Panduri, 050663 Bucharest, Romania 123 J Sol-Gel Sci Technol (2009) 51:315–329 DOI 10.1007/s10971-009-2017-z
-
Upload
institutuldefilosofie -
Category
Documents
-
view
0 -
download
0
Transcript of Sol–gel doped TiO 2 nanomaterials: a comparative study

5TH INTERNATIONAL CONFERENCE ON SOL-GEL MATERIALS- TRZEBIESZOWICE, POLAND
Sol–gel doped TiO2 nanomaterials: a comparative study
Malina Raileanu Æ Maria Crisan Æ Nicolae Dragan Æ Dorel Crisan ÆAnouk Galtayries Æ Ana Braileanu Æ Adelina Ianculescu ÆValentin S. Teodorescu Æ Ines Nitoi Æ Mihai Anastasescu
Received: 2 September 2008 / Accepted: 6 June 2009 / Published online: 6 July 2009
� Springer Science+Business Media, LLC 2009
Abstract Among the great number of sol–gel prepared
nanomaterials, TiO2 has attracted significant interest due to
its high photocatalytic activity, excellent functionality,
thermal stability and non-toxicity. The photocatalytic
degradation of pollutants using un-doped and doped TiO2
nanopowders or thin films is very attractive for applications
in environmental protection, as a possible solution for
water purification. The present work describes a compar-
ative structural and chemical study of un-doped TiO2 and
the corresponding S- and Ag-doped materials. The photo-
catalytic activity was established by testing the degradation
of organic chloride compounds from aqueous solutions.
Sol–gel Ag-doped TiO2 coatings, prepared by co-gelation
and sol–gel Ag-doped TiO2 coatings obtained from
nanopowders were also compared. Their structural evolu-
tion and crystallization behaviour (lattice parameters,
crystallite sizes, internal strains) with thermal treatment
were followed by thermal analysis, X-ray diffraction,
transmission electron microscopy, atomic force micros-
copy and specific surface areas measurements. X-ray
photoelectron spectroscopy analyses were performed to
characterize the surface composition and S or Ag specia-
tion, which was used to interpret the catalytic data.
Keywords Sol–gel � Nanopowders � Coatings �S-doped TiO2 � Ag-doped TiO2 � Water purification
1 Introduction
Titania represents one of the most studied inorganic com-
pounds in chemistry. Its preparation, physical and chemical
properties together with its applications for all crystallo-
graphic forms (anatase, rutile and brookite) have been the
object of numerous studies. The literature supplies thou-
sands of articles dedicated to TiO2. Let us mention at least
some reviews [1–8] and books [9–13]. The explanation of
such a huge interest is simple. It is well known that among
the various photocatalysts, titania occupies a very impor-
tant place, due to its high photocatalytic activity, excellent
functionality, high chemical stability, thermal stability and
non-toxicity. These properties make it useful in different
fields, ranging from optics to gas sensors via solar energy.
All the mentioned properties are improved in the case of
nanostructured TiO2, which can be easily obtained by the
sol–gel method. An advantage of nanometer sized materi-
als stems from the changes in electrochemical potentials of
the photogenerated charge carriers that accompany
decreasing particle size. The sol–gel method facilitates the
M. Raileanu � M. Crisan (&) � N. Dragan � D. Crisan �A. Braileanu � M. Anastasescu
Romanian Academy, Institute of Physical Chemistry Ilie
Murgulescu, 202 Splaiul Independentei, 060021 Bucharest,
Romania
e-mail: [email protected]; [email protected]
A. Galtayries
Laboratoire de Physico-Chimie des Surfaces (UMR CNRS
7045), Ecole Nationale Superieure de Chimie de Paris,
11 rue P. et M. Curie, 75005 Paris, France
A. Ianculescu
Department of Oxide Materials Science and Engineering,
‘‘Politehnica’’, University of Bucharest, 1-7 Gh. Polizu,
P.O. Box 12-134, 011061 Bucharest, Romania
V. S. Teodorescu
National Institute for Physics of Materials, Atomistilor 105 bis,
P.O. Box MG 07, Bucharest, Magurele, Romania
I. Nitoi
INCD-ECOIND, 90-92 Sos. Panduri, 050663 Bucharest,
Romania
123
J Sol-Gel Sci Technol (2009) 51:315–329
DOI 10.1007/s10971-009-2017-z
preparation of the photocatalyst in both forms (powders
and coatings). Moreover, it is very convenient for pro-
ducing nanocomposites materials in which different phases
could be highly dispersed in an inorganic matrix, that is for
the doping of titania with different metal or non-metal ions.
Recent studies [6, 7, 14] point out the doping procedure as
a possibility to enhance the efficiency of the photocatalytic
process. The dopant ions can behave as both hole and
electron traps or they can mediate interfacial charge
transfer [14]. Also known as ‘‘impurity doping’’, the pro-
cedure ensures the extension of the spectral response of a
wide band gap semiconductor to visible light.
The sol–gel method was extensively used in order to
improve the photocatalytic activity of TiO2 by doping with:
(a) different metals: Pt [15–17], Pd [18–21], Cu and
Co [22–25], Cr [26, 27], Ni [28], Fe [29–36], Mn [37], V
[38, 39], Nb [40–42], W and Al [43, 44], Au [45–48], Ag
[7, 19, 49–53]; (b) lanthanides: Nd [54], La and Eu [55], Ce
[56–58]; (c) non-metals: C [59–68], N [68–74], S [64, 66,
68, 72, 74–86], N–S co-doping [87]; (d) metal non-metal
co-doping: Zr–S [88].
The photocatalytic activity of TiO2 strongly depends on
its physicochemical properties, such as crystal structure,
lattice defects, surface area, particle size, content of sur-
face hydroxyls etc. The photocatalytic activity of TiO2 is
known to be a function of its surface properties and
increases with the specific surface area (SSA) of the
samples used [72]. Conventional TiO2 powder catalysts
present the disadvantages of agglomeration and of difficult
separation of the final particle-fluid for the catalyst recy-
cling. Thus, the application of TiO2 thin films has attracted
much attention in recent years. In addition to this, an
increasing interest toward sol–gel synthesis of nanostruc-
tured oxide thin films is due to the method advantages:
simple and cheap technological equipment, low processing
temperature for film densification and wide scope for
varying film properties by changing the composition of the
precursor solution.
Concerning the S-dopant, the literature data report that it
can act both as anion, replacing the lattice oxygen in TiO2
[78] and cation, replacing Ti ions [77, 79, 80]. Very few
data could be found regarding the S-doping of TiO2 that
refer to the preparation of thin coatings [86].
Taking into account that prevention and control of the
effects due to different environmental pollutants represent
one of the most acute current problems of humanity and
that pollution of the water can be considered as one of the
most important aspects, research in the domain of materials
with catalytic properties for water pollutant degradation
represents a very important topic. Knowing that TiO2 is an
excellent photocatalyst that allows the degradation and
finally the mineralization of stable organic pollutants
(detergents, dyes, pesticides) in water, the present work has
extended the field of investigation from S to Ag-doped
TiO2, aiming at accomplishing a comparison of their effi-
ciency for the removal of chloride organic compounds
from water. The selection of silver as metal ion dopant for
TiO2 was based on two well known properties: it enhances
the photoactivity in the visible domain [19] and it produces
the highest Schotty barrier among the metals, which
facilitates the electron capture [53].
Nanostructured coatings are preferred for environmental
protection due to their high surface/volume ratio, taking
into account that photocatalytic process is based on the
chemical reactions at the surface of the material. In addi-
tion, sol–gel processing allows control of the microstruc-
ture of the film. In order to increase the thickness of the
coatings many depositions are necessary, but these induce
tensile stress by shrinkage of the layers in drying and
thermal processing. This problem can be resolved either by
increasing the viscosity of the starting solution, or by
embedding a secondary phase (e.g. precalcinated powders,
fibers, etc) as a filler, to reinforce the resulting composite
structure [89]. Other papers also pointed out the processing
of sol–gel derived titanium dioxide composites coatings
[21, 90–92].
That is why one of the purposes of the present work was
to obtain not only sol–gel S-doped TiO2 powders but also
sol–gel S-doped TiO2 coatings with photocatalytic prop-
erties which make them useful in the environmental pro-
tection. Another objective was to realize a comparative
structural study between sol–gel Ag-doped TiO2 coatings
directly prepared by co-gelation and sol–gel Ag-doped
TiO2 coatings obtained from nanopowders.
2 Experimental
In order to undertake comparative studies, sol–gel doped
TiO2 materials have been prepared in both forms (powders
and coatings) and two kinds of dopants (S and Ag) have
been used. To a better assess of the effect of dopant on the
final properties of the products obtained, all doped mate-
rials have also been compared with the corresponding
materials in the absence of dopant.
2.1 Un-doped and S-doped TiO2 powders
Pure TiO2 sol–gel nanopowders have been prepared by
controlled hydrolysis-condensation of three different titanium
alkoxides: tetraethylorthotitanate (Merck), Ti(OC2H5)4 for
sample 1, tetraisopropylorthotitanate (Merck), Ti(O–iC3H7)4
for sample 2 and tetrabutylorthothitanate (Fluka),
Ti(O–C4H9)4 for sample 3. The corresponding parent
alcohols (absolute ethanol, provided by Riedel de Haen,
for sample 1; 2-propanol, provided by Fluka, for sample 2;
316 J Sol-Gel Sci Technol (2009) 51:315–329
123
and normal butanol, provided by J. T. Baker, for sample 3)
have been used as solvents. The hydrolysis of the Ti
alkoxides proceeded with a water excess and in non-
catalyzed conditions. In order to investigate the role of the
alkoxide type on the final properties of the TiO2 powders
obtained all other parameters reaction have been kept
unchanged. Thus, the molar ratios were: water/alkoxide = 5
and alcohol/alkoxide = 85, the pH value was 4 and the
reaction temperature was 298 K. The reaction times were
between 1 and 6 h, depending on the Ti alkoxide used as
precursor.
The corresponding sol–gel S-doped TiO2 powders have
been obtained under similar conditions as samples 1–3.
They were doped with 5% wt. S related to the TiO2 content
and were identified as 4, 5 and 6. The sulfur source for the
doped sol–gel powders was thiourea (H2NCSNH2) from
Alfa Aesar, which was introduced in the reaction mixtures
dissolved in the corresponding alcohol. The resulting sols
have been concentrated and dried at 353 K.
The un-doped and S-doped TiO2 powders obtained have
been subjected to thermal analysis, in order to establish the
thermal schedule for the subsequent investigations. The
thermal analysis was performed up to 1,000 �C, using a
Mettler Toledo Star System TGA/SDTA851/LF1600 �C
apparatus with a heating rate of 10 K min-1, in flowing air
atmosphere of 50 mL min-1. Thus, thermal treatments at
573, 673 and 773 K have been applied with heating rates of
1 K min-1 and a 1 h plateau in all cases.
X-ray diffraction (XRD) analysis was performed with a
Shimadzu XRD 6000 diffractometer, using Ni-filtered
CuKa radiation (k = 1.5418 A) with a scan step of 0.02�and a counting time of 1 s/step, for 2h diffraction angles
ranging between 20 and 80�. The calculated values of
microstructural factors have been obtained from comput-
erized analysis of XRD spectra with an XRAY5.0 program
[93, 94].
Morphological characterizations were conducted using a
transmission electron microscope (TEM) from Jeol
(200CX equipment), and X-ray photoemission spectros-
copy (XPS) analyses were performed using an ESCALAB
250 spectrometer from Thermo Electron Corporation
(TEC), with a monochromatic, focussed A1 Ka source. The
data processing was performed with the commercial
AVANTAGE program, provided by TEC. The measure-
ments of the BET SSA were performed using a Quanta-
chrome Analyzer—Model Nova 1000e with N2 adsorption
at 77 K. Before analysis the samples were heated at 573 K,
under vacuum for 4 h, for sample outgasing.
In order to establish the role of S in the photocatalytic
activity, the prepared powders using titanium ethoxide as
TiO2 source have been selected in order to be tested in the
degradation of different organic chloride compounds from
aqueous solutions.
To investigate the photocatalytic properties of the
sol–gel TiO2-based prepared powders, un-doped samples
of chlorobenzene synthetic solution (0.096 9 10-3 M)
were subjected to photolysis. A laboratory installation was
used consisting of an UV reactor system comprising: (a) an
UV immersion Heraeus lamp TQ 150 Z3 (medium pressure
mercury lamp) with spectral distribution of 200–360 and
460–510 nm, input rating of 150 W and quartz cooling
jacket (U = 39 mm); (b) the reaction vessel (1,500 cm3)
with magnetic stirrer and power pack; and (c) the photo-
catalyst (50 mg L-1). The reaction conditions were:
pH = 7; O2 = 7 mg L-1; irradiation time: 3,600 s; irradi-
ation pathlength l = 2 cm; k = 200–280 and 400–450 nm.
The chlorobenzene concentration was determined by the
Gas Chromatography (GC) technique.
2.2 Un-doped, S-doped and Ag-doped TiO2 coatings
Pure TiO2 sol–gel coatings (C–TiO2) have been prepared
by controlled hydrolysis-condensation of tetraethylorthoti-
tanate (Merck), Ti(OC2H5)4. Absolute ethanol, provided by
Riedel de Haen, has been used as solvent. The hydrolysis
of the Ti alkoxide was initiated by water addition in sub-
stoichiometric quantity. Unlike the powders, the prepara-
tion of coatings requires nitric acid as catalyst. The molar
ratios used in order to obtain coatings were: water/alkox-
ide = 1.5, alcohol/alkoxide = 55 and catalyst/alkox-
ide = 0.258, at pH 3.5 and a reaction temperature of
323 K. The reaction time was 1 h.
The corresponding sol–gel S-doped TiO2 coatings
(C–S–TiO2) have been obtained under similar conditions to
C–TiO2 sample. They were doped with 2% wt. S related to
the TiO2 content. The sulfur source for the S-doped sol–gel
coatings was thiourea (H2NCSNH2) from Alfa Aesar. It
was introduced in the reaction mixtures dissolved in the
corresponding alcohol, as in the case of doped powders
(see Sect. 2.1). In a recent paper [86] it has been estab-
lished that this concentration of sulfur dopant was optimum
for achieving the best photocatalytic activity of the coat-
ings in the water purification process.
Concerning the sol–gel Ag-doped TiO2 coatings, two
kinds of films have been prepared: in situ by cogelation of
precursors (C–Ag–TiO2) and from nanopowders (CN–Ag–
TiO2). For C–Ag–TiO2, the concentration of the dopant
was 2 wt.% Ag related to the TiO2 content (same for C–S–
TiO2). The silver source was AgNO3. CN–Ag–TiO2 films
were obtained from 2 wt.% Ag-doped TiO2 nanopowder
which was prepared by ultrasonically assisted hydrother-
mal synthesis and embedded in sol–gel TiO2 matrix. This
matrix was directly obtained from tetraethylorthotitanate
(Merck), Ti(OC2H5)4 as TiO2 precursor, using absolute
ethanol provided by Riedel de Haen, as solvent, water for
hydrolysis and nitric acid as catalyst. The scheme of
J Sol-Gel Sci Technol (2009) 51:315–329 317
123
preparation for the Ag-doped TiO2 coatings obtained from
nanopowders is the same as that presented in our previous
paper, for similar Pd-doped TiO2 coatings [21].
In all cases (C–TiO2, C–S–TiO2, C–Ag–TiO2 and
CN–Ag–TiO2) single and double-layers coatings have been
deposited on glass substrates using the dip-coating proce-
dure, with a withdrawal rate of 5 cm/min.
Regarding the characterization of the prepared coatings,
thermal analysis, XRD and XPS were performed under the
same conditions as described in Sect. 2.1. Concerning the
photocatalytic tests the same laboratory UV-reactor
Heraeus system was used. In the reaction vessel
(1,500 cm3) containing the CB solution, a rod was intro-
duced along which were fixed at 2 cm distances, ten glass
plates (7 9 2.5 cm) with the catalyst film. The irradiation
surface area was 175 cm2. In addition, atomic force
microscopy (AFM) characterization with an EasyScan 2
model from Nanosurf� AG Switzerland as well as Spec-
troellipsometric measurements (SE) have been performed.
SE was accomplished with a null-type Ellipsometer in the
wavelength range of 350–700 nm, at an angle of incidence
of 70�. The experimental ellipsometric spectra were fitted
with multilayer and multicomponent Bruggemann’s effec-
tive medium approximation (BEMA) model [95].
3 Results and discussion
3.1 Un-doped and S-doped TiO2 powders
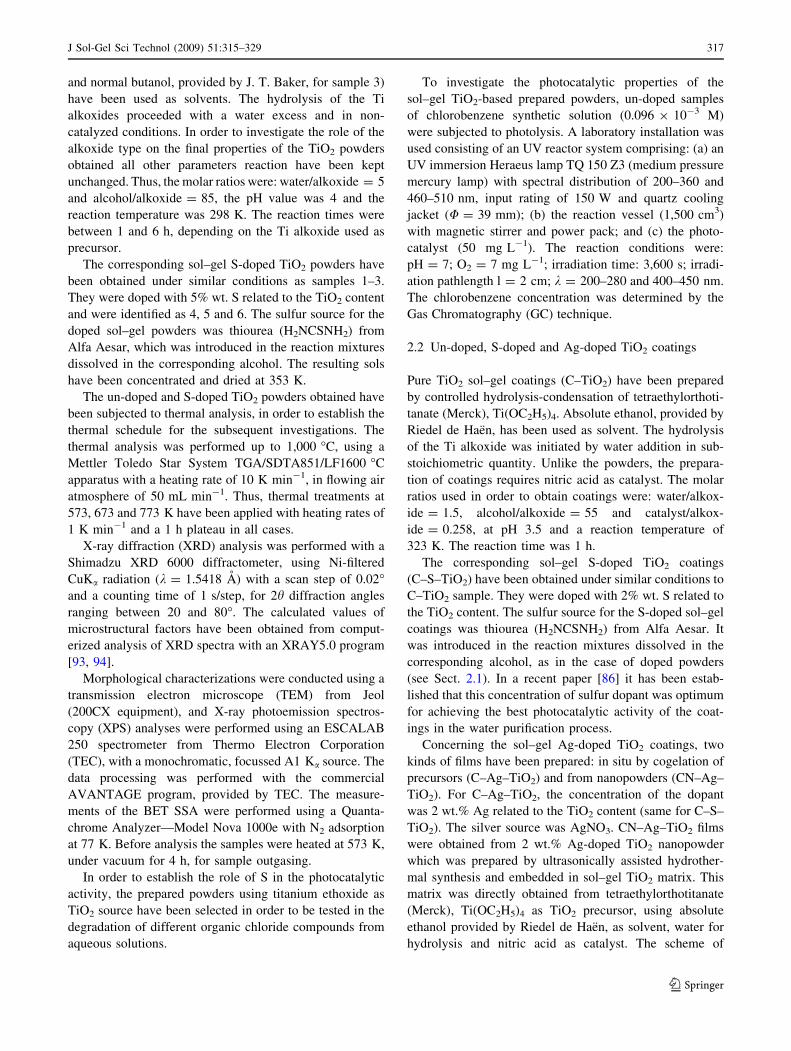
Because the XRD patterns for un-doped and S-doped TiO2
prepared powders obtained from different Ti alkoxides
(samples 1–6), thermally treated at 673 K for 1 h are very
similar, only one representative XRD pattern is presented
in Fig. 1.
In all cases, anatase as single crystalline phase has been
detected.
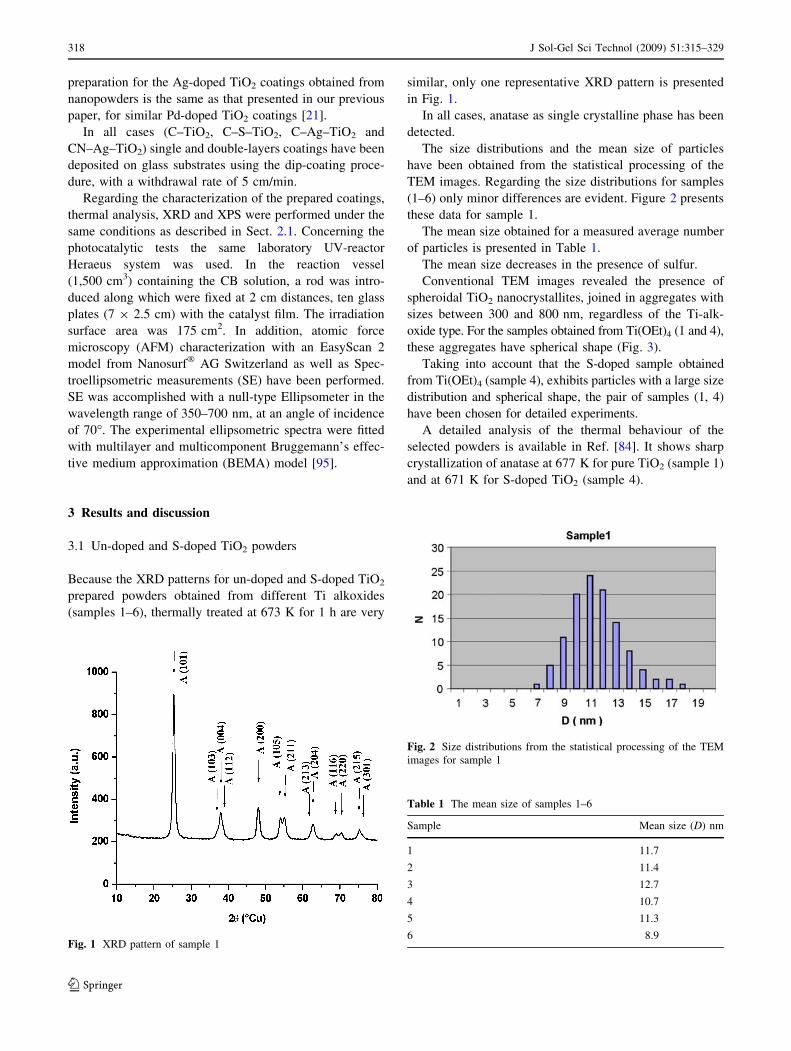
The size distributions and the mean size of particles
have been obtained from the statistical processing of the
TEM images. Regarding the size distributions for samples
(1–6) only minor differences are evident. Figure 2 presents
these data for sample 1.
The mean size obtained for a measured average number
of particles is presented in Table 1.
The mean size decreases in the presence of sulfur.
Conventional TEM images revealed the presence of
spheroidal TiO2 nanocrystallites, joined in aggregates with
sizes between 300 and 800 nm, regardless of the Ti-alk-
oxide type. For the samples obtained from Ti(OEt)4 (1 and 4),
these aggregates have spherical shape (Fig. 3).
Taking into account that the S-doped sample obtained
from Ti(OEt)4 (sample 4), exhibits particles with a large size
distribution and spherical shape, the pair of samples (1, 4)
have been chosen for detailed experiments.
A detailed analysis of the thermal behaviour of the
selected powders is available in Ref. [84]. It shows sharp
crystallization of anatase at 677 K for pure TiO2 (sample 1)
and at 671 K for S-doped TiO2 (sample 4).
Fig. 1 XRD pattern of sample 1
Fig. 2 Size distributions from the statistical processing of the TEM
images for sample 1
Table 1 The mean size of samples 1–6
Sample Mean size (D) nm
1 11.7
2 11.4
3 12.7
4 10.7
5 11.3
6 8.9
318 J Sol-Gel Sci Technol (2009) 51:315–329
123

The structural evolution (XRD) of samples 1 and 4, as a
function of temperature, is presented in Table 2. The XRD
analysis supplied valuable information regarding the
influence of S on TiO2 crystallization by means of lattice
constants and microstructural factors. The phase compo-
sition points out the presence of anatase as the single
crystalline phase for both samples thermally treated in the
range of temperatures between 573 and 773 K.
From these data one can establish that:
a) In the case of pure TiO2 (sample 1) as expected with
increasing temperature, the lattice becomes more
structured, so the lattice strains\S[quickly decrease.
At the same time and in agreement with\D[and\S[evolution, the geometry of the elementary cell (EC)
tends to the most stable state, resulting in a slight
contraction of the EC with temperature;
b) For the S-doped TiO2 (sample 4), the effect of sulfur
counters that of increasing temperature; indeed the rate
of crystallite growth is larger for sample 1 compared to
sample 4. Concerning u.c.v. (unit cell volume), the
decrease with increasing temperature is less significant
for sample 1 than for sample 4.
XPS measurements (Fig. 4) of the S 2p core level
indicate the presence of SO42- species on the sample
surface (S 2p core level binding energy of about 169 eV),
and the absence of sulfide species S2- (S 2p core level
binding energy of about 162 eV), at 573 and 773 K. This
indicates that the sulfur is present as S6? ion. These data
may be correlated with u.c.v. variations which suggest that
the substitution of some Ti4? ions (ionic radius = 0.68 A)
by S6? ions (ionic radius = 0.29 A) is the most probably
Fig. 3 TEM images of pure TiO2, sample 1 (a) and S-doped TiO2,
sample 4 (b)
250
350
450
550
650
750
160162164166168170172174
Binding energy (eV)
Inte
nsi
ty (
arb
. un
its)
sample 4 annealed at573 Ksample 4 annealed at773 K
169.0 eV
S 2p
Fig. 4 XPS S 2p core level spectra of sample 4, thermally treated at
573 and 773 K
Table 2 Calculated values of microstructural factors obtained from computerized analysis of XRD spectra
Sample/T (K) Identified phases Lattice constants Microstructural factors
a [A] c [A] u.c.v. [A3] \D[ [A] 10?3 9 \S[
1–573 Anatase 3.7752 (45) 9.4973 (164) 135.36 (56) 74 (7) 10.0 (8)
1–673 Anatase 3.7815 (13) 9.4709 (47) 135.43 (16) 178 (34) 1.4 (6)
1–773 Anatase 3.7750 (19) 9.4828 (68) 135.14 (23) 346 (51) 0.3 (3)
4–573 Anatase 3.7812 (18) 9.4778 (64) 135.51 (22) 172 (25) 1.6 (5)
4–673 Anatase 3.7783 (16) 9.4735 (58) 135.24 (20) 247 (37) 1.2 (4)
4–773 Anatase 3.7676 (55) 9.4561 (193) 134.23 (66) 302 (60) 1.5 (4)
a, c Lattice parameters, u.c.v. unit cell volume, D crystallite size, S internal strain
J Sol-Gel Sci Technol (2009) 51:315–329 319
123
occurring. However, the accommodation of S6? ions in the
anatase lattice results in an increase in the lattice strains.
The difference between the ionic radii and change of Ti4?
and S6?, leads to a more distorted crystalline lattice. This
supplementary positive charge must be compensated to
maintain the electro-neutrality of the lattice, presumably by
O2- ions from the lattice or from the atmosphere.
Both XPS and XRD data led to the conclusion that the
initial distribution of the local electrostatic forces is dis-
torted, which leads to more structural defects. This fact
certainly suggests the possibility of highly chemically
reactive sites. This could explain the higher catalytic per-
formances of S-doped TiO2 materials (see later discussion).
The XPS S/Ti atomic ratio is 0.15 at 573 K and 0.08 at
773 K, characteristic of S diffusion in the material after
annealing at higher temperature.
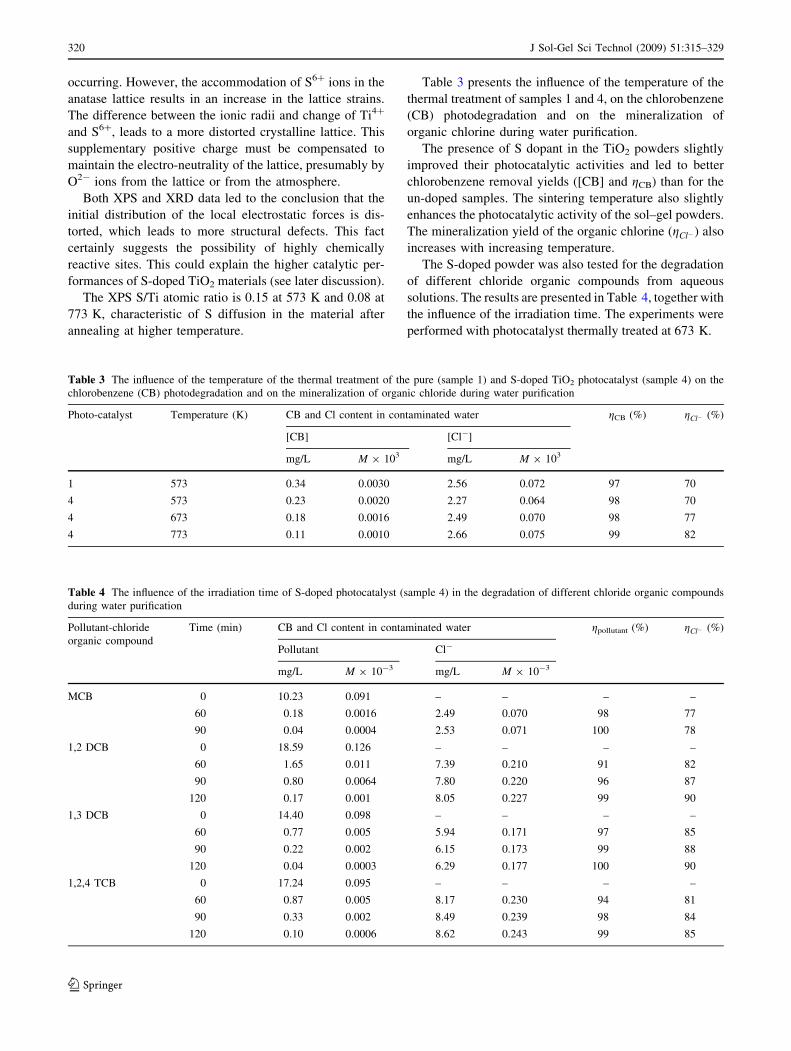
Table 3 presents the influence of the temperature of the
thermal treatment of samples 1 and 4, on the chlorobenzene
(CB) photodegradation and on the mineralization of
organic chlorine during water purification.
The presence of S dopant in the TiO2 powders slightly
improved their photocatalytic activities and led to better
chlorobenzene removal yields ([CB] and gCB) than for the
un-doped samples. The sintering temperature also slightly
enhances the photocatalytic activity of the sol–gel powders.
The mineralization yield of the organic chlorine (gCl�) also
increases with increasing temperature.
The S-doped powder was also tested for the degradation
of different chloride organic compounds from aqueous
solutions. The results are presented in Table 4, together with
the influence of the irradiation time. The experiments were
performed with photocatalyst thermally treated at 673 K.
Table 3 The influence of the temperature of the thermal treatment of the pure (sample 1) and S-doped TiO2 photocatalyst (sample 4) on the
chlorobenzene (CB) photodegradation and on the mineralization of organic chloride during water purification
Photo-catalyst Temperature (K) CB and Cl content in contaminated water gCB (%) gCl� (%)
[CB] [Cl-]
mg/L M 9 103 mg/L M 9 103
1 573 0.34 0.0030 2.56 0.072 97 70
4 573 0.23 0.0020 2.27 0.064 98 70
4 673 0.18 0.0016 2.49 0.070 98 77
4 773 0.11 0.0010 2.66 0.075 99 82
Table 4 The influence of the irradiation time of S-doped photocatalyst (sample 4) in the degradation of different chloride organic compounds
during water purification
Pollutant-chloride
organic compound
Time (min) CB and Cl content in contaminated water gpollutant (%) gCl� (%)
Pollutant Cl-
mg/L M 9 10-3 mg/L M 9 10-3
MCB 0 10.23 0.091 – – – –
60 0.18 0.0016 2.49 0.070 98 77
90 0.04 0.0004 2.53 0.071 100 78
1,2 DCB 0 18.59 0.126 – – – –
60 1.65 0.011 7.39 0.210 91 82
90 0.80 0.0064 7.80 0.220 96 87
120 0.17 0.001 8.05 0.227 99 90
1,3 DCB 0 14.40 0.098 – – – –
60 0.77 0.005 5.94 0.171 97 85
90 0.22 0.002 6.15 0.173 99 88
120 0.04 0.0003 6.29 0.177 100 90
1,2,4 TCB 0 17.24 0.095 – – – –
60 0.87 0.005 8.17 0.230 94 81
90 0.33 0.002 8.49 0.239 98 84
120 0.10 0.0006 8.62 0.243 99 85
320 J Sol-Gel Sci Technol (2009) 51:315–329
123
The performance of the catalyst for the different types of
chloride organic pollutant is noted. Regardless of the
composition of the organic chloride pollutant, for irradia-
tion times exceeding 60 min, removal yields (gpollutant)
between 96 and 100% and mineralization yields of the
organic chlorine (gCl� ) between 78 and 90% have been
obtained.
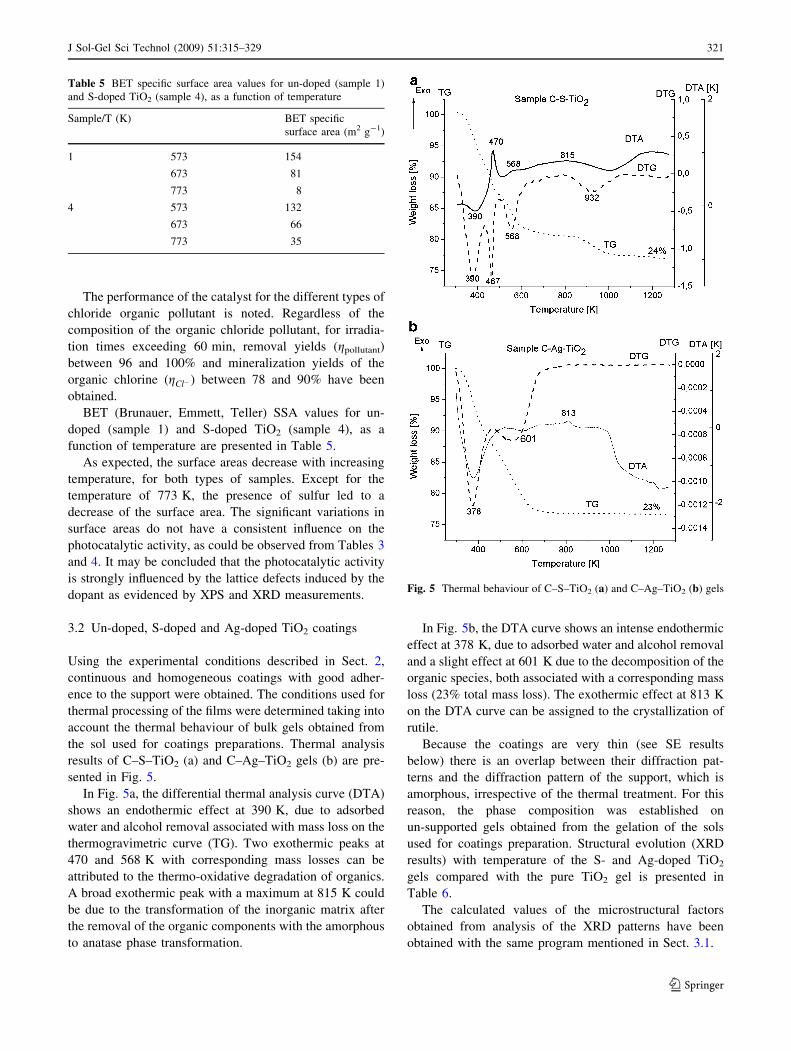
BET (Brunauer, Emmett, Teller) SSA values for un-
doped (sample 1) and S-doped TiO2 (sample 4), as a
function of temperature are presented in Table 5.
As expected, the surface areas decrease with increasing
temperature, for both types of samples. Except for the
temperature of 773 K, the presence of sulfur led to a
decrease of the surface area. The significant variations in
surface areas do not have a consistent influence on the
photocatalytic activity, as could be observed from Tables 3
and 4. It may be concluded that the photocatalytic activity
is strongly influenced by the lattice defects induced by the
dopant as evidenced by XPS and XRD measurements.
3.2 Un-doped, S-doped and Ag-doped TiO2 coatings
Using the experimental conditions described in Sect. 2,
continuous and homogeneous coatings with good adher-
ence to the support were obtained. The conditions used for
thermal processing of the films were determined taking into
account the thermal behaviour of bulk gels obtained from
the sol used for coatings preparations. Thermal analysis
results of C–S–TiO2 (a) and C–Ag–TiO2 gels (b) are pre-
sented in Fig. 5.
In Fig. 5a, the differential thermal analysis curve (DTA)
shows an endothermic effect at 390 K, due to adsorbed
water and alcohol removal associated with mass loss on the
thermogravimetric curve (TG). Two exothermic peaks at
470 and 568 K with corresponding mass losses can be
attributed to the thermo-oxidative degradation of organics.
A broad exothermic peak with a maximum at 815 K could
be due to the transformation of the inorganic matrix after
the removal of the organic components with the amorphous
to anatase phase transformation.
In Fig. 5b, the DTA curve shows an intense endothermic
effect at 378 K, due to adsorbed water and alcohol removal
and a slight effect at 601 K due to the decomposition of the
organic species, both associated with a corresponding mass
loss (23% total mass loss). The exothermic effect at 813 K
on the DTA curve can be assigned to the crystallization of
rutile.
Because the coatings are very thin (see SE results
below) there is an overlap between their diffraction pat-
terns and the diffraction pattern of the support, which is
amorphous, irrespective of the thermal treatment. For this
reason, the phase composition was established on
un-supported gels obtained from the gelation of the sols
used for coatings preparation. Structural evolution (XRD
results) with temperature of the S- and Ag-doped TiO2
gels compared with the pure TiO2 gel is presented in
Table 6.
The calculated values of the microstructural factors
obtained from analysis of the XRD patterns have been
obtained with the same program mentioned in Sect. 3.1.
Table 5 BET specific surface area values for un-doped (sample 1)
and S-doped TiO2 (sample 4), as a function of temperature
Sample/T (K) BET specific
surface area (m2 g-1)
1 573 154
673 81
773 8
4 573 132
673 66
773 35
Fig. 5 Thermal behaviour of C–S–TiO2 (a) and C–Ag–TiO2 (b) gels
J Sol-Gel Sci Technol (2009) 51:315–329 321
123

The Ag-doping favors TiO2 crystallization in anatase
simultaneously with the transformation of anatase to rutile,
even at 573 K. This fact explains the decrease of the cat-
alytic activity in comparison with the S-doped sample (see
Table 9). In the Ag-doped TiO2 samples, annealed at 673
and 773 K, the anatase phase exhibits a larger mean
crystallite size and smaller internal strains than in the case
of similar S-doped samples.
XPS spectra of C–S–TiO2 and C–Ag–TiO2 coatings,
annealed at 573, 673 and 773 K for 1 h, are presented in
Fig. 6.
The XPS normalized spectra of the Ti 2p core level
(Fig. 6a) for the C–S–TiO2 sample treated at 573 K, show
the presence of a peak at a binding energy of 457.9 eV (Ti
2p3/2), which may be attributed to Ti2O3 (Ti3?). The second
peak at about 463 eV corresponds to the Ti 2p1/2 of the Ti
2p doublet (spin-orbit coupling). From the examination of
the S 2p core level (Fig. 6b), the presence of only one
contribution, at a binding energy of about 167 eV, attrib-
uted to SO32- like species can be noticed, as well as the
absence of sulfide like species. For this sample, the XPS
S/Ti atomic ratio is 0.06 (573 K), and 0.08 (773 K), compa-
rable to the case of the S-doped powders annealed at 773 K.
Regarding the C–Ag–TiO2 coatings, treated at 573 K,
Fig. 6c presents the spectrum of the Ti 2p core level, in
which a peak at 458.3 eV (Ti 2p3/2) can be observed that
may also be attributed to Ti2O3 (Ti3?). The second peak at
about 464 eV corresponds to Ti 2p1/2 of the Ti 2p doublet
(spin-orbit coupling). No changes of the intensity as a
function of temperature have been observed. The normal-
ized spectra of the Ag 3d core level are presented in
Fig. 6d. No significant change of the binding energy of Ag
Table 6 Calculated values of microstructural factors obtained from computerized analysis of XRD spectra
Sample Temperature [K] Identified phases Lattice constants Microstructural factors
a [A] c [A] u.c.v. [A3] \D[ [A] 10?3 9 \S[
C–S–TiO2 573 A 3.7849 (34) 9.4671 (133) 135.62 (44) 100 (36) 3.0 (3.1)
C–Ag–TiO2 A [97% 3.7838 (52) 9.5215 (184) 136.32 (64) 93 (11) 4.0 (7)
R \3% – – – –
C–S–TiO2 673 A 3.7775 (26) 9.4850 (91) 135.35 (31) 107 (20) 3.0 (1.2)
C–Ag–TiO2 A 89% 3.7788 (32) 9.4936 (112) 135.56 (39) 111 (24) 2.7 (1.3)
R 11% 4.6020 (106) 2.9528 (69) 62.54 (43) 389 (128) 8.2 (6.8)
C–S–TiO2 773 A 3.7856 (62) 9.4771 (242) 135.81 (79) 161 (78) 2.7 (2.6)
C–Ag–TiO2 A 54% 3,7859 (22) 9.4875 (78) 135.99 (27) 267 (112) 0.6 (5)
R 46% 4.5978 (47) 2.9602 (38) 62.58 (21) 619 (223) 1.4 (6)
A anatase, R rutile, a, c lattice parameters, u.c.v. unit cell volume, D crystallite size, S internal strain
0
4000
8000
12000
16000
20000
24000
452457462467
Binding energy (eV)
Inte
nsi
ty (
arb
. un
its) C-S-TiO2 annealed at 773 K
C-S-TiO2 annealed at 573 K457.9 eV
Ti 2p3/2
Ti 2p1/2
1050
1150
1250
1350
1450
1550
160162164166168170172174
Binding energy (eV)In
ten
sity
(ar
b. u
nit
s) C-S-TiO2 annealed at 573 K
C-S-TiO2 annealed at 773 K
167.7 eV
S 2p
0
2000
4000
6000
8000
10000
12000
452457462467
Binding energy (eV)
Inte
nsi
ty (
arb
. un
its)
C-Ag-TiO2 annealed at 573 K
Ti 2p1/2
458.3 eV
Ti 2p3/2
400
500
600
700
800
900
1000
362364366368370372374376378
Binding energy (eV)
Inte
nsi
ty (
arb
. un
its)
C-Ag-TiO2 annealed at 573 KC-Ag-TiO2 annealed at 673 KC-Ag-TiO2 annealed at 773K
367.7 eV
Ag 3d5/2
Ag 3d3/2
a
dc
bFig. 6 XPS Ti 2p, S 2p and Ag
3d core level spectra of
C–S–TiO2 (a, b) and
C–Ag–TiO2 (c, d) coatings,
thermally treated at 573, 673
and 773 K for 1 h
322 J Sol-Gel Sci Technol (2009) 51:315–329
123

3d5/2 (367.7 eV), probably corresponding to Ag?, has been
observed. The second peak at about 374 eV corresponds to
the Ag 3d3/2 of the Ag 3d doublet (spin-orbit coupling). A
drastic loss of the intensity increasing temperature was
observed: the XPS Ag/Ti atomic ratio varies from 0.02
(573 K) to 0.00 (773 K), via 0.01 (673 K). The surface
quantities of the Ag dopant are significantly lower than the
S surface concentrations.
The thickness of the C–S–TiO2 and C–Ag–TiO2 coatings
and volume fraction of the components versus temperature,
determined from spectroellipsometry measurements are
presented in Tables 7 and 8. The dispersion of the refractive
index (n) versus wavelength for mono- (a) and bi-layers (b)
for C–S–TiO2 and C–Ag–TiO2 coatings with thermal
treatment is presented in Fig. 7.
The fitting parameters were the thickness of the layers
and volume fraction of the components (amorphous TiO2,
anatase-TiO2, sol-containing thiourea, air-filled voids). The
dielectric constants of these compounds were taken from
different optical databases or handbooks [96–98] while for
sol-containing thiourea a Pulfrich-type refractometer has
been used. The optical constants of the films were obtained
from the best fit. The fitting error was calculated according
to equation:
Error ¼XN
i¼1
Reci � Ree
i
� �2þ Imci � Ime
i
� �2h i
=N
where Re, the real part of ellipsometric function (tanW*
cosD); Reci , the calculated value; Ree
i , the measured value;
Im, the imaginary part of ellipsometric function (tanW*
sinD); Imci , the calculated value; Ime
i , the measured value;
and N, the number of experimental points.
From SE measurements one can observe the increase of
the refractive index and consequently the decrease of the
film thickness with temperature as a result of the film
densification. The S-doped TiO2 coatings exhibit thickness
Table 7 The thickness (d) of
the C–S–TiO2 coatings, initial
and thermally treated, and the
volume fractions of the
components
Sample No. of layers d (A) TiO2 (%) Thiourea (%) Voids (%) Error 9 10-4
C1–S–TiO2-i 1 702 51.58 49.38 0.04 1.4
C1–S–TiO2-573 K 433 77.47 22.51 0.02 2.1
C1–S–TiO2-673 K 422 76.56 23.42 0.02 1.4
C1–S–TiO2-773 K 361 83.47 16.52 0.01 1.5
C2–S–TiO2-i 2 884 77.65 22.33 0.02 2.1
C2–S–TiO2-573 K 761 82.89 17.10 0.01 2.1
C2–S–TiO2-673 K 670 85.80 14.18 0.01 2.5
C2–S–TiO2-773 K 644 85.12 14.87 0.01 14.1
Table 8 The thickness (d) of the C–Ag–TiO2 coatings, initial and
thermally treated, and the volume fractions of the components
Sample No. of
layers
d(A)
TiO2
(%)
Voids
(%)
Error 9
10-4
C1–Ag–TiO2-i 1 500 65.75 34.25 2.2
C1–Ag–TiO2-573 K 370 76.30 23.70 2.0
C1–Ag–TiO2-673 K 430 72.46 27.54 2.0
C1–Ag–TiO2-773 K 350 79.03 20.97 1.7
C2–Ag–TiO2-i 2 880 77.03 22.97 6.0
C2–Ag–TiO2-573 K 620 85.58 14.42 2.5
C2–Ag–TiO2-673 K 600 85.06 14.94 1.9
C2–Ag–TiO2-773 K 520 92.94 7.06 1.0
0.40 0.45 0.50 0.55 0.60 0.65 0.70 0.751.70
1.75
1.80
1.85
1.90
1.95
2.00
2.05
2.10
2.15
2.201-deposition coatings
n
λ (µm)
C1-Ag-TiO2-i
C1-Ag-TiO2-573K
C1-Ag-TiO2-673K
C1-Ag-TiO2-773K
C1-S-TiO2-i
C1-S-TiO2-573K
C1-S-TiO2-673K
C1-S-TiO2-773K
0.40 0.45 0.50 0.55 0.60 0.65 0.70 0.75
1.85
1.90
1.95
2.00
2.05
2.10
2.15
2.20
2.25
C2-Ag-TiO2-i
C2-Ag-TiO2-573K
C2-Ag-TiO2-673K
C2-Ag-TiO2-773K
C2-S-TiO2-i
C2-S-TiO2-573K
C2-S-TiO2-673K
C2-S-TiO2-773K
2-deposition coatings
n
λ (µm)
a
b
Fig. 7 The dispersion of the refractive index (n) versus wavelength
for mono- (a) and bi-layers (b) for C–S–TiO2 and C–Ag–TiO2
coatings, thermally treated
J Sol-Gel Sci Technol (2009) 51:315–329 323
123

and refractive indices greater than the Ag-doped TiO2
samples. More details concerning the ellipsometric data of
the C–S–TiO2 are presented in our previous paper [86].
AFM images of C–S–TiO2 and C–Ag–TiO2 thermally
treated at 573 K, measured over a 9.15 9 9.15 lm area,
are presented in Fig. 8. The roughness values, Root–Mean–
Square (RMS) deviation, for Ag-doped TiO2 coatings were
greater (14 nm) than for S-doped samples (2.8 nm).
The results of the photocatalytic tests are presented in
Table 9.
The photocatalytic activity tests of the coatings obtained
with S- and Ag-doped TiO2 in the photodegradation of
chlorobenzene at neutral pH have shown that a prolonged
irradiation time and two layers lead to better chlorobenzene
removal yields (gCB). The chlorobenzene removal yield is
slightly better for C–S–TiO2 coating. This could be
explained either by the presence of anatase as a single
crystalline phase in the S-doped sample, or by the lesser
amount of Ag (compared to S) in the surface of the
coatings.
3.3 Ag-doped TiO2 sol–gel coatings obtained
from nanopowders
Using the experimental conditions described in Sect. 2.2, con-
tinuous and homogeneous coatings, labeled CN–Ag–TiO2,
with good adherence to the support were obtained. The
thermal processing of the films was determined from the
thermal behaviour of the gels obtained from the gelation of
the sol used for coatings preparations.
Thermal analysis results obtained for the CN–Ag–TiO2
gel are presented in Fig. 9b and are compared with the
corresponding data for the TiO2 matrix (TiO2-M) gel
(Fig. 9a).Fig. 8 AFM images of C–S–TiO2 (a) and C–Ag–TiO2 (b) coatings,
thermally treated at 573 K for 1 h
Table 9 The influence of the
number of layers and of the
irradiation time of C–S–TiO2
and C–Ag–TiO2 photocatalysts,
thermally treated at 573 K for
1 h in the photodegradation of
chlorobenzene during water
purification
Photocatalyst Number
of layers
Irradiation
time (h)
Remanent
chlorobenzene
(mg/L)
Chlorobenzene
removal
yield, gCB (%)
C1–TiO2 1 0.5 2.70 75
C1–Ag–TiO2 2.75 76
C1–S–TiO2 2.37 78
C1–TiO2 1 1.19 89
C1–Ag–TiO2 1.08 91
C1–S–TiO2 0.62 94
C2–TiO2 2 0.5 2.59 76
C2–Ag–TiO2 2.46 78
C2–S–TiO2 1.95 82
C2–TiO2 1 0.76 93
C2–Ag–TiO2 0.58 95
C2–S–TiO2 0.32 97
324 J Sol-Gel Sci Technol (2009) 51:315–329
123

In Fig. 9a, the DTA curve shows an intense endothermic
effect at 378 K, due to adsorbed water and alcohol removal
and a slight feature at 598 K due to the decomposition of
the organic matter, both associated with a mass loss (21%
total mass loss). The presence of two maxima, at 546 and
593 K, on the DTG curve illustrates that the decomposition
takes place in two steps. The exothermic effect at 797 K on
the DTA curve can be assigned to the crystallization of
rutile. Figure 9b, presents the thermal behaviour of the
CN–Ag–TiO2 gel. The DTA curve shows an endothermic
effect at 353 K due to adsorbed water and alcohol removal
and a broad exothermic effect between 423 and 693 K with
three maxima at 439, 581 and 642 K, probably due to the
thermo-oxidative degradation of the organic species. The
DTA effects are associated with mass losses, with the total
mass loss being 11%.
The structural evolution (XRD results) of the CN–Ag–
TiO2 gel with temperature, is presented in Table 10 and
compared to that of pure TiO2 (TiO2-M) and C–Ag–TiO2
gel, obtained by co-gelation.
The Ag-doping favors the transformation of TiO2 from
anatase to rutile, the presence of rutile being detected even
at 673 K in both samples (C–Ag–TiO2, CN–Ag–TiO2),
which does not occur for the S-doped samples. This pro-
cess is more evident for the sample prepared by co-gela-
tion. In this case, the rate of growth of the anatase
crystallites dimension is much greater, and is accompanied
by a decrease in the tensile strains of the anatase phase with
increasing temperature.
The morphological characterization by TEM of the
CN–Ag–TiO2 gel, CN–Ag–TiO2 coating and TiO2-M
coating are presented in Figs. 10, 11 and 12. In order to
illustrate the transition zone between the quasi-amorphousFig. 9 Thermal behaviour of: TiO2 matrix (TiO2–M) (a) and
CN–Ag–TiO2 gel (b)
Table 10 Microstructural
factors calculated from the
computerized profiles analysis
of the XRD spectra
A anatase, R rutile, a, c lattice
parameters, u.c.v. unit cell
volume, D crystallite size, Sinternal strain
Sample Identified
phases
Microstructural factors
a [A] c [A] u.c.v. [A3] \D[ [A] 103 9 \S[
TiO2–M-573 K A 3.7770 (12) 9.4651 (42) 134.90 (14) 127 (25) 3.7 (1.1)
TiO2–M-673 K A 3.7835 (19) 9.4883 (67) 135.83 (23) 161 (26) 1.3 (7)
TiO2–M-773 K A 70% 3.7756 (16) 9.4740 (57) 135.05 (19) 443 (92) 0.5 (4)
R 30% 4.5886 (38) 2.9561 (30) 62.24 (17) 685 (193) 1.1 (4)
CN–Ag–TiO2-573 K A 3.7836 (17) 9.5069 (61) 136.10 (21) 178 (31) 3.4 (1.0)
CN–Ag–TiO2-673 K A 3.7717 (30) 9.4896 (106) 135.00 (36) 165 (27) 1.9 (6)
R \3% – – – – –
CN–Ag–TiO2-773 K A 90% 3.7731 (18) 9.4449 (61) 134.46 (21) 198 (42) 1.8 (7)
R 10% 4.6048 (134) 2.9487 (64) 62.52 (50) 610 (31) 1.5 (3)
C–Ag–TiO2 573 K A 3.7838 (52) 9.5215 (184) 136.32 (64) 93 (11) 4.0 (7)
C–Ag–TiO2-673 K A 89% 3.7788 (32) 9.4936 (112) 135.56 (39) 111 (24) 2.7 (1.3)
R 11% 4.6020 (106) 2.9528 (69) 62.54 (43) 389 (128) 8.2 (6.8)
C–Ag–TiO2-773 K A 54% 3.7859 (22) 9.4875 (78) 135.99 (27) 267 (112) 0.6 (5)
R 46% 4.5978 (47) 2.9602 (38) 62.58 (21) 619 (223) 1.4 (6)
J Sol-Gel Sci Technol (2009) 51:315–329 325
123

and crystalline structure for CN–Ag–TiO2 coating treated
at 773 K for 1 h, the SAED (selected area electron dif-
fraction) image is also included between the TEM ones
(Fig. 11c).
The un-supported gels CN–Ag–TiO2 exhibits aggregates
of nanocrystallites with the nanocrystallite size in the range
10–30 nm at 573 K (Fig. 10a) and 20–50 nm at 773 K
(Fig. 10b). The CN–Ag–TiO2 coatings have a mixed struc-
ture. There are quasi-amorphous zones with granular struc-
ture of a few nanometers, together with crystalline zones
with the crystallite size of 5–10 nm at 573 K (Fig. 11a) or
10–20 nm at 773 K (Fig. 11b). The SAED pattern (Fig. 11c)
is taken from the area of the transition zone between quasi-
amorphous to crystalline structure shown in Fig. 11b. For
comparison, Fig. 12 presents the TEM image of the pure
TiO2 film at 573 K, obtained from the sol matrix (M). The
TiO2 films are amorphous and their morphology exhibits
nanometric porosity [21]. The increase of temperature at
773 K determined the beginning of the crystallization and
led to almost a doubling in the sizes of pores.
AFM images of Ag-doped TiO2 coatings obtained by
co-gelation and from nanopowders, measured over a
9.15 9 9.15 lm area, are presented in Fig. 13. The
roughness values Root–Mean–Square (RMS) deviation for
CN–Ag–TiO2 coatings were greater (20 nm) than for
C–Ag–TiO2 ones (14 nm). Regardless of the method used
to prepare the coating (from nanopowder or by co-gelation)
the roughness values of the Ag-doped films are greater than
those for the S-doped ones.Fig. 10 TEM images of CN–Ag–TiO2 gel thermally treated at 573 K
(a) and 773 K (b) for 1 h
Fig. 11 TEM images of
CN–Ag–TiO2 coating thermally
treated at 573 K (a) and 773 K
(b) for 1 h; SAED image of
CN–Ag–TiO2 coating thermally
treated at 773 K for 1 h (c)
326 J Sol-Gel Sci Technol (2009) 51:315–329
123

4 Conclusions
Sol–gel doped TiO2 powders and coatings have been
obtained by the alkoxide route. The role of S and Ag as
dopants of TiO2 has been studied. The structure and pho-
tocatalytic activity of the nanomaterials have been com-
pared, as follows:
A. Pure and S-doped TiO2 sol–gel nanopowders
• The influence of the type of Ti-alkoxide, of the
dopant and of the thermal treatment on the
nanopowders structure was established.
• The materials obtained from titanium ethoxide as
TiO2 source were tested for the degradation of
different chloride organic compounds from aque-
ous solutions.
• The presence of S as dopant in the TiO2 powders
only slightly improved their photocatalytic activ-
ities and led to slightly better chlorobenzene
removal yields than for un-doped samples.
B. Un-doped, S-doped and Ag-doped TiO2 nanometer
coatings
• The influence of the number of layers and of the
temperature of the thermal treatment on the
coatings structure and on their catalytic properties
has been established for each dopant.
• The catalytic activity of the prepared coatings has
been tested in the chlorobenzene degradation from
aqueous solutions.
• Both dopants (S and Ag) have improved the
photocatalytic activity of TiO2. The doped-sam-
ples exhibit higher removal yields than the
un-doped ones, regardless of the number of layers
and the irradiation times.
• Based on characterizations and photocatalytic tests
comparisons, the S-doped samples were more
efficient than the Ag-doped materials. The higher
photocatalytic activities of the S-doped TiO2
samples are attributed both to the presence of
anatase as the single crystalline phase of TiO2 as
well as to a more significant surface concentration
of dopant. In the Ag-doped case, the presence of
rutile together with anatase led to the slight
decrease of the photocatalyst efficiency.
C. Ag-doped TiO2 coatings from nanopowders
• Both effects of Ag as dopant and of temperature on
the structural behaviour were studied.
• The Ag-doping favors the transformation of TiO2
from anatase to rutile even at 673 K. This process
is more evident for the sample prepared by
cogelation.
Fig. 12 TEM image of TiO2–M coating thermally treated at 573 K
for 1 h
Fig. 13 AFM images of C–Ag–TiO2 (a) and CN–Ag–TiO2
(b) coatings, thermally treated at 573 K for 1 h
J Sol-Gel Sci Technol (2009) 51:315–329 327
123
Acknowledgments This work was supported by the National
Research Program CEEX, grants No. 642/2005-2008, 6113/2005-
2008 and 59/2007-2008.
References
1. Hoffmann MR, Martin ST, Choi W, Bahnemann DW (1995)
Chem Rev 95:69
2. Linsebigler AL, Lu G, Yates JT Jr (1995) Chem Rev 95:735
3. Kajihara K, Nakanishi K, Tanaka K, Hirao K, Soga N (1998) J
Amer Ceram Soc 81:2670
4. Fujishima A, Rao T, Tryk D (2000) Photochem Photobiol C:
Photochem Rev 1:1
5. Diebold U (2003) Surf Sci Rep 48:53
6. Herrmann JM (2005) Top Catal 34:49
7. Hashimoto K, Irie H, Fujishima A (2005) Jpn J Appl Phys
44:8269
8. Litter MI (2005) Hdb Env Chem 2:325
9. Ollis DF, Serpone N (1989) In: Serpone N, Pelizzetti E (eds)
Photocatalysis fundamentals and applications. Wiley-Inter-Sci-
ence, Amsterdam
10. Watanabe T, Hashimoto K, Fujishima A (1993) In: Ollis DF, Al-
Ekabi H (eds) Photocatalytic purification and treatment of water
and air. Elsevier, Amsterdam
11. Fujishima A, Hashimoto K, Watanabe T (1999) TiO2 photoca-
talysis: fundamentals and applications. BKC Inc, Chiyoda-Ku,
Tokyo
12. Herrmann JM (1999) In: Jansen F, van Santen RA (eds) Catalytic
science series, vol 1: Environmental Catalysis. Imperial College
Press, London
13. Kaneko M, Okura I (2003) Photocatalysis—science and tech-
nology. Springer-Verlag, Berlin, Heidelberg, New York. ISBN
3-540-43473-9
14. Choi WY, Termin A, Hoffmann MR (1994) J Phys Chem
98:13669
15. Facchin G, Carturan G, Campostrini R, Gialanella S, Lutterotti L,
Armelao L, Marci G, Palmisano L, Sclafani A (2000) J Sol-Gel
Sci Technol 18:29
16. Lopez T, Gomez R, Pecci G, Reyes P, Bokhimi X, Novaro O
(1999) Mater Lett 40:59
17. Lopez T, Gomez R, Romero E, Schifter I (1993) React Kinet
Catal Lett 49:95
18. Jin S, Shiraishi F (2004) Chem Eng J 97:203
19. Kirilov M, Koumanova B, Spasov L, Petrov L (2006) J Univ
Chem Techn Metall 41:343
20. Crisan D, Dragan N, Crisan M, Raileanu M, Braileanu A,
Anastasescu M, Ianculescu A, Mardare D, Luca D, Marinescu V,
Moldovan A (2008) J Phys Chem Solids 69:2548
21. Crisan M, Braileanu A, Crisan D, Raileanu M, Dragan N, Mar-
dare D, Teodorescu V, Ianculescu A, Bırjega R, Dumitru M
(2008) J Therm Anal Cal 92:7
22. Zaharescu M, Parlog C, Crisan M, Gartner M, Vasilescu A
(1993) J Non-Cryst Solids 160:162
23. Matsumoto Y, Murakami M, Shono T, Hasegawa T, Fukumura T,
Kawasaki M, Ahmet P, Chikyow T, Koshihara S, Koinuma H
(2001) Science 291:854
24. Kim DH, Yang JS, Kim YS, Chang YJ, Noh TW, Bu SD, Kim
YW, Park YD, Pearton SJ, Park JH (2004) Annalen der Physik
13:70
25. Subramanian M, Vijayalakshmi S, Venkatraj S, Jayavel R (2008)
Thin Solid Films 516:3776
26. Droubay T, Heald SM, Shutthanandan V, Thevuthasan S,
Chambers SA, Osterwalder J (2005) Cr-doped TiO2 anatase: a
ferrromagnetic insulator. J Appl Phys 97:046103. doi:
10.1063/1.1846158
27. Zhu J, Deng Z, Chen F, Zang J, Chen H, Anpo M, Huang J, Zang
L (2006) Appl Catal B: Environ 62:329
28. Matsuo S, Sakaguchi N, Obuchi E, Nakano K, Perera RC,
Watanabe T, Matsuo T, Wakita H (2001) Anal Sci 17:149
29. Trapalis CC, Keivanidis P, Kordas G, Zaharescu M, Crisan M,
Szatvanyi A, Gartner M (2003) Thin Solid Films 433:186
30. Sugimoto K, Kim H, Akao N, Hara N (1994) In: Bardwell J (ed)
Surface oxide films, PV 96-18. The Electrochemical Society
Proceedings Series, Pennington, NJ
31. Kim H, Akao N, Hara N, Sugimoto K (1998) J Electrochem Soc
145:2818
32. Zaharescu M, Crisan M, Szatvanyi A, Gartner M (2000) J Opt
Adv M 2:618
33. Crisan M, Gartner M, Szatvanyi A, Zaharescu M (2002) Rev
Roum Chim 47:123
34. Barau A, Crisan M, Gartner M, Crisan D, Zaharescu M (2004) In:
Balabanova E, Dragieva I (eds) Nanoscience and nanotechnol-
ogy, vol 4. Heron Press Ltd., Sofia, p 194. ISBN 954-580-160-3
35. Sonawane RS, Kale BB, Dongare MK (2004) Mat Chem Phys
85:52
36. Gauthier V, Bourgeois S, Sibillot P, Maglione M, Sacilotti M
(1999) Thin Solid Films 340:175
37. Zhang K, Xu W, Li X, Zheng S, Xu G (2006) Central Eur J Chem
4:234
38. Crisan M, Zaharescu M, Crisan D, Ion R, Manolache M (1998) J
Sol-Gel Sci Techn 13:775
39. An JH, Kim BH, Jeong JH, Kim DM, Jeon YS, Jeon KO, Hwang
KS (2005) J Ceram Proc Res 6:163
40. Carrota MC, Ferroni M, Gnani D, Guidi V, Merli M, Martinelli
G, Casale MC, Notaro M (1999) Sens Actuators B Chem 58:310
41. Devi GS, Hyodo T, Shimizu Y, Egashira M (2002) Sens Actua-
tors B Chem 87:122
42. Garzella C, Comini E, Bontempi E, Depero LE, Frigeri C,
Sberveglieri G (2002) Sens Actuators B Chem 83:230
43. Hwang YK, Patil KR, Kim HK, Sathaye SD, Hwang JS, Park SE,
Chang JS (2005) Bull Korean Chem Soc 26:1515
44. Lee YC, Hong YP, Lee HY, Kim H, Jung YJ, Ko KH, Jung HS,
Hong KS (2003) J Colloid Interface Sci 267:127
45. Li FB, Li XZ (2002) Appl Catal A: Gen 228:15
46. Liao H, Lu W, Yu S, Wen W, Wong GKL (2005) J Opt Soc Amer
B 22:1923
47. Manera MG, Spadavecchia J, Buso D, de Julian Fernandez C,
Mattei G, Martucci A, Mulvaney P, Perez-Juste J, Rella R,
Vasanelli L, Mazzoldi P (2008) Sens Actuators B Chem 132:107
48. Du Z, Feng C, Li Q, Zhao Y, Tai X (2008) Colloids Surf A
Physicochem Eng Asp 315:254
49. Traversa E, Di Vona ML, Nunziante P, Licoccia S, Sasaki T,
Koshizaki N (2000) J Sol-Gel Sci Techn 19:733
50. Falaras P, Arabatzis IM, Stergiopoulos T, Bernard MC (2003) Int
J Photoenergy 05:123
51. You X, Chen F, Zhang J, Anpo M (2005) Catal Lett 102:247
52. Zhang L, Xia D, Shen S (2006) J Nanoparticle Research 8:23
53. Esfahani MN, Habibi MH (2008) Silver doped TiO2 nanostruc-
ture composite photocatalyst film synthesized by sol–gel spin and
dip coating technique on glass. Int J Photoenergy. doi:
10.1155/2008/628713 (Article ID 628713)
54. Burns A, Li W, Baker C, Shah SI (2002) Mat Res Soc Symp
703:V5.2.1
55. Palomino-Merino R, Conde-Gallardo A, Garcia-Rocha M, Her-
nandez-Calderon I, Castano V, Rodriguez R (2001) Thin Solid
Films 401:118
56. Xie Y, Ping L, Yuan C (2002) J Rare Earth 6:619
57. Bamwenda GR, Uesigi T, Abe Y, Sayama K, Arakawa H (2001)
Appl Catal A: Gen 205:117
328 J Sol-Gel Sci Technol (2009) 51:315–329
123
58. Li FB, Li XZ, Hou MF, Cheah KW, Choy WCH (2005) Appl
Catal A: Gen 285:181
59. Matos J, Laine J, Herrmann JM (1998) Appl Catal B: Environ
18:281
60. Colon G, Hidalgo MC, Navıo JA (2002) Catal Today 76:91
61. Tryba B, Morawski AW, Inagaki M (2003) Appl Catal B:
Environ 41:427
62. Toyoda M, Nanbu Y, Kito T, Hirano M, Inagaki M (2003)
Desalination 159:273
63. Irie H, Watanabe Y, Hashimoto K (2003) Chem Lett 91:3204
64. Ohno T, Tsubota T, Toyofuku M, Inaba R (2004) Catal Lett
98:255
65. Yu G, Chen Z, Zhang Z, Zhang P, Jiang Z (2004) Catal Today
90:305
66. Tachikawa T, Tojo S, Kawai K, Endo M, Fujitsuka M, Ohno T,
Nishijima K, Miyamoto Z, Majima T (2004) J Phys Chem B
108:19299
67. Carpio E, Zuniga P, Ponce S, Solis S, Rodriguez J, Estrada W
(2005) J Mol Catal A Chem 228:293
68. Wang H, Lewis JP (2006) J Phys: Condens Matter 18:421
69. Asahi R, Morikawa T, Ohwaki T, Aoki K, Taga Y (2001) Science
293:269
70. Irie H, Watanabe Y, Hashimoto K (2003) J Phys Chem B
107:5483
71. Nakamura R, Tanaka T, Nakato Y (2004) J Phys Chem B
108:10617
72. Bacsa R, Kiwi J, Ohno T, Albers P, Nadtocchenko V (2005) J
Phys Chem B 109:5994
73. Xu M, Lin S, Chen X, Peng Y (2006) J Zhejiang Univ Sci B
7:586
74. Nishijima K, Kamai T, Murakami N, Tsubota T, Ohno T (2008)
Photocatalytic hydrogen or oxygen evolution from water over
S- or N-doped TiO2 under visible light. Int J Photoenergy. doi:
10.1155/2008/173943 (Article ID 173943)
75. Hebenstreit ELD, Hebenstreit W, Diebold U (2000) Surf Sci
461:87
76. Hebenstreit ELD, Hebenstreit W, Diebold U (2001) Surf Sci
470:347
77. Ohno T, Mitsui T, Matsumura M (2003) Chem Lett 32:364
78. Umebayashi T, Yamaki T, Tanala S, Asai K (2003) Chem Lett
32:330
79. Ohno T, Akiyoshi M, Umebayashi T, Asai K, Mitsui M, Mat-
sumura M (2004) Appl Catal A: Gen 265:115
80. Ohno T (2004) Water Sci Technol 49:159
81. Sun H, Liu H, Ma J, Wang X, Wang B, Han L (2008) J Hazard
Mater 156:552
82. Yu JC, Ho W, Yu J, Yip H, Wong PK, Zhao J (2005) Environ Sci
Technol 39:1175
83. Ho W, Yu CJ, Lee S (2006) J Solid State Chem 179:1171
84. Crisan M, Braileanu A, Raileanu M, Crisan D, Teodorescu VS,
Bırjega R, Marinescu VE, Madarasz J, Pokol G (2007) J Therm
Anal Cal 88:171
85. Liu S, Chen X (2008) J Hazard Mater 152:48
86. Crisan M, Braileanu A, Raileanu M, Zaharescu M, Crisan D,
Dragan N, Anastasescu M, Ianculescu A, Nitoi I, Marinescu VE,
Hodorogea SM (2008) J Non-Cryst Solids 354:705
87. Wei F, Ni L, Cui P (2008) J Hazard Mater 156:135
88. Kim SW, Khan R, Kim TJ, Kim WJ (2008) Bull Korean Chem
Soc 29:1217
89. Habibi MH, Esfahani MN, Egerton TA (2007) Photochemical
characterization and photocatalytic properties of a nanostructure
composite TiO2 film. Int J Photoenergy. doi: 10.1155/2007/13653
(Article ID 13653)
90. Keshmiri M, Mohseni M, Troczynski T (2004) Appl Catal
B: Environ 53:209
91. Habibi MH, Nasr-Esfahani M, Egerton TA (2008) J Mater Sci
42:6027
92. Traversa E, Di Vona ML, Nunziante P, Licoccia S, Yoon JW,
Sasaki T, Koshizaki N (2001) J Sol-Gel Sci Techn 22:115
93. Dragan N, Lepadatu C (2002) Rom J Mater 32:282
94. Dragan N, Crisan D, Lepadatu C (2003) Rom J Mater 33:133
95. Bruggemann DAG (1935) Ann Phys 24:636
96. Palik ED (1997) Handbook of optical constants of solids. Aca-
demic Press, New York
97. Online optical databases http://www.angstec.com/nkDatabase2.
jsp
98. Online optical databases http://www.luxpop.com/
J Sol-Gel Sci Technol (2009) 51:315–329 329
123