Engineering Nanomaterials to Overcome Barriers in Cancer ...
Upload
khangminh22Category
view
0download
0
1
University of Salerno
Department of Chemistry and Biology
Ph.D. Thesis in Chemistry
“Carbon-based nanomaterials”
Mario Maggio
Tutor: prof. Gaetano Guerra Co-tutor: prof. Pasquale Longo Tutor esterno: dr. Luca Giannini
XXIX Cycle 2014-2017

2
Introduction
Chapter 1
Carbon Allotropes 1.1 Carbon Allotropes / 9
1.2 Structures of Layered Carbons / 10
1.2.1 Graphites / 11
1.2.2 Turbostratic Graphites / 13
1.2.3 Amorphous Carbons / 15
1.2.4 Carbon Blacks / 16
1.2.5 Carbon Nanotubes / 18
1.3 Structural Characterization of Graphitic Materials for the Preparation of
Anisotropic Carbon Nanofillers / 20
1.4 Graphite Oxide / 24
1.4.1 Preparation, Composition and Surface Areas of Graphite
Oxide Samples / 25
1.4.2 Characterization of Graphite Oxide Samples / 28
1.4.3 Mechanical Exfoliation of Graphite Oxide / 31
Chapter 2
Experimental part:
Materials, preparation procedures and
characterization techniques 2.1 Preparation of GO with Higher Content of Oxygenated Groups / 41
2.2 Preparation of GO with Lower Content of Oxygenated Groups / 41
2.3 Preparation of GOICs / 41
2.4 Preparation of GO and GOIC films / 42
2.5 Preparation of Chemically Reduced Graphite Oxide / 42
2.6 Graphite Oxide Exfoliation by Ball-Milling / 43
2.7 GO paper preparation / 43

3
2.8 Preparation of adducts of oxidized carbon black with ammonium ions
with long alkyl chains / 44
2.9 Oxidation of carbon blacks with different surface area /44
2.10 Wide Angle X-ray Diffraction / 45
2.11 Fourier Trasform Infrared Spectroscopy / 47
2.12 Differential Scanning Calorimetry / 47
2.13 Thermogravimetric Analysis / 47
2.14 Elemental Analysis / 48
2.15 BET Surface Area Measurements / 48
2.16 Scanning Electron Microscopy / 48
2.17 Transmission Electron Microscopy / 48
2.18 Back Titration of Graphite Oxides / 49
Chapter 3
Intercalation Compounds of graphite oxide 3.1 Graphite Oxide Intercalation Compounds with long alkyl chains
ammoniun cations / 53
3.2.1 Characterization of graphite intercalation
compounds with ammonium cations / 54
3.2.2 Structural reversibility of the graphite oxide intercalation
compounds with temperature / 58
3.2.3 Structure of the graphite oxide intercalation Compounds / 59
3.3 Graphite Oxide Intercalation and Exfoliation compounds with
Phosphonium ions / 62
3.3.1 Intercalation compounds with quaternary phosphonium ions / 62
3.3.2 Exfoliation compounds with quaternary phosphonium ions / 65
3.3.3 Structural Organization of GOIC and GOEC Compounds with TPP+
/ 67
3.3.4 Spectroscopic characterization of GOIC and GOEC Compounds
with TPP+ / 69
3.3.5 Release of Organo-Phosphonium Ions in Aqueous Solutions from
GOIC and GOEC / 71
Conclusions / 74

4
CHAPTER 4 Carbon Black Oxide and Carbon black oxide adducts
with organic ammonium ions
4.1 Preparation, Composition and Surface Areas of Carbon Black Oxide
Samples / 81
4.2 oCB/2HT adducts / 88
Conclusions / 93
CHAPTER 5
Graphite and Graphene Oxide paper 5.1 Structural characterizations of GO and b-GO papers / 99
5.2 Structural changes with thermal and microwave treatments / 103
5.3 Thermal behavior / 106
5.4 Dimensional stability in solvents / 108
5.5 Paper flexibility / 111
5.6 FTIR characterization and possible rationalization
of b-GO properties / 112
Conclusions / 115
General Conclusions

5

6
Introduction
Carbon-based nanomaterials have become important due to their unique
combinations of chemical and physical properties (i.e., thermal and
electrical conductivity, high mechanical strength, and optical properties),
and extensive research efforts are being made to utilize these materials for
various industrial applications, such as high-strength materials and
electronics.
In particular, layered oxidized carbon-based nanomaterials, like graphite
and graphene oxide, can be easily manipulated not only to obtain
intercalation and/or exfoliation compounds with organic ions, but also to
form thermally stable, solvent resistant and flexible papers.
This PhD thesis reports some advances in the field of carbon-based
nanomaterials.
In Chapter 1, as literature reports, well-known carbon allotropes are
described, focusing on their structure properties. A substantial part of this
chapter also reports preparation procedures and characterization of
graphite oxide, as described in PhD thesis of Marco Mauro (2011-2014).
In Chapter 2 and 3, materials, preparation procedures and characterization
techniques are listed and described in detail.
The following chapters report the main results obtained during this PhD
program.
Chapter 4 shows the preparation and structural characterizations of
graphite oxide (GO), graphite oxide intercalation compounds (GOICs) and
graphite oxide exfoliation compounds (GOEC) with organic ions.
Specifically, when intercalation of organic cations containing two long
hydrocarbon tails (quaternary ammonium ions) is obtained, the GOICs
exhibit a large distance between graphite oxide sheets as well as a long-
range order in the organization of guest species.
Moreover, for the first time for phosphonium salts (known for their
antibacterial activity), it is reported the preparation procedures that are
suitable to produce highly ordered graphite oxide intercalation compounds
(GOIC) or fully disordered graphite oxide exfoliated compounds (GOEC).

7
These intercalated and exfoliated compounds are structurally
characterized, and their largely different ion release behaviors in neutral
and acid aqueous solutions are compared. In the first part of Chapter 5,
oxidation studies on different carbon black (CB) samples, exhibiting largely
different BET surface areas, are reported. While in the second part of the
Chapter 5 formation of an intercalate crystalline structure of small and
highly disordered oxidized CB layers is for the first time reported. This
intercalate is obtained by self-assembling of CB with ammonium ions with
two long hydrocarbon tails (similar to those reported in Chapter 4), and its
crystalline structure is described mainly on the basis of x-ray diffraction
(WAXD) patterns.
In addition to a rich intercalation chemistry, graphene oxide can be used
to produce free-standing papers by vacuum filtration of colloidal
dispersions.
Therefore, Chapter 6 presents graphene oxide papers, prepared by
suspending graphite oxide powders in basified aqueous solution, that
exhibit thermal stability and solvent resistance much higher than usual GO
papers. In this way casting procedures, which are generally unsuitable for
production of robust GO papers, become suitable for basified GO.

8

9
Chapter 1
Carbon Allotropes
1.1 Carbon Allotropes
Carbon, the sixth element in the Periodic Table of Elements, is truly
remarkable for its extraordinary ability of catenation to combine with itself
and other chemical elements in different ways and thereby form the basis
of organic chemistry and of life. Diamond and graphite are well-known
allotropes of carbon. Elemental carbon with sp3 hybridization builds up a
tetrahedral lattice, giving rise to diamond (Fig. 1.1A), while sp2 hybridized
extended networks are responsible for the formation of graphite (Fig.
1.1B).
Figure 1.1. Crystal structures of (A) diamond and (B) hexagonal graphite.
Graphene is an atomically thick, two-dimensional (2D) sheet
composed of sp2 carbon atoms arranged in a honeycomb structure

10
(Scheme 1.1). It has been viewed as the building block of all other graphitic
carbon allotropes of different dimensionality. For example, graphite (3D
carbon allotrope) is made of graphene sheets piled on top of each other
with …ABABAB… stacking and separated by 0.335 nm. More disordered
graphitic structures exist for coals, cokes and carbon blacks. The 0D carbon
allotrope, fullerenes (buckyballs), can be envisioned to be made by
wrapping a section of graphene sheet. The 1D carbon allotropes, carbon
nanotubes (CNT), can be made by rolling graphene sheets.
Scheme 1.1. Mother of all graphitic forms. Graphene is a 2D building material for
carbon materials of all other dimensionalities. It can be wrapped up into 0D
buckyballs, rolled into 1D nanotubes, piled with a …ABABAB… stacking into 3D
graphite or randomly stacked in primary particles of carbon black.
1.2 Structures of Layered Carbons
Materials with layers of sp2-bonded carbon atoms exhibit a large variety of
structures characterized by different degree of structural order and
morphologies. These materials, principally, differ for their degree of order
perpendicular to the graphitic layers (out-of-plane order) and in the
graphitic layers (in-plane order).

11
The structures of layered carbons, from ordered graphites to
amorphous carbons, are discussed in the following. A systematic X-ray
diffraction characterization of different graphitic materials was also
performed, in order to select the most suitable starting material for the
preparation of anisotropic carbon nanofillers to be used in rubber
nanocomposites.
1.2.1 Graphites
Graphite is a crystalline, polymorphic form of elementary carbon with
ordered layers. Each carbon atom in the graphite crystal is hybridised
trigonally, forming three σ and one π bonds. The hybridised orbitals of the
sp2 type give σ bonds of a length of 1.42 Å, arranged at 120° angles with
respect to one another, with sheets made up of regular hexagons. The
fourth electron of each atom, being in the p orbital, forms π bonds with all
the neighbouring atoms. The structure of graphite consists of six-
membered rings in which each carbon atom has three near neighbours at
the apices of an equilateral triangle. Within the large planar layers, there
are linkages intermediate between atomic and metallic bonds. The layers
in the crystal are held together by van der Waals bonding forces. Weak
bonding perpendicular to the layers gives rise to easy gliding parallel to the
sheets.[1]
According to the structural model proposed by Hull in 1917 [2] and
described by Bernal in 1924,[3] the hexagonal unit cell of hexagonal
graphite contains four atoms in the positions listed below compared to the
reference system in Fig. 1.2:
(0,0,0) ; (0,0,1/2) ; (1/3,2/3,1/2) ; (2/3,1/3,0)

12
Figure 1.2. Detailed crystal structure of hexagonal graphite.
Hexagonal graphite consists of sheets stacked along the
crystallographic c axe with a regular …ABABAB… sequence and lattice
costant c0 = 0.67 nm (see Fig. 1.2). The X-ray diffraction analysis is the most
powerful tool to study the structure of graphites and of carbon materials in
general. The hexagonal graphite reflections can be classified into three
groups: reflections with 00ℓ, hk0 and hkℓ indices. Reflections with 00ℓ are
due to the diffraction from the basal planes stacked along the
crystallographic c axe. Only even ℓ values are permitted because of the
systematic extinction of 00ℓ reflections with odd ℓ values, related to the
…ABABAB… stacking. Reflections with hk0 are due to the diffraction from
the crystal planes perpendicular to the basal planes and the hkℓ reflections
are related to the diffraction from the inclined planes respect to the basal
planes.
The X-Ray diffraction pattern of hexagonal graphite in Fig. 1.3 [4]
presents the 002, 004 and 006 reflections characteristic of the stacking
along the crystallographic c axe, while the 100 and 110 reflections are
related to the order inside the graphitic layers. The distance between the A
and B planes is the Bragg’s distance d002 = 0.335 nm and the distance

13
between the A and A planes is the lattice costant c0 = 2d002 = 0.67 nm.
The Bragg’s distances d100 = a0∙ cos(30°) = 0.213 nm and d110 = a0∙
sin(30°) = 0.123 nm, are related to the 100 and 110 planes, orthogonal to
the A and B planes (see Fig. 1.2).
Figure 1.3. X-ray diffraction (Cu Kα) pattern of hexagonal graphite
1.2.2 Turbostratic Graphites
The described hexagonal structure of graphite refers to its crystalline form
defined as ideal models. However, in nature graphite usually appears in
less perfect forms and in a variety of disordered types from the so-called
turbostratic graphites to the amorphous carbons.
According to the random layer lattice structural model proposed by
Warren in 1941, turbostratic graphite is characterized by the lack of
…ABABAB… stacking with graphitic sheets randomly translated to each
other and rotated respect to the normal of the layers (see Scheme 1.2).[5]

14
Scheme 1.2. Top view of the turbostratic graphite structures compared with the
hexagonal graphite structure, after ref. 4.
Distortions from the hexagonal graphite structure determine the
intensity decrease or the disappearance of hkℓ reflections, such as 101,
102, 103, 104, 105 and 112, while the 00ℓ and the hk0 reflections are not
suppressed. The Bragg’s distance d002 and the width at half height β002
increase.[6]
Turbostratic structures are often observed in extensively ball-milled
graphites [7] or in carbon materials heated at relatively low temperatures
of 1300–1500 °C,[8] where the size of each layer is small and only a few
layers are stacked in ordered manner. By heating these carbons to high
temperatures, up to 3000 °C,[9] both the size and number of stacked layers
usually increase, and the regularity in stacking is also improved. Heat
treatment at intermediate temperatures gives a partial improvement in
stacking regularity. A wide range of structures from completely turbostratic
structures to graphite structures with pure …ABABAB… stacking is possible,
depending primary on the starting materials and the heat treatment
temperature.

15
1.2.3 Amorphous Carbons
Amorphous carbons such as coals, cokes and carbon blacks are materials
without long-range crystalline order. Short-range graphite-like order still
exists, and the degree of this kind of order gives rise to intermediate
structures between the graphitic and the completely amorphous (lack of
any crystalline structure) carbons, according to the random layer lattice
structural model.[5] Deviations of the interatomic distances and
interbonding angles with respect to the graphite lattice as well as to the
diamond lattice occur in such materials.
The X-Ray diffraction pattern of petroleum coke heat treated at
1000 °C in Fig. 1.4 [4] is characterized by very broad 00ℓ reflections, due to
the small number of layers stacked in an orered manner, unsymmetrical
two-dimensional hk reflections, and no hkℓ reflections, due to random
turbostratic stacking of the layers.
Figure 1.4. X-ray diffraction (Cu Kα) pattern of petroleum coke heat treated at
1000 °C.

16
The structure of amorphous carbons with short-range graphite-like
order can be rationalized by the Franklin’s model proposed in 1950.[10]
According to this model, this kind of carbons are characterized by two
types of carbon structures: carbon crystallites and completely amorphous
carbon. Small graphitic crystallites, containing few layers, are joined
together by cross-links. These cross-links are established by aliphatic chains
on the edges of each crystalline domains. The structural units in non-
graphitizing carbons are distributed randomly, and the cross-links are
sufficiently strong to impede movement of the layers into a more parallel
arrangement (see Fig 1.5A). The structural units in a graphitizing carbon
are approximately parallel to each other, and the links between adjacent
units are assumed to be weak (see Fig 1.5B).[11]
Figure 1.5. Franklin’s structural model of: (A) non-graphitizing and (B) graphitizing
carbons.
1.2.4 Carbon Blacks
Carbon blacks (CBs), formed through incomplete combustion of high
molecular weight hydrocarbon fractions of petroleum crude oils, coal tar,
ethylene cracking tar, and vegetable oil, are very important industrial
products, in particular these materials are the most important reinforcing

17
filler used to improve strenght, rolling resistance and abrasion resistance in
tire compounds.
CB samples are characterized by aggregates (200 – 1000 nm) of
nearly spherical particles (20 - 100 nm) with an internal structure made of
graphite-like units having a random orientation of the graphitic layers, as
shown in Fig. 1.6.[12]
Figure 1.6. Structure of carbon black aggregates.
CB powders are characterized by high surface areas, as a consequence of
their nanometric primary particles, that determine high filler-polymer
interfacial areas, when CB particles are dispersed in a polymer matrix. The
degree of aggregation of primary particles defines a very important
technological parameter, the so-called ‘‘structure’’ of CBs. High structure

18
CBs are characterized by high degree of aggregation (low void volume) (see
Fig. 1.7)
Figure 1.7. Degree of aggregation of primary particles of carbon black.
Another peculiar feature of CB particles is their surface activity, that
derives from both high energy graphitic edges and the oxygen groups
(carbonyl, carboxylic, lactonic and phenolic groups), at the edges of each
graphitic layer (see Fig. 1.6). The surface activity of CB particles is
responsible for the filler-filler and filler-polymer interactions in polymeric
nanocomposites.
1.2.5 Carbon Nanotubes
The discovery of carbon nanotubes (CNT) in 1991 opened up a new era in
materials science by Lijima [13]. These incredible structures have an array
of fascinating electronic, magnetic and mechanical properties. CNT are at
least 100 times stronger than steel, but only one-sixth as heavy, so
nanotube fibers could strengthen almost any material.[14] Nanotubes can

19
conduct heat and electricity far better than copper. CNT are already being
used in polymers to control or enhance conductivity and mechanical
properties.
Carbon nanotubes are composed of carbon atoms linked in hexagonal
shapes, with each carbon atom covalently bonded to three other carbon
atoms. Carbon nanotubes have diameters as small as 1 nm and lengths up
to several centimeters. Although, like buckyballs, carbon nanotubes are
strong, they are not brittle. They can be bent, and when released, they will
spring back to their original shape. Carbon nanotubes can occur as multiple
concentric cylinders of carbon atoms, called multi-walled carbon
nanotubes (MWCNTs) and as one cylinder which are called single-walled
carbon nanotubes (SWCNTs) (Fig. 1.8). Both MWCNT and SWCNT are used
to strengthen composite materials. [15, 16]
Figure 1.8 Structure of Single-Walled Carbon Nanotubes (SWCNT) and Multi-
Walled Carbon Nanotubes (MWCNT)

20
1.3 Structural Characterization of Graphitic Materials for the Preparation
of Anisotropic Carbon Nanofillers
Physical properties of fillers and of composites based on them are better
when fillers have a high anisotropy,[17–21] that means when they have
short and long correlation lengths in the direction perpendicular and
parallel to the structural layers, respectively.
Among layered fillers based on sp2-carbon atoms, highly anisotropic
graphites, with a high in-plane order and a reduced out-of-plane order, are
the most suitable starting material for the preparation of anisotropic
carbon nanofillers. In this respect, aiming to select a graphite with high
shape anisotropy of the crystallites and a long-range structural order in
graphene layers, a systematic X-ray diffraction characterization of different
graphitic materials was performed.
The X-ray diffraction patterns of six commercial graphitic materials
are compared in Fig. 1.9 and are organized from A to F, on the basis of a
progressive reduction of structural order. The relative Williamson-Hall plots
are presented in Fig. 1.10 and the derived correlation lengths and strains,
parallel and perpendicular to the structural layers, are reported in Table
1.1. Of course, errors in correlation lengths and strains, when only two
reflections are available, can be large (up to 10 % for samples D-F).

21
Figure 1.9. X-ray diffraction patterns (Cu Kα) of six commercial graphitic materials:
(A, B) graphites, (C) ball-milled graphite, (D, E) needle coke and calcined
petroleum coke and (F) carbon black N326. The patterns are reported from A to F
on the basis of a progressive reduction of structural order.

22
Figure 1.10. Out-of-plane (a) and in-plane (b) Williamson−Hall plots for the
graphitic samples from A to F, whose X-ray diffraction patterns are reported in Fig.
2.8.
Table 1.1. Structural parameters derived from Bragg’s lawand
Williamson-Hall plots of Fig. 2.9.
Sample
d002 D┴ D║
D║ / D┴
ε┴ ε║
ε┴ / ε║ (nm) (nm) (nm) (%) (%)
A 0.339 20.3 44.5 2.2 0.047 0.059 0.8
B 0.339 16.8 36.4 2.2 0.060 0.059 1.0
C 0.339 9.8 30.2 3.1 0.107 0.073 1.5
D 0.347 5.9 6.5 1.1 0.38 0.33 1.1
E 0.348 3.5 3.6 1.0 0.78 0.50 1.5
F 0.365 1.9 2.9 1.5 1.6 0.67 2.4
All samples of Fig. 2.8 present broad 00ℓ reflections and out-of-
plane correlation lengths (3rd column of Table 1.1) from 20 nm down to 2

23
nm. Moreover, all samples of Fig. 2.8, due to their structural disorder,
present distances between the structural layers (d002 in the 2nd column of
Table 1.1) slightly larger than those of ordered graphite samples (d002 =
0.335 nm).[22]
In particular, for samples A-C, the in-plane correlation lengths (4th
column of Table 1.1) are larger than the out-of-plane correlation lengths
(3rd column of Table 1.1) and the out-of-plane correlation length is
significantly reduced for sample C. Moreover, going from A to C there is
also a progressive reduction of the intensities of the 101 and 112
reflections with respect to the hk0 reflections. This clearly indicates a
progressive increase of disorder in the relative position of parallel graphitic
layers and hence a tendency toward the so-called turbostratic graphite.[6]
An almost perfect turbostratic structure is present in samples D-F, whose
101 and 112 reflections are negligible.
Samples D-F exhibit low out-of-plane correlation lengths
(corresponding to few graphitic layers). However, their in-plane correlation
lengths are also low, thus leading to poor shape anisotropy of the
crystallites (5th column of Table 1.1).
The whole structural information from Figs 1.8–1.9 (and Table 1.1)
clearly indicates that the ball-milled graphite (sample C in Fig. 1.8, renamed
G in the following), which presents the highest shape anisotropy (D║ / D┴ =
3.1, see Scheme 1.3), associated with a large in-plane correlation length
and a reduced order in the relative position of parallel graphitic layers,
appears to be the most suitable starting material for the preparation of
anisotropic carbon nanofillers (see the next paragraphs) to be used in
rubber nanocomposites.[23]

24
Scheme 1.3. Schematic representation of G with a basal spacing of d002 = 0.339
nm and a high shape anisotropy of D║ / D┴ ≈ 3.
1.4 Graphite Oxide
Graphite oxide (GO) is a layered material, which can be obtained by
chemical oxidation of graphite. Graphite oxide can be prepared by the
treatment of graphite with strong mineral acids and oxidizing agents,
typically via treatment with a mixture of sulfuric and nitric acid, using
potassium chlorate, as in the Brodie’s [24] or Staudenmaier’s [25]
methods, or with a mixture of sodium nitrate and concentrated sulfuric
acid, using potassium permanganate, as in the Hummers’ method.[26]
The precise structure of GO remains a matter of debate,[27] and,
according to the Lerf-Klinowski model,[28] GO consists of oxidized sheets
having oxygen containing functional groups, that confer polar surface
properties and a strong hydrophilic character. Hydroxyl and epoxide
groups are at the surface of the basal planes and carbonyl and carboxyl
groups are at the edges. Therefore, GO forms colloidal dispersion in water,
which are stabilized by negative charges from the carboxyl groups, without
the need for any surfactant.[29]

25
1.4.1 Preparation, Composition and Surface Areas of Graphite
Oxide Samples
Two sets of GO samples, containing higher (H-GO) and lower (L-GO) oxygen
content, were prepared by using Staudenmaier’s method and Hummers’
method, respectively, starting from the highly anisotropic graphite G. The
oxidation methods of G are represented in Scheme 1.4.
Scheme 1.4. Schematic representation of the oxidation reactions of the graphite
(G) with Staudenmaier’s and Hummers’ methods.
Measurements of the water loss up to 150 °C by TGA (roughly 20
%wt. for H-GO and 5 %wt. for L-GO), reported in Fig. 1.10, and elemental
analysis of the GO powders, reported in Table 1.2, indicate that the carbon
to oxygen weight ratio (see C/O ratios in Table 2.2) in H-GO is about 1.6
and 1.9 in L-GO. Hence, the compositions of GO samples are
CO0.47H0.2·0.28H2O for H-GO and CO0.39H0.12·0.05H2O for L-GO.

26
Figure 1.10. TGA curves in N2 of the starting high surface area graphite (G) and
of the derived L-GO and H-GO.

27
Table 1.2. Results of elemental analysis and BET measurements on the
starting high surface area graphite G and of the derived L-GO and H-
GO.a
Elemental composition (%wt.)
Sample SBET
(m2/g) C H N O S C/O
G 308 99.8 0.1 0.1 0.0 0.0 /
L-GO 0.8 63.7 0.6 0.1 33.7 1.9 1.9
H-GO 1.1 59.1 1.4 0.1 35 4.4 1.6
aElemental composition of the anhydrous GO samples: water contents of
nearly 20 %wt. and 5 %wt. are evaluated by TGA for H-GO and L-GO,
respectively.
Results of the BET measurements, reported in Table 1.2, show
that G exhibits a high surface area, SBET = 308 m2/g, associated to its
highly porous morphology, as shown in the SEM images in Fig. 1.11.
Figure 1.11 SEM images of G at different magnifications: (A) 50 μm and (B) 5 μm.

28
The oxidation of G definitely decreases its surface area from 308
m2/g to 0.8 m2/g for L-GO and 1.1 m2/g for H-GO. These surface area values
agree well with those reported in the literature for GO samples.[30-32]
1.4.2 Characterization of Graphite Oxide Samples
FTIR spectra in Fig. 1.12 show the presence of oxygenated functional
groups on the layers of both H-GO and L-GO, whose concentration is
negligible in the starting graphite sample (G). Absorption bands of carboxyl
groups (1730cm- 1), hydroxyl groups (stretching at 3420 cm-1 and bending
at 1385 cm-1) and epoxide groups (1145-1065 cm-1) are observed.[34]
Figure 1.12. FTIR spectra in the range 4000−400 cm−1 of the starting high surface
area graphite (G) and of the derived L-GO and H-GO.
The TGA curves in Fig. 1.10 also confirm the presence of oxygenated
functional groups, infact, both GO samples exhibit a weight loss from 150
°C to 300 °C, caused by the decarboxylation reactions and a weight loss
above 300 °C, associated to the removal of hydroxyl and epoxide
groups.[33]

29
Fig. 1.13. X-ray diffraction patterns (Cu Kα) of the starting high surface area
graphite (G) and of the derived L-GO and H-GO.
The X-ray diffraction patterns of GO samples in Fig. 1.13 reveal a
broad 001 reflection, corresponding to an interlayer distance of 0.84 nm, as
already reported by some literature studies.[35-38] This value is higher
than the interlayer distance observed in the starting graphite, about 0.339
nm. Hence, the oxidation of G produces an oxidized layered material with
increased interlayer distance, from 0.339 nm to 0.84 nm, as represented in
Scheme 1.5.
Scheme 1.5. Schematic representation of the increasing of the interlayer distance
in GO after oxidation of graphite G.

30
The out-of-plane correlation lengths, determined by the Scherrer
equation (see Chapter 6) were 5.4 nm for H-GO and 4.5 nm for L-GO.
Correspondingly, the in-plane periodicities (d100 and d110) and correlation
lengths (D║ = 30 nm) of both GO samples remain nearly unaltered with
respect to the values observed in the starting graphite. Hence, GO layers
present a long-range in-plane order as well as a high shape anisotropy of
the crystallites (D║ / D┴ = 5.6 for H-GO and 6.7 for L-GO).
The pH back titration curves of GO samples dissolved in 0.05 M
NaOH aqueous solution toward H+ ion are given in Fig. 1.14.
Different inflection points, corresponding to distinctive acidic
groups, such as carboxylic and phenolic groups, that form sodium salts in
the presence of sodium hydroxide, are observed. The CEC values were
evaluated as 7.3 mmol/g for H-GO and as 5.7 mmol/g for L-GO, when 17.8
mmol of H+ and 19.3 mmol of H+ were added to the well dispersed colloidal
solutions of H-GO and L-GO, respectively.
Figure 1.14. The pH back titration curve of L-GO (empty circles) and H-GO (filled
circles) dissolved in 0.05 M NaOH aqueous solution toward H+ ion.
In order to obtain graphitic fillers with improved compatibility with
polymer matrices, the intercalation chemistry of GO with organic ions was

31
investigated. The method promotes a non-covalent functionalization of
highly anisotropic GO layers and the results are discussed in the next
paragraph.
1.4.3 Mechanical Exfoliation of Graphite Oxide
The mechanical exfoliation of GO by ball-milling is a simple but effective
technique to produce exfoliated graphite oxide (eGO, also called graphene
oxide) in the bulk state (see Scheme 1.6).
Scheme 1.6. Schematic representation of the exfoliation of GO by ball-
milling.
The large increase of the interlayer spacing, from 0.34 nm up to nearly 0.8
nm, during the oxidation process of graphite and the disordered
arrangement of the functional oxidized groups on the layer surfaces of GO
lead to weak interlayer attractive forces, making easy the GO exfoliation by
simple mechanical processes.
Exfoliated GO samples were prepared according the procedure in
paragraph 5.6 , starting from L-GO, and the related X-ray diffraction
patterns are shown in Fig. 1.15.

32
Figure 1.15. X-ray diffraction patterns (Cu Kα) of the starting graphite oxide (L-GO)
and of the derived eGO after ball-milling.
The pattern of eGO shows, beside the maintenance of the 100 and 110
reflections, a very broad intense halo, centered at d = 0.37 nm with a
correlation length of about 1 nm, indicating the presence of a large fraction
of essentially exfoliated GO. The weak reflection with d = 0.76 nm and D┴ ≈
2.5 nm can be interpreted as the 001 reflection of unexfoliated GO,
occurring in an amount lower than 10 %wt.
The bands of carboxyl, phenolic and epoxide groups in the FTIR spectrum
of eGO appear enhanced in intensity with respect to the same bands in the
L-GO FTIR spectrum in Fig. 1.16. This result could be attributed to the
greater exposure of the oxygenated functional groups on the exfoliated
layers of eGO.

33
Figure 1.16. FTIR spectra of the starting graphite oxide (L-GO) and of the derived
eGO after ball-milling.
Similar considerations can be made by comparing the TGA of L-GO and
eGO in Fig. 1.17. In fact, above 150 °C, the oxygenated functional groups of
eGO decompose earlier with respect to the same groups of L-GO, and,
again, this phenomenon could be attributed to a greater exposure of the
groups on the exfoliated layers of eGO.

34
Figure 1.17. TGA curves in N2 of the starting graphite oxide (L-GO) and of
the derived eGO after ball-milling.
The results of the elemental analysis and the BET measurements, reported
in Table 1.5, show that L-GO and eGO samples have similar C/O ratios and
largely different surface areas, 0.8 m2/g and 4.6 m2/g, respectively,
definitely lower than the value for G (308 m2/g).

35
Table 1.5. Results of elemental analysis on the starting graphite oxide (L-
GO) and of the derived eGO after ball-milling.a
Elemental composition (%wt.)
Sample SBET
(m2/g) C H N O S C/O
L-GO 0.8 63.7 0.6 0.1 33.7 1.9 1.9
eGO 4.2 66.1 0.5 0.1 31.4 1.9 2.1
aElemental composition of the anhydrous samples: water contents of
nearly 5 %wt. and 6 %wt. are evaluated by TGA for L-GO and eGO,
respectively.
The SEM images of L-GO in Figs 1.18A-B indicate that the oxidation of G
leads to dense aggregates of graphene oxide sheets (surface area largely
decreases from 308 m2/g to 0.8 m2/g). The mechanical exfoliation of L-GO
by ball-milling strongly reduced the dimension of the particles, providing
sub-micrometric aggregates of thin crumpled graphene oxide sheets,
stacked in a disordered manner (Figs 1.18C-D).[39]

36
Figure 1.18. SEM images of: (A,B) L-GO and (C,D) eGO at different
magnifications.
The high degree of exfoliation of eGO is also confirmed by the TEM images
in Fig. 1.19. Particularly, in Fig. 1.19B single graphene oxide layers are
clearly visible.
Fig. 1.19. TEM images of eGO at different magnifications: (A) 0.5 μm and
(B) 200 nm.

37
References
[1] B. Kwiecińska, H. I. Petersen. Int. J. Coal Geol. 2004, 57, 99– 116.
[2] A. W. Hull. Phys. Rev. 1917, 10, 661–696.
[3] J. D. Bernal. Proc. R. Soc. A 1924, 106, 749–773.
[4] M. Inagaki and F. Kang, Carbon Materials Science and Engineering:
from Fundamentals to Applications, Chapter 2, 36,2006.
[5] B. E. Warren. Phys. Rev. 1941, 59, 693–698.
[6] Z. Q. Li, C. J. Lu, Z. P. Xia, Y. Zhou, Z. Luo. Carbon 2007, 45, 1686–
1695
[7] A. Milev, M. Wilson, G. S. Kamali Kannangara, N. Tran. Mater.
Chem. Phys. 2008, 111, 346–350.
[8] J. Zhao, L. Yang, F. Li, R. Yu, C. Jin. Carbon 2009, 47, 744– 751.
[9] O. J. Guentert. J. Chem. Phys. 1962, 37, 884–891.
[10] R. E. Franklin. Acta Crystallogr. 1950, 3, 107–121.
[11] P. J. F. Harris. Interisciplinary Science Reviews 2001, 26, 204–210.
[12] M. J. Wang, C. A. Gray, S. A. Reznek, K. Mahmud, Y. Kutsovsky, Kirk-
Othmer Encyclopedia of Chemical Technology, 2003.
[13] S. Lijima. Nature 1991, 354, 56 – 58.
[14] M. Treacy, T. W. Ebbesen, J. M. Gibson. Nature 1996, 381, 678–680
[15] E. Flahaut, R. Bacsa, A. Peigney, C. Laurent. ChemComm 2003, 12
1442–1443.
[16] Cumings, J.; Zettl, A. (2000). "Low-Friction Nanoscale Linear Bearing
Realized from Multiwall Carbon Nanotubes".Science. 289 (5479): 602–604
[17] S. Babu, M. S. Seehr. Carbon 1996, 34, 1259–1265.
[18] O. J. Guentert, C. A. Klein. Appl. Phys. Lett. 1963, 2, 125–127
[19] C. N. Hooker, A. R. Ubbelohde, D. A. Young. Proc. R. Soc. London A
1965, 284, 17–31.
[20] A. Celzard, J. F. Marêché, G. Furdin, S. Puricelli. J. Phys. D: Appl.
Phys. 2000, 33, 3094–3101.
[21] M. Cardinali, L. Valentini, J. M. Kenny. J. Phys. Chem. C 2011, 115,
16652–16656.
[22] H. Fujimoto. Carbon 2003, 41, 1585–1592.

38
[23] Lavoro J phys chem…Mauro et al 2013
[24] B. C. Brodie. Philos. Trans. R. Soc. London 1859, 149, 249–259.
[25] D. R. Dreyer, R. S. Ruoff, C. W. Bielawski. Angew. Chem. Int. Ed. 2010,
49, 9336–9344.
[26] H. He, J. Klinowski, M. Forster, A. Lerf. Chem. Phys. Lett. 1998, 287,
53–56.
[27] J. Luo, L. J. Cote, V. C. Tung, A. T. Tan, P. E. Goins, J. Wu, J. Huang. J.
Am. Chem. Soc. 2010, 132, 17667–17669.
[28] D. R. Dreyer, C. W. Bielawski. Adv. Funct. Mater. 2012, 12, 3247–3253;
[29] A. D. Todd, C. W. Bielawski. Catal. Sci. Technol. 2013, 3,135–139; D. R.
Dreyer, S. Murali, Y. Zhu, R. S. Ruoff, C. W. Bielawski. J. Mater. Chem. 2011,
21, 3443–3447.
[30] Y. Si, E. T. Samulski. Nano Lett. 2008, 8, 1679–1682.
[31] K. Haubner, J. Morawski, P. Olk, L. M. Eng, C. Ziegler, B. Adolphi, E.
Jaehne. ChemPhysChem 2010, 10, 2131–2139.
[32] D. Chen, H. Zhu, T. Liu. Appl. Mater. Interface 2010, 2, 3702−3708.
[33] Z. J. Fan, W. Kai, J. Yan, T. Wie, L. J. Zhi, J. Feng, Y. M. Ren, L. P. Song, F.
Wei. ACS Nano 2011, 5, 191−198.
[34] S. Zhang, Y. Shao, H. Liao, M. H. Engelhard, G. Yin, Y. Lin.
ACS Nano 2011, 5, 1785−1791.
[35] J. Wang, X. Wang, C. Xu, M. Zhang, X. Shang. Polym. Int.2011, 60,
816−822.
[36] H. Kim, S. Kobayashi, M. A. AbdurRahim, M. J. Zhang, A.
Khusainova, M. A. Hillmyer. Polymer 2011, 52, 1837−1846.
[37] S. Ansari, E. P. Giannelis. J. Polym. Sci.: Part B 2009, 47, 888−889.
[38] I. Y. Jeon, Y. R. Shin, G. J. Sohn, H. J. Choi, S. Y. Bae, J. Mahmood, S.
M. Jung, J. M. Seo, M. J. Kim, D. W. Chang, L. Dai, J. B. Baek. PNAS 2012,
109, 5588–5593.
[39] M. Mauro, V. Cipolletti, M. Galimberti, P. Longo and G. Guerra. J. Phys.
Chem. C 2012, 116, 24809–24813.

39

40
Chapter 2
Experimental part:
Materials, Preparation Procedures and
Characterization techniques

41
2.1 Preparation of GO with Higher Content of Oxygenated Groups
A 2000 mL three-neck round bottomed flask was flushed with gaseous N2
and was then immersed into an ice bath.[1] 33 mL of nitric acid and 67 mL
of sulfuric acid were fed to the flask under nitrogen and were then stirred
obtaining a homogenous mixture. After introducing 5 g of graphite powder
under vigorous agitation, 42 g of potassium chlorate was then added very
slowly, to minimize the risk of explosion. The reaction mixture was stirred
for 120 h at room temperature. The resulting dark green suspension was
poured into a large amount of a 5 %wt. HCl aqueous solution.
Centrifugation was then performed at 10000 rpm for 15 min using a
Hermle Z 323 K centrifuge. The isolated GO powder was washed twice with
100 mL of a 5 %wt. HCl aqueous solution and subsequently with deionized
water. Finally, it was dried at 60 °C for 12 h in an oven.
2.2 Preparation of GO with Lower Content of Oxygenated Groups
120 mL of sulfuric acid and 2.5 g of sodium nitrate were introduced into a
2000 mL three-neck round bottomed flask immersed into an ice bath and 5
g of graphite were added, under nitrogen, with a magnetic stirring.[2] After
obtaining a uniform dispersion of graphite powder, 15 g of potassium
permanganate were added very slowly to minimize the risk of explosion.
The reaction mixture was thus heated to 35 °C and stirred for 24 h. The
resulting dark green slurry was first poured into a copious amount of
deionized water, and then centrifugated at 10000 rpm for 15 min with a
Hermle Z323 K centrifuge. The isolated GO powder was washed twice with
100 mL of a 5 %wt. HCl aqueous solution and subsequently with deionized
water. Finally, it was dried at 60 °C for 12 h in an oven.
2.3 Preparation of GOICs
Intercalates with 2HT, TPP and MUTP were prepared in analogy with the
procedure reported by Matsuo et al. for graphite oxide intercalation
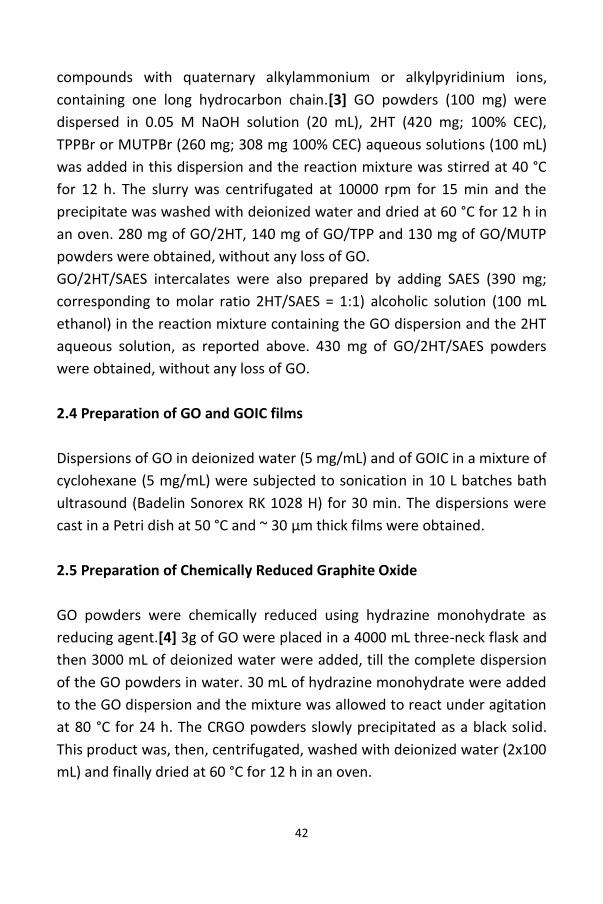
42
compounds with quaternary alkylammonium or alkylpyridinium ions,
containing one long hydrocarbon chain.[3] GO powders (100 mg) were
dispersed in 0.05 M NaOH solution (20 mL), 2HT (420 mg; 100% CEC),
TPPBr or MUTPBr (260 mg; 308 mg 100% CEC) aqueous solutions (100 mL)
was added in this dispersion and the reaction mixture was stirred at 40 °C
for 12 h. The slurry was centrifugated at 10000 rpm for 15 min and the
precipitate was washed with deionized water and dried at 60 °C for 12 h in
an oven. 280 mg of GO/2HT, 140 mg of GO/TPP and 130 mg of GO/MUTP
powders were obtained, without any loss of GO.
GO/2HT/SAES intercalates were also prepared by adding SAES (390 mg;
corresponding to molar ratio 2HT/SAES = 1:1) alcoholic solution (100 mL
ethanol) in the reaction mixture containing the GO dispersion and the 2HT
aqueous solution, as reported above. 430 mg of GO/2HT/SAES powders
were obtained, without any loss of GO.
2.4 Preparation of GO and GOIC films
Dispersions of GO in deionized water (5 mg/mL) and of GOIC in a mixture of
cyclohexane (5 mg/mL) were subjected to sonication in 10 L batches bath
ultrasound (Badelin Sonorex RK 1028 H) for 30 min. The dispersions were
cast in a Petri dish at 50 °C and ~ 30 μm thick films were obtained.
2.5 Preparation of Chemically Reduced Graphite Oxide
GO powders were chemically reduced using hydrazine monohydrate as
reducing agent.[4] 3g of GO were placed in a 4000 mL three-neck flask and
then 3000 mL of deionized water were added, till the complete dispersion
of the GO powders in water. 30 mL of hydrazine monohydrate were added
to the GO dispersion and the mixture was allowed to react under agitation
at 80 °C for 24 h. The CRGO powders slowly precipitated as a black solid.
This product was, then, centrifugated, washed with deionized water (2x100
mL) and finally dried at 60 °C for 12 h in an oven.
43
Chemical reduction of GO was also performed using ascorbic acid.[6] 0.5 g
of GO were placed in a 200 mL three-neck flask and then 50 mL of
deionized water were added, till the complete dispersion of the GO
powders in water. 0.5 g of ascorbic acid were added to the GO dispersion
and the mixture was allowed to react under agitation at 100 °C for 24 h.
The CRGO powders slowly precipitated as a black solid. This product was,
then, centrifugated, washed with deionized water and finally dried at 60 °C
for 12 h in an oven.
2.6 Graphite Oxide Exfoliation by Ball-Milling
GO powders were introduced in 125 mL ceramic jars (inner diameter of 75
mm) together with stainless steel balls (10 mm in diameter) and were dry-
milled in a planetary ball mill (Retsch GmbH 5657 Haan) for 2 h with a
milling speed of 500 rpm and a ball-to-powder mass ratio of 10 to 1.
2.7 GO paper preparation
GO and basified GO [5-9] aqueous dispersions were prepared from
graphite oxide powders (150 mg) in 20 mL of water and of 0.05 M NaOH
aqueous solution, respectively. Complete dispersions were obtained with
the aid of ultrasonication35 for 4 h at room temperature.
Both kinds of dispersions were processed by vacuum filtration 20 as well as
by casting in Petri dishes at 60 °C. By using these procedures GO and b-GO
papers with thickness in the range 10–70 mm were obtained. All the results
reported for GO paper refer to samples obtained by vacuum filtration,
because the cast samples are too brittle. Most of the results reported for b-
GO paper refer instead to cast samples, which present on the contrary
improved flexibility b-GO papers were washed by water and, to remove
Na+ ions, also by a 0.05 M HCl solution.
Robust b-GO papers have been obtained by using aqueous solutions with a
suitable range of NaOH concentration (0.01– 0.08 M).

44
2.8 Preparation of adducts of oxidized carbon black with ammonium ions
with long alkyl chains
oCB/1HT and oCB/2HT adducts have been prepared starting from oCB
samples with different O/C ratios. 200 mg of oCB powders were dispersed
in 0.05 M NaOH solution (40 mL) and 100 mL of 1HT or 2HT aqueous
solution (2mg/mL) was added in this dispersion and the reaction mixture
was stirred at 60° C for 1 h. The black slurry was centrifuged at 10,000 rpm
for 15 min and the precipitate was washed with deionized water and dried
at 60° C for 12 h in an oven. From oCB samples with 0.16, 0.37, 0.58 and
0.83 O/C weight ratios, 250, 290, 330 and 365 mg of oCB/2HT adducts
were obtained (without any loss of oCB), respectively. As for the oCB/1HT
adduct, 275 mg were obtained, starting from the oCB sample with
O/C=0.83.
Simple stoichiometric considerations show that, with oxidation level, the
ncation/nC ratio largely change (from 0.005 up to 0.033) while the ncation/nO
ratio remains essentially constant to 0.047+-0.005. This suggests that in the
considered preparation conditions only 4-5% of the bound oxygen atoms
leads to anion formation.
2.9 Oxidation of carbon blacks with different surface area
Oxidized Carbon Black samples (oCB) were prepared by Hummers’ method
[2]. About 6 g of all oCB samples were obtained. The obtained
Oxygen/Carbon weight ratio is 0.71 for graphite oxide while is 0.16, 0.37,
0.58 and 0.83 for oCB as obtained from CB samples with surface areas of
33, 77, 125 and 151 m2/g, respectively.
2.10 Wide Angle X-ray Diffraction
Wide-angle X-ray diffraction (WAXD) patterns were obtained by an
automatic Bruker D8 Advance diffractometer, in reflection, at 35 kV and 40
mA, using the nickel filtered Cu−Kα radiation (1.5418 Å). The d-spacings

45
were calculated using Bragg’s law and the observed integral breadths (βobs)
were determined by a fit with a Lorentzian function of the intensity
corrected diffraction patterns, according to the procedure described by
Iwashita et al.[10] The instrumental broadening (βinst) was also determined
by fitting of the Lorentzian function to line profiles of a standard silicon
powder 325 mesh (99%). For each observed reflection, the corrected
integral breadths were determined by subtracting the instrumental
broadening of the closest silicon reflection
from the observed integral breadths, β = βobs − βinst. The correlation lengths
(D) were determined using Scherrer’s equation(1).
D K
hk cos
hk hk
(1)
Where λ is the wavelength of the incident X-rays and θ the diffraction
angle, assuming the Scherrer constant K = 1.
Wide-angle X-ray diffraction measurements were also obtained by using a
cylindrical camera (radius = 57.3 mm). The WAXD patterns of films of GO
and GO compounds were recorded on a BAS-MS imaging plate (FUJIFILM)
and processed with a digital imaging reader (FUJIBAS 1800). In particular,
to recognize the kind of crystalline orientation present in films,
photographic X-ray diffraction patterns were taken by placing the film
sample parallel to the axis of the cylindrical camera and by sending the X-
ray beam parallel (EDGE measure) to the film surface.
The degree of the different kinds of uniplanar orientation of the crystallites
with respect to the film plane has been formalized on a quantitative
numerical basis using Hermans’ orientation functions, in analogy to that
one defined for the axial orientation:

46
( ) cos K 2 sin obs inst 2
D
(2)
by assuming cos χhkl2 as the squared average cosine value of the angle,
xhkl, between the normal to the film surface and the normal to the hkl
crystallographic plane.
Since, in our cases, a θhkl incidence of X-ray beam is used, the quantity cos
χhkl2 can be easily experimentally evaluated:
/ 2
2
I (hkl ) cos hkl sin hkl dhkl 2
cos 2
cos x 0
hkl hkl / 2
I (hkl ) sin hkl dhkl 0
(3)
where I(χhkl) is the intensity distribution of a hkl diffraction on the Debye
ring and χhkl is the azimuthal angle measured from the equator.
The diffracted intensities I(χhkl) of eq 3 were obtained by EDGE patterns, as
collected by using a cylindrical camera, by the azimuthal profile at a
constant 2θ value. Because the collection was performed at constant 2θ
values and in the equatorial geometry, the Lorentz and polarization
corrections were unnecessary.
In these assumptions, f hkl is equal to 1 and −0.5 if hkl planes of all
crystallites are perfectly parallel and perpendicular to the plane of the film,
respectively.
2.11 Fourier Trasform Infrared Spectroscopy
Fourier transform infrared spectra (FTIR) spectra in transmission mode
with 2.0 cm-1 resolution, were recorded with a BRUKER Vertex70
spectrometer equipped with a deuterated triglycine sulfate (DTGS)
detector and a KBr beam splitter. The powder specimens were diluted with

47
KBr of spectroscopic grade. The frequency scale was internally calibrated to
0.01 cm-1 with a He-Ne laser and the noise was reduced by signal
averaging 32 scans.
2.12 Differential Scanning Calorimetry
The differential scanning calorimetry (DSC) was carried out under nitrogen
in the suitable temperature range for each material at a heating or cooling
rate of 10 °C/min on a TA instruments DSC 2920. Two heating and one
cooling run were consecutively carried out in a cycle and the peak maxima
were considered as the transition temperatures.
2.13 Thermogravimetric Analysis
Thermogravimetric analysis (TGA) of the layered nanofillers was carried out
on a TG 209 F1, manufactured by Netzsch Geraetebau, from 20 to 800 °C,
at a heating rate of 10 °C, under N2 flow. TGA curves were also obtained
for scrambled rubber samples, Grubbs catalyst-functionalized graphene
oxides and grafted rubbers to graphene oxide sheets from 20 to 1000 °C, at
a heating rate of 10 °C, under air flow.
2.14 Elemental Analysis
Elemental analysis was performed with a Thermo FlashEA 1112 Series
CHNS-O analyzer, after pretreating samples in an oven at 100 °C for 12 h, in
order to remove the absorbed water.
2.15 BET Surface Area Measurements
Nitrogen adsorption at liquid nitrogen temperature (-196 °C) was used to
measure surface areas of the samples with a Nova Quantachrome 4200e
instrument. Before the adsorption measurement, clay and carbon-based
powders were degassed at 100 °C under nitrogen flow overnight to remove

48
water, while polymeric aerogels were degassed at 40 °C, in the same
conditions. The surface area values were determined by using 11-point
Braunauer-Emmett-Teller (BET) analysis.[11]
2.16 Scanning Electron Microscopy
The morphology of the samples was characterized by means of a scanning
electron microscope (SEM, Zeiss Evo50 equipped with an Oxford energy
dispersive X-ray detector). Low energy was used (5 keV) to obtain the
highest possible surface resolution. Before imaging, all specimens were
coated with gold using a VCR high resolution indirect ion-beam sputtering
system. The coating procedure was necessary to prevent surface charging
during measurement and to increase the image resolution.
2.17 Trasmission Electron Microscopy
TEM analysis on rubber nanocomposites was performed by Dr. Lucia
Conzatti at the CNR, Institute for Macomolecular Studies (ISMAC)-UOS
Genova with a Zeiss EM 900 microscope applying an accelerating voltage of
80 kV. Ultrathin sections (about 50 nm thick) of cross-linked specimens
were obtained by using a Leica EM FCS cryo-ultramicrotome equipped with
a diamond knife (sample temperature: –130 °C). Before the TEM analysis,
eGO samples were dispersed and sonicated in isopropanol, then 10 μL of
the dispersion were were deposited on Assing copper grids coated with
carbon film.
2.18 Back Titration of Graphite Oxides
The cation-exchange-capacity of the GO samples (CEC) was determined by
the back titration of sodium hydroxide solution (0.05 M, 50 ml) of GO (100
mg) by 0.05 M hydrochloric acid solution, according to the procedure
reported by Matsuo et al.[12]

49
References
[1] L. Staudenmaier. Ber. Dtsch. Chem. Ges. 1898, 31, 1481–1487.
[2] W. S. Hummers, R. E. Offeman. J. Am. Chem. Soc. 1958, 80, 1339.
[3] Y. Matsuo, T. Niwa, Y. Sugie. Carbon 1999, 37, 897–901.
[4] S. Stankovich, D. A. Dikin, R. D. Piner, K. A. Kohlhaas, A. Kleinhammes, Y.
Jia, Y. Wu, S. T. Nguyen, R. S. Ruoff. Carbon 2007, 45, 1558–1565.
[5] X. Fan, W. Peng, Y. Li, X. Li, S. Wang, G. Zhang and F. Zhang. Adv. Mater.
2008, 20, 4490–4493.
[6] D. Li, M. B. Miller, S. Giljie, R. B. Kaner and G. G. Wallace.
Nat. Nanotechnol. 2008, 3, 101–105.
[7] M. Mauro, M. Maggio, V. Cipolletti, M. Galimberti, P. Longo and G.
Guerra. Carbon 2013, 61, 395–403.
[8] C.-J. Kim, W. Khan and S.-Y. Park. Chem. Phys. Lett. 2011,
511, 110–115.
[9] M. Mauro, M. Maggio, A. Antonelli, M. R. Acocella and
G. Guerra. Chem. Mater. 2015, 27, 1590–1596.
[10] N. Iwashita, C. R. Park, H. Fujimoto, M. Shiraishi, M. Inagaki. Carbon
2004, 42, 701–714.
[11] S. Brunauer, P. H. Emmett , E. Teller. J. Am. Chem. Soc., 1938, 60, 309–
319.
[12] Y. Matsuo, T. Miyabe, T. Fukutsuka, Y. Sugie. Carbon 2007, 45, 1005–
1012.

50

51
Chapter 3
Intercalation Compounds of graphite oxide
A rich intercalation chemistry, both with organic ions, is possible, due to
the strong layers hydrophilicity of graphite oxide, [1-12].
All known graphite oxide intercalation compounds (GOIC) present poor
crystalline order, being generally limited to the distance between the
graphite oxide layers, which can largely increase (also up to 5 nm)
[5].These intercalated structures and their limited order are rather similar
to those observed for most clays with intercalated organic molecules (the
so called organoclays) [13-23].
In this work, we show the formation of GOIC exhibiting a long-range order
in the organization of the guest species in the interlayer space as well as a
large distance between graphite oxide sheets.
52
In particular, graphite oxide layers with a long-range in-plane order are
ionically bonded with cations, which exhibit a hexagonal rotator order in
the packing of their long hydrocarbon substituents. These ordered layered
structures are obtained provided that the cations contain at least two long
hydrocarbon tails. We also show that the intercalation of a second guest
species, exhibiting one or two long hydrocarbon tails, not only leads to a
further large increase of the interlayer spacing (from 3.4 nm up to nearly
5.8 nm, for guests with C18 alkyl chains) but also, surprisingly, improves
the order in the stacking of the layers as well as in the organization of the
hydrocarbon chains in the interlayer space.
3.1 Graphite Oxide Intercalation Compounds with long alkyl chains
ammoniun cations
Graphite Oxide intercalates with dimethyl ditalloyl ammonium (2HT) and
with 2-stearamidoethyl stearate (SAES) (Fig. 3.1) were prepared in analogy
with the procedure reported by Matsuo et al. for graphite oxide
intercalation compounds with quaternary ions, containing one long
hydrocarbon chain [23], by adding a basified GO dispersion to an aqueous
solution of the ammonium ions.
Figure 3.1. Molecular structures of ionic and polar compounds intercalated with
GO: dimethyl ditalloyl ammonium (2HT),2-stearamidoethyl stearate (SAES).

53
Measurements of the water loss by TGA and elemental analysis of the
desiccated GO powders indicate that the GO composition is
O0.47H0.2∙0.28H2O. On the basis of the guest weight uptake and
measurements of the water loss by TGA, the composition of GO/2HT and
GO/2HT/SAES intercalates has been evaluated as
CO0.47H0.2∙(C36H76N)0.059∙0.15H2Oand
CO0.47H0.2∙(C36H76N)0.059∙(C38H75O3N)0.057∙0.15H2O, respectively. The content
of 2HT guest ions in GO/2HT intercalates was 3.0 mmol/g GO, i.e. less than
one half of the maximum possible uptake, as calculated on the basis of the
cation exchange capacity. The content of the second polar guest (SAES) in
GO/2HT/SAES intercalates was 2.9 mmol/g GO, with a 2HT/SAES molar
ratio not far from 1/1. The above reported compositions correspond to a
molar ratio between carbon in the graphite oxide layers and alkyl chains of
the intercalated guest species (CGO/chains) of roughly 8/1 and 4/1, in
GO/2HT and GO/2HT/SAES intercalates, respectively.
3.2.1 Characterization of graphite intercalation compounds with
ammonium cations
The X-ray diffraction pattern of a graphite oxide powder, as obtained by
oxidation of graphite samples exhibiting high shape anisotropy [24-25],
shows a broad 001 peak corresponding to an interlayer distance of 0.84
nm, with a correlation length of 5.4 nm (Fig. 3.2A). The pattern of Fig. 3.2A
also shows narrow 100 and 110 peaks corresponding to a long-range order
in the graphitic planes (correlation length perpendicular to the 100 planes
higher than 30 nm). The X-ray diffraction pattern of a GOIC with ionically
bonded di(hydrogenated tallow)-dimethylammonium (2HT) is shown in Fig.
3.2B. This GOIC was prepared by first dispersing GO powder in a aqueous
solution of NaOH and by a further treatment with an aqueous solution of
dimethyl ditalloyl ammonium chloride (2HTCl).

54
Figure 3.2. X-ray diffraction patterns (CuKa) of the starting graphite oxide (A) and
of the derived GOIC, which includes the 2HT cation with two long hydrocarbon
chains (B) or 2HT and SAES (C). The symbols g and r indicate reflections relative to
the graphite oxide planes and to the hexagonal rotator order, respectively.
The pattern shows essentially unaltered 100 and 110 reflections, clearly
indicating the maintenance of the in-plane graphite oxide order. Moreover,
many narrow 00ℓ reflections (with ‘ up to 8) appear, which correspond to a
spacing between graphite oxide layers of 3.4 nm with a correlation length
increased up to 14 nm. The pattern of Fig. 3.2B also presents a reflection at
d = 0.42 nm, which suggests the occurrence of a hexagonal rotator order
[26-31] of the long hydrocarbon chains of the intercalated ammonium salt.
The broadness of this reflection indicates a correlation length of this
hexagonal rotator order in the interlayer space, in directions parallel to the
graphite oxide layers, close to 7 nm.
Surprisingly, the crystalline order of the obtained GOIC with 2HT can be
largely increased by adding a second guest species. In particular, by adding
polar molecules including long hydrocarbon chains, like e.g. 2-
stearamidoethyl stearate (SAES) or stearic acid (SA), the in-plane graphite
oxide order is maintained while all the other above described kinds of
55
order are improved. For instance, the X-ray diffraction pattern of the GO
sample of Fig. 3.2A, after treatment with 2HT and SAES, is reported in Fig.
3.2C. In this pattern, at least eleven 00ℓ reflections are present with an
increased correlation length (D = 42 nm) and with a largely increased
spacing (d = 5.8 nm). The intense and narrow diffraction peak at d = 0.42
nm, typical of hexagonal arrangements of long n-alkanes [26-31], indicates
an increase of the correlation length for the hexagonal rotator order (in the
direction parallel to the graphite oxide layers) from 7 nm up to 10 nm, as a
consequence of the addition of a second polar guest. These GOIC with
rotator order in the intercalated layers, lead to polycrystalline films
exhibiting macroscopic orientational order, by simple casting procedures.
For instance, X-ray diffraction patterns of films having a thickness of nearly
30 μm, as obtained by casting from aqueous suspensions of GO and of the
derived GO/2HT/SAES intercalate, are shown in Fig. 3A and B, respectively.
In particular, the EDGE patterns, i.e. photographic patterns taken with X-
ray beam parallel to the film surface, present intense (00ℓ) reflections on
the equatorial line (corresponding to the already described interlayer
distances of 0.84 nm and 5.8 nm for GO and GO/2HT/SAES in Fig. 3.3A and
B, respectively).

56
Figure 3.3. Photographic X-ray diffraction patterns (CuKa) of films cast from
aqueous suspensions of graphite oxide (A) and of the derived GOIC with 2HT and
SAES (B), as collected with the X-ray beam parallel to the film (EDGE patterns).
The hkl Miller indexes of the main reflections are indicated and the symbols g and
r discriminate 100 reflections relative to the graphite oxide planes and to the
rotator order, respectively.
As already described for GO [20], these diffraction data can be rationalized
by the orientation of the graphite oxide layers preferentially parallel to the
film plane. By using the procedure described in Chapter 6 , a degree of
parallelism of this plane with respect to the film surface has been
evaluated as f00l =0.85. As for the reflection at d = 0.42 nm in Fig. 3.3B, its
polarization along the meridian of the EDGE pattern is in agreement with
the assignment as
100 reflection of a hydrocarbon rotator order, nearly perpendicular to the
graphite oxide layers. Analogous results have been obtained for the
GO/2HT intercalate.
3.2.2 Structural reversibility of the graphite oxide intercalation
compounds with temperature
The presence of an hexagonal rotator order is clearly confirmed by
combined differential scanning calorimetry (DSC) and WAXD

57
measurements. For both GOIC of Fig. 3.2B and C, the DSC scans show an
irreversible first heating followed by reversible cooling and heating scans.
For instance, for the GOIC with 2HT (Fig. 3.4B), the first heating scan shows
an intense endothermic peak located at 42°C, while the subsequent cooling
and heating scans present exothermic and endothermic peaks at 25°C and
at 35°C, respectively (Fig. 3.4A).
Figure 3.4. DSC scans of the GOIC with 2HT: (dotted) first heating scan; (dashed)
cooling scan; (continuous) 2nd heating scan. (B) WAXD at RT, 50°C and at RT after
thermal treatments up to 100°C.
The WAXD patterns of the GO/2HT powder at room temperature, at 50°C
and at room temperature after treatment at 50°C, have been reported in
Fig. 3.4B. The pattern at 50°C shows that the endothermic phenomena of
Fig. 3.4A lead to the disappearance of the diffraction peak at d = 0.42 nm
and hence to the loss of the rotator order. Moreover, the pattern at 50°C
shows shifts of the 00ℓ reflections, indicating an increase of the interlayer
spacing from 3.4 nm to 4.0 nm. The pattern at room temperature of the

58
GOIC, after annealing at 50°C, shows a renewed reflection at d = 0.42 nm
as well as 00ℓ peaks corresponding to the former narrower periodicity (3.4
nm). This demonstrates, as already observed for other layered materials
intercalated with long hydrocarbon chain molecules[31], that both loss of
hexagonal rotator order and increase of the interlayer spacing are
thermally reversible. An analogous behavior has been observed for the
GO/2HT/SAES intercalate, with main crystallization and melting peaks of
the rotator phase being located at 88°C and 82°C, respectively.
3.2.3 Structure of the graphite oxide intercalation Compounds
The X-ray diffraction pattern of the GOIC of Fig. 2B presents a high
similarity with those of ordered intercalate structures obtained by self-
assembling of stearate ions in layered double hydrotalcite clay (LDH), in
which C18 chains form bilayer structure in the vertical direction and a
distorted hexagonal structure in the lateral direction, within the LDH
interlayer space.[32]
For the GOIC of Fig. 2B, an analogous structure with inclined bilayers is
here suggested (Fig. 3.5A and B). The tilt angle of these inclined bilayers
can be evaluated as a = 60°, on the basis of the basal spacing (d001 = 3.4
nm), by assuming that the thickness of the graphite oxide layer is close to
0.8 nm [1] , and that the length of two fully extended 2HT cations is 5.0
nm.

59
Figure 3.5. Schematic presentation of the crystalline structures of the GOIC with
the ammonium ion 2HT (A and B) or within additional polar guests with C18
hydrocarbon tails (C and D). The cylinders of the lateral views (A and C) indicate
hydrocarbon tails of the ammonium cation (blue) or of the additional polar guest
(purple). For the top views (B and D), ellipses and circles indicate hydrocarbon
chains inclined and perpendicular to the graphite oxide layers, respectively.
Moreover, dashed red lines show four adjacent hexagonal cells of GO while thick
black lines show the hexagonal rotator cell (in D) and the corresponding pseudo-
cell on a section parallel to the GO layers (in B). The definition of the alkyl chains
tilt angle a is shown in A.
For a = 60°, the surface occupied by eight graphite oxide unit cells (four are
indicated as dashed red lines in Fig. 3.5B) is nearly equal to the surface
occupied by a pseudo-cell of the rotator order, being parallel to the GO
planes (indicated as thick black lines in Fig. 3.5B). Hence, the intercalate
GO/2HT exhibits a CGO/chains molar ratio of nearly 8/1, in good
agreement with the molar ratio as independently evaluated by gravimetric
measurements. As for the more ordered GOIC of Fig. 3.5C including both
2HT and SAES guests, on the basis of the large interlayer spacing (5.8 nm),
analogous to those observed for cationic clays intercalated with

60
ammonium salts with C18 tails (6 nm) [43], a structure with perpendicular
bilayers can be suggested. In fact, the observed basal spacing is equal to
the sum of the periodicity of GO (≈0.8 nm) [24-30] and of the length of two
fully extended 2HT cations (≈5.0 nm) [40]. It is also worth adding that the
patterns of Fig. 3.2C and Fig. 3.3B present a clear odd–even effect for the
00ℓ reflections, with definitely more intense odd reflections. This
phenomenon can be easily rationalized on the basis of the model with
perpendicular alkyl chains (Fig. 3.5C). In fact, this model presents a
minimum of atomic density in the middle of the graphitic interlayer space,
due to non-bonded interactions between the tails of the long hydrocarbon
chains, being clearly consistent with the reduced intensity of the 00ℓ
reflections for ‘ even.
The basal planes of the hexagonal cells of the rotator order (ar = 0.42 nm,
thick black lines), and of GO (ag = 0.214 nm, dashed red lines) are
compared in Fig. 3.5D. A good fit between the two hexagonal cells, with ar
=2ag corresponding to four hexagonal cells of GO per one hexagonal cell of
the rotator order, is apparent and clearly indicates a molar ratio of
CGO/chains = 4/1. Again, the intercalate composition as derived by
structural considerations well agrees with the composition as derived by
gravimetric guest uptake.
It is worth adding that the observed long range hexagonal rotator order of
GOIC of Fig. 3.2C (D100r=10 nm) is possibly associated with this good fit
between the hexagonal cell bases of GO and of the hydrocarbon rotator
order. The two structures of Fig. 3.5 are also validated by density
considerations. In fact, an evaluation of the density in the interlayer space
provides a similar density for both intercalates (0.98 g/cm3) not far from
the value observed for crystalline polyethylene.

61
3.3 Graphite Oxide Intercalation and Exfoliation compounds with
Phosphonium ions.
Quaternary phosphonium salts constitute a new generation of efficient,
broad-spectrum, low-toxicity antiseptic, which has been proposed as active
compound for antibacterial materials. [33-34] Antibacterial materials based
on quaternary phosphonium salts, carried by clay minerals, have shown
long-acting antibacterial activity.[35-36] However, their application is
strongly limited by their bad dispersion in water.[37-38] This problem has
been overcome by preparation of phosphonium salt composites with
graphite oxide (GO),[39] which can lead to GO/ion compounds. [40] In fact,
it is well-known that the treatment of graphite with strong mineral acids
and oxidizing agents leads to graphite oxide (Hummers’ and Studenmaier’s
methods) whose layers exhibit a strong hydrophilicity and also a rich
intercalation chemistry with organic ions. [41-48] In particular, the
structural organization of compounds of GO with organic ions can largely
vary between regularly intercalated crystalline [41-47] to fully exfoliated
amorphous.[49-50]
To achieve a control of the release rate of ions in aqueous media for these
new antibacterial materials, a precise control of the molecular and
crystalline organization of the GO/phosphonium compounds is required. In
this work, procedures that are suitable to produce highly ordered graphite
oxide intercalation compounds (GOIC) or fully disordered graphite oxide
exfoliated compounds (GOEC), are reported. These limit intercalated and
exfoliated compounds are structurally characterized, and their largely
different ion release behaviors in neutral and acid aqueous solutions are
compared.
3.3.1 Intercalation compounds with quaternary phosphonium ions
Graphite oxide intercalation compounds with phosphonium ions are
prepared in analogy with the procedure reported by Matsuo et al. for
graphite oxide intercalation compounds with quaternary alkylammonium

62
ions. The molecular structures of the two phosphonium ionic compounds
used in this work, are reported in Fig. 3.6.
Figure 3.6. Molecular Structures of Tetraphenylphosphonium Bromide(TPPBr) and
11-Methoxy-11-oxo-undecyltriphenylphosphonium Bromide (MUTPBr).
The X-ray diffraction patterns of GOIC with ionically bonded TPP+ and
MUTP+ are shown in Fig. 3.7B,C, respectively. Both patterns show 100 and
110 reflections, clearly indicating the maintenance of in-plane graphite
oxide order. In particular, these reflections and hence the in-plane
graphitic order remain unaltered after transformation of GO in GOIC
compound with TPP+ (Fig. 3.7A,B). Moreover, few 00l reflections (with l up
to 3) appear, which correspond to increases of spacing between graphite
oxide layers from 0.84 nm up to 1.40 and 1.34 nm, as a consequence of
intercalation of TPP+ and MUTP+, respectively. The correlation length
perpendicular to the graphitic layers, as evaluated from the 001 reflection,
increases from 5.4 nm up 12 and 8 nm for GOIC with MUTP+ and TPP+,
respectively.

63
Figure 3.7. X-ray diffraction patterns (CuKα) of the starting graphite oxide (A) and
of the derived GOICs including phosphonium ions: TPP+ (B) or MUTP+ (C).
Differently from some recently described intercalates with ammonium ions
of GO [41],[51] and clays,[52] GOIC with MUTP+ does not show additional
order in the packing of its long hydrocarbon chains. The whole information
from the X-ray diffraction patterns of Fig. 3.7 indicates that similar
crystalline structures are obtained for both GOICs, with a higher structural
order for the compound including the symmetric TPP+ ion. These GOICs, by
simple casting procedures, lead to polycrystalline films exhibiting
macroscopic orientational order. For instance, X-ray diffraction patterns of
films having a thickness of nearly 50 μm, as obtained by casting from
aqueous suspensions of GO and of the derived GOIC with TPP+, are shown
in Fig. 3.8A,B, respectively. In particular, the EDGE patterns, i.e.,
photographic patterns taken with X-ray beam parallel to the film surface,
present intense (00ℓ) reflections on the equatorial line, corresponding to
the interlayer distances of 0.84 and 1.4 nm for GO and GOICs with TPP+, in
agreement with the powder diffraction patterns of Fig. 3.7A,B,
respectively. However, the THROUGH patterns, i.e., photographic patterns
taken with X-ray beam perpendicular to the film surface (not shown),
present uniform Debye rings, being intense for the in-plane 100 reflections.

64
As already described for GOIC with quaternary ammonium ions, [53] these
diffraction data can be rationalized by the orientation of the graphite oxide
layers preferentially parallel to the film plane. By using the procedure
described in the experimental section, a degree of parallelism of this plane
with respect to the film surface has been evaluated as f00ℓ ≈ 0.85 for both
GO and GOIC with TPP+.
Figure 3.8. Photographic X-ray diffraction patterns (CuKα) of films cast from
aqueous suspensions of graphite oxide (A) and of the derived GOIC with TPP+ (B).
The patterns have been collected with the X-ray beam parallel to the film. The hkl
Miller indexes of the main reflections are indicated.
3.3.2 Exfoliation compounds with quaternary phosphonium ions
The X-ray diffraction pattern of the GO as basified by the treatment with
NaOH solution is shown in Fig. 3.9A. It is clearly apparent that the 001 peak
of GO is replaced by a broad halo centered at d = 0.37 nm, clearly
indicating loss of order perpendicular to the graphite oxide layers.
However, the maintenance of the 100 and 110 peaks indicates
maintenance of the in-plane GO order and hence formation of exfoliated
GO layers.

65
The X-ray diffraction patterns of the compound of exfoliated GO with
ionically bonded TPP+ and MUTP+ are shown in Fig. 3.9B,C, respectively.
Both patterns are dominated by maintenance of the 100 and 110 GO peaks
as well as by the maintenance of a broad amorphous halo of the exfoliated
GO (3.9A), whose maximum is shifted from d = 0.37 nm to d ≈ 0.4 nm. For
both patterns a broad amorphous halo appears below 2θ ≈ 8°, which could
be possibly attributed to a minor amount (<10%) of GOIC crystallites with
very small correlation length perpendicular to the GO layers.
It is worth adding that GO compounds with phosphonium ions present a
crystalline order perpendicular to the GO layers being intermediate
between those of the presently reported GOIC and GOEC samples.
Figure 3.9. X-ray diffraction patterns (CuKα) of the exfoliated GO, as
obtained by basification (A), and of the exfoliated compounds with
phosphonium ions: TPP+ (B) or MUTP+ (C).

66
3.3.3 Structural Organization of GOIC and GOEC Compounds with TPP+.
Elemental analysis of the desiccated GO powders and measurements of the
water loss by TGA allow to evaluate the GO composition as
CO0.39H0.12·0.05H2O. Measurements of the guest weight uptake allow to
establish that the amount of TPP+ in both GOIC and GOEC is not far from
30 %wt. This value is much lower than the maximum possible uptake, as
calculated on the basis of the GO cation exchange capacity (72 %wt). The X-
ray diffraction data of Fig. 3.7 indicates that GOIC compounds with both
considered phosphonium ions exhibit a crystal structure with long-range
order only parallel and perpendicular to the GO layers. In particular, the
periodicity between the graphite oxide layers is close to 1.4 nm (Fig. 3.7B),
while a long-range order is maintained in the graphite oxide layers.
There is no evidence of order in the arrangement of the phosphonium ions
in the interlayer space, which are present in an amount close to one ion
per 18 graphitic carbons. Of course, in the interlayer space, beside the
phosphonium salt and water, also Na+ ions are present in an amount that,
on the basis of the evaluated CEC, subtracted by the amount of exchanged
phosphonium ions, is roughly equal to 11%wt and corresponding to one
Na+ ion per three graphitic carbons.
The crystalline structure of GOIC with TPP+ of Fig. 3.7B presents a density
value, calculated on the basis of the interlayer distance and elemental
analyses, close to 1.9 g/cm3, i.e., intermediate between the densities of the
corresponding GO (1.6 g/cm3) and of the starting graphite (2.3 g/cm3).

67
Figure 3.10. Schematic presentation of the crystalline structure of GOIC with TPP+
(ions shown as spheres): (A) lateral view, showing the distance between graphite
oxide layers; (B) top view, showing the average presence of one TPP+ ion per nine
graphitic unit cells (18 carbons). Schematic presentation of the exfoliated
structure of GOEC with TPP+ (A′).
This density value is, however, definitely higher than the values calculated
for the crystalline structures of GOIC with ammonium ions that exhibit long
hydrocarbon tails (in the range 1.0−1.1 g/cm3).
A schematic representation of the exfoliated compound with TPP+ is
shown in Fig. 3.10A′. The scheme shows that GO layers with ionically
bound phosphonium ions maintain only the in-plane order of the graphitic
carbons.

68
3.3.4 Spectroscopic characterization of GOIC and GOEC Compounds with
TPP+.
The FTIR spectra, in the range 2000−400 cm−1, of GOIC and GOEC
compounds with TPP+ have been compared with those of GO and TPPBr in
Fig. 3.11. The spectra show that many vibrational peaks of TPP+ are clearly
apparent both for GOIC and GOEC. In particular, a closer look to the peak
positions shows that most peaks are significantly red-shifted and that these
shifts are definitely higher for GOEC compound. For instance, the peak at
1485 cm−1 is shifted 3 cm−1 for GOIC and 11 cm−1 for GOEC, while the peak
at 694 cm−1 is shifted 6 cm−1 for GOIC and 10 cm−1 for GOEC. These shifts
are possibly due to the reduced confinement of TPP+ in the GO
compounds, with respect to TPPBr, which of course is strongly reduced for
the exfoliated compound. Also interesting are changes in the spectral
region 1800−1500 cm−1 that includes some relevant vibrations of GO. In
fact, the intense C C stretching peak at 1633 cm−1 is shifted down to 1625
cm−1 for GOIC. These data confirm the formation of GO compounds with
TPP+.

69
Figure 3.11. FTIR spectra of the starting graphite oxide (A), GOIC with TPP+ (B),
exfoliated GO (C), GOEC with TPP+ (D), and TPPBr (E). Filled circles indicate the
peaks of TPP+ in GOIC and GOEC samples.
70
3.3.5 Release of Organo-Phosphonium Ions in Aqueous Solutions from
GOIC and GOEC
The obtained GOIC and GOEC with TPP+ have been compared as for their
kinetics of release of the ionic antibacterial agent in aqueous solutions.
In particular, we have considered neutral (pH = 7 with 10 wt% of NaCl) and
acid (pH = 1.3, HCl 0.05 M) solutions with pH similar to those of human
stomach and colon, respectively. The amount of TPP+, as released from
GOIC (red curves) and GOEC (blue curves) in a neutral (circles) or in an acid
(triangles) solution, is plotted versus soaking time in Fig 3.12A. These
amounts have been evaluated by UV measurements in the spectral range
250−350 nm on the aqueous solutions. In particular, the UV spectra as
obtained after the soaking time of 82 h are compared in Fig 3.12C. The
data of Figure 6A clearly show that the release of the TPP+ ions in the
aqueous acid solution is complete both for GOIC (∼33 wt %) and GOEC
(∼27 wt %), after 70−80 h. In the neutral saline solution, the ion release is
only partial but still high from GOEC (∼12 wt %, after 82 h, i.e., nearly 44 wt
% of the TPP+ content) while poor for GOIC (∼4 wt %, i.e., nearly 12 wt %
of the TPP+ content). In the latter case, an equilibrium release value is
reached after nearly 70 h.
These desorption data can be rationalized on the basis of X-ray diffraction
characterization of the compound after the ion release tests, as compared
with those of the starting compounds (Fig. 3.13). The X-ray diffraction
patterns of GOIC and GOEC with TPP+ before and after ion release in
neutral and acidic aqueous solutions are plotted in Fig. 3.23a−c and d−f,
respectively.

71
Figure 3.12. TPP+ release from GOIC (red curves and symbols) and GOEC (blue
curves and symbols) in neutral saline (a,b; circles) or in acidic (c,d; pH = 1.3;
triangles) aqueous solutions: (A,B) kinetics of ion release versus soaking time,
expressed as percent content with respect to the GO compound (A) or as fraction
of the long-term release (B); (C) UV measurements, in the spectral range 250−350
nm, on the aqueous solutions after 82 h of soaking time.
All patterns of Fig. 3.13 maintain unaltered the 100 and 110 (the latter not
shown) peaks, indicating the maintenance of the in-plane graphitic order,
independently on the GO/TPP+ compound as well as of the considered ion
release conditions. As for GOIC, the minor ion release in neutral saline
water does not alter the crystalline order (cf. Fig 3.13 a,b), with only a
broadening of the 00l reflections. In particular, the broadening of the 001
reflection indicates a decrease of the correlation length perpendicular to
the graphene layers from 12 nm down to 9 nm. The X-ray diffraction
pattern of GOIC sample after complete ion release in acidic water (Fig.
3.13c) shows instead a replacement of the 00l peaks by a broad peak being
located at 2θ ≈ 12.5°, possibly corresponding to the packing of few layers
of GO (with a periodicity of d = 0.709 nm and a correlation length of 2.6
nm). A broader and weaker halo with its maximum roughly located at 2θ ≈

72
20.5° (d = 0.43 nm) is also present (Fig. 3.13c), possibly indicating the
presence of a minor amount of exfoliated GO.
Hence, the pH sensitive ion release from GOIC (red curves in Fig. 3.12A) is
due to the stability of its crystalline structure in neutral solutions and its
complete destruction in acid solution, due to the progressive exchange of
phosphonium ions with protons. As for GOEC, the ion release in neutral
saline water leads only to minor changes in the X-ray diffraction patterns
(Fig. 3.13d,e). In particular, two broad halos located at 2θ ≈ 6.4° and 13.6°,
already present in the pattern of GOEC (Fig. 3.13d) become more intense
after TPP+ release in saline water (Fig. 3.13e).
This suggests that the ion exchange in the saline water favors the
transformation of a minor amount of GOEC in the thermodynamically more
stable GOIC, although with a correlation length lower than 3 nm. The X-ray
diffraction pattern of GOEC sample after complete ion release in acidic
water (Fig. 3.13) shows instead only a broad halo being roughly centered at
2θ ≈ 26.5°, corresponding to fully exfoliated graphite. This indicates that
long-term treatments of GOEC in the acid aqueous environment leads to a
substantial reduction of the graphene oxide layers to graphene layers. [53-
54]
Also informative is a closer look to the release kinetics of Fig. 3.12A, as
obtained by plotting the data as a fraction of the long-term release versus
the soaking time (Figure 6B). For the faster kinetics of ion release in the
acidic solution, an enlargement of the first few hours is also shown as inset
of Figure 6B. It is apparent that, as expected, the release kinetics are faster
for GOEC than for GOIC. Moreover, for GOIC both in neutral (curve a in Fig.
3.12A) and acidic (curve d in the inset of Fig. 3.12B) aqueous solutions, the
ion release is linear with time, for hours. This ion release being linear with
time (generally indicated as zero order release) [54-56] can be possibly
rationalized by water diffusion in GOIC behind a sharp front separating
swollen and unpenetrated solid.[56][57]

73
Fig 3.13. X-ray diffraction patterns (CuKα) of GOIC (a−c) and GOEC (d−f) with TPP+
before (a,d) and after partial ion release in neutral aqueous solutions (b,e) or
complete ion release in acidic aqueous solutions (c,f). The 100 graphitic reflection
is maintained for all samples.
Conclusions
Starting from GO, graphite oxide intercalation compounds (GOIC) with
bulky guest molecules and with large interlayer spacing, which exhibit a
high crystalline order in the interlayer space, have been obtained. In
particular, intercalation in the interlayer space of ionic guest molecules
with two long hydrocarbon tails leads to an increase of the interlayer
spacing up to 3.4 nm, moreover the inclusion in the interlayer space of an
additional guest molecule, being polar and also including one or two long

74
hydrocarbon chains, leads to additional increase of the interlayer spacing
(up to 5.8 nm) and of the crystalline order. Besides the increase of the
spacing, the presence of an hexagonal rotator order of the intercalated
hydrocarbon chains, and its reversibility with temperature, are clearly
confirmed by combined differential scanning calorimetry (DSC) and WAXD
measurements.
Preparation procedures suitable to produce highly ordered graphite oxide
intercalation compounds (GOIC) or fully disordered graphite oxide
exfoliated compounds (GOEC) have been described, for two different
quaternary phosphonium salts too. Intercalated compounds were prepared
by using the same procedure for GOIC with ammonium salts, while
exfoliated compounds were prepared by exfoliation of GO powders in
NaOH aqueous solutions, followed by treatment of the exfoliated GO
powders with the organic salt.
The two prepared GOICs exhibit a similar crystalline structure, with long-
range order only parallel and perpendicular to the GO layers, with no
evidence of order in
the arrangement of the phosphonium ions in the interlayer space. By
simple casting procedures, macroscopic films with
high degree of uniplanar orientation of GOIC crystallites have also been
obtained.
Finally, their kinetics of release of the ionic antibacterial agent. The
obtained results indicate that, by controlling the crystalline structure of the
GO compounds, it is possible to control the release kinetics of cations in
water. For neutral saline solutions, the ion release is only partial and much
lower for GOIC than for GOEC. For acid solutions, for pH close to that one
of the human stomach, the ion release becomes complete for both GOIC
and GOEC (close to 30 wt %). For GOIC, the ion release in both
environments is constant with time, at least for release lower than 40 wt
%, i.e., it can be described in terms of zero order kinetics. Hence, GOICs
exhibit pH sensitive cation release, with zero order kinetics, which could be
helpful for applications requiring triggered and constant supply of active
ions.

75
References
[1] Y. Matsuo, T. Niwa, Y. Sugie. Carbon 1999, 37, 897–901.
[2] I. Dekany, R. Kruger-Grasser, A. Weiss. Colloid. Polym. Sci. 1998, 276,
570–6.
[3] Y. Matsuo, K. Hatase, Y. Sugie. Chem. Lett. 1999, 12, 1109–10.
[4] Z. Liu, Z. M. Wang, X. Yang, K. Ooi. Langmuir 2002, 18, 4926–32.
[5] Y. Matsuo, Miyabe T, Fukutsuka T, Sugie Y. Carbon 2007, 45, 1005–12.
[6] S. Stankovich, D.A. Dikin, O.C. Compton, G.H.B. Dommet, R.S. Ruoff,
S.B.T. Nguyen. Chem. Mater. 2010, 22, 4153–7.
[7] K. Zhang, L. Mao, L.L. Zhang, H.S.O. Chan, X.S. Zhao, J. Wu. J. Mater.
Chem. 2011, 21, 7302–7.
[8] Acik M, Dreyer DR, Bielawski CW, Chabal YJ. J Phys Chem C
2012;116:7867–73.]
[9] R. Bissessur, S.F. Scully. Solid State Ionics 2007, 178, 877–82.
[10] H. Bai, C. Li, X. Wang, G. Shi. J. Phys. Chem. C 2011, 115, 5545–51.
[11] T.N. Blanton, D. Majumda. Powder Diffr. 2012, 27, 104–7.
[12] Y. Okahata, A. Shimizu. Langmuir 1989, 5, 954–9.
[13] R.A. Vaia, R.K. Teukolasky, E.P. Giannelis. Chem. Mater. 1994, 6, 1017–
22.
[14] P. Beaudot, M.E. De Roy, J.P. Besse. Chem. Mater. 2004, 16, 935–45.
[15] M.A. Osman, M. Ploetze, P. Skrabal. J. Phys. Chem. B 2004, 108, 2580–
8.
[16] L.Y. Wang, G.Q. Wu, D.G. Evans. Mater. Chem. Phys. 2007, 104, 133–
40.
[17] M. Galimberti, A. Lostritto, A. Spatola, G. Guerra. Chem. Mater. 2007,
19, 2495–9.
[18] F. Kooli. Langmuir 2009, 25, 724–30.
[19] M. Galimberti, S. Senatore, L. Conzatti, G. Costa, G. Giuliano, G.
Guerra. Polym. Adv. Technol. 2009, 20, 135–42.
[20] M. Galimberti, S. Giudice, V. Cipolletti, G. Guerra. Polym. Adv.
Technol. 2010, 21, 679–84.
[21] M. Kajino, T. Saito, M. Okamoto, H. Sato, Y. Ozaki.

76
Appl. Clay. Sci. 2010, 48, 73–80.
[22] A. Das, K.W. Stockelhuber, R. Jurk, D. Jehnichen, G. Heinrich. Appl.
Clay. Sci. 2011, 51, 117–25
[23] S. Babu, M.S. Seehra. Carbon 1996, 34, 1259–65.
[24] M. Mauro, V. Cipolletti, M. Galimberti, P. Longo, G. Guerra. J. Phys.
Chem. C 2012, 116, 24809–13.
[25] S.Y. Chazhengina, E.N. Kotelnikova, I.V. Filippova, S.K. Filatov. J. Mol.
Struct. 2003, 647, 243–57.
[26] M. Dirand, Z. Achour-Boudjema. J. Mol. Struct. 1996, 375, 243–8.
[27] V. Chevallier, D. Petitjean, M. Bouroukba, M. Dirand. Polymer 1999,
40, 2129–37.
[28] Fu D, Liu Y, Su Y, Liu G, Wang D. J Phys Chem B 2011;115:4632–8.
[29] D. Fu, Y. Liu, G. Liu, Y. Su, D. Wang. Phys. Chem. Chem. Phys. 2011, 13,
15031–6.
[30] G. Ungar, N. Masic. J. Phys. Chem. 1985, 89, 1036–42.
[31] Y. Ide, M. Ogawa. J. Colloid. Interface. Sci. 2006, 296, 141–9.
[32] T. Itoh, N. Ohta, T. Shichi, T. Yui, K. Takagi. Langmuir 2003, 19, 9120–6.
[33] L.Z. Zhang, J.C. Yu, H.Y. Yip, Q. Li, K.W. Kwong,; W. Xu, P. K. Wong.
Langmuir 2003, 19, 10372−10380.
[34] Ohashi, F.; Ueda, S.; Taguri, T.; Kawachi, S.; Abe, H. Appl. ClaySci. 2009,
46, 296−299.
[35] P. Herrera, R.C. Burghardt, T.D. Phillips. Vet. Microbiol. 2000, 74,
259−272.
[36] X. Cai, S.Z. Tan, M.H. Liao, T. Wu, R.F. Liu, B. J. Yu. Cent.South Univ.
Technol. 2010, 17, 485−491.
[37] G. Ramorino, F. Bignotti, S. Pandini, T. Ricco. Compos. Sci. Technol.
2009, 69, 1206−1211.
[38] J.W. Rhim, S.I. Hong, C.S. Ha. LWT-Food Sci. Technol. 2009, 42,
612−617.
[39] X. Cai, S. Tan, M. Lin, A. Xie, W. Mai, X. Zhang, Z. Lin, T. Wu, Y. Liu.
Langmuir 2011, 27, 7828−7835.
[40] A.G. Xie, X. Cai, M.S. Lin, T. Wu, X.J. Zhang, Z.D. Lin, S. Tan. Mater. Sci.
Eng. B 2011, 176, 1222−1226.

77
[41] Y. Matsuo, T. Niwa, Y. Sugie. Carbon 1999, 37, 897−901.
[42] Y. Matsuo, K. Hatase, Y. Sugie. Chem. Lett. 1999, 1109−1110.
[43] Z.M. Liu, Y. Wang, X. Yang, K. Ooi. Langmuir 2002, 18,
4926−4932.
[44] C. Nethravathi, M. Rajamathi. Carbon 2006, 44, 2635−2641.
[45] Y. Matsuo, T. Miyabe, T. Fukutsuka, Y. Sugie. Carbon 2007, 45,
1005−1012.
[46] S. Stankovich, D.A. Dikin, O.C. Compton, G. H. B. Dommett, R.S. Ruoff,
S.T. Nguyen. Chem. Mater. 2010, 22, 4153−4157.
[47] K. Zhang, L. Mao, L.L. Zhang, H.S.O. Chan, Zhao, X. S. J. Wu. J. Mater.
Chem. 2011, 21, 7302−7307.
[48] M. Acik, D.R. Dreyer, C.W. Bielawski, Y.J. Chabal. J. Phys. Chem. C 2012,
116, 7867−7873.
[49] P. K. Ang, S. Wang, Q. Bao, J.T. Thong, K.P. Loh. ACS
Nano 2009, 3, 3587−3594.
[50] M. Mauro, M. Maggio, V. Cipolletti, M. Galimberti, P. Longo, G.
Guerra. Carbon 2013, 61, 395−403.
[51] V. Cipolletti, M. Galimberti, M. Mauro, G. Guerra. Appl. Clay Sci. 2014,
87, 179−188.
[52] Z. Bo, X. Shuai, S. Mao, H. Yang, J. Qian, J. Chen, J. Yan, K. Cen. Sci. Rep.
2014, 4, 4684.
[53] J. Zhang, H. Yang, G. Shen, P. Cheng, J. Zhang, S. Guo.
Chem. Commun. 2010, 46, 1112−1114.
[54] H. Liu, S. Farrell, K.J. Uhrich. Controlled Release 2000, 68, 167−174.
[55] L. Perioli, T. Posati, M. Nocchetti, F. Bellezza, U. Costantino, A.
Cipiciani. Appl. Clay Sci. 2011, 53, 374−378.
[56] N.L. Thomas, A.H. Windle. Polymer 1982, 23, 529−542.
[57] M. Mauro, M. Maggio, A. Antonelli, M.R. Acocella, G. Guerra. Chem.
Mater. 2015, 27, 1590-6.

78

79
CHAPTER 4
Carbon Black Oxide and Carbon black oxide adducts
with organic ammonium ions
Oxidation studies on carbon black (CB) show that the degree of oxidation
largely increases with initial BET surface areas. WAXD patterns suggest that
oCB samples are mainly constituted by a disordered spatial arrangement of
highly defective graphene oxide structural layers, with short in-plane
correlation length (2–3 nm). This is confirmed by the ability of oCB to form
ordered intercalation compounds, as for the first time reported here. In
fact, tetraalkylammonium cations in which two of the alkyl groups possess
long hydrocarbon tails (2HT) are able to induce formation of intercalate
crystalline structures not only by ion exchange in ordered GO crystals but
also by self-assembling with small and disordered oCB layers.

80
4.1 Preparation, Composition and Surface Areas of Carbon Black Oxide
Samples
Four commercial carbon black samples, exhibiting largely different BET
surface areas (in the range 33-151 m2/g), have been oxidized according to
the procedure described in Chapter 2. The oxygen content largely increases
with the initial BET values, as shown by increase of the O/C weight ratio as
evaluated by elemental analysis (Table 4.1 and Fig. 4.1, left scale).
TABLE 4.1 Elemental analysis of oxidized carbon black (oCB) and of
graphite oxide and graphene oxide samples.a
Sample C
(wt%)
H
(wt%)
O
(wt%)
S
(wt%) O/C
oCB(SACB= 33
m2/g)
85.9 0.2 13.7 <0.2 0.16
oCB(SACB= 77
m2/g)
70.2 0.8 26.0 2.7 0.37
oCB(SACB= 125
m2/g)
60.3 1.65 35.0 2.8 0.58
oCB(SACB= 151
m2/g)
50.3 2.3 41.7 5.4 0.83
Graphene oxide 59.4 0.6 37.1 2.6 0.62
Graphite oxide 56.1 1.2 39.8 2.7 0.71
a Elemental composition of anhydrous samples: The error in C and O
content is close to 1wt% while the error in H content is close to 0,1 wt%;
water contents (as evaluated by TGA, after equilibration at room
temperature in air with a relative humidity of 45%) was in the range 10-15
wt%, for all the examined samples.
For the sake of comparison, the elemental analyses of a graphite oxide
(GO) sample, as obtained by the same oxidation procedure from a high-
surface-area (330 m2/g) graphite, as well as of this GO sample after 24 h of
ball milling (exfoliated GO, eGO) are also reported in Table 1. It is apparent

81
that comparable degrees of oxidation are achieved for high surface area
carbon black and graphite samples.
Figure 4.1. O/C weight ratio (left scale, black squares) and weight loss at 800°C in
TGA scans (right scale, blue triangles) of the oxidized CB samples, versus the BET
surface area of the starting CB samples.
Differences in oxidation behavior of CB samples exhibiting different BET
values is also clearly shown by TGA scans, like those shown in Fig. 4.2 The
weight loss largely increases with the oCB oxygen content and, hence, with
the initial BET surface area. This is shown, for instance, by the weight loss
at 800°C as taken from TGA scans of Fig. 4.2, which is reported versus the
BET surface area of the initial CB samples in Fig. 4.1 (right scale).
TGA scans of GO and eGO samples, as obtained by the same oxidation
procedure, are also shown in Fig 4.2. It is apparent that oCB, GO and eGO
samples, for similar O/C ratios, present similar TGA losses. However, for GO
and eGO samples the main weight loss phenomenon is split in two steps,
rather than continuous, as for oCB samples. This is possibly more clearly
shown by the DTGA scans of Fig. 4.2B.

82
Figure 4.2 TGA scans at 20K/min, after drying at 100°C in the TGA apparatus, of
oCB and GO and eGO samples: (A) TGA; (B) DTGA. Close to each curve, their O/C
weight ratio is indicated.
Although elemental analyses and TGA scans suggest similar oxidation
behaviors of graphite and carbon black, large differences in reactivity of
the obtained oxygenated functional groups are clearly pointed out by DSC
scans (Fig. 4.3). All samples show an endothermic peak, whose intensity

83
increases with the degree of oxidation, which is centered in the
temperature range 105-130°C, with a Hendo which increases with the O/C
ratios up to 250-300 J/g. This endothermic peak is possibly mainly
associated with removal of intercalated water.[27-31] DSC behavior is,
however, completely different at higher temperatures. In fact, oCB samples
present broad endothermic phenomena, with multiple peaks. In particular,
the maximum Hendo value for the whole broad endothermic phenomenon
(close to 490 J/g) is observed for the most oxidized oCB sample (O/C=0.83).
DSC scans of GO and eGO samples, on the contrary and in agreement with
several literature reports, [27-31] exhibit intense exothermic peaks in the
temperature region 170°C-220°C, with large enthalpy changes (Hexo = 895
J/g and 460 J/g, for GO and eGO, respectively).
Figure 4.3 DSC scans at 10°C/min of GO, eGO and oCB samples. Close to each
curve, their O/C weight ratio is indicated.

84
The chemical origin of the GO exothermic peak has not yet received full
explanation in the literature. However, it is well established that the
intense exothermic peak is associated with a dramatic mass loss, mainly
due to loss of CO2 and H2O.[27-31]
We add here some simple thermodynamic considerations, relative to
possible dehydration and decarboxylation reactions leading to double bond
formations. These reactions, in fact, are endothermal when lead to
isolated or even conjugated double bonds while become exothermal only
when also lead to aromatization.
The prevalence of endothermal phenomena for oCB can be possibly
rationalized by prevalence of dehydration and decarboxylations reactions,
which do not lead to aromatization.
Figure 4.4 FTIR spectra of CB (a), oCB (b-e), graphite oxide (f) and graphene oxide
(g) samples, in different spectral ranges: (A) 2000-400 cm-1; (B) 1400-700 cm-1
(only for spectra e and f). In A, close to each curve of oxidized samples, their O/C
weight ratio is indicated.
The different oxidation degree for the prepared oCB samples clearly
appears also from FTIR spectra (Fig. 4.4). In particular, as O/C ratio
increases, the carboxylic 1718 cm-1 peak consistently increases. Moreover,

85
with increasing oxygen content, many vibrational peaks appear in the
1300-900 cm-1 range (mainly referring to C-O stretching of ether, epoxy,
alcoholic and carboxylic groups) as well as two well defined peaks at 885
and 849 cm-1 assigned to the asymmetric stretching and deformation
vibrations of epoxy groups respectively and a 575 cm-1 peak which could be
possibly attributed to peroxides. [32] FTIR spectra of oCB, for O/C weight
ratio higher than 0.5 (e.g. Fig. 4.4d,e), are very similar to each other.
However, they are definitely different from those of graphite oxide
samples obtained by oxidation of different kinds of graphites (e.g., Fig.
4.4f) as well as of graphene oxide samples (by mechanical milling [33] of
graphite oxide, Fig. 4.4g). Spectral differences between oCB and GO
samples are more clearly pointed out in Fig. 4.4B. This more detailed
comparison shows that most vibrational peaks are better defined in oCB
while some peaks also become more intense. The presence for oCB of well
defined vibrational peaks located at 1320, 1169, 849 cm-1 and 1008 cm-1
indicate the occurrence of an increased fraction of epoxy groups and ether
(furan type) groups [32], respectively. Moreover, the well defined
vibrational peak located at 1069 cm-1 reveals the contribution of an
increased amount of sulfonic group [34,35].
WAXD patterns (CuK) of the considered CB samples and of the
corresponding oCB samples are compared in Fig. 4.5.

86
Figure 4.5 (A) X-ray diffraction patterns of CB samples with different BET surface
areas, before (black curves) and after the oxidation procedure (red curves). Close
to each couple of patterns the starting BET value and the final O/C weight ratios
are indicated. (B,C) Enlarged X-ray diffraction patterns of CB with SBET = 151 m2/g
and of the corresponding oCB with O/C=0.85, for different 2θ ranges: (B) 15°-35°;
(C) 38°-100°.
All carbon black samples present very similar diffraction patterns (black in
Fig. 4.5), with broad diffraction halos. However, with increasing the CB
surface area, the maximum of the more intense diffraction halo is slightly
shifted (from 0.358 nm up to 0.368 nm, Fig. 4.5A), thus indicating a
corresponding slight increase of average distances between scattering
atoms. WAXD patterns of CB samples also present two minor halos
centered, independently of the CB surface areas, at 0.21 and 0.12 nm (Fig.
4.5C), corresponding to 100 and 110 in-plane graphite reflections. [36-40]
The broadness of the 100 and 110 reflections of the used carbon black
indicate correlation lengths in the range 2.1-2.3 nm, which are definitely
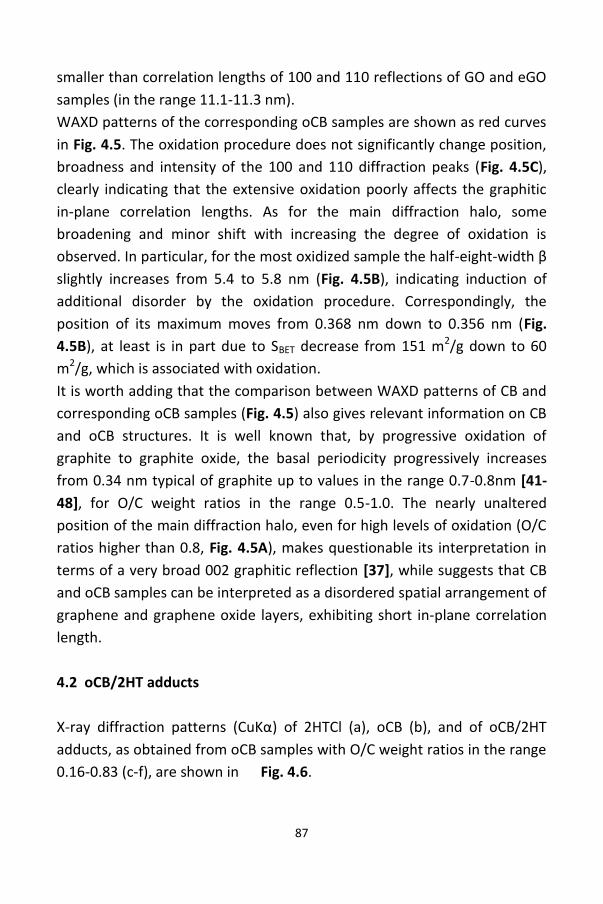
87
smaller than correlation lengths of 100 and 110 reflections of GO and eGO
samples (in the range 11.1-11.3 nm).
WAXD patterns of the corresponding oCB samples are shown as red curves
in Fig. 4.5. The oxidation procedure does not significantly change position,
broadness and intensity of the 100 and 110 diffraction peaks (Fig. 4.5C),
clearly indicating that the extensive oxidation poorly affects the graphitic
in-plane correlation lengths. As for the main diffraction halo, some
broadening and minor shift with increasing the degree of oxidation is
observed. In particular, for the most oxidized sample the half-eight-width β
slightly increases from 5.4 to 5.8 nm (Fig. 4.5B), indicating induction of
additional disorder by the oxidation procedure. Correspondingly, the
position of its maximum moves from 0.368 nm down to 0.356 nm (Fig.
4.5B), at least is in part due to SBET decrease from 151 m2/g down to 60
m2/g, which is associated with oxidation.
It is worth adding that the comparison between WAXD patterns of CB and
corresponding oCB samples (Fig. 4.5) also gives relevant information on CB
and oCB structures. It is well known that, by progressive oxidation of
graphite to graphite oxide, the basal periodicity progressively increases
from 0.34 nm typical of graphite up to values in the range 0.7-0.8nm [41-
48], for O/C weight ratios in the range 0.5-1.0. The nearly unaltered
position of the main diffraction halo, even for high levels of oxidation (O/C
ratios higher than 0.8, Fig. 4.5A), makes questionable its interpretation in
terms of a very broad 002 graphitic reflection [37], while suggests that CB
and oCB samples can be interpreted as a disordered spatial arrangement of
graphene and graphene oxide layers, exhibiting short in-plane correlation
length.
4.2 oCB/2HT adducts
X-ray diffraction patterns (CuKα) of 2HTCl (a), oCB (b), and of oCB/2HT
adducts, as obtained from oCB samples with O/C weight ratios in the range
0.16-0.83 (c-f), are shown in Fig. 4.6.

88
The patterns of Fig. 4.6c-f show that, for O/C ratio ≈ 0.45, well defined
diffraction peaks appear: at d = 4.8 nm (inset B of Fig. 4.6), d = 1.6 nm and
d = 0.94 nm (inset C of Fig 4.6). These peaks can be rationalized as 001, 003
and 005 reflections of an oCB/2HT intercalate structure and clearly suggest
that the shoulder appearing at d = 2.4 nm (indicated by a red arrow in Fig.
4.6A) can be attributed to the corresponding 002 reflection. This shows a
clear odd-even effect for the 00l reflections, with definitely more intense
odd reflections. The observed periodicity of 4.8 nm, being definitely higher
than the 001 periodicity of the 2HTCl salt (3.3 nm, Fig. 4.6a), and the
disappearance of all diffraction peaks of this salt clearly indicate the adduct
formation.
Patterns b-f of Fig 4.6 also show that, as O/C ratio increases, a broad
diffraction peak centered at d = 0.42 nm appears and increases its intensity
while the main carbon black amorphous halo progressively reduces its
intensity. This peak can be rationalized by the formation of a hexagonal
hydrocarbon rotator order, analogous to those formed in intercalate
compounds of surfactants, exhibiting long hydrocarbon chains, with
graphene oxide [21] (Fig. 4.6g) as well as with organoclays [22-25].

89
Figure 4.6. X-ray diffraction patterns of : a) 2HT; b) one of the prepared oCB
sample; c-f) oCB/2HT adducts, as obtained from oCB samples with different O/C
molar ratios: 0.16 (c), 0.37 (d), 0.58 (e), 0.83 (f); g) (graphene oxide)/2HT adduct.
Insets B and C show enlarged patterns for 2θ ranges 1.4°-3.5° and 8°-16°,
respectively. The inset D shows an enlarged f pattern, for 2θ range 10°-37°, with
intensity contributions from rotator phase (dashed line) and from residual
amorphous carbon (dotted line).
The large spacing observed for oCB/2HT intercalates (4.8 nm), suggests an
orientation of the ion hydrocarbon tails being nearly perpendicular with
respect to the graphitic layers, as shown in Fig. 4.7. This hypothesis is
confirmed by the well-defined odd-even effect for the 00l reflections, with
definitely more intense odd reflections (Fig. 4.6d-f). In fact, this feature can
be rationalized by the minimum of atomic density in the middle of the
graphitic interlayer space of the intercalate (lateral view of Fig 4.7), due to
non-bonded interactions between tails of the hydrocarbon chains.

90
Figure 4.7. Schematic lateral and top views of the proposed crystalline structure
of the oCB/2HT intercalate. Red cylinders and circles indicate hydrocarbon tails of
the ammonium cation, for lateral and top view, respectively. In the top view,
bases of hexagonal unit cells of graphite (yellow rhombus) and of the hydrocarbon
rotator order (green rhombus) and dotted lines representing 100 crystal planes of
graphite (d = 0.21 nm) and of the rotator order (d ≈ 0.42 nm).
The intercalate crystal structure of Fig. 4.7 is possibly stabilized by the good
fit between the bases of the hexagonal unit cells of graphitic layers (with 2
carbon atoms and d100 = 0.21 nm) and of the rotator order (with 1
hydrocarbon tail and d100 ≈ 0.42 nm), as shown in the top view of Fig. 4.7.
This intercalate structure hence exhibits 1 hydrocarbon tail per 8 graphitic
carbon atoms, i.e. 1 ion 2HT per 16 graphitic carbon atoms.
This molar ratio is definitely higher than those evaluated for the oCB/2HT
adducts. In fact, even for the most oxidized sample, n2HT/nC is only 1/30,
according to gravimetric measurements (W2HT/ WoCB = 0.825) or 1/27
according to elemental analysis (C=74.5 wt%, O= 15.5wt%, H=8.3 wt%,
N=1.6 wt%). This indicates that nearly 50% of the oCB sample is not
involved in the formation of the intercalate ordered structure. This
conclusion based on gravimetric and structural data, well agrees with the
partial maintenance of the oCB amorphous halo whose maximum is

91
located at 2θCuKα ≈ 25° at d ≈ 0.36 nm (Fig. 4.6 c-e), which is still present
even in the pattern of Fig. 4.6f (inset D).
For the sake of comparison, the WAXD pattern of the obtained adduct
from crystalline graphite oxide and 2HT (GO/2HT adduct, which also
includes 1 ion 2HT per 16 graphitic carbon atoms [21]) is shown in Fig. 4.6g.
GO/2HT adduct presents with respect to oCB/2HT adducts: (i) a definitely
shorter periodicity with d001 = 3.4 nm rather than 4.8 nm; (ii) a regular
decrease of the intensity of the 00l reflections with l and hence absence of
the odd-even effect; (iii) a higher crystalline order, as pointed out by the
presence of 00l reflections with 1<l<7 (inset C of Fig. 4.6); (iv) a definitely
sharper diffraction peak at d ≈ 0,42 nm. Features (i) and (ii) are rationalized
by an inclined rather than perpendicular orientation of the hydrocarbon
tails with respect to the graphitic layers [21]. Feature (iv) indicates a higher
correlation length (D100r = 7.2 nm rather than 3.0 nm) for the hexagonal
rotator order. It is also worth adding that for GO/2HT adduct, gravimetric
measurements (n2HT/nC ≈ 1/17), indicate that essentially the whole GO
sample is involved in formation of the intercalate structure.
Hence, going from fully intercalated GO/2HT adducts to partially
intercalated oCB/2HT adducts, the orientation of the hydrocarbon tails
from inclined becomes nearly perpendicular to the graphitic planes. It is
reasonable to assume that this preferential perpendicular orientation could
be determined by the small lateral size of the carbon black layers and
hence to the small lateral size of the hydrocarbon chain bundles.
Crystalline oCB/2HT adducts like those of Figures 4.6d-f remain stable after
mechanical milling, as well as after extraction by supercritical carbon
dioxide. On the contrary, for dispersion of the adduct in n-hexane followed
by fast solvent removal, the oCB/2HT adduct can be fully exfoliated, also
with complete loss of the ordered rotator phase of the ionically bonded
long hydrocarbon chains.
Also informative are SEM images of oCB and of the corresponding oCB/2HT
adducts. This is shown, for instance, for the oCB sample with O/C = 0.83, in
Figure 8. It is clearly apparent that the amorphous oCB sample presents
micrometric morphologies while the oCB/2HT adduct exhibits a much finer

92
morphology, possibly platelets (see inset of Fig. 4.8) whose lateral size is in
the range 20-50 nm.
Figure 4.8. SEM images of oCB, with O/C molar ratio of 0.83 (A) and of the
corresponding oCB/2HT adduct (B).
It is worth adding that the analogous preparation procedure, when
conducted with the ammonium salt with only one long hydrocarbon chain
(1HT), leads to a oCB/1HT adduct with an analogous rotator phase peak at
d = 0.42 nm, which however does not show low 2θ peaks typical of the
intercalate structure. Hence, the ammonium ion exhibiting only one
hydrocarbon chain is able to decorate small layers of CB by a hydrocarbon
rotator phase. However, it is not able to induce formation of the 3D
ordered intercalate phase.[49]
Conclusions
Oxidation studies on different carbon black (CB) samples show that, for
a same oxidation procedure, the degree of oxidation largely increases with
the BET surface areas of the starting CB. WAXD patterns of CB and oCB
samples can be interpreted by a disordered spatial arrangement of
defective graphene and graphene oxide layers, exhibiting short in-plane
correlation length (typically in the range 2–3 nm).

93
Ordered intercalation compounds can be also obtained if the starting
material is completely disordered like oxidized CB (oCB). These
intercalation compounds with oCB (with a O/C molar ratio higher than 0.3)
have been prepared following the same procedure of that reported for the
preparation of GOICs. X-ray diffraction patterns of oCB/2HT adducts show,
not only few 00l reflections that indicate an intercalate crystalline structure
with spacing between graphitic layers of 4.8 nm, but also hk0 reflections
typical of the hexagonal rotator order of the intercalated hydrocarbon
chains (with d100=0.42 nm).
The unexpected formation of an ordered intercalate crystalline structure
from highly disordered oxidized CB can be rationalized by: (i) replacement
of metal ions with ammonium ions on graphitic layers of oxidized CB; (ii)
organization of ionically bonded hydrocarbon chains in hexagonal rotator
phases; (iii) self-assembling of decorated graphitic layers in 3D ordered
intercalate crystalline structures, with hydrocarbon chains nearly
perpendicular to the graphitic planes.

94
References
[1] J.O. Besenhard. Carbon 1976, 14, 111-115.
[2] W.Q. Deng, X. Xu, W.A. Goddard. Phys. Rev. Lett. 2004, 92, 166103.
[3] S. Chakraborty, J. Chattopadhyay, W. Guo, W. E. Billups, Angew. Chem.
2007, 119, 4570–2.
[4] J. Li, L. Vaisman, G. Marom, J. K. Kim. Carbon 2007, 45, 744–50.
[5] S. Heguri, N. Kawade, T. Fujisawa, A. Yamaguchi, A. Sumiyama, K.
Tanigaki, M. Kobayashi. Phys. Rev. Lett. 2015, 114, 1-5.
[6] H. Fujimoto, A. Tressaud. Carbon 2015, 82, 176-83.
[7] Y. Matsuo, T. Niwa, Y. Sugie. Carbon 1999, 37, 897–901.
[8] Z. Liu, Z.M. Wang, X. Yang, K. Ooi. Langmuir 2002, 18, 4926–32.
[9] W. Yan, M.M. Lerner. Carbon 2004, 42, 2981–7.
[10] Y. Matsuo, T. Miyabe, T. Fukutsuka, Y. Sugie. Carbon 2007, 45, 1005–
12.
[11] T. E. Sutto, T.T. Duncan, T.C. Wong. Electrochim. Acta 2009, 54, 5648-
55.
[12] S. Stankovich, D.A. Dikin, O.C. Compton, G.H.B. Dommet, R.S. Ruoff, S.
B.T. Nguyen. Chem. Mater. 2010, 22, 4153-7.
[13] T. Maluangnont, G.T. Bui, B.A. Huntington, M.M. Lerner. Chem. Mater.
2011, 23, 1091-5.
[14] K. Zhang, L. Mao, L.L. Zhang, H.S.O. Chan, X.S. Zhao, J. Wu. J. Mater.
Chem. 2011, 21, 7302-7.
[15] W. Sirisaksoontorn, A.A. Adenuga, V.T. Remcho, M.M. Lerner. J. Am
Chem. Soc. 2011, 133, 12436-8.
[16] F. Guo, W. Xing, J. Zhou, L. Zhao, J. Zeng, Z. Liu, Q. Xue, Z. Yan, Acta
Crytall. 2014, 148, 220-7.
[17] X. Ai, J. Yu, M. Gu, T.B. Tang, T.J. Zhang. Phys. Chem C 2015, 119,
17438-43.
[18] K. Spyrou, M. Calvaresi, E.K. Diamanti, T. Tsoufis, D. Gournis, P. Rudolf,
F. Zerbetto. Adv. Funct. Mater. 2015, 25, 263-9.
[19] M. Mauro, M. Maggio, A. Antonelli, M.R. Acocella, G. Guerra. Chem.
Mater. 2015, 27, 1590-6.

95
[20] C. Cabrillo, F. Barroso-Bujans, R. Fernandez-Perea, F. Fernandez-
Alonso, D. Bowron, F.J. Bermejo. Carbon 2016, 100, 546-55.
[21] M. Mauro, M. Maggio, V. Cipolletti, M. Galimberti, P. Longo, G.
Guerra. Carbon 2013, 61, 395-403.
[22] M. Galimberti, A. Lostritto, A. Spatola, G. Guerra. Chem. Mater. 2007,
19, 2495-9.
[23] M. Galimberti, S. Senatore, L. Conzatti, G. Costa, G. Giuliano, G.
Guerra. Polym. Adv. Tech. 2009, 20, 135–42.
[24] M. Galimberti, S. Giudice, V. Cipolletti, G. Guerra. Polym. Adv. Tech.
2010, 21, 679-84.
[25] V. Cipolletti, M. Galimberti, M. Mauro, G. Guerra. Appl. Clay. Sci. 2014,
87, 179-88.
[26] W.S. Hummers, R.E. Offeman. J. Am. Chem. Soc. 1958, 80, 1339.
[27] A. Lerf, H. He, M. Forster, J. Klinowski. J. Phys. Chem. B 1998, 102,
4477–4482.
[28] McAllister, M.J. J.–L. Li, D.H. Adamson, C. Hannes, H.C. Schniepp, A.A.
Abdala, L. Jun, M. Herrera-Alonso, D.L. Milius, R. Car, R.K. Prud'homme,
I.A. Aksay. Chem. Mater. 2007, 19, 4396-4404.
[29] H.A. Becerril, J. Mao, Z. Liu, R.M. Stoltenberg, Z. Bao, Y. Chen. ACS
Nano 2008, 3, 463-470.
[30] C.–M. Chen, J. –Q. Huang, Q. Zhang, W. –Z. Gong, Q.–H. Yang, M.–Z.
Wang, Y.-G. Yang. Carbon 2012, 50, 659–667.
[31] S. You, S.M. Luzan, T. Szabó, A.V. Talyzin. Carbon 2013, 52, 171–180.
[32] M. Acik, G. Lee, C. Mattevi, A. Pirkle, R.M. Wallace, M. Chhowalla, K.
Cho, Y. Chabal. J. Phys. Chem. C 2011, 115, 19761–19781.
[33] I.Y. Jeon, Y.R. Shin, G.J. Sohn, H.J. Choi, S.Y. Bae, J. Mahmood, Jung,
S.M. J. M. Seo, M.J. Kim, D.W. Chang, L. Dai, J.B. Baek. Proc. Natl. Acad. Sci.
U.S.A. 2012, 109, 5588−5593.
[34] Z. Wei, Y. Yang, Y. Hou, Y. Liu, X. He, S. Deng. Chem. Cat. Chem. 2014,
6, 2354–2363.
[35] D. He, Z. Kou, Y. Xiong, K. Cheng, X. Chen, M. Pan, S. Mu, Carbon, 2014,
66, 312–319.

96
[36] M.R. Acocella, M. Mauro, L. Falivene, L. Cavallo, G. Guerra. ACS Catal.
2014, 4, 492-6.
[37] H. Shi, J.N. Reimers, J.R.J. Dahn. Appl. Cryst 1993, 26, 827-36.
[38] T. Ungár, J. Gubicza, G. Ribárik, C. Pantea, Waldek, T. Zerda. Carbon
2002, 40, 929–37.
[39] W. Ruland, B. Smarsly. J. Appl. Cryst. 2002, 35, 624-33.
[40] M. Mauro, V. Cipolletti, M. Galimberti, P. Longo, G. Guerra. J. Phys.
Chem. C 2012, 116, 24809-13.
[41] Y.G. Andreev, P.G. Bruce. J. Appl. Cryst. 2016, 49, 24–30.
[42] D. Chen, H. Zhu, T. Liu. Appl. Mater. Interfaces 2010, 2, 3702-8.
[43] Z.J. Fan, W. Kai, J. Yan, T. Wie, L.J. Zhi, J. Feng, Y.M. Ren, L.P. Song, F.
Wie. ACS Nano, 2011, 5, 191-8.
[44] Y. Guo, C. Bao, L. Song, B. Yuan, Y. Hu. Ind. Eng. Chem. Res. 2011, 50,
7772-83.
[45] S. Zhang, Y. Shao, H. Liao, M.H. Engelhard, G. Yin, Y. Lin. ACS Nano
2011, 5, 1785–91.
[46] J. Wang, X. Wang, C. Xu, M. Zhang, X. Shang. Polym. Int. 2011, 60, 816–
22.
[47] H. Kim, S. Kobayashi, M.A. Abdur Rahim, M.J. Zhang, A. Khusainova,
M.A. Hillmyer. Polymer 2011, 52, 1837-46.
[48] M. Maggio, M. Mauro, M.R. Acocella, G. Guerra. RSC Adv. 2016, 6,
44522.
[49] M. Maggio, M. R. Acocella, G. Guerra. RSC Adv. 2016, 6, 105565–
10557.

97
CHAPTER 5
Graphite and Graphene Oxide paper
Nowadays, it is widely acknowledged in the scientific community that large
scale production of single or few layers of graphene can be achieved by
top-down processes of exfoliation and reduction of GO, through chemical
or thermal treatments. [1-4]
It is also well recognized that the development of three-dimensional
structures with graphene oxide and graphene layers, e.g. aerogels
[5-11] or papers,[12-20] is expected to improve their manufacturability as
well as to expand their applications.
In particular, free-standing GO paper can be obtained by vacuum filtration
of colloidal dispersions of graphene oxide sheets.[12-20]
However GO papers, due to the high content of polar functional groups,
generally exhibit a strong tendency to go back into suspension in the
presence of solvents (mainly if polar or highly polar, like water), which is a
major inconvenience for many applications.

98
This work presents GO papers as prepared after basification of the colloidal
GO aqueous suspension (thereafter defined as basified GO paper and
shortly b-GO paper) that exhibit thermal stability and solvent resistance
much higher than usual GO papers. Moreover, it is shown that basification
of GO suspensions also facilitates processing, mainly solvent casting
procedures that lead to definitely more flexible papers. Spectroscopic
analyses of the obtained papers have been conducted aiming to a possible
rationalization of the observed behavior.
5.1 Structural characterizations of GO and b-GO papers.
The X-ray diffraction pattern (CuKα) of graphite oxide powder, obtained by
oxidation of graphite samples exhibiting high shape anisotropy [4] and
used as starting material of the present study, is shown in Fig. 5.1A. The
pattern shows the (001) peak corresponding to an interlayer distance of
0.82 nm, with a correlation length of 4.5 nm as well as the (100) and (110)
peaks (at d=0.21 nm and d=0.12 nm, respectively) corresponding to a long-
range order in the graphitic planes (e.g., correlation length perpendicular
to the (100) planes higher than 30 nm).
The GO paper, obtained by vacuum filtration of a GO suspension,20 has a
thickness of nearly 30 mm, a C/O ratio equal to 1.4 (first line of Table 1)
and a density of 1.79 +/- 0.01 g cm3, similar to those reported in the
literature for analogous GO papers.[12]
The X-ray diffraction pattern as taken by an automatic diffractometer of
this GO paper (Fig. 5.1) is similar to that one reported in Fig. 1 of ref. 20
and shows only the (001) diffraction peak. This clearly indicates that,
irrespective of the full exfoliation in the aqueous dispersion, GO aggregates
again to graphite oxide, coming back to the starting interlayer distance
(0.82nm), even with a slightly increased correlation length(from 4.5 up to
4.8 nm). The comparison between the patterns of Fig. 5.1A and B also
shows an increased intensity of the (001)peak with respect to the
amorphous halo as well as the disappearance of (100) and (110) peaks for
the GO paper. These features are due to the occurrence in the GO paper of

99
uniplanar orientation of the graphitic planes parallel to the paper surface.
This uniplanar orientation is clearly shown by the photographic patterns of
Fig. 5.1B’ and 5.1B’’, as taken with EDGE and THROUGH geometries, i.e. by
placing the X-ray beam parallel and perpendicular to the paper surface,
respectively (as sketched in the lower part of Fig. 5.1.
In fact, as already observed for EDGE patterns of other graphite and GO
papers and films,[21,22] the (001) reflection is present as arcs centered on
the equator (corresponding to a degree of parallelism of the (001) graphite
oxide planes with respect to the paper surface equal to f00ℓ ≈ 0.83) while
the (100) reflection is present as broad arcs centered on the meridian (Fig.
5.1B’). Of course, the corresponding pattern as taken by an automatic
powder diffractometer (Fig. 5.1B), which mainly collects information
relative to the equator of the EDGE pattern, completely loses information
relative to the hk0 reflections.
Figure 5.1. X-ray diffraction patterns (CuKa) as collected by an automatic powder diffractometer (A–E) or by a photographic camera with the X-ray beam parallel

100
(B0, D0 and E0 for EDGE diffraction geometry) or perpendicular to the sample surface (B”, D” and E” for THROUGH diffraction geometry) for: (A) the starting graphite oxide powder; (B, B’ and B”) GO paper obtained by vacuum filtration of GO suspension; (C) b-GO paper, by casting of a basified GO suspension, including 13 wt% of sodium ions; (D, D0 and D00) b-GO cast paper, after sodium removal by washing with HCl solution; (E, E0 and E00) b-GO paper treated at 100 °C for 15 s. The hk‘ Miller indexes of the main reflections are indicated.
The b-GO paper, as obtained by casting of a b-GO suspension, has a
thickness of nearly 30 mm, a C/O ratio equal to 1.1 (third line of Table 1).
Hence, the adopted basification procedure leads to an increase of the
oxygen content with respect to the GO paper, possibly mainly due to
opening of epoxide groups on the GO layers as promoted by hydroxyl ions.
Irrespective of its higher oxygen content (1st and 3rd line of Table 5.1) the
density of the b-GO paper (1.82 +/- 0.01 g/cm3) is even slightly higher than
for the GO paper (1.79 +/- 0.01 g/cm3).
The WAXD patterns of the cast b-GO paper, as taken by an automatic
powder diffractometer, before and after sodium removal (≈13 wt%,
corresponding to a C/Na ratio not far from 6), by washing with a 10 wt%
aqueous HCl solution, are shown in Fig. 5.1C and D, respectively. A shift to
a lower diffraction angle of the (001) reflection indicates a definitely
increased interlayer spacing (d001=1.0 nm, Fig. 5.1C), which disappears
after sodium removal (d001=0.8 nm, Fig. 1D). This clearly indicates the
formation of an intercalate crystalline structure of graphite oxide [21,23]
with sodium ions,38 which goes back to crystalline graphite oxide, after
sodium removal by hydrochloric acid treatment.
For both patterns of Fig. 5.1C and D, a relevant increase of the intensity of
the amorphous halo (roughly centered at d=0.37 nm) is observed. Due to
the increase of oxygen content (elemental analysis of Table 1), these halos
although not far from the graphitic interlayer spacing (d=0.34 nm) cannot
be attributed to graphite oxide reduction. Their high intensity instead
indicates a strong loss (of nearly 70%) of graphite oxide crystallinity.
X-ray diffraction patterns of the cast and washed b-GO paper as taken by a
photographic camera with EDGE and THROUGH geometries, are shown in

101
Fig. 5.1D’ and D’’, respectively. From the EDGE photographic pattern of Fig.
1D’, it is apparent that not only the (001) graphite oxide peak but also the
broad amorphous halo are centered on the equator. Rather surprisingly,
the degree of parallelism with respect to the paper surface of the
amorphous halo (f00ℓ ≈ 0.69) is even higher than for the narrower peak at
d=0.8 nm (Fig. 5.1D), corresponding to the (001) peak of the graphite oxide
component (f00ℓ ≈ 0.60).
WAXD patterns similar to those of Fig. 5.1D, D’ and D’’ are obtained for
different sonication conditions, with intensity of the amorphous halo
gradually increasing with sonication time and temperature. For instance,
after sonication of the GO dispersion at 80°C for 12 h, the WAXD pattern of
the obtained paper (not shown) exhibits an amorphous halo again
centered at d z=0.37 nm, whose intensity is nearly 10 times higher than the
intensity of the (001) graphite oxide peak still located at d =0.8 nm.
A complete loss of the (001) peak, i.e. of the crystalline order perpendicular
to the graphite oxide planes can be reached by simple annealing of the b-
GO paper. For instance, the WAXD pattern of the cast paper, after 15 s of
treatment at 100 °C (Fig. 5.1E) shows only a broad halo centered at d z 0.37
nm (Fig. 5.1F), which is very similar to the diffraction halo of amorphous
carbon [24] as well as of largely oxidized amorphous carbon. The two-
dimensional patterns of Fig. 5.1E’ and 5.1E” show that the broad
amorphous halo of the annealed b-GO paper is only present in the EDGE
pattern (E’) and centered on the equator. This again indicates a rather high
degree of parallelism of graphene oxide layers, with respect to paper
surface (f00ℓ = 0.67).
The loss of crystalline order perpendicular to the GO planes, which
characterize the b-GO paper of Fig. 5.1E, leaves essentially unaltered the in
plane hk0 reflections, as shown by a comparison between (100) rings in the
THROUGH patterns (Fig. 5.1B’’, D’’ and E’’).
Hence the present results clearly indicate that the basification procedure
leads to macroscopic papers with loss of crystalline order perpendicular to
the GO planes, without reducing the in plane crystalline order of the GO
planes. Moreover, the degree of parallelism with respect to the paper

102
plane of the GO layers (f circa 0.67) is still comparable with that one of the
graphite oxide crystallites being present in the GO paper of Fig. 5.1B (f00ℓ
≈0.83).
5.2 Structural changes with thermal and microwave treatments
GO and b-GO papers are largely different as for their structural changes as
a consequence of thermal treatments. For instance, the changes of WAXD
patterns, as collected by an automatic powder diffractometer, for GO and
b-GO papers, as a consequence of thermal treatments in the range 200–
400 °C are compared in Fig. 5.2A and B, respectively.
Figure 5.2. X-ray diffraction patterns (CuKα) as collected by an automatic powder
diffractometer for GO paper (A) and b-GO paper (B), as a consequence of different
thermal treatments: (a) unannealed; (b) 200 °C for 30 s; (c) 200 °C for 3 min; (d)
200 °C for 30 min; (e) 200 °C for 300 min; (f) 400 °C for 3 min. The d spacing,

103
expressed in nm, of the observed peaks is indicated. The insets in the top of the
figures show photographs of GO (A) and b-GO (B) papers after treatment at 400 °C
for 3 min.
As for GO paper treatments at 200 °C, the (001) peak progressively moves
to higher diffraction angles and correspondingly the interlayer spacing
reduces from 0.82 nm down to 0.40 nm. A weak but narrow graphitic peak
at d=0.34 nm, for all the considered annealing conditions, also appears
(Fig. 5.2Ab–f) and clearly indicates the formation of a minor amount of
ordered graphitic structure. Even after the thermal treatment at 400 °C
(Fig. 5.2f), the GO paper still contains minor amounts of reduced graphite
oxide crystallites (peak at d=0.40 nm) as well as of graphite crystallites
(peak at d=0.34 nm). Moreover, the GO paper after the thermal treatment
at 400°C is fully disintegrated (see inset in the upper part of Fig. 5.2A).
Largely different are the WAXD patterns of the b-GO paper after thermal
treatments at 200 °C and 400 °C (Fig. 5.2Bb–f), which all present only a
broad amorphous halo, as for the b-GO paper annealed at 100 °C (Fig. 5.1E,
E’ and E’’).
Particularly relevant is the maintenance of integrity of the b-GO paper,
even after the thermal treatment at 400 °C, which is instead fully lost for
GO paper (compare insets in the upper part of Fig. 5.2A and B,
respectively).
Structural changes for GO and b-GO papers, as a consequence of room
temperature microwave treatments have also been studied by WAXD
patterns (as collected by powder diffractometer), as shown in Fig. 5.3.

104
Figure 5.3 X-ray diffraction patterns (CuKα), as collected by an automatic powder
diffractometer, for: GO paper untreated (A), microwave treated at 900 W for 2
min (B) and for 40 min (C); b-GO paper untreated (D) and microwave treated at
400 W for 15 s (E).
The (001) graphite oxide peak of the GO paper is gradually shifted toward
higher 2θ values, and after 40 min of treatment the d spacing decreases
from 0.85 nm down to 0.69 nm, with a reduction of the correlation length
perpendicular to the graphitic layers from 4.4 nm to 3.5 nm (Fig. 5.3A–C).
The (001) graphite oxide peak of the b-GO paper (Fig. 5.3D), on the
contrary, after only 2 min of microwave treatment completely disappears
leading to an amorphous halo (Fig. 5.3E), which is again indistinguishable
from that one observed for the thermally treated b-GO paper (Fig. 5.1E).
Elemental analysis of the microwave treated b-GO paper (last line of Table
5.1) indicates a negligible reduction of oxygen content with respect to the

105
starting b-GO paper (3rd line of Table 5.1), clearly showing that the
amorphous halo centered at d=0.37 nm is due to loss of three dimensional
order of graphene oxide layers rather than to their reduction.
Hence, the minor graphite oxide component of the b-GO paper, differently
from the large graphite oxide component of GO paper, can easily loose
(both by thermal or microwave treatments) its crystalline order
perpendicular to the graphene oxide layers, always maintaining the GO
paper integrity.
Relevant information on structural organization of b-GO paper also comes
from N2 sorption experiments. In fact, as prepared b-GO papers that
maintain graphite oxide crystalline order (Fig. 1D) exhibit negligible BET
surface areas (<1 m2/g). b-GO paper samples, which have lost crystalline
order perpendicular to the GO planes both by annealing at 100 °C (Fig.
5.1E) or by microwave treatments (Fig. 5.3E), present definitely higher BET
values (4.6 +/- 0.1 m2/g). BET surface area values further increase as a
consequence of b-GO paper reduction processes, which maintain the
complete loss of crystalline order perpendicular to the GO planes. For
instance, for b-GO papers after 1 min of annealing at 400 °C and 500 °C,
where the C/O weight ratio increases up to 1.9 and 2.6 (Table 1), the BET
values increase up to 20 m2/g and 75 m2/g, respectively.
5.3 Thermal behavior
TGA and DSC measurements of GO and b-GO papers are compared in Fig.
5.4. TGA measurements (Fig. 5.4A) and the corresponding differential plot
(DTGA, Fig. 5.4B) show the well-known thermal degradation phenomenon,
corresponding to deoxygenation mainly by CO2 evolution, [41] which for
both GO and b-GO papers occurs at nearly 200 °C. However, the weight
loss for the b-GO paper (11%) is close to one half of the weight loss of the
GO paper (21%).
This nearly halved degradation phenomenon, for b-GO paper, is clearly
confirmed by DSC measurements (Fig. 5.4C), which show that the
corresponding exothermic peak (centered in the temperature range 195–

106
198°C) is also nearly halved. In fact, the enthalpy change is equal to 1.1 and
0.53 kJ/g, for GO and b-GO paper, respectively.
Both TGA and DSC measurements indicate that thermal deoxygenation
phenomena, are largely depressed for b-GO paper with respect to GO
paper. These data are also clearly confirmed by elemental analyses, as
collected in Table 1. In fact, as consequence of treatment at 300°C, the C/O
weight ratio of GO paper increases from 1.4 up to 4.6 (1st and 2nd lines of
Table 1) while for the b-GO paper only increases from 1.1 up to 1.7 (3rd and
4th lines of Table 1). Elemental analyses of b-GO paper treated at 400°C
and 500°C (5th and 6th lines of Table 1) show that the C/O weight ratio
increases only up to 2.6.
Hence, after treatment at 300°C, the GO paper has an oxygen content of
17.8 wt% while the b-GO paper has a nearly double oxygen content
(37wt%). A possible molecular origin of the definitely more difficult thermal
deoxygenation of b-GO papers, with respect to GO papers, is discussed in
Section 4.6.

107
Figure 5.4. Scans at heating rate of 10 °C/min of GO paper (black line) and b-GO
paper (red line): (A) TGA; (B) DTGA; (C) DSC.
5.4 Dimensional stability in solvents
Although b-GO paper exhibits an oxygen content definitely higher than for
usual GO paper (see, elemental analysis in Table 4.1), they present a much
higher dimensional stability when dispersed in both polar and apolar
solvents, mainly in the presence of sonication.

108
TABLE 5.1. Elemental analysis of different papers based on GO.a
Paper C
(wt%) H
(wt%) O
(wt%) C/O
GO
57.2
1.4
41.3
1.4
GO (300°C) 81.8 0.6 17.6 4.6
b-GO 52.1 0.9 47.0 1.1
b-GO(300°C) 62.4 0.8 37.6 1.7
b-GO (400°C) 64.9 1.1 33.8 1.9
b-GO (500°C) 71.4 1.2 27.4 2.6
b-GO (microwave)
52.4 1.0 46.6 1.1
a Elemental composition of anhydrous samples: The error in C and O content is close to
1wt% while the error in H content is close to 0,1 wt%; water contents (as evaluated by
TGA, after equilibration at room temperature in air with a relative humidity of 45%) was in
the range 13±2 wt%, for all the examined samples.
The dimensional stability in the presence of some solvents, after vigorous
stirring and three months of storage, for GO paper (by vacuum filtration)
and for b-GO papers (both by vacuum filtration and casting procedures), is
shown by photographs of vials in Fig. 5.5.
Both b-GO papers maintain their dimensional integrity after sonication in
organic solvents like acetone, ethanol and hexane while the GO paper
breaks in many pieces.
Both b-GO papers are also completely stable to sonication in polar organic
solvents, like dimethylformamide (DMF, lower part of Fig. 5.5) and N-
methyl-pyrrolidone (NMP), with solvents remaining fully transparent, while
the GO paper in part goes back into suspension and the solvents become
heavily turbid.
In water (intermediate part of Fig. 5.5), the GO paper comes back to GO
suspension, the b-GO(VF) paper breaks in few pieces also losing some fine
particles (less than 1 wt%) that generate water turbidity, while b-GO(C)
paper remains intact in fully transparent water.

109
Figure 5.5. Photographs of vials containing three different solvents
(dimethylformamide, water and NaOH 1 M aqueous solution) and three different
kinds of papers: GO; b-GO by vacuum filtration (b-GO(VF)) and b-GO by casting (b-
GO(C)). The photographs have been taken after vigorous stirring and three
months of storage.
b-GO(C) paper also exhibits a remarkable dimensional stability in acidic and
alkaline aqueous solutions, also for high concentrations. This is shown, for
instance, in the upper part of Fig. 5.5, for a 1 M aqueous solution of NaOH,
which fully destroys GO paper and becomes slightly turbid in the presence
of b-GO(VF). An analogous behavior is observed for the same GO papers in
1 M aqueous solutions of HCl.
It is worth adding that b-GO papers exhibit the above described high
solvent resistance both before and after the acidic treatment leading to ion

110
removal. Hence, the high solvent resistance of b-GO papers is not due to
interactions involving the added metal cations or possible multivalent
cationic metal contaminants.
5.5 Paper flexibility
Mechanical properties of b-GO paper are comparable or even better than
those of the usual GO paper. This is shown, for instance, for bending tests
evaluating radius of curvature (as one half of the minimum opening of a
gauge, before sample breaking, see Fig. 5.6A) of papers of different
thickness.
The plot of Fig. 5.6B clearly shows that papers by vacuum filtration present
similar radius of curvature, irrespective of the preparation from GO or b-
GO (upper curve). However, cast papers that were obtained only from b-
GO suspensions exhibit a definitely higher flexibility (lower curve with red
squares). In particular, the cast paper with lowest thickness (12 mm) is fully
foldable, i.e., does not break in our bending test, even for radius of
curvature equal to zero. It is worth adding that this 12 mm b-GO paper
survived a repeated folding test (1000 folds) with a curvature radius of 200
mm. Moreover, after the repeated folding test the thin paper was
crumpled (Fig. 5.6C) and then laid out in a plane (Fig. 5.6D), without any
fracture.

111
Figure 5.6. (A) Bending tests evaluating the minimum opening of a gauge, before
paper breaking. (B) The radius of curvature, calculated as one half of this
minimum opening, reported versus the papers thickness, for b-GO papers and GO
papers. In particular, triangles indicate data for papers by vacuum filtration,
squares data for papers by casting while circles indicate literature data taken from
Ruoff et al.20 An arrow indicates the cast b-GO paper that is fully foldable, i.e.
does not break in our bending test. (C and D) Photographs of a 12 mm b-GO
paper: (C) crumbled (D) and then laid out in a plane.
5.6 FTIR characterization and possible rationalization of b-GO properties
Many favorable properties of b-GO paper with respect to GO paper could
be rationalized by formation of covalent bonds between GO layers: (i)
largely improved filmability, which is generally associated with higher
molecular masses of the dispersed molecules; (ii) largely improved solvent
resistance, which is generally associated with crosslink formation; (iii)
paper integrity after complete loss of stacking order of GO as induced by
thermal or microwave treatments, which again is favored by covalent
bonds between graphene layers; (iv) higher paper density, irrespective of
lower crystallinity, of higher oxygen content and of lower degree of planar
orientation.

112
This section reports an infrared characterization of functional group on the
GO layers, aiming to understand the chemical nature of the possible
covalent links between GO layers. The FTIR reflection–absorption spectra
of the prepared GO papers have been studied for the range 4000–400 cm-1
and are compared for the spectral range 2000–800 cm-1, in Fig. 5.7.
The FTIR spectra of the GO paper (Fig. 5.7A) present peaks at 825 cm-1 and
1275 cm-1, due to the bending and asymmetric stretching modes of the
epoxy (C–O–C) group, and a peak at 1740 cm-1, which is generally
attributed to C-O stretching vibration of carboxylic functionalities.[25] The
intense peak at 1640 cm1, can be possibly attributed to an overlap of
different vibrational modes as C]C stretching vibration46 (which is
activated in GO due to oxygen functional groups and defects) and bending
mode of intercalated water.[26]
Largely different are the spectra of the obtained b-GO papers that are
mainly characterized by a very broad band roughly centered at 1335 cm-1
(Fig. 7B), which does not help to establish the chemical nature of the
functional groups on the layers.
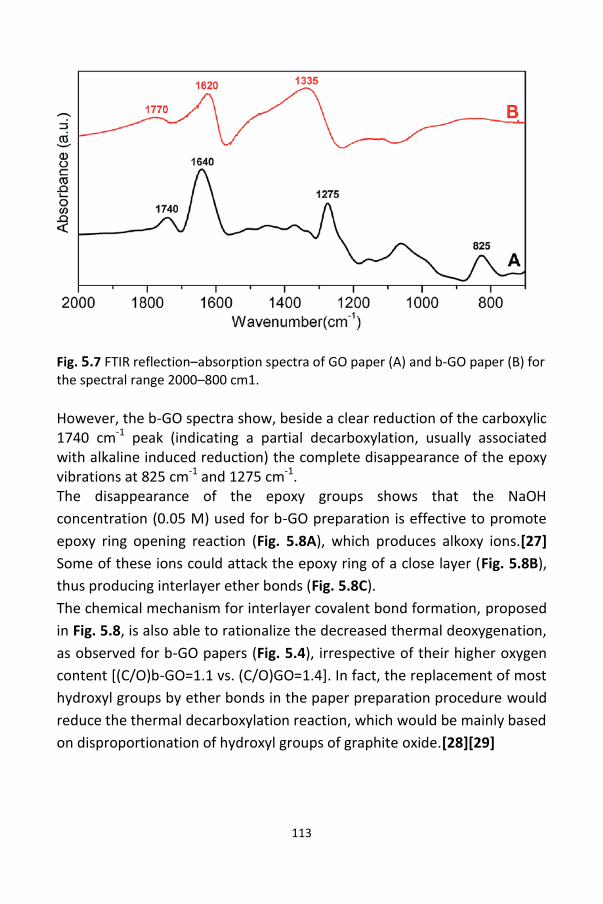
113
Fig. 5.7 FTIR reflection–absorption spectra of GO paper (A) and b-GO paper (B) for the spectral range 2000–800 cm1.
However, the b-GO spectra show, beside a clear reduction of the carboxylic 1740 cm-1 peak (indicating a partial decarboxylation, usually associated with alkaline induced reduction) the complete disappearance of the epoxy vibrations at 825 cm-1 and 1275 cm-1. The disappearance of the epoxy groups shows that the NaOH
concentration (0.05 M) used for b-GO preparation is effective to promote
epoxy ring opening reaction (Fig. 5.8A), which produces alkoxy ions.[27]
Some of these ions could attack the epoxy ring of a close layer (Fig. 5.8B),
thus producing interlayer ether bonds (Fig. 5.8C).
The chemical mechanism for interlayer covalent bond formation, proposed
in Fig. 5.8, is also able to rationalize the decreased thermal deoxygenation,
as observed for b-GO papers (Fig. 5.4), irrespective of their higher oxygen
content [(C/O)b-GO=1.1 vs. (C/O)GO=1.4]. In fact, the replacement of most
hydroxyl groups by ether bonds in the paper preparation procedure would
reduce the thermal decarboxylation reaction, which would be mainly based
on disproportionation of hydroxyl groups of graphite oxide.[28][29]

114
Fig. 5.8 Proposed mechanism for interlayer covalent bond formation for b-GO
paper.
Conclusions
The ability of GO aqueous suspensions to form robust GO paper is
largely improved by basification of the suspension prior of vacuum
filtration or casting procedures. In particular, casting procedures, which
generally lead to brittle GO paper, for the case of basified GO suspensions
lead to tough papers of macroscopic size, for a broad range of thickness (at
least in the range 5–50 mm).
Flexibility of b-GO papers, when obtained by casting procedures, is
definitely improved with respect to usual GO papers. In particular, cast b-
GO papers with low thickness (≈10 mm) do not break in our bending test,
even for radius of curvature equal to zero.
Differently from usual GO papers, b-GO papers exhibit a remarkable
dimensional stability, after thermal or solvent treatments. Dimensional
stability in solvents is observed even after sonication and differences with

115
respect to GO papers are particularly impressive in the presence highly
polar solvents, like water or DMF or NMP.
X-ray diffraction analyses indicate that b-GO papers have a much larger
amorphous component. Thermal treatments of b-GO paper easily produce
complete loss in stacking order of graphene oxide layers while thermal
treatments of GO paper lead to their disintegration but only to partial loss
in stacking order. Also microwave treatments at room temperature of b-
GO paper easily lead to loss in stacking order of graphene oxide layers.
TGA and DSC measurements show that, for b-GO papers, thermal
deoxygenation phenomena are less than halved with respect to those
observed for GO paper.
Physical and chemical properties of b-GO paper suggest the
formation of interlayer covalent bonds. Infrared characterizations indicate
that the main change observed moving from GO to b-GO papers is the
disappearance of the epoxy peaks. This indicates that relevant properties
of b-GO are induced by reactions of the hydroxyl ions with the epoxy
groups on the GO layers. A possible mechanism leading to formation of
interlayer ether bonds, for b-GO paper, is proposed.

116
References
[1] S. Park and R. S. Ruoff. Nat. Nanotechnol. 2009, 5, 217–224.
[2] H. Kim, A. A. Abdala and C. W. Macosko, Macromolecules 2010, 43,
6515–6530.
[3] R. Sengupta, M. Bhattacharya, S. Bandyopadhyay and
A. K. Bhowmick. Prog. Polym. Sci. 2011, 36, 638–670.
[4] M. Mauro, V. Cipolletti, M. Galimberti, P. Longo and
G. Guerra. J. Phys. Chem. C 2012, 116, 24809–24813.
[5] X. Zhang, Z. Sui, B. Xu, S. Yue, Y. Luo, W. Zhan. et al. J.
Mater. Chem. 2011, 21, 6494–6497.
[6] M. A. Worsley, P. J. Pauzauskie, T. Y. Olson, J. Biener,
J. H. Satcher Jr and T. F. Baumann. J. Am. Chem. Soc.
2010, 132, 14067–14069.
[7] M. A. Worsley, T. Y. Olson, J. R. I. Lee, T. M. Willey,
M. H. Nielsen, S. K. Roberts, et al. J. Phys. Chem. Lett.
2011, 2, 921–925.
[8] S. Nardecchia, D. Carriazo, M. L. Ferrer, M. C. Guti´errez and F. del
Monte. Chem. Soc. Rev. 2013, 42, 794–830.
[9] H. Hu, Z. Zhao, W. Wan, Y. Gogotsi and J. Qiu, Adv. Mater. 2013, 24,
2219–2223.
[10] T. Wu, M. Chen, L. Zhang, X. Xu, Y. Liu, J. Yan, et al. J. Mater. Chem. A
2013, 1, 7612–7621.
[11] S. Longo, M. Mauro, C. Daniel, P. Musto and G. Guerra,
Carbon 2014, 77, 896–905.
[12] D. A. Dikin, S. Stankovich, E. J. Zimney, R. D. Piner,
G. H. B. Dommett, G. Evmenenko, et al. Nature 2007, 448,
457–460.
[13] Y. Xu, H. Bai, G. Lu, C. Li and G. Shi. J. Am. Chem. Soc. 2008, 130, 5856–
5857.
[14] S. Park, J. An, I. Jung, R. D. Piner, S. J. An, X. Li, et al. Nano Lett. 2009, 9,
1593–1597.

117
[15] S. Pei, J. Zhao, J. Du, W. Ren and H.-M. Cheng. Carbon 2010, 48, 4466–
4474.
[16] O. C. Compton and S. T. Nguyen. Small 2010, 6, 711–723.
[17] F. Liu S. Song, D. Xue and H. Zhang, Adv. Mater. 2012, 24, 1089–1094.
[18] W. Wan, Z. Zhao, H. Hu, Y. Gogotsi and J. Qiu. Mater. Res. Bull. 2013,
48, 4797–4803.
[19] R.-Y. Liu and A.-W. Xu. RSC Adv. 2014, 4, 40390–40395.
[20] M. Kim, D. Y. Kim, Y. Kang and O. O. Park. RSC Adv. 2015, 5, 3299–
3305.
[21] M. Mauro, M. Maggio, V. Cipolletti, M. Galimberti, P. Longo and G.
Guerra. Carbon 2013, 61, 395–403.
[22] C.-J. Kim, W. Khan and S.-Y. Park. Chem. Phys. Lett. 2011, 511, 110–
115.
[23] M. Mauro, M. Maggio, A. Antonelli, M. R. Acocella and
G. Guerra. Chem. Mater. 2015, 27, 1590–1596.
[24] H. Shang, Y. Lu, F. Zhao, C. Chao, B. Zhang and H. Zhang.
RSC Adv. 2015, 5, 75728–75734.
[25] C.-N. Yeh, K. Raidongia, J. Shao, Q.-H. Yang and J. Huang.
Nat. Chem. 2015, 7, 166–170.
[26] J. W. Kim, D. Kang, T. H. Kim, S. G. Lee, N. Byun, D. W. Lee, et al. ACS
Nano 2013, 7, 8082–8088.
[27] T. Taniguchi, S. Kurihara, H. Tateishi, K. Hatakeyama,
M. Koinuma, H. Yokoi, et al. Carbon, 2015, 84, 560–566.
[28] A. M. Dimiev, L. B. Alemany and J. M. Tour. ACS Nano 2013, 7, 576–
588.
[29] M. Maggio, M. Mauro, M. R. Acocella, G. Guerra. RSC Adv. 2016, 6,
44522–44530.
118
General conclusions
New layered carbon-based materials were prepared and exhaustively
characterized exploiting different characterization techniques, such as
thermogravimetry (TGA), differential thermal calorimetry (DSC), Fourier
transform infrared (FTIR) and wide angle X-ray diffraction (WAXD).
Pristine graphite (G) with high surface area and carbon black (CB) samples
with different surface areas were selected as starting materials to prepare
the corresponding oxidized samples, i.e. graphite oxide (GO) and carbon
black oxide (oCB), with the Hummers’ method.
Thanks to the strong hydrophilicity and to the lamellar structure of oxidized
carbon-based materials, a rich intercalation chemistry is permitted.
In fact, after treatments of GO and oCB by strong basis, ordered
intercalation compounds have been obtained, not only if the starting
material is crystalline like graphite oxide, but also if it is completely
amorphous like oxidized carbon black.
Starting basified GO, free-standing papers can be obtained by vacuum
filtration, as well as by casting procedure, of colloidal dispersions of
graphene oxide sheets.
The use of basified GO leads to more flexible, solvent resistant and
thermally stable GO papers. Spectroscopic analyses of the obtained papers
have been conducted aiming to a possible rationalization of the observed
behavior.
Copyright © 2022 FDOKUMEN