jonas kwadzo kotoka - Unisa Institutional Repository
156
The impact of computer simulations on the teaching and learning of electromagnetism in grade 11: a case study of a school in the Mpumalanga Province By JONAS KWADZO KOTOKA submitted in accordance with the requirements for the degree of MASTER OF SCIENCE IN MATHEMATICS, SCIENCE AND TECHNOLOGY EDUCATION in the subject PHYSICS EDUCATION at the UNIVERSITY OF SOUTH AFRICA SUPERVISOR: PROF J KRIEK June 2012
-
Upload
khangminh22 -
Category
Documents
-
view
2 -
download
0
Transcript of jonas kwadzo kotoka - Unisa Institutional Repository

The impact of computer simulations on the teaching and learning of electromagnetism in grade
11: a case study of a school in the Mpumalanga Province
By
JONAS KWADZO KOTOKA
submitted in accordance with the requirements for
the degree of
MASTER OF SCIENCE IN MATHEMATICS, SCIENCE AND TECHNOLOGY EDUCATION
in the subject
PHYSICS EDUCATION
at the
UNIVERSITY OF SOUTH AFRICA
SUPERVISOR: PROF J KRIEK
June 2012

i
DECLARATION
I declare that
THE IMPACT OF COMPUTER SIMULATIONS ON THE TEACHING AND LEARNING OF
ELECTROMAGNETISM IN GRADE 11: A CASE STUDY OF A SCHOOL IN THE
MPUMALANGA PROVINCE
is my own work and that all sources that I have used and quoted have been indicated and
acknowledged by means of complete references.
__________________________ __________________
SIGNATURE DATE
(Mr. J.K. Kotoka)
ii
ABSTRACT
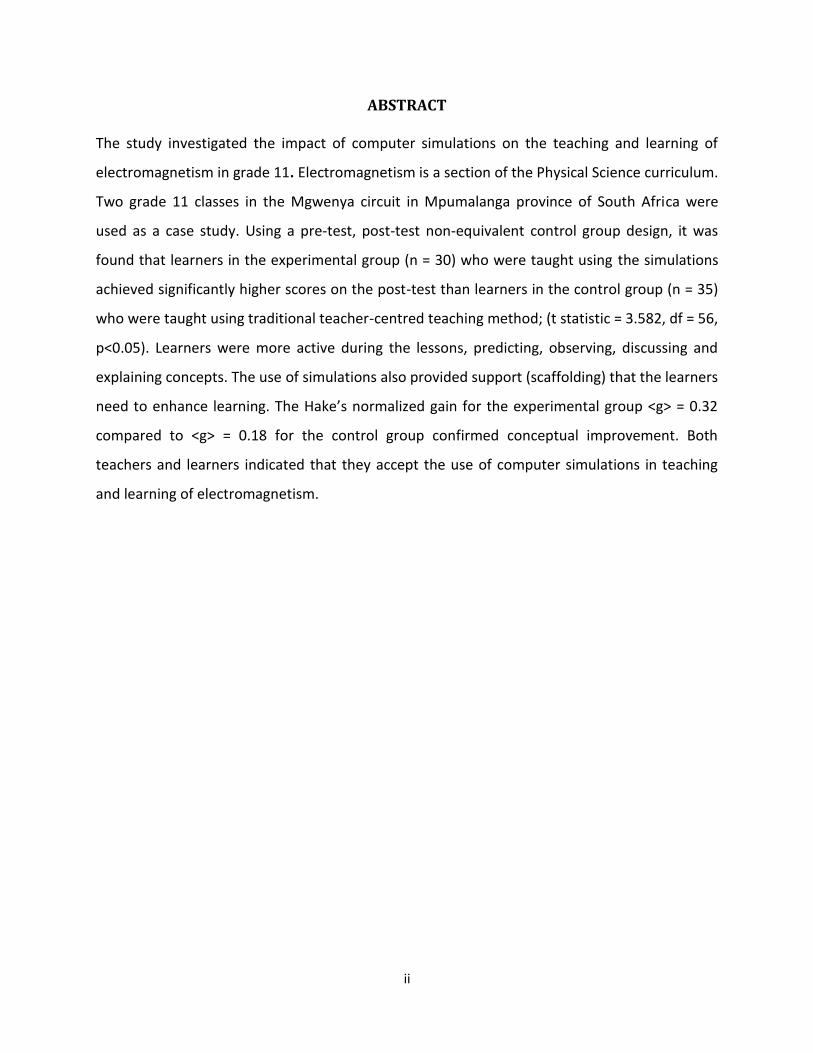
The study investigated the impact of computer simulations on the teaching and learning of
electromagnetism in grade 11. Electromagnetism is a section of the Physical Science curriculum.
Two grade 11 classes in the Mgwenya circuit in Mpumalanga province of South Africa were
used as a case study. Using a pre-test, post-test non-equivalent control group design, it was
found that learners in the experimental group (n = 30) who were taught using the simulations
achieved significantly higher scores on the post-test than learners in the control group (n = 35)
who were taught using traditional teacher-centred teaching method; (t statistic = 3.582, df = 56,
p<0.05). Learners were more active during the lessons, predicting, observing, discussing and
explaining concepts. The use of simulations also provided support (scaffolding) that the learners
need to enhance learning. The Hake’s normalized gain for the experimental group <g> = 0.32
compared to <g> = 0.18 for the control group confirmed conceptual improvement. Both
teachers and learners indicated that they accept the use of computer simulations in teaching
and learning of electromagnetism.

iii
KEY WORDS
Computer Simulations, Electromagnetism: magnetic field lines, the right hand grip rule,
Flemings left and right hand rules, motors and generators, Grade 11 Physics, Constructivist
Theory.

iv
ACKNOWLEDGEMENTS
I want to acknowledge the grace of the Almighty God and my Lord Jesus Christ without which
this work would not have been possible.
I wish to express my deepest gratitude to my supervisor, Prof. Jeanne Kriek of ISTE, University
of South Africa for her direction, supervision, encouragement and constructive criticism
throughout this work.
My sincere thanks also go to my wife Mrs. Love Kotoka, for all the love, encouragement and the
support you gave me. My daughter Gladys and my son Christian, you gave me reason to work
hard. Thank you for the understanding when I was not able to spend time with you.
I am very much grateful to Dr. U.I. Ogbonaya of ISTE, University of South Africa, for his valuable
guidance and assistance.
My thanks also go to the Principal, the Physical Science teachers and students of the school
where the research was carried out.
Finally, to all the lecturers and my fellow students in the postgraduate class at ISTE, I will ever
remember you all for your support and challenging moments from the beginning to the
completion of this work.
May the Lord richly bless you.

v
DEDICATION
This study is dedicated to my dear wife: Mrs. Love Kotoka and our two lovely children,
Gladys Yayra Kotoka and Christian Delali Kotoka.

vi
ACRONYMS
ASS Assessment Standards
CAI Computer Assisted Instruction
CAPS Curriculum and Assessment Policy Statement
CBI Computer-Based Instruction
CD – ROM Compact Disc - Read-only Memory
DCGEP Discovery Channel Global Education Partnership
DoE Department of Education
DOS Disk Operating System
DVD Digital Versatile Disc
FET Further Education and Training
IA Index of Agreement
IBM International Business Machine
ICT Information and Communication Technology
ICTs Information and Communication Technologies
LO Learning Outcome
MBL Microcomputer-Based Lab
NCET National Council for Educational Technology
NCS National Curriculum Statement
NEIMS National Education Infrastructure Management System
PC Personal Computers
PhET Physics Education Technology
TV Television
ZPD Zone of Proximal Development

vii
DEFINITION OF TERMINOLOGY
The following terminology has been used in this study and is presented alphabetically:
Computer Simulation: The computer-generated virtual reality of a three-dimensional image or
environment that can be interacted within a seemingly real or physical way by using special
electronic equipment.
Computer: Electronic machine, operated under the control of instructions stored in its own
memory that can accept data (input), manipulate data according to specified rules (process),
produce results (output) and store the results for future use.
Curriculum Implementer/ subject facilitator: Refers to the South African Department of
Education official who supervises in our case the Physical Science programme of study and
helps the teachers to understand their common objectives and assists them to plan to achieve
the objectives.
Curriculum: A combination of the learning outcomes, pedagogy, and content that students are
to address.
Dinaledi Schools: Schools identified by the South African Department of Education countrywide
to excel in Mathematics and Science. These schools are supported by the department and the
private sector to increase the number of learners passing high-level Mathematics and Science in
Grade 12 and to encourage successful matriculants to pursue further studies in technical
disciplines like engineering in tertiary institutions.
Experience: Is defined in terms of a teachers’ number of years of teaching. That is the number
of years the teacher has taught Physical Science in a secondary school.
ICT (Information & Communications Technology): Refers generally to computer technologies
which include other technologies used for the collection, storage, manipulation and
communication of information.

viii
Physical Science: In the South African system the subject Physical Science is concerned with the
study of Physics and Chemistry.
Secondary School: In the South African system, a Secondary School or High School is the school
in-between primary school and University. It starts from Grade 8 and ends in Grade 12.
Software: The sets of instructions and data used by computers, sometimes referred to as
computer programmes.
Teacher education: This is the formal training and instruction teachers received as students in
tertiary institutions through which they acquired knowledge and developed skills. It refers to
the preparation phase of the teachers.
Teachers’ background: In this study it refers to teachers’ qualifications in terms of academic,
professional and teaching experience.

ix
LIST OF TABLES
Table 1.1: Candidates’ performance in Physical Science: 2010, 2009 and 2008. 16
Table 1.2: Department of Education laboratories summary grid for ordinary schools. 17 Table 2.1: An example of the Formal Programme of Assessment. 31 Table 2.2: Computer Penetration Ratios at Schools in Selected African Countries,
2006. 37 Table 2.3: Development of National ICT Policies 2000–2007 . 38 Table 4.1 Mr C’s lessons compared to a teacher centred or learner centred Approach. 63 Table 4.2: MR E’s lessons compared to a teacher centred or learner centred Approach. 80 Table 4.3: t-test: Two-Sample Assuming Unequal Variances for the June Exams. 84 Table 4.4: t-test: Two-Sample Assuming Unequal Variances for Pre-Test. 85 Table 4.5: t-test: Two-Sample Assuming Unequal Variances for Post-Test. 86 Table 4.6: Description of group performances in pre-test and post-test. 87
Table 4.7: Analysis of test questions. 90
Table 4.8: Index of agreement for section B of learners’ and teachers’ questionnaire. 93 Table 4.9: Index of agreement for section C of learners’ and teachers’ questionnaire. 94

x
LIST OF FIGURES
Figure 3.1: Research procedure. 55 Figure 4.1: Magnetic field lines around a bar magnet. 61 Figure 4.2: Screenshot from PhET Interactive Physics simulation showing magnetic field lines. 66 Figure 4.3: Screenshot from Interactive Physics simulation showing fields around a straight wire carrying current to show the right hand grip rule. 68 Figure 4.4: Screenshot from PhET Interactive Physics simulation showing Electromagnet. 69 Figure 4.5: Screenshot from Plato learning Interactive Physics simulation showing the four scenarios. 70 Figure 4.6: Screenshot from Plato learning Interactive Physics simulation showing a current carrying conductor. 70 Figure 4.7: Screenshot from Plato learning Interactive Physics simulation showing the field lines around a conductor. 71 Figure 4.8: Screenshot from Plato learning Interactive Physics simulation showing direction of the current the wire. 71 Figure 4.9: Screenshot from Plato learning Interactive Physics simulation showing a switch between the positive and negative of the current in the wire. 72 Figure 4.10: Screenshot from Plato learning Interactive Physics simulation showing magnetic field lines and field around the conductor. 73 Figure 4.11: Screenshot from Plato learning Interactive Physics simulation showing current direction in the wire. 73 Figure 4.12: Screenshot from Plato learning Interactive Physics simulation showing a change in the positions of north and south of the magnets and a change in the direction of the force on the conductor. 74
xi
Figure 4.13: Screenshot from Plato learning Interactive Physics simulation showing the direction of force (big arrow), on the wire. 74 Figure 4.14: Screenshot from Plato learning Interactive Physics simulation showing the Fleming’s left hand in the scenario. 75 Figure 4.15: Screenshot from PhET Interactive Physics simulation showing a bar magnet with one coil. 76 Figure 4.16: Screenshot from PhET Interactive Physics simulation showing a bar magnet with two coils. 76 Figure 4.17: Screenshot from PhET Interactive Physics simulation showing the field lines of the magnet. 77 Figure 4.18: Screenshot from PhET Interactive Physics simulation showing a flip of the magnet to change the positions of the north and south, and the direction of the field lines of the magnet. 78 Figure 4.19: Screenshot from PhET Interactive Physics simulation showing the transformer. 79 Figure 4.20: Screenshot from PhET Interactive Physics simulation showing a generator. 79 Figure 4.21: Mean performance of learners in the pre - test and post - test. 87
Figure 4.22: Graphical representation of pre-test and post-test of the control group. 88
Figure 4.23: Graphical representation of pre-test and post-test of the experimental Group. 89

xii
Table of Contents
DECLARATION ............................................................................................................................................. i
ABSTRACT ................................................................................................................................................... ii
KEY WORDS ............................................................................................................................................... iii
ACKNOWLEDGEMENTS ........................................................................................................................... iv
DEDICATION ............................................................................................................................................... v
ACRONYMS ................................................................................................................................................. vi
DEFINITION OF TERMINOLOGY .................................................................................................................. vii
LIST OF TABLES ............................................................................................................................................ ix
LIST OF FIGURES ........................................................................................................................................... x
CHAPTER 1................................................................................................................................................ 15
INTRODUCTION ....................................................................................................................................... 15
1.1 BACKGROUND TO THE STUDY ................................................................................................... 15
1.2 CONTEXT OF THE STUDY ............................................................................................................ 18
1.3 RATIONALE FOR THE STUDY ...................................................................................................... 19
1.4 AIM OF THE STUDY ....................................................................................................................... 19
1.5 RESEARCH PROBLEM AND RESEARCH QUESTIONS ............................................................... 20
1.6 RESEARCH HYPOTHESIS .............................................................................................................. 20
1.7 SIGNIFICANCE OF THE STUDY .................................................................................................... 20
1.8 LIMITATIONS OF THE STUDY ..................................................................................................... 21
1.9 ORGANISATION OF THE STUDY ................................................................................................. 22
1.9 SUMMARY ....................................................................................................................................... 23
CHAPTER 2 .................................................................................................................................................. 24
LITERATURE REVIEW ................................................................................................................................... 24
2.1 INTRODUCTION ................................................................................................................................ 24
2.2 THE PROCESS OF TEACHING AND LEARNING .................................................................................. 24
2.2.1 TEACHING .................................................................................................................................. 24
2.2.2 LEARNING .................................................................................................................................. 25
2.2.3 TEACHER – CENTRED TEACHING APPROACH ........................................................................... 26
2.2.4 LEARNER – CENTRED TEACHING APPROACH............................................................................ 27
2.3 ROLE OF EXPERIMENTS IN PHYSICS ................................................................................................. 28

xiii
2.3.1 PRACTICAL INVESTIGATIONS AND EXPERIMENTS IN PHYSICAL SCIENCE................................ 30
2.3.2 PROCEDURE FOR PRACTICAL INVESTIGATION AND EXPERIMENTS IN THE NCS ..................... 30
2.4 ELECTROMAGNETISM ...................................................................................................................... 32
2.4.1 ELECTROMAGNETISM IN THE SOUTH AFRICAN CURRICULUM CONTEXT ............................... 34
2.5 THE USE OF ICT IN EDUCATION ........................................................................................................ 35
2.5.1 BACKGROUND TO ICT USE IN AFRICA ....................................................................................... 36
2.6 ADVANTAGES OF ICT USAGE IN THE TEACHING AND LEARNING OF PHYSICS ............................... 38
2.7 DISADVANTAGES OF ICT USAGE IN THE TEACHING AND LEARNING OF PHYSICS .......................... 40
2.8 ACCESS TO ICT IN EDUCATION ......................................................................................................... 41
2.9 COMPUTER SIMULATION AND MODELLING ................................................................................... 41
2.9.1 PHYSICS EDUCATION TECHNOLOGY (PhET) PROJECT .............................................................. 43
2.9.2 PLATO LEARNING CENTRE ......................................................................................................... 44
2.10 THEORETICAL FRAMEWORK .......................................................................................................... 44
2.11 SUMMARY ...................................................................................................................................... 46
CHAPTER 3................................................................................................................................................ 47
RESEARCH METHODOLOGY .................................................................................................................. 47
3.1 INTRODUCTION ............................................................................................................................. 47
3.2 RESEARCH DESIGN........................................................................................................................ 47
3.3 PARTICIPANTS .............................................................................................................................. 48
3.4 INSTRUMENTATION ..................................................................................................................... 48
3.4.1 CLASSROOM OBSERVATION SCHEDULE ............................................................................ 49
3.4.2 PRE-TESTS AND POST-TESTS .............................................................................................. 49
3.4.3 QUESTIONNAIRES .................................................................................................................. 49
3.5 VALIDITY AND RELIABILITY OF THE INSTRUMENTS ............................................................ 50
3.5.1 VALIDITY OF THE INSTRUMENTS ...................................................................................... 50
3.5.2 RELIABILITY OF THE INSTRUMENTS ................................................................................. 51
3.6 METHODOLOGY............................................................................................................................. 52
3.7 PILOT STUDY ................................................................................................................................. 56
3.8 ETHICAL CONSIDERATIONS ........................................................................................................ 57
3.8.1 OFFICIAL PERMISSIONS ........................................................................................................ 57
3.8.2 TEACHERS, LEARNERS AND PARENTS PERMISSIONS ..................................................... 57
3.9 SUMMARY ....................................................................................................................................... 58

xiv
CHAPTER 4................................................................................................................................................ 59
PRESENTATION AND DATA ANALYSIS ................................................................................................ 59
4.1. INTRODUCTION ............................................................................................................................ 59
4.2. OBSERVATION OF LESSONS OF THE TEACHERS .................................................................... 60
4.2.1 MR. C’S LESSONS ..................................................................................................................... 60
4.2.2 MR. E’S LESSONS ..................................................................................................................... 65
4.2.3 ANALYTIC COMPARISON OF THE TWO LESSONS ............................................................. 82
4.3 ANALYSIS OF TEST RESULTS ...................................................................................................... 84
4.3.1. ANALYSIS OF JUNE EXAMS .................................................................................................. 84
4.3.2 ANALYSIS OF THE PRE-TEST OF THE TWO GROUPS ....................................................... 85
4.3.3. ANALYSIS OF POST-TEST OF THE TWO GROUPS ............................................................ 86
4.3.4 ANALYSIS OF THE PERFORMANCE OF THE TWO GROUPS USING GRAPHS ................ 87
4.3.5 RESEARCH QUESTION 1: Does the use of computer simulation have an impact on the
performance of grade 11 learners in electromagnetism? .................................................................. 89
4.3.6 ANALYSIS OF TEST ITEMS .................................................................................................... 90
4.3.7 HAKE’S NORMALIZED GAIN ................................................................................................. 91
4.4 ANALYSIS OF QUESTIONNAIRES ................................................................................................ 92
4.4.1 ANALYSIS OF SECTION B OF BOTH LEARNERS AND TEACHERS QUESTIONNAIRES . 92
4.5 RESEARCH QUESTION 2: To what extent does the use of computer simulations influence the
learning of electromagnetism in grade 11? ............................................................................................ 96
4.6 RESEARCH QUESTION 3: To what extent does the use of computer simulations influence the
teaching of electromagnetism in grade 11? ........................................................................................... 97
4.7 SUMMARY ....................................................................................................................................... 98
CHAPTER 5................................................................................................................................................ 99
CONCLUSIONS AND RECOMMENDATIONS .......................................................................................... 99
5.1 OVERVIEW ...................................................................................................................................... 99
5.2 SUMMARY OF FINDINGS ............................................................................................................ 100
5.3 CONCLUSION ................................................................................................................................ 101
5.4 IMPLICATIONS AND RECOMMENDATIONS ............................................................................ 102
REFERENCES ........................................................................................................................................... 104
APPENDICES .............................................................................................................................................. 115

15
CHAPTER 1
INTRODUCTION
1.1 BACKGROUND TO THE STUDY
Today, more than ever before, employers require workers with higher problem solving skills.
This is because the world is changing rapidly and technology is advancing apace. The skills that
education provides must therefore keep abreast of these changes and equip the individual with
the problem solving skills to enable them to fit into today’s global economy.
Physics is a Science that could provide its learners with the problem solving skills that today’s
employers require. Physics is often considered the most fundamental of all the natural Sciences
and its theories attempt to describe the behaviour of the building blocks of matter, light, the
universe and everything in the universe (Jirage, 2011). The importance of Physics in society
today is underlined by our reliance on technology. Several of the technologies that are
transforming the world can be traced directly to vital Physics research. For example, research
on the Physics of semiconductors enabled the first transistor to be developed. This device is the
main component of all electronic systems, including computers, and it is considered one of the
most important inventions in human history (Woodford, 2011). An understanding of Physics
can equip learners with excellent analytical, quantitative and problem solving skills, valuable in
a range of careers (Ouellette, 1999). It is not surprising, then, that today an increasing number
of employers have realised this fact and are hiring Physics graduates (Modini, n.d). Current
trends in the job market thus demand that every effort be made to improve the teaching and
learning of Physics in order to encourage learners to develop interest in the subject and
subsequently increase the number of learners doing Physics.
However, reports reveal that the number of learners in South Africa who are studying Physical
Science, which comprises Physics and Chemistry, are few compared to other subjects (DoE
2009b, 2010b). Furthermore, only a small percentage achieves passes at the matriculation
examination (DoE, 2004) cited in (Kriek & Grayson, 2009). The reports on the national senior

16
certificate examination results (DoE 2009b, 2010b, & 2011a) indicate that only 53.4%, 47.8%,
38.9% and 54.9% of learners achieved 30% and above in the 2011, 2010, 2009 and 2008 final
grade 12 National Certificate Examinations respectively. Table 1.1 below provides details of
these results.
Table 1.1: Candidates’ performance in Physical Science: 2011, 2010, 2009 and 2008
Year Total number of learners
Total achieving 30% and above
% achieving 30% and above
2011 180585 96441 53.4
2010 205364 98260 47.8
2009 220882 82356 38.9
2008 218156 119823 54.9
Table 1.1 reveals that Physical Science learners are not performing well in the final
matriculation examinations. This is a cause for concern and research is required to find reasons
for this poor performance. One of the reasons could be the non-availability of teaching and
learning resources such as laboratories and laboratory equipment. Statistics from the National
Education Infrastructure Management System (NEIMS), in Table 1.2 below, show that the
percentage of ordinary schools1 in South Africa without laboratories ranges from 60% to 94%.
Limpopo Province is worst off with 94% of ordinary schools without laboratories, while Gauteng
Province is best equipped although 60% of its ordinary schools are lacking laboratories. In
Mpumalanga, where the study was conducted, a staggering 89% of ordinary schools do not
have laboratories. There are 1,868 schools in Mpumalanga, but only 213 of these have
laboratories. Out of these 213 schools, only 53 have laboratories which are stocked with
Physical Science laboratory equipment. This means that 1,655 schools in the Mpumalanga
Province are without laboratories, as indicated in the table below.
1 Ordinary school is a school that is not for learners with disabilities.

17
Table 1.2: Department of Education laboratories summary grid for ordinary schools
Province
Number of
schools
With laboratory
% With laboratory
Laboratory Stocked
% Stocked
Without laboratory
% Without
laboratory
Eastern Cape 5,676 493 9 110 2 5,183 91
Free State
1,615 337 21 103 6 1,278 79
Gauteng
2,031 813 40 287 14 1,218 60
KwaZulu-Natal
5,931 719 12 221 4 5,212 88
Limpopo
3,923 235 6 59 2 3,688 94
Mpumalanga
1,868 213 11 53 3 1,655 89
North West
1,674 269 16 72 4 1,405 84
Northern Cape
611 180 29 67 11 4,31 71
Western Cape
1,464 513 35 259 18 9,51 65
TOTAL 24,793 3,772 15 1,231 5 21,021 85
Source: National Education Infrastructure Management System (NEIMS), May, 2011
The lack of Physical Science laboratories and equipment is likely to impede learning and
discourage interest in Physical Science. However, an alternative in the form of computer
simulations could be considered especially in situations where the real laboratory equipment is
lacking because researches have shown that computer simulations have increased learner
achievements. Cigrik, and Ergul (2009) and Ogbonaya (2010) reported increased learner
achievements in their studies when computer simulations were used. Computer simulations
can help learners visualise abstract concepts in Science (Rutten, van Joolingen & van der Veen,
2012). This limited study seeks, therefore, to determine if computer simulations could be used
to assist in the teaching and learning of Physics concept electromagnetism in a high school in
Mpumalanga.

18
1.2 CONTEXT OF THE STUDY
The Republic of South Africa (RSA) has a land size of about 1 219 090 square kilometres. It
shares boarders with Namibia, Botswana, Zimbabwe, Mozambique, Swaziland and Lesotho. It
has a population of about 50 586 757. The republic is divided into nine provinces. Gauteng
Province, the capital province, is the smallest by land size but the most densely populated with
about 22.39% of the total population of the country resident in Gauteng. Mpumalanga, where
this study took place, although larger than Gauteng in land size, has only 7.23% of the country’s
population (Statistics South Africa, 2011).
For the purposes of educational administration, the provinces are further divided into regions,
the regions into districts and the districts into clusters. There are four regions in the
Mpumalanga Province; this study took place in the Mgwenya districts of the Ehlanzeni Region.
The Ehlanzeni region is divided into 14 educational districts, of which Mgwenya district is one
(DoE, 2010b). The other regions are Nkangala, Bushbuck Ridge and Gert Sebande.
Education in RSA is facing challenges similar to those experienced in most developing countries
around the world. These challenges include inadequate school buildings which lead to
overcrowding in classes and inadequate teaching and learning equipment (Onwu, 1999 and
Kihumba, 2009). There is also shortage of teachers, especially in Mathematics and Science
(Kopolo, 2009). Mpumalanga as a province in RSA is also facing these challenges and even more
because of it rural nature. As a result of these challenges, Mpumalanga lagged behind the other
provinces in the 2009 and 2010 National Certificate Examinations (DoE, 2010b). The Ehlanzeni
Region is the capital region of the province and therefore the conditions in some of the schools
are better than in many schools in other regions which are more remote from the capital. The
Mgwenya district is close to the capital city, Nelspruit, so the clusters in the district are more
likely to get the necessary materials and support from Department of Education officials. For
this reason most of the schools in the region are functional.

19
1.3 RATIONALE FOR THE STUDY
From my experience as a teacher and an examiner (marker) of Physics in the grade 12 final
examinations over the past five years, it has become apparent that learners of Science are not
able to satisfactorily answer sections in the Physics question paper dealing with
electromagnetism. This problem was mentioned in the chief examiner’s report on the 2010
National Curriculum Statement (NCS) examinations: “electromagnetism is very poorly
understood by most learners because teachers are also not very confident in teaching this
section and the subject facilitators must provide teacher development workshops on these
sections” (DoE, 2010a: p. 299). The concepts of electricity and magnetism are highly weighted
in both National Curriculum Statement (NCS) and Curriculum and Assessment Policy Statement
(CAPS). Electricity and magnetism is to be assessed at ± 37% weighting in the grade 12
matriculation examinations (DoE, 2009).
In addition, as a teacher, I have observed that learners find it difficult to visualise many of the
concepts in electromagnetism. Concepts such as magnetic field lines, magnetic field lines
moving from north to south, the right hand grip rule, Flemings left and right hand rules, the
principles of operations of motors and generators, are all difficult to demonstrate, particularly
in an environment where there are no laboratories or laboratory equipment. The teaching of
these concepts is difficult, for teachers and learners find the concepts difficult to grasp because
they are considered to be abstract. Therefore to visualise the concepts in electromagnetism,
computer simulations were used.
1.4 AIM OF THE STUDY
The aim of this study was to determine the impact of computer simulations on the teaching and
learning of electromagnetism in grade 11 Physics in one school in the Mpumalanga Province.

20
1.5 RESEARCH PROBLEM AND RESEARCH QUESTIONS
A growing body of research suggests that computer simulations can have a positive impact on
Science teaching and learning (Binns, Bell, & Smetana, 2010). For instance, Bozkurt and Ilik
(2010), Chang, Chen, Lin and Sung (2008), Farrokhnia and Esmailpour (2010), Trundle and Bell
(2010), Basson (2010), Cigrik, and Ergul (2009) and Ogbonaya (2010) reported more learner-
centred, teacher-learner interactions during technology-enhanced instruction and increased
learner achievements in their studies. Considering the problems of most schools in
Mpumalanga not having laboratories, low learner pass rate in Science, and the emphasis placed
on electricity and magnetism in the curriculum, this research sought to answer the following
questions:
1. Does the use of computer simulations have an impact on the performance of grade 11
learners in electromagnetism?
2. To what extent does the use of computer simulations influence the learning of
electromagnetism in grade 11?
3. To what extent does the use of computer simulations influence the teaching of
electromagnetism in grade 11?
1.6 RESEARCH HYPOTHESIS
H0 = the use of computer simulation has no impact on the performance of grade 11 learners in
electromagnetism.
1.7 SIGNIFICANCE OF THE STUDY
Science teachers all over the world are looking for ways to motivate their learners and make
Science more accessible. A variety of ways of achieving this have been suggested in literature
but unless they are tried out in a South African context, teachers may not be able to decide
which of these ways will work. The use of computer simulation is one of the approaches that
have been recommended to be used by teachers to promote learners’ conceptual
understanding (“National Research Council”, 2011). This study sought to verify this assertion.
Although this is a limited study with two classes in one school and findings cannot be
generalized, new insight can be presented with regards to teaching and learning of

21
electromagnetism as a subject. The study will contribute to Physics education literature and will
also open up new possibilities for improving Physics teaching, especially where there are
inadequate well equipped Science laboratories which could bring about an improvement in
learners’ achievements. Furthermore, the research will provide information that can be used to
make recommendations to school administrators and Physics curriculum developers in South
Africa on the formulation of policies to enhance Physics teaching by using computer
simulations.
1.8 LIMITATIONS OF THE STUDY
Research involving schools can come with some challenges. For instance, the participating
school in this research insisted that learners participating in the research be kept in their
original classes intact. This does not permit the researcher to select individual participants to
form the control and experimental groups randomly. Even though steps were taken to verify
that the two classes were comparable in terms of academic ability before the research
commenced, this is a limitation.
Although members of the two groups mixed freely during break times and after classes, it was
assumed that the level of contamination would be minimal because their varied classroom
experiences could not easily be invoked without sitting together in front of a computer to
discuss what was being observed.
There were only two schools in the Mgwenya circuit with ICT facilities. One of these schools did
not permit the research because they had already taught electromagnetism to their learners.
This situation left the researcher with only one school to use for the study and therefore the
results of the study cannot be generalized because the sample may not be representative.
The suitability of the simulation software to the South African curriculum is another limiting
factor in this research. The simulations used were not designed specifically for the South
African curriculum, therefore there was not one software that could be used alone to teach all
the concepts in electromagnetism. So, it became necessary to use simulation software from

22
two sources in the teaching of electromagnetism in this study. Simulation software from the
Physics Education Technology (PhET) project based at the University of Colorado at Boulder,
Colorado, USA, (See section 2.9.1) and simulations from the Plato Learning Centre based in the
UK (See section 2.9.2) were used. However, much time was spent by the researcher to train the
teacher (Mr. E) to be able to select appropriate software from the two sources for the various
concepts in electromagnetism.
1.9 ORGANISATION OF THE STUDY
Chapter one
In this chapter, the background, context, rationale, problem statement, research questions and
the hypothesis of the study are presented. The significance of the study is also discussed.
Chapter Two
A literature review that is related to this study is presented and also a discussion of the
theoretical framework guiding the study.
Chapter Three
This chapter focuses on the research methodology, research design, pilot study, selection of
participants, discussion of the instruments for data collection, and ethical issues considered in
the study.
Chapter Four
This chapter presents data and report on the findings from the data analysis. The findings are
used to answer the three research questions that guide the study.
Chapter Five
In this final chapter, the findings of the study are summarised, and the limitations of the study
as well as recommendations and implications of the study are presented.

23
1.9 SUMMARY
The study`s orientation was established in this chapter. The background, the rationale, aim of
the study and the research questions and hypothesis were presented. In addition, the
significance as well as the limitations of the study were discussed.

24
CHAPTER 2
LITERATURE REVIEW
2.1 INTRODUCTION
In order to place the study in perspective, a literature survey was conducted to present current
issues on the teaching and learning in general and in grade 11 Electromagnetism specifically.
The use of technology is also discussed to unleash the capabilities of technology to create
learning systems that differ from traditionally directed instruction, as reported by Jonassen and
Reeves (1996). Collins (1991: p. 28) also remarks that “in a society where most work is
becoming computer-based, ‘school work’ cannot resist the change” This limited study was
carried out with the purpose of filling a gap to investigate the impact of computer simulations
on the teaching and learning of the topic electromagnetism in the grade 11 Physics curriculum
of the National Curriculum Statement (NCS). The constructivist learning theory has been
adopted as the basis for teaching in this study.
2.2 THE PROCESS OF TEACHING AND LEARNING
The accomplishment of the objectives of education depends on the teaching and learning
process. This process is the most influential tool of education to bring about desired
transformations in the learners. To attain the objectives of education the process of teaching
and learning, the teacher, the learner, the curriculum and other variables are organised in a
systematic way by education departments and school administrators (Harrison, Blakemore, &
Buck, 2001).
2.2.1 TEACHING
According to (Dijkstra, Van Hout Worlter & Van der Sijde, 1990) teaching is a complex cognitive
skill which requires problem solving in a relatively ill-structured, dynamic environment.
Teaching has at least two consecutive stages as every other cognitive skill: planning and
execution (Anderson, Greens, Kilne & Neves, 1991). In the first stage a plan is made to solve the
problem and in the second stage the plan is translated into action to actually solve the problem.
Dijstra et al (1990) assumed that there are knowledge systems involved in teaching. These

25
knowledge systems are lesson organisation knowledge (the skill to plan a lesson), instruction
knowledge (the skills to explain the material clearly, to pass questions, to give feedback), and
classroom management knowledge (the skill to run a lesson smoothly). Knapp & Glenn (1996)
compared the old way of teaching (teache-centred teaching) and the new (learner-centred
teaching). Teacher-centred teaching involved introducing information and skills, providing
exercises to practice skills and memorize skills information and then checking learners’ ability to
remember these lessons. However, learner-centred teaching now engages learners in activities
that require them to think critically, solve problems, and seek answers to their own questions.
Teachers serve as model learners, mentors, coaches and resource persons. Teaching therefore
can be seen as the persistent direction and management of the learning process. It is also the
process of offering opportunities for learners to produce relatively permanent change through
the engagement in experiences offered by the teacher (Sharma, 2008).
2.2.2 LEARNING
Learning is looked at today as how learners construct their individual understanding from
personal experiences (Niess, Lee, & Kajder, 2007). When educators think about learning, they
should think about how learners organise and connect their personal experience and
understanding, their knowledge that connects huge amounts of information for recall,
application and expansion of their understanding (Niess, Lee, & Kajder, 2007). Educational
Psychologists indicate that learning happens “when experience cause a relatively permanent
change in an individual’s knowledge or behavior” (Woolfolk – Hoy, 2004: p.178). From the
definition, knowledge is acquired when a learner is said to have learnt. The knowledge will be
exhibited through a change in the learners’ capability and when these are transferred to new
situations (Sharma, 2008). Therefore, when there is a relatively permanent change in a learner's
behavior or capability as a result of experience or practice, then learning can be said to have
taken place.

26
2.2.3 TEACHER – CENTRED TEACHING APPROACH
Teacher-centred teaching places emphasis on the teacher providing information to the
learners. Many teachers learned to teach at a time when teachers were expected to decide
what should be learned, how it should be learned, and when it should be learned (Wood,
2008). In this paradigm, the lecture method was and is the main teaching method. In this
method, the teachers are defining key concepts, giving examples, explaining relationships, and
demonstrating skills. Though some discussion may take place, the focus is predominantly on
the teacher asking questions and learners answering the questions. Learners were or are
expected to be passive and reactive as instructed by the teacher (Wood, 2008). Research
consistently finds that, teacher-centred teaching, and rote memorization of abstract material
are less effective in terms of promoting learners learning. Effective teaching requires that
learners take part actively, and be allowed to exercise and relate their lessons to their own
experience (Tatto, 1999). Even though this is the view current researchers are focusing on,
Allen, (2004) mentioned the following advantages and disadvantages of the teacher-centred
teaching approach.
Advantages: teacher-centred teaching approach:
Teachers cover topics faster because learners are mostly passive and just listening to the
teacher.
The focus of all learners is on one person, the teacher and this makes the class quiet.
Teaching is done by the teacher and those who can learn will learn.
Disadvantages of teacher-centred teaching approach:
Learners could not master the objectives of the topics.
Core learning objectives such as communication and information literacy skills could not
be learnt by learners because they are mostly quiet and only listening.
The learners are not engaged all the time in their learning.
Learners are not active in the learning process.
Learners do not learn through collaboration with each other, and
Learners do not learn through cooperation with each other.

27
2.2.4 LEARNER – CENTRED TEACHING APPROACH
A learner-centred teaching approach proposes that the focus should be shifted from teachers
teaching to learners learning where the teacher will be a facilitator in the process (Huba &
Freed, 2000). According to Lukinbeal, Kennedy, Jones, Finn, Woodward, Nelson, Grant,
Antonopolis, Palos, & Atkinson-Palombo, (2007) teachers should not be placed as the active
agent and learners as passive vessels, but rather the classroom should be a place of dialogue
and a place where new knowledge is shaped through collaboration. Boyd, (2012) and Kahl &
Venette, (2010) also reinforce this belief by saying; the goal of learner-centred education is to
shift the focus from teachers to learners where learners would be taking the lead in the
discussions in the teaching and learning process. Some more positives of the learner-centred
teaching was mentioned by Huba and Freed (2000) as follows. In learner-centred teaching:
Learners construct knowledge through collecting and simplifying information and
integrating it with the general skills of inquiry, communication, critical thinking, and
problem solving.
Learners are actively involved.
Emphasis is on using and communicating knowledge efficiently to address evolving
issues and problems in real-life situations.
The teacher’s role is to coach and facilitate the learning process and teacher and
learners evaluate learning together.
Assessment is used to promote and diagnose learning.
Emphasis is on coming up with better questions and learning from errors.
Desired learning is measured directly through papers, projects, presentations,
portfolios, and the like.
The ethos is cooperative, collaborative, and supportive.
The teacher and learners learn together.
These advantages makes it easier for the learner-centred teaching to make use of computer
simulations, games, field study, peer teaching, group projects, stimulating visual aids, and
problem-based learning (Kahl & Venette ,2010). To further support the above positives,
(Randler, & Hulde, 2007) reported that they found a higher retention rate in the learner-

28
centred, hands-on group in their study on the topic: “Hands‐on versus teacher-centred
experiments in soil ecology”. They also reported in the same study that the hands-on and
learner-centred approaches were rated as more exciting, reflecting the interest of learners in
doing experiments on their own. Even though learner-centred teaching is said have these
advantages, according to (Alsardary & Blumberg, 2009), learner-centred teaching is time
consuming and not suitable for large classes.
2.3 ROLE OF EXPERIMENTS IN PHYSICS
Physics teachers try to provide a picture of Physics theories to their learners through
experiments (Koponen & Mäntylä, 2006). Mhlongo (2010) defines experiments as a set of
instructions that learners follow to verify a certain concept or law. In order to accomplish this,
learners have to set up the laboratory apparatus, follow a procedure to collect data, apply
theory, record the results, draw conclusions and then write an experimental report. The role
experiments play in Physics education is so central that hardly any textbook fails to mention
that Physics is an experimental Science (Koponen & Mäntylä, 2006). Practically testing the
theories in experiments is central to acquiring Physics knowledge and understanding it.
According to Etkina, Van Heuvelen, Brookes and Mills (2002: p. 352), experiments benefit
learners in three ways. Experiments allow learners to:
Observe a phenomenon to collect data, find patterns in the observations and devise an
explanation.
Test the explanations that they have devised for their initial observations.
Apply the concept that they have devised and tested to explain other phenomena or to
invent a device.
The South African Department of Education realises these benefits of experiments; hence in
formulating the National Curriculum Statement (NCS) for Physical Science grade 10 – 12,
Physical Science is described as a subject that focuses on investigating physical and chemical
phenomena through scientific enquiry (DoE, 2003). In order to achieve this, the policy

29
document aims to prepare learners for future learning and employment by developing
competencies in three focus areas. These areas are:
scientific inquiry and problem solving in a variety of scientific, technological, socio-
economic and environmental contexts;
the construction and application of scientific and technological knowledge; and
the nature of Science and its relationship to technology, society and the environment
(DoE, 2003, p. 10)
These focus areas were later transformed and referred to as learning outcomes (LOs) to be
achieved through Assessment Standards (ASS). The first learning outcome (LO 1), practical
scientific inquiry and problem solving skills, has four assessment standards. These require that
learners should be able to:
1. Plan and conduct practical investigations
2. Interpret data to draw conclusions
3. Solve problems
4. Communicate and present information and scientific arguments (DoE, 2003).
These four assessments standards are benefits or competencies that the learner derives from
conducting a practical experiment and they prepare the learner for future learning or
employment. This further strengthens the argument that experiments are very important in
Science and Physics education. It is evident from table 1.2 that few schools in the country have
laboratories. Hence, the benefits of experiments mentioned above are definitely compromised
as it is certainly needed in the teaching and learning of Physics. This is because Physics is said to
be an experimental subject. The topic of electromagnetism under focus in this study requires
many experiments that, if performed, will help learners to derive the benefits mentioned
above.

30
2.3.1 PRACTICAL INVESTIGATIONS AND EXPERIMENTS IN PHYSICAL SCIENCE
Practical investigations and experiments form an important part of the formal assessment
programme in the NCS. The new curriculum to be implemented in 2012; the Curriculum and
Assessment Policy Statement (CAPS), also includes experiments as part of its formal assessment
programme (DoE, 2011). According to NCS document (DoE, 2006) for Physical Sciences Grades
10 - 12, Learning Outcome 1 (LO1) is on developing practical scientific inquiry and problem
solving skills. This outcome is meant to be assessed at a 35-45% weighting in the Grade 12 end
of year final matriculation examinations. For this to be achieved, Grades 10 - 12 Physical
Science learners must have completed the following tasks as part of their formal assessment
(DoE, 2008):
Practical investigations and experiments (one in Physics in one school term and one in
Chemistry in another school term).
One research project, either in Physics or Chemistry (this task could involve the
collection of data or information to solve a problem, also in one school term).
It is evident, therefore, that practical investigations and experiments are crucial in Physical
Science, as reflected in the high weighting of 35 - 45% in the national examination.
2.3.2 PROCEDURE FOR PRACTICAL INVESTIGATION AND EXPERIMENTS IN THE NCS
According to the National Senior Certificate Handbook (DoE, 2009a), the Further Education and
Training (FET) band, focuses on teaching and assessing an investigative approach. The
motivation for teaching and assessing this type of approach is that it has the potential to reflect
what life is about (DoE, 2009a). An investigative approach not only teaches skills essential to
Science but also those skills essential to living in a modern world (DoE, 2009a). For these
reasons the handbook prescribes a guide to how this formal assessment may be weighted
according to the various learning outcomes, as reflected in table 2.1 below.

31
Table 2.1: An example of the Formal Programme of Assessment
SCHOOL BASED ASSESSMENT (25%)
EXTERNAL ASSESSMENT (75%)
Practical investigation Physics Focus LO 1: LO 2: LO 3 60-80%: 10-20%: 10-
20%
Practical investigation Chemistry Focus LO 1:LO 2:LO 3 60-80%: 10-20%: 10-20%
Research project LO3 focus (e.g. library/ internet research) LO 1: LO 2: LO 3 10-20%: 10-20% :60-
80%
Final Examinations
Two Controlled Tests Mid-year Examinations Preliminary
Examinations
Source: National Senior Certificate Handbook (DoE, 2009a: p.11)
The following is suggested as a guide of what should be assessed across an investigation (DoE,
2009c: p. 8):
1. Developing a hypothesis.
2. Manipulation of equipment measurement and observations.
3. Planning and designing.
4. Presentation of data.
5. Analysing, concluding and evaluating.
6. Communicating and presenting information.
The NCS presents policies and procedures on the assessment and what should be assessed. On
the other hand, most schools do not have laboratories and laboratory equipment as noted
earlier in section 1.1. So, following the above prescribed investigative approach to teaching and
learning clearly presents several challenges. For this reason, other resources such as computer
simulations should be investigated to determine whether they could be useful in achieving this
objective of the NCS which are also in line with constructivist learner-centred teaching
approach as discussed in the theoretical framework (section 2.10) of this report.

32
2.4 ELECTROMAGNETISM
Hair clippers, hairdryers, electric fans, blenders, electric bells and transformers are electrical
gadgets used these days. These electrical gadgets make use of the principle of
electromagnetism. Prescott (2006) defines electromagnetism as the combination of an
electrical field and a magnetic field and their interaction to produce a force. High school
electromagnetism basically consists of magnets, magnetic field lines, field around a straight
wire, the right hand grip rule, field around a circular wire and solenoid, electromagnets, the
Flemings left and right hand rules, force on current carrying conductor, the principles of
operations of motors and generators, electromagnetic induction, Faradays’ law, transformers,
power generation and distribution.
Albe, Venturini, and Lascours (2001) researched the ability of learners to apply mathematical
ideas when studying electromagnetism. They had two groups, 50 learners in a teacher training
programme and 64 Physical Science undergraduates. Those in the teacher training programme
were interviewed before a course on electromagnetism and were then asked in pairs to define
magnetic flux and explain its physical significance. The data from the interviews were used to
develop a multiple-choice test. The test was administered to the Physical Science learners at
the beginning of their degree course. Another diagnostic test probed their understanding of
magnetic field and its representation in diagrams. Albe et al (2001) found that, while most
students were able to state the formula for magnetic flux, many were unable to define it, or to
apply the formula to simple problems. They therefore concluded that many learners’
understanding was disconnected and applied incoherently.
Planinic (2006) also reported from a study conducted in Croatia and replicated in America that
learners exhibit difficulties in most conceptual areas in electricity and magnetism. The two
studies made use of the Conceptual Survey of Electricity and Magnetism (CSEM) which covers a
large conceptual domain and gives many opportunities for comparing the difficulties of
different conceptual areas in electricity and magnetism. The CSEM was administered as a post-
test to 84 Croatian learners in a calculus-based General Physics course at the University of
33
Zagreb. The most difficult area found among both the Croatian and American learners was
electromagnetic induction.
Two other studies, in Turkey and England conducted by Saglam and Millar (2006) where a
written test, consisting of 16 diagnostic questions was developed and used to survey the
understanding of electromagnetism of upper secondary school learners in Turkey (n = 120) and
England (n = 152). Similar conclusions have been reached that learners have a poor
understanding of the basic ideas of electromagnetism. From all these studies it is evident that
electromagnetism is possibly not well understood by learners even in high schools.
Electromagnetism is an important component of high school curriculum in many countries and
if learners were well equipped in conceptual areas of it, they should not struggle with it in their
higher education (Saglam & Millar, 2006).
In addition, Dori and Belcher (2005) also mentioned that, it is a problem understanding
magnetism, which has been studied to a much lesser extent than electricity, and this problem
seems to be even more pronounced due to the fact that humans are simply not equipped with
sensors to gauge magnetism. Although we can indirectly observe electricity as light generated
by current flowing through light bulbs, or felt by electric shocks, there is almost no sensual
indication of magnetic fields (Dori & Belcher, 2005)
Therefore, it appears teachers will have to come up with effective instructional designs to
enable learners to understand the fundamental ideas in electromagnetism (Saglam, 2010). This
is because, Saglam (2010) argues that many research in Science education have revealed that
learners in Science courses have many alternative ideas of the basic ideas of Science. But,
according to Duit (2009) even though we can find many research reports on learners’
understanding of the basic mechanics ideas in Physics, research on learners’ ideas in
electromagnetism is scarce.

34
In the field of electromagnetism, technology-rich environments such as computer simulations
are crucial, as they can enable the presentation of spatial and dynamic images and depict
relationships among difficult concepts for learners to understand (Dori & Belcher 2004). Dori
and Belcher (2004) involved media-rich software for simulation and visualization in freshman
electromagnetism to transform the way it was taught in order to increase students’ conceptual
and analytical understanding and decrease failure rates in this area of Physics. The approach
was designed to help students visualise, develop better insight, and conceptual models of
electromagnetic phenomena. The reform is centred on a collaborative learner centred
approach, with the use of visualisations. So Dori and Belcher (2005) contented that using
visualisations helps learners in understanding electromagnetism because in this way they could
make it possible for learners to see magnetic field lines, magnetic field lines moving from north
to south on a magnet, the right hand grip rule, and electromagnetic induction which normally
were considered unseen. Therefore, the researcher decided to use computer simulation to see
if it could help improve performance and conceptual understanding of grade 11 learners in
electromagnetism.
2.4.1 ELECTROMAGNETISM IN THE SOUTH AFRICAN CURRICULUM CONTEXT
The work schedule from DoE stipulates that, electromagnetism as a knowledge area should be
treated in two weeks of teaching in South Africa. Usually in each week, there are 4 single
periods and 1 double period for teaching in most schools for the Physical Science. This means 8
single periods and 2 double periods in the two weeks of teaching for electromagnetism. The
teaching time for Physical Sciences is 4 hours per week (DoE, 2011b and DoE, 2009b). So from
this DoE policy, one period is about 40 minutes long and the double periods usually meant for
practical work and assessments is about 80 minutes long.
This knowledge area is intended to be assessed at ± 37% weighting in the grade 12
matriculation examinations. The knowledge area has also been allowed a mark allocation of ±
55 of 150 marks in the Physics paper in these examinations (DoE, 2009). But according to the
chief examiner’s report on the 2010 matriculation examinations, learners performed

35
unsatisfactorily in electromagnetism (DoE, 2010a). And this is a course for concern. Therefore,
this research seeks to find a solution using computer simulation.
2.5 THE USE OF ICT IN EDUCATION
Historically, man has developed through the Stone Age, the Iron Age, the Industrial Age and
now finds himself in the Information and Communication Age. The history of education has
been characterised by successive innovations to enhance higher quality. For many years,
scholars have pursued more effective, efficient and satisfying teaching and learning practices.
Hermans, Tondeur, van Braak and Valcke (2008) reported that the first electronic computer,
intended to make Physics calculations easier, was constructed in 1939 by John Vincent
Atanosoff of Iowa State University. Since the invention was designed to reduce the laborious
demands of Physics calculations, it is important to trace how this computer has been used, is
being used at present and will likely be used in Physics education in the future (Mlabo, 2007). In
this regard, Murdock (2004) presents a coordinated chronological sequence of the history of
technology in the classroom in the United States (US), as follows:
1951 - Television is used for the first time in United States primary schools.
1958 - The National Defence Education Act of the US brings new technology into vocational
education.
1960 - More money is put into education which sees some growth in the use of technology
in the classroom.
1963 - The Vocational Education Act is passed which allows for more money to support the
use of technology in schools.
1965 - The Elementary and Secondary Education Act brings new money into schools for
technology. Mainframes and minicomputers are introduced in some schools, but most are
used for administration or for school counseling.
1981 - International Business Machines (IBM) is the first mainframe manufacturer to
develop a personal computer (PC); drill and practice computer-assisted instruction (CAI)
gains acceptance in schools; and the first educational drill and practice programs are now
developed for personal computers.

36
1986 - 25 % of high schools use personal computers for college and career guidance, K-8
schools buying mostly Apple II and Macintosh computers, high schools buying mostly DOS-
based clones.
1990 - Multimedia personal computers are developed; simulations, educational databases
and other types of CAI programs are being delivered on CD-ROM disks, many with
animation and sound.
1992 - Schools start using gopher servers to provide students with on-line information.
1994 - Most US classrooms have at least one PC available for instructional delivery.
1996 - Many schools are rewiring for Internet access; a few schools install web servers and
provide talent with a way to create instructional web pages.
1997-2007 - Educational software becomes more useful and interesting to students as
graphics and video are incorporated. Larger computer storage capacity and the growing
prevalence of CD-ROM and DVD drives in personal computers make it easier for educators
to store large graphic and video and sound files for educational applications.
From this chronological sequence of the history of the use of ICT technology in the classroom, it
is evident that greater opportunities in teaching and learning have been opened up by the
growth in the development of ICT. For instance, personal computers today are much faster than
the cumbersome machines used in classrooms in the 1980s. Owing to this improvement,
computers are now easier to use than in the past; that is, they are more user friendly. In
addition, more peripheral devices such as scanners, printers, projectors and cameras have been
developed which makes using ICT even more exciting.
2.5.1 BACKGROUND TO ICT USE IN AFRICA
Literature on the history and development of technology use in the classroom in Africa is a
challenge to keep track of (Trucano, 2010). But according to Arowolo (2009), Zietsman’s (1984)
master’s research report which evaluated diagnostic and remedial aspects of a microcomputer
program on the topic of speed, in South Africa is an indication that technology and computer
simulations have been in use in South African schools since as far back as 1984. Evidence from

37
eLearning Africa website “More than Television,” (2008) show that television (TV) and video
technology was introduced into the South African classroom by the Discovery Channel Global
Education Partnership (DCGEP). The DCGEP launched the Learning Centre project at
Umkhathizwe Primary School in October 1998. The aim was to develop learning content in the
Physical Sciences, Cultures, Geography, Health, Biology and many other subjects in close
collaboration with the communities in which DCGEP works. This was intended to meet the
communities’ specific needs and to produce culturally-relevant programming. Besides serving
educational purposes, the Learning Centres also provided the communities with access to
national and international news, as well as affording them the opportunity to enjoy live sports
events.
Farrel and Isaacs (2007), in their survey of ICT and education in Africa, maintain that ICT use in
education is at a particularly dynamic stage in Africa, as there are new developments and
announcements happening on a daily basis somewhere on the continent. Their survey reported
on Computer Penetration Ratios at schools in Selected African Countries in 2006. The ratios are
shown in table 2.2 below. This table indicates that computer penetration in some African
countries in 2006 was very low, as low as 1.1% in Mozambique and 2.5% in Ghana even though
Egypt has a 100% penetration.
Table 2.2: Computer Penetration Ratios at Schools in Selected African Countries, 2006
Country Number of schools
Number of schools with computers
Percentage of schools with computers
Egypt 26000 26000 100%
Ghana 32000 800 2.5%
Mozambique 7000 80 1.1%
Namibia 1519 350 22.1%
South Africa 25582 6651 22.6%
According to this survey, 13 African countries had developed a national ICT policy by the year
2000, policy development was underway in 10 countries while in the remaining 30 countries

38
there was no policy development at that point. The table below (table 2.3) illustrates the
development of national ICT policy from 2000 to 2007.
Table 2.3: Development of National ICT Policies 2000–2007
Status of National ICT Policy Development by Country
2000 2005 2007
Policy in place 13 28 36
Policy under development 10 15 12
No development underway 30 10 5
Total 53 53 53
Table 2.3 reveals that there is progress in the status of national ICT policy development in
Africa. The point that future socio-economic development will need to embrace the use of ICT
appears to be widely recognised by governments throughout Africa and is manifest in the
number of countries that have a national policy for ICT in place or under development. The
South African government in a white paper on e-education, for example, stated it’s believe,
that ICT has the potential to improve the quality of education and training (DoE, 2004), and this
is what this research seeks to prove.
2.6 ADVANTAGES OF ICT USAGE IN THE TEACHING AND LEARNING OF PHYSICS
People remember visual information more easily than verbal information. Having access
to visual materials and explanations may well extend people's ability to learn,
particularly in the case of those who have difficulty learning from books and lectures
(Collins, 1991).
At present, various ICT applications exist which aim to stimulate learners' active engagement.
These create conditions that would be very difficult, expensive or time-consuming in the
Physics laboratory and allow learners the experience of working under such conditions in the
classroom (Jimoyiannis & Komis, 2001). Among such ICT applications, computer simulations are
39
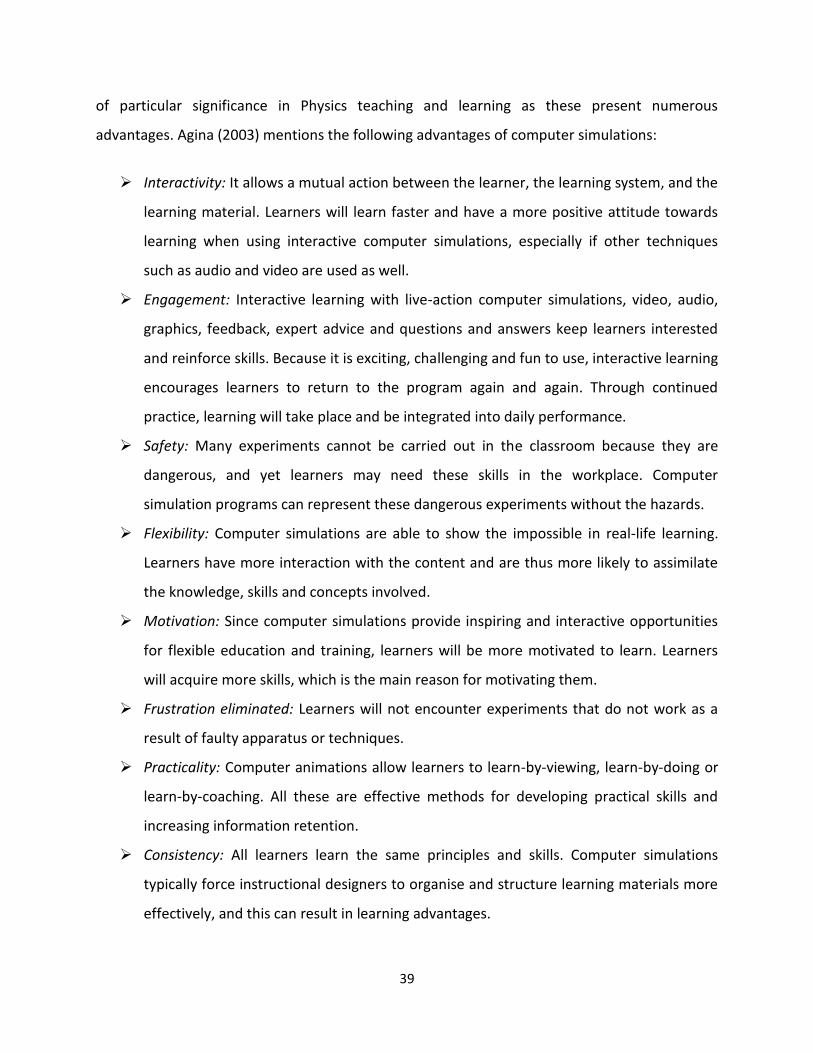
of particular significance in Physics teaching and learning as these present numerous
advantages. Agina (2003) mentions the following advantages of computer simulations:
Interactivity: It allows a mutual action between the learner, the learning system, and the
learning material. Learners will learn faster and have a more positive attitude towards
learning when using interactive computer simulations, especially if other techniques
such as audio and video are used as well.
Engagement: Interactive learning with live-action computer simulations, video, audio,
graphics, feedback, expert advice and questions and answers keep learners interested
and reinforce skills. Because it is exciting, challenging and fun to use, interactive learning
encourages learners to return to the program again and again. Through continued
practice, learning will take place and be integrated into daily performance.
Safety: Many experiments cannot be carried out in the classroom because they are
dangerous, and yet learners may need these skills in the workplace. Computer
simulation programs can represent these dangerous experiments without the hazards.
Flexibility: Computer simulations are able to show the impossible in real-life learning.
Learners have more interaction with the content and are thus more likely to assimilate
the knowledge, skills and concepts involved.
Motivation: Since computer simulations provide inspiring and interactive opportunities
for flexible education and training, learners will be more motivated to learn. Learners
will acquire more skills, which is the main reason for motivating them.
Frustration eliminated: Learners will not encounter experiments that do not work as a
result of faulty apparatus or techniques.
Practicality: Computer animations allow learners to learn-by-viewing, learn-by-doing or
learn-by-coaching. All these are effective methods for developing practical skills and
increasing information retention.
Consistency: All learners learn the same principles and skills. Computer simulations
typically force instructional designers to organise and structure learning materials more
effectively, and this can result in learning advantages.

40
Immediate feedback: Learners receive immediate feedback from the computer
simulations and this enhances their skills and abilities.
Isolating specific actions in a complex sequence: Computer simulations can show motion
for part of a complex operation, thus clarifying functions that would otherwise be
impossible to isolate and view independently.
These advantages particularly encouraged me to undertake this study because I would like to
contribute to the teaching and learning of Physics, especially electromagnetism, by making
teaching more practical, more flexible and more motivational for both teachers and learners.
2.7 DISADVANTAGES OF ICT USAGE IN THE TEACHING AND LEARNING OF PHYSICS
Although there are many advantages in the use of computer simulations, the application of the
technology still has its limitations and disadvantages. According to Lai and Kritsonis (2006),
research findings show that the use of computer technology has a positive effect on the
achievement levels of learners but still has its limitations and weaknesses, such as
Cost: the first drawback of a computer and its technologies is that they raise educational
expenses and damage the equity of education. This was also observed by Gips, DiMattia
and Gips (2004). But in this study one computer with a data projector was used to
present the lessons, as discussed in chapter 4 sections 4.2.2 of this report. In my view,
this is less costly than establishing a school laboratory and equipping it.
Isolation: Loss of communication and interaction between learner and teacher, and
among learners themselves. Here the teacher in this study used leading questions to
introduce and to reinforce concepts, as discussed in detail in chapter 4 section 4.2.2 of
this report. So learners were involved and they communicated with each other and also
with the teacher. Learners were put in groups to discuss concepts among themselves
and then give feedback by means of verbal reports to the teacher and the class.
Knowledge: it is essential that both teachers and learners have knowledge of basic
computer operations before they can apply computer simulations to assist in teaching
and learning. This disadvantage was also addressed in this study by training the teacher.

41
The teacher was trained by the researcher to use the simulation software, the
computer and the data projector in his teaching. This is reported in detail in chapter 3,
section 3.6 of this report.
2.8 ACCESS TO ICT IN EDUCATION
Mumtaz (2000) reports that evidence of good practice in the use of ICT is invariably found in
those schools that also have high quality ICT resources, and that a lack of computers and
software can seriously limit what teachers can do in the classroom. The importance of schools
being well resourced in ICT equipment is also highlighted by Becta publication, primary schools
– ICT and standards (Becta, 2003). The inability of a teacher to gain access to ICT resources may
be the result of a number of factors and not always simply because the hardware or software is
not present within the school. In the Becta survey of 170 teachers, for example, when a large
number of respondents identified access to resources as a problem (20.8%) they were actually
referring to different kinds of access problems. Some respondents were indeed referring to a
lack of resources at the school, while others were referring to the poor quality of the resources
that were available. A number of respondents in the Becta survey suggested that although
there might be an array of software now available for use in the classroom, much of this
software was not appropriate or would not actually enhance a lesson in any way. This is
supported by Guha (2000) who found that poorly designed software, and a lack of time for
teachers to design their own software, often causes teachers to “give up” and choose not to
make use of ICT (Becta, 2004). While this is true, in the current study, the simulation software
was provided by the researcher and the teacher was also trained to be able to use the software.
2.9 COMPUTER SIMULATION AND MODELLING
Simulation software involves imitating real or imaginary situations by using the computer to
represent the situation through mathematical models with which the user interacts. The user
responds to situations presented by the program to affect some particular outcome. With
practice and experience, the learner is able to determine the factors and variables which the

42
programmer has incorporated into the system and replay their performance to try out possible
improvements (Bransford, Brown, & Cocking, 2000). The use of simulation software in technical
training has been successful, with training times diminished by as much as 95% (Bransford et al,
2000). Studies have shown significant gains in achievement scores in areas such as Mathematics
when simulation and higher order thinking software is used (Schacter, 1999).
The demarcation between simulations and modelling is analogous to that between toy cars and
Lego bricks (Bliss & Ogbom, 1989). Simulations can be classified as models with predefined
rules of operation and interaction among objects they encompass. They can be used to support
exploratory learning activities in which learners explore the simulation by manipulating the
variables or the parameters provided, but not the underlying theories and rules of operation
(Bliss & Ogbom, 1989).
Modelling software differs from simulation software in that the computer provides the tools to
create a model for a real or non-real environment. It provides the students with greater scope
for visualising, designing and controlling an environment (Bransford et al, 2000; Riel, 1998).
When used in this way, the computer follows the instructions provided by the learner. The
learning situation revolves around the task of creating the environment and instructions to
investigate that environment. Modelling therefore extends the scope of learning from purely
exploratory to encompassing more expressive activities (Ogbom, 1998).
Simulations help learners to visualise the real world, making the understanding of concepts
easier. Simulations can be used where phenomena cannot be observed and explored in the real
world. Trey and Khan (2008) used simulations in their study to help learners observe a
phenomenon which could not be observed in the real world and found that learners achieved
better results after the instruction.
In their study, Rotbain, Marbach-Ad and Stavy (2008: p.54) reported four major advantages
from the learners’ perspective of working with computer simulations:

43
The first one is that the activity helped the learners to visualize the abstract concepts
and processes of molecular genetics by representing the subject matter in a more
concrete manner. Secondly, it enabled them to work individually in their own time, to
run the animation over and over as much as they needed, while controlling the pace of
the simulation. Also, the individual animation activity freed the teachers to move
between the learners and give them direct feedback as they worked. The last of the
advantages was the contribution of the activities to the diversification of the lessons and
the interactivity and the immediate feedback of the animation.
In the present study, the researcher chose to use simulations rather than modelling because
the intention was not that learners explore the concept of electromagnetism but rather to find
out whether a group of learners (the experimental group) would perform better than another
group (the control group) after an intervention using simulation software from the Physics
Education Technology (PhET) project based at the University of Colorado at Boulder, Colorado,
USA, and simulations from the Plato Learning Centre based in the UK.
2.9.1 PHYSICS EDUCATION TECHNOLOGY (PhET) PROJECT
The Physics Education Technology (PhET) project creates useful computer simulations for
teaching and learning Physics, Chemistry, Biology, Earth Science and Mathematics and makes
them freely available from the PhET website (http://phet.colorado.edu) (Perkins, Adams,
Dubson, Finkelstein, Reid, Wieman, and LeMaster, 2006). According to Wieman, et al (2007),
the goals for these simulations are to increase learners’ engagement, improve learning and
improve beliefs about and approach towards learning. There is a collection of these simulations
free online created for teachers and learners that demonstrate principles in the natural
Sciences especially. These interactive simulations can be used in a classroom or in laboratories
to enhance teaching and learning. PhET simulations are developed using the results of
education research and feedback from teachers, and are tested in learner interviews and
classroom studies (McKagan, Perkins, Dubson, Malley, Reid, LeMaster & Wieman, 2008).

44
2.9.2 PLATO LEARNING CENTRE
The Plato Learning Center also creates useful computer simulations for teaching and learning
Physics, Chemistry and Biology. The computer simulations from the Plato Learning Centre based
in the UK used in this research was not free like the PhET simulations. It came on a CD - ROM
which can be purchased to be installed on a computer. The CD - ROM is titled the Multimedia
Science School (MSS) 11–16 Edition, Version 2.0. MSS 11–16 is an exceptional multimedia
resource to support the teaching and learning of secondary Science. Developed by experienced
teachers, MSS 11–16 is curriculum-focused software that covers topics in Physics, Chemistry
and Biology (“Plato Learning Centre”, 2005). This Version 2.0, the latest development of the
software package as at 2005, has been enhancing Science teaching and learning in schools
around the world for over five years (“Plato Learning Centre”, 2005). In early 2005, 50% of
secondary schools in the UK had a licence to use at least one of the teaching tools that feature
in MSS 11–16 (“Plato Learning Centre”, 2005). The CD-ROM features 45 highly interactive
multimedia teaching tools that can transform the explanation of difficult concepts such as the
Electromagnetism, engaging learners and provoking effective thinking and learning. More
information can be found from their website (www. http://platolearning.co.uk).
2.10 THEORETICAL FRAMEWORK
Constructivists support learner-centred approach to teaching and suggest that learning is more
successful when learners are actively involved in the learning process rather than when learners
are made to receive knowledge passively. Constructivists’ learner-centred teaching, helps to
develop leaners with critical thinking skills, creative thinking skills, and problem solving skills
(Friedrich, & Hron, 2011). According to Wieman, Adams and Perkins (2008), research has
indicated that learners learn better when they construct their own understanding of scientific
ideas within the framework of their existing knowledge. In order to accomplish this process,
learners must be motivated to engage actively with the content and they must be able to learn
from that engagement. Interactive computer simulations can meet these two needs; the goals
for these simulations, according to Wieman, Adams and Perkins (2007), are increased student
engagement, improved learning, and improved beliefs about and approach towards learning. It

45
is hoped therefore that the use of interactive computer simulations in the teaching of
electromagnetism holds the key to learners’ visualisation of the abstract concepts inherent in
this aspect of Physics.
This study is framed by a constructivist theory which has its roots in the psychology-based
traditions going back to Dewey (1966), Bruner (1966), Piaget (1970) and Vygotsky (1978). The
major theoretical perspectives which support Computer-Based Instruction (CBI) as a means of
enhancing student learning are based on constructivism, the leading learning theory of the
1990s. Both these theories have captured the interest and attention of teachers and
educational technologists because they have important implications for the design and use of
CBI. Indications are that advances in computer technology can help to bring about the
development of learner-centred learning environments through the use of a range of tools and
techniques which draw heavily on constructivist approaches. The use of constructivism as an
approach to the design of learning environments has major implications for the design of
computer-based instruction.
A critical component of theories of constructivism is the concept of the zone of proximal
development (ZPD), based on the work of Vygotsky (1978), which posits that learning takes
place through the learner completing tasks for which support (scaffolding) is initially required.
This support may include a tutor, a peer or a technology such as the application of computer
simulations. This has led to the use the term computer supported learning. Computer
supported learning environments are those in which computers are used either to maintain a
learning environment or to support the student learner in this Vygotskian sense (DeCorte,
1990; Mevarech & Light, 1992). This technology was used in this study to help create the types
of learning environments and the types of support for learning that are known to be best, but
have been ignored or not implemented widely in the past (Glickman, 1991).
Constructivism and learner-centred learning paradigms are supported by advancements in
technology such as computer simulations. Vygotsky (1978) proposed that learning requires two
46
mediation tools, tangible or technical tools and intangible tools. The role of tangible tools such
as computer simulations as a means of mediation in this constructivist theoretical framework is
that they will serve as the scaffold that the learners need to construct knowledge. This position
is supported by Kennedy and McNaught (2001) who point out that carefully designed
computer-based cognitive tools can scaffold learning.
2.11 SUMMARY
The chapter presented literature review that is relevant to the study. The literature reviewed
includes; the process of teaching and learning, role of experiments in physics,
electromagnetism, the use of ICT in education, advantages and disadvantages of ICT usage in
the teaching and learning of physics, access to ICT in education, computer simulation and
modelling. The theoretical framework is also presented in this chapter.

47
CHAPTER 3
RESEARCH METHODOLOGY
3.1 INTRODUCTION
In order to determine the impact of computer simulations on the teaching and learning of
electromagnetism in grade 11, a case study was done in one school in the Mpumalanga
Province. A mixed method research approach was followed by using quantitative research
methods to answer the first research question (see section 1.5 and 3.2) and qualitative research
methods to answer the second and third research questions (see section 1.5)
3.2 RESEARCH DESIGN
“Sometimes it is just not possible to randomly assign individual participants to groups. For
example, to receive permission to use school children in a study a researcher has to agree to
keep students in existing classrooms intact” (Gay & Airasian 2003: p. 378). This is the situation
the researcher was faced with and this necessitated the choice of quasi-experimental design for
the study. The non-equivalent control group design was used where two existing grade 11
Physical Science classes in a high school were the sample. One of the classes was taken as the
experimental group(x1) and the other class as the control group(x2).
The school insisted that the two classes were formed randomly and therefore constituted two
classes of similar academic abilities. Since this can pose validity threats to the research findings,
their previous term marks (June Exams) were obtained (Appendix T) by the researcher and a t-
test was calculated using statistical analysis tools in Microsoft excel and the results analysed.
The mean, the standard deviation, median and the t-test were calculated using this approach; (t
= 0.906, df = 101, p = 0.3672) from the excel calculations. The t-critical two tail is 1.984
approximately 2.00 at P > 0.05. The interpretation of this analysis is that since the t-critical
(2.00) is greater than the t-statistics (0.906) at P > 0.05; there is no statistically significant
difference in the achievement of the two classes in the June exams. This t-test therefore

48
established that the two classes were of the same academic ability before the treatment.
Details of the t-test calculations can be found in table 4.1 in chapter 4.
3.3 PARTICIPANTS
The participants of the study were two intact Physical Science classes and their two usual class
teachers in a high school in Mgwenya Circuit of Mpumalanga Province of South Africa. The two
grade 11 Physical Science classes consist of 54 learners in grade 11A and 53 learners in grade
11C. Grade 11A was chosen randomly to form the control group while grade 11C became the
experimental group. In total the learners’ population was 107 in the two groups. The ages of
the participants ranges from 15-19 years.
The two teachers’ academic qualifications were the same. Mr C teaching grade 11A had a B.Ed.
Science degree and four years teaching experience while Mr E teaching grade 11C also had a
B.Ed. Science degree and three years teaching experience. Classroom observations were done
by the researcher prior and during the intervention to ascertain that the teachers were
comparable in their ways of teaching.
The school randomly distributed the learners into the two classes and they are of comparable
academic ability (see section 3.2). The school is one of the few well-resourced schools in the
province and it is a Dinaledi school. The school has a computer Science laboratory well
equipped with computers, as well as data projectors and overhead projectors. The school also
has a Science laboratory with some laboratory equipment. This school was easily accessible to
the researcher. The above reasons motivated the researcher to select the school for the study.
3.4 INSTRUMENTATION
Data were gathered using three instruments. They are the observation schedule, the pre-test,
post-test for learners, and the structured questionnaires for both the learners and the teachers
(Appendix A, B, C and D respectively). The two questionnaires were similar in sections B and C
but slightly different in sections A.

49
3.4.1 CLASSROOM OBSERVATION SCHEDULE
The observation schedule was used when the researcher did classroom observation during the
intervention period. This was to enable the researcher to collect data on the teaching of the
teachers involved in the study to make sure that they are on the same level with regards to
their content knowledge of electromagnetism as well as following what was expected from
them with regards to either traditional teacher-centred instruction or learner-centred
instruction using the computer simulations. The observation schedule sought to collect
information on how the teacher introduces the lessons, learner involvement in the lessons,
teacher’s ability to teach the content (electromagnetism) effectively and whether teacher
follows the work plan and the curriculum in the teaching.
3.4.2 PRE-TESTS AND POST-TESTS
The Pre-tests and post-tests were conducted to measure the impact of the simulation software
on the performance of the learners in the experimental group after the teaching intervention.
The pre-test, post-test were the same, this is to ensure that the level of difficulty of the two
tests are maintained, and the test being the same for the two groups. The test consists of
twenty multiple choice questions and five short-answered written questions. The questions in
the test were adapted and slightly modified from three sources. Details of the slight
modifications are given in section 3.5.1. The questions were from:
South Africans matriculation past Physical Science (Physics) examination papers
Commonly used South African Physical Science textbooks and
Modelling teachers question banks CD2 Part 1.
3.4.3 QUESTIONNAIRES
There were three sections in the questionnaire. Section A of the questionnaire sought
background information, while sections B and C sought information to enable the researcher
answer research questions 2 and 3. The statements in sections B, and C were adapted and
modified from the interview transcript of students and teachers by (Arowolo, 2009). Some of
the questions in the interview transcripts were modified into a five point Likert scale

50
questionnaire. The Likert scale questionnaire which was a structured, close-ended
questionnaire was chosen over the open-ended type of questionnaire for the following reasons;
To avoid unclear or useless responses that open responses may produce.
To avoid the difficulty of scoring open-ended questions or what is usually referred to as
free response questions (Gay & Airasian, 2003).
3.5 VALIDITY AND RELIABILITY OF THE INSTRUMENTS
3.5.1 VALIDITY OF THE INSTRUMENTS
For validation, the pre-test, post-test and the observation schedule were given to three experts
in Physical Science in the Ehlanzeni Region of education in the Mpumalanga province of South
Africa to read and make corrections and suggestions. This is to ensure both face validity and
content validity. Two of these experts have been teaching Physical Science in the high school
for six and eight years respectively. They both hold B.Ed. degrees in Science education. One was
the head of Science department and has six years’ experience of teaching Physical Science. The
second teacher at the time was a principal of a high school and had eight years’ experience in
teaching Physical Science in a high school as well. The third expert was at the time the
Curriculum Implementer (CI) of Physical Science in the Ehlanzeni region of education. These
three experts made valuable suggestions on the test as follows:
Question one of part 1 had its multiple choice answer (b) being; the direction of the
switch. It was suggested that this option should change to, the switch. The reason being
that a switch has no direction and may mislead or confuse the learners.
The phrase, “the north pole of” or “the south pole of” was suggested to be inserted in
question 4 of part 1. This was to prevent the question from having two of the multiple
choice answers from being the right answers. These two options were options (a) and
(b).
Question sixteen of part 1 had a multiple choice option reading “the magnetism is
turned off”. It was changed to “the magnetism is lost” for the clarity of that multiple
choice option.
51
Originally, all the questions in part 1 had option (e); none of the above. But this option
was removed from the options of all the questions entirely. As stated by Gay & Airasian,
(2003: p. 152) “when constructing a test, one must avoid options like none of the above
or all of the above”.
The three experts agreed that the test adequately measures all the learning outcomes or
objectives of the topic electromagnetism in grade 11 Physical Science. On the observation
schedule, there was no correction or suggestion made.
The structured questionnaire was also given to these three experts mentioned above to read
and answer. They were also requested to make suggestions regarding omissions, ideas that
may be important and that may have been left out and those ideas that should be removed.
There was a concern of clarity of one statement on the questionnaire. The statement reads;
“ICT usage makes teaching very descent”. It was therefore suggested that the word descent be
clarified or the statement removed. Hence the statement was removed for lack of appropriate
word or phrase to simplify the statement.
In addition to these views of the three experts, the questionnaire was given to the pilot sample
and their teacher for pre-testing. The pilot sample was also encouraged to make suggestions to
improve clarity of the statements in the questionnaire. But this time, no comments or
suggestions came up even though the researcher was present at the time to pick up problems
and suggestions regarding clarity and ambiguity of the statements in the structured
questionnaire.
3.5.2 RELIABILITY OF THE INSTRUMENTS
Reliability tells test users about the consistency of the scores produced in a test and Validity
tells test users about the appropriateness of a test. Both are therefore important for judging
the suitability of a test or measuring instruments (Gay & Airasian, 2003: p. 141). However, (Gay
& Airasian, 2003: p. 141) argue that “a valid test is always reliable but a reliable test is not
always valid”. For this reason the reliability of the pre-test, post-test was established after the
validity considerations, using the Spearman-Brown formula. For this purpose, the test was given
52
to the pilot sample for testing. The pilot sample wrote the test twice within three weeks. The
marks obtained (Appendix E) were used to calculate the Spearman correlation coefficient using
SPSS. The marks yielded a Spearman correlation coefficient of 0.65. Appendix F shows a
detailed table of the SPSS results of the calculation of the Spearman correlation coefficient. This
was then used in the Spearman-Brown formula to determine the reliability of the test
instrument. The Spearman-Brown formula yielded a reliability coefficient of 0.79. The
interpretation of this coefficient of reliability follows from the fact that reliability is the degree
to which a test consistently measures whatever it measures. Reliability is usually expressed
numerically ranging from 0.0 to 1.0; so that a high coefficient indicates high reliability. Looking
at the range 0.0 to 1.0 for estimating the coefficient of reliability, the reliability of 0.79 for the
pre-test, post-test used in this research can be said to be established.
It is important that observation is as objective as possible. Therefore, observers must not bring
into the observations, their own interests and biases. To measure the reliability of the
observation schedule, three observation practice sessions were arranged by the researcher in
the school used for piloting. In the three practice sessions, the researcher and a colleague
Physical Science teacher, who is also a registered masters student at the Institute for Science
and Technology Education (ISTE) at the University of South Africa (UNISA) observed the three
lessons together but independently. The results were compared and checked for consistency
and agreements at the end of each observation session. There was about 89% agreement on
the statements in the schedule for the three practice sessions. After the three practice sessions
the researcher used the observation schedule to observe lessons in the main research study.
After each observation, field notes were written immediately to ensure that, memories of what
was observed during the lesson was intact as much as possible.
3.6 METHODOLOGY
In this study, the researcher used a quasi-experimental design in which the performances of
participants in control and experimental groups were used as basis to establish and explain the
impact of computer simulations on the teaching and learning of electromagnetism in grade 11
53
Physics. In this design, the participants in the two groups first wrote a pre-test. The two grade
11 classes which constituted the two groups were 11A and 11C. The 11A class was randomly
used as a control group and 11C as the experimental group. The two usual teachers of the two
classes were maintained and used as the teachers in the research to maintain continuity in the
school’s academic programme. For the purposes of anonymity, the teacher for the control
group will be called Mr. C and the teacher for the experimental group will be called Mr. E. This
design is consistent with many other similar studies, (e.g. Caner & Ogan-Bekiroglu, 2009; Chee,
Munirah et al, 2009; and Arowolo 2009).
For the purposes of this research, and for the two teachers to be at the same level for the
research, the researcher and the two teachers met for two hours from 1:20pm – 3:20pm after
their lessons for the day. At that meeting, topics to be taught under electromagnetism were
reviewed and reorganized for the purposes of the research. This took about one hour after
which the teacher for the control group left the meeting and the teacher for the experimental
group was trained by the researcher to use the PhET simulations and simulations from the Plato
learning centre to teach electromagnetism. The training took place for approximately one hour.
Details of the descriptions of the lessons are found in chapter 4 sections 4.2.1 and 4.2.2.
The control group was taught electromagnetism using the traditional teacher-centred teaching
approach together with real laboratory experiments and demonstrations. The experimental
group was also taught electromagnetism using a more learner-centred teaching approach using
demonstrations aided by computer simulations of the concepts using PhET simulations and
simulations from the Plato learning center. The intervention lasted for two weeks. The
breakdowns of the lessons are detailed in section 4.2.1 and 4.2.2. After these lessons, the two
groups wrote a post-test which was the same as the pre-test. As in the pre-test, a t-test was
calculated using the marks obtained in the post-test. The results of the t-test on the post-test
were compared in order to determine the impact of the computer simulations on the teaching
and learning of electromagnetism in grade 11 Physics.

54
Also, the test items were analysed for the two groups to ascertain the levels of knowledge
gained in the various concepts under electromagnetism. Details of this analysis are shown in
4.3.6 and 4.3.7. For the questionnaires, the index of agreement was calculated to help answer
research questions 2 and 3. Section 4.4 presented the detailed analysis of the index of
agreement.
After the lessons and the tests, the two groups came together in the Science laboratory where
there were presentations by the two teachers involved in the research. The presentations were
on the highlights of the two teaching methods used in the research. This is to give a feel of the
computer simulations to the control group too and also to enable both groups to answer a
structured questionnaire. The questionnaire was to enable the researcher to answer research
questions 2, and 3. Figure 3.1 below, diagrammatically illustrates the research procedure
followed in this study.

55
Experimental Group
Figure 3.1: Research procedure
Control Group
Pre - test
Normal teaching (teacher E),
&
Simulations (demonstrations)
Normal teaching (teacher C)
&
Practical work (demonstrations)
Pre - test administered as post - test
Demonstrations of lessons by the two teachers to the
two groups in the Science laboratory.
Answering questionnaires

56
3.7 PILOT STUDY
Constructing a test is very important in research, since it impacts directly on the kind of data
that are likely to be produced. It is therefore crucial that, before the actual research study,
questions such as whether the research instruments are asking for what the researcher wants
to establish must be carefully considered by the researcher. These questions regarding validity
and reliability of research instruments are vital. Gay (1981) cited in Makomosela (1996) argues
that a test is not valid per se; it is valid for a particular purpose and for a particular group. For
this reason, a pilot sample was chosen and used to validate the instruments used in this study.
The sample used as pilot in this study comprises of one grade 11 Physical Science class, of 35
learners and their Physical Science teacher in another school. This school is located in the White
River circuit of the Ehlanzeni region in the Mpumalanga province of South Africa. This circuit is
the second closest circuit to the Mgwenya circuit where the actual study took place. The
Physical Science teacher in the sample is well qualified and holds a B.Sc. degree in Physics and a
diploma in education similar to teachers Mr. C and E. This teacher integrates computer
simulations in his lessons. This motivated the researcher to choose his class for the piloting.
Before the pilot study started the teacher has already taught electromagnetism to his grade 11
class. Therefore, this makes this pilot sample appropriate to be used for piloting the pre-test,
post-test and also the questionnaire. This teacher was approached by the researcher and he
willingly accepted the challenge for his class to be used as a pilot in this study. Three meetings
followed within three weeks. The first meeting was an introduction to the study and the
reasons were conveyed. The sample wrote the pre-test and took approximately 40 minutes to
complete. The second meeting was used to answer the questionnaire and during the third
meeting, the sample wrote the same test again to enable the researcher to check for the
reliability of the test. The test scores are presented in appendix E.

57
3.8 ETHICAL CONSIDERATIONS
3.8.1 OFFICIAL PERMISSIONS
The researcher applied for ethics clearance and received approval from the Ethics Review
Committee of the University of South Africa, and also applied to the Mpumalanga Department
of Education for permission to conduct research in a school in the Mgwenya circuit of the
province and received approval. These ethics clearance documents can be found in Appendices
J and K respectively. These are requirements before any research can be carried out in the
University of South Africa and in the Mpumalanga Department of Education. This is to ensure
that the research done by the students of the university complies with the protection of the
rights of the subjects as well as to ensure that due process is followed. The following paragraph
describes how the researcher obtained ethics clearance from other stake holders in the study.
3.8.2 TEACHERS, LEARNERS AND PARENTS PERMISSIONS
Since the principal, teachers and learners as well as parents are required to give consent in any
research, especially where minors in school are involved, their informed consents were sought
through letters. These letters can be found in Appendices L, M, and N. Since they are
instrumental to the success or failure of the research, the researcher believes that he has
particular responsibility to the teachers and learners as subjects of the study. One of the
responsibilities of the researcher to the participants in this study was to ensure that they are
protected from any victimization, information distortions or any other forms of practices that
may infringe on their rights as participants in the study. The researcher was guided by the fact
that participants in a research study have the right to be informed about the aims, purposes
and likely publication of findings of the research and of potential consequences for participants,
and to give their informed consent before participating in the research. For this reason, the
researcher met with the teachers and the learners to be involved in the study and explained to
them what will be required of them in the research. It was also emphasized to them that
participation in the study is voluntary and that nobody will be victimised in any way as stated in
their ethics letters. They could also withdraw from the research if they wanted to. Consent
forms (Appendices P, Q, R, and S) were later filled and signed by the teachers, learners, parents

58
and the principal to allow the research to be conducted. In this study all the teachers and
learners who signed the forms continued throughout.
3.9 SUMMARY
The chapter described the research design, the methodology used in carrying out the study and
the participants in the study. It outlined the instruments used, how the instruments were
constructed, and the validity and reliability of the instruments was also discussed. Furthermore,
the chapter reported on the pilot study, methods of analyzing the data collected, and the
ethical procedures followed. The data collected and analysis will be discussed in the next
chapter in order to answer the research questions.

59
CHAPTER 4
PRESENTATION AND DATA ANALYSIS
4.1. INTRODUCTION
In this chapter, the data and the analysis of data are presented. The analysis is to help answer
the three research questions which guided this research. The three research questions are:
1. Does the use of computer simulations have an impact on the performance of grade 11
learners in electromagnetism?
2. To what extent does the use of computer simulations influence the learning of
electromagnetism in grade 11?
3. To what extent does the use of computer simulations influence the teaching of
electromagnetism in grade 11?
Two tests were conducted, a pre-test and a post-test. The scores of these two tests were
analysed quantitatively using the t-test to form the basis for comparison of the experimental
group and the control group involved in the research. The t-test was used to determine
whether the means of the post-test scores of the two groups were statistically significantly
different from each other. This analysis was used to determine whether the null hypothesis
should be accepted or rejected.
Classroom observations were done by using a classroom observation schedule to ascertain
whether the teachers were following the work plan as agreed on by the two teachers and the
researcher. The observation schedule also helped to record the teaching methods used by the
two teachers in their six lessons.
Questionnaires were also used to collect data to help answer research questions 2, and 3. This
was also analysed quantitatively using Microsoft excel spread sheets. The questionnaire has
three sections, namely A, B and C. Section A is to collect data on the background of the
respondents, sections B and C seeks data to help answer research question 2 and 3.

60
4.2. OBSERVATION OF LESSONS OF THE TEACHERS
Before the research started, the researcher observed the lessons of the two teachers who took
part in the research. It was observed that they were following a common work plan which they
had agreed upon earlier in the year. They were both teaching electricity when the researcher
went to observe their lessons. The two classes do not have Physical Science lessons at the same
time of the day. So, it was convenient for the researcher to observe the lessons, one after the
other. The following is a report of the six lessons of the two teachers, starting with Mr. C’s
lessons followed by Mr. E’s lessons.
4.2.1 MR. C’S LESSONS
Mr. C taught the topics in six lessons, of four 40 minutes periods and two 80 minutes periods.
Two of the 40 minutes periods were extended by about 15 minutes each, because these two
periods were last periods. This was agreed on by learners and the teacher to allow for
completion of all the topics within a specified time, so it did not pose any problems as learners
were prepared to stay on 15 minutes after school twice for the lessons. Below are the details of
Mr. C’s lessons as observed by the researcher using the observation schedule (Appendix A).
These details of the observation of lessons given below are extracted from appendix A1 to A6
and field notes taken during the lesson observations.
LESSON 1: In the first lesson, Mr. C started by reviewing lessons on magnets taught in grade 10.
He started by asking learners what a magnet is (See Appendix U). As mentioned in literature,
learners are not able to visualise the directions of the magnetic field lines (see section 2.4).
After some discussion on this with the learners, Mr. C asked the learners to draw a bar magnet,
indicate the polarity of the magnet, and also show the magnetic field lines and their directions
around the magnet. The learners struggled with this task, showing that they might have
forgotten the concepts. Mr. C then called two learners to the chalk board to present their
solutions to the problem on the chalk board. One of the learner’s solutions was correct and the
other could not indicate the direction of the field lines correctly. Mr. C then used the correct
solution to explain the concept. He also showed the learners a real bar magnet with the North
Pole painted red and the South Pole painted blue. Mr. C also used a paper, iron filings and the
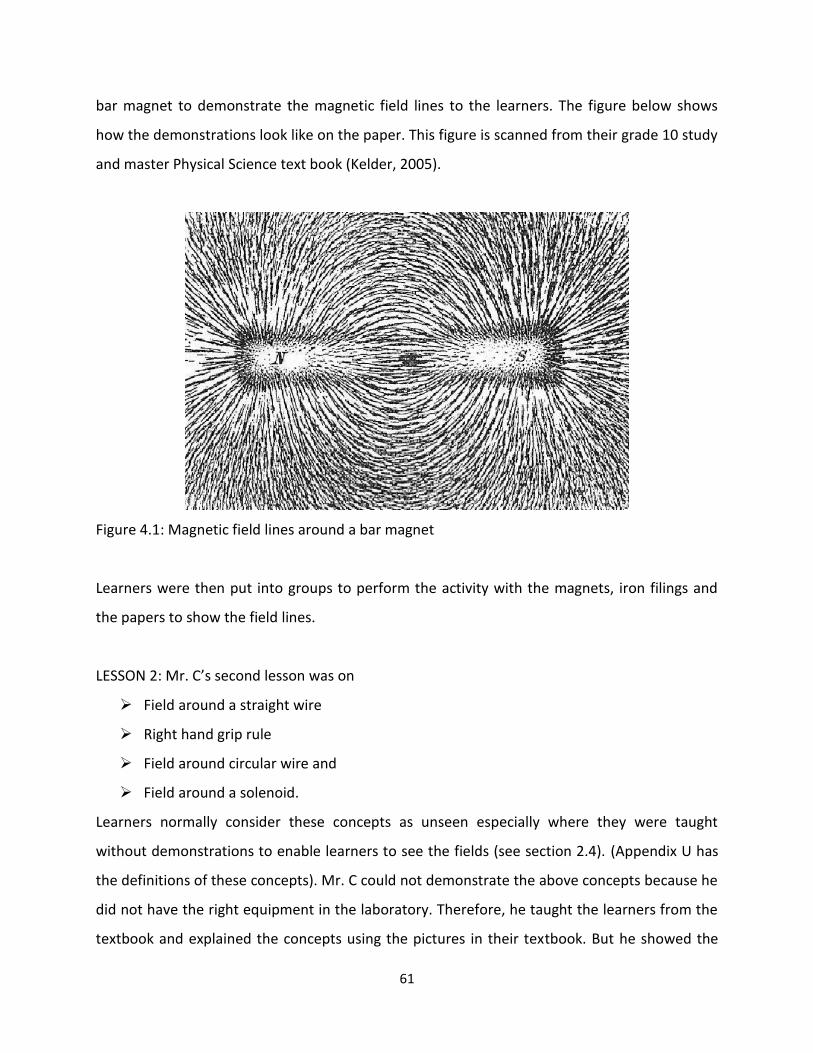
61
bar magnet to demonstrate the magnetic field lines to the learners. The figure below shows
how the demonstrations look like on the paper. This figure is scanned from their grade 10 study
and master Physical Science text book (Kelder, 2005).
Figure 4.1: Magnetic field lines around a bar magnet
Learners were then put into groups to perform the activity with the magnets, iron filings and
the papers to show the field lines.
LESSON 2: Mr. C’s second lesson was on
Field around a straight wire
Right hand grip rule
Field around circular wire and
Field around a solenoid.
Learners normally consider these concepts as unseen especially where they were taught
without demonstrations to enable learners to see the fields (see section 2.4). (Appendix U has
the definitions of these concepts). Mr. C could not demonstrate the above concepts because he
did not have the right equipment in the laboratory. Therefore, he taught the learners from the
textbook and explained the concepts using the pictures in their textbook. But he showed the
62
learners a real magnetic compass. The lesson therefore was more teacher-centred. In a
teacher-centred or teacher-talk classroom environment, the learner is a passive participant. But
with the nature of the topic Mr. C was teaching, without the right equipment in the laboratory,
it was difficult for him to involve the learners actively in the lesson.
LESSON 3: In this lesson, Mr. C taught electromagnets and their uses (See Appendix U and V).
He explained electromagnets and gave examples such as the electric bell and the magnetic
relay where electromagnets are applied in everyday usage. He also showed the learners an old
electric bell which is not functional after he discussed the working of the electric bell with the
learners. He used a circuit diagram from their textbook (Kelder, 2005) to explain how the
electric bell works. He gave the learners a summary of notes on how the electric bell works to
paste in their note books.
LESSON 4: The Lesson on Fleming’s left hand rule, force on current carrying conductor in a
magnetic field (see Appendix U), and the motor effect were also taught using explanations and
accompanying pictures from the learners’ textbook. This was because the school laboratory
does not have the equipment for Mr. C and the learners to practically perform these activities.
LESSON 5: For the lesson on electromagnetic induction and Faraday’s law, Mr. C got the
equipment from the laboratory to demonstrate induction for the learners. He used a coil of
wire from the laboratory, connected to a galvanometer, and a bar magnet. He moved the bar
magnet through the coil and there were deflections on the galvanometer. He used this to teach
induction and Faraday’s law of electromagnetic induction. Mr. C allowed some interested
learners to also move the magnet through the coil themselves. Learners were given a summary
of the lessons on the chalk board which they wrote into their note books. To evaluate learners
conceptual learning, oral questions were also asked and learners answered by putting up their
hands. Definition of electromagnetic induction and Faraday’s law can be found in Appendix U.

63
LESSON 6: Mr. C concluded his lessons by using textbook pictures and explanations to teach
transformers, power generation and distribution. They went through some calculations on
transformers as well.
SUMMARY OF TEACHER AND LEARNERS ACTIVITIES DURING THE SIX LESSONS OF MR. C.
In order to view Mr. C’s lessons as learner-centred or teacher-centred, the activities of Mr. C
and his learners during all the six lessons have been summarized in table 4.1 below.
Table 4.1: MR C’s LESSONS COMPARED TO A TEACHER CENTRED OR LEARNER CENTRED APPROACH
LESSONS TEACHER ACTIVITY LEARNER ACTIVITY LEARNER/ TEACHER CENTRED APPROACH
Lesson 1: Magnets, magnetic poles and magnetic field lines
Teacher reviewed lessons on magnets by asking learners to draw a bar magnet showing magnetic field lines. Teacher called two learners to the chalk board to present their solutions. Teacher demonstrated magnetic field lines with paper, iron fillings, and a bar magnet. Teacher put into groups to perform the activity as well.
Learners responded by drawing bar magnets and the field lines. Two learners presented their drawings on the chalk board. Learners looked on as the teacher used iron filings to demonstrate the magnetic field lines and were asked to perform the same activity as well in their groups.
This lesson was learner centred as learners were actively involved and they used the skill of communication. As discussed in section 2.2.4 this is a features of learner centred lesson.
Lesson 2: Field around a straight wire, Right hand grip rule, Field around circular wire and Field around a solenoid
Teacher taught the learners from the textbook and explained the concepts using the pictures in their textbook. Teacher also showed learners a magnetic compass.
Learners listen to the teacher as he explained the concepts.
Lesson was abstract and learners were quiet in class as discussed in teacher centred teaching approach in section 2.2.3

64
Lesson 3: Electromagnets and their uses
Teacher taught electromagnets and explained its everyday application in the electric bell. Teacher showed learners a real electric bell as he explained its working and gave notes on the electric bell.
Learners listen to the teacher as he explained the concepts. Learners paste notes in their books.
This lesson was not abstract as learners saw the real electric bell but learners were quiet in class just listening to the teacher. The lesson was teacher centred.
Lesson 4: Fleming’s left hand rule, force on current carrying conductor in a magnetic field, and motors
Teacher taught these topics using explanations and accompanying pictures from the learners’ textbook.
Learners listen to the teacher as he explained these concepts.
This lesson was teacher centred as learners were passive participants because there was no activity for them to do.
Lesson 5: Electromagnetic induction and Faraday’s law
Teacher used a coil of wire from the laboratory, connected to a galvanometer, and a bar magnet to teach electromagnetic induction and Faraday’s law of electromagnetic induction. Teacher allowed some interested learners to also move the magnet through the coil themselves.
Learners looked on as the teacher demonstrated induction and Faraday’s law. Some learners also perform the activity of induction.
After the demonstration by the teacher, some learners move the magnet through the coil. This lesson was not teacher centred since some learners were engaged in the activity.
Lesson 6: Transformers, power generation and distribution
Teacher concluded lessons by using textbook pictures and explanations to teach transformers, power generation and distribution. Teacher did some calculations on the chalk board with regards to transformers.
Learners listen to the teacher as he explained these concepts and wrote the examples on the calculations on transformers in to their note books.
In this lesson the teacher explained and wrote on the board. Learners were passive and only listened to the teacher and copy what was written on the chalk board. As mentioned in section 2.2.3, the focus was only on the teacher. This makes this lesson teacher centred.

65
4.2.2 MR. E’S LESSONS
Mr. E taught the topics in six lessons, of four 40 minutes periods and two 80 minutes periods.
The double periods were extended by about 15 minutes each, because these two periods were
last periods. This was agreed on by learners and the teacher to allow for completion of all the
topics within a specified time, so it did not pose any problems as learners were prepared to stay
on 15 minutes after school twice for the lessons just as it was in Mr. C lessons.
It was intended that the lessons of the experimental group will take place in the school’s
computer laboratory. But due to the use of the computer laboratory for teaching at the times it
was needed for the research lessons, we could not use it. At the time of the research, the
school’s internet connections were also down, so Java software could not be downloaded to be
able to play the simulations. For these reasons, the experimental group also had their classes in
the Science laboratory. Instead of each learner sitting by a computer and working through the
simulations, the teacher, Mr. E, used the researchers lap top and the schools data projector to
teach electromagnetism using the PhET simulations and simulations from the Plato learning
center. Below are the details of Mr. E’s lessons as observed by the researcher using the
observation schedule (Appendix A). These details of the observation of lessons given below are
extracted from appendix A7 to A12 and field notes taken during the lesson observations.
LESSON 1: Both Mr. E and Mr. C were following the same lesson plan and the same teaching
sequence. So during his first lesson, Mr. E also reviewed grade 10 magnetism with the learners.
Mr. E used a learner-centred approach in his teaching. As discussed in section 2.2.4 paragraph
2, Mr. E did not place himself as the active agent and his learners as passive vessels, so he
started his lesson by distributing some bar magnets to the learners who were already grouped
into five groups. He also gave each group a nail. The learners were asked to name these two
apparatus by putting up their hands. After one learner identified the magnet and the nail, Mr. E
instructed them to put the magnet and the nail about 15 cm apart, and observe what happens
and take note. They then moved the nail closer to the magnet about 5 cm from its original
position. This was done till the magnet attracted the nail; learners were then asked to discuss in
their groups why the nail was not attracted at the earlier positions. It was concluded as part of
the class discussion that the nail was not in the magnetic field that was why it was not

66
attracted, and only got attracted when it got into the magnetic field. The lesson then
proceeded, with Mr. E asking the learners to draw the bar magnet and indicate the north and
the south poles, the field lines, and the direction of the field lines. Again the learners of Mr. E
also struggled, just as Mr. C’s learners as stated in lesson 1 of Mr. C’s lesson. So Mr. E showed
them a simulation of the field lines using the data projector. Below is a screen shot of the field
lines.
Figure 4.2: Screenshot from PhET Interactive Physics simulation showing magnetic field lines.
From this simulation, Mr. E could flip the magnet to change the polarities of the magnet and
hence the directions of the field lines always move from north to south. Also there was a
magnetic compass which also indicated the change in direction of the field lines each time the
magnet was flipped. Mr. E then showed the learners a real magnetic compass from the school
laboratory. But the difference between lesson 1 of Mr. C and that of Mr. E was that the learners
of Mr. E could see the magnetic field lines and their directions from the simulation. They also
saw the magnetic compass in use in the simulation. Here Mr. E was using the simulation as
scaffold to help the learners as mentioned in the theoretical framework in this report. And this

67
could address conceptual understanding as the learners could see the how the direction of the
field lines changes when the magnetic poles are changed.
LESSON 2: Mr. E’s second lesson was also on:
Fields around a straight wire carrying current
Right hand grip rule
Field around a circular wire
Field around a solenoid
Since the school laboratory does not have the appropriate equipment to practically
demonstrate these concepts Mr. E used, pictures from the learners’ textbook (Kelder, 2005).
But unlike Mr. C, Mr. E supported his lessons with computer simulations. Below are screen
shots of the simulations which Mr. E used to support his lessons.
Figure 4.3 below shows a screen shot from the Java applets on Physics. This is one of many free
simulations downloaded from the internet by the researcher for the use of this research.
From this simulation, Mr. E’s learners were able to predict what was going to happen to the
field lines if the current in the conductor was reversed according to the right hand grip rule.
This shows that learning has taken place and the learners took active part in the process.
Learners were asked to observe these changes as they were used to further explain the right
hand grip rule. This time learners could visualise the concepts.

68
Figure 4.3: Screenshot from Interactive Physics simulation showing Fields around a straight
wire carrying current to show the right hand grip rule.
LESSON 3: Mr. E used PhET simulations to teach electromagnetism. Faraday’s electromagnetic
laboratory (2.01) is a screen shot from PhET simulations (see Fig 4.4). In this simulation, Mr. E
could pick, a bar magnet, a coil, an electromagnet, a transformer and a generator. This
simulation allows the teacher to show, the field lines, compass, and the flow of electrons in the
coil of wire. He used it to explain what an electromagnet is, how it works and its daily
applications and uses.

69
Figure 4.4: Screenshot from PhET Interactive Physics simulation showing electromagnet.
After using the simulation to teach electromagnets, Mr. E moved on to its use in electric bells
and magnetic relays. This time Mr. E projected the circuit diagram of the electric bell scanned
from their text book for learners to see. He used the diagram to teach learners how
electromagnets are applied in the electric bell (See Appendix V). He also gave the learners a
summary of notes on how the electric bell works to paste in their note books. These learners
were also given the real electric bell in the laboratory to see just as Mr. C did in his lesson.
LESSON 4: This lesson was on Fleming’s left hand rule, force on a current carrying conductor in
a magnetic field and the motor effect. For the purposes of these topics the researcher
borrowed a CD - ROM of simulations from Penryn College, a private high school in Nelspruit.
These simulations are not free. The school bought the CD – ROM from Plato learning UK Ltd.
With this CD-ROM, Mr. E was able to easily teach the three topics in this lesson. The screen shot
below gives four scenarios. The first is field around a current carrying conductor, the second is
the force on a current carrying conductor placed in a magnetic field, the third scenario is the
motor effect and the last scenario is the DC motor based on Fleming’s left hand rule.
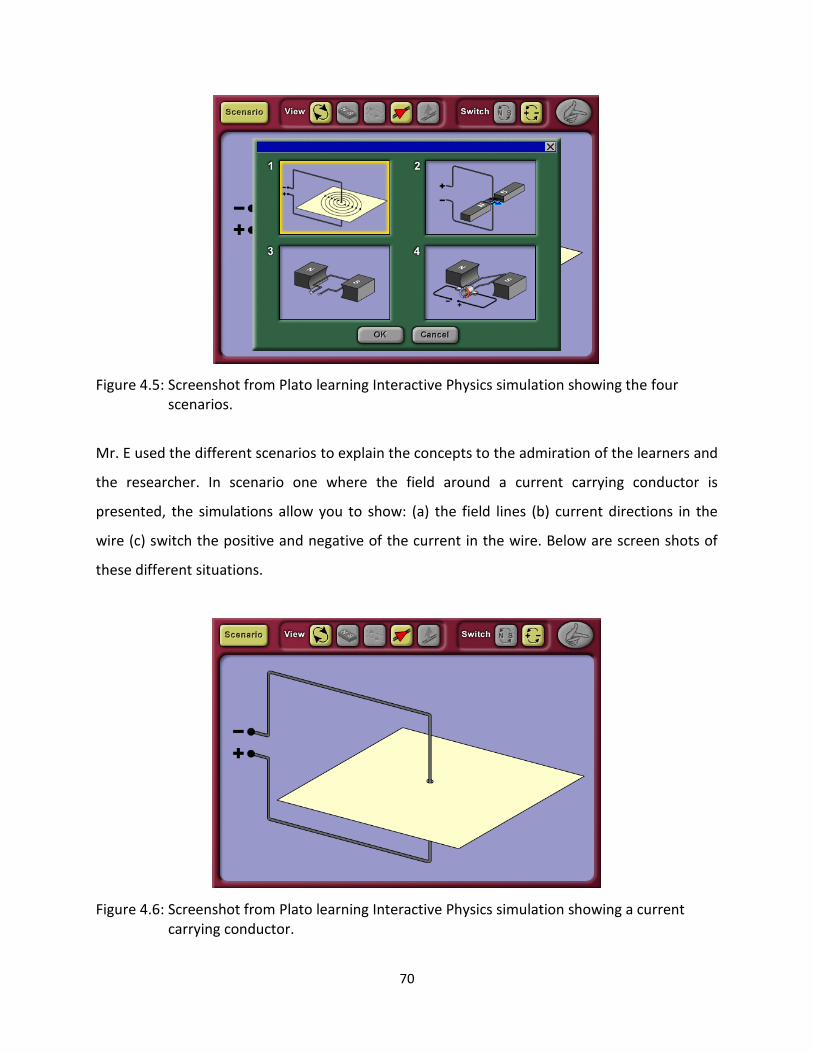
70
Figure 4.5: Screenshot from Plato learning Interactive Physics simulation showing the four scenarios.
Mr. E used the different scenarios to explain the concepts to the admiration of the learners and
the researcher. In scenario one where the field around a current carrying conductor is
presented, the simulations allow you to show: (a) the field lines (b) current directions in the
wire (c) switch the positive and negative of the current in the wire. Below are screen shots of
these different situations.
Figure 4.6: Screenshot from Plato learning Interactive Physics simulation showing a current carrying conductor.

71
Figure 4.7: Screenshot from Plato learning Interactive Physics simulation showing the field lines. around a current carrying conductor.
Figure 4.8: Screenshot from Plato learning Interactive Physics simulation showing current Direction (arrow), in the wire.
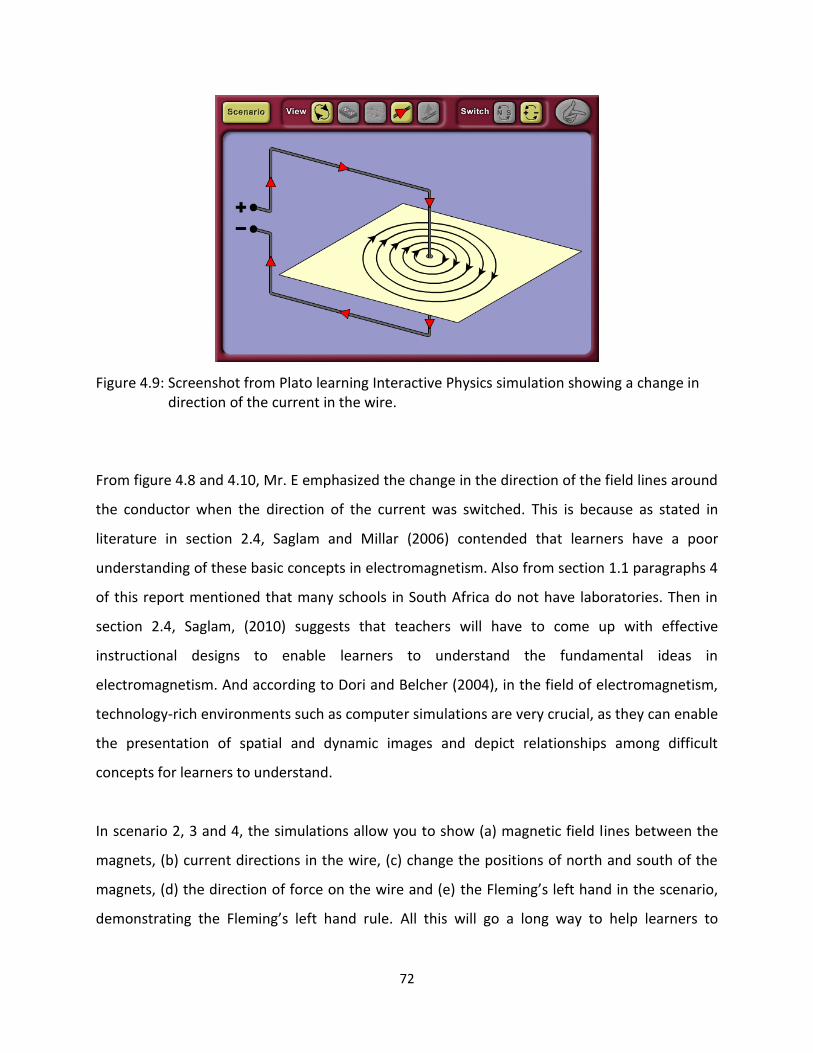
72
Figure 4.9: Screenshot from Plato learning Interactive Physics simulation showing a change in direction of the current in the wire.
From figure 4.8 and 4.10, Mr. E emphasized the change in the direction of the field lines around
the conductor when the direction of the current was switched. This is because as stated in
literature in section 2.4, Saglam and Millar (2006) contended that learners have a poor
understanding of these basic concepts in electromagnetism. Also from section 1.1 paragraphs 4
of this report mentioned that many schools in South Africa do not have laboratories. Then in
section 2.4, Saglam, (2010) suggests that teachers will have to come up with effective
instructional designs to enable learners to understand the fundamental ideas in
electromagnetism. And according to Dori and Belcher (2004), in the field of electromagnetism,
technology-rich environments such as computer simulations are very crucial, as they can enable
the presentation of spatial and dynamic images and depict relationships among difficult
concepts for learners to understand.
In scenario 2, 3 and 4, the simulations allow you to show (a) magnetic field lines between the
magnets, (b) current directions in the wire, (c) change the positions of north and south of the
magnets, (d) the direction of force on the wire and (e) the Fleming’s left hand in the scenario,
demonstrating the Fleming’s left hand rule. All this will go a long way to help learners to

73
understand these basic concepts in electromagnetism. Below are the screen shots of the five
different situations for the three scenarios, (scenario 2, 3 and 4).
Figure 4.10: Screenshot from Plato learning Interactive Physics simulation showing magnetic field lines and field around the conductor.
Figure 4.11: Screenshot from Plato learning Interactive Physics simulation showing current direction (arrow), in the Wire.

74
Figure 4.12: Screenshot from Plato learning Interactive Physics simulation showing a change in the positions of north and south of the magnets and hence, change in the direction of the force on the conductor.
Figure 4.13: Screenshot from Plato learning Interactive Physics simulation showing the direction of force (big arrow), on the wire.

75
Figure 4.14: Screenshot from Plato learning Interactive Physics simulation showing the Fleming’s left hand in the scenario.
These simulations helped the learners to comprehend the concepts as they responded correctly
to oral evaluation conceptual questions asked by the teacher, Mr. E. The analysis of the post-
test results as indicated in sections 4.3.3, 4.3.4 and 4.3.6 confirms that Mr. E’s learners
benefited from the simulations. The learners also gave correct predictions when they were
asked to predict for instance the direction of the conductor when the positions of the north and
south of the magnets were changed in figure 4.11 and 4.13. They predicted correctly by
drawing figure 4.12 in their note books before Mr. E showed the simulation of it.
LESSON 5: Mr. E used simulations to teach electromagnetic induction and Faraday’s law of
electromagnetic induction which according to Dori and Belcher (2004) are considered difficult
for learners to visualise (see section 2.4). The simulation of Faraday’s law of electromagnetic
induction is also another very interesting and elaborative simulation from the PhET. In this
simulation the user could (a) use just one coil or two coils, (b) show field lines of the magnet, (c)
flip the magnet to change the positions of the north and south of the magnet and these enable
the learners to visualise the concept. Below are screen shots of these situations in the Faraday’s
law of electromagnetic induction simulation and how Mr. E used them in the lesson.

76
Figure 4.15: Screenshot from PhET Interactive Physics simulation showing a bar magnet with one coil.
Figure 4.16: Screenshot from PhET Interactive Physics simulation showing a bar magnet with two coils.
After Mr. E picked the second coil, he moved the magnet through the upper coil (less winding)
whiles learners were asked to observe what happens with the bulb and galvanometer critically.
He then moved the magnet in the same way, through the lower coil (more winding). In the two
instances the magnet went through the coil with the North Pole facing the coil, and then it was
withdrawn. The speed of the movement was also maintained. The learners attention was

77
brought to all these to enable them to make their judgments. Learners were then asked to
discuss in their groups, what the differences were with respect to the brightness of the bulb
and the deflection on the galvanometer.
From the verbal reports presented by the leaders from each group, all the groups observed
that, the light bulb glow brighter and the galvanometer deflected more when the magnet was
moved through the lower coil which has more winding. This signifies that learning has taken
place as discussed in literature and mentioned in section 2.2.2. Meanwhile electromagnetic
induction is one of the problem areas mentioned earlier in literature, section 2.4. Planic (2006)
reported from a study conducted in Croatia and replicated in America that the most difficult
area of electromagnetism found among learners in these two countries was electromagnetic
induction. Mr. E emphasized that, the induced current depends on the:
number of windings
strength of the magnet and
speed of the movement.
For figure 4.17 and 4.19, learners were asked to again observe and discuss what happens when
the north and south poles of the magnet were flipped as shown below. Learners saw that the
directions of the deflection on the galvanometer changed as the poles of the magnet was
flipped and moved through the coils.
Figure 4.17: Screenshot from PhET Interactive Physics simulation showing the field lines of the Magnet.

78
Figure 4.18: Screenshot from PhET Interactive Physics simulation showing a flip of the magnet to change the positions of the north and south, and the direction of the field lines of the magnet.
LESSON 6: This was Mr. E’s last lesson; he combined simulations and pictures from learners’
textbooks to teach transformers, power generation and power distribution linking the new
lesson to Faraday’s law in the previous lesson. The principle of mutual induction was explained
using figure 4.19 below.

79
Figure 4.19: Screenshot from PhET Interactive Physics simulation showing a transformer.
From the transformer (figure 4.19), when the alternating current (which is continually changing
direction) is passed through the primary coil, a continually changing magnetic flux induces a
continually changing current in the secondary coil. The learners observed and listened as Mr. E
explained using the simulation and pictures from their text book to demonstrate the induction.
Figure 4.20: Screenshot from PhET Interactive Physics simulation showing the generator.

80
Figure 4.20 was used to explain power generation in a hydroelectric power system. From the
simulation as more water was released from the tap (dam), the magnet (turbine) turns faster.
This induces more alternating current in the coil carrying the bulb and the bulb glows brighter.
As the water is reduced, the bulb glows dimmer as a result.
SUMMARY OF TEACHER AND LEARNERS ACTIVITIES DURING THE SIX LESSONS OF MR. E.
In order to view Mr. E’s lessons as learner-centred or teacher-centred, the activities of Mr. E
and his learners during all the six lessons have been summarized in table 4.2 below.
Table 4.2: MR E’s LESSONS COMPARED TO A TEACHER CENTRED OR LEARNER CENTRED APPROACH
LESSONS TEACHER ACTIVITY LEARNER ACTIVITY LEARNER/ TEACHER CENTRED APPROACH
Lesson 1: magnets, magnetic poles and magnetic field lines
Teacher distributed some bar magnets and nails to the learners in their five groups. The learners were asked to name these two apparatus. Leaners were asked to: put the magnet and the nail about 15 cm apart, and observe what happens, move the nail closer to the magnet about 5 cm from its original position till the magnet attracted the nail, discuss in their groups why the nail was not attracted at the earlier positions, draw a bar magnet showing magnetic field lines. Teacher then showed them a simulation of the field lines (Fig. 4.2).
One learner identified the magnet and the nail. Learners perform the activity as instructed in their groups. Learners discuss in their groups why the nail was not attracted at the earlier positions but was attracted when it got nearer to the magnet. Five learners, one from each group presented a verbal report of their group discussions to the class. Learners drew bar magnets showing magnetic field lines. Learners who got the directions of the field lines wrong corrected their mistakes after they visualized it from the simulation.
This lesson was learner centred as learners were actively involved using general skills of inquiry, communication, critical thinking, and problem solving. And these are features of learner centred lesson as discussed in section 2.2.4
Lesson 2: Field around a straight wire, Right hand grip rule, Field around circular wire and Field
Teacher used computer simulations to support his teaching of these concepts. Teacher asked learners to predict observe and explain what was going to happen to
Learners predicted and explain what was going to happen to the field lines if the current in the conductor was reversed according to the right hand grip rule using the
In this lesson, learners were actively predicting, observing and explaining

81
around a solenoid the field lines if the current in the conductor was reversed according to the right hand grip rule using the computer simulations (Fig 4.3).
computer simulations as they could see the directions easily in fig 4.3.
concepts and the teacher used computer simulations to facilitate the learning process. So this lesson was learner centred.
Lesson 3: Electromagnets and their uses
Teacher used computer simulation which allowed him to show, the field lines, compass, and flow of electrons to explain electromagnets and how it works and its daily applications and uses such the electric bell. Teacher
projected the circuit diagram of the electric bell scanned from their text book for learners to see. Teacher gave summary of notes on how the electric bell works to learners to paste in their note books.
Learners listen to the teacher as he explained the concept. Learners paste notes in their books
In this lesson, learners were not actively in involved. They mainly listened to explanations from the teacher. This as discussed in section 2.2.3 is a characteristic of teacher centred lesson.
Lesson 4: Fleming’s left hand rule, force on current carrying conductor in a magnetic field, the motor
Teacher used computer
simulation to teach current carrying conductor, force on a current carrying conductor placed in a magnetic field, the motor effect and the DC motor based on Fleming’s left hand rule by asking learners to predict, observe and explain. Teacher asked learners to predict for instance the direction of the conductor when the north and south of the magnets were switched in figure 4.11 and 4.13.
Learners listened and watched the simulations with keen interest asking questions for clarification. Learners were correctly predicting directions of field lines, directions of force on the conductor after listening to explanations with the simulations. Learners for example predicted correctly by drawing figure 4.12 in their note books before its simulation was projected.
Learners were active predicting, observing and explaining concepts and the teacher used computer simulations to facilitate the learning process. So the lesson was learner centred.
Lesson 5: Teacher asked learners to Learners observe the Learners then

82
electromagnetic induction and Faraday’s law
observe what happens with the bulb and galvanometer in fig 4.17 critically while the teacher moved the magnet through the upper coil (less winding) and lower coil (more winding) with the same speed of the movement. In the two instances the magnet went through the coil with the North Pole facing the coil, and then it was flipped with the south Pole now facing the coil. Teacher then asked
Learners to discuss in their groups, what the differences were with respect to the brightness of the bulb and the deflection on the galvanometer.
computer simulations and some asked the teacher to repeat some actions for better observations. Learners then discussed in their groups, what the differences were with respect to the brightness of the bulb and the deflection on the galvanometer. Five learners, one from each group presented a verbal report of their group discussions to the class.
Learners were involved actively in their groups discussing what they have observed. It was also evident that the leaners in their groups used
skills of inquiry, communication, critical thinking, and problem solving. And from the discussion in section 2.2.4 paragraph 3, this lesson was learner centred.
Lesson 6: transformers, power generation and distribution
Teacher combined simulations and pictures from learners’ textbooks to teach transformers, power generation and power distribution. Teacher explained the principle of mutual induction using figure
4.19. Teacher used Fig. 4.21 to explained power generation in a hydroelectric power system.
Learners listened to the explanations and visualise from the simulation that as more water was released from the tap (dam), the magnet (turbine) turns faster. This induces more alternating current in the coil carrying the bulb and the bulb glows brighter. As the water is reduced, the bulb glows dimmer as a result.
Even though learners could vsualise the concepts from the simulations, learners were not active in this lesson and that makes the lesson teacher centred.
4.2.3 ANALYTIC COMPARISON OF THE TWO LESSONS
From the discussion of the observations of the two lessons, Mr. C used a more teacher-
centred teaching approach. Apart from lesson 1 where Mr. C allocated learners to groups to
perform an activity, and lesson 5 where some learners could perform the activity by

83
moving the magnet through the coil, the rest of his lessons were characterised by him
giving explanations and learners being passive and listening. This could be attributed to the
fact that the school did not have the relevant apparatus for Mr. C to be able to carry out all
the activities with his learners.
On the other hand, Mr. E used simulations in almost all his lessons. He involved the learners
in the lessons. He asked learners to predict, observe and explain. He assigned the learners
to groups to discuss a phenomenon they have observed and this allowed learners to
communicate amongst themselves but also between him and the learners. As discussed in
the theoretical frame work he used the simulations to help learners to understand and to
learn concepts that were described in the literature as difficult for learners by providing
scaffolding. This is evident in table 4.5 under section 4.3.3 where learners in the
experimental group improved better in the post-test. The performance of his learners in
the post-test analysis in section 4.3.3 and 4.3.4 attests to this assertion. This teaching
approach is also in line with the constructivist learner-centred approach discussed in
section 2.2.4 of this report. Hake, (1998) described this approach of teaching as medium
<g> course which combines both the traditional modes and the interactive-engagement
models of teaching as discussed in section 4.3.7. Mr. E’s lesson therefore was characterised
by active participation of learners, where learners predicted, observed and explained
concepts in electromagnetism using computer simulations as well as real equipment
(magnets, nails and a real electric bell) in their assigned groups.
The zone of proximal development (ZPD) a critical component of constructivism (see
theoretical framework), conceived that learning takes place by the learner completing
tasks for which support (scaffolding) is initially required. This support may include a tutor,
a peer or technology such as the applications of computer simulations, Mr. E, the teacher,
the computer simulations, and the demonstrations acted as the support or the scaffolding
which helped the learners to construct their knowledge and understanding of the topic
electromagnetism as reflected in the analysis in table 4.7 in section 4.3.6 below.

84
4.3 ANALYSIS OF TEST RESULTS
The results of pre-test and post-test conducted for both experimental and control groups were
analysed. As stated in the second paragraph under research design section 3.2, the previous
terms marks of the two groups (June examination marks) were obtained by the researcher to
establish whether or not the two groups were of the same academic ability before the research
started. These scores were also analysed in this section to establish whether or not the two
groups were of the same academic ability before the research started. The June examination
scores are shown in appendix T. The researcher used Statistical analysis tools in Microsoft excel
to analyse the results. The mean, the standard deviation, median and the t-test were calculated
using this approach.
4.3.1. ANALYSIS OF JUNE EXAMS
Using the Microsoft excel spreadsheet program to calculate the independent t-test for the June
examination scores (appendix T) of the two groups showed that, there was no statistically
significant difference between the two groups. Below is the table representing the results of
the calculations on the June examinations.
Table 4.3: t-test: Two-Sample Assuming Unequal Variances for the June Examinations.
From the Microsoft excel calculations, t = 0.906, df = 101, p = 0.3672. The t-critical two tail is
1.984 approximately 2.00 at p > 0.05. The interpretation of this analysis is that since the t-
11A (Control) 11C (Experimental)
Mean 42.11320755 40.01851852
Variance 168.3330914 117.2638015
Observations 53 54
Hypothesized Mean Difference
0
df 101
t Stat 0.905812175
P(T<=t) one-tail 0.183595554
t Critical one-tail 1.660080631
P(T<=t) two-tail 0.367191107
t Critical two-tail 1.98373095

85
critical 2.00 is greater than the t-statistics 0.906 at p > 0.05, there is no statically significant
difference in the achievement of the two classes in the June examination. This t-test therefore
established that the two classes were of the same academic ability before the treatment
started.
4.3.2 ANALYSIS OF THE PRE-TEST OF THE TWO GROUPS
Even though, the June examination analysis shows that the two groups were comparable
academically, a pre-test was conducted before the treatment to establish whether or not the
two groups were of the same ability in the topic electromagnetism before the research started.
The scores of this test (appendix G and H) were also analysed using Microsoft excel spreadsheet
and the result is indicated in the table 4.4 below. In this analysis, t statistics = 0.390, df = 63,
p = 0.05, t-critical two tail = 1.998 which is approximately 2.00. The interpretation of this is that
since the t-critical 2.00 is greater than the t-statistics 0.906 at p > 0.05, there is no statistically
significant difference in the achievement of the two classes in the pre-test. This means before
the research the two groups were at the same level in the topic electromagnetism. In the table
4.2 Y1 indicates the experimental group and Y2 indicates the control group.
Table 4.4: t-Test: Two-Sample Assuming Unequal Variances for Pre-Test
11A (Control) 11C (Experimental)
Mean 42.11320755 40.01851852
Variance 168.3330914 117.2638015
Observations 53 54
Hypothesized Mean Difference
0
df 101
t Stat 0.905812175
P(T<=t) one-tail 0.183595554
t Critical one-tail 1.660080631
P(T<=t) two-tail 0.367191107
t Critical two-tail 1.98373095

86
4.3.3. ANALYSIS OF POST-TEST OF THE TWO GROUPS
Testing the null hypothesis and answering research question 1, the post-test scores (Appendix
G and H) for the two groups (experimental group and the control group) were analysed. The
post-test scores were entered into the Microsoft excel spreadsheet to calculate the mean out
of 30, median, standard deviation and the t-test. Below is a table presenting the results of the
Microsoft excel calculations of the post-test scores.
Table 4.5: t-Test: Two-Sample Assuming Unequal Variances for Post-Test
Post-Test( Experimental – X1) Post-Test( Control – X2)
Mean 16.3 12.54285714
Variance 21.18275862 13.78487395
Observations 30 35
Hypothesized Mean Difference 0
df 56
t Stat 3.582383911
P(T<=t) one-tail 0.000356697
t Critical one-tail 1.672522304
P(T<=t) two-tail 0.000713394
t Critical two-tail 2.003240704
From table 4.5 above t-statistic = 3.582, df = 56, p<0.05 and t-critical two tail = 2.00. The
interpretation of this result is that since the t-critical two tail = 2.00, is less than t-statistics
3.582. There is therefore a statistically significant difference between the post-test scores of
the experimental group and the control group. The null hypothesis which states that, the use of
computer simulations has no impact on the performance of grade 11 learners in
electromagnetism is rejected.

87
4.3.4 ANALYSIS OF THE PERFORMANCE OF THE TWO GROUPS USING GRAPHS
Even though a statistical difference was established using the t-test, the following tables and
graphs were also used to further confirm the difference.
Table 4.6: Description of group’s performances in pre-test and post-test
Index
Statistics in Pre - test Statistics in Post - test
Experimental Group
Control Group
Experimental Group
Control Group
Mean 8.3 8.5 16.3 12.5
SD 2.6 3.1 4.6 3.7
Highest Score 12 16 24 20
Least score 2 1 8 6
Range 10 15 16 14
Table 4.6 shows that even though the means of the two groups were almost the same for the
statistics in the pre-test with the control group having 8.5 and the experimental group 8.3, the
statistics in post-test, shows that the experimental group’s mean improved significantly. The
experimental group had a mean of 16.3 and the control group’s mean was 12.5. This data is
also clearly shown in the bar graph below.
Figure 4.21: Mean performance of learners in the pre-test and post-test
0
2
4
6
8
10
12
14
16
18
Experimental group Control group
Me
an s
core
s
Groups
Comparing the mean scores of both the experimental and control groups
post test
pre test
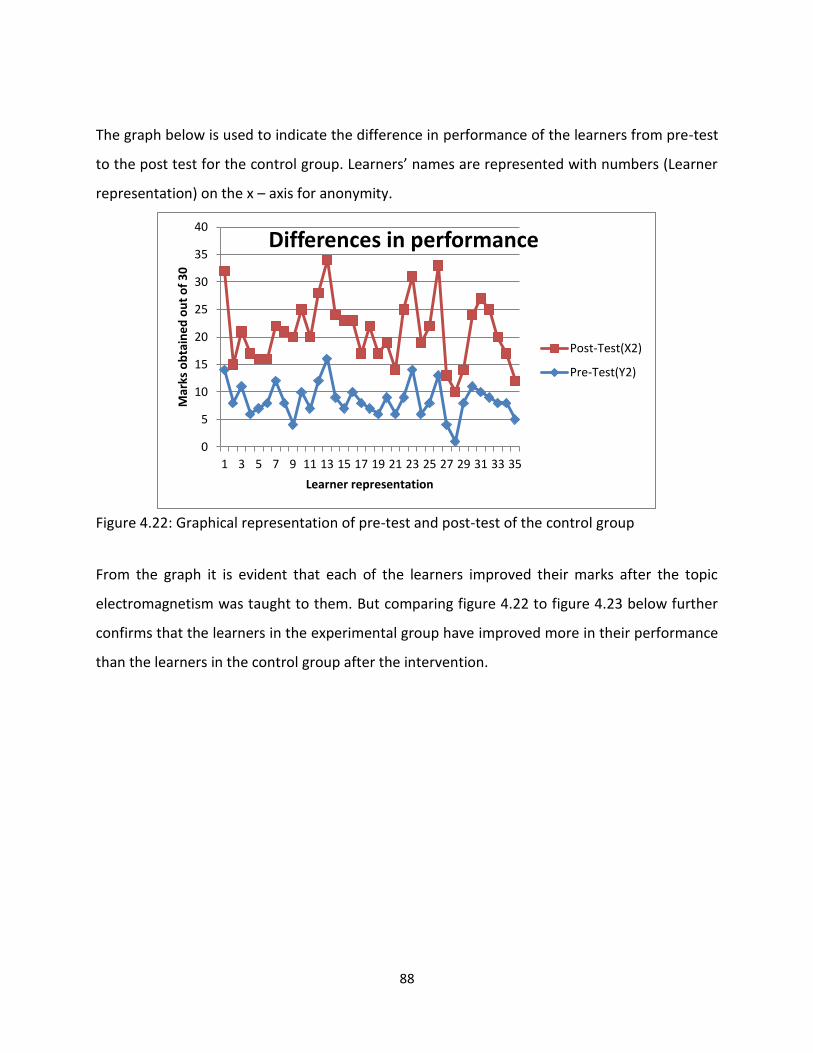
88
The graph below is used to indicate the difference in performance of the learners from pre-test
to the post test for the control group. Learners’ names are represented with numbers (Learner
representation) on the x – axis for anonymity.
Figure 4.22: Graphical representation of pre-test and post-test of the control group
From the graph it is evident that each of the learners improved their marks after the topic
electromagnetism was taught to them. But comparing figure 4.22 to figure 4.23 below further
confirms that the learners in the experimental group have improved more in their performance
than the learners in the control group after the intervention.
0
5
10
15
20
25
30
35
40
1 3 5 7 9 11 13 15 17 19 21 23 25 27 29 31 33 35
Mar
ks o
bta
ine
d o
ut
of
30
Learner representation
Differences in performance
Post-Test(X2)
Pre-Test(Y2)

89
Figure 4.23: Graphical representation of pre-test and post-test of the experimental group
This graph also shows that all the learners have improved their marks from the pre-test to the
post-test. And comparing the two graphs, the intervention helped the learners in the
experimental group compared to the control group to improve their marks. This is attributed to
the more learner-centred teaching approach used by Mr. E and the use of the simulations
which help the learners to visualize the concepts and allow them to construct their own
understanding by predicting, observing and explaining the topics presented.
4.3.5 RESEARCH QUESTION 1: Does the use of computer simulation have an impact on the
performance of grade 11 learners in electromagnetism?
So, in answering research question 1, the results of the analysis in 4.3.3 above indicate that
computer simulations does have an impact on the performance of grade 11 learners in
electromagnetism, because, the results of the t-tests indicated statistical significance difference
in the performance at p < 0.05. The null hypothesis which states that, the use of computer
simulations has no impact on the performance of grade 11 learners in electromagnetism is
therefore rejected.
0
5
10
15
20
25
30
35
40
1 3 5 7 9 11 13 15 17 19 21 23 25 27 29
Mar
ks o
bta
ine
d o
ut
of
30
Learner representation
Differences in performance
Post-Test(X1)
Pre-Test(Y1)

90
4.3.6 ANALYSIS OF TEST ITEMS
As the t-test showed statistical significance in the performance between the post-test scores of
the experimental group and the control group, the following analysis in table 4.7 was done to
determine the conceptual improvement in the concepts taught under electromagnetism in this
research. (See table 4.7)
Table 4.7: Analysis of test questions
Questions on Question numbers
Control Group Performance in %
Experimental Group Performance in %
Pre test
Post test
Improvement Pre test
Post test
Improvement
Current carrying conductor
1, 2 40 45 5 39 58 19
Induced emf 3, 4, 5, 6, 7
27 29 2 16 35 19
Electromagnets 8, 9, 15, 16, 22
32 34 2 31 44 13
Motors 10, 18, 24 14 30 16 9 39 30
Magnetic poles 11, 12, 21 76 73 -3 76 86 10
Magnetic field lines 13, 14, 17 47 67 20 40 77 37
Transformers 19, 20 23 79 56 28 63 35
Electromagnetic induction and Faradays Law
23, 25 5 5 0 0 15 15
From the analysis in table 4.7, the control group showed minimal improvements in aspects of
the test, but a good improvement in questions on transformers (questions 19 and 20). Many of
the learners in the control group were able to answer question 20, which is a calculation on
transformers but only few of the learners in the experimental group answered that question 20
correctly. There was no conceptual improvement in electromagnetic induction and Faraday’s
law for the control group and limited improvement for the experimental group. There was
about 3% drop from the pre-test on magnetic poles for the control group. This is due to many
of them drawing the transformer instead of the magnetic poles and its field lines in the post-
test. However the experimental group showed a better conceptual improvement in all aspects
of the test except for the aspect on transformers.

91
4.3.7 HAKE’S NORMALIZED GAIN
Average normalized gain, (<g>), has been an important tool for the characterization of
conceptual improvement in Physics courses since its use in Hake's extensive study on
conceptual learning in introductory Physics (Stewart, 2010). So, to see the gains in the scores,
the <g> was calculated. The <g> was calculated as 0.18 for the control group and 0.32 for the
experimental group. The average normalized gain gives an index that helps in the comparison
of the extent to which the treatment is effective (Hake, 2007). The effectiveness of the models
of instruction was further classified according to the average normalized gain as follows:
(a) High-g courses: (<g>) > 0.7
(b) Medium-g courses: 0.3 < (<g>) < 0.7
(c) Low-g courses: (<g>) < 0.3
According to the classifications suggested above, low <g> courses are associated with
traditional models of instruction which were operationally defined by Hake (1998) as those that
relied primarily on passive-student lecturers, ‘recipe-following’ laboratory sessions and
algorithmic quantitative problem solving examinations.
The high <g> courses were regarded as those that mostly used interactive-engagement models
while the medium <g> courses were those that integrated both traditional models and the
interactive-engagement models. These interpretations are consistent with the findings of this
research as the experimental groups <g> were calculated as 0.32 and their teacher (Mr. E) also
used a more learner-centred teaching approach. Mr. E used both traditional models and the
interactive-engagement models. This is because he was using the computer simulation to help
him explain the concept to the learners.

92
4.4 ANALYSIS OF QUESTIONNAIRES
As indicated in chapter three under instrumentation, questionnaires were administered to
enable the researcher answer research questions 2 and 3. The data from sections B, and C were
also entered into a Microsoft excel spread sheet (Appendix I) to calculate an index of
agreement (IA). The index of agreement was calculated using the formula; IA =
; Adopted
from (Makomosela, 1996 p. 34). Where
n is the number of learners or teachers choosing one of the five points on the Likert
scale,
i is a multiplier corresponding to the point on the scale as follows, 1 (strongly disagree)
corresponds to -2, 2 (disagree) to -1, 3 (uncertain) to 0, 4 (agree) to +1 and 5 (strongly
agree) to +2,
N is the total number of learners and teachers responding to that statement.
Division by 2.5 was done to confine IA within the range of -1 to +1.
If IA is negative the sample is assumed to disagree with the statement, but if IA is positive, the
sample is assumed to agree with the statement and if IA is zero the sample is assumed to be
undecided.
4.4.1 ANALYSIS OF SECTION B OF BOTH LEARNERS AND TEACHERS QUESTIONNAIRES
Section B of both learners and teachers questionnaires has 12 statements (see Appendix C and
D). As the data collected from section B of the teachers’ and learners’ questionnaires were
analysed, results of the analysis show that out of twelve (12) statements in the questionnaire,
only statement 1 has a negative index of agreement (IA). Statement 1 was seeking to mean that
the teachers have being using computer simulations to teach even before the research. Table
4.8 below shows the analysis of the learners and teachers questionnaires. From table 4.8 the IA
for statements 1 is negative. This means that the learner and teacher sample disagreed with the
statement in their questionnaires. Both teachers and learners disagreed with the statement
that computer simulations were being used to teach even before the research. The rest of the
11 statements are in favour of using ICT to teach.

93
And both teachers and learners agreed to these 11 statements as these statements show
positive IA in table 4.8.
Table 4.8: Index of agreement for section B of learners’ and teachers’ questionnaire.
Section B
Statements Codes Codes Total No. of respondents
Index of Agreement IA 1 2 3 4 5 1 2 3 4 5
No. of learners who responded
No. of teachers who responded
Leaners Teachers Leaners Teachers
1 55 18 5 14 9 2 101 2 -0.380 -0.8 2 1 2 14 40 43 1 1 100 2 0.488 0.6 3 6 17 12 31 34
1 1 100 2 0.280 0.6
4 5 5 26 44 17 2 97 2 0.260 0.8 5 1 2 13 40 43 1 1 99 2 0.493 0.6 6 1 4 5 30 61 2 101 2 0.578 0.8 7 0 4 4 37 56 2 101 2 0.574 0.8 8 1 6 12 57 25 1 1 101 2 0.392 0.6 9 6 12 35 36 12 2 101 2 0.143 0.4
10 0 2 11 54 34 2 101 2 0.475 0.8 11 5 1 19 41 34 1 1 100 2 0.392 0.6 12 2 1 7 42 49 1 1 101 2 0.535 0.6
The rest 11 of the statements in section B to which both the teachers and learners agreed are
as follows:
2. Teachers should be “work shopped” on the use of ICT in teaching.
3. ICT should always be used in teaching Physics topics.
4. ICT usage should be integrated with traditional normal teaching methods.
5. ICT usage makes teaching Physics easier.
6. ICT usage saves time used in drawing and labelling diagrams on chalk board.
7. ICT usage makes diagrams and writings clearer.
8. ICT usage captures learners’ attention in class.
9. ICT usage helps class control.
10. ICT usage brings improve excitement in learners.
11. ICT usage makes it easier for learners to visualize lessons.
12. ICT usage makes imaginary concepts (e.g. direction of magnetic field lines) real.

94
With this analysis, it is clear that both the teachers and their learners who took part in the
research accept that, ICT (computer simulation) can improve the teaching and learning of
Physics. This is because the rest of the 12 statements in the questionnaire to which both
teachers and learners agree, are positive statements in favour of using ICT to teach. This means
that the teachers and learners accept the use of ICT in the teaching of electromagnetism. This
was also confirmed during informal interviews with teachers and learners after the
intervention, but did not form part of the investigation.
4.4.2 ANALYSIS OF SECTION C OF BOTH LEARNERS AND TEACHERS QUESTIONNAIRES
Section C also has 12 statements for both the learners’ and teachers’ questionnaires (appendix
C and D). Below is table 4.9 showing analysis of the learners’ and teachers’ questionnaires.
Table 4.9: Index of agreement for section C of learners’ and teachers’ questionnaire
Section C
Statements Codes Codes Total No. of respondents
Index of Agreement IA 1 2 3 4 5 1 2 3 4 5
No. of learners responding
No. of teachers responding
Leaners Teachers Leaners Teachers
1 43 27 28 2 1 1 1 101 2 -0.432 -0.600
2 5 11 62 21 2 1 1 101 2 0.016 -0.600
3 3 12 45 36 4 2 100 2 0.104 0.400
4 11 19 30 27 13 1 1 100 2 0.048 0.600
5 7 10 57 32 4 1 1 110 2 0.058 0.600
6 5 6 46 37 9 2 103 2 0.151 0.400
7 7 5 26 47 15 2 100 2 0.232 0.400
8 6 12 24 42 14 1 1 98 2 0.188 0.200
9 15 29 21 22 13 1 1 100 2 -0.044 -0.600
10 36 39 14 10 0 2 99 2 -0.408 -0.400
11 7 18 10 30 36 1 1 101 2 0.277 0.600
12 59 18 13 4 7 2 101 2 -0.467 -0.400
The index of agreement (IA) for statements 1, 9, 10, and 12 are negative for both teachers and
learners. This means the two samples (teachers and learners) disagreed with these statements.
For statement 2 the teachers disagreed but the learners were mostly undecided. This is clear
from table 4.9. As many as 62 out of 101 learner respondents were undecided for this
statement. Since the teachers know better it is assumed they agreed that government is not

95
ready to provide ICT infrastructure for all schools. Even though statements 1, 9, 10 and 12 have
negative IA, this does not make all of them factors that may negatively influence the use ICT to
teach. Statements 1 and 12 are factors that may negatively influence the use of ICT. This is
because as the two statements have negative IA, it means that the sample is saying, not all
schools in their district have ICT infrastructure (statement 1), and computers in their school are
not enough for all learners in the class (statement 12). And these can negatively influence ICT
use in teaching. However, statements 9 and 10 are not factors that may negatively influence
the use of ICT. Statement 9 and 10 reads:
I find it time consuming to use ICT in teaching Physics.
Learners get distracted by ICT in teaching Physics.
Since the statements have negative IA, it means learners and teachers do not find it time
consuming to use ICT in teaching. Also, learners do not get destructed by ICT in teaching
Physics. This means that the two statements are eliminated as factors that may negatively
influence the use of ICT to teach Physics.
From the 12 statements in section C of both the learners and teachers questionnaires, both
teachers and learners agreed with 8 of the statements as can be seen in table 4.9. Because the
teachers and learners agreed with these 8 statements, these statements are also therefore
eliminated as factors that may negatively influence the use of ICT in teaching Physics. These
statements are listed below.
The curriculum support ICT usage in teaching Physics.
The timetable of the school permits the use of ICT in teaching Physics.
The workloads (content of Physical Science syllabus) allow the use of ICT in teaching.
The simulation software programmes available currently are compatible with the South
African syllabus.
Schools and teachers can get access to software programmes that are compatible with
the South African syllabus.

96
Learners can get access to software programmes that are compatible with the South
African syllabus.
I find it time consuming to use ICT in teaching Physics.
Learners cannot learn Physics with ICT on their own (they need help from the teacher).
The way these statements are structured, if the respondents had disagreed, to them, then, they
may be considered as factors that may negatively influence the use of ICT to teach. But because
of the way statements 1, 2, and 12 are structured, the respondent disagreeing with them
makes them factors that may hamper the use of ICT to teach. Below are statements 1, 2, and 12
respectively.
All schools have the ICT infrastructure in my district.
Government is ready to make ICT infrastructure available to schools.
Computers available in my school are enough for all students in my classroom.
Of the 12 statements under section C, which are some possible factors that may hamper the
use of ICT in teaching Physics, it came out that only three of them may currently be hampering
the use of ICT in teaching Physics. These are the fact that:
All schools do not have the ICT infrastructure.
Government is not ready to make ICT infrastructure available to all schools and
Where there is ICT infrastructure, it is mostly inadequate.
4.5 RESEARCH QUESTION 2: To what extent does the use of computer simulations influence
the learning of electromagnetism in grade 11?
Analysis of data from the observation schedule, and section B and C of the questionnaires were
used in answering research question 2. From the classroom observation report in section 4.2.2,
the computer simulations influenced learning of electromagnetism positively: learners were
more active during their lessons, predicting, observing, discussing and explaining concepts by
the help of the teacher and the computer simulations. Learners could construct their own
understanding of scientific ideas within the framework of their existing knowledge. Then
analysis of the tests in table 4.7 also showed that the simulations helped increase conceptual
understanding for the experimental compared to the control group in these topics: current

97
carrying conductor, induced emf, electromagnets, magnetic poles, magnetic field lines,
electromagnetic induction and Faraday’s Law. This was further confirmed by the calculation of
the Hake’s normalized gain <g> in conceptual improvement. The normalized gain was
calculated for the experimental group as <g> = 0.32 (medium <g> course) and 0.18 for the
control group (low <g> course). (See section 4.3.7) Finally, analysis of teachers and learners
views from the questionnaires indicates that the teachers and learners accept the use of
computer simulations in the learning of electromagnetism. From the analysis in sections 4.4.1
and 4.4.2, the teachers and learners agreed that , ICT (computer simulations) usage makes
diagrams and writings clearer, it captures learners’ attention in class, it helps class control, it
brings improve excitement in learners, it makes it easier for learners to visualise lessons and it
makes imaginary concepts (e.g. magnetic field lines) real.
4.6 RESEARCH QUESTION 3: To what extent does the use of computer simulations influence
the teaching of electromagnetism in grade 11?
In answering research question 3, the analysis from classroom observation indicated that the
use of the computer simulation also positively influenced the teaching of electromagnetism
(see section 4.2.2). It provided opportunities to enhance a learner centred teaching approach
(see section 4.2.2). In the experimental group where the computer simulations were used, it
supported the teacher in his effort that helped the learners to gain conceptual understanding
because it created a learning environment that supports learning. As discussed in theoretical
framework, the simulations acted as that support (scaffolding) that the learners need to
construct knowledge (see section 4.3.3). This is an important component of the constructivist’s
theories referred to as the Zone of Proximal Development (ZPD) (see section 2.10). The views of
both teachers and learners from the analysis of the questionnaires showed that the teachers
and learners accept the use of computer simulations in teaching even though before the
research they were not exposed to it. From the analysis in sections 4.4.1 and 4.4.2, the teachers
and learners agreed that, ICT (computer simulations) usage should be integrated with
traditional normal teaching methods, it makes teaching Physics easier, it saves time used in
drawing and labelling diagrams on chalk board. They also agreed that ICT should always be used

98
in teaching Physics topics and that teachers should be “work shopped” on the use of ICT in
teaching.
4.7 SUMMARY
The chapter presented the observation of lessons of the teachers, analysis of test results, and
analysis of the questionnaires. The three research questions were also answered in this
chapter.

99
CHAPTER 5
CONCLUSIONS AND RECOMMENDATIONS
5.1 OVERVIEW
The topic electromagnetism is poorly understood by most learners and therefore they are not
able to satisfactorily answer sections on it in the Physics final examination paper and teachers
are also not very confident in teaching this section of the Physics curriculum (see section 1.3).
Learners also find it difficult to visualize many of the concepts in electromagnetism (see section
2.4). Research suggests that computer simulations and more learner-centred, teacher-learner
interactions can have a positive impact on Science teaching and learning (see section 1.5).
Therefore, the aim of this research was to investigate the impact of computer simulations on
the teaching and learning of the topic electromagnetism in grade 11 in one school in the
Mpumalanga Province. Hence the following research questions guided the study:
1. Does the use of computer simulations have an impact on the performance of
grade 11 learners in electromagnetism?
2. To what extent does the use of computer simulations influence the learning of
electromagnetism in grade 11?
3. To what extent does the use of computer simulations influence the teaching of
electromagnetism in grade 11?
To answer these questions, two teaching methods were compared. One teacher used the
traditional teacher-centred method to teach. The other teacher used the learner-centred
teaching approach with computer simulations. According to the constructivist theory (see
theoretical framework), in a learner-centred teaching environment, technology such as
computer simulation can serve as that initial scaffold that the learner needs, to be able to learn.
In the following section, the major findings of the study are summarized and their implications
for teaching and learning are highlighted.

100
5.2 SUMMARY OF FINDINGS
The first research question which guided this research was “Does the use of computer
simulations have an impact on the performance of grade 11 learners in electromagnetism?”
In answering this research question, the analysis of the results using Microsoft excel
spreadsheet to calculate the t-test of the post-test shows that even though the two groups
show no statistically significant difference in the performance in the pre-test, there was a
statistically significant difference in performance in the post-test which lead to the rejection of
the null hypothesis that states: the use of computer simulation has no impact on the
performance of grade 11 learners in electromagnetism.
The second research question that guided the research was: “To what extent does the use of
computer simulations influence the learning of electromagnetism in grade 11?”
In order to answer this question, the data collected using the classroom observation schedule,
as well as the analysis of the test items individually and section B of the teachers’ and learners’
questionnaires were quantitatively and qualitatively analysed.
From the classroom observation report in section 4.2.2, the computer simulations influenced
learning of electromagnetism positively. Learners were more active during their lessons,
predicting, observing, discussing and explaining concepts with the help of the teacher and the
computer simulations. In addition, the simulations provided an opportunity to visualise many of
the concepts in electromagnetism. Then quantitative analysis of the tests in table 4.7 also
showed that the simulations helped increase conceptual understanding for the experimental
group compared to the control group in these topics: current carrying conductor, induced emf,
electromagnets, magnetic poles, magnetic field lines, electromagnetic induction and Faraday’s
law. This was further confirmed by the calculation of the Hake’s normalized gain <g>. For the
experimental group, <g> was calculated as 0.32 (medium <g> course) and 0.18 for the control
group (low <g> course) also using table 4.7 and discussed in section 4.3.6. Also, a qualitative
analysis of teachers and learners views from the questionnaires indicates that the teachers and
learners accept the use of computer simulations in the teaching of electromagnetism. The
teachers and learners agreed that , ICT (computer simulations) usage makes diagrams and
writings clearer, it captures learners’ attention in class, it helps class control, it brings improve

101
excitement in learners, it makes it easier for learners to visualise lessons and it makes imaginary
concepts (e.g. magnetic field lines) real. (See sections 4.4.1 and 4.4.2)
The third question that guided the research was: “To what extent does the use of computer
simulations influence the teaching of electromagnetism in grade 11?”
In order to answer this question, the qualitative analysis from classroom observation was used.
The analysis indicated that the use of the computer simulation positively influenced the
teaching of electromagnetism (see section 4.2.2). The computer simulations supported the
teacher of the experimental group to help his learners to gain conceptual understanding. As
discussed in theoretical framework, the simulations acted as that support (scaffolding) that the
learners need to enhance learning (see section 4.3.3). This is an important component of the
constructivist’s theories referred to as the Zone of Proximal Development (ZPD) (see section
2.10). The views of both teachers and learners from the analysis of the questionnaires also
showed that the teachers and learners accept the use of computer simulations in teaching even
though before the research they were not exposed to it. They agreed that, ICT (computer
simulations) usage should be integrated with traditional normal teaching methods, it makes
teaching Physics easier, it saves time used in drawing and labelling diagrams on chalk board.
They also agreed that ICT should always be used in teaching Physics topics and that teachers
should be “work shopped” on the use of ICT in teaching. (See sections 4.4.1 and 4.4.2).
5.3 CONCLUSION
The improvement in the performance of the experimental group may be strongly attributed to
the use of computer simulations that aided learners’ to visualise the concepts, as opposed to
the teacher-centred teaching method used for teaching the control group (Gilbert, Justi &
Aksela 2003) cited in Kriek & Stols (2010). From the observation of all the lessons and the
analysis of both the tests and questionnaire, it can be concluded that all the lessons went well
especially the lessons with the experimental group. This is because the simulations captured
the attention of the learners, and this view is reflected by the learners in their responses in the
102
questionnaire. According to the theory of constructivism (see theoretical framework), learning
takes place by the learner completing tasks for which support (scaffolding) is initially required.
This support may include a tutor, a peer or technology such as the applications of computer
simulations. Mr. E, the teacher, the computer simulations, and the demonstrations acted as the
support or the scaffolding which helped the learners to construct their knowledge and
understanding of the topic electromagnetism as reflected in the analyses above.
5.4 IMPLICATIONS AND RECOMMENDATIONS
The intention of this research is not to attempt to generalize the present findings, but to do a
case study regarding the impact of computer simulation on the teaching and learning of the
topic electromagnetism in grade 11 Physics. The answers to this have implications for
researchers, teacher trainers, teachers, learners and the Department of Education.
This study contributes to literature in two ways. Firstly, it provides evidence that the use of
computer simulations combined with a more learner-centred method of teaching Physics could
have significant effect on learners’ performance. Secondly, it has provided a possible review of
an instructional model for constructivist learning approach in conjunction with the use of
computer technology. The researchers’ argument is that, Physics teachers should make use of
the computer simulations in teaching, since research suggests that it has the potential to make
abstract concepts real. The zone of proximal development (ZPD) by Vygotsky (1978) on which
this study was based was put into practice when the teacher used this simulation to create an
environment that helped learners in the experimental group to perform significantly better
than those in the control group. Indications are that computer simulation may hold the solution
to help teachers teach difficult and abstract areas of the Physics syllabus such as
electromagnetism as alluded to by the chief examiners report for the 2010 NCS examinations
(DOE, 2010 p.299). It is therefore recommended that computer simulations be used to
compliment the other methods, analogies, tutorials and practical lessons and not only as the
only method of teaching Physics.

103
From the National Education Infrastructure Management System (NEIM) report in May 2011, it
is evident that most schools in South Africa do not have laboratories and laboratory equipment
as indicated earlier in chapter one section 1.1 paragraph 4 of this report. For this reason
computer simulations must be seriously considered to be used which may help teachers and
learners in these schools without Science laboratories and even compliment the effort of those
having Science laboratories to help improve the performance in Science.
However, no matter how good a programme may be, its success depends heavily on the
commitment and calibre of the people who implement it, the teachers in this case. One
implication of classroom integration of technology is the need to train teachers in the use of
technology as an instructional tool. Without the relevant knowledge and skills, teachers will
find it difficult to weave technology attributes with the curriculum needs, classroom
management, and other instructional skills (Stols & Kriek, 2011). Therefore, it is recommended
that the teacher training programmes of the Universities are updated so as to equip new
teachers with the required knowledge and skills to handle computer-based teaching effectively.
Also, in-service training programmes need to be organized for the serving teachers.
Based on the encouraging findings of this study it is recommended that the study be repeated
with a larger and more representative sample. During such a replication, efforts should be
made to identify specific teacher needs for purposes of teacher training before
implementation.

104
REFERENCES
Abbott, A.F., (1982). Ordinary Level Physics. (3th ed.). London: Heinemann Educational Books.
Agina, A.M. (2003, June Monday), The advantages and disadvantages of the animation
technology in education and training. Twente, Enschede, The Netherlands.
Albe, V., Venturini, P., & Lascours, J. (2001). Electromagnetic concepts in mathematical
representation of Physics. Journal of Science Education and Technology, 10(2),
197–203.
Allen, M.J. (2004). Assessing Academic Programs in Higher Education (Online Document).
Retrieved May 2, 2012 from http://www.
openlibrary.org/.../Assessing_Academic_Programs_in_Higher_Education
Alsardary, S., & Blumberg, P. (2009). Interactive, Learner-Centred Methods of Teaching
Mathematics, PRIMUS: Problems, Resources, and Issues in Mathematics Undergraduate
Studies, 19:4, 401-416 Retrieved April 16, 2012 from
www.http://dx.doi.org/10.1080/10511970701678596
Anderson,J.R., Greens, J.G., Kilne, P.J., & Neves, D.M. (1991). Acquisition of problem solving
skill. In Anderson, J.R. (Ed.), Cognitive skills and their acquisition (pp.199 – 230).
Hillsdale,NJ: Lawrence Erlbaum Associates.
Arowolo, K.M. (2009). The impact of information and communications technology (ICT) in the
teaching and learning of kinematics in Grade 11 Physical Science. Unpublished masters
dissertation of the University of the Witwatersrand, Johannesburg.
Basson, I. (2010). Addressing the school-university Physics practical skills gap. Retrieved July 2,
2010, from http://www.assaf.org.za/wp-content/uploads/2010/.../Basson-Physics-skills-
gap.pdf
Becta, (2003). Primary schools – ICT and Standards. An analysis of national data from Ofsted
and QCA by Becta. Coventry: Becta.
Becta, (2004). A review of the research literature on barriers to the uptake of ICT by teachers
Coventry: Becta.
105
Binns, I.C., Bell, R.L., & Smetana, L.K. (2010). Using Technology to Promote Conceptual Change
in Secondary Earth Science Pupils’ Understandings of Moon Phases. Journal of the
Research Center for Educational Technology, 6 (2), 112 – 129.
Bliss, J., & Ogbom J. (1989). Tools for exploratory learning. Journal of Computer Assisted
Learning 5, 37 – 50.
Boyd, M. (2012). From the Comfort of Your Office: Facilitating Learner- Centred Continuing
Education in the Online Environment, Cataloging & Classification Quarterly, 50:2-3, 189-
203. Retrieved April 16, 2012 from www.
http://dx.doi.org/10.1080/01639374.2011.651195
Bozkurt, E.,& Ilik, A. (2010). The effect of computer simulations over students’ beliefs on Physics
and Physics success. Procedia Social and Behavioral Sciences 2, 4587–4591.
Bransford, J. D., Brown, A. L. & Cocking, R. R. (2000). How people learn: Brain, mind, experience,
and school. Washington, DC: National Academy Press.
Bruner, J. S. (1966). Toward a theory of instruction. Cambridge, Mass: Belknap Press of
Harvard University.
Caner,F., & Ogan-Bekkiroglu, F. (2009). Impact of MBL usage on the concept learning and graph
interpretation skills in Physics. Proceedings of the Frontiers in Science and Education
research Conference. Eastern Mediterranean University, Famagusta, North Cyprus. (pp
361 – 367).
Chang, K.E., Chen, Y.L., Lin, H.Y., & Sung, Y.T. (2008). Effects of learning support in simulation-
based Physics learning. Computers & Education, 51, 1486–149.
Chee, Y.P., Munirah S.K., Lim C. C., Koh T. S., Lau C.Y., Wong D., Lyna, Lee P., & Foong, S. K.
(2009). On improving students’ understanding of photoelectric effect. Proceedings of
the Frontiers in Science and Education research Conference. Eastern Mediterranean
University, Famagusta, North Cyprus. (pp 201 – 210).
Cigrik, E.,& Ergül, R. (2009). The investigation of the effect of simulation based teaching on the
student achievement and attitude in electrostatic induction. Procedia Social and
Behavioral Sciences 1, 2470 – 2474.

106
Collins, A. (1991). The Role of Computer Technology in Restructuring Schools. Phi Delta Kappan,
73 (1) 28 – 36.
Cutnell, J. D., & Johnson, K.W. (2005). Physics (6th ed.). Hoboken: John Willy & sons.
DeCorte, E. (1990). Learning with new information technologies in schools: Perspective from
the psychology of learning and instruction. Journal of Computer Assisted Learning, 6, 69-
87.
de Jong, T., & Van Joolingen, W. (1998). Scientific discovery learning with computer
simulations of conceptual domains. Review of Educational Research, 68, 179–201.
Dewey, J. (1966). Democracy and education. New York, NY: Free Press.
Dijkstra, S., Van Hout Worlter, B.H.M., & Van der Sijde, P.C. (1990). Research on instruction
design effects. In Van der Sijde, P.C. (Ed.). The effect of teacher training designed on the
basis of a teaching script. (pp. 62 – 78). New Jersey: Educational Technology
Publications.
DoE (Department of Education) (2011a). Educational measurement, assessment and public
examinations report on the national senior certificate examination results. Pretoria:
Department of Education.
DoE (Department of Education) (2011b). Physical Sciences Curriculum and Assessment Policy
Statement (CAPS) Final Draft. Pretoria: Department of Education.
DoE (Department of Education) (2010a). Chief examiners report on NCS November 2010,
part 2. (p. 299). Pretoria: Department of Education.
DoE (Department of Education) (2010b). Educational measurement, assessment and public
examinations report on the national senior certificate examination results. Pretoria:
Department of Education.
DoE (Department of Education) (2009a). National Senior Certificate Handbook:
Implementation. (p. 11). Pretoria: Department of Education.
DoE (Department of Education) (2009b). National Examinations and Assessment
Report on the National Senior Certificate Examination Results Part 2. Pretoria:
Department of Education.

107
DoE (Department of Education) (2009c). Physical Science National Curriculum Statement.
Grades 10 – 12 (General) Subject Assessment Guidelines. Pretoria: Department of
Education.
DoE (Department of Education) (2008). Physical Sciences National Curriculum Statement
Grades10 – 12 (General) Subject Assessment Guidelines. Pretoria: Department of
Education.
DoE (Department of Education) (2006).Physical Sciences National Curriculum Statement grades
10-12, Teacher Training Manual. Pretoria: Department of Education.
DOE (Department of Education) (2004). South African Government white paper on e-education.
Pretoria: Department of Education.
DoE (Department of Education). (2003). Physical Science National Curriculum Statement.
Grades 10 – 12 (General) Content. Pretoria: Department of Education.
DoS (Department of Statistics). (2011). Mid-year population estimate. Pretoria: Department of
Stastistics.
Dori,Y.J., & Belcher, J. (2005). How Does Technology-Enabled Active Learning Affect
Undergraduate Students’ Understanding of Electromagnetism Concepts? The journal of
learning Sciences, 14(2), 243–279.
Dori,Y.J., & Belcher, J. (2004, April). Improving Students’ Understanding of Electromagnetism
through Visualizations – A Large Scale Study. Paper submitted to the NARST Annual
Meeting – the National Association for Research in Science Teaching Conference,
Vancouver, BC. Retrieved September 12, 2010 from
http://web.mit.edu/jbelcher/www/TEALref/dori.pdf
Duit, R. (2009). Students’ and teachers’ conceptions and Science education. Kiel: Institude for
Science Education (IPN) (Distributed electronically).
Etkina, E., Van Heuvelen A., Brookes D.T.,& Mills D. (2002). Role of Experiments in Physics
Education – A Process Approach. The Physics Teacher, 40, 351 – 355.

108
Farrokhnia, M.R., & Esmailpour, A. (2010). A study on the impact of real, virtual and
comprehensive experimenting on students’ conceptual understanding of DC electric
circuits and their skills in undergraduate electricity laboratory. Procedia Social and
Behavioral Sciences, 2, 5474–5482.
Farrell, G., & Isaacs, S. (2007). Survey of ICT and Education in Africa: A Summary Report,
Based on 53 Country Surveys. Washington, DC: infoDev / World Bank. Retrieved
September 1, 2011 from http://www.infodev.org/en/Publication.353.html
Friedrich, H. F., & Hron, A. (2011). Factors affecting teachers’ student-centred classroom
computer use, Educational Media International, 48:4, 273-285 Retrieved April 16, 2012
from www.http://dx.doi.org/10.1080/09523987.2011.632276
Gay, L.R., & Airasian, P. (2003). Educational Research: Competencies for analysis and
application (7th ed.). Columbus: Merrill, Prentice Hall.
Gips, A., DiMattia, P., & Gips, J. (2004). The effect of assistive technology on educational costs:
Two case studies. In K. Miesenberger, J. Klaus, W. Zagler, D. Burger (eds.), Computers
Helping People with Special Needs, Springer, 2004, pp. 206-213.
Glickman, C. (1991). Pretending not to know what we know. Educational Leadership, 48(8), 4 -
10.
Guha, S. (2000, November). Are we all technically prepared? Teachers’ perspectives on the
causes of comfort or discomfort in using computers at elementary grade teaching. Paper
presented at the Annual Meeting of the National Association for the Education of Young
Children Atlanta, GA.
Hake, R.R. (1998). “Interactive-engagement versus traditional methods: A six-thousand-student
survey of mechanics test data for introductory Physics courses,” American Journal of
Physics. 66, 64-74.
Hake, R.R. (2007). "Design-Based Research in Physics Education Research: A Review," in A.E.
Kelly, R.A. Lesh, & J.Y. Baek, eds. (in press), Handbook of Design Research Methods in
Mathematics, Science, and Technology Education. Erlbaum; Retrieved September 8,
2010 from http://www.Physics.indiana.edu/~hake/DBR-Physics3.pdf.

109
Harrison, J. M., Blakemore, C. L., & Buck, M. M. (2001). Basic principles of curriculum design. In
Harrison (Ed.), Instructional strategies for secondary school physical education (5th ed.)
(pp. 131-148). Boston: McGraw-Hill.
Henisay, K.B. (2011). Philosophy of teaching. Retrieved November 30, 2011, from
http://www.web.Physics.ucsb.edu/-khensay/profesional/teaching_philosophy.pdf
Hermans, R., Tondeur, .J, van Braak, J., & Valcke, M. (2008). The impact of primary school
teachers’ educational beliefs on the classroom use of computers. Computers &
Education, 51, 1499–1509.
Huba, M.E., & Freed, J.E. (2000). Learner centered assessment on college campuses: Shifting
the focus from teaching to learning. Community College Journal of Research and Practice.
24(9)759 – 766.
Jimoyiannis, A., & Komis, V. (2001). Computer simulations in Physics teaching: a case study on
students' understanding of trajectory motion. Computers & Education, 36, 183-204.
Jirage, R. (2011). Branches of Science. Retrieved January 2, 2012, from
http://www.buzzle.com/articles/branches-ofScience.html
Jonassen, D. J., & Reeves, T. C. (1996). Learning with technology: Using computers as cognitive
tools. In D. J. Jonassen (ed.), Handbook of research for educational communications and
technology (pp. 693-719). New York: Simon & Schuster Macmillan.
Kahl, D.H. Jr, & Venette, S. (2010). To Lecture or Let Go: A Comparative Analysis of
Student Speech Outlines from Teacher-Centred and Learner-Centred Classrooms,
Communication Teacher, 24:3, 178-186. Retrieved April 16, 2012 from www.
http://dx.doi.org/10.1080/17404622.2010.490232
Kain, D. J. (2003). Teacher-centred versus student-centred: Balancing constraint and theory in
the composition classroom. Pedagogy 3 (1): 104–108.
Kelder, K.H. (2005). Study & master Physical Sciences. (2nd ed.). (grade 10 & 11). Cape Town:
Cambridge University Press.

110
Kennedy, D.M., & McNaught, C. (2001). Computer based cognitive tools: In Montgometrie, C.
&Viteli, J. (Eds), ED – MEDIA (pp 925 – 930). Proceedings of the 13th Annual world
conference on Educational Media, Hypermedia & Telecommunications. Tampere,
Finland, 25 – 30 June. Norfolk, VA: Association for the Advancement of Computers in
Education (AACE).
Kihumba, G.F. (2009). Availability and use of school laboratory facilities and their influence on
students’ achievement in Sciences: A case of secondary schools in Trans-Nzoia District.
Unpublished masters dissertation, of the School of Education, Moi University, Kitale.
Knapp, L.R., & Glenn, A.D. (1996). Restructuring schools with technology. Massechusetttes:
Allyn & Bacon.
Kopolo, L. (2009). Assessing the impact of qualified Mathematics and Science teachers in the
Buffalo City area. Unpublished masters dissertation, of the Nelson Mandela
Metropolitan University, Port Elizabeth.
Koponen, I.T. & Mäntylä, T. (2006). Generative Role of Experiments in Physics and in Teaching
Physics: A Suggestion for Epistemological Reconstruction. Science & Education, 15, 31-
54.
Kriek, J., & Grayson, D. (2009). A Holistic Professional Development model for South African
Physical Science teachers . South African Journal of Education, 29, 185-203.
Kriek, J., & Stols, G. (2010). Teachers’ beliefs and their intention to use interactive simulations in
their classrooms. South African Journal of Education, 30, 439-456.
Lai, C.C., & Kritsonis, W.A. (2006). The Advantages and Disadvantages of Computer Technology
in Second Language Acquisition. Doctoral forum. National journal for publishing and
mentoring doctoral student research, 3, (1) 2006.
Lukinbeal, C., Kennedy, C. B., Jones III, J. P., Finn, J., Woodward, K. A., Nelson, D., Grant, Z. A.,
Antonopolis, N., Palos, A., & Atkinson-Palombo, C. (2007). Mediated geographies:
Critical pedagogy and geographic education. APCG Yearbook, 69, 31_44.

111
Makomosela, Q. (1996). The influence of High School Physics Teachers’ beliefs about Physics
and Physics and Physics Education on alternative conceptions in electromagnetism: A
Lesotho study. Unpublished master’s dissertation, of the University of the
Withwatersrand, Johannesburg.
McKagan, S.B., Perkins, K.K., Dubson, C., Malley, C., Reid, S., LeMaster, R., & Wieman, C.E.
(2008). Developing and Researching PhET simulations for Teaching Quantum Mechanics.
American Journal of Physics, 76, 406-417.
Mevarech, A. R., & Light, P. H. (1992). Peer-based interaction at the computer: Looking
backward, looking forward. Learning and Instruction, 2, 275-280.
Mhlongo, M.R. (2010). The contribution of simulations to the practical work of foundation
Physics students at the University of Limpopo. Unpublished masters dissertation, of the
University of South Africa, Pretoria.
Mlambo, W. (2007). Information and communication technology in A – Level Physics teaching
and learning at secondary schools in Manicaland Zimbabwe: Multiple case studies
unpublished masters dissertation, of the Rhodes University.
Modini, R. (n.d). Why study Physics and is Physics relevant. Retrieved October 6, 2011, from
http://www.tuition.com.hk/Physics.htm
More than Television: Discovery Channel's Non-Profit Initiative Encourages Learning. (2008).
Retrieved January 6, 2009, from http://www.elearning-africa.com/.../more-than-
television-discovery-channel
Mumtaz, S. (2000). Factors affecting teachers’ use of information and communications
technology: a review of the literature. Journal of Information Technology for Teacher
Education, 9 (3), 319-341.
Murdock, E. (2004). History, the History of Computers, and the History of Computers Education.
Retrieved April 4, 2010, from http://www.csulb.edu/~murdock/histofcs.html

112
National Research Council. (2011). Learning Science Through Computer Games and
Simulations. Committee on Science Learning: Computer Games, Simulations, and
Education, Margaret A. Honey and Margaret Hilton, Editors. Board on Science
Education, Division of Behavioral and Social Sciences and Education. Washington, DC:
The National Academies Press. Retrieved January 4, 2012 form http://www.nap.edu.
NEIMS. (2011). National Education Infrastructure Management Systems. Pretoria
Department of Education: Retrieved June 15, 2012
from http://www.education.gov/emis/emiweb/neims.html.
Nelkon, M., & Parker, P. (1984), Advanced Level Physics (5th ed.). London: Heinemann
Educational Books.
Niess, M.L., Lee, J.K., & Kajder, S.B. (2007). Guiding Learning with Technology. Hoboken: John
Willy & sons.
Ogbom, J. (1998). Cognitive development and qualitative modelling. Journal of Computer
Assisted Learning 14, 292 –307.
Ogbonaya, U.I. (2010). Improving the teaching and learning of parabolic functions by the use of
Information and Communication Technology (ICT). African journal of research in
Mathematics, Science and technology education 14 (1) 49 – 60.
Onwu, G.O.M. (1999). An Investigation of the availability and use of learning materials in Grade
12 Science classes in some selected schools in the Northern Province. [Electronic
version], 1-52. Retrieved from June
http://www.jet.org.za/.../001731_onwu_Use%20oflearninig%20materials.pdf
Ouellette, J. (1999). Physicists graduate from Wall Street. American Institute of Physics, 5 (155-
6) 9 -13 Retrieved January 2, 2012 from http://www.aip.org/tip/INPHFA/vol-5//155-
6/p9.pdf
Perkins, K., Adams, W., Dubson, M., Finkelstein, N., Reid, S., Wieman, C. and LeMaster, R.
(2006). PhET: Interactive Simulations for Teaching and Learning Physics.
Piaget, J. (1970). Piagets’ theory. In P. H. Mussen (Ed.), Carmichael's manual of child
psychology, (3rd ed., pp. 703-732). New York, NY: John Wiley & Sons.

113
Planinic, M. (2006). Assessment of difficulties of some conceptual areas
from electricity and magnetism using the conceptual survey of electricity
and magnetism. American Journal of Physics, 74(12): 1143-1148.
Plato Learning Centre, (2005). Multimedia Science School on CD – ROM. [CD ROM]. (11th - 16th
ed.). version 2.0. London: United Kingdom: Plato Learning.
Prescott, C. (2006). The Oxford Science Study Dictionary. (2nd ed.). Singapore: KHL Printing Co
Pte Ltd.
Randler, C., & Hulde, M. (2007): Hands‐on versus teacher‐centred experiments in soil ecology,
Research in Science & Technological Education, 25(3), 329-338. Retrieved April 16, 2012
from www.http://dx.doi.org/10.1080/02635140701535091
Riel, M. M. (1998). Just-in-time learning or learning communities. (p. 18). Abu Dhabi: The
Fourth Annual Conference of the Emirates Center for Strategic Studies and Research.
Rotbain, Y., Marbach-Ad, G., & Stavy, R. (2008). Using a Computer Animation to Teach High
School Molecular Biology. Journal of Science Education Technology, 17, 49-58.
Rutten, N., van Joolingen, W.R., & van der Veen, J.T., (2012). The learning effects of computer
simulations in Science education. Computers & Education 58, 136–153.
Saglam, M. (2010). Students’ performance awareness, motivational orientations and learning
strategies in a problem-based electromagnetism course. Asia-Pacific Forum on Science
Learning and Teaching, 11, (16) 1-18.
Saglam, M., & Millar, R. (2006). Upper high school students’ understanding of
electromagnetism. International Journal of Science Education, 28(5), 543–566.
Schacter, J. (1999). The impact of education technology on student achievement: what the
most current research has to say. Santa Monica, CA: Milken Exchange on Education
Technology.
Sharma, T. (2008). “Teaching - learning process: Characteristic and limitation of behaviourist,
cognitivist and humanistic approach to learning ” (Online document). Retrieved May 29,
2012 from www.scribd.com/doc/5769721/teaching-learning-process
Stewart, J. (2010). Correcting the Normalized Gain. The Physics Teacher, 48 (3), 194.

114
Stols, G., & Kriek, J. (2011). Why don’t all maths teachers use dynamic geometry software in
their classrooms? Australasian Journal of Educational Technology. 27(1), 137-151.
Tatto, M.T. (1999). “Conceptualizing and Studying Teacher Education across World
Regions: An Overview,” (Background paper prepared for the Conference on Teachers in
Latin America: New Perspectives on their Development and Performance, San Jose,
Costa Rica, June 28-30, 1999). World Bank: Washington D.C.
Trey, L. and Khan, K (2008). How Science students can learn about unobservable phenomena
using computer-based analogies. Computers & Education, 51, 519–529.
Trucano, M. (2010). Knowledge Maps: ICT in Education. Washington, DC: The World Bank.
Retrieved September 1, 2011 from http://www.worldbank.org/education/ict
Trundle, K.C., & Bell, R.L. (2010). The use of a computer simulation to promote conceptual
change: A quasi-experimental study. Computers & Education 54, 1078–1088.
Vygotsky, L. S. (1978). Mind in society: the development of higher psychological processes.
Cambridge: Harvard University Press.
Wieman, C.E., Perkins, K.K., & Adams, W.K. (2007). Oersted Medal Lecture: Interactive
Simulations for teaching Physics: What works, what doesn't and why. American Journal
of Physics. 76, 393-399.
Wieman, C.E., Adams, W.K., & Perkins, K.K. (2008). PhET: Simulations That Enhance
Learning, American Journal of Physics.76 (4 & 5), 393-399.
Wood, J.B. (2008). Learner-Centred Education in Gerontology and Geriatrics, Gerontology &
Geriatrics Education, 29:3, 207-209. Retrieved April 16, 2012 from
www.http://dx.doi.org/10.1080/07399330802359427
Woodford, C. (2011). History of Computers. Retrieved January 3, 2012 from
http://www.explainthatstuff.com/historyof
Woolfolk – Hoy, A. (2004). Educational Psychology (9th ed.). Boston: Pearson Allyn & Bacon.

115
APPENDICES
APPENDIX A
CLASSROOM OBSERVATION SCHEDULE
Teacher observed: __________________________________ Lesson: ____________________
Observer: _______________________________
Subject: Physical Science
Topic: __________________________________
Grade: 11
Instructions: For each of these statements indicate in the appropriate box in front of it with X
Teachers teaching style Excellent Good Fair Poor 1 Teacher reviews learners previous knowledge
2 Evidence of teacher preparation prior to the lesson
3 Teacher involves learners in the lesson (e.g. puts learners in groups to perform activities or to have discussions and report to the class)
4 Teacher appropriately uses teaching aids to facilitate teaching and learning
5 Teacher is able to simplify difficult concepts to learners
6 Teacher encourages learners to answer other learners questions
7 Teacher provides relevant examples on concepts that relates to their everyday experiences
8 Teacher presents well planned lesson according to the curriculum and the work schedule
9 Teacher’s general class management (e.g. managing class discussions, activities and learner discipline)
10 Teacher evaluates lesson to check the achievement of lesson objectives

116
APPENDIX A1
CLASSROOM OBSERVATION SCHEDULE
Teacher observed: Mr. C. Lesson: One
Observer: Researcher
Subject: Physical Science
Topic: Magnets, magnetic poles and magnetic field lines
Grade: 11
Instructions: For each of these statements indicate in the appropriate box in front of it with X
Teachers teaching style Excellent Good Fair Poor
1 Teacher reviews learners previous knowledge X
2 Evidence of teacher preparation prior to the lesson X
3 Teacher involves learners in the lesson (e.g. puts learners in groups to perform activities or to have discussions and report to the class)
X
4 Teacher appropriately uses teaching aids to facilitate teaching and learning
X
5 Teacher is able to simplify difficult concepts to learners X
6 Teacher encourages learners to answer other learners questions
X
7 Teacher provides relevant examples on concepts that relates to their everyday experiences
X
8 Teacher presents well planned lesson according to the curriculum and the work schedule
X
9 Teacher’s general class management (e.g. managing class discussions, activities and learner discipline)
X
10 Teacher evaluates lesson to check the achievement of lesson objectives
X

117
APPENDIX A2
CLASSROOM OBSERVATION SCHEDULE
Teacher observed: Mr. C. Lesson: Two
Observer: Researcher
Subject: Physical Science
Topic: Field around a straight wire, Right hand grip rule, Field around circular wire and Field around a
solenoid
Grade: 11
Instructions: For each of these statements indicate in the appropriate box in front of it with X
Teachers teaching style Excellent Good Fair Poor
1 Teacher reviews learners previous knowledge X
2 Evidence of teacher preparation prior to the lesson X
3 Teacher involves learners in the lesson (e.g. puts learners in groups to perform activities or to have discussions and report to the class)
X
4 Teacher appropriately uses teaching aids to facilitate teaching and learning
X
5 Teacher is able to simplify difficult concepts to learners X
6 Teacher encourages learners to answer other learners questions
X
7 Teacher provides relevant examples on concepts that relates to their everyday experiences
X
8 Teacher presents well planned lesson according to the curriculum and the work schedule
X
9 Teacher’s general class management (e.g. managing class discussions, activities and learner discipline)
X
10 Teacher evaluates lesson to check the achievement of lesson objectives
X

118
APPENDIX A3
CLASSROOM OBSERVATION SCHEDULE
Teacher observed: Mr. C. Lesson: Three
Observer: Researcher
Subject: Physical Science
Topic: Electromagnets and their uses
Grade: 11
Instructions: For each of these statements indicate in the appropriate box in front of it with X
Teachers teaching style Excellent Good Fair Poor
1 Teacher reviews learners previous knowledge X
2 Evidence of teacher preparation prior to the lesson X
3 Teacher involves learners in the lesson (e.g. puts learners in groups to perform activities or to have discussions and report to the class)
X
4 Teacher appropriately uses teaching aids to facilitate teaching and learning
X
5 Teacher is able to simplify difficult concepts to learners X
6 Teacher encourages learners to answer other learners questions
X
7 Teacher provides relevant examples on concepts that relates to their everyday experiences
X
8 Teacher presents well planned lesson according to the curriculum and the work schedule
X
9 Teacher’s general class management (e.g. managing class discussions, activities and learner discipline)
X
10 Teacher evaluates lesson to check the achievement of lesson objectives
X

119
APPENDIX A4
CLASSROOM OBSERVATION SCHEDULE
Teacher observed: Mr. C. Lesson: Four
Observer: Researcher
Subject: Physical Science
Topic: Fleming’s left hand rule, force on current carrying conductor in a magnetic field,
and motors
Grade: 11
Instructions: For each of these statements indicate in the appropriate box in front of it with X
Teachers teaching style Excellent Good Fair Poor
1 Teacher reviews learners previous knowledge X
2 Evidence of teacher preparation prior to the lesson X
3 Teacher involves learners in the lesson (e.g. puts learners in groups to perform activities or to have discussions and report to the class)
X
4 Teacher appropriately uses teaching aids to facilitate teaching and learning
X
5 Teacher is able to simplify difficult concepts to learners X
6 Teacher encourages learners to answer other learners questions
X
7 Teacher provides relevant examples on concepts that relates to their everyday experiences
X
8 Teacher presents well planned lesson according to the curriculum and the work schedule
X
9 Teacher’s general class management (e.g. managing class discussions, activities and learner discipline)
X
10 Teacher evaluates lesson to check the achievement of lesson objectives
X

120
APPENDIX A5
CLASSROOM OBSERVATION SCHEDULE
Teacher observed: Mr. C. Lesson: Five
Observer: Researcher
Subject: Physical Science
Topic: Electromagnetic induction and Faraday’s law
Grade: 11
Instructions: For each of these statements indicate in the appropriate box in front of it with X
Teachers teaching style Excellent Good Fair Poor
1 Teacher reviews learners previous knowledge X
2 Evidence of teacher preparation prior to the lesson X
3 Teacher involves learners in the lesson (e.g. puts learners in groups to perform activities or to have discussions and report to the class)
X
4 Teacher appropriately uses teaching aids to facilitate teaching and learning
X
5 Teacher is able to simplify difficult concepts to learners X
6 Teacher encourages learners to answer other learners questions
X
7 Teacher provides relevant examples on concepts that relates to their everyday experiences
X
8 Teacher presents well planned lesson according to the curriculum and the work schedule
X
9 Teacher’s general class management (e.g. managing class discussions, activities and learner discipline)
X
10 Teacher evaluates lesson to check the achievement of lesson objectives
X

121
APPENDIX A6
CLASSROOM OBSERVATION SCHEDULE
Teacher observed: Mr. C. Lesson: Six
Observer: Researcher
Subject: Physical Science
Topic: Transformers, power generation and distribution
Grade: 11
Instructions: For each of these statements indicate in the appropriate box in front of it with X
Teachers teaching style Excellent Good Fair Poor
1 Teacher reviews learners previous knowledge X
2 Evidence of teacher preparation prior to the lesson X
3 Teacher involves learners in the lesson (e.g. puts learners in groups to perform activities or to have discussions and report to the class)
X
4 Teacher appropriately uses teaching aids to facilitate teaching and learning
X
5 Teacher is able to simplify difficult concepts to learners X
6 Teacher encourages learners to answer other learners questions
X
7 Teacher provides relevant examples on concepts that relates to their everyday experiences
X
8 Teacher presents well planned lesson according to the curriculum and the work schedule
X
9 Teacher’s general class management (e.g. managing class discussions, activities and learner discipline)
10 Teacher evaluates lesson to check the achievement of lesson objectives
X

122
APPENDIX A7
CLASSROOM OBSERVATION SCHEDULE
Teacher observed: Mr. E. Lesson: One
Observer: Researcher
Subject: Physical Science
Topic: magnets, magnetic poles and magnetic field lines
Grade: 11
Instructions: For each of these statements indicate in the appropriate box in front of it with X
Teachers teaching style Excellent Good Fair Poor 1 Teacher reviews learners previous knowledge X
2 Evidence of teacher preparation prior to the lesson X
3 Teacher involves learners in the lesson (e.g. puts learners in groups to perform activities or to have discussions and report to the class)
X
4 Teacher appropriately uses teaching aids to facilitate teaching and learning
X
5 Teacher is able to simplify difficult concepts to learners
X
6 Teacher encourages learners to answer other learners questions
X
7 Teacher provides relevant examples on concepts that relates to their everyday experiences
X
8 Teacher presents well planned lesson according to the curriculum and the work schedule
X
9 Teacher’s general class management (e.g. managing class discussions, activities and learner discipline)
X
10 Teacher evaluates lesson to check the achievement of lesson objectives
X

123
APPENDIX A8
CLASSROOM OBSERVATION SCHEDULE
Teacher observed: Mr. E. Lesson: Two
Observer: Researcher
Subject: Physical Science
Topic: Field around a straight wire, Right hand grip rule, Field around circular wire and Field around a
solenoid
Grade: 11
Instructions: For each of these statements indicate in the appropriate box in front of it with X
Teachers teaching style Excellent Good Fair Poor
1 Teacher reviews learners previous knowledge X
2 Evidence of teacher preparation prior to the lesson X
3 Teacher involves learners in the lesson (e.g. puts learners in groups to perform activities or to have discussions and report to the class)
X
4 Teacher appropriately uses teaching aids to facilitate teaching and learning
X
5 Teacher is able to simplify difficult concepts to learners X
6 Teacher encourages learners to answer other learners questions
X
7 Teacher provides relevant examples on concepts that relates to their everyday experiences
X
8 Teacher presents well planned lesson according to the curriculum and the work schedule
X
9 Teacher’s general class management (e.g. managing class discussions, activities and learner discipline)
X
10 Teacher evaluates lesson to check the achievement of lesson objectives
X

124
APPENDIX A9
CLASSROOM OBSERVATION SCHEDULE
Teacher observed: Mr. E. Lesson: Three
Observer: Researcher
Subject: Physical Science
Topic: Electromagnets and their uses
Grade: 11
Instructions: For each of these statements indicate in the appropriate box in front of it with X
Teachers teaching style Excellent Good Fair Poor
1 Teacher reviews learners previous knowledge X
2 Evidence of teacher preparation prior to the lesson X
3 Teacher involves learners in the lesson (e.g. puts learners in groups to perform activities or to have discussions and report to the class)
X
4 Teacher appropriately uses teaching aids to facilitate teaching and learning
X
5 Teacher is able to simplify difficult concepts to learners X
6 Teacher encourages learners to answer other learners questions
X
7 Teacher provides relevant examples on concepts that relates to their everyday experiences
X
8 Teacher presents well planned lesson according to the curriculum and the work schedule
X
9 Teacher’s general class management (e.g. managing class discussions, activities and learner discipline)
X
10 Teacher evaluates lesson to check the achievement of lesson objectives
X

125
APPENDIX A10
CLASSROOM OBSERVATION SCHEDULE
Teacher observed: Mr. E. Lesson: Four
Observer: Researcher
Subject: Physical Science
Topic: Fleming’s left hand rule, force on current carrying conductor in a magnetic field,
and motors
Grade: 11
Instructions: For each of these statements indicate in the appropriate box in front of it with X
Teachers teaching style Excellent Good Fair Poor
1 Teacher reviews learners previous knowledge X
2 Evidence of teacher preparation prior to the lesson X
3 Teacher involves learners in the lesson (e.g. puts learners in groups to perform activities or to have discussions and report to the class)
X
4 Teacher appropriately uses teaching aids to facilitate teaching and learning
X
5 Teacher is able to simplify difficult concepts to learners X
6 Teacher encourages learners to answer other learners questions
X
7 Teacher provides relevant examples on concepts that relates to their everyday experiences
X
8 Teacher presents well planned lesson according to the curriculum and the work schedule
X
9 Teacher’s general class management (e.g. managing class discussions, activities and learner discipline)
X
10 Teacher evaluates lesson to check the achievement of lesson objectives
X
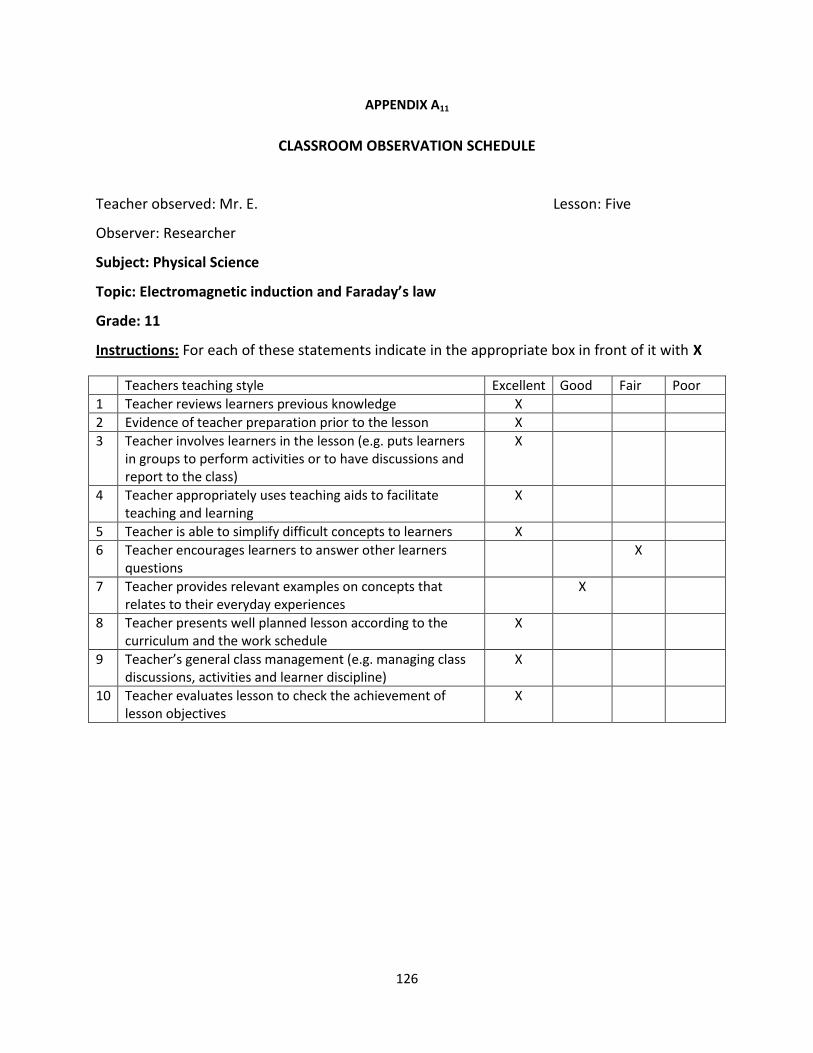
126
APPENDIX A11
CLASSROOM OBSERVATION SCHEDULE
Teacher observed: Mr. E. Lesson: Five
Observer: Researcher
Subject: Physical Science
Topic: Electromagnetic induction and Faraday’s law
Grade: 11
Instructions: For each of these statements indicate in the appropriate box in front of it with X
Teachers teaching style Excellent Good Fair Poor
1 Teacher reviews learners previous knowledge X
2 Evidence of teacher preparation prior to the lesson X
3 Teacher involves learners in the lesson (e.g. puts learners in groups to perform activities or to have discussions and report to the class)
X
4 Teacher appropriately uses teaching aids to facilitate teaching and learning
X
5 Teacher is able to simplify difficult concepts to learners X
6 Teacher encourages learners to answer other learners questions
X
7 Teacher provides relevant examples on concepts that relates to their everyday experiences
X
8 Teacher presents well planned lesson according to the curriculum and the work schedule
X
9 Teacher’s general class management (e.g. managing class discussions, activities and learner discipline)
X
10 Teacher evaluates lesson to check the achievement of lesson objectives
X

127
APPENDIX A12
CLASSROOM OBSERVATION SCHEDULE
Teacher observed: Mr. E. Lesson: Six
Observer: Researcher
Subject: Physical Science
Topic: Transformers, power generation and distribution
Grade: 11
Instructions: For each of these statements indicate in the appropriate box in front of it with X
Teachers teaching style Excellent Good Fair Poor
1 Teacher reviews learners previous knowledge X
2 Evidence of teacher preparation prior to the lesson X
3 Teacher involves learners in the lesson (e.g. puts learners in groups to perform activities or to have discussions and report to the class)
X
4 Teacher appropriately uses teaching aids to facilitate teaching and learning
X
5 Teacher is able to simplify difficult concepts to learners X
6 Teacher encourages learners to answer other learners questions
X
7 Teacher provides relevant examples on concepts that relates to their everyday experiences
X
8 Teacher presents well planned lesson according to the curriculum and the work schedule
X
9 Teacher’s general class management (e.g. managing class discussions, activities and learner discipline)
X
10 Teacher evaluates lesson to check the achievement of lesson objectives
X

128
APPENDIX B NAME: _________________________________ GRADE: ________ ELECTROMAGNETISM TEST: CIRCLE THE CORRECT ANSWER FOR EACH QUESTION IN THIS PART. Part I; Multiple Choices (1 point each) (40 Minutes)
1. A current carrying conductor placed in a magnetic field experiences a force, the direction of the force depends on
(a) The direction of the current flow (b) The switch (c) The type of conductor used (d) The strength of the magnet
2. Which of the following devices are based on the principles that a current carrying conductor in a magnetic field experience a force
(a) A relay (b) A DC motor (c) A coil (d) An electromagnet
3. An EMF is induced when
(a) The electric flux threading a coil changes (b) The magnetic flux threading coil changes (c) The galvanometer is connected to a device (d) The galvanometer is connected to a device
4. When the north pole of a magnet is pushed into a coil connected to galvanometer, the needle
(a) Moves to the left (b) Moves to the right (c) Stays still (d) Moves down
5. The direction in which an induced current flows depends on
(a) Ohm’s law (b) Kirchhoff’s law
(c) Lenz’s law (d) Faraday’s law 6. Which of the following devices DOES NOT operate on the principle of induced EMF?
(a) An alternator (b) A dynamo (c) An AC generator (d) An electromagnet

129
7. The size of the induced EMF depends on (a) Rate of change of magnet flux with respect to time (b) Rate of change of electric flux with respect to time (c) Rate of change of voltage with respect to time (d) Rate of change of induced current
8. The principle of operation of an electromagnetic relay is (a) A current flowing through a conductor produces a concentric magnetic field (b) A current flowing through a conductor produces a concentric electric field
(c) A changing magnetic field includes a current (d) A changing electric field induces a current 9. Electromagnetic relays can be found in
(a) The starter motor of a car (b) A dynamo (c) A computer (d) A transformer
10. Which of these inventions uses the generation of electricity from a magnet?
(a) A microphone (b) A generator (c) A galvanometer (d) A motor
11. What are the opposite ends of a magnet called?
(a) Its terminals (b) Its north and south poles (c) Its magnetic fields (d) Its electromagnetic poles
12. What force would result if the north poles of two magnets were brought near one another? (a) Repulsion (b) Attraction (C) Friction (d) Compaction 13. What can iron filings sprinkled on a piece of paper with a magnet under the paper show you?
(a) That current can flow through the filings (b) That paper distorts magnetism (c) That magnetic fields are counter clockwise (d) The pattern of a magnetic force field
14. How can you show that electricity creates a magnetic field?
(a) Use a compass near a wire with current flowing through it (b) Move wire through an electric field (c) Move wire through a magnetic field (d) Connect a battery to the magnetic field

130
15. How do you make an electromagnet? (a) Connect a magnet to battery (b) Run current through a wire wrapped around an iron rod (c) Place a wire in a magnetic field (d) Place a wire in a magnetic field with current flowing through it
16. What happens when you turn off current in an electromagnet?
(a) The magnetism is lost (b) The current keeps flowing because of the magnetic force (c) The electromagnet loses its polarity (d) The electromagnet becomes a generator
17. The area surrounding a magnet that exerts a force on all magnetic materials located near it
(a) Electric field (b) Magnetic poles (c) Magnetic field (d) Electric flux
18. Can you generate electricity with a magnet?
(a) No, because only friction on electric charges or batteries create electricity (b) Yes, by moving a wire thorough a magnetic field (c) Yes, by putting a current through a wire around a magnet (d) Yes, because magnets use electricity to stay effective
19. Transformers can (a) Increase voltage (b) Decrease voltage (c) Neither decrease nor increase voltage (d) Increase or decrease voltage 20. A transformer is needed to step down the 230V mains supply to 6V. If the primary coil has 1 000 turns, how many turns must the secondary coil have?
(a) 36 turns (b) 46 turns (c) 16 turns (d) 26 turns

131
PART 2: (2 point each): Answer this part on the plane sheets attached. 21. Draw a bar magnet indicating the north and south poles. Show on the same diagram, the magnetic flux. 22. What are electromagnets composed of? 23. What is electromagnetic induction? How does it work? 24. State Flemings Left-hand Rule. 25. State Faradays Law of electromagnetic induction.

132
APPENDIX C
A QUESTIONNAIRE FOR LEARNERS ON ICT USE IN TEACHING AND LEARNING PHYSICS
Instructions: Please tick or fill in where necessary. For the purpose of this questionnaire Information
and Communication Technology (ICT) is defined as a range of technologies for gathering, storing,
retrieving, processing, analyzing and transmitting information like computers, projectors and internet.
SECTION A: Background Information
1. Name of Learner: __________________________
2. Gender?
3. Age?
13 -15 years
15 - 17 years
17 - 19 years
over 19 years
Instructions: For sections B, C and D, use the codes given, by writing a code (e.g. 1, 2, 3, 4 or 5) of your
choice against the questions. The codes are given below.
Strongly disagree (SD) Disagree (D) Undecided (U) Agree (A) Strongly agree (SA)
1 2 3 4 5
Male Female
SECTION B: Learners views on teaching electromagnetism using computer simulation.
SD D U A SA
1 2 3 4 5
1 The teacher uses ICT (computer simulation) to teach even before this research.
2 Teachers should be “work shopped” on the use of ICT in teaching.
3 ICT should always be used in teaching Physics topics.
4 ICT usage should be integrated with traditional normal teaching methods.
5 ICT usage makes teaching Physics easier.
6 ICT usage saves time used in drawing and labeling diagrams on chalk board.
7 ICT usage makes diagrams clearer than drawing them on the chalk board.
8 ICT usage captures learners’ attention in class.
9 ICT usage helps class control.
10 ICT usage brings excitement in learners.
11 ICT usage makes it easier for learners to visualize lessons.
12 ICT usage makes imaginary concepts (e.g. magnetic field lines) real

133
SECTION C: Factors that may influence the use of ICT in teaching.
SD D U A SA
1 2 3 4 5
1 All schools have the ICT infrastructure in my district.
2 Government is ready to make ICT infrastructure available to schools.
3 The curriculum support ICT usage in teaching Physics.
4 The timetable of the school permits the use of ICT in teaching Physics.
5 The workloads (content of Physical Science syllabus) allow the use of ICT in teaching.
6 The simulation software programmes available currently are compatible with the South African syllabus.
7 Teachers can get access to software programmes that are compatible with the South African syllabus.
8 Learners can get access to software programmes that are compatible with the South African syllabus.
9 I find it time consuming to use ICT in teaching Physics.
10 Learners get distracted by ICT in teaching Physics.
11 Learners cannot learn Physics with ICT on their own (they need help from the teacher).
12 Computers available in my school are enough for all learners in my class.

134
APPENDIX D
A QUESTIONNAIRE FOR TEACHERS ON ICT USE IN TEACHING AND LEARNING PHYSICS
Instructions: Please tick or fill in where necessary. For the purpose of this questionnaire Information
and Communication Technology (ICT) is defined as a range of technologies for gathering, storing,
retrieving, processing, analyzing and transmitting information like computers, projectors and internet.
SECTION A: Background Information
1. Name of Teacher __________________________
2. Gender:
3. Age
20 -25 years
25 - 30 years
30 - 35 years
over 35 years
4. Qualifications:
o Academic __________________________ o Professional __________________________ o Others __________________________
Instructions: For sections B, C and D, use the codes given, by writing a code (e.g. 1, 2, 3, 4 or 5) of your
choice against the questions. The codes are given below.
Strongly disagree (SD) Disagree (D) Undecided (U) Agree (A) Strongly agree (SA)
1 2 3 4 5
Male Female

135
SECTION B: Teachers views on teaching electromagnetism using computer simulation.
SD D U A SA
1 2 3 4 5
1 I, the teacher do use ICT (computer simulation) to teach even before this research.
2 Teachers should be “work shopped” on the use of ICT in teaching.
3 ICT should always be used in teaching Physics topics.
4 ICT usage should be integrated with traditional normal teaching methods.
5 ICT usage makes teaching Physics easier.
6 ICT usage saves time used in drawing and labeling diagrams on chalk board.
7 ICT usage makes diagrams clearer than drawing them on the chalk board.
8 ICT usage captures learners’ attention in class.
9 ICT usage helps class control.
10 ICT usage brings excitement in learners.
11 ICT usage makes it easier for learners to visualize lessons.
12 ICT usage makes imaginary concepts (e.g. magnetic field lines) real
SECTION C: Factors that may influence the use of ICT in teaching.
SD D U A SA
1 2 3 4 5
1 All schools have the ICT infrastructure in my district.
2 Government is ready to make ICT infrastructure available to schools.
3 The curriculum support ICT usage in teaching Physics.
4 The timetable of the school permits the use of ICT in teaching Physics.
5 The workloads (content of Physical Science syllabus) allow the use of ICT in teaching.
6 The simulation software programmes available currently are compatible with the South African syllabus.
7 Teachers can get access to software programmes that are compatible with the South African syllabus.
8 Learners can get access to software programmes that are compatible with the South African syllabus.
9 I find it time consuming to use ICT in teaching and Physics.
10 Learners get distracted by ICT in teaching Physics.
11 Learners cannot learn Physics with ICT on their own (they need help from the teacher).
12 Computers available in my school are enough for all learners in my class.

136
APPENDIX E
Pilot Group Test Scores
Learner Test 1 (X1) X12 Test 2 (X2) X2
2
1 19 361 21 441
2 20 400 19 361
3 12 144 15 225
4 13 169 13 169
5 12 144 11 121
6 11 121 14 196
7 12 144 14 196
8 15 225 15 225
9 15 225 15 225
10 14 196 15 225
11 16 256 15 225
12 21 441 20 400
13 14 196 16 256
14 16 256 20 400
15 11 121 10 100
16 17 289 19 361
17 10 100 15 225
18 8 64 9 81
19 14 196 15 225
20 21 441 20 400
21 9 81 14 196
22 10 100 12 144
23 15 225 15 225
24 11 121 16 256
25 15 225 7 49
26 9 81 6 36
27 10 100 12 144
28 12 144 13 169
29 7 49 8 64
30 13 169 16 256
31 15 225 9 81
32 15 225 10 100
33 13 169 16 256
34 10 100 9 81
35 6 36 10 100
TOTAL 461 6539 484 7214

137
APPENDIX F
CALCULATING SPEARMAN’S CORRELATIONS COEFICIENT FOR THE PILOT GROUP
Pre-test Post-test
Spearman's rho Pre - test Correlation
Coefficient
1.000 .648**
Sig. (2-tailed) . 0.000
N 35 35
Post-test Correlation
Coefficient
0.648** 1.000
Sig. (2-tailed) 0.000 .
N 35 35
**. Correlation is significant at the 0.01 level (2-tailed).

138
APPENDIX G
Grade 11A – Control Group Test Scores
Learner(n2) Pre-
Test(y2) % Pre-Test y2
2 Post-
Test(x2) % Post-
Test x22
1 14 46.67 196 18 60.00 324
2 8 26.67 64 7 23.33 49
3 11 36.67 121 10 33.33 100
4 6 20.00 36 11 36.67 121
5 7 23.33 49 9 30.00 81
6 8 26.67 64 8 26.67 64
7 12 40.00 144 10 33.33 100
8 8 26.67 64 13 43.33 169
9 4 13.33 16 16 53.33 256
10 10 33.33 100 15 50.00 225
11 7 23.33 49 13 43.33 169
12 12 40.00 144 16 53.33 256
13 16 53.33 256 18 60.00 324
14 9 30.00 81 15 50.00 225
15 7 23.33 49 16 53.33 256
16 10 33.33 100 13 43.33 169
17 8 26.67 64 9 30.00 81
18 7 23.33 49 15 50.00 225
19 6 20.00 36 11 36.67 121
20 9 30.00 81 10 33.33 100
21 6 20.00 36 8 26.67 64
22 9 30.00 81 16 53.33 256
23 14 46.67 196 17 56.67 289
24 6 20.00 36 13 43.33 169
25 8 26.67 64 14 46.67 196
26 13 43.33 169 20 66.67 400
27 4 13.33 16 9 30.00 81
28 1 3.33 1 9 30.00 81
29 8 26.67 64 6 20.00 36
30 11 36.67 121 13 43.33 169
31 10 33.33 100 17 56.67 289
32 9 30.00 81 16 53.33 256
33 8 26.67 64 12 40.00 144
34 8 26.67 64 9 30.00 81
35 5 16.67 25 7 23.33 49
Total 299 996.67 2881 439 1463.33 5975
Average 8.54 28.48 82.31 12.54 41.81 170.7

139
APPENDIX H
Grade 11C – Experimental Group Test Scores
Learner(n1) Pre-
Test(y1) % Pre-Test y1
2 Post-
Test(x1) % Post-
Test x12
1 11 36.67 121 21 70.00 441
2 11 36.67 121 20 66.67 400
3 11 36.67 121 17 56.67 289
4 2 6.67 4 13 43.33 169
5 12 40.00 144 16 53.33 256
6 9 30.00 81 21 70.00 441
7 7 23.33 49 13 43.33 169
8 9 30.00 81 24 80.00 576
9 12 40.00 144 18 60.00 324
10 6 20.00 36 14 46.67 196
11 4 13.33 16 12 40.00 144
12 6 20.00 36 23 76.67 529
13 6 20.00 36 10 33.33 100
14 9 30.00 81 11 36.67 121
15 7 23.33 49 13 43.33 169
16 7 23.33 49 18 60.00 324
17 6 20.00 36 11 36.67 121
18 11 36.67 121 20 66.67 400
19 7 23.33 49 23 76.67 529
20 11 36.67 121 23 76.67 529
21 9 30.00 81 17 56.67 289
22 10 33.33 100 15 50.00 225
23 10 33.33 100 13 43.33 169
24 9 30.00 81 12 40.00 144
25 9 30.00 81 13 43.33 169
26 12 40.00 144 17 56.67 289
27 4 13.33 16 17 56.67 289
28 7 23.33 49 8 26.67 64
29 7 23.33 49 24 80.00 576
30 7 23.33 49 12 40.00 144
Total 248 826.67 2246 489 1630.00 8585
Average 8.27 27.56 74.867 16.30 54.33 286.2

140
APPENDIX I Section B
Statements Codes Codes Total No. of respondents
Index of Agreement IA 1 2 3 4 5 1 2 3 4 5
No. of learners who responded
No. of teachers who responded
Leaners Teachers Leaners Teachers
1 55 18 5 14 9 2 101 2 -0.380 -0.8 2 1 2 14 40 43 1 1 100 2 0.488 0.6 3 6 17 12 31 34
1 1 100 2 0.280 0.6
4 5 5 26 44 17 2 97 2 0.260 0.8 5 1 2 13 40 43 1 1 99 2 0.493 0.6 6 1 4 5 30 61 2 101 2 0.578 0.8 7 0 4 4 37 56 2 101 2 0.574 0.8 8 1 6 12 57 25 1 1 101 2 0.392 0.6 9 6 12 35 36 12 2 101 2 0.143 0.4
10 0 2 11 54 34 2 101 2 0.475 0.8 11 5 1 19 41 34 1 1 100 2 0.392 0.6 12 2 1 7 42 49 1 1 101 2 0.535 0.6
Index of agreement for section B of learners’ and teachers’ questionnaire
Section C
Statements Codes Codes Total No. of respondents
Index of Agreement IA 1 2 3 4 5 1 2 3 4 5
No. of learners responding
No. of teachers responding
Leaners Teachers Leaners Teachers
1 43 27 28 2 1 1 1 101 2 -0.432 -0.600
2 5 11 62 21 2 1 1 101 2 0.016 -0.600
3 3 12 45 36 4 2 100 2 0.104 0.400
4 11 19 30 27 13 1 1 100 2 0.048 0.600
5 7 10 57 32 4 1 1 110 2 0.058 0.600
6 5 6 46 37 9 2 103 2 0.151 0.400
7 7 5 26 47 15 2 100 2 0.232 0.400
8 6 12 24 42 14 1 1 98 2 0.188 0.200
9 15 29 21 22 13 1 1 100 2 -0.044 -0.600
10 36 39 14 10 0 2 99 2 -0.408 -0.400
11 7 18 10 30 36 1 1 101 2 0.277 0.600
12 59 18 13 4 7 2 101 2 -0.467 -0.400
Index of agreement for section C of learners’ and teachers’ questionnaire

141
APPENDIX J

142
APPENDIX K

143
APPENDIX L
Letter to the Principal Dear Principal,
I am Kotoka Jonas Kwadzo, a full time teacher at Lihawu High School, and a Master’s student at
UNISA. As a requirement for the award of a Master of Science degree in Science, Mathematics
and Technology Education, I am investigating the impact of information and communication
technology (computer simulations) on the teaching and learning of electromagnetism in grade
11 Physics. I would like to humbly request your permission to use a computer simulation to
teach learners in Grade 11 Physics, administer a pre-test, post-test and questionnaires to collect
data from the Grade 11 Physical Science learners by the help of the class teacher(s).
There would be no interruption of your normal school programme, I would follow the normal
school timetable and the Physical Science teacher(s) would use the computer simulation to
teach electromagnetism in the computer lab while a control group will be taught using the
traditional (normal) teaching methods. After the intervention, I would collect data by learners
answering a post-test and a questionnaire. Teacher(s) on the other hand will only answer a
questionnaire. The data collected will be treated with confidentiality and the names of your
school, the teachers and the learners will not be used in the analysis of the data.
The teacher(s) may benefit from the research since they would be trained in the use of the
simulations. The learners would also benefit from the method of instruction as it is hoped that
this would enhance their understanding of the concepts.
Please do not hesitate to contact me if you have any further queries or clarifications. My
contact details are as follows:
Cell numbers: 0734639661 and 0728568824.
Email: [email protected] and [email protected]
I look forward to your anticipated positive response.
Thank you.
Yours faithfully,
( )
Kotoka Jonas Kwadzo.

144
APPENDIX M
Letter to the educator
Dear Educator,
I am Kotoka Jonas Kwadzo, a full time teacher at Lihawu High School, and a Master’s student at
UNISA. As a requirement for the award of a Master of Science degree in Science, Mathematics
and Technology Education, I am investigating the impact of information and communication
technology (computer simulations) on the teaching and learning of electromagnetism in grade
11 Physics. I would like to request you to be part of my study. The study will involve the use of
computer simulations to teach learners in Grade 11 Physical Science.
I would follow the normal school timetable and you will use the computer simulation to teach
electromagnetism in the computer lab while a control group will also be taught using the
traditional (normal) teaching methods. After the intervention, I would collect data from the
learners, by the learners answering a post-test and a questionnaire. You on the other hand will
only answer a questionnaire.
Participation in this research is voluntary and there will be no victimization whatsoever for
refusal to participate. There would be no interruption of your normal school programme. The
data collected will be treated with confidentiality and the names of your school, yourself and
learners will not be divulged. It is hoped that you may benefit from the research since you
would be trained in the use of the simulations. The learners would also benefit from the
method of instruction as it is hoped that this would enhance their understanding of the
concepts.
Please do not hesitate to contact me if you have any further queries or clarifications. My
contact details are as follows:
Email: [email protected]. Cell numbers: 0734639661 and 0728568824.
I look forward to your anticipated positive response.
Thank you.
Yours faithfully,
( )
Kotoka Jonas Kwadzo.

145
APPENDIX N
Letter to the parent
Dear parent,
I am Kotoka Jonas Kwadzo, a full time teacher at Lihawu High School, and a Master’s student at
UNISA. As a requirement for the award of a Master of Science degree in Science, Mathematics
and Technology Education, I am investigating the impact of information and communication
technology (computer simulations) on the teaching and learning of electromagnetism in grade
11 Physics. I will like to seek your consent for your child to be part of my study. The study will
involve the use of computer simulations to teach learners in Grade 11 Physics. I will collect data
by administering tests, questionnaires and do lesson observations.
Participation in this research is voluntary and there will be no negative consequences
whatsoever for refusal to participate.
There will be no interruption of your child’s normal school programme, the normal school
timetable shall be followed and your child will be taught with the use of computer simulation in
the computer laboratory. The data collected will be treated with confidentiality and the name
of your child will not be mentioned in the analysis of the data. That is, the name and identity of
your child will be protected in this study.
It is hoped that your child will benefit from the research since the simulation is to enhance the
learners’ understanding of Physics concepts.
Please do not hesitate to contact me if you have any further queries or clarifications. My
contact details are as follows:
Cell numbers: 0734639661 and 0728568824.
Email: [email protected]
I look forward to your anticipated positive response.
Thank you.
Yours faithfully,
( )
Kotoka Jonas Kwadzo.

146
APPENDIX O
Letter to The Provincial Education Office. Dear Sir/Madam,
I am Kotoka Jonas Kwadzo, a full time teacher at Lihawu High School, and a Master’s student at
UNISA. As a requirement for the award of a Master of Science degree in Science, Mathematics
and Technology Education, I am investigating the impact of information and communication
technology (computer simulations) on the teaching and learning of electromagnetism in grade
11 Physics. I would like to humbly request your permission to use a computer simulation to
teach learners in Grade 11 Physics, administer a pre-test, post-test and questionnaires to collect
data from the Grade 11 Physical Science learners with the help of the class teacher(s) in a
school in the province.
There would be no interruption of the normal school programme, I would follow the normal
school timetable and the Physical Science teacher(s) would use the computer simulation to
teach electromagnetism in the computer lab while a control group will be taught using the
traditional (normal) teaching methods. After the intervention, I will collect data by
administering tests, questionnaires and do lesson observations. The data collected will be
treated with confidentiality and the names of the school, the teachers and the learners will not
be used in the analysis of the data.
The teacher(s) may benefit from the research since they would be trained in the use of the
simulations. The learners would also benefit from the method of instruction as it is hoped that
this would enhance their understanding of the concepts.
Please do not hesitate to contact me if you have any further queries or clarifications. My
contact details are as follows:
Email: [email protected]. Cell numbers: 0734639661 and 0728568824.
I look forward to your anticipated positive response.
Thank you.
Yours faithfully,
( )
Kotoka Jonas Kwadzo.

147
APPENDIX P
Consent form for teachers to participate
I__________________________________ a teacher at
____________________________________ School hereby grants consent to Mr.
Kotoka Jonas Kwadzo to be part of his research. The data that will be collected
from me and my class should only be used for research purposes and conferences.
The data collected should be treated with confidentiality and the name of the participants
(teachers and learners) should not be mentioned in the analysis of the data. The participants
(teachers and learners) may withdraw from the study at any time.
Signature: ______________________________________ Date: ______________
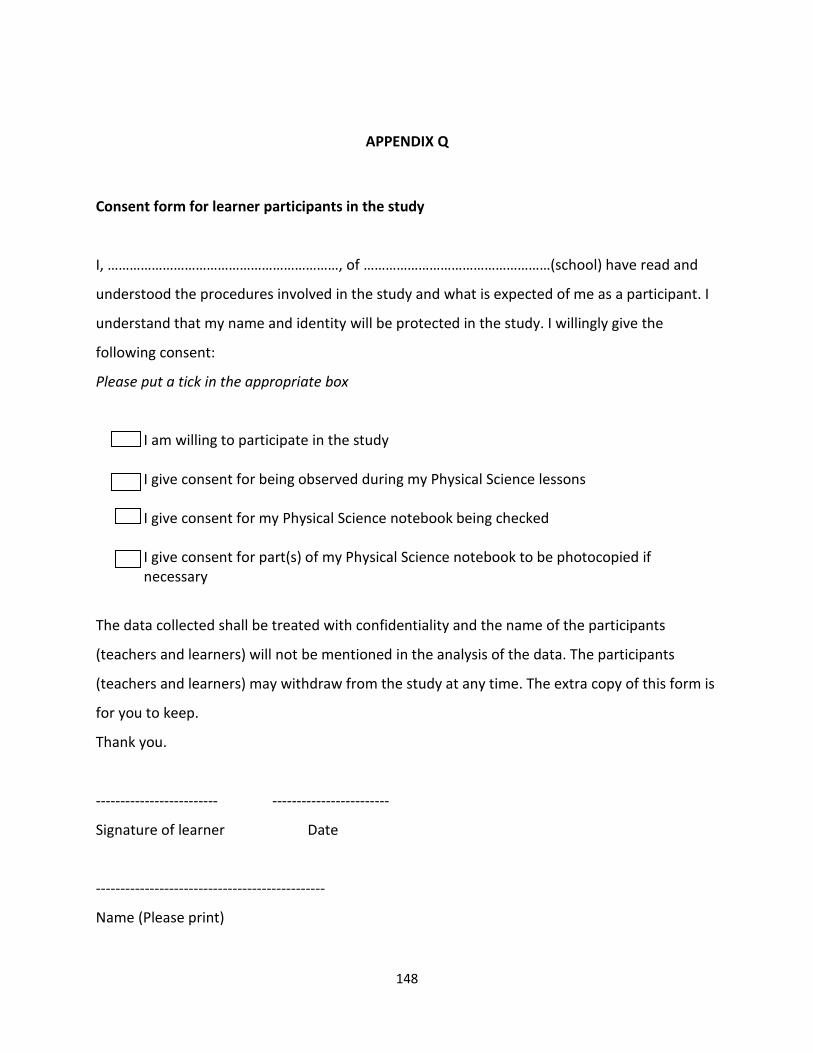
148
APPENDIX Q
Consent form for learner participants in the study
I, ………………………………………………………, of ……………………………………………(school) have read and
understood the procedures involved in the study and what is expected of me as a participant. I
understand that my name and identity will be protected in the study. I willingly give the
following consent:
Please put a tick in the appropriate box
I am willing to participate in the study I give consent for being observed during my Physical Science lessons
I give consent for my Physical Science notebook being checked
I give consent for part(s) of my Physical Science notebook to be photocopied if necessary
The data collected shall be treated with confidentiality and the name of the participants
(teachers and learners) will not be mentioned in the analysis of the data. The participants
(teachers and learners) may withdraw from the study at any time. The extra copy of this form is
for you to keep.
Thank you.
------------------------- ------------------------
Signature of learner Date
-----------------------------------------------
Name (Please print)

149
APPENDIX R
Consent form for parents
I __________________________________ the parent of
___________________________________ hereby grant consent to Kotoka Jonas Kwadzo to
allow my ward to be part of his research. The data that will be collected from my ward and
his/her class should only be used for research purposes and presentations at conferences. The
data collected should be treated with confidentiality and neither the name of the school, my
ward or the teacher should be mentioned in the analysis of the data. The participants (teachers
and learners) may withdraw from the study at any time.
Parents Signature: ______________________________ Date: ______________
Ward’s name _________________________ Ward’s Signature: __________Date: __________
Appendix S
Consent form for principal
I______________________________________ the principal of
_____________________________________ School, hereby grants consent to Mr.
Kotoka Jonas Kwadzo, to involve the Grade 11 learners and teacher(s) in his research.
The data collected should be treated with confidentiality and the name of the participants
(teachers and learners) should not be mentioned in the analysis of the data. The participants
(teachers and learners) may withdraw from the study at any time.
Signature: ___________________________________________ Date: ______________

150
Appendix T
GRADE 11C - JUNE EXAMS Learner Scores Learner Scores
1 20 28 55
2 30 29 58
3 48 30 64
4 55 31 41
5 30 32 30
6 31 33 45
7 38 34 70
8 55 35 30
9 55 36 32
10 57 37 31
11 56 38 31
12 59 39 33
13 33 40 56
14 34 41 30
15 60 42 30
16 32 43 40
17 40 44 32
18 48 45 51
19 36 46 30
20 40 47 68
21 38 48 30
22 34 49 52
23 52 50 21
24 35 51 65
25 30 52 38
26 32 53 58
27 33
TOTAL SCORES 2232

151
GRADE 11A - JUNE EXAMS Learner Scores Learner Scores
1 68 28 63
2 45 29 48
3 35 30 46
4 32 31 31
5 36 32 33
6 56 33 49
7 54 34 50
8 36 35 37
9 63 36 50
10 28 37 20
11 33 38 31
12 34 39 30
13 51 40 35
14 34 41 22
15 38 42 48
16 31 43 40
17 41 44 43
18 30 45 36
19 41 46 34
20 32 47 45
21 26 48 45
22 55 49 36
23 36 50 34
24 41 51 20
25 35 52 50
26 54 53 54
27 31 54 35
TOTAL SCORES 2161

152
APPENDIX U
DEFINITIONS OF SOME CONCEPTS IN ELECTROMAGNETISM
1. Magnet
A magnet is a material that produces a magnetic field. This magnetic field is invisible but is responsible
for the most notable property of a magnet.
2. Magnetic fields.
The region around a magnet, where magnetic force will be experienced by a magnetic substance.
3. Magnetic field lines around a long wire
The magnetic field lines around a long wire which carries an electric current form concentric circles
around the wire. The direction of the magnetic field is perpendicular to the wire and is in the direction
the fingers of your right hand would curl if you wrapped them around the wire with your thumb in the
direction of the current.
4. Right-hand grip rule
Right-hand grip rule is used to determine the direction of a magnetic field from the current direction in a
conducting wire. It says that if the right hand grips the wire so that the thumb points the same way as
the current, the fingers curls the same way as the field lines.
5. Solenoid
Solenoid refers to a long, thin loop of wire, often wrapped around a metallic core, which produces a
magnetic field when an electric current is passed through it.
6. Electromagnets
An electromagnet is made from a coil of wire that acts as a magnet when an electric current passes
through it but stops being a magnet when the current stops.

153
8. Force on current carrying conductor
When a conductor carrying a current is placed in a magnetic field, the conductor experiences a magnetic
force. The direction of this force is always right angles to the plane containing both the conductor and
the magnetic field, and is predicted by Fleming’s Left-Hand Rule.
9. Fleming’s left-hand rule
Fleming’s left-hand rule says that if you hold the thumb and the first two fingers of your left hand at
right angles, the thumb gives the direction of the force, the first finger shows the direction of the
magnetic field (which is taken from north to south) while the centre finger points in the direction of the
current (which is from the positive terminal to the negative terminal of the battery).
10. Electric motors and generators
An electric motor is an electromechanical device that converts electrical energy into mechanical energy.
Most electric motors operate through the interaction of magnetic fields and current-carrying conductors
to generate force. The reverse process, producing electrical energy from mechanical energy, is done by
generators such as an alternator or a dynamo.
11. Fleming's right hand rule
Fleming's right hand rule (for generators) tells us that if we have to know the direction of the motion of
the conductor and the direction of the magnetic field. We have our right hand out and the thumb and
first two fingers at right angles, each to the other. The thumb will point in the direction of the motion of
the conductor. The index finger will point in the direction of the magnetic lines of force. We have motion
of the conductor and the direction of the magnetic field. The middle finger will now point in the
direction of conventional current flow.
12. Transformers
A transformer is a device for increasing or decreasing an ac Voltage

154
13. Electromotive force, (emf)
In Physics, electromotive force, emf and measured in volts refers to voltage generated by a battery or
by the magnetic force according to Faraday’s Law, which states that a time varying magnetic field will
induce an electric current.
14. Faraday’s law of electromagnetic induction
Any change in the magnetic environment of a coil of wire will cause a voltage (emf) to be "induced" in
the coil. No matter how the change is produced, the voltage will be generated. The change could be
produced by changing the magnetic field strength, moving a magnet toward or away from the coil,
moving the coil into or out of the magnetic field, rotating the coil relative to the magnet.
15. Induced electromotive force (emf)
Emf is induced (produced) in a wire if there is a relative motion between the wire and a magnetic field.
Which can happen: If the wire/coil moves, if the magnet or electromagnet moves, if the electromagnet
is switched on or off or is alternating. The induced electromotive force (emf) in any closed circuit is
equal to the time rate of change of the magnetic flux through the circuit. OR The emf generated is
proportional to the rate of change of the magnetic flux.
The definitions of these concepts are taken from Cutnell & Johnson, (2005), Nelkon & Parker, (1984),
Abbott, (1982)

155
APPENDIX V
THE ELECTRIC BELL
The circuit diagram of the electric bell
How the electric bell works:
The bell system is a circuit consisting of an electromagnet, a switch, set to off, which the ringer
presses, a power source, a gong, a hammer (which forms part of a second switch), and electrical
contact point.
Once the ringer presses the switch the circuit is completed, and the electromagnet becomes
active and attracts the hammer.
The hammer moves towards the magnet, striking the gong, but as it does so the circuit is
broken (the hammer is part of the second switch completing the circuit), and the hammer falls
back.
Once it has fallen back into place, the circuit is completed and it moves forward, striking the
gong and breaking the circuit again, this cycle is repeated until the ringer releases the switch.