
Jonas Eklof Thesis The finale - Theseus
96
Förnamn Efternamn Evaluation of Recycling Polystyrene (PS) from a Microbiology Product Jonas Eklöf Degree Thesis Plastteknik 2014
-
Upload
khangminh22 -
Category
Documents
-
view
0 -
download
0
Transcript of Jonas Eklof Thesis The finale - Theseus

Förnamn Efternamn
Evaluation of Recycling Polystyrene (PS) from
a Microbiology Product
Jonas Eklöf
Degree Thesis
Plastteknik
2014

EXAMENSARBETE Arcada Utbildningsprogram: Plastteknik Identifikationsnummer: 4207 Författare: Arbetets namn: Evaluering av Återvunnet Polystyren (PS) ifrån en Mikro-
biologisk Produkt Handledare (Arcada): Mariann Holmberg Uppdragsgivare: Plastone Oy Sammandrag: Detta är ett beställningsarbete av Plastone Oy och i det undersöks möjligheterna vad man kan göra genom återvinning med avfallsmaterialet som uppstår då man tillverkar en mikrobiologisk produkt i deras plastfabrik. Produkten tillverkas genom formsprut-ning och materialet som används är polystyren (PS). Ur litteraturstudien fann man vari-erande möjligheter på hur man kan återvinna PS på bästa sätt, men ingen lösning som har varit effektiv i praktiken. Det framgick också att återvunnet PS inte är så vanligt, men det fanns inte tillräckligt med argument varför det inte skulle vara möjligt att åter-vinna. Därmed blev huvudmålet att undersöka och jämföra hur de mekaniska och visu-ella egenskaperna påverkas då man återvinner PS. Materialet återvanns totalt tre gånger genom att använda olika mängd av återvunnet material blandat med jungfruligt PS. Materialet återvanns genom användningen av en maskin som sönderdelar plastmateri-alet till flis, som sedan gick att återanvända. Test bitarna tillverkades genom formsprut-ning i form av hundben. Sammanlagt har 8 olika test material tillverkats. Samma bitar har använts i alla försök för att få ett mera jämförbart och noggrant resultat. De meka-niska egenskaperna som undersöktes var slag- dragprov. De optiska egenskaperna tran-smittans och färg analys undersöktes med UV-Vis spektroskopi. Materialets strukturella egenskaper undersöktes med mikroskop. Till sist gjordes expert intervjuer för att be-döma möjligheterna att återvinna materialet. Enligt resultaten har återvunnet PS mycket liknande egenskaper som jungfruligt PS. De mekaniska egenskaperna skiljde sig en aning då det var högre återvinnings grad men inte nämnvärt eller så pass mycket att det skulle förändra användning syftet. Lika så var det med de visuella egenskaperna. Ge-nom att återvinna PS kan man spara materialkostnader och effektivera avfallsprocessen betydligt. Nyckelord: Plastone Oy, Polystyren, Polystyren flis, återvinning Sidantal: 96 Språk: Engelska Datum för godkännande:

DEGREE THESIS Arcada Degree Programme: Plastteknik Identification number: 4207 Author: Jonas Eklöf Title: Evaluation of Recycling Polystyrene (PS) from a Microbi-
ology Product Supervisor (Arcada): Mariann Holmberg Commissioned by: Plastone Oy Abstract:
This thesis was commissioned by Plastone Oy and it investigates the possibility of what to do with the scrap material that comes from the production of the microbiology product in their plastic factory through recycling. The product is produced using injection mould-ing and the material used is polystyrene (PS). The literature that was reviewed found sev-eral possibilities of how to recycle PS in the best way but none that was efficient practi-cally. It also revealed that recycling PS is not so usual, but there were not enough argu-ments why it could not be possible. Therefore the main aims were to investigate and compare how the mechanical and visual properties affect when PS is recycled. The mate-rial was recycled three times with different amount of grades of recycled material and raw virgin PS material. In total 8 different materials were produced. The material was re-cycled with the use of a plastic shredder were the outcome were in form of PS flakes. The test pieces were produced trough injection moulding. All the same test pieces have been used during the testing in order to gain a more comparable and accurate test result. The mechanical properties have been investigated by impact test and tensile test. The optical transmittance and colour analyse have been investigated by UV-Vis spectroscopy. The structural property has been investigated by microscopy test. Finally expert interviews have been made for evaluation of the recycling possibilities of the material. According to the results recycled PS has very similar results as raw virgin PS. The mechanical proper-ties differ slightly when the grade and cycle of amount of recycled material were higher but not significant or that much that it would change the end use purpose. The visual properties were even more similar. By recycling PS material it can save material costs and improve the efficiency of waste process considerably. Keywords: Plastone Oy, Polystyrene, Polystyrene flakes, Recycle Number of pages: 96 Language: English Date of acceptance:

TABLE OF CONTENTS
1 introduction ...................................... ................................................................... 11
1.1 Aim and objectives ......................................................................................................... 12
1.2 Acknowledgements ........................................................................................................ 12
1.3 Company background .................................................................................................... 13
1.3.1 Bioscreen HC and clean room ................................................................................ 13
2 Literature review ................................. ................................................................ 15
2.1 Polystyrene (PS) ............................................................................................................ 15
2.1.1 Polystyrene background ......................................................................................... 16
2.1.2 Thermoplastics ........................................................................................................ 17
2.1.3 Morphology ............................................................................................................. 18
2.1.4 Chemical background ............................................................................................. 20
2.1.5 Polymerization......................................................................................................... 22
2.2 Mechanical properties .................................................................................................... 23
2.3 Spectrophotometry ......................................................................................................... 26
2.3.1 Opponent-colour theory .......................................................................................... 27
2.4 Processing and applications .......................................................................................... 29
2.5 Market and consumption ................................................................................................ 30
2.6 Recycling ........................................................................................................................ 33
2.6.1 Mechanical recycling ............................................................................................... 35
2.6.2 Chemical recycling .................................................................................................. 36
2.6.3 Energy recovery ...................................................................................................... 37
2.6.4 Expanded polystyrene ............................................................................................ 37
2.6.5 Microwave assisted pyrolysis (MAP) chemical recycle process ............................. 39
2.7 Machines ........................................................................................................................ 39
2.7.1 Plastic shredder ...................................................................................................... 39
2.7.2 Injection moulding machine .................................................................................... 40
2.7.3 Tensile testing machine .......................................................................................... 45
2.7.4 UV-VIS-NIR Spectroscopy ...................................................................................... 47
2.7.5 Zeiss Microscope – Optical microscopy ................................................................. 48
2.7.6 Charpy/Izod impact test .......................................................................................... 50
3 Method ............................................ ..................................................................... 53
3.1 Test specimen ................................................................................................................ 54
3.2 Injection moulding machine preparation and parameters .............................................. 55
3.3 Tensile test ..................................................................................................................... 56
3.4 Spectrophotometry – Transmission ............................................................................... 56

3.4.1 Calculations ............................................................................................................. 57
3.5 Microscope ..................................................................................................................... 58
3.6 Interviews ....................................................................................................................... 60
4 Results ........................................... ...................................................................... 60
4.1 Tensile test ..................................................................................................................... 61
4.2 Transmittance ................................................................................................................ 65
4.2.1 L*a*b colour analyse results ................................................................................... 71
4.3 Zeiss Microscopy ........................................................................................................... 72
4.4 Interview answers .......................................................................................................... 75
5 Discussion ........................................ ................................................................... 77
6 Conclusion ........................................ .................................................................. 80
6.1 What are the recycling possibilities for the Bioscreen HC product? .............................. 80
6.2 Was the new mechanical and optical properties successfully defined when the product
had been recycled? ................................................................................................................. 81
6.3 What are the benefits of polystyrene when recycling it?................................................ 83
7 Suggestions for future work ....................... ....................................................... 83
References ........................................ ........................................................................ 84
Appendix I/I (9) .................................. ........................................................................ 88
Appendix II/II (9) ................................ ........................................................................ 89
Appendix III/III (9) .............................. ........................................................................ 89
Appendix IV/IV (9) ................................ ..................................................................... 90
Appendix V/V (9) .................................. ..................................................................... 92

Figures
Figure 1 Honeycomb 2 C (Bioscreen 2012) ................................................................ 13
Figure 2 3D drawing of the plate (left) and the lid (right) (Courtesy of Plastone Oy
2013. Adjusted by Jonas Eklöf) ................................................................................... 14
Figure 3 Classification of amorphous and semi-crystalline polymers (DuPont 2013) .. 17
Figure 4 Illustration of an amorphous region and crystalline regions in a polymer
(Elsevier 2013) ........................................................................................................... 18
Figure 5 Chemical composition of polystyrene (University of Liverpool 2013) .......... 20
Figure 6 The different structures of polystyrene (University of Liverpool 2013) ......... 21
Figure 7 Chemical structure of polystyrene (Wikipedia 2013) .................................... 22
Figure 8 A typical stress-strain curve for brittle polymer materials (Wikipedia 2013.
Modified by Jonas Eklöf) ............................................................................................ 25
Figure 9 +60 to -60 colour scale (CIELAB 2013) ....................................................... 28
Figure 10 L*a*b and colour scale and their colour distinguish. Notice that the white is
on the Y-axis and the black is on the negative -Y axis (HunterLab 2012) .................... 29
Figure 11 Polystyrene (PS), Styrene-Butadiene (SB) and SB plate quality pricing from
year 2000 to 2008 (Muovifakta Oy 2008) .................................................................... 31
Figure 12 PS and SB application fields in Europe 2007 (Muovifakta Oy 2008) .......... 32
Figure 13 The after-life distribution of plastic use (PlasticEurope 2012) ..................... 33
Figure 14 The thermoplastics ID code when sorting the different grades of plastic
(Luke 2009) ................................................................................................................ 35
Figure 15 EPS manufacturing process. The PS has now become EPS beads that are
larger in size and contain some pentane (Lee 2010) ..................................................... 38
Figure 16 The plastic shredder (Arcada 2013 Jonas Eklöf) ......................................... 40
Figure 17 The main parts of the mould in the injection moulding machine (Strong
2006) .......................................................................................................................... 41
Figure 18 Illustration of total mould cycle and process of an injection moulding
machine (Strong 2006) ................................................................................................ 42
Figure 19 Illustration of an injection moulding machine showing the main sections and
parts (Strong 2006) ..................................................................................................... 43
Figure 20 Melting process (Strong 2006) ................................................................... 43
Figure 21 The injection process of the resin (Strong 2006) ......................................... 44

Figure 22 Screw go back to its starting position and part begins to cool (Strong 2006) 44
Figure 23 When cooling time is reached the mould is opened and part is removed
(Strong 2006) .............................................................................................................. 45
Figure 24 A Testometric tensile testing machine and software (Arcada 2013 Jonas
Eklöf) ......................................................................................................................... 46
Figure 25 UV-NIR/VIS set up workstation. Software for calibrating results (left) and
UV-NIR machine (right) (Arcada 2013 Jonas Eklöf) ................................................... 48
Figure 26 Drawings and measurements in mm of the Zeiss Axio Scope (Courtesy of
Carl Zeiss MicroImaging GmBH 2013) ...................................................................... 49
Figure 27 Overview of different functions of the Zeiss Axio Scope (Courtesy of Carl
Zeiss MicroImaging GmBH 2013) .............................................................................. 50
Figure 28 Charpy and Izod impact test showing the difference of the both methods
(Strong 2006) .............................................................................................................. 52
Figure 29 Cut out from the ASTM tentative method of test for tensile properties of
plastics (Mathew 2011) ............................................................................................... 54
Figure 30 Illustration how the transmission is measured from the material. In the
picture the sample appear to be a concentration, but the principle is the same for a solid
material (Gallik 2011) ................................................................................................. 58
Figure 31 Spot that was found on all test pieces (Arcada 2013 Jonas Eklöf) ............... 59
Figure 32 First result with non recycled PS UV-VIS spectrum ................................... 66
Figure 33 Second result with 100 percent recycled PS UV-VIS spectrum ................... 66
Figure 34 Third result with 15 percent recycled PS UV-VIS spectrum ....................... 67
Figure 35 Fourth result with 15 percent recycled PS two times UV-VIS spectrum ...... 67
Figure 36 Fifth result with 15 percent recycled PS three times UV-VIS spectrum ...... 68
Figure 37 Sixth result with 30 percent recycled PS UV-VIS spectrum ........................ 68
Figure 38 Seventh result with 30 percent recycled PS two times UV-VIS spectrum ... 69
Figure 39 Eight result with 30 percent recycled PS three times UV-VIS spectrum ...... 69
Figure 40 All results including the set up information from the UV-VIS machine UV-
VIS spectra ................................................................................................................. 70
Figure 41 3D scatter plots from the results of the colour analysis test ......................... 72
Figure 42 A picture taken with a normal 8MP lens camera. Notice the red indication
(Arcada 2013 Jonas Eklöf) .......................................................................................... 73
Figure 43 Closer look on the indicated spot with a 5x objective magnification (Arcada
2013 Jonas Eklöf) ....................................................................................................... 74
Figure 44 Same spot as the previous with a 5x objective magnification and more light
transmission (Arcada 2013 Jonas Eklöf) ..................................................................... 74
Figure 45 Same spot but with a 10x objective magnification (Arcada 2013 Jonas Eklöf)
................................................................................................................................... 75
Figure 46 Technical data sheet of GPPS STYRON 678E (Styron 2012) ..................... 88
Figure 49 Image recording with 5x magnification (Jonas Eklöf) ................................. 92
Figure 50 Same images as figure 49 but with other transmission parameters (Jonas
Eklöf) ......................................................................................................................... 92
Figure 51 Image 49 but with 10x magnification and more transmission intensity (Jonas
Eklöf) ......................................................................................................................... 93
Figure 52 Microscope image recording with 10x intensity (Jonas Eklöf) .................... 93
Figure 53 Microscope image recording with 10x transmission intensity (Jonas Eklöf) 94
Figure 54 Microscope image recording with 10x and high transmission intensity (Jonas
Eklöf) ......................................................................................................................... 94
Figure 55 Microscope image recording with 10x intensity (Jonas Eklöf) .................... 95
Figure 56 Microscopy image recording with 10x magnification (Jonas Eklöf) ............ 95
Figure 57 Microscope image recording with 10x magnification (Jonas Eklöf) ............ 96
Tables
Table 1 Common Characteristics of Polystyrene (Holst 2013) .................................... 15
Table 2 Common Properties of PS (Holst 2013) ......................................................... 16
Table 3 Common recognitions of qualities of amorphous and crystalline plastics
(Crawford 1998) ......................................................................................................... 19
Table 4 The colour scaling of the L*a*b scale (HunterLab 2012) ............................... 28
Table 5 Common applications for PS (Holst 213 & Lindberg 2013) ........................... 29
Table 6 PS and SB application field 2007 (Muovifakta Oy 2008) ............................... 32
Table 7 List of amount of tests made (Jonas Eklöf) ..................................................... 55
Table 8 Set up parameters for the injection moulding machine (Jonas Eklöf) .............. 55
Table 9 Parameter set for the tensile testing machine (Jonas Eklöf) ............................ 56
Table 10 Set up parameters for the UV-VIS spectroscopy .......................................... 57

Table 11 Tensile test results with 5 mm/min test speed ............................................... 61
Table 12 Stress at peak 5 mm/min .............................................................................. 62
Table 13 Nominal strain at break 5 mm/min ............................................................... 62
Table 15 Tensile test results 50 min/mm ..................................................................... 63
Table 16 Stress at peak 50 min/mm ............................................................................ 64
Table 17 Nominal strain at yield 50 min/mm .............................................................. 64
Table 18 Young's modulus 50 min/mm ...................................................................... 65
Table 19 L*a*b colour analysis results ....................................................................... 71
Table 20 Mechanical properties with test speed 5 mm/min and the difference in percent
compared from the first test......................................................................................... 81
Table 21 Mechanical properties with test speed 50 mm/min and the difference in
percent compared from the first test ............................................................................ 82
Table 22 L*a*b colour analysis result difference in percent compared with the first
result ........................................................................................................................... 82

FOREWORD
For this thesis I want to thank Mariann Holmberg for the support, guidance and faith in
me, John Ekholm for providing an interesting project, the lab staff for supervising and
set up of the different machines, especially Björn Wiberg for the help with the UV-Vis
spectroscopy and the microscope. I would also like to thank all my friends in school for
the interesting discussions and great company, especially Pontus Salminen for all the
help and support. And last but not least, a big thank you to Anna Tarkianinen and my
brother Stefan Eklöf for supporting and believing in me.

11
1 INTRODUCTION
Like all factories that manufacture something there is always thoughts of how to be
more profitable, save money and, something that recently is getting more important, to
be more environmentally friendly. To be more environmental friendly is to recycle. Re-
cycling is not only reducing material costs for a company it also reduces waste. Today’s
generation get to hear more about the environmental importance and how big companies
need to think more about the environment. It is a demanding task for a company to cut
down or reduce processing methods because of this, but the actions can also be a posi-
tive thing and ideas and suggestions of doing so are always welcome for a company that
needs to show their contribution to the environment.
Plastone Oy is a manufacturing company in Finland that is manufacturing thermoplastic
products from injection moulding machines. The company has specialized in manufac-
turing state of the art products for demanding use and applications in the medical indus-
try, electronic industry and among other fields as well.
One of the products that Plastone Oy manufactures for the medical industry is a micro
plate which goes under the product name “Bioscreen HC” (HC = Honeycomb). The
company gave some thoughts on what the possibilities would be to recycle the Bi-
oscreen HC product. Bioscreen HC is made of transparent polystyrene (PS) and is of top
quality. The product undergoes deep quality control and is manufactured in a clean
room environment. Since the product is so demanding there is no room for any defects
or errors. In most cases when a product is manufactured there are some leftover. From
the Bioscreen HC there is as well some left overs, which in this case is mostly the sprue
channels that comes along when the product is produced from the injection moulding
machine. Other waste material can be some contamination or some other error that the
product has received from the manufacturing process or the quality control department.
This thesis is about what are the changes in the mechanical and optical properties when
the Bioscreen HC product is recycled. As mentioned earlier the material that is used
when producing the Bioscreen HC is made out from polystyrene. When the product is
manufactured at Plastone Oy there is an amount of portion that goes to waste and is not

12
used. These parts have had no notable error or any other contamination whatsoever that
can be found by the naked eye. The student has collected the waste material and has
been using that for the research. Also, unused raw material of polystyrene has been used
for comparison of the difference in the two types.
1.1 Aim and objectives
The aims and objectives of this thesis are listed below:
• Determine what are the recycling possibilities for the Bioscreen HC product.
• Define the new mechanical and optical properties of the product if it has been
recycled.
• Determine what are the benefits of polystyrene when recycling it.
1.2 Acknowledgements
All the machines that have been used in the thesis have been located in Arcada’s plastic
lab and in the chemistry lab. A deeper explanation of the different machines and param-
eters will be explained in the literature review section and the method section.
As mentioned earlier the recycle method that has been used is a mechanical recycle
method. The student has been using a grinder to shred down the existing product into
small pieces that are similar to what new, raw and non-recycled plastic granulates are
shaped and formed like.
An injection-moulding machine has been used to produce test pieces. A tensile testing
machine has been used to find the mechanical properties of the material. The material is
also analysed optically to find possible contamination of the transparency in the material
using a UV-NIR machine and a Zeiss Microscope for optical analyzing. The same test
pieces have been used in all mentioned testing machines for a comparable test result.

13
1.3 Company background
Plastone Oy is a subsidiary company of Mekalasi Oy, which is a sales and marketing
health care supplier. Mekalasi Oy was founded in 1952 in Finland. Since then the com-
pany has been working together with Plastone Oy. Plastone Oy is a supplier and provid-
er of plastic parts for Mekalasi Oy. Examples of these products are disposable laborato-
ry- and health care accessories. Both Mekalasi Oy and Plastone Oy still remain their
roots in Finland. In 2011 Mekalasi Oy and Plastone Oy employed around 100 people
and is located in Finland in Nurmijärvi and its turnover was around 18 million euros.
Plastone Oy in Nurmijärvi consists of several departments. The company has a produc-
tion plant, which has over 20 injection-moulding machines and microinjection moulding
machines, which can produce big to small plastic parts. There are also machines, which
produce silicone parts, which is a very meticulous process and demanding product that
Plastone Oy offers. Plastone Oy also has a moulding and tooling department for mainte-
nance, making new moulds and new products. Today Plastone Oy also has established a
factory in Estonia, which is concentrating on electrical equipment and solutions.
(Mekalasi Oy AB 2012)
1.3.1 Bioscreen HC and clean room
Figure 1 Honeycomb 2 C (Bioscreen 2012)
Figure 1 is a picture of the product Bioscreen HC. The first Bioscreen HC baby was
created in 1980s that was developed from the company called Labsystems Oy, which is
now called Growth Curves Ltd. It has been working very well since then and has re-

14
ceived positive feedback from researcher all around the world. After a couple of dec-
ades on the market the product is now mostly used as a tool for automating routine mi-
crobiology growth experiments. Because of the good material properties the product can
be used for high temperature control. (Bioscreen 2013)
The product consists of two parts, the plate and the lid. The plate consists of 10x10
wells that make it looks like a “honeycomb” which is suitable for the chosen name of
the product. Figure 2 below is a 3D drawing of the two parts of the product, the plate
and the lid.
Figure 2 3D drawing of the plate (left) and the lid (right) (Courtesy of Plastone Oy 2013. Adjusted by Jonas Eklöf)
As mentioned earlier Bioscreen is made out of Polystyrene (PS) and is manufactured
with an injection−moulding machine. When the product is produced it is then sterilized
by radiation with gamma rays to take out any possible contamination.
The Bioscreen HC is manufactured in a clean room environment. Instead of the word
“clean room” the word “aseptic” could also be used, but is more used for more chemi-
cally or more medically production plants. The word aseptic means that it is “free from
contamination caused by harmful bacteria, viruses or other microorganisms” This
means that the product is manufactured in a controlled environment to protect it from
any unnecessary contamination. In a manufacturing factory a clean room is often an en-
closed space in the factory. People that are in a clean room area like the factory workers

15
and guests must wear full protection clothing such as gloves, overalls, shoe protection
and hair net protection. According to ISO 14644-1 a clean room is “A room which the
concentration of airborne particles is controlled, and which is constructed and used in
a manner to minimize the introduction, generation, and retention of particles & mi-
crobes inside the room and in which other relevant parameters, e.g. temperature, hu-
midity and pressure, are controlled as necessary.” (CERHB 2003)
2 LITERATURE REVIEW
This chapter covers the main characters of PS, the properties, market and consumption,
possible recycling methods and finally, a description of the different machines that was
used for the test is also found.
2.1 Polystyrene (PS)
Polystyrene has advantages and some disadvantages that are worth taking into consider-
ation when working with it. Depending on what application it is used for it is beneficial
to know its main characteristics that can be both good and bad. PS is mostly used be-
cause of its transparency and hardness. The material is easy to process since it has low
water absorption and therefore very seldom needs pre drying before processing it. The
price is also low comparing with other plastics with the same characteristics. Drawbacks
of the material are that it burns easily, it is brittle and when exposed outside it gets de-
graded and a yellow colour. Other common characteristics of PS are shown in table 1.
Table 1 Common Characteristics of Polystyrene (Holst 2013)
Advantage Disadvantage
� Very stiff and hard � Burns easily
� Good Electrical insulation
properties
� Poor temperature resistance
� Low Mould shrinkage � Get yellowish more fragile when out-
side (because of UV radiation)
� Low water absorption 0,05%
� Low Price
� Low resistance against oil and solvents
� Easy to work with
� Unlimited staining opportuni-
ties
� Brittle

16
Table 2 below shows the common properties of PS. One the most common property that
PS has is the transmissivity. The transmissivity or transparency is almost the same as
glass. The common colour and surface is often clear and transparent. The lack of polari-
ty in the molecule results in low water absorption, as mentioned earlier. Because of the
brittleness the material has a quite low bending strength and tensile strength. (Lindberg
2013: 71)
Table 2 Common Properties of PS (Holst 2013)
Density 1,05 g/cm3
Transparency Light transmissivity 87-92%
Tg 100 (70-115) °C
Colour/surface Glass clear Transparent
Young's Modulus 3000-3500 MPa
Tensile Strength 700-800 MPa
Fatigue 20 MPa
Bending Strength 50-100 MPa
Impact Strength 5 J/cm
Water absorption (at
50% hum.) 0.1 %
2.1.1 Polystyrene background
The first chemical recognition of PS can be characterized by the styrene monomer in
polystyrene. The structure has a carbon−carbon double bond to which a benzene ring is
attached. The benzene ring is also called an aromatic ring. The aromatic ring reduces the
ability of the polymer chain to bend and interferes substantially with other parts of the
molecule. Because of this the PS prevent the formation of any crystalline regions and
therefore PS is usually considered to be fully amorphous. The aromatic benzene rings
also increase the tensile strength. Light passes through the structure without significant
refraction because of the high properties of amorphous that PS has and makes it trans-
parent and clear, which will be explained more in the opacity section. The aging of PS is
quite short. PS tends to get yellowish with exposure to UV light and oxygen. The mate-
rial is also subject to environmental stress cracking. PS is therefore appropriate for ap-
plications for short duration and not for long-term use. (Strong 2006:247−250)
17
The strength of PS is strongly determined by the molecular weight. Normal uses of PS
do not usually depend upon high strength, and so the molecular weight is often kept at
moderate levels to facilitate easy processing. PS has a wide range between the softening
point and decomposition point, which makes it easy to process (~90°C to 250°C).
(Strong 2006:247 ff.)
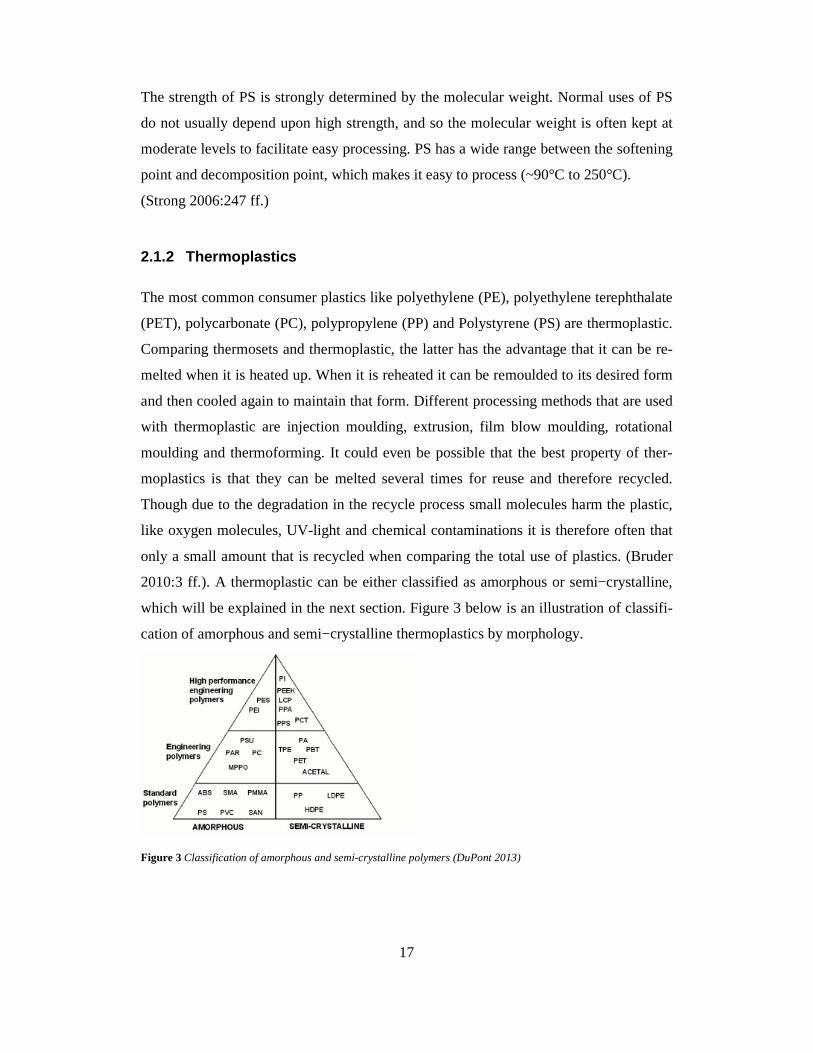
2.1.2 Thermoplastics
The most common consumer plastics like polyethylene (PE), polyethylene terephthalate
(PET), polycarbonate (PC), polypropylene (PP) and Polystyrene (PS) are thermoplastic.
Comparing thermosets and thermoplastic, the latter has the advantage that it can be re-
melted when it is heated up. When it is reheated it can be remoulded to its desired form
and then cooled again to maintain that form. Different processing methods that are used
with thermoplastic are injection moulding, extrusion, film blow moulding, rotational
moulding and thermoforming. It could even be possible that the best property of ther-
moplastics is that they can be melted several times for reuse and therefore recycled.
Though due to the degradation in the recycle process small molecules harm the plastic,
like oxygen molecules, UV-light and chemical contaminations it is therefore often that
only a small amount that is recycled when comparing the total use of plastics. (Bruder
2010:3 ff.). A thermoplastic can be either classified as amorphous or semi−crystalline,
which will be explained in the next section. Figure 3 below is an illustration of classifi-
cation of amorphous and semi−crystalline thermoplastics by morphology.
Figure 3 Classification of amorphous and semi-crystalline polymers (DuPont 2013)
18
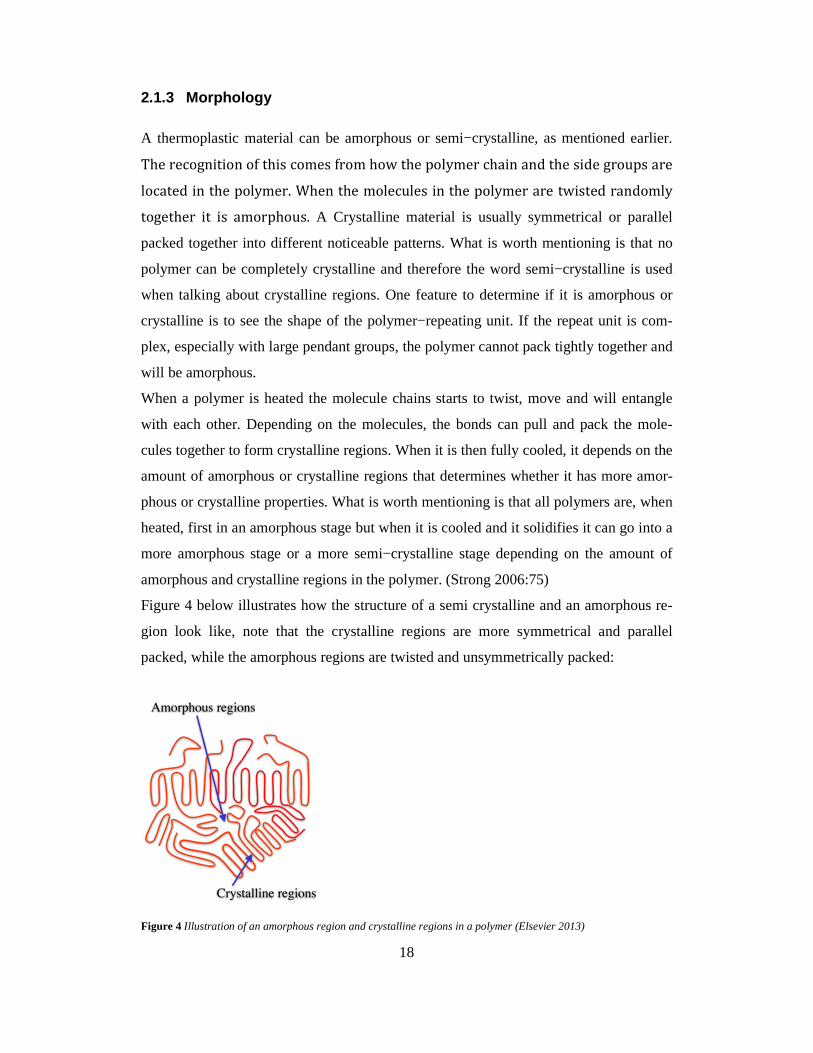
2.1.3 Morphology
A thermoplastic material can be amorphous or semi−crystalline, as mentioned earlier.
The recognition of this comes from how the polymer chain and the side groups are
located in the polymer. When the molecules in the polymer are twisted randomly
together it is amorphous. A Crystalline material is usually symmetrical or parallel
packed together into different noticeable patterns. What is worth mentioning is that no
polymer can be completely crystalline and therefore the word semi−crystalline is used
when talking about crystalline regions. One feature to determine if it is amorphous or
crystalline is to see the shape of the polymer−repeating unit. If the repeat unit is com-
plex, especially with large pendant groups, the polymer cannot pack tightly together and
will be amorphous.
When a polymer is heated the molecule chains starts to twist, move and will entangle
with each other. Depending on the molecules, the bonds can pull and pack the mole-
cules together to form crystalline regions. When it is then fully cooled, it depends on the
amount of amorphous or crystalline regions that determines whether it has more amor-
phous or crystalline properties. What is worth mentioning is that all polymers are, when
heated, first in an amorphous stage but when it is cooled and it solidifies it can go into a
more amorphous stage or a more semi−crystalline stage depending on the amount of
amorphous and crystalline regions in the polymer. (Strong 2006:75)
Figure 4 below illustrates how the structure of a semi crystalline and an amorphous re-
gion look like, note that the crystalline regions are more symmetrical and parallel
packed, while the amorphous regions are twisted and unsymmetrically packed:
Figure 4 Illustration of an amorphous region and crystalline regions in a polymer (Elsevier 2013)

19
A rule of thumb to determine whether a plastic material is amorphous or crystalline, can
be that glass is amorphous (clear and transparent) and metals are crystalline (opaque or
translucent). (Crawford 1998:4 f.)
Table 3 below characterizes the essential recognition of qualities of amorphous and
crystalline plastics.
Table 3 Common recognitions of qualities of amorphous and crystalline plastics (Crawford 1998)
Amorphous Crystalline
� Often transparent
� Sharp melting point when the struc-
ture is closely packed result that the
secondary bonds are broken at the
same time
� Low shrinkage because the random
arrangement of molecules produces
little volume change
� Usually opaque depending on the
amount of crystalline regions but can
also be translucent
� Low chemical resistant because again
of the random arrangement of mole-
cules are more open and enables
chemicals to penetrate deep into the
material and destroy many of the sec-
ondary bonds
� High shrinkage because when it solidi-
fies the molecules in the polymer are
closely packed to a high aligned struc-
ture
� Poor fatigue and wear resistance be-
cause of the random structure
� High chemical resistance because of
the tightly packed structure prevents
chemicals to strike deep into the ma-
terial
� Good fatigue and wear resistance be-
cause of the uniform structure
Amorphous polymers are often transparent and polystyrene is about 88% transparent,
which is quite high comparing with glass that has about the similar transparency. Amor-
phous materials have no melting temperature, so it is defined in Tg (glass transition
temperature) when the molecule chains start to move. Semi crystalline polymers can
stand generally an increase in temperature better than amorphous polymers. Because of
this, semi−crystalline materials tend to have a better fatigue strength and chemical re-
sistance. Semi−crystalline polymers are not as brittle as amorphous materials and there-
fore do not crack so easily. This means that semi crystalline has a higher flexural
strength than the amorphous polymers. Amorphous polymers also have a lower shrink-
age than semi−crystalline materials. (Bruder 20010:3 ff.)

20
The glass transition temperature, or Tg, is around 90°C for amorphous materials and al-
so for PS. The specific volume is increasing linearly before and, even in some cases,
after the Tg. For semi−crystalline the Tg is around 170°C. In amorphous polymers, the
change in flexibility is quite dramatic because the amorphous regions have considerable
more space and relatively unrestricted molecules that can participate in these long-range
movements. Amorphous polymers might become leathery or rubbery above Tg. Highly
semi−crystalline polymers exhibit much less change through the glass transition tem-
perature, Tg, because the crystalline structure restricts the polymers and limits the long-
range movements to only small actions due to the high increase in Tg for semi crystal-
line materials, indicates why it has higher shrinkage. (Strong 2006:73)
Due to the linear increase of the amorphous material, the energy consumption is consid-
erably lower than semi crystalline polymers and constant above Tg. That is why it can
be more challenging for a plastic machine operator to find the right parameters when
using semi−crystalline material because they are the opposite. (Bruder 20010: 7 ff.)
2.1.4 Chemical background
Polystyrene is made from the monomer styrene. It consists of an aromatic ring that is
attached with a vinyl group. The styrene monomer reacts with other styrene monomers
(with each other) during the initiation process to become polystyrene. During the initia-
tion process the vinyl group loses its double bond and therefore it is in the vinyl group
that the polymerization takes place, which is illustrated in figure 5 below.
Figure 5 Chemical composition of polystyrene (University of Liverpool 2013)

21
Polystyrene is normally atactic, which means is has a randomly irregular structure, in
this case for polystyrene it is the benzene rings, which are randomly placed in the poly-
mer structure. (Bruder 2006: 11 ff.) There is isotactic (all have same repeating structural
elements) and sydotactic (in which the repeating units have alternating stereo chemical
configurations.) polystyrene, but the atactic polystyrene is mostly used. (Edshammar
2002: 95). Figure 6 show how the three types distinguish from each other. Figure 7 is
the chemical structure of PS.
Figure 6 The different structures of polystyrene (University of Liverpool 2013)

22
Figure 7 Chemical structure of polystyrene (Wikipedia 2013)
2.1.5 Polymerization
The common polymerization process of polystyrene is chain growth polymerization.
Another name for the polymerization process is also called addition polymerization, as
mentioned earlier. Addition polymerization comes from when free radicals are created
in which bonds with a monomer and then creates a new free radical, which can bond
with another monomer. This continues as long as there are monomers to react with. The
process, containing of many steps, is not easy to explain and therefore will be briefly
explained of the main steps.
In the addition polymerization process for polystyrene the vinyl groups, in which the
carbon-carbon double bond is, reacts with similar groups in another styrene monomer
group in a reaction vessel. The reaction occurs under very high temperature conditions.
An Initiator is then used to mix the both monomers together to start the polymerization
process. The most common initiator that is used is a peroxide compound and is also
used for polystyrene. The peroxide easily forms radicals. Radicals means that a mole-
cule which contain of unpaired electron, a radical, look for something to pair with and
then start the reaction. Initiators can also be called catalysts. However, there is an argu-
ment that the name catalysts cannot be used in the same way. According to New Oxford
American Dictionary the word ”Catalyst” means “A substance that increases the rate of

23
a chemical reaction without itself undergoing any permanent chemical change.” In this
case the catalyst are not heated, they are used up and used as reactants in the polymeri-
zation process. (Strong 2006: 51 f.)
During the initiation step there are electrons that are ready to be used with the free radi-
cals and the bonding begins. The chain can continue to grow when free radicals are cre-
ated and bonded with a new monomer and then creates a new free radical as long as
there are monomers to interact with. For simplification, a repeating unit replaces the
long chain, by the unit that is added to the chain in each step, which is the monomer.
The polymer is recognized by the monomer, in this case the styrene, which is often how
the polymer is chemically recognized. (Strong: 2006: 53 f.)
2.2 Mechanical properties
Tensile strength
Tensile strength is most common mechanical property to test when it comes to investi-
gate the mechanical properties of a material. There are two important mechanical prop-
erties, Tensile Stress and yield stress. (Strong 2006:121) Tensile Stress at Yield or Yield
Stress is the first stress at which an increase in strain occurs without an increase in
stress. It is expressed commonly in megapascals (MPa). Tensile Strain at break is when
the test specimen breaks. It is measured in percentage (%). (ISO 527-1 1993:2). A stress
vs. strain graph displays the relation between stress and strain (ISO 527-1 1993: 8).
Tensile Stress or Tensile Strength
There are other mechanical properties as well. (Strong 2006:122) As mentioned earlier
stress-strain determines the force it is required to pull in order to deform and, if possi-
ble, eventually break a material. When this happens it is named to be at stress. There is
another stress that needs to be mentioned, called “Engineering stress”, that also can be
obtained using the same method but it will not be used in this research and therefore not
be going into that. Stress is measured in N/m2 and defined in Pascal and often uses the
greater value Mega Pascal (MPa). Stress is the applied force over the cross sectional
area as shown on the formula 1 below. (Brown 2002:97)

24
[1]
σ = Stress or tensile strength, measured in N/mm2 [MPa]
F = Force, measured in Newton [N]
A = Area, cross sectional area of the piece measured in [mm2]
(Brown 2002: 97)
Strain
Strain is a dimensionless value and therefore can have many different expressions. A
percentage value is often used to determine the strain and is calculated of how much a
designated deformation differs locally from a rigid body deformation (Wikipedia 2013:
Deformation (Mechanics)). The strain is defined from formula 2 below. Notice how the
units cancel each other out.
[2]
(Brown 2002: 98)
To convert the result into percentage is simply done by multiplying by 100 shown in
formula 3.
[3]
A
F=σ
[mm] llength Original
[mm] LExtension
oStrain
δ=
100[mm] llength Original
[mm] LExtension [%]Strain ×=
o
δ

25
(Brown 2002: 98)
Figure 8 below is a typical stress-strain curve for brittle plastic materials. Ductile plas-
tics have the same approach but do not rupture, instead they will continue to stretch and
the curve will keep rising and reach a maximum point (where the ultimate strength is
then measured) and eventually decrease until it reaches a fracture point. (Brown
2002:99)
Figure 8 A typical stress-strain curve for brittle polymer materials (Wikipedia 2013. Modified by Jonas Eklöf)
Modulus of Elasticity in Tension
The modulus of elasticity, or Young’s modulus, is a very common value that is used
much in with plastics properties. Young’s modulus determines how stiff a material is.
The modulus is constantly changing due to the amount of grades in a plastic. Young’s
modulus depends on a variety of properties such as Density, tensile strength, flexural
modulus and elongation at break. Young’s modulus can be used either in tension or in
compression. (Crawford 1998: 21-22)

26
2.3 Spectrophotometry
Spectrophotometry is the definition of finding the optical properties of a material. Stud-
ying the optical properties or finding the opacity of the polymer is a deep morphology
of looking deep into the depths of a polymer. Opacity is a study to understand the opti-
cal properties how a polymer interacts when it comes to contact with light. There are
different types of which the light interacts with the plastic. These are absorption, trans-
mission and reflection. Also the colour of the plastic has an influence on the optical
properties and will be explained in the next section. Transmission will be mainly fo-
cused here. (Strong 2006:176 f.)
The transparency of a material depends on the crystallinity of the polymer. The crystal-
line regions in the polymer are larger than the wavelengths of visible light (between
400−700 nm), the light that you are able to see through something. Semi−crystalline
polymers are therefore opaque or translucent. There are mixed materials have either
transparent or translucent characteristics. HIPS is one material that you might think be
transparent, but because of more crystalline regions that appears due to the mixing with
the butadiene rubber, it can be either transparent or translucent depending on the size of
the wavelength or the amount of the crystalline regions. (Osswald et al. 2003:553)
Transmission or light transmission is defined how well light will be passed through a
plastic material. Another definition of transmission is transmittance, which means ac-
cording to New Oxford American Dictionary 2010, “The ratio of the light energy falling
on a body to that transmitted through it” is amount of light that passes through the plas-
tic material.
A plastic is usually transparent when light passes straight through the material and the
light beam is not usually changed. When a plastic material does not allow light to pass
through it is named to be opaque. There is also some plastic that is somewhat a little
transparent but also opaque that when looking through the material it might be blurry or
dense. These plastics are named to be translucent. They allow light to partly pass
through and may only show some contours or shadows. What is worth mentioning is
that a plastic material can never be fully transparent. There is always some light that is
absorbed. When light passes through an amount is absorbed in to the material, which
causes minor heating. Some plastics have higher protection against light transmission. A
harmful light that can cause degradation of a plastic is the ultraviolet light. Depending

27
on the properties of the plastic the material may get yellowish when exposed to a high-
energy ultraviolet light. In many cases of the yellowish colour is caused by a preferen-
tial absorption of blue light (Strong 2006:177)
There is a way to know how much light that may pass through a plastic material or to
know how high the transmission is of a plastic material. It can be compared with how
much light passes through clean air or a vacuum in the same environment. By using
standard ASTM D1003 you can investigate the light transmittance. The transmittance
values are measured in percentage and the name for the commonly transmittance is lu-
minous transmittance. The luminous transmittance is defined as the ratio of transmitted
light to the incident light. (Strong 2006:178)
Since PS is amorphous it is transparent because it consists of less crystalline regions.
Because of the lack of crystalline regions the light can pass through without any reduc-
tions. Plastics with more crystals in the polymer, or polymers that are semi−crystalline
are more translucent. As mentioned earlier is that amorphous materials are often trans-
parent while semi−crystalline materials are more translucent. What is still worth men-
tioning is that semi−crystalline material can still be transparent depending on the crystal
size of the polymer. If the crystals are smaller than the wavelength of the visible light
that surpasses the material it is not reducing and therefore no light is reduced. One of
these plastics is polyethylene terephthalate, PET. (Strong 2006: 178)
As mentioned earlier the colour is also important when it comes to measuring the inten-
sity of the transmission (Osswald et al 2003:560). In the process of processing a materi-
al, especially when recycling a material, some unexpected additives may affect the col-
our of the plastic. These types of colours are called colorants. Colorants can affect how
the light is absorbed into the material. Depending on the colorant it also affects the
transmission (Strong 2006:178).
2.3.1 Opponent-colour theory
The opponent- colour theory, or opponent process, is a theory that explains how the
human eye perceives colour. There are three main opponent colours; red vs. green, blue
vs. yellow and black vs. white. From with this scale all the colours in between, like vio-
let, brown and orange, can be found and measured. As mentioned this theory explains

28
much how the different sections in the human eye perceives and process colour and is
therefore not relevant in this thesis to go in further, but in order to understand the L*a*b
colour analyse in the transmittance spectra it is good to know what the foundation of the
theory comes from (Wikipedia 2014: Opponent process).
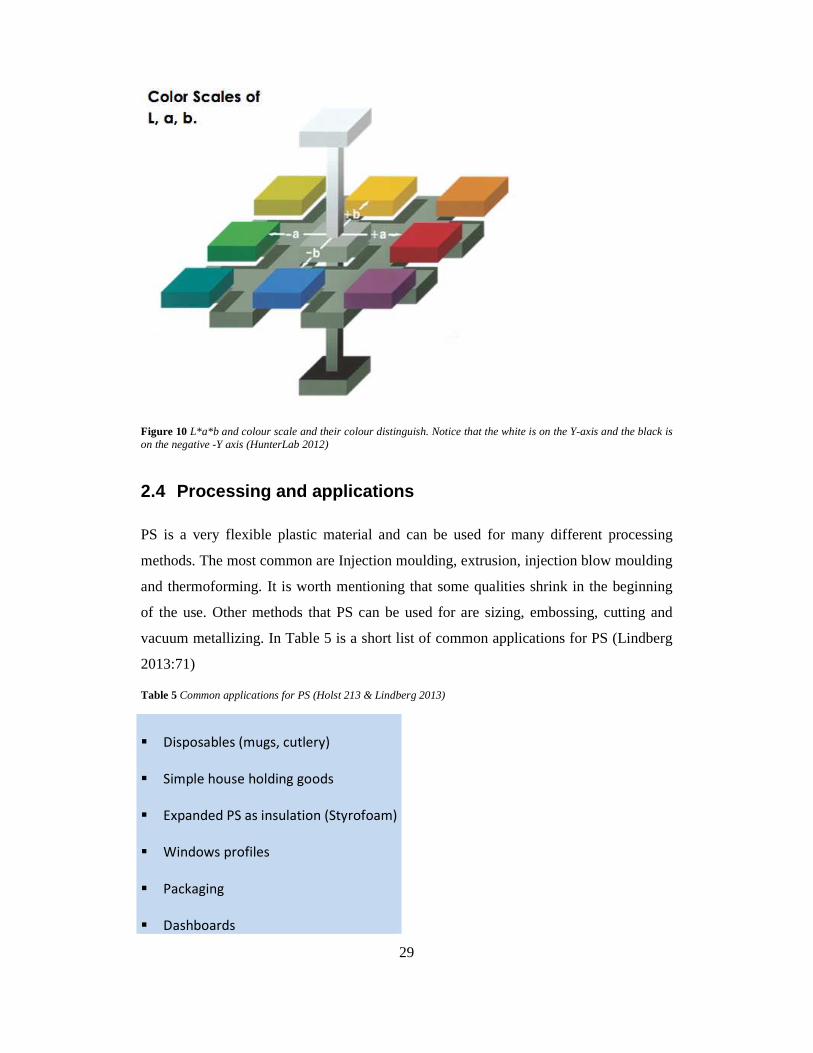
The L*a*b colour analyse are scaled according to the opponent- colour Theory. The
scales can be seen as a Cartesian x, y, and z coordinate system. Table 4 below shows
how the colours are split. (HunterLab 2012)
Table 4 The colour scaling of the L*a*b scale (HunterLab 2012)
Scale Colour Percent
L Light vs. dark 0-50 (white) 51-100 (black)
a Red vs. Green Positive (red) Negative (green)
b Yellow vs. Blue Positive (yellow) Negative (blue)
Figure 9 is a CIELAB colour chart illustration of scale +60 to -60 and figure 10 shows
how the colours are distinguished with their corresponding and the contrast colour.
Figure 9 +60 to -60 colour scale (CIELAB 2013)
29
Figure 10 L*a*b and colour scale and their colour distinguish. Notice that the white is on the Y-axis and the black is on the negative -Y axis (HunterLab 2012)
2.4 Processing and applications
PS is a very flexible plastic material and can be used for many different processing
methods. The most common are Injection moulding, extrusion, injection blow moulding
and thermoforming. It is worth mentioning that some qualities shrink in the beginning
of the use. Other methods that PS can be used for are sizing, embossing, cutting and
vacuum metallizing. In Table 5 is a short list of common applications for PS (Lindberg
2013:71)
Table 5 Common applications for PS (Holst 213 & Lindberg 2013)
� Disposables (mugs, cutlery)
� Simple house holding goods
� Expanded PS as insulation (Styrofoam)
� Windows profiles
� Packaging
� Dashboards

30
� Isolation, Capacitors
� Pipes
2.5 Market and consumption
It was hard to find what the current application fields and pricing for PS are. Instead an
interesting lifespan from the current decade were found that is shown in figure 10.
When studying the market value of PS during year 2000 to 2008 it has notably been un-
der some changes. Since raw plastic material is not so expensive, comparing with other
materials with similar properties and application use, more customers have been starting
to take this advantage. Because of this the material has increased its value. The unit
price in euros per kilograms year 2000 was about 0,90 e/kg. By the end of the decade
the unit price almost doubled and increased to roughly 1,40 e/kg (Muovifakta Oy
2008:75).

31
Figure 11 Polystyrene (PS), Styrene-Butadiene (SB) and SB plate quality pricing from year 2000 to 2008 (Muovifak-ta Oy 2008)
Figure 11 illustrates the different application fields for PS. In year 2007 approximately
2,4 tonnes of PS and SB where produced in Europe. The largest market for PS is still in
the packaging sector. Other field PS is also used in is for refrigerator panels, household
goods, machines and equipment. XPS panels or extruded polystyrene foam is a material
used much in the construction and packaging industry to produce EPS, expanded poly-
styrene material. (Muovifakta Oy 2008:74)

32
Figure 12 PS and SB application fields in Europe 2007 (Muovifakta Oy 2008)
Table 6 below is a clarification of the information from figure 11. The amount is pre-
sented in percent from the total amount of 2,4 tonnes of PS used in year 2007.
Table 6 PS and SB application field 2007 (Muovifakta Oy 2008)
42%
12%8%
6%
5%
27%
PS and SB application uses in Europe 2007
Packaging
XPS-foam
Machines and Equipment
Householding
Refigerator panels
Other

33
2.6 Recycling
Plastics today are almost similarly consumed in all sorts like paper. Even though plas-
tics do not have similar properties like paper, both materials are still used much all over
the world and are used for disposable application, which means that once it has been
used it is thrown away. The big consequence, especially for plastics, is that once the
plastic has been used it leads to an environmentally concern of how to dispose it proper-
ly. EU has tried to confront the problem by legislation for plastic materials to recycle
the material as much as possible. The mandate goal is to completely recycle all the plas-
tic materials so there are zero landfills and pollutions (Strong 2006:826). In Europe re-
cycling is still the minority when it comes to the after-life of the plastic as shown in fig-
ure 3. Most material is still left as landfill disposal. Even though the percent seems
small, Europe is still the leading country when it comes to recycling and development of
a sustainable environment. (PlasticEurope 2012)
Figure 13 The after-life distribution of plastic use (PlasticEurope 2012)

34
Before considering if PS should be recycled it has to be sorted out among all other
mixed plastics and materials. All day-to-day thermoplastics are sorted out by the grade
of the plastic. This does not mean that they are used for recycling, only sorted out. Once
the plastics are sorted out the materials are packed, also called that they are baled. Once
they are baled they can then be sold to companies that have interest in using bales of
recycled materials. If there are no interests, the bales are then profitless, marked as
waste and not used. (Vernon 2011)
Companies perhaps have their own method of how to collect their own bale and reuse
their material, but for a plastic like PS that is not so expensive; the material is often
thrown away as waste and not reused. Because of this PS has not gained any popularity
and do not yet lead to any interest for establishing a valuable product for recycling. For
a company to even start considering recycle plastic there has to be a large market for the
reprocessed products in order for them to survive as an interesting product at the com-
pany and for the customers. By achieving a usable, meaningful product from PS it is
important for the company to take all three types of recycle possibilities into considera-
tion to maintain an effective recycle environment solution. The three most common re-
cycle methods, mechanical, chemical and energy recovery as fuel, will therefore be ex-
plained so an awareness of the possibilities of how PS could be recycled in order to re-
duce its waste portion from plastic waste. (Plasticeurope 2012)
As mentioned earlier the most common thermoplastics are sorted out by different grades
of the plastic. An ASTM standard has been set to label out all materials with what resin
they are made up from. Six common thermoplastics are sorted with ID codes to classify
the grade of the plastic. PS has ID code six and in figure 12 are all the most common ID
codes when sorting plastics. Notice that there are 7 different types whereas ID number 7
is labeled as “other”, which can be a mixture of different types of plastics, and ID code
3 is Polyvinylchloride (PVC) and marked with the letter “V”. Both ID code number 7
and 3 is a recycle problem and is very hard to burn.

35
Figure 14 The thermoplastics ID code when sorting the different grades of plastic (Luke 2009)
2.6.1 Mechanical recycling
With mechanical recycling the main goal is to recycle the plastic material for making
new products by decreasing the use of new raw material trough a mechanical process.
(Al-Salem et al 2009)
Mechanical recycling consists of many steps and it varies from material to material, like
different foams and materials used as fibers, but the main procedure of how mixed plas-
tics are sorted, mechanically recycled, and then reused will be explained so the main
principals are understood.
The first step starts with size reduction, which can be done by grinding, shredding or
milling. The big pieces of plastics are cut down to small flakes to be further processed.
Once the pieces have been cut down they are transported to a cyclone to again be sepa-
rated from any contamination, which could be dust or any other harmful impurity. The
different plastics flakes are then floated in a tank where they separate each other accord-
ing to the density of the polymer. This is the stage where the plastic now separate each
other from other plastics so same plastics with the same molecular weight can then
milled together and start to be reproduced. The material is then treated with washing
and drying. Water is used to wash the material and chemicals can also be used for wash-
ing. Examples of this can be adhesives that might still occur on the surface of the mate-
rials or any other contamination that might harm the end use properties of the plastic.
The material is then agglutinated and some extra pigments, additives or new raw mate-
36
rial are added so the quality has similar visual and physical properties as new raw mate-
rial would have. Once agglutinated, the material is then extruded to long threads that are
then cut or pelletized. Finally the material reaches its final stage, quenching, where it is
cooled with water so it later can be sold as a final product. The material is now ready to
be reprocessed and shaped in any of the machines that produce plastic parts. (Aznar et
al. 2007)
2.6.2 Chemical recycling
Chemical recycling is a complex but probably the most profitable recycling method.
The use of the monomer side groups in the polymers can be used to make different
kinds of feedstock’s that could be used as chemicals for making other plastics. The use
of chemical recycling could also be used to reproduce usable molecules, liquids or gas-
es. For example, the styrene monomer in polystyrene is used when making copolymers
and is a very useful product. (Al-Salem et al 2009)
Chemical recycling has both advantages and disadvantages. The material that are repro-
duced chemically is a potential product that is useful for many chemical production
plants, which means that there is a good market for the product and the price of the ma-
terial can be sold for a decent price. The disadvantage is that there are a lot of expensive
elements that are used in the production of the chemical recycle process that is used to
attain the demanded material. The question that has to be asked in the company is then
if the production is beneficial enough to be reproduced so it can survive as a potential
product. (Schmidt 2012)
As mentioned earlier there are many different ways of how to make use of the polymer
if recycling the material through a chemical recycling process. For PS the most used
chemical recycling process would be to either depolymerise the material down to the
styrene monomer group or use thermolysis, so the material is heated to brake down the
molecules to be used as energy or fuel. (Al-Salem et al 2009)
In order to chemically recycle PS back the plastic is depolymerised through pyrolysis.
The plastic is threated in a very high temperature with the right catalysts and other
atomic elements to achieve the right outcome. Recently, according to chemistryworld,
Phillip Broadwith explains briefly how PS could be depolymerised in order to get to the
useful styrene monomer. A catalysts, either platinum or rhodium has to be combined

37
with cerium on alumina spheres. PS particles are continuously fed into the reactor,
where the catalysts are which occur under very high temperature. In the reactor the ma-
terial undergoes pyrolysis, which mean that PS decomposes through heating under high
temperature, into styrene. The styrene is then removed, as a gas, through a gaseous sys-
tem. (Broadwith 2012)
2.6.3 Energy recovery
Energy recovery or energy recycling is simply by burning the plastic waste to extract
energy from the combusted heat. (Al-Salem et al 2009) The energy can be used as heat,
steam and electricity. When plastics are burned they give out high energy. This energy
is called calorific value. Crude oil has a calorific value between 41−46 MJ/kg. (Jatro
2012) PS has a calorific value of 41.90 MJ/kg and show a potentially good value to be
used as fuel. The value is seemingly high considering that the plastic comes from the
production of crude oil. (Al-Salem et al 2009)
The treatment has some advantages but also some drawbacks. The main advantage is
that the waste can be used for something useful, by producing energy, which is more
useful than landfill. The drawback is when the plastic is combusted it causes large quan-
tity of air pollutant emissions that are harmful for the environment. Like the five most
common thermoplastics PS is known to soot notably much when it is burned. By using
energy recycling the material has to be held under careful treatment with strict standards
and constructions.
2.6.4 Expanded polystyrene
One example where PS would be beneficial to use, once the material has been success-
fully recycled, is to reproduce the material into expanded polystyrene (EPS). EPS is a
foam material that is used much for thermal insulation. It is used much in the packaging
and the construction industry (PlasticEurope 2014). Figure 4 shows a schematic guide-
line how EPS beads are manufactured from the styrene monomer in order to produce
EPS products.

38
Figure 15 EPS manufacturing process. The PS has now become EPS beads that are larger in size and contain some pentane (Lee 2010)
Once the EPS bead material has been produced there are still some steps that need to be
mentioned. The main components that consist in the EPS beads are solid PS and a mate-
rial, which is called a blowing agent. Pentane is usually used as a blowing agent. The
production of EPS consists of three main stages, which happen at the shape moulding
company. The first stage is the pre-expansion stage, where the PS beads are inserted to a
steam machine that heats the material up to 100−200 ◦C (Lee 2010). When the pentane
gas releases the PS beads start to expand and the density drops tremendously. (BPF re-
cycling group 2014)
In the second stage the pre expanded PS are stored in silos where the material is cooled
and some pentane is still released in the silos. In the third and final stage the material is
produced according to the application area it is going to be used. The material is formed
in a vacuum atmosphere. The typical products that are produced are mainly blocks for
insulation or cartons for packaging (BPF recycling group 2014).

39
2.6.5 Microwave assisted pyrolysis (MAP) chemical r ecycle process
There is a case where polystyrene is chemically recycled using a microwave assisted
pyrolysis (MAP). The material that is attained in the process is mainly styrene, some
amount of char and gas are also found as well. (Andrea Undri et al 2013)
The process requires a treating temperature of 350 ◦C, but can also be higher. The char
amount increase when the temperature rise and may not be so inadequate since styrene
is more valuable. To gain more styrene a catalyst can be used, but is a more expensive
approach. (Andrea Undri et al 2013)
To use a MAP an absorber has to be used that can tolerate much more heat than the
plastic in order to achieve the product, which in this case is primarily styrene. Metals
like iron can be used for the process and absorb microwave (MW) heat. The absorber
then converts the MW into heat. The result depends on the temperature that take place
in the MAP process and it is hard to estimate what the correct temperature is to use, but
as mentioned earlier, it requires a treating temperature of at least 350 ◦C. (Andrea Undri
et al 2013)
From the case of using MAP the goal were mainly to decrease PS from landfill waste. It
is hard to estimate the exact result but the amount of PS were over half of the outcome
and the gas that was attained were a potential product to be used for energy recovery
without any handling of NOx or other air pollutants. (Andrea Undri et al 2013)
2.7 Machines
All the machines that have been used have been located in Arcadas’ facilities. Introduc-
tion about the main use, how to operate it and preparation are explained as well as what
the outcome is when the machines have been used.
2.7.1 Plastic shredder
By using a plastic shredder a plastic material can begin the process of being rapidly and
effectively recycled mechanically. The principle is simple and requires few steps. Plas-
tic material is inserted into a bucket or hopper where the material is then transported to a
shredder and which cuts the material. The material circulates numerous of times through
the shredder depending of the filter, which determines the size of the outcome. The out-

40
come after the shredding are small flakes, similar to virgin pellet−looking plastic, that
can be used as recycled plastic resin, for example to an injection moulding machine.
Depending on the material and the design of the shredding blades, it is recommended to
run the shredding process numerous times in order to get small and even shaped flake
pieces. Otherwise if the shredded plastic flakes are uneven and, for example, inserted to
an injection-moulding machine, it may damage the injection process. Figure 16 is a pic-
ture of the shredder used for the experiment.
Figure 16 The plastic shredder (Arcada 2013 Jonas Eklöf)
2.7.2 Injection moulding machine
Injection moulding is one of the most common processing methods for thermoplastics.
It can make a large variety of complex products in any size, big or small. The process is
fully automated which makes it operational for a large quantity production. When a
plastic part is made with the injection moulding technique little finishing is required.
This means that when a plastic part has been processed through the injection−moulding
machine it can usually be immediately packed and be ready for shipping which consid-
erably reduces the labour costs. Surprisingly the Injection moulding machine itself is
not the only expensive unit. The moulding part, shown in figure 17, is an essential part

41
in the whole injection-moulding machine and can be almost as expensive as the whole
injection-moulding machine itself in some cases. (Strong 2006: 431)
Figure 17 The main parts of the mould in the injection moulding machine (Strong 2006)
The process of how the plastic is transported and moulded in the injection-moulding
machine is quite simple. Imagine when toothpaste is pushed out from the hole of the
tube. The toothpaste shape itself according to the shape of the outlet of the tube. The
plastics in the injection moulding machine does the same, except that it is pushed fur-
ther in to a mould where it then is cooled down and shaped to a figure. In practical this
means that raw plastic materials in form of small pellets are inserted in a hopper. The
pellets are then melted into a paste looking substance, when the plastic has melted (to a
substance like tooth paste) to a certain temperature it is then pushed into the mould or
the cavity and is then clamped and closed. The moulding process requires cooling,
which is the longest process in the whole production. Once the cooling time is reached
the mould is opened and then the part is removed either manually by a human or auto-
matically by a robot. (Strong 2006: 432 f.)
The process of how to actually create the product or in other words to “mould” a part or
product in the injection moulding machine has some important steps. As mentioned ear-
lier the phase that takes the longest time in the injection moulding process is the cooling
time for the plastic to harden, which starts immediately when the plastic has reached the

42
mould and the clamping starts, and continues until the mould is opened. Besides that the
process can be divided into 4 steps. The first step is the melting of the plastic, where the
plastic is melted to a certain temperature and then pushed forward. The second step is
the injection of the plastic in to the mould and keeping it there by holding pressure. The
third step is then to hold it for a certain time while the plastic cools down by the mould-
ing temperature and once the cooling time is satisfactory the mould opens. Figure 18 is
an illustration of the total cycle time for the plastic process when inserted to an injection
moulding machine and figure 19 an illustration of a typical injection moulding machine.
(Strong 2006: 462)
Figure 18 Illustration of total mould cycle and process of an injection moulding machine (Strong 2006)

43
Figure 19 Illustration of an injection moulding machine showing the main sections and parts (Strong 2006)
The injection unit is where the process starts. Plastic resin or pellets is filled in the hop-
per where the pre heating starts. Then by gravity and its own weight the resin is moved
down to the barrel where a screw is located that feeds, compress and metering the resin
whereas the first step is that the mould is closed, resin is pushed forward and the melt-
ing of the plastic starts as shown in figure 20. (Strong 2006: 434 ff.)
Figure 20 Melting process (Strong 2006)
In the second stage, shown in figure 21, when the resin has melted it then extrudes for-
ward to be completely moved away from the barrel. The plastic is now a dosage, which
is the amount that will be formed in the mould. The dosage that is moved forward is

44
called shot size. This step is also called the injection cycle where the plastic also initial-
ly gets in contact with the mould. (Strong 2006: 437)
Figure 21 The injection process of the resin (Strong 2006)
The temperature often starts low, then in the middle stage the temperature raises and
then goes down before it reaches the nozzle.
In the third stage the part is cooling and then clamped in the mould cavities while the
screw is moved back simultaneously as shown in figure 22. (Strong 2006: 439)
Figure 22 Screw go back to its starting position and part begins to cool (Strong 2006)
In the fourth and last step while holding pressure is compressing the part the screw is
moved backwards at the same time to again receive and melt a dosage from the hopper.
Once the cooling is over the mould opens, the part is removed and the cycle starts over
again as shown in figure 23 below. (Strong 2006: 440)

45
Figure 23 When cooling time is reached the mould is opened and part is removed (Strong 2006)
To set up the parameters on the injection-moulding machine can be struggling some-
times, in order to get top quality results. Most of the time the work is done either by
computer software or through test with different parameters. The parameters are often
tested by trial and error attempts with the nozzle temperature, pressure, cooling time,
mould temperature and dosage. There are also mathematical ways of how in theory
achieve the correct parameters, but are always needed to be tested practically and ad-
justed in order to get the best results. When the desired parameters have been achieved
there are some important steps to follow in order to start-up the injection moulding ma-
chine properly, keep the production in a steady-state and how to shut down the machine
in a correct way. The starts up steps, production and shut down of the machine have
been taken into consideration and are listed in appendix [III].
2.7.3 Tensile testing machine
The universal testing machine of the brand “Testometric” model M 350- 5CT was used
for the tensile test as shown in the picture in figure 24. The universal testing machine is
mainly used for three types of testing; tensile test, flexural test and compression test.
The tensile test, which is considered as a pull test, was used in this research. The tensile
test was used following ISO Standard 527. In a tensile test, pull tests can be done to de-
termine tensile stress at yield and tensile strain at break. The other two tests, flexural
test and compression test, are mainly used for testing bodies with different structure and
material properties. (Brown 2002:97)

46
Figure 24 A Testometric tensile testing machine and software (Arcada 2013 Jonas Eklöf)
Tensile stress-strain test
Tensile tests or pull tests are the mostly used testing method. These are the essential
facts that are used for production or research of any polymeric material. The test method
is exceptional in many ways; is fast and easy to use and gives a result that can be quick-
ly studied. The core aspect in pull tests is to determine the strength and deformation of a
material. (Brown 2002:97)
Tensile stress-strain is measured in the amount of force that is required to pull a material
apart. The tensile stress-strain also determines the displacement of what the material
result in such approach at a constant deformation rate. (Brown 2002:97)

47
Flexural Stress-strain test
Flexural stress-strain is used to find the bending properties and displacement of a mate-
rial. The force is applied perpendicular to the surface. This gives the flexural properties
and the displacement of what the material undergoes as a result of the force applied.
(Brown 2002: 143) Most used flexural test method is the three-point method where both
ends of the test piece rest and a loading are applied in the middle. This results in a bend-
ing of the test piece. A common materials used for testing flexural stress is composites
with a sandwich structure. (Brown 2002:148)
Compression test
Compression, as the name states, is used to find the compression of a material. It exam-
ines the opposite to what tensile stress−strain does. Same machine can be used to test
both tensile and compression but in the latter case it is needed to have an even higher
force and high stiffness which might make it a bit difficult. A compression cage can be
used when working with the tensile testing machine. The mainly used materials used to
examine compression are rubber and foam to study special characteristics in elasticity
and deformation. (Brown 2002:127)
2.7.4 UV-VIS-NIR Spectroscopy
UV−VIS−NIR stands for Ultraviolet−Visible−Near Infrared. The UV light is a wave-
length that is shorter than the visible wavelength. The UV-VIS Spectroscopy is used to
study the chemistry interactions between electromagnetic radiation, atoms and mole-
cules (Anglient 200:151). The spectroscope has gained much popularity because of its
fast technique. Samples can be quickly tested and analyzed without any pre-treatment.
Both solids and liquids samples can be used with the spectroscope (Xiaobo et al. 2010:
14:32). UV−VIS−NIR spectroscopy is known as electronic spectroscopy because it
deals with the absorption of energy by electrons in molecules. The electrons are ar-
ranged in three different configurations in the molecule. The two bonds are called the π
(pi) − bonds and σ (sigma) − bonds. The last one is η (eta) − electron configurations.
When these electrons get in contact with the light, depending on the electrons, they get
in different states, which can be the excited state or anti-bonding state between the tran-
sitions when the light that passes through a sample. These states are the origin of what is

48
studied with the UV−VIS−NIR spectroscopy (Mehta 2011). The molecule absorbs a
portion of light and a spectroscope record the phase when light transmits through the
sample. The data, which the spectroscope record, is plotted in a graph where the x- and
y- axis is represented of the absorption (A) and (arbitrary unit) the wavelength (in nm)
(λ). When the spectroscope is finished and has plotted the amount of absorption in the
different wavelengths the result is called a spectrum (PharmaxChange 2011). Figure 25
is a picture of a UV-NIR/VIS workstation.
Figure 25 UV-NIR/VIS set up workstation. Software for calibrating results (left) and UV-NIR machine (right) (Ar-cada 2013 Jonas Eklöf)
2.7.5 Zeiss Microscope – Optical microscopy
The optical microscope is the most common and oldest tool for observations of test
specimens. With the use of an optical microscope, scientists can examine a specimen
that cannot be seen with the human eye alone.
The optical microscope uses the light, different lenses and a set of objective magnifica-
tion objectives in order to get the right intensification. The optical microscope use the
wavelength between visible light, which means that it is between the light of wave-
lengths that the human eye can mostly catch up. Other microscopes can use electrons in
order to study deeper into the sample.
The model Zeiss Axio Scope A1 is a compound microscope that can use different kinds
of lenses and do many different types of tests, which can be modified depending on the

49
test specimen and type of research attainment. It can focus on transmitted-light or re-
flective light.
For the thesis research, the goal was to study the transmittance, the amount of light that
passes through and investigate if any defects were found, so the set up for the micro-
scope used was transmitted-light. The reason why the transmitted light is used and not
the reflected light is done because the main purpose is to see through the test pieces and
with the help from the visible light, spot any defects or contaminations that may not be
observed with the naked eye inside the test sample. The reflected light set up is the
study of the surface of a specimen and study how much is reflected back. Using a digital
camera the images can be saved and documented for further study. The drawings in fig-
ure 26 below illustrate an overview measurements of the Zeiss Axio Scope A1 and fig-
ure 27 is an overview of different functions of the Zeiss Axio Scope A1 microscope.
(Carl Zeiss MicroImaging GmbH 2013)
Figure 26 Drawings and measurements in mm of the Zeiss Axio Scope (Courtesy of Carl Zeiss MicroImaging GmBH 2013)

50
Figure 27 Overview of different functions of the Zeiss Axio Scope (Courtesy of Carl Zeiss MicroImaging GmBH 2013)
2.7.6 Charpy/Izod impact test
The charpy or izod test is a very common testing method. The test is used as much as
the tensile stress-strain tests when investigating a material behaviour. The charpy or
izod test is a common testing method to quickly and practically investigate the behav-
iour from a sudden impact on a material.
The tensile stress-strain test is considered to be equilibrium toughness. This means that
all the same tests are related to the region or area under the same stress-strain curve.
This is good for comparison with other materials and to get a balanced test. The charpy
or izod test uses a more sudden impact test on the test piece under a shorter time and is
called to also be impact toughness test. This is another approach to investigate the mate-
rial stress-strain behavior in a way because the test depends on the main properties of
the material if it is either tough or brittle. The impact test piece is direct proportional to
the impact. This means that, depending on the material, the material will internally
move or deform by the impact individually. An impact test material can be either tough

51
or brittle. A material is tough when it has a long elongation and low modulus, which
means little change. A material is brittle when it has low elongation and high modulus,
great change.
Materials with high molecular weight usually have a higher toughness because they
usually have higher strength and tolerate higher toughness. This is because these mate-
rials will send out the impact along the polymer chain and will make the atoms vibrate
along it so it shares the total energy of the impact.
The principal for utilizing the charpy or izod impact test is quite simple. Depending if it
is a charpy test or izod test sample is placed and clamped horizontally or vertically re-
spectively. Then, a standard notch is used for the test pieces and a pendulum swings and
slices the test piece. The pendulum will swing across the sliced test piece and some of
the energy will go into the test piece. From there the loss in height, the potential energy,
can be directly related to the energy that was absorbed to the test piece. A pointer rec-
ords the height of the swing. The test results are often measured in [J/M] and are ex-
pressed as impact toughness. As mentioned earlier the test sample is first prepared so it
follows the ASTM D 256 or ISO standard. The sample has a v-shaped cut so it initiates
the rupture. (Strong 2006:141 ff.)

52
Figure 28 Charpy and Izod impact test showing the difference of the both methods (Strong 2006)
Figure 28 above shows the difference between a charpy and izod impact test. The char-
py and izod test have their differences with not only the positioning of the test piece.
The charpy test, when it is positioned horizontally, creates a tensile stress inside the
notch. For the izod test where the test piece is clamped vertically the notch is bended
that is struck by the swinging pendulum or hammer. What is also notable for the izod
and the charpy tests is that the notch on the test piece has a different radius. (Osswald et
al 2003:473 f.:475 ff.).

53
Some say that the charpy or izod impact tests are unreliable. For example, the test can
be used for other materials like metals, where you expect to get a more straightforward
result. However even for those results there has been an argument that the results are to
unpredictable. The author suggests that the test can be used for quality control and spec-
ification purposes but not for end-product performance. The test is still useful and is
good for the examiner to get more general knowledge of how a material behaves.
(Crawford 1998:152 f.)
As mentioned earlier the impact toughness or impact strength can be calculated as fol-
lows in formula 4:
�����������ℎ = �����������������ℎ������(J/m2)
[4]
(Crawford 1998:152)
3 METHOD
Test specimens were produced and compared throughout the following tests. The exper-
imental part of this thesis was done using the following methods.
1. Tensile test.
2. UV−Vis−NIR Spectroscopy transmission analysis test.
3. Optical Microscopy test.
4. Expert interviews.
The materials used for the test were the following:
1. GPPS, General Purpose Polystyrene 678E polymer resin. Producer: Styron.
Technical information data sheet can be found in the Appendix [I].
2. Recycled PS flakes. Grinded and produced from Bioscreen HC products by Jo-
nas Eklöf. Total number of recycles made can be found in the next section table.

54
3.1 Test specimen
In order to be able to test and compare the results, dog bone test pieces were produced
using the injection-moulding machine. The dog bone test specimen is a type IV dog
bone that has been produced according to ASTM D638 standard. Bellow in figure 29 is
the data that has been used to proceed according to the standards:
Figure 29 Cut out from the ASTM tentative method of test for tensile properties of plastics (Mathew 2011)
The variety of the IV dog bone test pieces are listed in table 7 below. In total there are
eight different types of tests, which were made from same material when recycled. The
first piece is used with pure PS while the other test pieces have been recycled according
to the total amount of percentage-recycled material in the test pieces. The second test
piece is 100 percent recycled from the first test. The third test use 15 percent of the 100
percent recycled material. The fourth test piece use 30 percent of the 100 percent recy-
cled material and so on. The differences of the different test pieces are the amount of
recycled materials and times that the material has been recycled.

55
Table 7 List of amount of tests made (Jonas Eklöf)
# Amount of recycled materials [%] Times recycled
1 0 Non (only raw material)
2 100 One
3 15 One
4 30 One
5 15 Two
6 30 Two
7 15 Three
8 30 Three
3.2 Injection moulding machine preparation and para meters
The steps of how to safely and properly operate an injection moulding machine was fol-
lowed according to author A. Brent Strong which can be found in the appendix [III].
The parameters used for the injection-moulding machine was not hard to find since PS
is easy to work with. The main parameters used for PS in the injection-moulding ma-
chine are listed in table 8 below.
Table 8 Set up parameters for the injection moulding machine (Jonas Eklöf)
Temperature Value Unit
Nozzle 220 °C
2. Cylinder 220 °C
3. Cylinder 220 °C
4. Cylinder 215 °C
Hopper 45 °C
Mould Temperature 45 °C
Mould fastening 350 kN
Cooling time 15 S
Injection 130 Mm/s
Injection time 4 S
Holding time 5 S
Holding pressure 140 Bar
Cushion 5 Mm
Plasticizing stroke 25 Mm

56
3.3 Tensile test
The mechanical properties for the PS and all the rPS were tested through a tensile test-
ing machine. The tests were conducted at a load speed of 50 mm/min and according to
ASTM D638. According to ASTM D638, in order to get a reliable test, each material
needs to be tested with 5 dog bones. The length for the type IV standards is approxi-
mately 33 mm. Thickness of the dog bone needs to be lower than 4 mm (in this case
~1.61 mm) and width 6 mm (in this case 5.56 mm). Force was 50 mm/min in the stand-
ard setup, but because PS is so brittle it was set to 5 mm/min. According to the stand-
ards when using 5 mm/min there should be a tolerance of ±20%. A check was made
with 50 mm/min and it was 40.9 MPa (which is close enough to run all test again with
50 mm/min). Parameters set for the test is listed in table 9 below. Worth noting is that as
mentioned earlier the tensile testing machine can find many more different mechanical
properties like compression, flexural strength and shear stress. These tests would require
other ISO standards and those tests have not been taken into consideration for the cur-
rent duty. The reason for this is because of the lack of mould and test pieces for those
shapes. (Brown 2002:107)
Table 9 Parameter set for the tensile testing machine (Jonas Eklöf)
Test speed [mm/min]
Force [kN] Distance between grips [mm] Tolerance [%]
50 5 60 ±10
5 5 33 ±10
3.4 Spectrophotometry – Transmission
The UV-VIS-NIR machine was used to find the transmittance and absorbance between
wavelengths of 190-2700 nm. The value was set first to be Violet (the wavelength),
which is below the Visible wavelength (< 400nm) and then through the visible wave-
length up to 2700nm. The final parameters were then set to ~ 190nm – 2700 nm wave-
length. The other and final parameters for absorbance are listed in table 10.
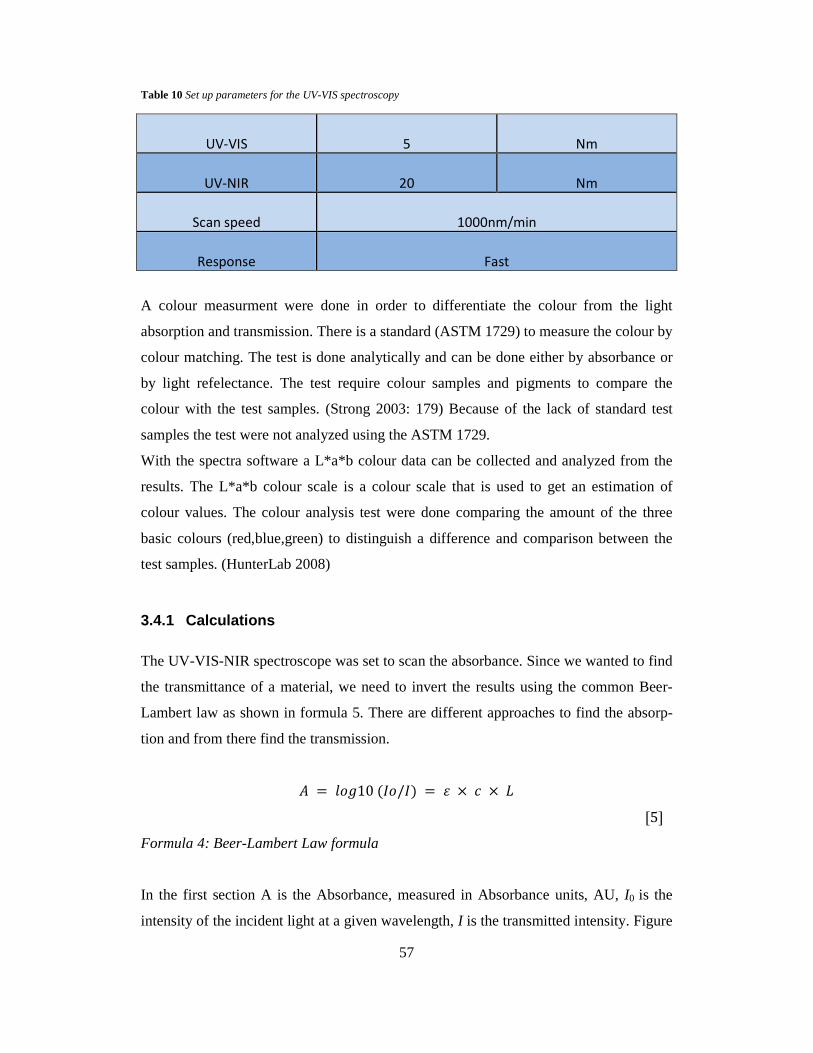
57
Table 10 Set up parameters for the UV-VIS spectroscopy
UV-VIS 5 Nm
UV-NIR 20 Nm
Scan speed 1000nm/min
Response Fast
A colour measurment were done in order to differentiate the colour from the light
absorption and transmission. There is a standard (ASTM 1729) to measure the colour by
colour matching. The test is done analytically and can be done either by absorbance or
by light refelectance. The test require colour samples and pigments to compare the
colour with the test samples. (Strong 2003: 179) Because of the lack of standard test
samples the test were not analyzed using the ASTM 1729.
With the spectra software a L*a*b colour data can be collected and analyzed from the
results. The L*a*b colour scale is a colour scale that is used to get an estimation of
colour values. The colour analysis test were done comparing the amount of the three
basic colours (red,blue,green) to distinguish a difference and comparison between the
test samples. (HunterLab 2008)
3.4.1 Calculations
The UV-VIS-NIR spectroscope was set to scan the absorbance. Since we wanted to find
the transmittance of a material, we need to invert the results using the common Beer-
Lambert law as shown in formula 5. There are different approaches to find the absorp-
tion and from there find the transmission.
� = ���10(��/�) = × � × "
[5]Formula 4: Beer-Lambert Law formula
In the first section A is the Absorbance, measured in Absorbance units, AU, I0 is the
intensity of the incident light at a given wavelength, I is the transmitted intensity. Figure

58
30 below show how I0 is the intensity of the incident light and the transmitted intensity I
that is measured.
Figure 30 Illustration how the transmission is measured from the material. In the picture the sample appear to be a concentration, but the principle is the same for a solid material (Gallik 2011)
The last portion in formula 5 show is the other common Beer-Lambert formula. The
formula shows that same result is approached when ε is epsilon which is a constant, is
multiplied with c , which is the concentration of the absorbed sample, and L, which is
the pathlength through the sample. In order to get the transmittance the values of the
absorption is inversed. One way is to use the formula [5] is to manipulate the equation
to get the transmittance. In Appendix [IV] is a proof of how the transmission is the
inverse of absorbption using formula [5].
3.5 Microscope
The Zeiss Microscope used transmission set up with up to a 50 times enlargement mag-
nification. 50 were to near to study anything within the material. Mostly 5x and 10x
magnification objectives were good enough in order to be able to study the transmit-
tance of the solid material.

59
It is important that the workstation is clean when starting to use the machine. The cam-
era and the objects must be carefully cleaned in order to receive best results and record
the best images. There are lots of cleaning agents and materials that can be used in order
to prevent bad images (Zölffel 2013:4). There are some steps that can be done in order
to check if there is dirt on the results. One thing to start with is the sharpness or quality
of the image. Dirt can be spotted when similar contrast of the image follows when ad-
justing the objectives, specimen or condenser (check figure 21) in result of poor quality
of sharpness and contrast (Zölffel 2013:4). There are of course other types of dirt that
can be the reason why a bad quality of image appears, but that kind of dirt are usually
found when going to a 20x or more objective magnification, which then detects even
fingerprints and other particles. (Zölffel 2013:6)
Figure 31 shows how good quality the recorded image appeared from the digital cam-
era. The picture that was captured shows a spot that were found on all the test pieces. It
was interesting that all the test pieces had the same pattern on exactly the same spot.
The reason for this would probably be a defection that has emerged from the mould dur-
ing the production process with the injection moulding machine. The spot was best visi-
ble with a 5x objective magnification.
Figure 31 Spot that was found on all test pieces (Arcada 2013 Jonas Eklöf)

60
3.6 Interviews
Interviews from persons from the sub-contracting fair in Tampere were done in order to
get an expert opinion on how PS is currently used and suggestions what to do with it
when recycled. The name GPPS have been used instead of PS because General-
Purpose-Polystyrene might get mixed with the other PS products.
The Tampere sub-contracting fair took place on the 24th to 26th of September 2012. The
exhibition is the biggest sub-contracting fair in Finland. The fair has over 1000 exhibi-
tors and involves metal industry, electronic industry, rubber industry, plastic industry,
design, consultation, and ICT.
The interviews were done face-to-face with key persons representing different plastic
companies. The questions asked are listed below.
1. What method or recycle process do you think GPPS would be most suitable for?
What is your opinion?
2. If recycling PS mechanically (able to be re-used for the injection-moulding ma-
chine) what product or field do you think rPS would be most suitable or profita-
ble to produce?
3. Have you had any experience in recycling GPPS as energy or any other way? If
so do you think that would be a good choice to use GPPS waste?
4 RESULTS
In this chapter the main results are shown. The results from each test method are pre-
sented in separate sections of this chapter. In the appendix are the rest of the tests results
and also the results found from the microscope test.

61
4.1 Tensile test
Results of the tensile test were collected in order to compare all the results. There was
some trouble producing the dog bones from the injection-moulding machine at first be-
cause the mould, which produced another standard of dog bones were broken and una-
ble to be used further so the mould had to be changed and the process had to reschedule.
Since the IV type dog bone mould was produced in the university there is not a 100 per-
cent guarantee that it followed the correct standards. The tests were tested according to
ASTM D638. Also, the dog bones got greenish both when recycled and when only raw
PS was used. Since the injection-moulding machine at school is not only used with PS
the reason for this might be that a green PET material was used before the test, even
though it had been properly cleaned. Since all the produced material looked the same it
did not change the relative results between the materials. The main goal was to compare
the recycled materials with each other.
The PS dog bones snapped remarkably fast with the 50 mm/min set-up. Because of this
the test speed was also tested and measured with 5 mm/min, respectively, each for a
more comparable result. All results from the tensile testing machine are shown in the
appendix [II], but stress at yield, nominal stress at break and Young’s modulus was
compared and is mainly focused in the results tables below. Table 11−14 reveals the
results with the test speed of 5 mm/min. Table 15−18 reveals the results with the test
speed of 50 mm/min.
Table 11 Tensile test results with 5 mm/min test speed
Material and
times recycled
Stress at Peak
[MPa]
Nominal strain at break
[%]
Young’s Modulus
[MPa]
I. Non rPS 31.737 2.275 1479.259
II 100% rPS 34.022 2.881 1309.529
III 15% rPS one 34.508 2.819 1309.688
IV 15% rPS two 35.748 2.951 1267.181
V 15% rPS three 36.325 3.066 1210.164
VI 30% rPS one 36.231 3.292 1155.65
VII 30% rPS two 35.264 2.951 1257.568
VIII 30% rPS
three 35.9 3.152 1264.892

62
Table 12 Stress at peak 5 mm/min
Table 13 Nominal strain at break 5 mm/min
0 5 10 15 20 25 30 35 40
I. Non rPS
II 100% rPS
III 15% rPS one
IV 15% rPS two
V 15% rPS three
VI 30% rPS one
VII 30% rPS two
VIII 30% rPS three
Stress at peak [MPa]Standard deviation
2.2
1.8
1.6
1.5
1.1
1.3
2.9
1.2
0 0,5 1 1,5 2 2,5 3 3,5
I. Non rPS
II 100% rPS
III 15% rPS one
IV 15% rPS two
V 15% rPS three
VI 30% rPS one
VII 30% rPS two
VIII 30% rPS three
Nominal strain at break [%]Standard deviation
0.17
0.19
0.27
0.18
0.2
0.27
0.3
0.1

63
Table 15 Tensile test results 50 min/mm
Material and
times recycled Stress at Peak [MPa] Strain at Peak [%] Young’s Modulus [MPa]
I. Non rPS 39.592 3.478 1375.001
II. 100% rPS 36.143 3.547 1258.807
III. 15% rPS one 39.774 3.534 1308.22
IV. 15% rPS two 39.074 3.393 1322.958
V. 15% rPS three 39.303 3.422 1352.265
VI. 30% rPS one 39.547 3.479 1330.311
VII. 30% rPS two 37.384 3.089 1337.184
VIII. 30% rPS three 38.668 3.382 1294.302
0 200 400 600 800 1000 1200 1400 1600
I. Non rPS
II 100% rPS
III 15% rPS one
IV 15% rPS two
V 15% rPS three
VI 30% rPS one
VII 30% rPS two
VIII 30% rPS three
Young's Modulus [Mpa]
Standard Deviation
110
122
34
20
55
68
35
7
Table 14 Young's modulus 5 mm/min

64
Table 16 Stress at peak 50 min/mm
Table 17 Nominal strain at yield 50 min/mm
0 10 20 30 40 50
I. Non rPS
II. 100% rPS
III. 15% rPS one
IV. 15% rPS two
V. 15% rPS three
VI. 30% rPS one
VII. 30% rPS two
VIII. 30% rPS three
Stress at peak [MPa]
standard deviation
1.8
0.8
1.2
0.9
1.7
0.5
0.8
0.9
0 0,5 1 1,5 2 2,5 3 3,5 4
I. Non rPS
II. 100% rPS
III. 15% rPS one
IV. 15% rPS two
V. 15% rPS three
VI. 30% rPS one
VII. 30% rPS two
VIII. 30% rPS three
Nominal strain at yield [%]standard deviation
0.70
0.13
0.22
0.25
0.2
0.15
0.1
0.1

65
Table 18 Young's modulus 50 min/mm
4.2 Transmittance
The transmittance was found using the UV-VIS-NIR machine. The test specimens used
in the UV-VIS-NIR test were the same test specimens that had been used for the tensile
test. For a more comparable test the test specimens were cleaned and assured that the
surface was lapped where the beam would hit the test piece. The very same adjustments
were made for all the test pieces so the results would be comparable. The results can be
found form figure 32−39. The first test was with non-recycled polystyrene. The second
test was with 100 percent recycled polystyrene. The third test was tested with 15 percent
recycled polystyrene. The forth test was tested with 15 percent recycled polystyrene
with a second time recycled. The fifth test was with 15 percent recycled polystyrene
with a third time recycled material. The sixth test was with 30 percent recycled material.
The seventh test was tested with 30 percent recycled material with a second time recy-
cled. The eight and the final test were tested with 30 percent recycled material with a
third time recycled material. In figure 40 all results are combined for a comparison be-
tween the deviations of the different tests.
0 200 400 600 800 1000 1200 1400 1600
I. Non rPS
II. 100% rPS
III. 15% rPS one
IV. 15% rPS two
V. 15% rPS three
VI. 30% rPS one
VII. 30% rPS two
VIII. 30% rPS three
Young's modulus [MPa]
standard deviation
13.6
23.7
61.5
38.1
32.6
21.7
26
29.

66
Figure 32 First result with non recycled PS UV-VIS spectrum
Figure 33 Second result with 100 percent recycled PS UV-VIS spectrum

67
Figure 34 Third result with 15 percent recycled PS UV-VIS spectrum
Figure 35 Fourth result with 15 percent recycled PS two times UV-VIS spectrum
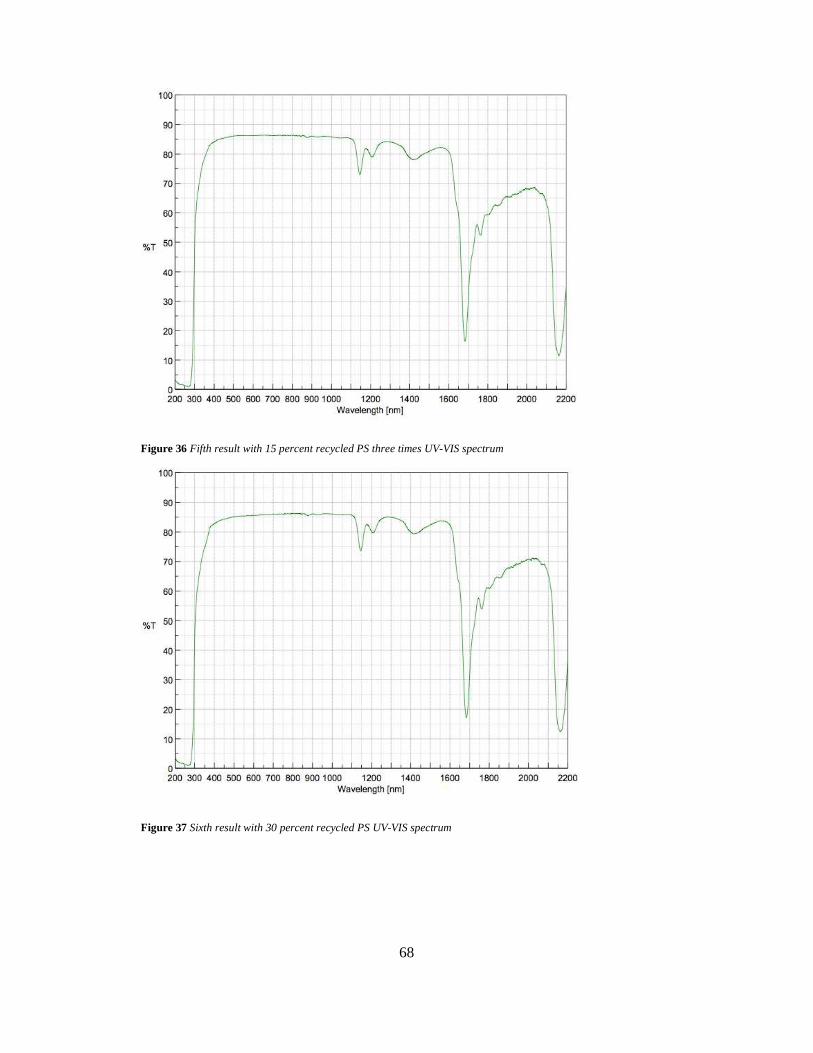
68
Figure 36 Fifth result with 15 percent recycled PS three times UV-VIS spectrum
Figure 37 Sixth result with 30 percent recycled PS UV-VIS spectrum

69
Figure 38 Seventh result with 30 percent recycled PS two times UV-VIS spectrum
Figure 39 Eight result with 30 percent recycled PS three times UV-VIS spectrum

70
Figure 40 All results including the set up information from the UV-VIS machine UV-VIS spectra

71
4.2.1 L*a*b colour analyse results
The spectra software was used to gain colour analysis values form the tests. The values
were in an L*a*b system of measuring colour. A 3D scatter plot workbook was used in
order to plot all the values in the same graph. It was hard to be able to fit all the values
since they all had almost the same results but some adjustments were made in order to
distinguish between the tests. The scales on the graph were set so the y−axis represent
the L value 0 − 100. The x-axis represents the a-value 3 − (-3) and the b value 3 − (-3).
Below are the values shown in table 19 and the 3D plot graph of the results in figure 41.
The values were so close that the labels are not present.
Table 19 L*a*b colour analysis results
L*a*b Analysis
Value X Y Z
a L b
Non recycled PS -0,19 94,58 0,44
100 % rPS -0,23 94,23 0,88
15 % rPS one -0,19 94,55 0,51
15 % rPS two -0,19 94,38 0,54
15 % rPS three -0,22 94,38 0,56
30 % rPS one -0,16 94,03 0,76
30 % rPS two -0,16 94,73 0,43
30 % rPS three -0,19 94,53 0,52

72
Figure 41 3D scatter plots from the results of the colour analysis test
4.3 Zeiss Microscopy
A digital camera was used to take pictures of the findings used with the Zeiss Micro-
scope. Using the transparency set up made it possible to look through the material.
Some interesting spots were found that were further investigated, but it was hard to no-
tice any particular difference between the test pieces since all had the same odd-looking
particles inside. One particular spot were followed because it clearly distinguished in-
side the material as seen in figure 42−45. When investigated even further the colour
changed when looking with up to 10x magnification.

73
Figure 42 A picture taken with a normal 8MP lens camera. Notice the red indication (Arcada 2013 Jonas Eklöf)

74
Figure 43 Closer look on the indicated spot with a 5x objective magnification (Arcada 2013 Jonas Eklöf)
Figure 44 Same spot as the previous with a 5x objective magnification and more light transmission (Arcada 2013 Jonas Eklöf)

75
Figure 45 Same spot but with a 10x objective magnification (Arcada 2013 Jonas Eklöf)
All the results recorded images from the microscopy test can be found in Appendix [V]
4.4 Interview answers
The answers from the interviews are listed down below from key persons in the plastic
industry. Some persons accepted to use their name and company name and some only
allowed name. Persons who wanted to be completely anonymous are listed as “Person
“X”. The Answers are listed according to the question number. The persons are not
listed in a specific order.
Joni Henionen, Masamuovi Oy
1. “You can grind scrap material, that’s the easiest way to use it. Another one is to
re-pelletize it through extrusion to re-granulate it. That is better for quality but
more expensive. The best way is to immediately grind scrap material after pro-
ducing it and right back to the process.”

76
2. “Various types, but should not be anything with optical or big visual demands.
Perhaps a food container or fork that can be used once. Nothing with big de-
mands. Because you have the risk that you will produce more scrap using too
much recycled material. Best way is to grind it and immediately use it on the
same process, then you will have a small percentage of recycled material and
won’t need any drying and used immediately is the best way”
3. “When the material is mixed for example with some other material it is contami-
nated and not usable, then you can use it as energy material, energy scrap. Eve-
ry material except PVC can be used as energy material. It is not the most profit-
able way but the more eco-friendly (environmental friendly way) use as energy.”
Person A
1. “ If we can mechanically recycle in our plant it is most efficient for us. For ex-
ample if you do some products and there are waste parts sprue channels we can
immediately after put it on recycle on our own stock so we can re-use it 100%.”
2. “Should be simple products. Without any high mechanical or visual demands.”
3. “Don’t have answer”
Mika Kantola
1. “One efficient way would be to mill it back to scrap and use it again”
2. “There is no such thing as best product, it can be used to what it meets to de-
mands”
3. “For example we recycle in our plant, so we mill it and use it again. When we
deliver our product, they may burn it and use it as energy. After a product has
been used it can be burned”
Person B

77
1. “There are many techniques that polystyrene is good at. Depends on the prod-
uct. In our company we grind the sprue and failure pieces”
2. “Best products would be where the colour is not so important. Not a part that
need to have so big visual demands. Not for food use if not food approved. If it is
parts that have to look good you need to be very careful with the recycled mate-
rial that there is no other materials, no other particles and the colours are the
same.”
3. “ I don’t know that sector”
Fredrik Holst
2. “The products should be simple, disposable products. It can be for example flower-
boxes and simple storage boxes.”
5 DISCUSSION
In this section the research methods will be explained and why they were used, except
the interview answers. They will be evaluated and concluded in the next section.
It was not hard to realize that the most beneficial and practical way to recycle the Bi-
oscreen HC product would be to grind it down to flakes and then use the rPS flakes in
the injection moulding machine. The grinding process went fast and smooth with no
holdbacks. As mentioned in the theory section it is important that the outcome of the
flakes have similar size and because of this it might be good to shred the material nu-
merous of times in order to make sure of that. Surprisingly the rPS flakes were visually
good already on the first run but were grinded two times for convenience.
The injection moulding machine was easy to operate when producing the test pieces
even though some unexpected scenarios slowed down the project. There was no differ-
ence in the parameter set-up for the different materials when operating with the injec-
tion moulding machine. Since the machine was not only used for the purpose of the cur-
rent research other materials had been operated before the production of the test pieces.

78
As a result of this the injection moulding machine were carefully cleaned. Nevertheless
there was still an expectation that the produced test pieces would have an effect on the
results. Green PET had been used in the injection moulding machine and the outcome of
the test pieces indicated when producing test pieces that a weak greenish colour were
found when they were stacked. The reason for this was probably that some PET granu-
lates were still inside the injection moulding machine when producing the test pieces
As for the tensile test the set up was somewhat modified in order to gain a more decent
and comparable result with the test pieces. In the beginning the tensile test the force was
set to 50 mm/min, as it had been used in the standards, but because the material was so
brittle it was set to 5 mm/min. At first the tests seemed to give reliable results, but after
all test were done a 20% difference were discovered. Since the standards indicated that
changing the test speed the result should have a tolerance of ±20% it seemed to proceed
as planned.
The results provided from the tensile tests were not similar to the one as on the technical
data sheet. The young’s modulus was not done according to the standard since it re-
quired different test tools and standard. However the results were all done in the same
approach and could therefore be compared simultaneously. The mechanical properties
from tensile test results were surprisingly similar to each other. It was expected that the
stress at peak, nominal strain at break should be higher and young’s modulus lower with
the recycled material, since it was expected to be more elastic. It was expected that the
most notable difference observed would be with either in the 30 % recycled material
that had been recycled three times because the molecule chains in the polymer would
have been most broken down here.
The virgin raw material had lower stress at peak and strain at break, but higher young’s
modulus with test speed of 5 mm/min and test speed of 50 mm/min which supported the
assumption that the material might have got slightly more elastic after the recycles.
The charpy/izod test would have been interesting to gain even more mechanical proper-
ties of the different materials, which could have been studied and compared. Since such
machine was not available at the time it was therefore not used.
79
When obtaining the optical properties there were no surprisingly big differences even
though the greenish colour was distinguished on the test pieces. However, the properties
from the UV-Vis-NIR spectroscopy had some restrictions. The same spot were meas-
ured on all test pieces for transmittance value and surprisingly all had the similar results.
Even though the weak greenish colour could be designated in the recycled test pieces
that no notable difference was found in the colour analysis. Perhaps the results would
have provided more interesting values if there was a possibility to do a sweep test in or-
der to get a transmittance result from the whole test piece. For the transmittance test the
index of refraction was not measured due to the lack of experimental equipment needed
for the ASTM D 542 standard test. But as with the previous test, all the tests were done
with the same approach and therefore the optical properties could be measured and
compared.
The microscope provided some detail information of different shapes and possible con-
taminant particles that existed in the test samples. Surprisingly, at this test also, there
was no significant difference in the test pieces that could separate one test from another.
All test pieces had similar particles in them which could mean that it could be contami-
nants or dust from either the injection moulding machine, the plastic shredder or other
unavoidable contamination.

80
6 CONCLUSION
In this chapter the research questions are answered and the results are analyzed.
6.1 What are the recycling possibilities for the Bi oscreen HC
product?
According to the interviews collected from the key persons in the plastic industries the
recycling possibilities for the Bioscreen HC can be observed in three different perspec-
tives, namely the economical perspective, environmental perspective and the technical
perspective. On the economical perspective the most beneficial way to recycle the Bi-
oscreen HC product would be using a recycling method so the material could be effi-
ciently reused up to a hundred percent. The reused material would perhaps not be suited
for the same product but instead used as another disposable product that does not re-
quire high demands. Environmentally speaking there is still no doubt that the material
can at least be collected and sorted for further handling as reproduction or burned as en-
ergy fuel in order to decrease the material waste quantity. From a technical viewpoint
the material has a good potential once it has been recycled either chemically, to obtain
the styrene monomer, or mechanically through extrusion with re-pelletizing and re-
granulation to maintain an equivalent and competing product quality compared with the
raw material.
According to the tests one can argue that the material could be used for the same pur-
pose since the mechanical and optical properties did not differ significantly. Even
though the material was tested with the instruments in Arcada, like the injection mould-
ing machine, which does not handle only one material but many different materials, that
would expect to change the results. This did surprisingly not show up and did not affect
the results in a noteworthy condition. The verdict if the material could be immediately
used for the same purpose is still not up to the researcher to decide. Other test methods
are still required in order to make sure that the materials would be suited for the same
product. Also the reproduction of a plastic into a medical product is also a legal issue
that requires further bureaucratic investigations and approaches.

81
6.2 Was the new mechanical and optical properties s uccessful-
ly defined when the product had been recycled?
The results from the different tests were successfully obtained and defined. However
since the results were surprisingly similar to each other the conclusions should be taken
with great caution. The mechanical property, in terms of stress at peak, nominal strain
and young’s modulus were compared between results that were found from the first test
material, which was the raw polystyrene material that had not been recycled. In theory
these values should be able to be compared and distinguished with each other. The per-
centage values have been calculated so that the differences have been calculated be-
tween the non-recycled material, material one, and the corresponding material 2 − 8.
Then the average between the two materials has been calculated so the difference could
be found in percent. The results of the mechanical properties with the different test
speed are listed below in table 19 and 20.
The materials are listed as following:
Material 1: Non recycled PS (only raw material)
Material 2: 100 % recycled PS flakes
Material 3: 15 % recycled PS flakes and 85% raw PS (recycled one time)
Material 4: 15 % recycled PS flakes and 85% raw PS (recycled two times)
Material 5: 15 % recycled PS flakes and 85% raw PS (recycled three times)
Material 6: 30 % recycled PS flakes and 70% raw PS (recycled one time)
Material 7: 30 % recycled PS flakes and 70% raw PS (recycled two times)
Material 8: 30 % recycled PS flakes and 70% raw PS (recycled three times)
Table 20 Mechanical properties with test speed 5 mm/min and the difference in percent compared from the first test
Mechanical Prop-erty 5mm/min
Material equability in percent between material one and the corre-sponding material
1 2 3 4 5 6 7 8
Stress at peak 0,0% 7% 9% 13% 14% 14% 11% 13% Nominal strain at
break 0,0% 26,64% 24% 30% 35% 45% 30% 39%
Young's Modulus 0,0% -11% -11% -14% -18% -22% -15% -14%

82
Table 21 Mechanical properties with test speed 50 mm/min and the difference in percent compared from the first test
Mechanical Prop-erty 50 mm/min
Material equability in percent between material one and the corre-sponding material
1 2 3 4 5 6 7 8
Stress at peak 0% -8,7% 0,5% -1,3% -0,7% -0,1% -5,6% -2,3% Nominal strain at
break 0% 2,0% 1,6% -2,4% -1,6% 0,0% -11,2% -2,8%
Young's Modulus 0% -8,5% -4,9% -3,8% -1,7% -3,3% -2,8% -5,9%
The percentage difference distinguished much when the test speed was slower. The val-
ues could obviously be measured more accurately and the rate of the difference would
be more sensitive which would probably be one of the reasons. The values from the ta-
bles can be understood so that the higher amount and times the material have been recy-
cled, the higher the risk are that the mechanical properties varies in comparison with the
raw material.
As for the optical properties the results were even harder to distinguish since the results
were visually identical. In order to make an attempt to differentiate between the results
all the eight corresponding results were compared with the first result value, which was
also in this test the raw material. The materials are numbered from 1 – 8 and the de-
scriptions are the same and can be seen from the previous, mechanical property test. The
extreme values may seem high but when comparing the results on the colour scales in
figure 9 the values does not seem to affect much or change colour in the figure.
Table 22 L*a*b colour analysis result difference in percent compared with the first result
L*a*b colour
analysis Axis
Material equability in percent between material one and the corre-
sponding material
1 2 3 4 5 6 7 8
L 0% -0,4% 0,0% -0,2% -0,2% -0,6% 0,2% -0,1%
a 0% -21% 0% 0% -16% 16% 16% 0%
b 0% 100% 16% 23% 27% 73% -2% 18%
The microscopy tests speak for themselves. The possible contaminants reordered were
found on all the test pieces and it was not possible to distinguish one material from an-
other since all had the same odd-looking particles. There will always be some particles
inside a material.

83
6.3 What are the benefits of polystyrene when recyc ling it?
According to the theoretical research, the test results and the expert interviews the main
benefit from recycling polystyrene is that plastic factories can save material costs if
they, through a mechanical recycling method, reuse the material by shredding down the
sprue channels or scrap material with no visually error. Since the properties do not re-
markably change much it should not affect the end result. However this statement is
completely dependent on the values as a result of the research and tests results made by
the student. The conclusion should not be followed through all considerations regarding
the recycle possibilities of polystyrene.
7 SUGGESTIONS FOR FUTURE WORK
There was a suggestion to do a test run in the factory by using scrap material that came
from the production of the Bioscreen HC product and use it for the same product. The
scrap would be collected and inserted to a shredder, which would produce flakes that
would be inserted in the injection moulding machine and work as the recycled material.
The times the material would be shredded and amount of recycled material used could
be the same as the current research have used in order to have the possibility to do a
comparison between the tests collected from the laboratory and lab used in the school
and the ones that would be used in the factory. The goal could either be that one would
state the argument that an amount of recycled material could be used in the Bioscreen
HC product in order to save material costs or investigate if there is any difference when
same product have been produced by a certain amount of recycled material. Similar
quality check would be made as the original Bioscreen HC product undergoes when it is
produced in order to compare the results and find any possible contaminants, followed
by other mechanical and optical properties tests to prove it. The challenge would be to
use a shredder and an injection moulding machine that has only been used for the Bi-
oscreen HC product so no unwanted material or contaminants would be able to harm the
quality of the product. When the recycled Bioscreen HC product has been produced it
would undergo the same quality routine check, as the normal product would do in order
84
to find any possible errors or quality absences. If no such error would be found the next
step would be to inform customers to test if the recycled product had any effect on the
end result.
REFERENCES
Akul, Mehta. 2011. Ultraviolet-Visible (UV-ViS) Spectroscopy − Principle. Available
from link: http://pharmaxchange.info/press/2011/12/ultraviolet-visible-uv-vis-
spectroscopy-principle/ Accessed 04.05.2013.
Alliance of Foam Packaging Recyclers. 2009. PS: Think Recycling. Available from link:
http://www.drewfoam.com/PDFs/RecycleHowTo_hr.pdf Accessed 08.02.2014.
Aznar, M.P, Caballero, M.A, Sancho, J.A, Francs, E. 2006, Plastic waste elimination by
co-gasification with coal and biomass in fluidized bed with air in pilot plant. Available
from link: http://rshanthini.com/tmp/CP307/cogasification.pdf Accessed 12.02.2014.
BPF Recycling Group. 2014. Expanded Polystyrene (EPS) and the Environment. Avail-
able from link: http://www.eps.co.uk/pdfs/eps_and_the_environment.pdf Accessed
09.02.2014.
Broadwith, Philip. 2012. Available from link:
http://www.rsc.org/chemistryworld/2012/10/continuous-polystyrene-recycling Accessed
05.02.2014.
Carl Zeiss MicroImaging GmbH. Dr. Michael Zölffel. The Clean Microscope. Available
from link:
http://applications.zeiss.com/C125792900358A3F/0/3C1DAE76330E42F7C12579EC0
028F56B/$FILE/50-1-0025_the_clean_microscope_e.pdf Accessed 12.2.2014.
Carl Zeiss MicroImaging GmbH. Microscopy from Carl Zeiss. Axio Scope. Available
from link:
http://applications.zeiss.com/C125792900358A3F/0/2E85DC644423F238C1257906004
7CEE4/$FILE/60-2-0004_e.pdf Accessed 12.2.2014.

85
Carl Zeiss MicroImaging GmbH. 2013. Available from link:
http://microscopy.zeiss.com/microscopy/en_de/products/microscope-
components/objectives.html Accessed 29.10.2013.
Wikipedia, Deformation (Mechanics) 2013. Available from link:
http://en.wikipedia.org/wiki/Deformation_(mechanics) Accessed 10.10.2013.
Crude oil calorific value. Available from link: http://www.jatrofuels.com/170-0-
Calorific+Values.html Accessed 07.02.2014.
Edshammar, Lars-Erik. Plastforum Nordica. 2012, Plast handboken – en materialguide
för industrin, 263 pages.
HunterLab. 2008. Insight on Color – CIE L*a*b Color Scale. Available from link:
http://www.hunterlab.se/wp-content/uploads/2012/11/CIE-L-a-b-.pdf. Accessed
09.02.2014.
Lee, Eung Kee (Richard). 2010. Novel Manufacturing Process for Polymer Bead
Foams. Available from link:
https://tspace.library.utoronto.ca/bitstream/1807/24808/1/Lee_Eung_K_201006_PhD_t
hesis.pdf Accessed 09.02.2014
Lindberg, Anne-Maj and Henrik. Plaster och Gummi. Scanned pages provided from
Fredrik Holst 30.09.13.
Mekalasi OY AB. 2012, Asiakasta Ajatellen. Available from link:
http://www.mekalasi.fi/wp-content/uploads/2013/03/Mekalasi_yritysesite_www.pdf
Accessed 02.05.2013.
Agilent Technologies. Owen, Tony. 2000, Fundamentals of UV-visible spectroscopy.
Available from link:
https://www.chem.agilent.com/Library/primers/Public/59801397_020660.pdf
Accessed 20.05.2013.
Osswald Tim A. Menges, Georg. 2003, Materials science of polymers for engineers.
Second edition, 622 pages.

86
(Opacity) New Oxford American Dictionary 3rd edition © 2010 by Oxford University
Press, Inc.
S.M. Al-Salem, P. Lettieri, J. Bayens. 2009. Recycling and recovery routes of plastic
solid waste (PSW): A review. 19 pages. Available from link:
http://www.sciencedirect.com/science/article/pii/S0956053X09002190 Accessed
10.05.2013.
Strong, A. Brent. 2006, Plastics: Materials and Processing, third edition, 917 pages.
The Center of Excellence for Regenerative Health Biotechnology (CERHB). 2003.
Available from link: http://www.cerhb.ufl.edu/pdf/edcenter/cleanroom_basics.pdf Ac-
cessed 04.05.2013.
Ulf, Bruder. 2010, Värt att veta om plast, 81 pages. Available from link:
http://www.plastkemiforetagen.se/SiteCollectionDocuments/PUB_Ebok.pdf Accessed
25.04.2013.
Undri, Andrea, Feridani, Marco, Rosi, Luca, Frediani, Piero. 2013. Reverse polymeriza-
tion of waste polystyrene through microwave assisted pyrolysis. Available from link:
http://www.sciencedirect.com/science/article/pii/S0165237013002143 Accessed
20.01.2014.
Vernon, Luke. 2011. Why All Plastic Containers Can’t be Recycled. Available from link
http://ecoramblings.com/why-all-plastic-containers-cant-be-recycled/ Accessed
05.02.2014.
Z Xiaobo, Z Jiewen, MJW Povey, M Holmes, M Hanpin. Anal. Chim. Acta. 2010. Var-
iables selection methods in near infrared spectroscopy, 667 pages.
FIGURES
Figure 3:
http://www2.dupont.com/Plastics/en_US/Products/Zytel_HTN/Zytel_HTN_whitepaper
_R8.html Accessed 10.05.2013.
Figure 4:
87
http://textbooks.elsevier.com/manualsprotectedtextbooks/9780750663809/Static/polym
ers/polymers2b.html Accessed 10.05.2013.
Figure 5 and 6:
http://www.chemtube3d.com/polymer/_PolystyreneF.html Accessed 04.10.2013.
Figure 7: http://en.wikipedia.org/wiki/Polystyrene Accessed 11.04.2013.
Figure 8:
http://en.wikipedia.org/wiki/File:Brittle_v_ductile_stress-strain_behaviour.png
Accessed 04.10.2013.
Figure 9: http://ecoramblings.com/why-all-plastic-containers-cant-be-recycled/
Figure 27: http://cellbiologyolm.stevegallik.org/node/7 Accessed 29.10.2013.
INTERVIEWS
Holst, Fredrik. 2013. Provided information about typical properties of PS and possible
use for recycled PS.
Henionen, Joni. Masamuovi Oy. 2013. Interview and talked about recycle possibilities
of solid PS.
Kantola, Mika. 2013. Interview of the recycle possibilities of solid PS.
Answer to interview as person A. Asserted to be anonym. 2013. Interview of the recycle
possibilities of solid PS.
Answer to interview as person B. Asserted to be anonym. 2013. Interview of the recycle
possibilities of solid PS.

88
APPENDIX I/I (9)
Figure 46 Technical data sheet of GPPS STYRON 678E (Styron 2012)

89
APPENDIX II/II (9)
APPENDIX III/III (9)
Start-up
Heat barrel and mold sufficiently before starting screw.
Heat system from outlet to inlet.
Open hopper slide gate slowly or fill hopper slowly to avoid bridging.
Allow proper drying/preheating temperature and time for material supply.
Purge old material from barrel.
Run a few manual cycles before engaging automatic controls.
Start mold cooling system.
Ensure proper barrel/sprue bushing seal and alignment.
Inspect electrical wires and connectors.
Inspect water and hydraulic hoses, connections.
Perform necessary mold release application.
Figure 47 All tests from tensile test from 5 mm/min in graph
Figure 48 All tests from tensile test from 50 mm/min in graph

90
Inspect mold for damage.
Ensure proper mold clamping pressure, sealing.
Steady-state
Maintain recommended lubrication/release of mold and moving parts.
Adjust temperature as needed.
Keep hopper full, or ensure an unblocked supply hose for the pellets.
Shutdown
Retract injection unit.
Close slide gate on hopper or run hopper empty of pellets.
Purge barrel of molten material.
Run barrel and mold cooling until fully cooled.
Safety
Always set safety interlock before reaching into mold area.
Be cautious of hot resin ejected during purge or flowchecks.
Do not look into nozzle opening.
(Strong 2006: 861, 862)
APPENDIX IV/IV (9)
By knowing the principals of inverse calculation the procedure should follow the same
pattern as the equation below.
� × � = 1
� = 1�
� = 1�
Below follows a calculation proving that Transmission is the inverse of Absorption that
is used in the Transmission section by formula [5].

91
& = ��� = 10'()*
Both sides are inverted using �'+ = ,-.
1& = 1
10'()*
(&)', = (10'()*)',
Multiplying buy using (�/)+ =�/∙+
1& =10()*
Both side are added with the logarithmic equation
��� 11&2 = ���10'()*
”log10-εlc ” is the same as εlc which gives the formula for absorption
� = ��� 11&2 = ��

92
APPENDIX V/V (9)
Figure 49 Image recording with 5x magnification (Jonas Eklöf)
Figure 50 Same images as figure 49 but with other transmission parameters (Jonas Eklöf)

93
Figure 51 Image 49 but with 10x magnification and more transmission intensity (Jonas Eklöf)
Figure 52 Microscope image recording with 10x intensity (Jonas Eklöf)

94
Figure 53 Microscope image recording with 10x transmission intensity (Jonas Eklöf)
Figure 54 Microscope image recording with 10x and high transmission intensity (Jonas Eklöf)

95
Figure 55 Microscope image recording with 10x intensity (Jonas Eklöf)
Figure 56 Microscopy image recording with 10x magnification (Jonas Eklöf)

96
Figure 57 Microscope image recording with 10x magnification (Jonas Eklöf)


![Finale 2003 - [Untitled3]](https://static.fdokumen.com/doc/165x107/63186635cf65c6358f01f7b4/finale-2003-untitled3.jpg)