REPORT FINALE - Comune di Castiglione della Pescaia
159
1 REPORT FINALE 2°Anno Il problema emergente delle microplastiche nel Mar Mediterraneo: il potenziale impatto sulla balenottera comune come modello di “descrittore ambientale” M. Cristina Fossi Silvia Casini, Cristina Panti, Letizia Marsili, Ilaria Caliani, Daniele Coppola, Matteo Giannetti, Matteo Baini, Cristiana Guerranti, Tommaso Campani, Roberta Minutoli Università di Siena, Dipartimento di Scienze Fisiche, della Terra e dell’Ambiente, Siena, Italia [email protected]
-
Upload
khangminh22 -
Category
Documents
-
view
0 -
download
0
Transcript of REPORT FINALE - Comune di Castiglione della Pescaia

1
REPORT FINALE 2°Anno
Il problema emergente delle microplastiche nel Mar Mediterraneo: il potenziale impatto sulla balenottera comune come modello
di “descrittore ambientale”
M. Cristina Fossi
Silvia Casini, Cristina Panti, Letizia Marsili, Ilaria Caliani, Daniele Coppola, Matteo Giannetti, Matteo Baini, Cristiana Guerranti, Tommaso Campani, Roberta Minutoli
Università di Siena, Dipartimento di Scienze Fisiche, della Terra e dell’Ambiente, Siena, Italia

2
Indice Premesse pag. 3 1. Metodologie utilizzate pag. 4 2. Aree ed attività di campionamento pag. 12 3. Risultati e discussioni pag. 31 4. Considerazioni conclusive pag. 70 5. Bibliografia pag. 86 Annesso 1 Annesso 2

3
PREMESSE A seguito degli importanti risultati conseguiti dallo svolgimento del primo anno del progetto, in riferimento al riconoscimento dell’importanza di tali indagini sullo scenario internazionale come confermato dal comitato scientifico dell’International Whaling Commission (Panama 2012, Woods Hole 2013, St. Andrews 2014) e come confermato dalla necessità di implementare il Descrittore 10 (Marine Litter) della Direttiva Quadro della Strategia Marina Europea, si è ritenuto essenziale lo sviluppo di un secondo anno di attività del progetto sui seguenti aspetti:
a) Raccolta di un numero superiore di campioni di microplastiche in un area più vasta del Santuario Pelagos che comprenda le aree del:
- Mar Ligure - Mar di Sardegna - Mar Tirreno (Arcipelago Toscano)
b) Individuazione e conteggio delle macroplastiche superficiali in aree di indagine del Santuario Pelagos;
c) Sviluppo di tecniche diagnostiche più specifiche per evidenziare la presenza di microplastiche in individui planctonici e neustonici (rilevamento con tecniche di microscopia ottica e microscopia elettronica a scansione e trasmissione);
d) Campionamento di biopsie cutanee di balenottere comuni free-ranging e relative indagini ecotossicologiche nell’area del Santuario Pelagos;
e) sviluppo di nuovi biomarkes su individui free-ranging di varie specie di cetacei (oltre alla balenottera comune) specifici per individuare la presenza e gli effetti degli additivi delle plastiche (in particolare ftalati).

4
1
METODOLOGIE UTILIZZATE

5
1. METODOLOGIE
A) RACCOLTA E CARATTERIZZAZIONE DI CAMPIONI DI MICROPLASTICHE (SUPERFICIALI E COLONNA D’ACQUA) IN SOTTO-AREE DEL SANTUARIO PELAGOS CHE COMPRENDONO LE ZONE DEL:
- Mar Ligure - Mar di Sardegna - Mar Tirreno (Arcipelago Toscano)
Campionamento microplastiche e plancton superficiale I campionamenti vengono effettuati con retino conico standard WP2 (bocca con anello metallico tondo da 57 cm di diametro, lunghezza 2,60 m circa, vuoto di maglia da 200 µm) equipaggiato con flussimetro per la stima dei metri cubi di acqua filtrata.
Fig.1. Retino conico standard WP2 con flussimetro.
Metodologia di prelievo Il campionamento viene eseguito con imbarcazione in movimento: il retino è calato sotto la superficie dell’acqua e viene trainato alla velocità di 1,5 nodi per 15 minuti. Il retino una volta salpato, deve essere sciacquato dalla bocca verso il bicchiere, con getto d’acqua salata a pressione al fine di convogliare il materiale verso la parte terminale del retino (bicchiere di raccolta). Tempo necessario per ogni retinata: 25-30 minuti Trattamento campioni a bordo: per ogni retinata il campione raccolto è portato al volume di due litri e suddiviso in due sub-aliquote da 1 litro ciascuna, una filtrata su garza con stesso vuoto di maglia del retino ed immediatamente congelata per successive analisi di accumulo contaminanti, l’altra fissata in acqua di mare e formalina tamponata al 4% per successive analisi quali- quantitative.
Campionamento mesozooplancton verticale Il campionamento di microplastiche e plancton nella colonna d’acqua è stato eseguito con retino conico standard WP2 (bocca con anello metallico tondo da 57 cm di diametro, lunghezza 2,60 m circa, vuoto di maglia da 200 µm) equipaggiato con flussimetro per la stima dei metri cubi di acqua filtrata.
Metodologia di prelievo: il campionamento viene eseguito con imbarcazione ferma. Il retino viene calato manualmente sino alla profondità di 50 m e recuperato alla velocità di 1m/s. Il retino deve

6
poi sciacquato dalla bocca verso il bicchiere, con getto d’acqua a pressione al fine di convogliare il materiale verso la fine della rete. Tempo necessario per ogni retinata: 2-3 minuti Trattamento campioni a bordo: il campione raccolto è portato al volume di due litri e suddiviso in due sub-aliquote da 1 litro ciascuna, una filtrata su garza con stesso vuoto di maglia del retino ed immediatamente congelata per successive analisi di accumulo contaminanti, l’altra fissata in acqua di mare e formalina tamponata al 4% per successive analisi quali-quantitative.
B) INDIVIDUAZIONE E CONTEGGIO DELLE MACROPLASTICHE SUPERFICIALI NELLE SUDDETTE AREE DI INDAGINE DEL SANTUARIO PELAGOS CHE COMPRENDE LE AREE DEL:
- Mar Ligure - Mar di Sardegna
Seguendo uno specifico piano di campionamento è stato eseguito un monitoraggio qualitativo e quantitativo delle macroplastiche rilevate sulla superficie del mare. I dati verranno successivamente elaborati in termini quantitativi, dimensionali, qualitativi. Di seguito viene riportata la metodologia utilizzata, derivata da un esame critico delle principali metodologie utilizzate a livello internazionale.

7
Messa a punto del protocollo “Survey e monitoraggio del marine litter in mare”
La metodologia più utilizzata per la quantificazione ed il monitoraggio dei rifiuti marini galleggianti è l'osservazione visiva dalle imbarcazioni. I risultati ottenuti tramite questa metodologia sono fortemente dipendenti dall’obiettivo della campagna di monitoraggio, dall'osservatore, dal protocollo utilizzato, dall’imbarcazione e dalle condizioni meteo-marine di osservazione. Poiché i risultati dipendono da tutti questi diversi fattori esterni, il confronto tra diverse indagini e le valutazioni di tendenza sono difficili da effettuare. L’utilizzazione di protocolli condivisi per la segnalazione e la registrazione dettagliata sia delle condizioni di osservazione, sia degli avvistamenti sono, di conseguenza, molto importanti. Esistono alcune linee guida e pubblicazioni scientifiche che forniscono diversi approcci per la quantificazione dei rifiuti marini e sottolineano le difficoltà di raccolta dei dati e l’applicazione di una metodologia robusta per l’ottenimento di dati universalmente comparabili. Le linee guida UNEP (Cheshire et al., 2009) descrivono come un monitoraggio dettagliato può essere effettuato in aree ristrette (5 x 5 km) attraverso indagini dedicate, oppure le indagini possono essere effettuate lungo transetti. Questa metodologia è utilizzata principalmente quando si utilizzano navi impiegate per scopi diversi e messe a disposizione per questo tipo di monitoraggio. La US National Oceanographic and Atmospheric Administration (NOAA) ha sviluppato un protocollo denominato “Shipboard Observation Form for Floating Marine Debris” (Arthur et al., 2011). Questo protocollo si basa sull’esperienza acquisita dal NOAA nei precedenti studi condotti sui rifiuti galleggianti marini. L'obiettivo di questo metodo è quello di essere in grado di calcolare la densità dei rifiuti marini all'interno dell'area attraversata dal transetto, utilizzando una versione leggermente modificata della formula usata da Matsumura e Nasu (1997), Shiomoto e Kameda (2005) e Thiel et al. (2003). L'identificazione e la classificazione corretta degli oggetti galleggianti può essere difficile, per questo, sono stati proposti sistemi di classificazione semplificati. Il sistema di classificazione operato dovrebbe essere compatibile con quello riportato nel Descrittore 10 della EU MSFD (Task Group D10, EUR 25009 EN – 2011). Nell’ambito del presente progetto è stato effettuato un monitoraggio dei rifiuti galleggianti nelle aree del Santuario Pelagos sfruttando sia le imbarcazioni utilizzate per la raccolta delle biopsie cutanee di cetacei e campioni di plancton e microplastiche, sia navi di opportunità che seguivano transetti predefiniti. L’osservazione è stata effettuata a prua dell’imbarcazione (ove possibile) con le spalle rivolte al sole e solamente in condizioni meteo-marine ottimali (mare calmo e visibilità buona). Sono state presi in considerazione i rifiuti galleggianti osservati entro i 20 metri dall’imbarcazione, poiché ad una distanza maggiore gli oggetti sono difficilmente classificabili. L’avvistamento, senza l’utilizzo del binocolo, è stato effettuato cambiando ogni 30 minuti l’osservatore per evitare l’affaticamento dell’operatore. La scheda utilizzata per la raccolta dei dati (vedi Tab.1) è stata ripresa e modificata dal protocollo NOAA (NOAA Form 57-11-14 (6-12)). All’inizio del turno di avvistamento l’operatore ha compilato la prima parte della scheda (data, orario, coordinate, ecc.) e sono state annotate le condizioni meteo-marine nelle apposite caselle. Se durante il monitoraggio sono state osservati cambiamenti nelle condizioni meteo-marine, sono state annotate nell’apposita casella. Per ogni oggetto galleggiante (dimensioni superiori a 2,5 cm) è stata posta una crocetta all’interno della categoria di appartenenza. Alla fine dell’attività di avvistamento sono state annotate orario e coordinate. Poiché lo scopo del progetto prevedeva solo il conteggio di macroplastiche, è stata effettuata successivamente un’elaborazione per il calcolo dei rifiuti galleggianti, tenendo in considerazione solo gli oggetti definiti come “plastiche” nella scheda.

8
La densità (D) delle macroplastiche è stata calcolata utilizzando la formula (Hinojosa e Thiel , 2009):
D = N / ( W x L)
N = numero di plastiche osservato W = massima distanza (in km) perpendicolare al transetto osservata
L = lunghezza totale (in km) del transetto
Tab.1. Scheda per monitoraggio macro-litter in mare

9
Fig.2. Macroplastiche galleggianti campionate con evidenti eventi di fouling.
C) SVILUPPO DI TECNICHE DIAGNOSTICHE PIÙ SPECIFICHE PER EVIDENZIARE LA PRESENZA DI MICROPLASTICHE IN INDIVIDUI PLANCTONICI (RILEVAMENTO CON TECNICHE DI MICROSCOPIA OTTICA E MICROSCOPIA ELETTRONICA A SCANSIONE E TRASMISSIONE)
Questo indagine è stata applicata su vari organismi planctonici al fine di individuare la presenza di microplastiche all’interno degli apparati gastro-intestinali degli organismi. Per quanto riguarda l’utilizzo della microscopia elettronica, sono stati utilizzati due tipi di microscopi, il SEM (Scanning Electron Microscope) ed il TEM (Transmission Electron Microscope). Il primo approccio con il TEM, tramite sezioni ultrasottili, fornirà dati ultrastrutturali sulle particelle delle microplastiche e la loro localizzazione tissutale. Il secondo approccio, attraverso l’utilizzo del SEM (visione dei campioni a risoluzione più bassa) servirà, mediante rilevatori di elettroni retrodiffusi, a calcolare le quantità relative di queste particelle nei tessuti scelti come target. La principale difficoltà di questo tipo di indagine sarà quella di mettere a punto una metodologia ed un protocollo per la scelta del tessuto target e la preparazione del campione sul quale poi indagare la presenza delle microplastiche. Fino ad oggi, i pochi studi presenti su specie marine riguardano principalmente invertebrati filtratori quali i bivalvi nei quali è stata notata, tramite microscopia elettronica, la presenza di microplastiche, tuttavia mancano dati sugli organismi planctonici che risultano di maggiore interesse in ambiente pelagico.
D) CAMPIONAMENTO DI BIOPSIE CUTANEE DI BALENOTTERE COMUNI (ED ALTRE SPECIE DI CETACEI) FREE-RANGING E RELATIVE INDAGINI ECOTOSSICOLOGICHE NELLA’AREA DEL SANTUARIO PELAGOS
Le biopsie cutanee di cetacei sono un materiale biologico particolarmente idoneo per la stima del rischio ecotossicologico di cetacei free-ranging (Fossi et al., 2010). In questo progetto vengono utilizzate biopsie cutanee come strumento per una diagnosi della presenza e degli effetti dei derivati delle microplastiche (es. ftalati) e contaminanti persistenti da esse veicolati (POPs - OCs) nella popolazione mediterranea di balenottera comune ed in altre specie di cetacei (odontoceti).
Tecnica di campionamento della biopsia cutanea: campioni di epidermide, derma e grasso sottocutaneo sono stati ottenuti da esemplari di B. physalus free-ranging usando una balestra e dardi modificati con una punta da biopsia in alluminio (0.9 cm di diametro, 4.0 cm di lunghezza) e un galleggiante. E’ stata utilizzata una balestra Barnett Wildcat (150 libre). Per evitare la possibilità di trasmissione di infezioni batteriche o virali tra diversi animali e cross-contaminazione dei campioni, la punta da biopsia è stata sterilizzata tutte le volte prima di effettuare il campionamento. E’ stata prestata particolare attenzione a prelevare i campioni di biopsia in prossimità della pinna dorsale e sempre nella stessa parte del corpo dell’animale. La procedura di

10
avvicinamento all’animale consiste nell’approcciare l’esemplare ad una velocità da bassa a moderata e sparare il dardo ad una distanza di circa 20-50 m. La biopsia cutanea viene posta immediatamente in azoto liquido o in mezzo per colture organotipiche (CITES Nat. IT025IS, Int. CITES IT 007).
Fig.3. Campionamento di biopsie di balenottera comune durante le campagne nel Santuario Pelagos.
E) INDAGINI ECOTOSSICOLOGICHE SU BIOPSIE CUTANEE E CAMPIONI DI PLANCTON PRELEVATI NELL’AREA DEL SANTUARIO PELAGOS
Valutazione dei livelli dei contaminanti di natura antropica: la stima dei livelli dei contaminanti nella specie target rappresentano un importante parametro di esposizione; questi dati possono essere correlati ai dati provenienti dalle risposte dei biomarker per una valutazione completa dello stress tossicologico della specie. Dato che i cetacei accumulano alte concentrazioni di composti tossici come ftalati, bisefenolo A, idrocarburi policiclici aromatici (IPA), composti organoclorurati (OC) e ritardanti di fiamma brominati (BFR), alcuni di questi contaminanti sono stati analizzati nei campioni di biopsia cutanea dei cetacei e nei campioni di plancton attraverso specifiche metodologie analitiche ottimizzate per le diverse matrici biologiche.
Marcatori diagnostici per l’esposizione ai contaminanti: le isoforme del citocromo P450 (CYP1A/CYP2B) e il recettore per i composti arilici (Aryl Hydrocarbon Recetor – AHR) sono marcatori di esposizione ai contaminati di natura antropica come IPA, OC, BFR. L’AHR ha un ruolo fondamentale nella regolazione della trascrizione dell’mRNA delle isoforme del CYP in risposta al legame del recettore con gi IPA, composti alogenati aromatici e composti diossino-simili. I loro livelli di espressione (sia genica che proteica) sono stati analizzati nelle biopsie cutanee mediante PCR Real Time quantitativa (qRT-PCR) e Western Blot (WB).

11
Marcatori diagnostici per alterazioni nella riproduzione: molti dei meccanismi legati ad eventi di distruzione endocrina sono mediati da recettori (per esempio la modulazione degli steroidi avviene attraverso i recettori per gli estrogeni/androgeni o tramite cross-talk dei recettori con l’AHR). È quindi estremamente importante studiare nell’ambito di questo progetto la modulazione dell’espressione di tali recettori in risposta ai contaminanti derivati dalle microplastiche della quale è nota la potenzialità di distruttori endocrini (ftalati, bisfenolo A, ritardanti di fiamma). I marcatori di alterazione delle capacità riproduttive (recettore per gli estrogeni – ER) sono stati analizzati mediante qRT-PCR.
Marcatori diagnostici di stress generale: la pelle dei cetacei è esposta ad un insieme di stress ambientali e antropici; biomarker di stress generali sono quindi essenziali per definire lo stato di salute generale dell’organismo. La perossidazione lipidica comprende una serie di reazioni a catena da parte dei ROS dovuta ai loro doppi legami ed è il risultato delle interazioni dei radicali lipidici e/o della formazione di specie non radicaliche da radicali lipidici perossidati. La maggior parte dei prodotti di questo processo sono tossici e mutageni attivi. La perossidazione lipidica è stata valutata nelle biopsie cutanee misurando i livelli di MDA (malondialdeide) mediante test spettrofotometrici.
Realizzazione di esperimenti ex-vivo: è stata indagata la sensibilità e specificità dello strumento diagnostico multidisciplinare (descritto precedentemente) in colture organotipiche di biopsie da esemplari free-ranging di balenottera comune e di altre specie di cetacei esposte a concentrazioni crescenti di miscele di ftalati e bisfenolo A.

12
2
AREE ED ATTIVITA’ DI CAMPIONAMENTO

13
2. AREE ED ATTIVITA’ DI CAMPIONAMENTO
Nell’ambito del 2° anno di attività del progetto sono state svolte 4 campagne di campionamento con tempistiche diverse ed in varie aree del Santuario Pelagos:
1° Campagna – Mar Tirreno (Arcipelago Toscano)
2° Campagna – Mar di Sardegna 3° Campagna – Mar Ligure
4° Campagna – Mar Tirreno (Arcipelago Toscano)
Le attività di campionamento comprendevano:
Campionamenti di plancton e microplastiche superficiali
Campionamenti di plancton e microplastiche nella colonna d’acqua
Campionamenti di biopsie cutanee in esemplari di balenottera comune free-ranging Campionamenti di biopsie cutanee in altre specie di cetacei free-ranging
Monitoraggio macroplastiche

14
1° Campagna – Mar Tirreno (Arcipelago Toscano)
La prima campagna (parte terminale del primo anno del progetto), della durata di 4 giorni, si è svolta nell’area del Mar Tirreno (Arcipelago Toscano). Lo scopo principale di questa campagna è stato quello di realizzare la seguente tipologia di campionamento:
Campionamenti di plancton e microplastiche superficiali
Di seguito vengono riportati in dettaglio le tempistiche della prima campagna, l’area percorsa, le miglia percorse, il numero e la localizzazione dei campionamenti di plancton e microplastiche effettuati, il numero e la localizzazione degli avvistamenti di esemplari di cetacei ed il numero e la localizzazione delle biopsie effettuate.
Inizio attività: 11 Dicembre 2012 (ore 09:00) Fine attività: 13 Dicembre 2012 (ore 16:00) Miglia percorse: 109 miglia percorse di cui on-effort 97,90 Campionamenti di plancton e microplastiche: 8 retinate superficiali
Tab. 2. Retinate nel Mar Tirreno (Arcipelago Toscano)(Dicembre 2012).
CAMPIONAMENTO TIPO NUMERO COORDINATE
Retinata plancton Superficiale MPM46 N42 27.516 E11 05.840
Retinata plancton Superficiale MPM47 N42 25.066 E11 00.443
Retinata plancton Superficiale MPM48 N42 22.611 E10 55.509
Retinata plancton Superficiale MPM49 N42 22.611 E10 55.509
Retinata plancton Superficiale MPM50 N42 15.428 E11 05.111
Retinata plancton Superficiale MPM51 N42 22.795 E11 19.418
Retinata plancton Superficiale MPM52 N42 22.265 E11 15.422
Retinata plancton Superficiale MPM53 N42 22.706 E11 05.589
Di seguito viene riportata la restituzione grafica mediante mappa dedicata dei campionamenti di plancton e microplastiche superficiali svoltisi nella campagna del Dicembre 2012 nel Mar Tirreno (Fig.4).

15
Fig.4. Restituzione grafica mediante mappa dedica dei campionamenti di plancton e microplastiche superficiali Mar Tirreno (Dicembre 2012).
Viste le pessime condizioni meteo marine riscontrate nel periodo della prima campagna di campionamento in Mar Tirreno (Dicembre 2012) si è realizzato un’ulteriore campagna di campionamento nell’area del Mar Tirreno (4° campagna, Novembre 2013) della quale i dettagli sono stati riportati successivamente.
Campionamento di biopsie cutanee nella specie target (Balenottera comune)
Viste le pessime condizioni meteo marine riscontrate nel periodo della prima campagna di campionamento in Mar Tirreno (Dicembre 2012) non si era potuto realizzare nessun avvistamento e campionamento della specie target ne’ di altre specie di interesse.
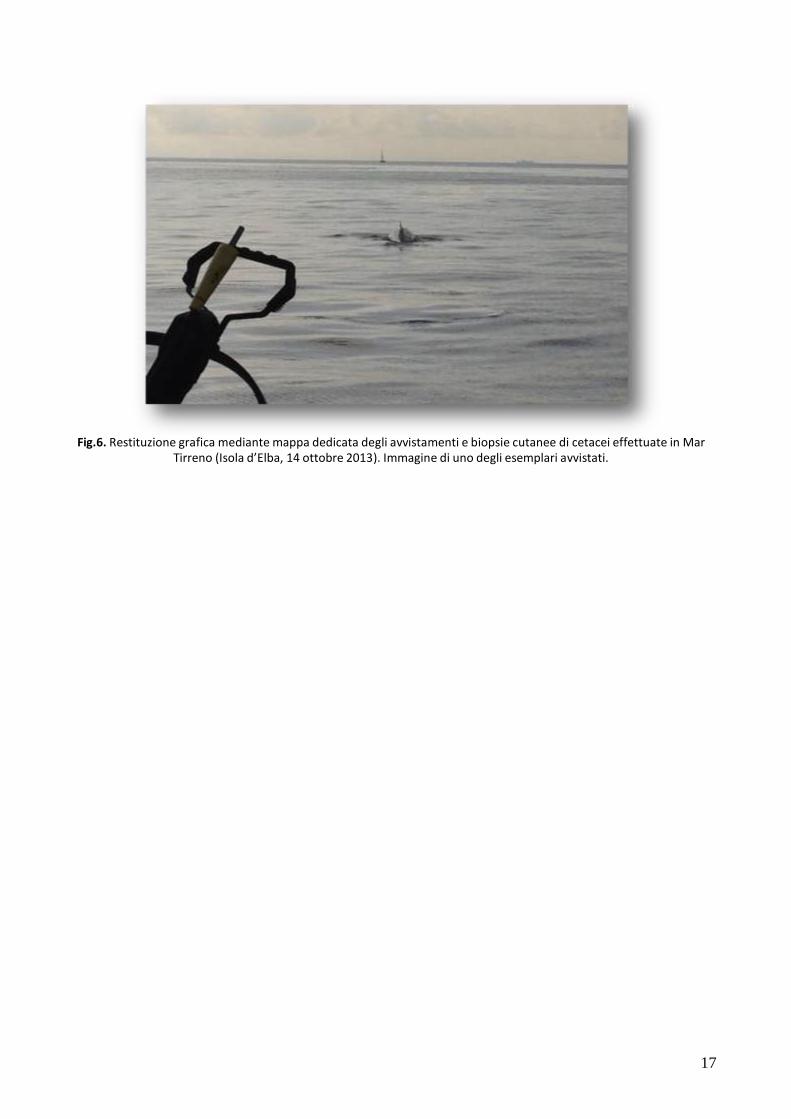
In data 14/10/2013 a seguito di una segnalazione della Capitaneria di Porto di Portoferraio della presenza nella rada di due esemplari di balenottera (presumibilmente balenottera comune), 4 ricercatori dell’Università di Siena si sono tempestivamente recati nella zona di segnalazione dopo una consultazione con il personale della Divisione IV del MATTM. Dopo non aver riscontrato la presenza dei due esemplari nella zona di segnalazione, i ricercatori dell’Università di Siena hanno realizzato, con l’appoggio della Capitaneria di Porto, un survey dell’area esterna alla rada di Portoferraio ed hanno, dopo due ore di navigazione, localizzato i due esemplari (uno dei quali presentava estesa parassitosi) e hanno realizzato una biopsia su uno dei due individui (Tab. 3, Fig. 6). Il campione oltre alle analisi ecotossicologiche prefissate, è stato sottoposto anche ad analisi genetica per l’identificazione della specie tramite l’analisi del DNA mitocondriale. Il gene cytochrome c oxidase subunit I (COXI) è stata isolato e sequenziato nel campione da determinare e contemporaneamente in altri due esemplari del genere Balaenoptera la cui specie era nota. In particolare, un esemplare di B. physalus e un esemplare di B. bridey (in quanto quest’ultima specie sister group della B. borealis). Sebbene l’animale campionato avesse presentato caratteristiche comportamentali e morfologiche atipiche per la balenottera comune, le analisi hanno evidenziato un’omologia della sequenza del 100% con la specie B. physalus (Fig. 5).

16
Fig.5. Risultato dell’identificazione della specie campionata in Mar Tirreno (Isola d’Elba, 14 ottobre 2013) mediante il database BOLD (http://www.boldsystems.org/).
Tab. 3. Avvistamento di cetacei e biopsie cutanee effettuati all’Isola d’Elba.
SPECIE AVVISTAMENTI BIOPSIE DATA COORDINATE
Balaenopetera physalus 2 1 14/10/2013 N42 53.007 E10 13.745
17
Fig.6. Restituzione grafica mediante mappa dedicata degli avvistamenti e biopsie cutanee di cetacei effettuate in Mar
Tirreno (Isola d’Elba, 14 ottobre 2013). Immagine di uno degli esemplari avvistati.

18
2° Campagna - Mar di Sardegna
La seconda campagna, della durata di 10 giorni, si è svolta nell’area del Mar di Sardegna. Lo scopo principale di questa campagna è stata quella di realizzare cinque attività diverse:
Campionamenti di plancton e microplastiche superficiali
Campionamenti di plancton e microplastiche nella colonna d’acqua Campionamenti di biopsie cutanee in cetacei free-ranging
Campionamenti di eufasiacei
Monitoraggio delle macroplastiche
Di seguito vengono riportati in dettaglio le tempistiche della campagna, l’area percorsa, le miglia percorse, il numero e la localizzazione dei campionamenti di plancton e microplastiche effettuati, il numero e la localizzazione degli avvistamenti di esemplari di cetacei ed il numero e la localizzazione delle biopsie effettuate.
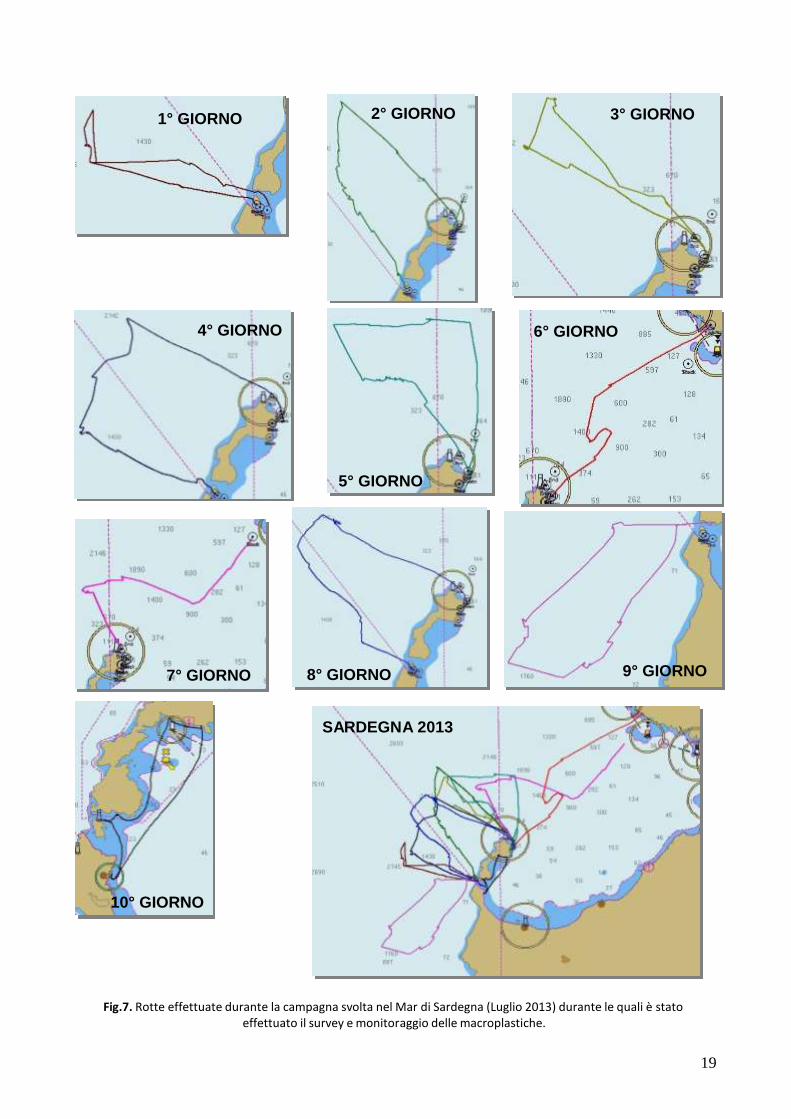
Inizio attività: 08 Luglio 2013 (ore 11:30) Fine attività: 17 Luglio 2013 (ore 12:00) Miglia percorse: 492.88 miglia percorse di cui on-effort 440.72 Campionamenti di plancton e microplastiche: 14 retinate superficiali e 2 retinate notturne Avvistamenti di cetacei: n° 8 (gruppi) Stenella coeruleoalba, n° 1 Balaenoptera physalus, n° 5 (gruppi) Tursiops truncatus, n° 2 Grampus griseus e n° 2 (gruppi) Delphinus delphis Campionamenti effettuati: 32 biopsie Stenella coeruleoalba, 1 biopsia Balaenoptera physalus, 2 biopsie Tursiops truncatus, 1 biopsia Grampus griseus e 4 biopsie Delphinus delphis
19
1° GIORNO 2° GIORNO 3° GIORNO
4° GIORNO 6° GIORNO
5° GIORNO
7° GIORNO
8° GIORNO 9° GIORNO
SARDEGNA 2013
10° GIORNO
Fig.7. Rotte effettuate durante la campagna svolta nel Mar di Sardegna (Luglio 2013) durante le quali è stato effettuato il survey e monitoraggio delle macroplastiche.

20
Campionamenti di plancton e microplastiche superficiali e campionamenti nella colonna d’acqua
Durante la campagna di campionamento di Luglio 2013 sono stati condotti 15 campionamenti superficiali ed un campionamento nella colonna d’acqua. Visto i numerosi campionamenti sia superficiali che verticali condotti nella stessa area nella campagna del 2012, si è ritenuto più produttivo in questo secondo anno di attività intensificare i campionamenti in altre aree fino al 2012 non esplorate (vedi sopra). Inoltre, come dimostrato da numerosi lavori su questo argomento ed anche dall’unico lavoro nel Mediterraneo da noi realizzato grazie al finanziamento del primo anno (Fossi et al. 2012), la presenza di microplastiche è rilevante nei primi centimetri superficiali ed estremamente rarefatta nella colonna d’acqua, per questo motivo i campionamenti nella colonna d’acqua sono stati in numero inferiore rispetto a quelli superficiali in questa area.
SARDEGNA
Fig.8. Mappa dei campionamenti di plancton e microplastiche superficiali. In rosso i punti dove sono state effettuate le retinate superficiali di giorno, in blu è evidenziato il punto delle retinate notturne (campionamento eufasiacei).
Tab. 4. Retinate (superficiali e colonna d’acqua) nel Mar di Sardegna (Luglio 2013).
CAMPIONAMENTO TIPO NUMERO COORDINATE
Retinata plancton Superficiale MPM55 N41 01.601 E7 54.868
Retinata plancton Superficiale MPM56 N40 59.656 E8 04.200
Retinata plancton Superficiale MPM57 N41 08.763 E8 04.378
Retinata plancton Superficiale MPM58 N41 09.890 E8 17.529
Retinata plancton Superficiale MPM59 N41 18.771 E8 04.902
Retinata plancton Superficiale MPM60 N41 14.464 E8 02.005
Retinata plancton Superficiale MPM61 N40 59.025 E8 13.259
Retinata plancton Superficiale MPM62 N41 19.381 E8 16.903
Retinata plancton Superficiale MPM63 N41 11.109 E8 30.101
Retinata plancton Superficiale MPM64 N41 22.187 E8 33.116
Retinata plancton Superficiale MPM65 N41 20.342 E8 43.425
Retinata plancton Superficiale MPM66 N40 49.707 E7 51.122
Retinata plancton Superficiale MPM67 N40 47.618 E8 01.834
Retinata plancton Superficiale MPM68 N40 59.683 E8 17.573
Retinata plancton Superficiale (Notturna) MPM N40 58.824 E8 10.793
Retinata plancton Verticale (Notturna) MPP N40 58.863 E8 10.162

21
Campionamenti di biopsie cutanee in cetacei free-ranging
Tab. 5. Tabella riassuntiva degli avvistamenti e campionamenti (biopsie cutanee) di cetacei in Mar di Sardegna (Luglio 2013).
SPECIE AVVISTAMENTI DATA n° BIOPSIE COORDINATE
Stenella coeruleoalba 25 esemplari 08/07/2013 2 N41 03.445 E7 53.822
Balaenoptera physalus 3 esemplari 09/07/2013 1 N41 17.776 E8 01.945
Stenella coeruleoalba 10 esemplari 09/07/2013 2 N41 14.701 E8 11.398
Tursiops truncatus 10 esemplari 09/07/2013 - N40 59.726 E8 11.539
Grampus griseus 2 esemplari 09/07/2013 - N41 11.318 E8 15.696
Stenella coeruleoalba 100 esemplari 10/07/2013 3 N41 10.853 E8 12.432
Stenella coeruleoalba 150 esemplari 10/07/2013 2 N41 10.853 E8 12.432
Tursiops truncatus 5 esemplari 10/07/2013 - N41 07.358 E8 19.987
Tursiops truncatus 15 esemplari 11/07/2013 - N41 05.355 E8 21.553
Stenella coeruleoalba 200 esemplari 12/07/2013 4 N41 14.108 E8 11.950
Tursiops truncatus 5 esemplari 12/07/2013 1 N41 05.885 E8 21.257
Stenella coeruleoalba 200 esemplari 13/07/2013 5 N41 13.974 E8 29.369
Tursiops truncatus 15 esemplari 13/07/2013 - N41 10.421 E8 28.092
Grampus griseus 3 esemplari 13/07/2013 1 N41 10.421 E8 28.092
Stenella coeruleoalba 150 esemplari 14/07/2013 7 N41 18.117 E8 25.136
Tursiops truncatus 3 esemplari 14/07/2013 1 N41 30.084 E8 51.660
Stenella coeruleoalba 100 esemplari 15/07/2013 7 N41 14.615 E8 01.706
Delphinus delphis 25 esemplari 16/07/2013 2 N40 49.582 E8 02.581
Delphinus delphis 20 esemplari 16/07/2013 2 N40 49.783 E8 02.334
Di seguito viene riportata la restituzione grafica mediante mappa dedicata degli avvistamenti di cetacei e relative biopsie effettuati nel Mar di Sardegna (Luglio 2013) (Fig.9)
Fig.9. Restituzione grafica mediante mappa degli avvistamenti di cetacei e relative biopsie effettuate nel Mar di Sardegna (Luglio 2013). Verde: tursiope, rosa: balenottera comune, blu: stenella striata, rosso: grampo, viola: delfino
comune, bianco: capodoglio.

22
Fig.10. Avvistamento di esemplari di delfino comune durante la compagnia di campionamento in Sardegna (16/07/2013).

23
3° Campagna - Mar Ligure
Le campagna svolta nel Mar Ligure è il risultato di tre periodi di attività di campionamento e monitoraggio svoltisi tra agosto e ottobre 2013. Lo scopo principale di questa campagna è stata quella di realizzare:
Campionamenti di plancton e microplastiche superficiali
Campionamenti di plancton e microplastiche nella colonna d’acqua Campionamenti di biopsie cutanee in cetacei free-ranging
Campionamenti di eufasiacei
Monitoraggio delle macroplastiche
Di seguito vengono riportati in dettaglio le tempistiche delle varie attività (agosto-ottobre 2013), l’area percorsa, le miglia percorse, il numero e la localizzazione dei campioni di plancton e microplastiche effettuati, il numero e la localizzazione degli avvistamenti di esemplari di cetacei ed il numero e la localizzazione delle biopsie effettuate.
1-3 Agosto 2013
Inizio attività: 01 Agosto 2013 (ore 12:00) Fine attività: 03 Agosto 2013 (ore 16:00) Miglia percorse: 120 miglia percorse di cui on effort 100,80 Campionamenti di plancton e microplastiche: 1 retinata superficiale Avvistamenti esemplari di cetacei: n° 2 (gruppi) Stenella coeruleoalba e n° 15 esemplari di Balaenoptera physalus Campionamenti effettuati: 2 biopsie Stenella coeruleoalba e 10 biopsie Balaenoptera physalus
1° GIORNO 2° GIORNO 3° GIORNO LIGURIA 2013
Fig.11. Rotte effettuate durante la prima campagna svolta nel Mar Ligure (Agosto 2013) durante le quali è stato effettuato il survey e monitoraggio delle macroplastiche.

24
Campionamenti di plancton e microplastiche superficiali
Durante questo periodo, l’attività si è concentrata sul campionamento delle biopsie cutanee di balenottera comune ed è stato possibile effettuare solamente un campionamento di microplastiche e plancton. Per questo motivo un monitoraggio più ampio si è svolto nei successivi periodi dedicati a questa specifica attività.
Tab. 6 - Retinate per campionamento plancton e microplastiche in Mar Ligure (Agosto 2013).
CAMPIONAMENTO TIPO NUMERO COORDINATE
Retinata plancton Superficiale MPM69 N43 39.571 E7 48.825
Campionamenti di biopsie cutanee in cetacei free-ranging
Tab.7 - Avvistamenti e campionamento cetacei (biopsie cutanee) in Mar Ligure(Agosto 2013).
SPECIE AVVISTAMENTI DATA n° BIOPSIE COORDINATE
Stenella coeruleoalba 30 01/08/2013 2 N43 33.295 E7 53.429
Balaenoptera physalus 15 02/08/2013 10 N43 23.236 E7 57.402
Stenella coeruleoalba 100 03/08/2013 - N43 30.448 E7 58.980
Fig.12. Restituzione grafica mediante mappa degli avvistamenti di cetacei e relative biopsie effettuate nel Mar Ligure (Agosto 2013). Rosa: balenottera comune, blu: stenella striata.
24-27 settembre 2013
Inizio attività: 25 Settembre 2013 (ore 9:00) Fine attività: 27 Settembre 2013 (ore 17:00) Miglia percorse: 196 miglia percorse di cui on effort 98,70 Campionamenti di plancton e microplastiche: 1 retinata superficiale Avvistamenti esemplari di cetacei: n° 30 Stenella coeruleoalba , n° 1 Balaenoptera physalus e n°2 Physeter macrocephalus
I campionamenti di plancton e microplastiche superficiali sono stati condotti grazie all'appoggio della Marina Militare Italiana lungo una rotta che ha attraversato il Santuario Pelagos (Italia-

25
Monaco-Francia , vedi Fig. 13). Durante 3 giorni di navigazione, dal 24 al 27 di settembre, è stata seguita la rotta che unisce Livorno (Italia) con Tolone (Francia).
Fig.13. Rotta Livorno-Tolone.
Lungo tale rotta sono stati effettuati 7 campionamenti di plancton e microplastiche superficiali dei quali i dettagli vengono riportati (Tab. 8, Fig 14).
Tab. 8 - Retinate superficiali e nel Mar di Ligure (Settembre 2013).
CAMPIONAMENTO TIPO NUMERO COORDINATE
Retinata plancton Superficiale MPMM 1 N43 30.144 E10 12.328
Retinata plancton Superficiale MPMM 2 N43 31.861 E09 49.445
Retinata plancton Superficiale MPMM 3 N43 28.376 E09 33.235
Retinata plancton Superficiale MPMM 4 N43 05.985 E07 40.117
Retinata plancton Superficiale MPMM 5 N43 02.376 E07 20.050
Retinata plancton Superficiale MPMM 6 N42 56.066 E06 52.408
Retinata plancton Superficiale MPMM 7 N43 02.993 E06 02.554
Fig.14. Mappa dei campionamenti di plancton e microplastiche superficiali. In rosso i punti dove sono state effettuate le retinate superficiali di giorno, in blu è evidenziato il punto del campionamento degli eufasiacei.
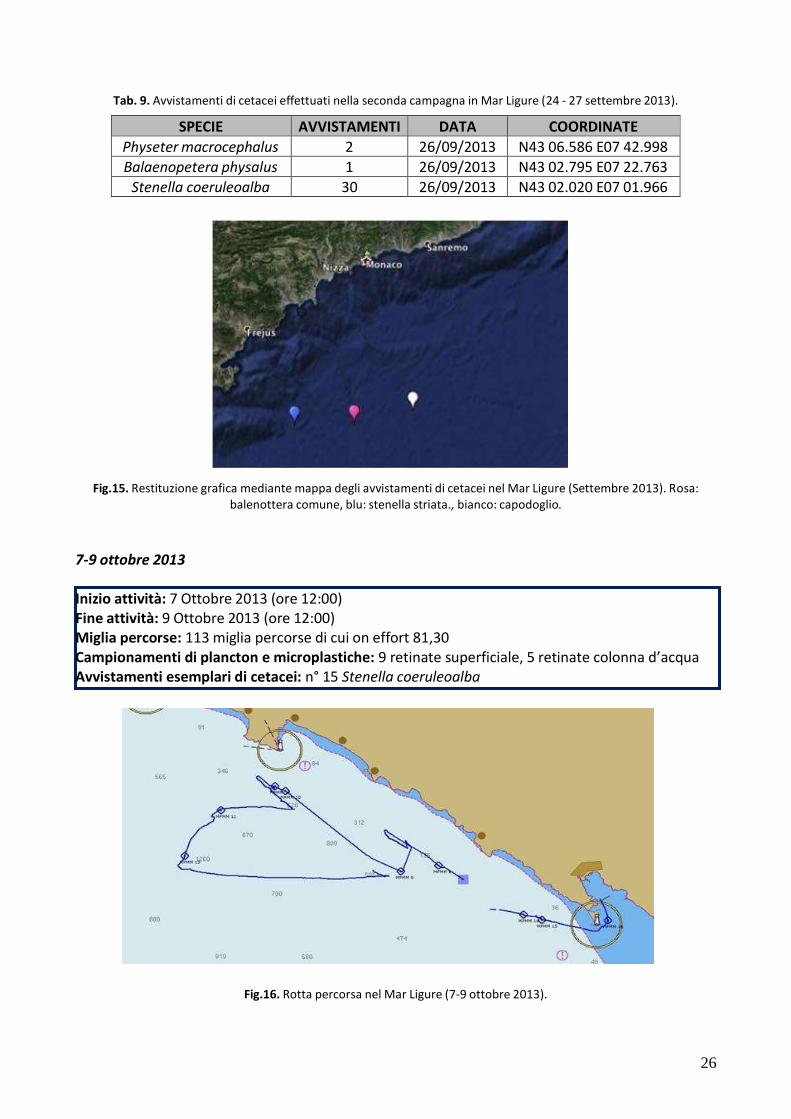
Durante i 3 giorni di navigazione sono stati avvistate tre specie di cetacei (Tab. 9, Fig. 15) ma, essendo questa attività strettamente effettuata per il monitoraggio delle microplastiche e plancton superficiale non sono stati eseguiti campionamenti degli esemplari free-ranging.
26
Tab. 9. Avvistamenti di cetacei effettuati nella seconda campagna in Mar Ligure (24 - 27 settembre 2013).
SPECIE AVVISTAMENTI DATA COORDINATE
Physeter macrocephalus 2 26/09/2013 N43 06.586 E07 42.998
Balaenopetera physalus 1 26/09/2013 N43 02.795 E07 22.763
Stenella coeruleoalba 30 26/09/2013 N43 02.020 E07 01.966
Fig.15. Restituzione grafica mediante mappa degli avvistamenti di cetacei nel Mar Ligure (Settembre 2013). Rosa: balenottera comune, blu: stenella striata., bianco: capodoglio.
7-9 ottobre 2013
Inizio attività: 7 Ottobre 2013 (ore 12:00) Fine attività: 9 Ottobre 2013 (ore 12:00) Miglia percorse: 113 miglia percorse di cui on effort 81,30 Campionamenti di plancton e microplastiche: 9 retinate superficiale, 5 retinate colonna d’acqua Avvistamenti esemplari di cetacei: n° 15 Stenella coeruleoalba
Fig.16. Rotta percorsa nel Mar Ligure (7-9 ottobre 2013).

27
Campionamenti di plancton e microplastiche superficiali e campionamenti lungo la colonna d’acqua (verticali) sono stati condotti grazie all'appoggio della Marina Militare Italiana lungo una rotta che ha attraversato il Santuario Pelagos nella zona del Mar Ligure prospiciente l’area delle Cinque Terre (vedi Fig. 16). Durante i 3 giorni di navigazione dal 7 al 9 ottobre è stata seguita la rotta che partendo dal porto di La Spezia costeggia la Riviera di Levante fino al promontorio di Portofino. Sono state individuate 9 stazioni di campionamento, 2 pelagiche e 7 costiere, riportate nella mappa della rotta percorsa (Tab. 10, Fig. 17).
Tab. 10. Retinate per campionamento plancton e microplastiche superficiali (9) e campionamenti nella colonna
d’acqua (5) realizzate nella terza campagna in Mar Ligure (7-9 ottobre 2013).
CAMPIONAMENTO TIPO NUMERO COORDINATE
Retinata plancton Superficiale MPMM 8 N44 07.076 E09 32.017
Retinata plancton Superficiale MPMM 9 N44 09.547 E09 26.359
Retinata plancton Superficiale MPMM 10 N44 14.039 E09 13.713
Retinata plancton Superficiale MPMM 11 N44 12.259 E09 06.028
Retinata plancton Superficiale MPMM 12 N44 14.441 E09 12.240
Retinata plancton Superficiale MPMM 13 N44 07.965 E09 01.643
Retinata plancton Superficiale MPMM 14 N44 02.484 E09 42.151
Retinata plancton Superficiale MPMM 15 N44 01.996 E09 44.386
Retinata plancton Superficiale MPMM 16 N44 01.940 E09 52.242
Retinata plancton Verticale MPMV 1 N44 07.076 E09 32.017
Retinata plancton Verticale MPMV 2 N44 14.039 E09 13.713
Retinata plancton Verticale MPMV 3 N44 12.259 E09 06.028
Retinata plancton Verticale MPMV 4 N44 07.965 E09 01.643
Retinata plancton Verticale MPMV 5 N44 02.484 E09 42.151
Fig.17. Mappa dei campionamenti di plancton e microplastiche superficiali. In rosso i punti dove sono state effettuate le retinate superficiali, in giallo le retinate nella colonna d’acqua (7-9 ottobre 2013)..

28
Vengono riportati di seguito gli avvistamenti di cetacei effettuati, grazie all' appoggio della Marina Militare Italiana, lungo una rotta che ha attraversato il Santuario Pelagos nella zona del Mar Ligure prospiciente alle Cinque Terre. Lungo tale rotta e’ stato effettuato 1 avvistamento (stenella striata - gruppo) dei quali i dettagli vengono riportati in Tab.11 e Figura 18.
Tab. 11 – Avvistamenti di cetacei effettuati nella terza campagna in Mar Ligure (7 - 9 di ottobre).
SPECIE AVVISTAMENTI DATA COORDINATE
Stenella coeruleoalba 15 08/10/2013 N44 12.321 E9 18.992
Fig.18. Restituzione grafica mediante mappa dedicata de gli avvistamenti di cetacei effettuati in Mar Ligure (7-9 ottobre 2013). Blu: stenella striata.

29
4° Campagna – Mar Tirreno (Arcipelago Toscano)
La quarta campagna (parte terminale del secondo anno del progetto), della durata di 1 giorno, si è svolta nell’area del Mar Tirreno (Arcipelago Toscano). Lo scopo principale di questa campagna è stato quello di realizzare la seguente tipologia di campionamento:
Campionamenti di plancton e microplastiche nella colonna d’acqua
Di seguito vengono riportati in dettaglio le tempistiche della campagna, l’area percorsa, le miglia percorse, il numero e la localizzazione dei campioni di plancton e microplastiche effettuati.
Inizio attività: 12 Novembre 2013 (ore 08:00) Fine attività: 12 Novembre 2013 (ore 17:00) Miglia percorse: 44 miglia percorse Campionamenti di plancton e microplastiche: 4 retinate verticali
Fig.19. Mappa dei campionamenti di plancton e microplastiche nella colonna d’acqua (in giallo).
Tab. 12 - Retinate per campionamento plancton e microplastiche nella colonna d’acqua nel Mar Tirreno (Arcipelago Toscano)(Novembre 2013).
CAMPIONAMENTO TIPO NUMERO COORDINATE
Retinata plancton Verticale MPP70 N 42 29.796 E 11 04.575
Retinata plancton Verticale MPP71 N 42 25.049 E 10 58.779
Retinata plancton Verticale MPP72 N 42 19.078 E 11 04.255
Retinata plancton Verticale MPP73 N 42 21.161 E 11 15.793

30
3. CAMPIONI DISPONIBILI PER INDAGINI ECOTOSSICOLOGICHE
Di seguito vengono riportati in dettaglio i campioni disponibili per le indagini eco tossicologiche.
Tab. 13. Campioni di plancton e microplastiche.
Area
Data
Numero Retinate Tipologia retinata
Eufasiacei
Mar Tirreno (Arcipelago
Toscano)
Dicembre 2012 Novembre 2013
12
8 superficiali 4 verticali
-
Mar di Sardegna
Luglio 2013
14 diurne 2 notturne
15 superficiali 1 verticale
30 esemplari di Meganyctiphanes
norvegica
Mar Ligure Agosto 2013
Settembre 2013 Ottobre 2013
22
17 Superficiali 5 Verticali
6 esemplari di Meganyctiphanes
norvegica
Fig.20. Immagini realizzate durante il campionamento effettuato con retino conico standard WP2.

31
Tab. 14. Biopsie cutanee di cetacei free-ranging campionate nel Santuario Pelagos.
Area Specie n° Biopsie Codice UniSi
Mar Tirreno (Arcipelago Toscano)
Balaenoptera physalus
1
BPRT1
Mar di Sardegna
Stenella coeruleoalba
32
AST7-38
Balaenoptera physalus
1
BPAS25
Tursiops truncatus
2
TTAS3-4
Grampus griseus
1
GGAS1
Delphinus delphis
4
DDAS1-4
Mar Ligure
Stenella coeruleoalba
2
IST210-211
Balaenoptera physalus
10
BPL1-10
Fig.21. Esemplari di balenottera comune, grampo e stenella avvistati durante le campagne di campionamento.

31
3
RISULTATI E DISCUSSIONI

32
1. RISULTATI DELLE INDAGINI ECOTOSSICOLOGICHE E CONTEGGIO DELLE MICROPLASTICHE CAMPIONI DI PLANCTON/NEUSTON PRELEVATI IN DIVERSE AREE DEL SANTUARIO PELAGOS
Di seguito viene riportata l’analisi dei campioni di plancton e microplastiche relative sia al secondo anno di campionamento nelle tre sub-aree del Santuario Pelagos selezionate che integrando i risultati dei due anni di progetto (Tab.15-17). a) Contenuto di microplastiche, zooplancton totale, MEHP e DEHP: dei 54 campioni superficiali di plancton/neuston analizzati, 44 contengono particelle di microplastiche (81%). Il
valore più alto di particelle di microplastiche, rapportato ai m3 di acqua filtrata (3,33 items/m3),
è stato riscontrato nel campione MPM53 (Arcipelago Toscano). La media totale degli items/m3
riscontrata nel totale delle retinate effettuate nelle tre aree del Santuario Pelagos è di 0,26
items/m3. Tra le diverse aree di campionamento risulta evidente come il valore medio del
Mar Tirreno (Arcipelago Toscano) (0,80 items/m3) sia più alto rispetto alle altre due aree (Mar di Sardegna e Mar Ligure) nei diversi anni di campionamento. Per quanto riguarda i livelli di MEHP i campioni raccolti nel 2012 nel Mar di Sardegna sono quelli con il valore medio più elevato, mentre il valore medio più basso è risultato essere quello dei campioni provenienti dall’Arcipelago Toscano raccolti durante il 2012. Discorso diverso per il DEHP, per questo contaminante i valori medi più elavati e quelli più bassi sono stati riscontrati nella medesima area del Mar Ligure rispettivamente nel 2013 e nel 2012. Durante i campinamenti e grazie a spiaggiamenti occasionali lungo le coste del Santuario Pelagos (Mar Ligure) sono stati rinvenuti esemplari di Meganyctiphanes norvegica, analizzati sia mediante tecniche di microscopia elettronica sia per valutare i livelli di ftalati (MEHP e DEHP). I livelli di MEHP e DEHP sono risultati di 9,56 e 15, 33 ng/g peso secco, rispettivamente.

33
Tab.15. Valori delle microplastiche (items/m3), zooplancton totale (zoop/m
3) e concentrazioni di MEHP e DEHP (ng/g)
nelle retinate superficiali nelle diverse aree del Santuario Pelagos nell’anno 2012.
Area di Campionamento ID items/m3 zoop/m
3
MEHP ng/g
DEHP ng/g
Mar di Sardegna 2012
MPM27 0,44 150,99 60,57 0,00
MPM28 0,00 19,91 76,15 0,00
MPM29 0,07 109,50 96,27 0,00
MPM31 0,21 14,19 103,64 0,00
MPM32 0,04 129,18 50,80 0,00
MPM33 0,07 125,04 11205 0,00
MPM34 0,07 328,97 92,49 0,00
MPM35 0,11 50,14 234,93 87,28
MPM36 0,11 160,74 167,26 104,33
MPM37 0,00 143,05 94,60 0,00
MPM38 0,06 270,11 17,70 0,00
MPM39 0,00 185,39 24,43 0,00
MPM41 0,07 43,64 82,91 0,00
MEDIA AREA n=13 0,09 133,14 97,97 15,07
Mar Ligure 2012
MPM42 0,17 35,84 47,11 0,00
MPM43 0,07 21,77 82,96 0,00
MPM44 0,11 12,05 24,75 0,00
MPM45 0,83 14,27 39,27 37,22
MEDIA AREA n=4 0,30 20,98 48,52 9,30
Arcipelago Toscano 2012
MPM46 0,04 43,04 3,61 28,63
MPM47 - - 0,00 10,68
MPM48 0,00 46,96 0,00 0,00
MPM49 0,00 29,32 2,32 0,00
MPM50 - - 48,96 22,43
MPM51 0,44 440,46 59,28 14,89
MPM52 1,79 274,19 52,18 12,25
MPM53 3,33 236,02 10,03 10,74
MPM54 0,00 44,70 - -
MEDIA AREA n=7/n=8 0,80 159,24 22,05 12,45

34
Tab.16. Valori delle microplastiche (items/m3) e zooplancton totale (zoop/m
3) concentrazioni di MEHP e DEHP
(ng/g) nelle retinate superficiali nelle diverse aree del Santuario Pelagos nell’anno 2013.
Area di
Campionamento ID items/m
3 zoop/m
3 MEHP ng/g DEHP ng/g
Mar di Sardegna 2013
MPM55 0,14 990,17 18,25 16,50
MPM56 0,11 1172,75 18,15 12,30
MPM57 0,04 403,79 26,50 16,13
MPM58 0,07 8711,84 23,39 19,11
MPM59 0,25 1228,93 23,08 14,80
MPM60 1,69 259,83 31,90 14,49
MPM61 0,11 1488,76 22,52 12,70
MPM62 0,14 140,45 35,29 13,66
MPM63 0,00 242,28 29,26 26,05
MPM64 0,07 2212,08 33,08 18,23
MPM65 0,18 263,34 44,83 28,16
MPM66 0,39 474,02 35,77 27,90
MPM67 0,14 368,68 37,89 30,11
MPM68 0,00 5126,40 28,53 20,27
MEDIA AREA n=14 0,24 1648,81 29,18 19,31
Mar Ligure 2013
MPM69 0,00 4108,15 51,05 31,97
MPMM1 1,56 832,55 41,90 6,86
MPMM2 0,04 917,86 0,00 0,00
MPMM3 0,00 240,80 0,00 0,00
MPMM4 0,09 74,24 46,12 2,03
MPMM5 0,09 29,44 39,32 25,57
MPMM6 0,04 2,14 53,76 62,20
MPMM7 0,01 1978,27 48,39 221,27
MPMM8 0,13 13819,58 46,90 0,00
MPMM9 0,11 4886,41 47,79 61,17
MPMM10 0,03 727,96 49,09 62,70
MPMM11 0,01 1318,97 41,51 25,85
MPMM13 0,03 1675,23 48,32 63,62
MPMM14 0,60 2226,35 29,63 70,92
MPMM15 0,07 2612,75 33,50 48,78
MPMM16 0,27 9549,71 18,93 34,73
MEDIA AREA n=16 0,19 2812,52 37,77 43,12

35
Fig.22. Livelli medi di MEHP e DEHP (ng/g peso secco) in campioni di plancton/neuston prelevati, suddivisi per area ed anno di campionamento.
Nelle retinate nella colonna d’acqua (Tab.17) non è stata rilevata la presenza di particelle di microplastiche. In questi campioni non è stato possibile valutare i livelli di MEHP e DEHP poiché la quantità di materia organica era insufficiente. Tab.17. Valori delle microplastiche (items/m
3) e zooplancton totale (zoop/m
3) nelle retinate nella colonna d’acqua
nelle diverse aree del Santuario Pelagos nell’anno 2012 e 2013.
Area di Campionamento ID items/m3 zoop/m
3
MPP30 0,00 27,38 Mar di Sardegna 2012
MPP40 0,00 127,65
MEDIA AREA n=2 0,00 77,51
MPMV1 0,00 1102,72
MPMV2 0,00 1266,05
Mar Ligure 2013 MPMV3 0,00 864,88
MPMV4 0,00 811,31
MPMV5 0,00 566,24
MEDIA AREA N=5 0,00 922,24
MPP70 0,00 331,15
MPP71 0,00 1123,66 Arcipelago Toscano 2013
MPP72 0,00 1003,15
MPP73 0,00 175,47
MEDIA AREA N=4 0,00 658,36

36
b) Analisi dimensionale delle microplastiche: misurando le dimensioni di ogni singola plastica campionata durante le retinate superficiali è stato possibile suddividere gli items di plastica in due categorie: mesoplastiche (> 5mm) e microplastiche (≤ 5mm). Le mesoplastiche non sono state
considerate successivamente nell’analisi totale che ha fornito il dato di items/m3 (microplastiche) nelle diverse retinate. In Figura 23 sono riportati i valori % delle categorie di meso/microplastiche campionate nel totale delle retinate effettuate nel 2012/2013 e la suddivisione % delle microplastiche nelle 4 categorie dimensionali (0,2-0,5 ; 0,51-1 ; 1,01 - 2.5 ; 2,51 - 5 mm).
Fig.23. Valori % di microplastiche e mesoplastiche campionate nelle retinate superficiali 2012-2013.
Nella Fig.24 sono riportati i valori percentuale della presenza di micro e/o mesoplastiche suddivisi nelle aree e anni di campionamento. Tranne che per il campionamento nel Mar Ligure 2012 (60% di mesoplastiche) tutte le altre aree presentano valori più alti delle microplastiche rispetto alle mesoplastiche. Tale può essere influenzato dal numero basso di particelle di plastica ritrovato nelle 4 retinate effettuate. Nella Fig.23 è stata inoltre effettuata una più accurata analisi dimensionale delle microplastiche campionate; la particelle di plastica sono state suddivise in 4 categorie in base alle loro dimensioni (0,2-0,5 ; 0,51-1 ; 1,01 - 2.5 ; 2,51 - 5 mm) per ottenere un’analisi più dettagliata delle dimensioni delle microplastiche. Possiamo notare come le categorie più presenti nelle 4 campagne di campionamento, escluso il Mar Ligure 2012, siano quelle comprensive degli items di dimensioni più grandi (1,01 - 2.5 mm; 2,51 - 5 mm) mentre la categoria delle microplastiche di dimensioni più piccole è presente solo in entrambe le campagne del 2013. Infine, come precedentemente descritto per micro/mesoplastiche, la suddivisione delle categorie in Mar Ligure 2012 è influenzata sicuramente dal numero basso di microplastiche campionate.

37
Fig.24. Valori % delle categorie dimensionali di microplastiche suddivise nelle diverse aree ed anni di campionamento.

38
c) Analisi delle principali componenti dello zooplancton: nelle tabelle 18-24 vengono riportate le
abbondanze (individui/m3)dei principali gruppi tassonomici identificati nelle retinate svolte nei due anni di progetto (2012-2013) nelle tre aree del Santuario Pelagos.
Tab.18. Organismi planctonici (individui/m
3) campionati nel Mar Ligure nella campagna 2012.
Mar Ligure 2012 MPM42 MPM43 MPM44 MPM45
Appendicolarie 2,16 0,25 0,34 0,17
Chetognati 0,11
Cladoceri 0,00 12,50 2,64 0,50
Copepodi 17,75 8,46 5,34 13,44
Isopodi 0,17
L. decapodi 0,14
Molluschi pteropodi 13,61 0,11 0,34
Sifonofori 0,33 0,21 0,29
Uova Invertebrati 1,33 3,10
Uova Teleostei 0,66
Totale Zooplancton/m3 35,84 21,77 12,05 14,27
Tab.19. Organismi planctonici (individui/m3) campionati nel Mar Tirreno (Arcipelago Toscano) nella campagna 2012.
Mar Tirreno 2012 MPM46 MPM48 MPM49 MPM51 MPM52 MPM53
Appendicolarie 4,77 7,45 5,60 105,46 47,95 46,95
Chetognati 2,98 1,06 0,40 6,20 6,34
Cladoceri 5,57 4,38 3,20 13,96 38,96 16,50
Copepodi 27,63 28,86 15,33 286,92 161,82 105,96
Dolioli 0,60 0,59 0,53 3,00 41,87
Foraminiferi 1,06 0,67 1,55
Idromeduse 0,20 0,24
L. decapodi 0,10 0,24 0,13 1,55
L. pesci 0,12 0,13
Molluschi pteropodi 0,20 1,30 2,40 15,51 21,73 10,15
Radiolari 0,20 1,27
Salpe 0,24 0,27
Sifonofori 0,30 1,42 0,40 6,20 0,75 5,71
Uova Invertebrati 3,10
Uova Teleostei 0,50 0,27 1,27
Totale Zooplancton/m3 43,04 46,96 29,32 440,46 274,19 236,02

38
Tab.20. Organismi planctonici (individui/m3) campionati nel Mar di Sardegna nella campagna 2012.
Mar di Sardegna 2012 MPM27 MPM28 MPM29 MPP30 MPM31 MPM32 MPM33 MPM34 MPM35 MPM36 MPM37 MPM38 MPM39 MPP40 MPM41
Appendicolarie 25,59 1,12 20,89 3,38 0,32 61,10 34,76 28,37 6,39 64,64 39,33 61,22 54,07 2,21 2,00
Chetognati 0,58 0,07
Cladoceri 17,72 2,98 18,31 0,29 0,70 3,79 17,91 13,76 11,24 10,81 0,74 16,41 14,75 4,43 1,58
Copepodi 17,84 3,65 40,43 19,04 10,74 52,46 54,95 233,99 19,24 68,82 94,87 180,49 103,72 108,47 27,81
Foraminiferi 0,33 0,11 0,21
Idromeduse 3,54 0,14 1,23 0,79
L. decapodi 0,56 1,11 1,47 10,53 3,37 1,40 5,65 1,47 8,20 2,21
L. echinodermi 0,07
L. pesci 0,04 0,04 0,04 0,07 0,04
L. policheti 0,11
Molluschi pteropodi 79,54 9,09 7,25 1,46 0,98 6,11 2,98 39,89 6,81 4,67 4,67 2,52 6,64 2,40 7,27
Policheti 0,04 0,18
Salpe 0,11 0,21 1,35
Sifonofori 4,65 0,74 2,21 0,79 0,98 2,11 1,12 1,12 2,46 0,49 0,74 6,27 2,74
Uova Invertebrati 0,98 1,47 0,33 0,32 2,74 1,12 1,12 0,49 0,25 0,63 0,98
Uova Teleostei 1,66 0,14 15,24 0,67 0,07 1,26 1,58 7,30 2,81 3,20 1,23 0,63 2,21 0,37 2,21
Totale Zooplancton/m3 150,99 19,91 109,50 27,38 14,19 129,18 125,04 328,97 50,14 160,74 143,05 270,11 185,39 124,15 43,64

39
Tab.21. Organismi planctonici (individui/m3) campionati nel Mar di Sardegna nella campagna 2013.
Mar di Sardegna 2013 MPM 55 MPM 56 MPM 57 MPM 58 MPM 59 MPM 60 MPM 61 MPM 62 MPM 63 MPM 64 MPM 65 MPM 66 MPM 67 MPM 68
Anfipodi 3,51
Appendicolarie 35,11 193,21 182,58 10,53 17,56 17,56 2808,99
Chetognati 3,51 42,13 17,56 28,09
Cladoceri 488,06 610,96 87,78 509,36 895,37 91,29 1053,37 28,09 21,07 210,67 245,79 87,78 280,90
Copepodi 284,41 428,37 193,12 87,82 52,67 105,34 42,13 24,58 7,02 17,56 158,01 17,56 632,02
Efire 28,09 14,04 210,67
Idromeduse 14,04 17,56
L.bivalvi 7,02 17,56
L.cirripedi 70,22
L. decapodi 7,02 17,56 14,04 17,56 1123,60
L. echinodermi 7,02 17,56
L. eufausiacei 17,56
L.gasteropodi 17,56 49,16 35,11 87,78 0,00 14,04 70,22
L. policheti 87,82 10,53 7,02
Molluschi gasteropodi 7517,48 175,56 28,09 126,40 66,71 189,61 1966,29 193,12 35,11 35,11 70,22
Nauplii copepodi 17,56
Salpe 228,33 7,02 17,56
Sifonofori 182,58 7,02 35,11 70,26 3,51 35,11
Uova Invertebrati 3,51
Uova Teleostei 70,22
Totale Zooplancton/m3 990,17 1172,75 403,79 8711,84 1228,93 259,83 1488,76 140,45 242,28 2212,08 263,34 474,02 368,68 5126,40

40
Tab.22. Organismi planctonici (individui/m3) campionati nel Mar Ligure nella campagna 2013.
Mar Ligure 2013 MPM 69 MPMM1 MPMM2 MPMM3 MPMM4 MPMM5 MPMM6 MPMM7 MPMM8 MPMM9 MPMM10 MPMM11 MPMM13 MPMM14 MPMM15 MPMM16
Appendicolarie 175,56 156,10 97,26 342,06 4094,69 401,62 18,20 95,26 52,35 68,15 270,28 181,32
Chetognati 17,34 14,85 0,53 341,22 33,47 27,30 21,98 20,94 108,11 241,76
Cladoceri 2808,99 381,59 601,77 63,37 0,27 986,29 2047,34 133,87 9,10 762,07 649,15 976,87 504,53 1994,56
Copepodi 842,70 190,79 206,67 158,42 59,39 22,08 1,34 621,42 7080,40 3781,95 473,17 366,38 910,90 976,87 1585,67 7011,18
Eufasiacei 34,69
Foraminiferi 6,08 6,34 10,47
Idromeduse 35,11 10,47
L.cirripedi 22,72
L. decapodi 7,33
L. echinodermi 22,72 36,04
L. eufausiacei 9,10
L. pesci 33,47 60,44
L.gasteropodi 6,08 6,34 368,15 9,10 21,98 10,47 36,04
L. policheti 85,31 36,04
L.pteropodi 17,34 5,70 85,31 163,79 43,97 22,72 36,04 60,44
Molluschi pteropodi
Molluschi gasteropodi 175,56
Nauplii copepodi 70,22 6,34 3,68 85,31 33,47 10,47 45,44
Ostracodi 3,68 45,44
Radiolari 33,47
Salpe 9,10 22,72
Sifonofori 5,70 33,47 22,72
Uova Teleostei 34,69 17,10 33,47 9,10
Totale Zooplancton/m3 4108,15 832,55 917,86 240,80 74,24 29,44 2,14 1978,27 13819,58 4886,41 727,96 1318,97 1675,23 2226,35 2612,75 9549,71

41
Tab.23. Organismi planctonici (individui/m3) campionati nel Mar Ligure nella campagna 2013.
Mar Ligure 2013 MPMV1 MPMV2 MPMV3 MPMV4 MPMV5
Appendicolarie 180 ,90 56 ,50 168 ,89 143 ,21 86 ,72
Calyptopis 5 ,14 20 ,20 15 ,07
Cladoceri 45 ,00 33 ,38 68 ,67 87 ,08 53 ,69
Copepodi 739 ,97 1109 ,40 536 ,38 457 ,47 348 ,08
Doliolidi 1 ,86
Foraminiferi 13 ,11 3 ,71
Idromeduse 9 ,20 7 ,70 3 ,71 13 ,86 8 ,16
L. decapodi 35 ,18 12 ,99 0 ,00
L. pteropodi 42 ,17 23 ,11 22 ,27 47 ,92 34 ,81
Policheti 1 ,26 2 ,57 3 ,57
Salpe 17 ,98
Sifonofori 27 ,95 5 ,14 37 ,12 28 ,24 15 ,11
Uova Teleostei 7 ,99 5 ,14 9 ,28 9 ,75 4 ,61
Totale Zooplancton/m3 1102 ,72 1266 ,05 864 ,88 811 ,31 566 ,24
Tab.24. Organismi planctonici (individui/m3) campionati nel Mar Tirreno( Arcipelago Toscano) nella campagna 2013.
Mar Tirreno 2013 MPP70 MPP71 MPP72 MPP73
Appendicolarie 180 ,90 56 ,50 168 ,89 143 ,21
Appendicolarie 14 ,51 78 ,85 61 ,46 9 ,65
Chetognati 4 ,28 69 ,89 54 ,60 0 ,57
Copepodi 184 ,38 651 ,14 670 ,27 154 ,46
Dolioli 1 ,25 14 ,93 31 ,79
Foraminiferi 6 ,94 0 ,09
Idromeduse 3 ,47
L. decapodi 2 ,99 0 ,47 1 ,42
L. echinodermi 0 ,60
L. eufausiacei 0 ,09
L. pesci 0 ,60
L. policheti 2 ,39 0 ,09 0 ,57
L. pteropodi 6 ,94 267 ,03 173 ,95 4 ,83
Ostracodi 8 ,68 1 ,79 0 ,19
Salpe 5 ,38
Sifonofori 86 ,81 21 ,51 9 ,96 3 ,98
Uova Teleostei 13 ,89 6 ,57 0 ,19 0 ,00
Totale Zooplancton/m3 331 ,15 1123 ,66 1003 ,15 175 ,47

42
d) Analisi attraverso Geographic Information System (GIS): i risultati ottenuti dal campionamento di plancton e microplastiche nell’area del Mar di Sardegna e del Mar Ligure durante le campagne di campionamento del 2011, 2012 e 2013 sono stati elaborati con il metodo di interpolazione della media pesata sull’inverso della distanza (IDW) tramite il sistema di informazione geografica ArcGIS. Questo ha permesso di realizzare delle mappe di distribuzione dei frammenti di microplastiche
(items/m3) e delle specie di zooplancton (ind zoopl/m3). Questo ha permesso di evidenziare le aree con minore e maggiore presenza delle variabili considerate (Fig. 25)
Fig. 25.Elaborazione grafica tramite GIS dell’abbondanza delle microplastiche (items/m
3) nel Mar di Sardegna (2011,
2012, 2013). In rosso i punti di campionamento.

43
Fig. 26. Elaborazione grafica tramite GIS dell’abbondanza delle microplastiche (items/m3) nel Mar Ligure (2011, 2012,
2013). In rosso i punti di campionamento.
Inoltre, è stato possibile realizzare delle mappe di distribuzione e abbondanza per le specie zooplanctoniche individuate nei campioni (Appendicolarie, Cladoceri, Copepodi, Foraminiferi, Larve di decapodi, Larve di pteropodi, Policheti, Salpe, Sifonofori, Uova invertebrati, Uova teleostei) in modo da visualizzare in modo diretto le differenze e le similitudini della distribuzione tra le singole specie. Le mappe della distribuzione dello zooplancton specie per specie sono riportate nell’annesso 1.

44
2. RISULTATI DEGLI AVVISTAMENTI DELLE MACROPLASTICHE E DELLA MESSA A PUNTO DEL
PROTOCOLLO “SURVEY MONITORAGGIO MARINE LITTER IN MARE”
Come già descritto nella sezione metodologica, la tecnica più utilizzata per la quantificazione ed il monitoraggio dei rifiuti marini galleggianti è l'osservazione visiva dalle imbarcazioni. Nell’ambito del presente progetto è stato effettuato un monitoraggio dei rifiuti galleggianti nelle aree del Santuario Pelagos sfruttando sia le imbarcazioni utilizzate per la raccolta delle biopsie cutanee di cetacei e campioni di plancton e microplastiche, sia navi di opportunità che seguivano transetti predefiniti. L’osservazione è stata effettuata come descritta precedentemente prendendo in considerazione i rifiuti galleggianti osservati entro i 20 metri dall’imbarcazione, poiché ad una distanza maggiore gli oggetti sono difficilmente classificabile. La scheda utilizzata per la raccolta dei dati (riportata nella sezione metodologica) è stata ripresa e modificata dal protocollo NOAA (NOAA Form 57-11-14 (6-12)). Poiché lo scopo del progetto prevedeva solo il conteggio di macroplastiche, è stata effettuata successivamente un’elaborazione per il calcolo dei rifiuti galleggianti, tenendo in considerazione solo gli oggetti definiti come “plastiche” nella scheda. I risultati vengono riportati di seguito nelle tabelle 25 e 26.
Tab. 25. Risultati del survey delle macroplastiche nel Mar di Sardegna 2013 rapportate ai km2
monitorati.
Mar di Sardegna 2013
Data Miglia
(On-Effort) Items
Macroplastiche km
(On-Effort)
km2
Items/km2
08/07/2013 39 42 72.23 2.89 14.54
09/07/2013 34 176 62.97 2.52 69.88
10/07/2013 24 127 44.45 1.78 71.43
11/07/2013 45 120 83.34 3.33 36.00
12/07/2013 50 310 92.60 3.70 83.69
13/07/2013 35 57 64.82 2.59 21.98
14/07/2013 33 80 61.12 2.44 32.72
15/07/2013 48 104 88.90 3.56 29.25
16/07/2013 33 79 61.12 2.44 32.32
Totale 341 1095 631.53 25.25 -
Media - - - - 43.53
Tab.26. Risultati del survey delle macroplastiche nel Mar di Ligure 2013 rapportate ai km
2 monitorati.
Mar Ligure 2013
Data Miglia
(On-Effort) Items
Macroplastiche km
(On-Effort)
km2
Items/km2
01/08/2013 40 241 74.08 2.96 81.33
Data Miglia
(On-Effort) Items
Macroplastiche km
(On-Effort)
km2
Items/km2
25/09/2013 9.10 46 16.85 0.34 136.47
26/09/2013 15.19 24 28.13 0.56 42.66
Totale 24.29 70.00 44.99 0.90 -
Media - - - - 77.80

45
3. RISULTATI DELLE DIAGNOSI ECOTOSSICOLOGICHE SUL POTENZIALE IMPATTO DELLE MICROPLASTICHE E DERIVATI TOSSICOLOGICAMENTE ATTIVI SU B. PHYSALUS NELLE TRE AREE DEL SANTUARIO PELAGOS.
Di seguito vengono riportati i risultati dei livelli di contaminanti e delle risposte dei biomarkers analizzati sulle 12 biopsie cutanee di balenottera comune campionate nel Santuario Pelagos (luglio-novembre 2013) per le diagnosi ecotossicologiche del potenziale impatto delle microplastiche su B. physalus. I risultati ottenuti sono stati analizzati e discussi tenendo in considerazione il sesso degli individui (maschi versus femmine) per tutte le aree del Santuario Pelagos e l’anno di campionamento (2012 versus 2013) solo per il Mar Ligure. Non è stata presa in considerazione la variabile area perché nell’Arcipelago Toscano ed nel Mar di Sardegna gli esemplari campionati sono stati solo uno per area. Vengono inoltre considerati singolarmente tutti i parametri analizzati: livelli di ftalati, organoclorurati, espressione proteica del CYP1A1 e CYP2B, perossidazione lipidica, espressione genica del PPAR A, PPAR G, AhR, CYP1A ed ER1. Inoltre, i risultati sono stati analizzati correlando i valori dei livelli di contaminanti con le risposte biologiche ed i diversi biomarker tra loro.
a) Analisi complessiva Maschi vs Femmine -Analisi dei contaminanti Livelli di ftalati Nella porzione del blubber sottocutaneo delle biopsie cutanee di balenottera sono state valutate le concentrazioni dello ftalato mono-2-etilesilftalato (MEHP), principale metabolita del di-2-etilesilftalato (DEHP) composto additivo della plastica.
Fig.27. Livelli medi di MEHP (ng/g peso secco) in esemplari maschi (n=3) e femmine (n=4) di balenottera comune del Santuario Pelagos (2013).
I valori più elavati di MEHP sono stati riscontrati negli esemplari di sesso maschile, in cui il valore medio risulta essere 54,35 ng/g, mentre nelle femmime il valore medio riscontrato è 38,12 ng/g. Tale differenza non è tuttavia statisticamente significativa (Fig. 27).

46
Livelli degli organoclorurati
Nella porzione del blubber sottocutaneo delle biopsie cutanee di balenottera sono state valutate le concentrazioni dei composti organoclorurati DDT (e i suoi metaboliti) e PCB (30 congeneri), composti veicolati dalle particelle di plastica.
Fig.28. Livelli medi di organoclorurati (PCB totali – DDT e metaboliti) in esemplari maschi (n=6) e femmine (n=6) di balenottera comune del Santuario Pelagos (2013).
Per entrambe le categorie di OC indagate le concentrazioni più elevate dei contaminanti sono state evidenziate negli esemplari di sesso maschile sebbene tali differenze non siano statisticamente significative nella variabile sesso (Fig. 28).

47
- Risposte biologiche (biomarkers)
Nella porzione di derma delle biopsie cutanee sono state valutate le analisi delle risposte biomarker del citocromo P450 1A1/2B mediante western blot, la perossidazione lipidica e l’espressione genica del PPAR A, PPAR G, AhR, CYP1A e dell’ ER1 mediante PCR Real-Time quantitativa.
- Livelli di CYP1A1 e CYP2B
Per entrambe le isoforme del citocromo P450 la maggiore induzione proteica è stata evidenziata negli esemplari di sesso maschile senza evidenziare però in entrambi i citocromi differenze statisticamente significative nella variabile sesso. Questo dato appare correlato ad i livelli di OC, che appaiono più alti nell’individui di sesso maschile (Fig. 29).
Fig.29. Livelli proteici di medi CYP1B e CYP2B in esemplari maschi (n=6) e femmine (n=5) di balenottera comune del Santuario Pelagos.
- Livelli di Perossidazione Lipidica
I dati riguardanti la perossodazione lipidica, biomarker di stress ossidativo, confermano le evidenze ottenute con l’analisi delle isoforme del citocromo; un valore moderatamente più elevato negli individui di sesso maschile rispetto alle femmine (Fig. 30).
Fig.30.Livelli medi di perossidazione lipidica (LPO) in esemplari maschi (n=6) e femmine (n=6) di balenottera comune del Santuario Pelagos.

48
- Livelli di espressione genica
l’analisi di cinque geni biomarker mediante valutazione delle variazioni dell’espressione genica ha evidenziato come per ogni marcatore l’espressione più elevata risulti nelle femmine rispetto ai maschi. In particolare, una differenza statisticamente signifivativa (p<0.05) risulta per le differenze di espressione dei geni CYP1A e ER1 tra i due sessi (Fig. 31).
*
*
Fig.31.Livelli medi di espressione genica dei geni PPAR G, PPAR A, ER1, CYP1A e AhR in esemplari maschi (n=6) e femmine (n=6) di balenottera comune del Santuario Pelagos.* indica differenze statisticamente significative (p<0.05)
tra i sessi.
49
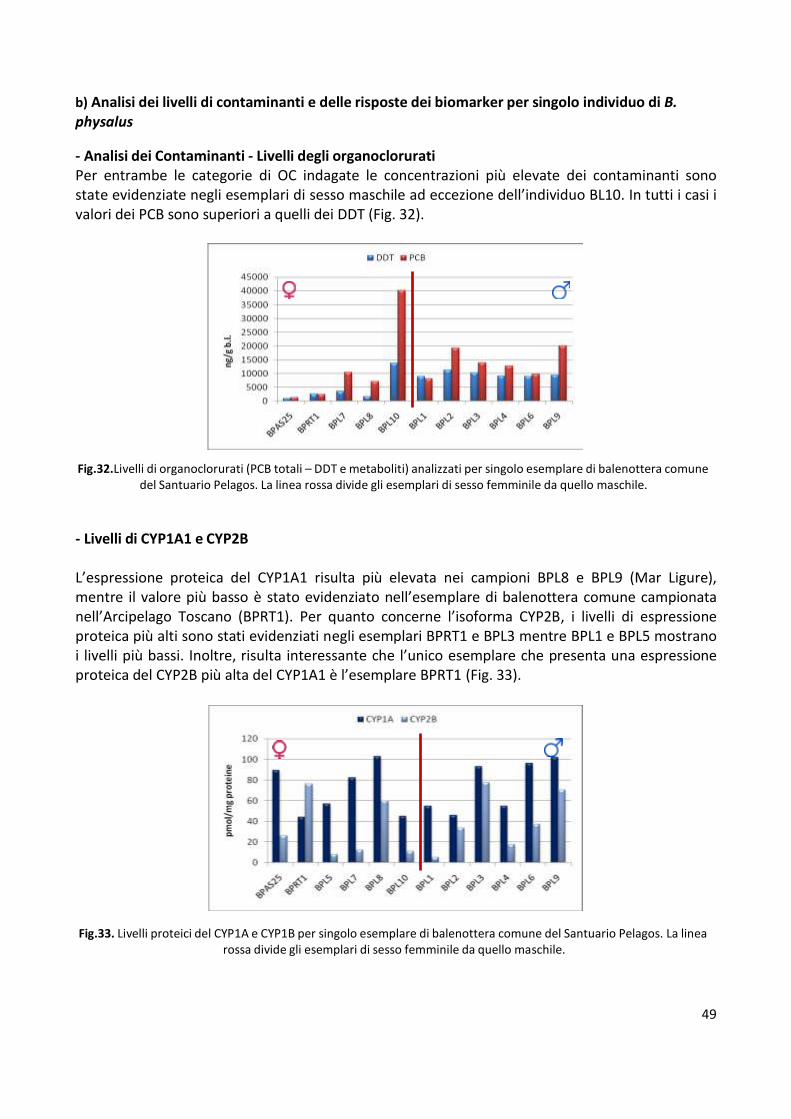
b) Analisi dei livelli di contaminanti e delle risposte dei biomarker per singolo individuo di B. physalus
- Analisi dei Contaminanti - Livelli degli organoclorurati Per entrambe le categorie di OC indagate le concentrazioni più elevate dei contaminanti sono state evidenziate negli esemplari di sesso maschile ad eccezione dell’individuo BL10. In tutti i casi i valori dei PCB sono superiori a quelli dei DDT (Fig. 32).
Fig.32.Livelli di organoclorurati (PCB totali – DDT e metaboliti) analizzati per singolo esemplare di balenottera comune
del Santuario Pelagos. La linea rossa divide gli esemplari di sesso femminile da quello maschile.
- Livelli di CYP1A1 e CYP2B
L’espressione proteica del CYP1A1 risulta più elevata nei campioni BPL8 e BPL9 (Mar Ligure), mentre il valore più basso è stato evidenziato nell’esemplare di balenottera comune campionata nell’Arcipelago Toscano (BPRT1). Per quanto concerne l’isoforma CYP2B, i livelli di espressione proteica più alti sono stati evidenziati negli esemplari BPRT1 e BPL3 mentre BPL1 e BPL5 mostrano i livelli più bassi. Inoltre, risulta interessante che l’unico esemplare che presenta una espressione proteica del CYP2B più alta del CYP1A1 è l’esemplare BPRT1 (Fig. 33).
Fig.33. Livelli proteici del CYP1A e CYP1B per singolo esemplare di balenottera comune del Santuario Pelagos. La linea rossa divide gli esemplari di sesso femminile da quello maschile.

50
- Livelli di Perossidazione Lipidica
I dati riguardanti la perossodazione lipidica, biomarker di stress ossidativo, evidenziano che BPAS25 e BPL3 presentano i livelli più alti rispetto agli altri esemplari (Fig. 34).
Fig.34. Livelli di perossidazione lipidica (LPO) per singolo esemplare di balenottera comune del Santuario Pelagos. La
linea rossa divide gli esemplari di sesso femminile da quello maschi.
- Livelli di espressione genica
L’analisi per ogni individuo analizzato per i cinque geni mette in evidenza la variabilità inter- individuale nella risposta (Fig. 35). L’espressione più elevata per il gene PPARG risulta nell’individuo BPL10 (individuo che presenta peraltro i livelli più alti di OC), mentre la più bassa in BPL 9 con una induzione di 8,5 volte. Per gli individui campionati nel Mar di Sardegna e nell’Arcipelago Toscano, i valori risultato mediamente bassi, circa 1,5 volte in meno rispetto alla media degli individui del Mar Ligure. Analogamente, anche per i valori di espressione genica del gene PPAR A, gli individui con la più elevata espressione (BPL 8) e la più bassa (BPL2) presentano una over-espressione del gene in BPL 8 di 5 volte rispetto a BPL2, mentre gli individui campionati nelle altre aree di interesse hanno un espressione mediamente uguale (1,2 volte) rispetto al set di campioni prelevati in Mar Ligure. Per quanto riguarda le variazioni dei livelli di espressione del CYP1A, la balenottera comune campionata nell’Arcipelago Toscano mostra un’espressione del gene molto elevata, circa 17 volte più elevata rispetto al valore di espressione più basso dell’indiduo ligure BPL 9 e 4,9 volte più elevato rispetto alla media degli individui del Mar Ligure. Per quanto riguarda l’espressione del CYP1A, confrontando Mar di Sardegna e Arcipelago Toscano, l’espressione del gene è più elavata di circa 2,5 volte. I livelli di espressione del gene ER1 sono più elevati nell’individuo BPL8 di 12,6 volte rispetto a BPL10 che presenta espressione più bassa. I valori medi di espressione delle balenottere comuni campionate nel Mar Ligure sono più elevati che nel Mar di Sardegna e l’Arcipelago Toscano rispettivamente di 2 e 1,4 volte. Infine, l’espressione del gene AhR risulta piuttosto omogenea tra tutti i campioni di B. physalus. L’espressione più elavata è risultata nel campione BPL 8, nel quale l’AhR risulta indotto 1,8 volte

50
rispetto al campione BPL 4. Le differenze tra la media degli individui campionati nel Mar Ligure e quelli del Mar di Sardegna e Arcipelago Toscano è molto bassa (1,2 volte).
Fig.35.Livelli di espressione genica dei geni PPAR G, PPAR A, CYP1A, ER1 e AhR per singolo esemplare di balenottera comune campionate nel Santuario Pelagos. La linea rossa divide gli esemplari femmine dai maschi.

51
c) Analisi complessiva 2012 vs 2013 di B. physalus
Nei due anni di campionamento nel Mar Ligure sono stati campionati 19 esemplari di balenottera comune di cui 9 nel 2012 (F=4; M=5) e 10 nel 2013 (F=4; M=6). - Analisi dei contaminanti Livelli di ftalati L’analisi dei levelli di MEHP nelle balenottere comuni campionate sia nel Mar di Sardegna che nel Mar Ligure, mettono in evidenza una variazione stagionale di questo composto soprattutto per quanti riguarda gli individui di sesso maschile. I livelli di questo ftalato, infatto, aumentano con un tred temporale da luglio a settembre (Fig. 36).
Fig.36. Livelli medi di MEHP (ng/g peso secco) in esemplari maschi e femmine di balenottera comune nel Mar Ligure e nel Mar di Sardegna in diversi periodi del 2012 e 2013.
Livelli degli organoclorurati
Per entrambe le categorie di OC indagate le concentrazioni più elevate dei contaminanti sono state evidenziate negli esemplari di sesso maschile campionati nel 2012, mentre per gli individui di sesso femminile il valore più elevato dei PCB è da attribuirsi ad i valori particolarmente elevati di un singolo individuo (BL10). La differenza nelle concentrazioni nei due anni può essere attribuita al diverso periodo di campionamento, settembre nel 2012 e inizio agosto 2013, e di conseguenza ad una maggiore bioaccumulo di composti liposolubili legato alla dieta negli individui campionati alla fine del periodo estivo di foraggiamento (Fig. 37).

52
Fig.37. Livelli medi di organoclorurati (PCB totali – DDT e metaboliti) in esemplari maschi e femmine di balenottera comune nel Mar Ligure campionati nel 2012 e 2013.
- Risultati risposte biologiche (biomarkers)
Solo per l’area di campionamento della Liguria è stato possibile effettuare un confronto tra gli individui maschi e femmine campionate nei due diversi anni.
-Livelli di CYP1A1 e CYP2B
Per entrambe le isoforme del citocromo P450 la maggiore induzione proteica è stata evidenziata negli esemplari di sesso maschile senza evidenziare però in entrambi i citocromi differenze statisticamente significative nella variabile sesso. Nella figura 35 è evidente come il valore del CYP2B valutato negli esemplari femminili campionati nel 2013 sia inferiore a quello delle femmine campionate nel 2012 (Fig. 38).

53
Fig.38. Livelli medi di espressione proteica del CYP1A1 e CYP2B in esemplari maschi e femmine di balenottera comune del Santuario Pelagos in due diversi anni di campionamento.
- Livelli di Perossidazione Lipidica
I dati riguardanti la perossodazione lipidica, biomarker di stress ossidativo, evidenziano un valore leggermente maggiore degli individui di sesso maschile rispetto ai maschi campionati nel 2013 mostrando una differenza statisticamente significativa (Fig. 39).
*
*
Fig.39.Confronto dei livelli medi di perossidazione lipidica in esemplari maschi e femmine di balenottera comune del Santuario Pelagos campionati nel 2012 e 2013. * indica differenze statisticamente significative (p<0.05) tra gli idividui
di sesso maschile negli anni 2012 e 2013.
- Livelli di espressione genica
L’espressione dei quattro geni biomarkers è stata messi a confronto per valutare le possibili variazioni negli anni 2012 e 2013 tra gli esemplari di balenottera comune campionati nella medesima area del Santuario Pelagos (Fig. 40). Il gene PPAR G, nel 2012 presenta valori di mRNA più elevati sia per i maschi che per le femmine, mentre per il gene PPAR A risulta un andamento opposto. Nell’anno 2012 gli individui di balenottera comune, sia maschi che femmine, presentano dei livelli di espressione del CYP1A più elevati (le femmine di circa 10 volte) rispetto ai valori di espressione dello stesso gene negli individui campionati nel 2013. Questo dato è strettamente correlato alle diverse concentrazioni di contaminanti OC rilevate nei due anni/periodi di campionamento.

54
Per quanto riguarda il gene ER 1, invece, l’espressione più elevata risulta nelle femmine campionate nel 2013 e nei maschi campionati nel 2012. L’espressione del gene AhR appare moderatamente più elevata sia nei maschi che nelle femmine di balenottera comune campionate nel 2013 rispetto al 2012.
*
*
Fig.40.Confronto dei livelli medi di espressione dei geni PPAR G, PPAR A, CYP1A, ER1 ed AhR in esemplari maschi e femmine di balenottera comune del Santuario Pelagos campionati nel 2012 e 2013. * indica differenze statisticamente
significative (p<0,05).

55
4) RISULTATI DELLE DIAGNOSI ECOTOSSICOLOGICHE SUL POTENZIALE IMPATTO DELLE MICROPLASTICHE E DERIVATI TOSSICOLOGICAMENTE ATTIVI SU S. COERULEOALBA CAMPIONATA NELLE AREE DEL SANTUARIO PELAGOS.
a) Analisi complessiva Maschi vs Femmine
- Analisi dei contaminanti - Livelli degli organoclorurati
Per entrambe le categorie di OC indagate le concentrazioni più elevate dei contaminanti sono state evidenziate negli esemplari di sesso maschile senza differenze statisticamente significative (Fig. 41).
Fig.41.Livelli medi di OC (DDT – PCB totali) in esemplari maschi (n=5) e femmine (n=5) di stenella striata campionate nel Santuario Pelagos.
- Livelli di CYP1A1 e CYP2B
Per entrambe le isoforme del citocromo P450 la maggiore induzione proteica è stata evidenziata negli esemplari di sesso femminile nonostante non vi siano differenze statisticamente significative (Fig. 42).
Fig.42. Livelli proteici di medi CYP1B e CYP2B in esemplari maschi (n=5) e femmine (n=11) di stenella striata campionata del Santuario Pelagos.
GaloppiniPLA
Evidenziato

56
- Livelli di Perossidazione Lipidica
I dati riguardanti la perossodazione lipidica, biomarker di stress ossidativo, confermano le evidenze ottenute con l’analisi delle isoforme del citocromo; un valore moderatamente maggiore negli individui femmine rispetto ai maschi (Fig. 43).
Fig.43.Livelli di perossidazione lipidica in esemplari maschi (n=5) e femmine (n=11) di stenella striata campionata del Santuario Pelagos.
- Livelli di espressione genica
L’espressione dei geni PPAR G, PPAR A, ER 1, CYP1A e AhR è stata misurata negli esemplari di stenella striata campionati nel Santuario Pelagos. Dal confronto tra gli individui maschili e femminili è evidente come l’espressione del geni PPAR G e AhR sia pressochè uguale tra maschi e femmine. Gli individui di sesso femminile presentano, invece, espressioni più elevate dei geni PPAR A e ER 1. Al contrario l’espressione del gene CYP1A sembra subire una over-espressione negli individui di sesso maschile (Fig. 44).
Fig.44.Livelli di espressione genica dei geni PPAR G, PPAR A, ER1, CYP1A ed AhR in esemplari maschi (n=5) e femmine (n=10) di stenella striata campionata del Santuario Pelagos.

57
b) Analisi dei livelli di contaminanti e delle risposte dei biomarker per singolo campione di S. coeruleoalba
- Analisi dei contaminanti - Livelli degli organoclorurati
Analizzando i livelli di PCB e DDT per singolo campione di stenella striata, AST14 e AST31 presentano i valori più elevati, mentre i livelli di DDT sono più elevati nel campione AST34 e AST27. Al contrario, i valori più bassi sia per i PCB e DDT sono stato misurati nel campione AST19 (Fig. 45).
Fig.45.Livelli di organoclorurati (PCB totali – DDT) analizzati per singolo esemplare di stenella striata del Santuario Pelagos. La linea rossa divide gli esemplari di sesso maschile dalle femmine.
c) Risposte di Biomarkers
- Livelli di espressione proteica CYP1A1 e CYP2B
L’espressione proteica del CYP1A1 è risultata più elevata nei campioni di sesso femminile AST12, AST16 ed AST25 (Mar di Sardegna), mentre il valore più basso negli esemplari di sesso maschile AST24 ed AST35 (Mar di Sardegna). Per quanto concerne l’isoforma CYP2B, i livelli di espressione proteica più alti risultano nell’esemplare IST210 (Mar Ligure) mentre il valore più basso risulta nell’individuo di sesso maschile AST35.
Fig.46. Livelli proteici di medi CYP1B e CYP2B in esemplari maschi (n=5) e femmine (n=11) di stenella striata campionata del Santuario Pelagos. La linea rossa divide gli esemplari femmine da quelli di sesso maschile.

58
- Livelli di perossidazione lipidica
L’esemplare AST16 per le femmine e AST 32 (Mar di Sardegna) per i maschi mostrano i livelli più elevati di perossidazione lipidica. Tuttavia la variabilità inter-individuale risulta piuttosto bassa sia nei maschi che nelle femmine (Fig. 47).
Fig.47.Livelli di perossidazione lipidica in esemplari maschi (n=5) e femmine (n=11) di stenella striata campionata del Santuario Pelagos. La linea rossa divide gli esemplari femmine da quelli di sesso maschile.
- Livelli di espressione genica:
L’epressione del gene PPARG risutlta più elevata negli individui di sesso femminile campionati nel Mar Ligure (IST 210 e 211), mentre i valori più bassi sono stati ottenuti per gli individui femminili AST 7 e AST 28. Il gene PPAR A è maggiormente espresso nei campioni di stenelle femmine AST11 AST 22 e IST210, e negli individui di sesso mashile AST8 e AST24. L’epressione CYP1A è più elevata negli individui maschili AST8 e AST35, che se confrontata all’epressione del CYP1A nel campione AST16 è 8 volte maggiore. L’epressione dele gene ER1 risulta più elevata di 8.2 volte nel campione AST12 rispetto al campione IST 211. I maschi presentano espressioni moderatamente elevate, nonostante che il recettore sia strettamente legato agli ormoni femminili. Per il gene AhR l’epressione è mediamente omogenea in tutti gli individui sia di sesso femminile che maschile (Fig. 48) .

59
Ah
R (
esp
ressio
ne
no
rmalizza
ta)
Fig.48. Livelli di espressione genica dei geni PPAR G, PPAR A, CYP1A, ER1 ed AhR in esemplari maschi (n=5) e femmine (n=10) di stenella striata campionata del Santuario Pelagos. La linea rossa divide gli esemplari femmine da quelli di
sesso maschile.
e) Analisi delle correlazioni
Interessanti correlazioni sono state evidenziate fra l’induzione del CYP1A1 e l’up-regulation del recettore AhR nelle femmine di stenella striata. Questo dato conferma la stretta dipendenza della riposta del CYP1A all’attivazione da parte del recettore Ah e il loro ruolo come indicatori dell’esposizione a contaminanti liposolubili (Fig. 49).
r=0,65; p<0,05
Esemplari Femmine (AhR - CYP1A1)
1,15
1,10
1,05
1,00
0,95
0,90
0,85
0,80
0,75
0,70 100 120 140 160 180 200 220 240 260 280 300
CYP1A1 (pmol/mg proteine)
Fig.49. Correlazioni fra i Livelli di espressione genica dei CYP1A e AhR in esemplari femmine (n=10) di stenella striata campionata del Santuario Pelagos.
Una seconda correlazione è stata evidenziata fra i livelli di perossidazione lipidica e l’up-regulation del recettore Ah, dovuta probabilmente all’esposizione a stress ambientali, in particolare composti diossino-simili.

60
Ah
R (
esp
ressio
ne
no
rmalizza
ta)
1,15
r=0,64; p<0,05
Esemplari Femmine (AhR - LPO)
1,10
1,05
1,00
0,95
0,90
0,85
0,80
0,75
0,70 6 8 10 12 14 16 18 20 22
LPO (nmol/mg proteine)
Fig.50. Correlazioni fra i livelli di espressione genica del AhR ed i livelli di LPO in esemplari femmine (n=10) di stenella striata campionata del Santuario Pelagos.

60
5) RISULTATI DELLE DIAGNOSI ECOTOSSICOLOGICHE SUL POTENZIALE IMPATTO DELLE MICROPLASTICHE E DERIVATI TOSSICOLOGICAMENTE ATTIVI SU ALTRE SPECIE DI CETACEI (Delphinus delphis, Grampus griseus e Tursiops truncatus) CAMPIONATE NELLE AREE DEL SANTUARIO PELAGOS.
Analisi dei Contaminanti - Livelli degli organoclorurati
Per entrambe le categorie di OC indagate le concentrazioni più elevate dei contaminanti sono stata evidenziate in un esemplare di delfino comune campionato nel Mar di Sardegna. Il ridotto numero di campioni per specie non consente però un adeguata analisi statistica (Fig. 51).
Fig.51. Livelli di organoclorurati (DDT e metaboliti – PCB totali) per singolo esemplare di tursiope (TTAS3-4) e delfino comune (DDAS1-4) campionati nel Santuario Pelagos.

61
- Livelli di espressione proteica del CYP1A1 e CYP2B
Per entrambe le isoforme di citocromo indagate, le concentrazioni più elevate sono state evidenziate nell’unico individuo di grampo campionato. I livelli proteici del CYP1A1 e CYP2B nella specie delfino comune, invece, risultano più bassi negli individui che presentano le concentrazioni dei contaminanti OC più elevati (Fig. 51-52).
Fig.52. Livelli di espressione proteica del CYP1A1 e CYP2B per singolo esemplare di tursiope (TTAS3-4), delfino comune (DDAS1-4) e grampo (GGAS1) campionati nel Santuario Pelagos.
- Livelli di perossidazione lipidica
I valori di perossidazione lipidica più elevati sono stati evidenziate nel campione DDAS4 che tuttavia presenta livelli di OC più bassi insieme a DDAS2. Il ridotto numero di campioni per specie non consente però un adeguata analisi statistica (Fig. 53).
Fig.53. Livelli di perossidazione lipidica per singolo esemplare di tursiope (TTAS3-4) e delfino comune (DDAS1-4) campionati nel Santuario Pelagos.

62
6) RISULTATI DELLE DIAGNOSI ECOTOSSICOLOGICHE SUL POTENZIALE IMPATTO DELLE MICROPLASTICHE E DERIVATI TOSSICOLOGICAMENTE ATTIVI SU QUATTRO SPECIE DI CETACEI CAMPIONATE NELLE AREE DEL SANTUARIO PELAGOS.
Un’analisi complessiva dei contaminanti e dell’espressione proteica comparando tutte le specie campionate nelle campagne del 2013 è stata effettuata al fine di individuare il diverso impatto delle microplastiche e dei derivati tossicologicamente attivi a livello inter-specificico.
- Analisi dei Contaminanti - Livelli degli organoclorurati
Le concentrazioni dei contaminanti organoclorurati nelle quattro specie analizzate sia odontoceti (delfino comune, tursiope, stenella striata) che misticeti (balenottera comune) risultano più elevate nella specie stenella striata, confermando l’elevata esposizione di questa specie a composti liposolubili assunti tramite la dieta. Le concentrazioni più basse sia di PCB totali che di DDT sono stati misurati nel blubber sottocutaneo delle biopsie di balenottera comune (Fig. 54).
Fig.54.Livelli organoclorurati (PCB totali – DDT e metaboliti) nelle quattro specie di cetacei campionate nel Santuario Pelagos nell’anno 2013. DD (D. delphis), TT (T. truncatus), SC (S. coeruleoalba) e BP (B. physalus).
- Livelli di espressione proteica del CYP1A1 e CYP2B e di perossidazione lipidica
Le risposte biomarkers per l’espressione proteica CYP1A1 e CYP2B analizzate nelle quattro specie hanno evidenziato livelli di induzione proteica più elevati nella specie stenella striata come confermato anche dalle concentrazioni dei contaminanti organoclorurati (Fig. 54). La balenottera, pur avendo i livelli di PCB e Oc più bassi, presenta comunque una induzione delle due isoforme nell’ordine di grandezza delle altre due specie di odontoceti analizzate (tursiope e delfino comune) I livelli di perossidazione lipidica, invece, risultano omogenei nelle quattro specie, ma le risposte più elevate sono stati riscontrati nel delfino comune

63
Fig.55.Livelli di CYP1A1, CYP2B e LPO in quattro specie di cetacei campionati nel 2013 nel Santuario Pelagos. (D. delphis), TT (T. truncatus), SC (S. coeruleoalba) e BP (B. physalus). I CY1A1 e 2B sono espressi in pmol/mg proteine, i
valori di LPO in nmol/mg proteine.

64
E) SVILUPPO DI TECNICHE DI MICROSCOPIA OTTICA ED ELETTRONICA A SCANSIONE E TRASMISSIONE PER
LO STUDIO ANATOMICO E L’EVENTUALE INDIVIDUAZIONE DI MICROPLASTICHE IN EUFASIACEI
CAMPIONATI NEL SANTUARIO PELAGOS
Attraverso l’utilizzo del SEM (scanning electron microscope) e del TEM (trasmission electron microscope) è stata descritta l’anatomia del tratto gastrointestinale di esemplari di eufasiacei campionati nelle tre aree di studio del Santuario Pelagos per ottenere un quadro anatomicamente completo di questa specie al fine di valutare l’eventuale presenza di microplastiche ingerite. I campioni sono stati fissati immediatamente dopo il prelievo per la successiva analisi tramite entrambe le tipologie di microscopio. Una volta messa a punto e validata la migliore procedura attraverso prove sperimentali (diversi tempi di fissazione, diversi fissativi e diverse concentrazioni dei tamponi utilizzati) svolte su differenti specie di eufasiacei, è stato necessario il reperimento dei campioni di eufasciacei che riguardavano più da vicino il tema dell’impatto sulla balenottera concentrandosi sulla sua principale preda: la Meganictyphanes norvegica. L’analisi dei campioni di dimensioni tra i 5 e i 6 cm di questa specie è stata dipendente alla difficile reperibilità di organismi di tali dimensioni che risultano fondamentali per l’analisi del tratto gastrointestinale. I primi campioni ottenuti attraverso le retinate notturne/diurne (utilizzati come descritto sopra per la messa a punto della fissazione), essendo di dimensioni inferiori hanno reso difficile o non hanno permesso, in alcuni casi, l’isolamento del tratto gastrointestinale. Tuttavia, gli esemplari campionati nel Santuario Pelagos nel Settembre 2013 hanno reso possibile per la prima volta l’isolamento sia dello stomaco che dell’intestino e la loro fissazione per la successiva visualizzazione microscopio ottico (Fig. 56 e 58) ed al TEM. Inoltre in alcuni campioni è stata possibile la loro visualizzazione al SEM dopo una opportuna suddivisione longitudinale del campione (Fig. 57).
Fig.56.Sezione sagittale del tratto gastrointetstinale di esemplari di Meganictyphanes norvegica al microscopio ottico.

65
Fig.57. Sezione longitudinale del tratto gastrointestinale di Meganictyphanes norvegica al SEM.
Fig.58. Sezione sagittale dello stomaco di esemplari di M. norvegica al microscopio ottico.

66
E) SVILUPPO DI NUOVI BIOMARKES SU INDIVIDUI FREE-RANGING DI VARIE SPECIE DI CETACEI E
BALENOTTERA COMUNE SPECIFICI PER INDIVIDUARE LA PRESENZA E GLI EFFETTI DEGLI ADDITIVI DELLE
PLASTICHE (IN PARTICOLARE FTALATI).
Le slices (colture organotipiche “ex vivo”) di tessuto cutaneo e sottocutaneo sono state ottenute da sub-aliquote di biopsia cutanea ed esposte seguendo il protocollo descritto da Fossi et al. (2010). Le slices trattate sono state incubate per 24h in un mezzo di coltura cellulare con concentrazioni diverse delle diverse classi di contaminanti.
- Esperimenti in vitro ed ex-vivo
Slices di biopsia cutanea di balenottera comune e tursiope sono state esposte a concentrazioni crescenti di composti derivati o associati alla plastica quali bisfenolo A e ftalati, direttamente durante le attività di campionamento. Sulle slices sono state valutate le variazioni di espressione di geni coinvolti nel metabolismo dei composti derivati della plastica per determinare l’esposizione e la risposta degli organismi in successivi studi in natura. I biomarker molecolari analizzati sono: i recettori Peroxisome proliferator-activated alpha e gamma (PPARα e γ), il recettore per gli estrogeni alpha (ERα), il citocromo P450 1A1 (CYP1A) e 2B (CYP2B). In particolare, sono stati selezionati i geni PPAR A e G poiché sono coinvolti nel metabolismo dei composti additivi della plastica. I recettori “Peroxisome proliferator-activated” (PPARs) appartengono ad una superfamiglia di recettori ormonali nucleari, di cui sono presenti tre isoforme: PPAR A, B e G. Studi effettuati sui composti perfluorinati suggeriscono che alcuni effetti biologici dei PFC, ftalati e bisfenolo A sono mediati attraverso i PPAR.
Colture organotipiche di balenottera comune: trattamento con miscela di ftalati
Cinque colture organotipiche allestite da biopsie cutanee sono state trattate con una miscela di ftalati a concentrazioni crescenti. Slices di biopsie cutanee provenienti da 3 femmine (BPAS 5, BPAS 6, BPL 5) e 2 maschi (BPAS8 e BPAS 12) sono stati trattate con concentrazioni crescenti di una miscela di ftalati (metanolo-controllo, 0,1 μg/ml, 1 μg/ml, 10 μg/ml). Dall’analisi complessiva delle 5 curve emerge un aumento significativo dell’espressione media del gene PPAR G alle dosi più alte del trattamento (Fig. 59). In particolare, analizzando separatamente le curve derivanti da biopsie prelevate da individui maschi e femmine è evidente come l’espressione del gene PPAR G sia diversamente indotto nelle femmine, nelle quali si ha una repressione dovuta alla concentrazione di trattamento più elevata, mentre nei maschi l’espressioni aumenti di circa 22 volte alle concentrazioni più elevate rispetto al controllo. Il gene PPAR A è moderatamente indotto in seguito al trattamento con le dosi 0,1 μ/ml e 1 μ/ml della miscela di ftalati nei maschi, mentre nelle femmine non si ha una relazione lineare tra dose e risposta. Analogamente, anche l’espressione del gene ER 1 non mostra una linearità dose-risposta in entrambi i sessi. (Fig. 60-61)

67
Fig.59.Livelli espressione dei geni PPAR G, PPAR A e ER 1 nei trattamenti ex-vivo in slices di biopsia cutanea di balenottera comune trattate con una miscela di ftalati (FT) a dosi crescenti.
Fig.60. Livelli espressione dei geni PPAR G, PPAR A e ER 1 nei trattamenti ex-vivo in slices di biopsia cutanea di
femmine di balenottera comune trattate con una miscela di ftalati (FT) a dosi crescenti.

68
Fig.61. Livelli espressione dei geni PPAR G, PPAR A e ER 1 nei trattamenti ex-vivo in slices di biopsia cutanea di maschi di balenottera comune trattate con una miscela di ftalati (FT) a dosi crescenti.
Colture organotipiche di balenottera comune: trattamento con bisfenolo A
Tre colture organotipiche allestite da biopsie cutanee sono state trattate con concentrazioni crescenti di bisfenolo A (etanolo-controllo; 0,1 μg/ml, 1 μg/ml, 10 μg/ml, 100 μg/ml). I trattamenti ex-vivo sono stati condotti su due biopsie di balenottera comune femmina (BPAS 6, BPT 21) e un maschio (BPAS12). Dall’analisi complessiva delle tre curve, il gene PPAR A presenta un’espressione media che aumenta con l’aumentare delle dosi di trattamento (1 μg/ml, 10 μg/ml, 100 μg/ml ). Al contrario l’espressione dei geni PPAR G e ER 1 non presentano una correlazione dose risposta, in particolare l’espressione è più elevata nel controllo rispetto alle dosi crescenti di bisfenolo A.

69
Fig.62.Livelli espressione dei geni PPAR G, PPAR A e ER 1 nei trattamenti ex-vivo in slices di biopsia cutanea di balenottera comune trattate con bisfenolo A (BPA) a dosi crescenti.
Colture organotipiche di tursiope: trattamento con miscela di ftalati
Da un individuo maschio di tursiope sono state allestite colture organotipiche trattate con concentrazioni crescenti di una miscela di ftalati come descritto per la balenottera comune. L’espressione del gene PPAR G presenta un andamento dose-risposta che aumenta all’aumentare della dose di trattamento rispetto al controllo (metanolo). Al contrario, l’espressione del gene PPAR A non mostra alterazioni dei livelli si espressione in seguito all’esposizione alla stessa miscela.
Fig.63. Livelli espressione dei geni PPAR G e PPAR A nei trattamenti ex-vivo in slices biopsia cutanea di un maschio di tursiope trattate con una miscela di ftalati (FT) a dosi crescenti.

70
4
CONSIDERAZIONI CONCLUSIVE

71
Considerazione conclusive
Vari aspetti vengono discussi nella parte conclusiva in funzione degli obiettivi progettuali:
a) Principali considerazione sulle indagini ecotossicologiche su campioni di plancton/neuston e conteggio delle microplastiche nel Santuario Pelagos;
b) Principali considerazione sulle indagini ecotossicologiche sul potenziale impatto delle microplastiche e suoi derivati tossicologicamente attivi su B. physalus e altre specie di cetacei del Santuario Pelagos;
c) Principali considerazione sulle indagini ecotossicologiche sul potenziale impatto dei derivati delle microplastiche tossicologicamente attivi su B. physalus del Santuario Pelagos posti a confronto con esemplari campionati un area di “controllo” (Mar di Cortez-Messico).

72
A) Principali considerazione sulle indagini ecotossicologiche su campioni di plancton/neuston e
conteggio delle microplastiche nel Santuario Pelagos
I risultati conclusivi di questo progetto sono fra i primi dati a livello internazionale sulla presenza di microplastiche nel Mar Mediterraneo e i possibili effetti sugli organismi. I dati prodotti riportano l’abbondanza e la distribuzione spaziale delle microplastiche nell’area del Santuario Pelagos in relazione a tre diverse aree di studio (Mar Ligure, Mar di Sardegna e Mar Tirreno) ed in funzione di 3 anni di campionamento (2011-2013). In particolare nei 77 campioni superficiali di plancton/neuston campionati nei tre anni di progetto (2011-2013), il 75,3% conteneva particelle di microplastiche. La media totale degli items/m3 presento nelle 77 retinate superficiali effettuate nelle tre aree del Santuario Pelagos è di 0,36 items/m3. Tra le diverse aree di campionamento risulta evidente come il valore medio dell’Arcipelago Toscano (0,80 items/m3) sia più alto rispetto alle altre due aree (Mar di Sardegna e Mar Ligure) prendendo in considerazione i diversi anni di campionamento.
Fig.64. Valori % di delle varie categorie di microplastiche suddivise in base alle dimensioni nelle diverse aree ed anni di campionamento.
I dati di questo progetto rivelano inoltre che una delle aree più impattate da microplastiche del risulta l’AMP delle Cinque Terre. Questa area è stata confermata come hot spot per le microplastiche anche dai recenti studi di Collignon et al., 2012. Questi risultati sono importanti per focalizzare l’attenzione sullo stato di conservazione di un’area molto sfruttata dal turismo e sull’equilibrio tra misure di conservazione e di gestione. Infine, da una accurata indagine dimensionale dei frammenti di plastica campionati nelle varie areedi studio, emerge che tutte le aree di campionamento presentano valori più alti di microplastiche (<5mm) rispetto alle mesoplastiche (>5mm). Inoltre, le categorie di microplastiche più presenti nei campioni superficiali (ad eccezione del campioni prelevati nel Mar Ligure nel 2012), siano quelle 1,01 - 2.5 ; 2,51 - 5 mm. Infine, delle 11 retinate effettuate nella colonna d’acqua, nessuna presentava particelle di microplastica.

73
Tutti campioni di plancton/neuston superficiali e nella colonna d’acqua (ove possibile, in base alla quantità di materia organica prelevata) sono stati sottoposti ad analisi tossicologica del contenuto di ftalati evidenziando sia la presenza del principale additivo della plastica DEHP che del suo metabolita MEHP in gran parte dei campioni analizzati. In conclusione va sottolineato che l’abbondanza media di microplastiche stimata in questo studio (Santuario Pelagos) è paragonabile a quella riscontrata in altre aree ad alto impatto antropico, rappresentando quindi il primo campanello d’allarme sul rischio emergente da microplastiche nell’unica AMP pelagica del Mar Mediterraneo. Le cause di questo elevato livello di contaminazione possono essere molteplici.Le plastiche, derivanti dal turismo costiero, la pesca ricreativa e commerciale, scarichi urbani, il traffico e l’industria marittima possono entrare direttamente nell’ecosistema marino e costituire un rischio per il biota sia come macroplastiche che, a seguito di processi di degradazione a lungo termine, come microplastiche. In passato pochissimi studi hanno esplorato l’impatto delle microplastiche sugli organismi filtratori o altri animali planctofagi. Questo progetto rappresenta il primo studio al mondo che ha indagato sul potenziale impatto delle microplastiche su organismi filtratori di grande taglia, come le balenottere. Nel Mar Mediterraneo, durante il recente survey di Collignon et al., 2014 è stata rivelata la presenza di microplastiche negli stomaci della specie ittica Myctophum punctatum. Inoltre, diversi studi riportano informazioni sulla ingestione di frammenti di plastica di diversa dimensione, colore e forma da parte di pesci epibentofagi ed iperbentofagi (Ariidae, Scianidae) di ambienti estuarini demersali nell’Atlantico sud ovest tropicale. Di recente è stata riportata la presenza di interazioni tra diverse specie di mammiferi marini e frammenti di plastiche marine così come l’ingestione di plastiche nella specie Pontoporia blainvillei. Ciononostante, gli effetti fisiologici e tossicologici della ingestione di plastiche da parte di organismi filtratori sono stati fino ad oggi poco indagati e poco compresi, così come le implicazioni della ingestione delle plastiche attraverso la rete alimentare.

74
B) Principali considerazione sulle indagini ecotossicologiche sul potenziale impatto delle
microplastiche e suoi derivati tossicologicamente attivi su B. physalus del Santuario Pelagos
Da una approfondita indagine, il sistema geo-referenziato GIS, appare evidente come nelle due aree oggetto di studio del Santuario Pelagos, vi sia una sovrapposizione fra le aree di foraggiamento e relativo avvistamento/campionamento delle balenottere e veri e propri “Hot Spot” di presenza di microplastiche. Infatti il massimo addensamento di microplastiche in zone pelagiche, come già evidenziato anche in aree pelagiche remote del pianeta (North Pacific Gyre), appare sicuramente legato a correnti (a forma di Gyre) che causano l’addensamento di questi frammenti plastici in aree dove probabilmente sono anche presenti elevate concentrazioni di plancton e quindi più frequentate dalle balenottere per motivi di foraggiamento. In queste are “hot spot”le balenottere risultano di conseguenza fortemente esposte all’assunzione delle microplastiche durante le elevate attività di filtrazione, e a seguito di questo, all’impatto tossicologico di contaminanti rilasciati dalle plastiche come gli additivi (ftalati), ma anche da composti liposolubili POPs ad esse adesi ( OC, PAH, PBDEs).
Fig.65. Distribuzione e densità delle microplastiche e punti di campionamento delle balenottere nell’area del Mar di Sardegna considerata.

75
Fig.66. Distribuzione e densità delle microplastiche e punti di campionamento delle balenottere nell’area del Mar Ligure
considerata.
Un calcolo teorico dell’assunzione di microplastiche nel Santuatio Pelagos da parte di una balenottera comune è riportato nella tabella sottostante (Fossi et al 2014).
Tab.27. Calcolo dei parametri di alimentazione e ingestione di individui adulti di balenottera comune.
Balaenoptera physalus
Lunghezza media 20 m
Peso corporeo 50,000 kg
Volume di engulfment 71 m3
Numero di lunges giorno–1 83
Volume totale filtrato al giorno 5893 m3
Consumo totale di plancton al giorno 913 kg
Numero teorico di microplastiche ingerite al giorno 3653

76
Le plastiche e microplastiche in mare sono in grado di adsorbire e trasportare composti chimici, inclusi alti livelli di OC come PCB, DDT ed altri composti liposolubili come IPA. E’ noto, inoltre, che additivi usati comunemente come i ritardanti di fiamma brominati, gli ftalati ed il monomero costituente bisfenolo A, possono agire come distruttori endocrini perché sono in grado di mimare, competere per o inibire la sintesi di ormoni endogeni. In particolare gli ftalati sono stati associati con vari effetti a livello molecolare, cellulare e di organo in invertebrati acquatici e pesci (Oehlmann et al., 2009). Il bisfenolo A è un agonista degli estrogeni ed antagonista degli androgeni e può alterare la riproduzione e lo sviluppo, in maniera differenziata a seconda delle concentrazioni in cui è presente e delle specie esposte. Dalle indagini eco tossicologiche effettuate sulle balenottere comuni che si alimentano nelle aree di studio emerge che le concentrazioni di OC indagate sono più elevate negli esemplari di sesso maschile campionati nel 2012, mentre per gli individui di sesso femminile il valore più elevato dei PCB è da attribuirsi ad i valori particolarmente elevati di un singolo individuo (BL10). La differenza nelle concentrazioni nei due anni oggetto di studio può essere attribuita al diverso periodo di campionamento, settembre (2012) e inizio agosto (2013) nel Mar Ligure e luglio nel Mar di Sardegna (2012 e 2013), e di conseguenza ad un maggiore bioaccumulo di composti liposolubili legato alla dieta negli individui campionati alla fine del periodo estivo di foraggiamento (Fig. 67). Nell’anno 2012 gli individui di balenottera comune, sia maschi che femmine, presentano dei livelli di espressione del CYP1A più elevati (le femmine di circa 10 volte) rispetto ai valori di espressione dello stessi gene campionati nella campagna del 2013. Questo dato è strettamente correlato alle diverse concentrazioni di contaminanti OC rilevate nei due anni/periodi di campionamento.
Fig.67a. Livelli di OC e risposte biomarkers suddivisi per sesso (M, F), anno di campionamento (2012, 2013), area
di campionamento (Mar di Sardegna=Sar, Mar Ligure=Lig).
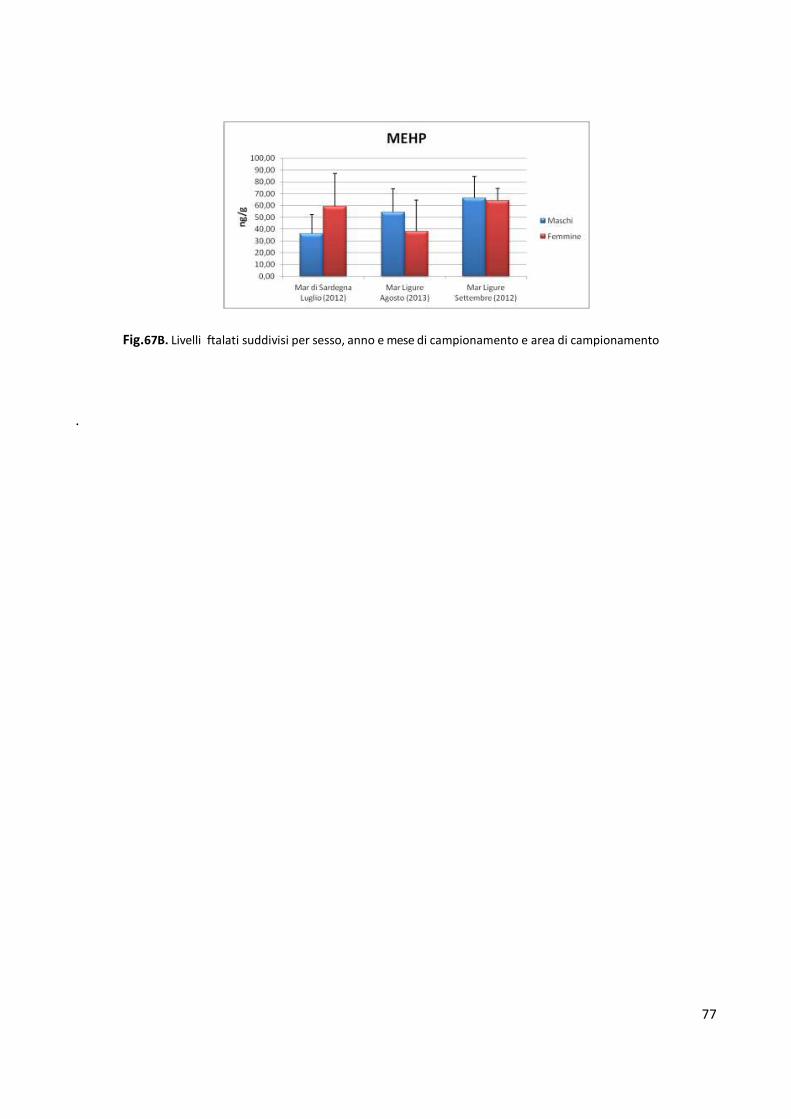
77
Fig.67B. Livelli ftalati suddivisi per sesso, anno e mese di campionamento e area di campionamento
.

78
C) Principali considerazione sulle indagini ecotossicologiche confrontando B. physalus del Santuario Pelagos con esemplari campionati un area di “controllo” (Mar di Cortez-Messico).
Allo scopo di valutare due aree a diverso impatto antropico è stata effettuata l’analisi su campioni di B. physalus campionate sia nel Santuario Pelagos che nell’area “di controllo” del Mar di Cortez (Mexico). I dati presi in esame si riferiscono sia ai livelli di contaminanti e alle risposte biomarker (Riportati nel Report del 1 anno di attività). Da questa indagine comparativa emerge che le balenottere del Santuario Pelagos hanno una concentrazione di MEHP superiore rispetto all’ area del Mar di Cortez, infatti hanno una concentrazione media di MEHP pari a 59,54 ng/g peso secco, mentre in quelli del Mar di Cortez la concentrazione è di 39,98 ng/g peso secco. Anche dalle analisi degli organoclorurati totali (DDT totali e i PCB totali) emerge che le concentrazioni negli individui provenienti dal Santuario Pelagos risultano più alte rispetto a gli individui campionati nel Mar di Cortez (eccetto per l’HCB). Le analisi delle risposte dei biomarker quali il citocromo P450 1A1/2B mediante western blot, la perossidazione lipidica e l’espressione genica del recettore per gli estrogeni alfa mostrano in tutti i test diagnostici utilizzati una risposta più alta negli individui del Santuario Pelagos rispetto a quelli del Mar di Cortez (eccetto CYP2B, maggiormente legato a processi di detossificazione), confermando il più alto rischio tossicologico dell’area Mediterranea rispetto all’area Messicana, in particolare in relazione alla presenza di composti con potenzialità da distruttori endocrini.
La balenottera come indicatore dello stato ecotossicologico di due bacini: mar Mediterraneo e
Mar di Cortez
Al fine di realizzare un’analisi conclusiva dei dati e di proporre la balenottera comune come indicatore integrato della contaminazione di un intero bacino, sono stati analizzati i dati relativi alle balene campionate nel Mar Mediterraneo (Santuario Pelagos) ed in Mar di Cortez (Messico) con le seguenti tecniche di analisi statistiche: A) Analisi gerarchica dei clusters: applicata allo scopo di verificare l’esistenza di sub-aree
omogenee all’interno dell’area investigata. Il numero dei clusters ottimo è stato determinato applicando la regola del “Cut”.
B) Analisi discriminante sui fattori della Principal Component Analysis: applicata allo scopo di evidenziare i parametri discriminanti i clusters definiti al punto A). La significatività dell’analisi è stata testata attraverso il Monte-Carlo Test della somma degli autovalori (divisi attraverso i ranghi) di una analisi discriminante. Versione non parametrica del Pillai test.
Tutte le analisi sono state svolte utilizzando il software R version 2.15.2 (2012-10-26), "Trick or Treat" ed i packages Energy, Ade4. Dall’analisi dei cluster si evince la presenza di due principali raggruppamenti distinti che raccolgono le osservazioni (considerando tutte le variabili) nel Mar Mediterraneo (Santuario Pelagos, Mar di Sardegna e Mar Ligure) e nel Mar di Cortez (Fig. 64).

79
Fig. 68. Dendrogramma dell’analisi gerarchica dei clusters.
Sui gruppi di osservazione è stata quindi applicata l’analisi discriminante sui fattori della PCA allo scopo di evidenziare le variabili cui può essere imputata una eventuale discriminazione delle aree esaminate. Tale analisi è stata svolta considerando le osservazioni sugli individui di balenottera del Mar di Cortez e delle due aree del Santuario Pelagos)
Le figure 69 e 70 mostrano i risultati dell’analisi, prima separando le tre popolazioni di dati e successivamente solo comprando gli esemplari provenienti dai due bacini.

80
d = 0.5
Canonical weights
CYP1
P
B DD T
d = 0.5 d = 1
CYP2B
PCB
Ocs
LPO
DDT
MEHP
HCB
CYP1A1
Canonical weights
Messico
Liguria
CYP2B
LPO
A1
MEH
PC Ocs
Sardegna
HCB
Cos(variates,canonical variates)
Eigenvalues
Scores and classes
d = 0.5
Liguria
RS1
RS7
RS5
RS3
RS4
Messico
RS2
RS6
Sardegna
Cos(components,canonical variates Class scores
Fig. 69. Analisi discriminante sui fattori della PCA. Grafico composito: Plot dei pesi canonici (in alto a sinistra);
rappresentazione della matrice di struttura: plot delle correlazioni fra le variabili discriminanti e gli assi discriminanti (al centro a sinistra); Istogramma degli autovalori (in basso a sinistra); plot delle correlazioni fra i fattori della PCA e gli assi discriminanti (al centro in basso); plot dei centroidi di gruppo (in basso a destra); plot dei punteggi canonici (main plot).

80
-2
-1
0
1
2
-1
0
1
2
-1
0
1
2
3
-1
0
1
2
3
-1
0
1
2
-1
0
1
2
3
-1
0
1
2
3
-1
0
1
2
3
CYP1A1 CYP2B LPO
Cortez
Pelagos Cortez
Pelagos
Cortez
Pelagos
-2 -1 0 1 2 -2 -1 0 1 2 -2 -1 0 1 2
MEHP
HCB
DDT
Pelagos
Cortez Pelagos
Pelagos
Cortez
Cortez
-2 -1 0 1 2 -2 -1 0 1 2 -2 -1 0 1 2
PCB Ocs
Pelagos Pelagos
Cortez
Cortez
-2 -1 0 1 2 -2 -1 0 1 2
Fig. 70. Analisi discriminante sui fattori della PCA. Grafico dei caninical scores by discriminant variables
Il grafico, diverso dal precedente perché, in presenza di due soli gruppi viene definito un solo asse discriminante, rappresenta, per ciascuna variabili discriminante, i canonical scores. Dalla posizione che i centroidi di gruppo assumono lungo l’asse y=0 si osserva:
1) Le variabili HCB e LPO non sembrano discriminare i due bacini 2) Nell’ordine le variabili DDT, OC, MEHP,PCB discriminano i due bacini essendo prevalenti in
Pelagos 3) CYP1A1 e CY2B hanno un effetto discriminativo più blando: la prima assume valori più
elevati in Pelagos, la seconda valori più elevati in Cortez. Il test di Montecarlo replicato 999 volte è risultato significativo (RV=0.08 p=0.006) a riprova del fatto che il modello discriminante applicato è significativo.

81
In conclusione I dati ottenuti in questo progetto (primo e secondo anno di attività) rappresentano la prima evidenza a livello mondiale del potenziale impatto dei più abbondanti derivati delle plastiche (gli ftalati) nel secondo più grande mammifero planctofago, la balenottera comune. Questi dati sottolineano inoltre l’elevata presenza di microplastiche nelle varie aree oggetto di studio del Santuario Pelagos, sottolineando il rischio di esposizione della cetofauna che frequenta la suddetta area.
Questi dati, presentati sia in lavori scientifici pubblicati su importanti riviste del settore che in vari contesti congressuali internazionali (vedi allegato 2) hanno avuto un particolare riconoscimento sullo scenario internazionale, soprattutto da parte dell’ IWC come confermato da: a) comitato scientifico dell’ International Whaling Commission - Panama 2012, b) Marine debris workshop IWC – Wood Hole 2013; c) Steering Commitee di Pollution 2020 (St. Andrews 2014), dove uno dei temi prioritari è l’impatto delle plastiche e microplastiche sui cetacei, con particolare riferimento al caso di studio della balenottera comune del Mediterraneo e al presente progetto. La balenottera comune è un cetaceo cosmopolita. E’presente nelle più ampie masse d’acqua del pianeta, dall’equatore alle regioni polari. Nonostante la sua distribuzione cosmopolita è classificata come endangered nella lista rossa dell’IUCN. In generale, l’alimentazione delle balenottere è stata descritta come l’evento biomeccanico più grande mai esistito sulla terra. La balenottera si nutre all’inizio nuotando rapidamente verso le prede e poi decelerando mentre apre la bocca per ingerire enormi quantità di acqua e prede. La balenottera comune e la balenottera azzurra che si nutrono di krill concentrano i loro sforzi su grandi aggregazioni di krill (150-300 m) nella colonna d’acqua durante il giorno e si nutrono in superficie durante la notte.
E’ ben noto che la balenottera nel Mediterraneo si nutre di preferenza dell’eufasiaceo planctonico Meganyctifanes norvegica, ciò nonostante, a seconda dell’area e della stagione, si nutre anche di un ampio spettro di organismi marini, inclusi copepodi, altre specie di eufasiacei e piccoli pesci. Ad ogni movimento di ingestione una balenottera può assumere circa 70.000 l di acqua. Per questo motivo è a rischio per l’ingestione di una quantità molto elevata di frammenti di plastica sia direttamente dall’acqua che indirettamente dal plancton (sia durante l’alimentazione superficiale che durante quella profonda). Dopo l’ingestione delle microplastiche la balenottera può essere esposta al rilascio di additivi come OC, PBDE, ftalati ed bisfenolo A ed ai loro potenziali effetti tossicologici. Dati preliminari sul MEPH in 5 campioni di eufasiacei quali Euphausia krohni, campionati nel canale di Sicilia, riportano alti livelli di questo contaminante, con range tra 8,35 e 51,14 ng/g. Questi risultati suggeriscono la presenza di derivati delle plastiche anche in specie planctoniche residenti nella colonna d’acqua. Considerando la presenza di microplastiche nell’ambiente Mediterraneo, la presenza di additivi delle plastiche nel grasso sottocutaneo di esemplari di balenottera (sia spiaggiati che free-ranging) e la lunga aspettativa di vita di questa specie, la balenottera appare esposta in maniera cronica ed elevata a contaminanti emergenti persistenti come risultato della ingestione delle microplastiche. In questo stesso contesto, i risultati ottenuti suggeriscono che gli ftalati possono essere usati come traccianti per l’assunzione delle microplastiche da parte della balenottera sia direttamente dalla filtrazione del mezzo acquatico che dall’ingestione di plancton già contaminato dagli stessi additivi della plastica. Questi dati rappresentano un primo segnale di allarme sul rischio potenziale che la popolazione mediterranea di balenottera comune sia esposta a distruttori endocrini come il MEHP. Questi risultati sono in linea con quanto riportato in precedenza da Fossi et al., 2010, riguardo al pericolo da distruttori endocrini in questa specie nel mediterraneo. I “undesirable biological effects” (in

82
accordo con il concetto di biomarker presente nel Descrittore 8/10 della Strategia Marina Europea) evidenziati suggeriscono come la popolazione mediterranea di balenottere possa essere esposta ad una miscela di contaminanti persistenti ed emergenti tra cui gli interferenti endocrini, che possono alterare la sopravvivenza di questa popolazione già considerata endangered. A questo riguardo, censimenti condotti in gran parte del Mediterraneo occidentale hanno stimato che la popolazione della balenottera fosse di 3.583 individui, di cui 901 localizzati nel bacino corso- ligure-provenzale (Forcada 1995 e 1996). Dati più recenti riguardanti il Santuario Pelagos indicano che la popolazione stimata è diminuita marcatamente (approssimativamente di un fattore 6) negli ultimi 20 anni (Panigada et al, 2011), focalizzando l’attenzione sulle problematiche di conservazione di questa specie. In conclusione, i presenti dati hanno rappresentano la prima evidenza a livello mondiale del potenziale impatto delle microplastiche e derivati (additivi delle plastiche-ftalati) nei cetacei misticeti ed in particolare nella balenottera comune. Questi risultati sottolineano l’importanza di future ricerche riguardo lo studio dell’impatto tossicologico delle microplastiche in specie filtratrici come i cetacei misticeti, lo squalo elefante (Cetorhinus maximus) ed la mobula (Mobula mobula) (Fossi et al. 2014) Questi risultati rafforzano inoltre l’uso potenziale di queste specie per l’implementazione del Descrittore 10 (marine litter) della Direttiva Quadro dell Strategia Marina Europea come indicatori della presenza e dell’impatto di microplastiche nell’ambiente pelagico (Fossi et al. 2014, Galgani et al. 2014).

83
PRINCIPALI RISULTATI OTTENUTI DAL PROGETTO E POSSIBILI SVILUPPI FUTURI
Questi risultati rappresentano la prima evidenza a livello mondiale del potenziale impatto delle microplastiche e derivati (additivi delle plastiche-ftalati) nei cetacei misticeti ed in particolare nella balenottera comune. Questi importanti risultati conseguiti h an n o ot t en u t o u n r i con os c imen t o sullo scenario internazionale come confermato dal comitato scientifico dell’International Whaling Commission (Panama 2012, Woods Hole 2013, St. Andrews 2014) e come confermato dalla necessità di implementare il Descrittore 10 (Marine Litter) della Direttiva Quadro della Strategia Marina Europea con lo studio di grandi organismi filtratori (Fossi et al. 2014, Galgani et al. 2014). In sintesi i principali risultati del progetto in funzione degli obbiettivi proposti sono:
E’ stato realizzato un protocollo metodologico standard di riferimento per l’analisi di
microplastiche e derivati tossicologicamente attivi (ftalati) in campioni di plancton e micro‐layer superficiale (incorporato nell’attuale Monitoraggio per il Descrittore 10 da parte delle Regioni)
E’ stata effettuata una mappatura delle microplastiche in un area più vasta del Santuario Pelagos comprendente le aree del Mar Ligure, Mar di Sardegna e Mar Tirreno (Arcipelago Toscano). E’ stato inoltre realizzato un primo conteggio e mappatura delle Macroplastiche superficiali nelle varie aree di indagine del Santuario Pelagos
E’ stato realizzato il primo protocollo metodologico standard di riferimento per l’analisi di composti potenzialmente tossici derivati da microplastiche in campioni di biopsie cutanee di balenottera comune e di altre specie di cetacei residenti nel Santuario Pelagos.
Sono state sviluppate metodologie diagnostiche ex vivo (slices di biopsie cutanee) per evidenziare l’esposizione e l’effetto dei composti derivati da microplastiche o da loro veicolati, al fine di diagnosticare gli effetti biopsie cutanee di individui free‐ranging.
E’ stata realizzata una prima valutazione dei livelli e degli effetti dei composti derivati da microplastiche, o da loro veicolati, sulla popolazione di balenottera comune campionata nell’area del Santuario Pelagos e paragonata con un’area a ridotto impatto antropico (Mar di Cortez –Messico). Le stesse indagini sono inoltre state realizzate su individui free-ranging di altre specie di cetacei: stenella striata, delfino comune, grampo e tursiope.
Sono state sviluppate tecniche diagnostiche più specifiche per evidenziare la presenza di microplastiche in individui planctonici e neustonici (rilevamento con tecniche di microscopia ottica e microscopia elettronica a scansione e trasmissione);
E’ stata proposta la prima bozza di applicabilità del “modello balenottera” come indicatore della qualità di “mega‐aree” pelagiche (vedi Risultati Fase III, IV). L’importanza di questo risultato è connesso al conseguimento per la prima volta informazioni per determinare la presenza o meno di effetti ecotossicologici diretti connessi alla presenza di rifiuti galleggianti e loro derivati sugli ecosistemi marini, determinazione che risulta di estrema importanza per l’acquisizione di dati ed informazioni finalizzate al popolamento del descrittore 10 (marine litter) per l’implementazione della direttiva quadro sulla strategia europea dell’ambiente marino, per il quale non esistono al
84
momento metodiche alternative. A seguito degli importanti risultati conseguiti dallo svolgimento del presente si ritiene di particolare importanza il completamento e pianificazione di attività progettuali future sui seguenti aspetti:
Completare la mappatura delle microplastiche nell’intero Santuario Pelagos monitorando le aree non indagate in questa fase progettuale.
Espandere l’area di indagine, sia per il mappaggio delle microplastiche che per le indagini ecotossicologiche sulla Balenottera comune nei quartieri invernali del Canale di Sicilia (area di Lampedusa).
Approfondire gli aspetti tossicologici legati alla presenza di altri composti tossici rilasciati o trasportati dalle plastiche (Ritardanti di fiamma, Bisfenolo A, ecc).
Questi risultati sottolineano inoltre l’importanza di future ricerche riguardo lo studio dell’impatto tossicologico delle microplastiche in altre specie filtratrici come lo squalo elefante (Cetorhinus maximus) ed la mobula (Mobula mobula) (Fossi et al. 2014).

85
COLLABORAZIONI
Durante lo svolgimento del progetto, l’Università di Siena ha collaborato con i seguenti ricercatori
ed istituti di ricerca.
Per le campagne di campionamento:
Dr. Giancarlo Lauriano, ISPRA, Roma
Dr. Simone Panigada, Tethys Research Institute, Milano
Dr. Jorge Urban , UBCS, Messico
Per la analisi di laboratorio e dei dati:
Dr. Maria Grazia Finoia, ISPRA, Roma
Prof. Pietro Lupetti, Università di Siena
Dr. Fabrizio Rubegni, Regione Toscana

86
5
BIBLIOGRAFIA

87
Bibliografia consultata
Bakir A., Rowland S.J., Thompson R.C. Competitive sorption of persistent organic pollutants onto microplastics in the marine environment. Mar. Poll. Bul. 2012, 64: 2782-2789.
Bakir A., Rowland S.J., Thompson R.C. Enhanced desorption of persistent organic pollutants from microplastics under simulated physiological conditions. Env. Poll. 2014, 185: 16-23.
Barnes, D.K.A., Galgani, F., Thompson, R.C., Barlaz, M., 2009. Accumulation and fragmentation of plastic debris in global environments. Phil. Trans. R. Soc. B 364 (1526), 1985-1998.
Barron, M.G., Schultz, I.R., Hayton, W.L., 1989. Presystemic branchial metabolism limits di-2-ethylhexyl phthalate accumulation in fish. Toxicol. Appl. Pharm. 98, 49-57.
Boerger, C., Lattin, G., Moore, S.L., Moore, C.J., 2010. Plastic ingestion by planktivorous fishes in the North Pacific Central Gyre. Mar. Poll. Bull. 60 (12), 2275–2278.
Borch, J., Axelstad M., Vinggaard A.M., Dalgaard M., 2006. Diisobutyl phthalate has comparable anti- androgenic effects to di-n-butyl phthalate in fetal rat testis. Toxicol. Lett. 163, 183-190.
Browne M.A., Dissanayake A., Galloway T.S., Lowe D.M., Thompson R.C. Ingested microscopic plastic translocates to the circulatory system of the mussel, Mytilus edulis (L). Environ. Sci. & Tech 2008,42: 5026- 5036.
Browne M.A., Niven S.J., Galloway T., Rowland S.J, Thompson R.C. Microplastic moves pollutants to worms, reducing functions linked to health and biodiversity. Curr. Biol. 2013, 2: 2388-2392.
Cole, M., Lindeque, P., Fileman, E., Halsband, C., Goodhead, R., Moger, J., Galloway, T.S., 2013. Microplastic ingestion by zooplankton. Environmental Science and Technology 47, 6646-55.
Collignon A., Hecq J.H., Galgani F., Voisin P., Collard F., Goffart A., 2012. Neustonic microplastic and zooplankton in the North Western Mediterranean Sea. Mar. Pollut. Bull. 64, 861-864.
CollignonA., Hecq J.H., Galgani F., Collard F., Goffart A. Annual variation in neustonic micro- and meso- plastic particles and zooplankton in the Bay of Calvi (Mediterranean-Corsica). Mar. Poll. Bull.2014, 79: 293- 298.
Croll, D.A., Marinovic, B., Benson, S., Chavez F.P., Black, N., Ternullo, R., Tershy B.R., 2005. From wind to whales: trophic links in a coastal upwelling system. Mar. Ecol-Prog. Ser. 289, 117–130. Croll, D.A., Tershy, B.R., 2002. Filter feeding. In: Perrin WF, Wursig B, Thewissen JGM (eds) Encyclopedia of marine mammals. Academic Press, San Diego, pp. 428–432.
Derraik, J.G.B., 2002. The pollution of the marine environment by plastic debris: a review. Mar. Pollut. Bull. 44, 842-852.
Engler, R.E., 2012. The complex interaction between marine debris and toxic chemicals in the ocean. Environ. Sci.&Tech 46, 12302-15.

88
Forcada, J., Agiolar, A., Hammond, P., Pastor, X., Aguilar, R., 1996. Distribution abundance of fin whales (Balaenoptera physalus) in the western Mediterranean Sea during the summer. J. Zool. 238, 23-24.
Forcada, J., Notarbartolo di Sciara, G., Fabbri, F., 1995. Abundance of fin whales and striped dolphins summering in the Corso Ligurian basin. Mammalia 59, 127-140.
Fossi MC, Casini S, Maltese S, Panti C, Spinsanti G, Marsili L. An "ex vivo" model to evaluate toxicological responses to mixtures of contaminants in cetaceans: Integumentum biopsy slices. Env. Toxicol.2013 doi: 10.1002/tox.21841.
Fossi, M.C., Panti, C., Guerranti, C., Coppola, D., Giannetti, M., Marsili, L,. Minutoli, R., 2012 Are baleen whales exposed to the threat of microplastics? A case study of the Mediterranean fin whale (Balaenoptera physalus). Mar. Poll. Bull.64, 2374-2379.
Fossi, M.C., Urban, J., Casini, S., Maltese, S., Spinsanti, G., Panti, C., Porcelloni, S., Panigada, S., Lauriano, G., Niño-Torres, C., Rojas-Bracho, L., Jimenez, B., Muñoz-Arnanz, J., Marsili, L., 2010. A multi-trial diagnostic tool in fin whale (Balaenoptera physalus) skin biopsies of the Pelagos Sanctuary (Mediterranean Sea) and the Gulf of California (Mexico). Mar. Environ. Res. 69 (1), S17-S20.
Hidalgo-Ruz, V., Gutow, L., Thompson R.C., Thiel, M., 2012. Microplastics in the Marine Environment: a Review of the Methods used for Identification and Quantification. Environ. Sci. Technol. 46 (6), 3060-3075.
Koelmans A.A., Besseling E., Foekema E.M. Leaching of plastic additives to marine organisms. Env. Poll. 2014, 187: 49-54.
Koelmans, A.A., Besseling, E., Wegner, A., Foekema, E.M., 2013. Plastic as a carrier of POPs to aquatic organisms: a model analysis Environ. Sci. & Tech 203, 47 8992-3.
Latini, G., 2005. Monitoring phthalate exposure in humans. Clin. Chim. Acta 361 (1), 20-29.
Latini, G., De Felice, C., Verrotti, A., 2004. Plasticizers, infant nutrition and reproductive health. Reprod. Toxicol. 19, 27-33.
Latini, G., Wittassek, M., Del Vecchio, A., Presta, G., De Felice C., Angerer, J., 2009. Lactational exposure to phthalates in Southern Italy. Environ. Internat. 35, 236-239.
Lithner D., Larsson A., Dave G. Environmental and health hazard and assessment of plastic polymers based on chemical composition. Sci, of the Tot. Env. 2011, 409:3309-3324.
Lithner, D., Damberg, J., Dave, G., Larsson, A., 2009. Leachates from plastic consumer products - Screening for toxicitywith Daphniamagna. Chemosphere 74, 1195-1200.
Lithner, D., Larsson, Å., Dave, G., 2011. Environmental and health hazard ranking and assessment of plastic polymers based on chemical composition. Sci. Total Environ. 409, 3309-3324.
Lusher, A.L., McHugh, M., Thompson, R.C., 2013. Occurrence of microplastics in the gastrointestinal tract of pelagic and demersal fish from the English Channel. Mar. Poll. Bull. 67,94-99.
Mankidy R., Wiseman S. Ma H., Giesy J.P. Biological impact of phthalates. Tox. Letters 2013, 50-58.

89
Marsili L, Fossi MC, Neri G, Casini S, Gardi C, Palmeri S, Tarquini E, Panigada S. Skin biopsies for cell cultures from Mediterranean free-ranging cetaceans. Mar Environ Res. 2000 50(1-5):523-6.
Moore, C.J., Moore, S.L., Leecaster, M.K., Weisberg, S.B., 2001. A comparison of plastic and plankton in the North Pacific Central Gyre. Mar. Pollut. Bull. 42 (12), 1297–1300.
Murray, F., Cowie, F.R., 2011. Plastic contamination in the decapod crustacean Nephropsnorvegicus (Linnaeus, 1758). Mar. Poll. Bull. 62 (6), 1207-1217.
Notarbartolo di Sciara, G., Zanardelli, M., Jahoda, M., Panigada, S., Airoldi S., 2003. The fin whale Balaenoptera physalus (L. 1758) in the Mediterranean Sea. Mammal Rev. 33 (2), 105-150.
Oehlmann, J.R., Schulte-Oehlmann, U., Kloas, W., Jagnytsch, O., Lutz, I., Kusk, K.O., Wollenberger, L., Santos, E.M., Paull, G.C., Van Look, K.J.W., Tyler, C.R., 2009. A critical analysis of the biological impacts of plasticizers on wildlife. Philos. T. Roy. Soc. B 364, 2047-2062.
Orsi Relini, L., Giordano, A., 1992. Summer feeding of the fin whale, Balaenoptera physalus, in the Liguro- Provençal Basin. Eur. Res. Cetaceans 6, 138–141.
Panigada, S., Lauriano, G., Burt, L., Pierantonio N., Donovan, G., 2011. Monitoring Winter and Summer Abundance of Cetaceans in the Pelagos Sanctuary (Northwestern Mediterranean Sea) Through Aerial Surveys. PLoS ONE 6(7): e22878. doi:10.1371/journal.pone.0022878.
Panti C, Spinsanti G, Marsili L, Casini S, Frati F, Fossi MC. 2011. Ecotoxicological diagnosis of striped dolphin (Stenella coeruleoalba) from the Mediterranean basin by skin biopsy and gene expression approach. Ecotoxicology 20:1791–800.
Relini, G., Orsi Relini, L., Cima, C., Fasciana, C., Fiorentino, F., Palandri, G., Relini, M., Tartaglia, M.P.,Torchia, G., Zamboni, A., 1992. Macroplancton, Meganyctiphanes norvegica, and fin whales, Balaenoptera physalus, along some transects in the Ligurian Sea. Europ. Res. Cetaceans 6, 134–137.
Rizzo ML, Szekely, GJ(2010). DISCO Analysis: A Nonparametric Extension of Analysis of Variance, Annals of
Applied Statistics, Vol. 4, No. 2, 1034-1055.
Robards, M.D., Piatt, J.F., Wohl, K.D., 1995. Increasing frequency of plastic particles ingested by seabirds in the subarctic North Pacific. Mar. Pollut. Bull. 30, 151–157.
Rochman C.M. Lewison R., Eriksen M., Allen H., Cook A.M, The S.J. Plybrominated diphenyl ethers (PBDEs) in fish tissue may be an indicator of plastic contamination in marine habitats. Sci. Tot. Env. 2014, 622-633.
Rochman C.M. Plastics and priority pollutants: a multiple stressor in aquatic habitats. Environ. Sci. & Tech.2013, 47: 2439-2440.
Rochman C.M., Hoh E., Kurobe T., Teh S.J. Ingested plastic transfers hazardous chemicals to fish and induces hepatic stress. Nature Sci. Rep. 2013, 3: 3263.
Ryan, P.G., Moore, C.J., Van Franeker, J.A., Moloney, C.L., 2009. Monitoring the abundance of plastic debris in the marine environment. Philos. Trans. R. Soc. B 364, 1999–2012.

90
Setala O, Fleming-Lehtinen V, Lehtiniemi M.Ingestion and transfer of microplastics in the plaktonic food web.Env.Poll.2014, 185:77-83.
Singh S., Lung Li S.S. Phthalates: toxicogenomics and inferred human diseases. Genomics 2011, 97: 148-157. Singh S.,
Lung Li S.S. Phthalates: toxicogenomics and inferred human diseases. Genomics 2011, 97: 148-157
Szekely, G. J. (2000) Technical Report 03-05, E-statistics: Energy of Statistical Samples, Department of
Mathematics and Statistics, Bowling Green State University.
Szekely, G. J. and Rizzo, M. L. (2004) Testing for Equal Distributions in High Dimension, InterStat, November (5).
Szekely, G. J. and Rizzo, M. L. (2005) Hierarchical Clustering via Joint Between-Within Distances: Extending Ward's
Minimum Variance Method, Journal of Classification 22(2) 151-183.
Talsness, C.E., Andrade, A.J.M., Kuriyama, S.N., Taylor, J.A., vom Saal, F.S., 2009. Components of plastic: experimental studies in animals and relevance for human health. Philos. T. Roy. Soc. B 364, 2079-2096.
Teuten, E.L., Rowland, S.J., Galloway, T.S., Thompson, R.C., 2007. Potential for plastics to transport hydrophobic contaminants. Environ. Sci. Technol. 41, 7759-7764.
Thioulouse, J, Chessel, D, Doledec, S Olivier, J.M. ADE-4: a multivariate analysis and graphical display software.
Statistics and Computing (1997) 7,75-83.
Thompson, R.C., Olsen, Y., Mitchell, R.P., Davis, A., Rowland, S.J., John, A.W.G., McGonigle, D., Russell, A.E., 2004. Lost at sea: where is all the plastic? Science 304, 838.
Ventrice P., Ventrice D., Russo E., de Sarro G. Phthalates: european regulation, chemistry, pharmacokinetic and related toxicity. Env. Toxicol. and Pharm. 2013: 36: 88-96.
von Moos, N., Burkhardt-Holm. P., Köhler. A. Uptake and effects of microplastics on cells and tissue of the blue mussel Mytilus edulis L. after an experimental exposure. Environ. Sci. & Tech 2012 46, 11327-35.
Voparil, I.M., Mayer, L.M., 2000. Dissolution of sedimentary polycyclic aromatic hydrocarbons into the lugworm’s (Arenicola marina) digestive fluids. Environ. Sci. Technol. 34, 1221-1228.
Wright, SL,Thompson,RC,Galloway,TS,2013.The physical impacts of microplastics on marine organisms: A review. Env. Poll. 178, 483-92.

Annesso 1
ELABORAZIONE GRAFICA ZOOPLANCTON

I
Mar di Sardegna
Elaborazione grafica tramite GIS dell’abbondanza dei principali organismi zooplanctonici campionati nel Mar di Sardegna (2011, 2012, 2013) . In rosso i punti di campionamento.

II

III
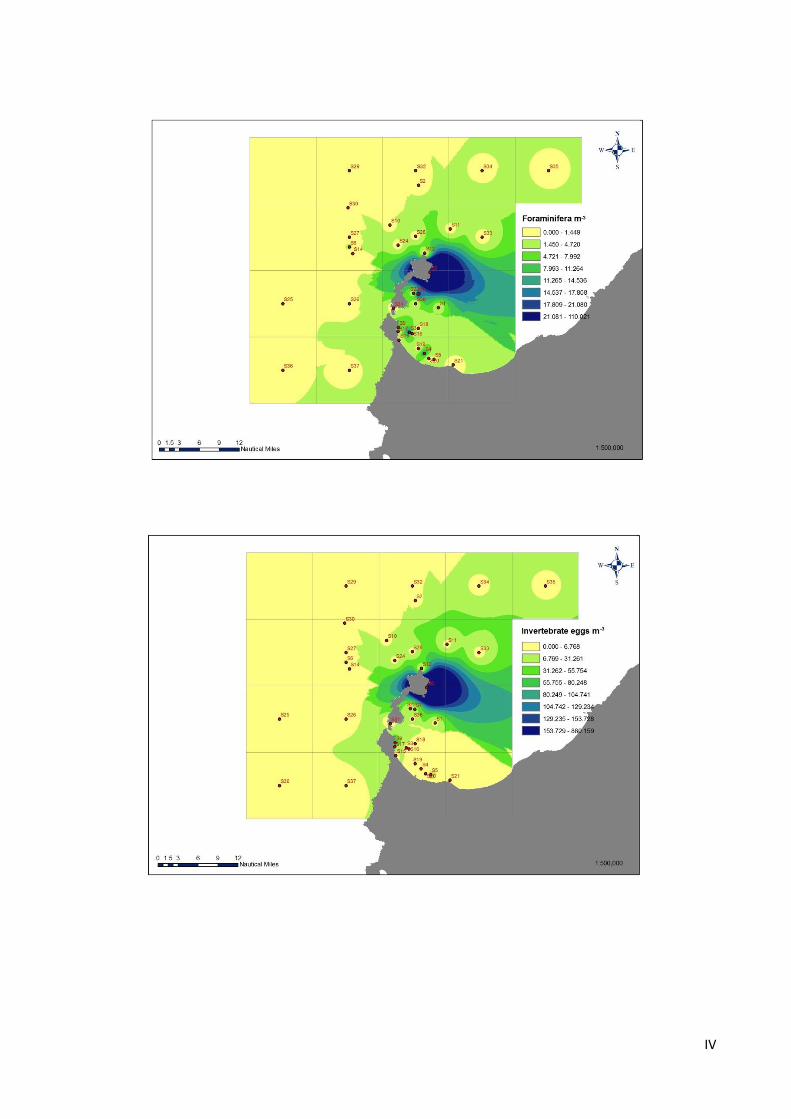
IV

V

VI

VII
Mar Ligure
Elaborazione grafica tramite GIS dell’abbondanza dei principali organismi zooplanctonici
campionati nel Mar Ligura (2011, 2012, 2013) . In rosso i punti di campionamento

VIII

IX

X

XI

XII

Annesso 2
PRINCIPALI PUBBLICAZIONI PRODOTTE

Are baleen whales exposed to the threat of microplastics? A case studyof the Mediterranean fin whale (Balaenoptera physalus)
Maria Cristina Fossi a,⇑, Cristina Panti b, Cristiana Guerranti a, Daniele Coppola a, Matteo Giannetti a,b,Letizia Marsili a, Roberta Minutoli c
aDepartment of Environmental Sciences, University of Siena, Via P.A. Mattioli 4, 53100 Siena, ItalybDepartment of Evolutionary Biology, University of Siena, Via A. Moro 2, 53100 Siena, ItalycDepartment of Animal Biology and Marine Ecology, University of Messina, Viale F. Stagno D’Alcontres, 31, 98166 Messina, Italy
a r t i c l e i n f o
Keywords:Microplastic particlesMediterranean SeaNeustonSurface planktonPhthalatesFin whale
a b s t r a c t
Baleen whales are potentially exposed to micro-litter ingestion as a result of their filter-feeding activity.However, the impacts of microplastics on baleen whales are largely unknown. In this case study of theMediterranean fin whale (Balaenoptera physalus), we explore the toxicological effects of microplasticson mysticetes. The study included the following three steps: (1) the collection/count of microplasticsin the Pelagos Sanctuary (Mediterranean Sea), (2) the detection of phthalates in surface neustonic/plank-tonic samples, and (3) the detection of phthalates in stranded fin whales. A total of 56% of the surfaceneustonic/planktonic samples contained microplastic particles. The highest abundance of microplastics(9.63 items/m3) was found in the Portofino MPA (Ligurian Sea). High concentrations of phthalates (DEHPand MEHP) were detected in the neustonic/planktonic samples. The concentrations of MEHP found in theblubber of stranded fin whales suggested that phthalates could serve as a tracer of the intake of micro-plastics. The results of this study represent the first warning of this emerging threat to baleen whales.
� 2012 Elsevier Ltd. All rights reserved.
1. Introduction
The emerging issue of microplastics (plastic fragments smallerthan 5 mm) in the marine environment has recently receivedincreasing attention (Hidalgo-Ruz et al., 2012). This ubiquitous, per-sistent form of micro-debris requires centuries to degrade com-pletely. Microplastics are primarily the result of the degradation ofplastics released into the environment since the beginning of theplastic age. Micro-debris floating in the Mediterranean Sea hasreached maximum levels of 892,000 particles/km2. Recently, Colli-gnon et al. (2012) determined neustonicmicroplastic and zooplank-ton abundance in the northwestern Mediterranean Sea and showedthat the estimated mean abundance of microplastics was of thesame order of magnitude as that found for the North Pacific Gyre(0.334 particles/m2, Moore et al., 2001), underscoring the high levelof this emerging threat in the Mediterranean environment.
Microplastics accumulate at the sea surface, especially withinthe neustonic habitat (Ryan et al., 2009). This habit harbors a spe-cifically adapted zooplankton fauna. There is increasing concernthat a wide range of marine organisms are affected by plasticwastes in the sea. However, the mechanical, physical and toxico-
logical impacts of these wastes are largely unknown. More than180 species, including planktophagous species, have been shownto absorb plastic debris. Macrodebris ingestion and entanglementare well documented in sea birds, mammals and turtles and morerecently in fishes (planktivorous and benthophagous) and inverte-brates (Robards et al., 1995; Derraik, 2002; Thompson et al., 2004;Ryan et al., 2009; Boerger et al., 2010; Collignon et al., 2012; Pos-satto et al., 2011; Dantas et al., 2012; Murray and Cowie, 2011).
No information has previously been reported on the impacts ofmicroplastics on baleen whales, such as fin whales (Balaenopteraphysalus). The filter-feeding activities of these whales represent apotential source of exposure to micro-litter ingestion. The finwhale, the only resident mysticete in the Mediterranean Sea, formsaggregations during the summer on the feeding grounds of the Pel-agos Sanctuary Marine Protected Area (MPA) (Notarbartolo di Sci-ara et al., 2003). These whales feed primarily on planktoniceuphausiid species. With each mouthful, the whales can trapapproximately 70,000 l of water, and their feeding activities in-clude surface feeding. They could therefore face risks caused bythe ingestion and degradation of microplastics. Micro-debris canbe a significant source of lipophilic chemicals (primarily persistentorganic pollutants – POPs) and a source of pollutants such as poly-ethylene, polypropylene and, particularly, phthalates. These chem-ical pollutants can potentially affect organisms (Teuten et al.,2007), are potential endocrine disruptors and can affect populationviability. With their long lifespan, whales could be chronically
0025-326X/$ - see front matter � 2012 Elsevier Ltd. All rights reserved.http://dx.doi.org/10.1016/j.marpolbul.2012.08.013
⇑ Corresponding author. Tel.: +39 0577 232913; fax: +39 0577 232930.E-mail addresses: [email protected] (M.C. Fossi), [email protected] (C. Panti), guerran-
[email protected] (C. Guerranti), [email protected] (D. Coppola), [email protected](M. Giannetti), [email protected] (L. Marsili), [email protected] (R. Minutoli).
Marine Pollution Bulletin 64 (2012) 2374–2379
Contents lists available at SciVerse ScienceDirect
Marine Pollution Bulletin
journal homepage: www.elsevier .com/locate /marpolbul

exposed to these persistent contaminants derived from the inges-tion and degradation of microplastics.
One toxicological feature of the marine environment that canaffect filter-feeding organisms is the influence that microplasticsmay produce by enhancing the transport and bioavailability of per-sistent, bioaccumulative and toxic substances. In fact, chemicalsfor which the logarithm of the octanol/water partitioning coeffi-cient (K(OW)) > 5 can potentially be partitioned >1% to polyethyl-ene, a major component of microplastics. Moreover,contaminants such as phthalates and polycyclic aromatic hydro-carbons (PAHs) are among the principal constituents of plastics.The dialkyl or alkyl/aryl esters of 1,2-benzenedicarboxylic acid,commonly known as phthalates, are high-production-volume syn-thetic chemicals; moreover, they are not covalently bound to plas-tic and migrate from the products to the environment, thusbecoming ubiquitous contaminants (Latini et al., 2009). Publicand scientific concern about the potential human and wildlifehealth risks associated with exposure to phthalates has increasedin recent years. The primary focus has moved away from the hep-atotoxic effects to the endocrine-disrupting potency of thesechemicals (Latini, 2005), which have been shown to be reproduc-tive toxicants in animals (Borch et al., 2006). Di-(2-ethylhexyl)phthalate (DEHP) is the most abundant phthalate in the environ-ment. In both invertebrates and vertebrates, DEHP is rapidlymetabolized in the form of its primary metabolite, MEHP (mono-(2-ethylhexyl) phthalate) (Barron et al., 1989), which can be usedas a marker of exposure to DEHP.
This case study examines the Mediterranean fin whale, one ofthe largest filter feeders in the world. This study is the first inves-tigation of the potential impact of microplastics in a baleen whaleand suggests the use of phthalates as a tracer of the intake ofmicroplastics through the ingestion of micro-debris and plankton.
2. Methodology
The study included the following three steps: (1) the collection,counting and sorting of microplastics and planktonic organisms insurface neustonic/planktonic and water column samples from thePelagos Sanctuary MPA (NW Mediterranean Sea); (2) the measure-ment of phthalate concentrations in surface neustonic/planktonicand water column samples; and (3) the measurement of phthalateconcentrations in stranded fin whale specimens collected on thecoasts of Italy.
2.1. Step I: collection and sorting of microplastics in surface neustonic/planktonic and water column samples in the Pelagos Sanctuary
Surface neustonic/planktonic and water column samples werecollected in the Ligurian Sea and Sardinian Sea (Fig. 1a) in summer2011 (June–July) during the day with a WP2 standard net (57 cmmouth diameter, 200 lm mesh size) equipped with a flowmeterfor the measurement of the filtered volumes. For each surface sam-ple (n = 23; MPM3–MPM26), the net was towed horizontally justbelow the water surface at a speed of approximately 1 knot for15 min. For each water column sample (MPP3, MPP10 andMPP22, corresponding to the same geographical coordinates asMPM3, MPM10 and MPM22) (Fig. 1a), the same net was verticallytowed from a depth of 50 m to the surface at a speed of 1 m/s. Inboth cases, the net was washed on board, and each 2-l samplewas split into two separate aliquots of 1 l each with a Folsom split-ter. One 1-l aliquot was filtered on a 200 lmmesh sieve and imme-diately frozen in liquid nitrogen for the subsequent analysis ofphthalates. The second aliquot was preserved in 4% formalde-hyde-seawater buffered solution for subsequent quali-quantitativeanalyses. A total of 26 frozen and preserved samples were used for
this study. For the analysis of plankton and plastic particles, thesamples were observed under a Leica Wild M10 stereomicroscope.The organisms were counted and taxonomically classified (Table 1,Supplementary data). The plastic particles were counted and mea-sured, and those smaller than 5 mm were classified as microplas-tics. All the data were normalized to the total volume filteredand expressed as individuals and items/m3. To compare the datawith data expressed as items/m2 in the literature, the present datacan be converted by multiplying the values (items/m3) by 0.5 m,the thickness of the water stratum sampled with the WP2 net asdescribed above.
2.2. Step II: detection of phthalates in surface neustonic/planktonic andwater column samples
DEHP and MEHP were analyzed in the surface neustonic/plank-tonic and water column samples (0.5–0.7 g) from the two samplingsub-areas (Ligurian Sea and Sardinian Sea) following a method de-scribed by Takatori et al. (2004), with a few modifications de-scribed in Guerranti et al. (2012). Each sample was thawed andweighed, and acetone was added. The sample obtained in thisway was sonicated. The organic part, containing DEHP and MEHP,was separated from the remaining water, and the supernatant wasisolated. The supernatant phase was then recovered and combinedwith that resulting from the first extraction and was then evapo-rated in a centrifugal evaporator. The extract was then resus-pended with 0.5 ml of acetonitrile and passed through a nylonfilter with pores of 2 lm. Subsequently, the sample was placed inan autosampler vial and injected into an LC-ESI-MS system. Theinstrumental analysis was performed with a Finnigan LTQ ThermoLC/MSn 110 with an ESI interface. A total of 5 ll of the extractedsample was injected via the autosampler into the HPLC system. Areverse-phase HPLC column (Wakosil 3C18, 2.0 � 100 mm, 3 lm;Wako Pure Chemical Industries Ltd.) was used. The mobile phasesconsisted of 100% acetonitrile (A) and 0.05% aqueous acetic acid(B). Elution was performed using an isocratic mode (A/B: 15/85,v/v) at 0.25 ml/min. ESI-MS was operated in the negative or posi-tive ion mode depending on the analytes (MEHP was detected inthe negative mode, whereas DEHP was detected in the positivemode). The heated capillary and voltage were maintained at500 �C and ±4.0 kV, respectively. The ions used for identificationwere (parent ion/daughter ion) 277/134 and 391/149 for MEHPand DEHP, respectively. For the quantitative analysis, a four-pointcalibration curve prepared by the progressive dilution of a solutionof the two analytes of interest was used. Blanks were analyzedwith each set of five samples as a check for possible laboratory con-tamination and interference. The data quality assurance and qual-ity control protocols also included matrix spikes and continuingcalibration verification. The limits of detection (LODs) and limitsof quantification (LOQs) for the compounds analyzed were the val-ues of the compound in the +3 SD and +10 SD blanks, respectively.The LOD and LOQ were 1 and 2 ng/g, respectively, for MEHP and 5and 10 ng/g, respectively, for DEHP.
The levels of analytes below the limits of detection (<LOD) werespecified as values equal to the value of the LOD. If the analyte waspresent at levels between the LOD and the LOQ, the LOQ value wasused. The values are expressed as fresh weight (f.w.).
2.3. Step III: measurement of phthalate concentrations in stranded finwhale specimens collected along the coasts of Italy
Blubber samples were collected close to the dorsal fin in fivestranded fin whales (sub-adults and adults) during the period July2007–June 2011 at five different sites on the Italian coast. The sam-ples were stored at �20 �C prior to analysis. The details of the loca-tion and gender of the stranded whales are shown in Fig. 1b. DEHP
M.C. Fossi et al. /Marine Pollution Bulletin 64 (2012) 2374–2379 2375

Sardinian Sea
SARDINIAMPM21
MPM25
MPM26
MPM24
MPM18
MPM17
MPM19
MPM20
MPM23
San Rossore PI (Male)MEPH 53.98 ng/g
Orbetello GR (Male)MEPH 51.84 ng/g
Castelsardo SS (nd)MEPH 1.00 ng/g
Amalfi SA (Female)MEPH 99.93 ng/g
Palinuro SA (nd)MEPH 83.12 ng/g
Phthalates concentration in superficial neustonic/planktonic samples
AREADEHP (ng/g) MEHP (ng/g)
n mean s.d. n mean s.d.
Ligurian Sea 14 18.38 44.39 14 61.93 124.26
Sardinian Sea 9 23.42 32.46 9 40.30 41.55
Microplastics(Items/m3)
0-0.1
0.11-1
1.01-5
5.01-10
MEHP concentration in stranded fin whales (n=5)
SPECIES TISSUE Mean MEHP (ng/g)
Balaenoptera physalus Blubber 57.97
MPM4
MPM14 MPM15
MPM16
MPM3MPM6
MPM5MPM8
MPM7MPM9
MPM10
MPM12
MPM13
MPM11Ligurian Sea
LIGURIAa b
100 Km
10 Km
10 Km
Fig. 1. (a) Microplastic particles in superficial neustonic/planktonic samples (items/m3) collected in the Pelagos Sanctuary (Ligurian Sea and Sardinian Sea) and mean DEPHand MEPH concentrations (ng/g). Geographical coordinates of sampling sites are reported in Table 2 of Supplementary data. (b) DEHP concentrations (ng/g) in blubbersamples of five stranded fin whales collected along the Italian coasts during the period July 2007–June 2011 in five different locations.
Table 1Microplastic particles in superficial neustonic/planktonic samples (items/m3) collected in the Pelagos Sanctuary, zooplankton abundance (ind/m3), DEPH and MEPHconcentrations (ng/g f.w.), mean values ± S.D. (see Fig. 1 for sampling sites).
Sample Items/m3 Zooplankton abundance (ind/m3) DEHP (ng/g) MEHP (ng/g)
Ligurian SeaMPM3 0.00 403.96 5.00 1.00MPM4 0.10 167.78 5.00 55.20MPM5 0.10 23.45 10.00 1.00MPM6 0.00 43.67 172.41 3,12MPM7 0.00 36.77 5.00 5.75MPM8 0.05 204.71 5.00 454.07MPM9 0.00 4275.51 5.00 1.00MPM10 0.00 193.15 5.00 2.00MPM11 1.35 377.49 5.00 37.64MPM12 0.50 496.35 5.00 4.87MPM13 0.33 6147.00 10.00 1.00MPM14 9.67 4253.33 10.00 188.94MPM15 0.04 179.51 10.00 25.68MPM16 0.95 4645.71 5.00 85.78Mean 0.94 ± 2.55 1532.03 18.38 ± 44.39 61.93 ± 124.26
Sardinian SeaMPM17 0.00 82.74 76,02 19.83MPM18 0.83 27.07 10.00 1.00MPM19 0.11 744.54 10.00 11.30MPM20 0.00 668.66 5.00 107.11MPM21 0.03 90.19 10.00 35.56MPM23 0.24 102.73 5.00 1.00MPM24 0.00 523.27 84.81 109.93MPM25 0.00 15000.00 5.00 30.64MPM26 0.00 3919.72 5.00 46.34Mean 0.13 ± 0.27 2350.99 23.42 ± 32.46 40.30 ± 41.55
Total Mean 0.62 ± 2.00 1852.49 20.36 ± 39.42 53.47 ± 99.34
2376 M.C. Fossi et al. /Marine Pollution Bulletin 64 (2012) 2374–2379

and MEHP were extracted from blubber (1 g), and phthalate con-centrations were measured with the method described above.
3. Results
Of the 23 surface neustonic/planktonic samples, 13 containedplastic particles (Table 1, Fig. 1a). The highest microplastic abun-dance (9.67 items/m3, equivalent to 4.83 items/m2) was found ina sample collected near the Portofino MPA (Ligurian Sea). Largeamounts of plastic particles were detected in the surface neuston-ic/planktonic samples collected in the Pelagos Sanctuary areasinvestigated (mean value 0.62 items/m3). The amounts of plasticparticles were approximately seven times higher in the samplesfrom the Ligurian Sea (mean value 0.94 items/m3) than in the sam-ples from the Sardinian Sea (mean value 0.13 items/m3) (Table 1).Plastic particles were not found in the three water column samples(Table 2). The planktonic species were taxonomically determined,and the results are shown in Table 1 of Supplementary data.
High concentrations of the phthalates MEHP and DEHP were de-tected for the first time in the surface neustonic/planktonic sam-ples collected in the Pelagos Sanctuary areas. The values of MEHPwere approximately 1.5 times higher in the samples from the Lig-urian Sea than in the samples from the Sardinian Sea. Lower con-centrations of MEHP were detected in the 3 water columnsamples than in the surface samples (Table 2).
The presence of harmful chemicals in Mediterranean fin whales,associated with the potential intake of plastic derivatives by waterfiltering and plankton ingestion, was demonstrated for the firsttime by the results of this study, which documented the presenceof relevant concentrations of MEHP in the blubber of four out offive stranded fin whales (Fig. 1b). MEHP is a marker for exposureto DEHP, whereas DEHP was never detected in the samples. It isnot surprising that DEHP was not detected in these samples, as itis well known that the DEHP is rapidly metabolized to MEHP, itsprimary metabolite (Latini et al., 2004). The preliminary data ob-tained by the current study suggest that phthalates can serve asa tracer of the intake of microplastics by fin whales resulting fromthe ingestion of micro-litter and plankton.
4. Discussion
The present study, following the recent publication by Collignonet al. (2012), provides an initial insight into microplastic pollutionin the Mediterranean Sea by reporting the concentrations and spa-tial distribution of microplastics in the area of Pelagos Sanctuary.We emphasize that the mean abundance of microplastics esti-mated in this study is of the same order of magnitude as that foundfor the North Pacific Gyre (Collignon et al., 2012), suggesting thehigh level of this emerging threat in the only pelagic MPA of theMediterranean Sea.
The Pelagos Sanctuary for Mediterranean Marine Mammals is amarine protected area of approximately 90,000 km2 in the north-western Mediterranean Sea. A remarkable cetacean fauna consist-ing of 8 species, including the baleen whale B. physalus, coexists inthe Sanctuary with very high levels of human pressure. Plastic
from coastal tourism, recreational and commercial fishing, marinevessels and marine industries can directly enter the marine envi-ronment and pose a risk to biota both as macroplastics and, follow-ing long-term degradation, as microplastics. Within the PelagosSanctuary, the Portofino MPA showed the highest values of micro-plastic items/m3. This area was also confirmed as a ‘‘hot spot’’ formicroplastics by Collignon et al. (2012). These results serve to fo-cus particular attention on the conservation status of an area witha high level of exploitation by tourists and on the balance betweenconservation measures and management.
Previously, very few studies have addressed the impact ofmicroplastics on filter-feeding organisms or other planktivorousanimals. No previous studies have assessed the potential impactof microplastics on large filter-feeding organisms, such as baleenwhales.
At the lowest level of the food web, the great abundance ofmicroplastics in the photic zone could both interfere with and bea severe threat to plankton viability. Microplastic debris has beenfound in the gastrointestinal tracts of several planktivorous fishes(Myctophidae, Stomiidae and Scomberesocidae) in the North PacificGyre (Boerger et al., 2010). In the Mediterranean Sea, during thesurvey recently carried out by Collignon et al. (2012), plastic mi-cro-debris was found in the stomachs of myctophids (Myctophumpunctatum). Moreover, several studies report the ingestion of plas-tic debris of different sizes, colors and shapes by both epibentho-phagous and hyperbenthophagous fish species (Ariidae, Scianidae)inhabiting a demersal estuarine environment in the tropical Wes-tern South Atlantic (Costa et al., 2011; Possatto et al., 2011; Dantaset al., 2012). The occurrence of interactions between several spe-cies of marine mammals and marine debris (Williams et al.,2011) and of plastic ingestion in Franciscana dolphins were also re-cently reported (Denuncio et al., 2011). However, the physiologicaland toxicological effects of plastic ingestion by filter-feedingorganisms are poorly investigated and understood, as are theimplications of plastic ingestion occurring through the food chain.
Marine plastics have been found to adsorb and transport chem-icals, including high concentrations of organochlorines such aspolychlorinated biphenyls (PCBs), dichlorodiphenyl trichloroeth-ane (DDT) and PAHs (Teuten et al., 2007). After the ingestion ofplastics by an organism, the presence of digestive surfactants isknown to increase the bioavailability of these compounds sorbedto plastics (Voparil and Mayer, 2000) by markedly increasing thedesorption rate of plastics compared with that found in sea water(Teuten et al., 2007). Due to the large surface-area-to-volume ratioof microplastics, marine organisms may be particularly at risk ofexposure to leached additives after microplastics are ingested.Such additives may interfere with biologically important pro-cesses, potentially resulting in endocrine disruption (Barneset al., 2009; Lithner et al., 2009, 2011). In this context, it is knownthat commonly used additives, such as brominated flame retar-dants, phthalates and the constituent monomer bisphenol A, canact as endocrine-disrupting chemicals because they can mimic,compete with or disrupt the synthesis of endogenous hormones(Talsness et al., 2009). In particular, phthalates have been associ-ated with a range of molecular, cellular and organ effects in aquaticinvertebrates and fish (Oehlmann et al., 2009). Bisphenol A is both
Table 2Microplastic particles in water column samples (items/m3) collected in the Pelagos Sanctuary, zooplankton abundance (ind/m3), DEPH and MEPH concentrations (ng/g f.w.), meanvalues ± S.D (see Fig. 1 for sampling sites).
Sample Items/m3 Zooplankton abundance (ind/m3) DEHP (ng/g) MEHP (ng/g)
MPP3 0.00 49.71 5.00 1.00MPP10 0.00 1266.05 5.00 4.32MPP22 0.00 864.88 5.00 1.00
Mean 0.00 726.88 5.00 ± 0.00 2.11 ± 1.92
M.C. Fossi et al. /Marine Pollution Bulletin 64 (2012) 2374–2379 2377

an estrogen agonist and an androgen antagonist, and it can differ-entially affect reproduction and development, depending on itsconcentration and the species affected. Nevertheless, Oehlmannet al. (2009) note that there has been relatively little research intothe chronic effects of long-term exposure to these additives inaquatic organisms.
The present data represent the first evidence of the potentialimpact of the most abundant plastic derivatives (phthalates) in abaleen whale, the second-largest filter feeder in the world: theMediterranean fin whale. The fin whale is a cosmopolitan cetacean.It is found in the largest water masses of the world, from the equa-tor to the polar regions. Despite its cosmopolitan distribution, it isclassified as Endangered on the IUCN Red List. In general, rorqualfeeding has been described as the largest biomechanical event thathas ever existed on Earth (Croll and Tershy, 2002). Fin whales cap-ture food by initially swimming rapidly toward a school of preyand then decelerating while opening the mouth to gulp vast quan-tities of water and schooling prey. Fin and blue whales foraging onkrill off the coast concentrate their foraging effort on dense aggre-gations of krill (150–300 m) in the water column during the dayand feed near the surface at night (Croll et al., 2005).
It is well known that the fin whale in the Mediterranean Seafeeds preferentially on the planktonic euphausiid Meganyctiphanesnorvegica. Nevertheless, depending on the area and the season, thewhale feeds on a wide spectrum of marine organisms, includingcopepods, other euphausiid species (e.g., Thysanoessa inermis,Calanus finmarchicus, Euphausia krohni) and small schooling fish(Orsi Relini and Giordano, 1992; Relini et al., 1992; Notarbartolodi Sciara et al., 2003). With each mouthful, a fin whale can trapapproximately 70,000 l of water. For this reason, a whale could riskingesting a great amount of microplastic debris, both directly fromthe water and indirectly from the plankton (during both surfacefeeding and deeper feeding activity). After microplastics are in-gested, a fin whale may be exposed directly to leached additives,such as polybrominated diphenyl ethers, phthalates and bisphen-olA and their potential toxicological effects.
Preliminary data on MEHP in 5 samples of Euphausia krohni col-lected in the Sicilian Channel reported high concentrations of thiscontaminant ranging from 8.35 to 51.14 ng/g. These results sug-gested that plastic derivatives also occur in planktonic speciesinhabiting the water column (unpublished data, Guerranti per-sonal communication).
In view of the presence of microplastics in the Mediterraneanenvironment, the detection of plastic additives in the blubber offin whales and the long lifespan of the species, fin whales appearto be chronically exposed to persistent and emerging contaminantsas a result of microplastic ingestion. In this context, the prelimin-ary observations presented in this paper suggest that phthalatescan serve as a tracer for the intake of microplastics in micro-litterand in plankton by fin whales. These observations represent awarning that the endangered Mediterranean population of this ba-leen whale is exposed to endocrine disruptors such as MEHP. Theresults of this study are consistent with the evidence previously re-ported by Fossi et al. (2010) of an early warning signal of endocrineinterference furnished by the up-regulation of the estrogen recep-tor alpha gene detected in skin biopsies of male Mediterranean finwhales compared with fin whales from the Sea of Cortez (Mexico).This ‘‘undesirable biological effect’’ (in agreement with the descrip-tion of the concept of biomarkers in Descriptor 8 of the MarineStrategy Framework Directive) can suggest that the Mediterraneanpopulation is exposed to a mixture of persistent and emergingcontaminants, such as endocrine disruptors, that may impair thepopulation viability of this already endangered species.
In this context, surveys covering much of the western Mediter-ranean basin have estimated the fin whale population to be 3.583individuals (Forcada et al., 1996), 901 of which inhabit the
Corsican-Ligurian-Provencal basin (Forcada et al., 1995). However,according to more recent data on the Pelagos Sanctuary, theestimated population has decreased markedly (approximately bya factor of six) in the past 20 years (Panigada et al., 2011) raisingparticular concerns about the status of this species.
In conclusion, the present data represent the first evidence ofthe potential impact of plastic additives (phthalates) in baleenwhales. These results underscore the importance of future researchon the detection of the toxicological impact of micro-plastics in fil-ter-feeding species such as mysticete cetaceans, the basking sharkand the devil ray. The results also underscore the potential use ofthese species in the implementation of Descriptor 10 (marine lit-ter) in the EU Marine Strategy Framework Directive as indicatorsof the presence and impact of micro-litter in the pelagicenvironment.
Acknowledgments
This project was supported by the Italian Ministry of Environ-ment, Territory and Sea (prot n.39752/III-17). We thank Dr. SilviaMaltese, Dr. Matteo Baini, Dr. Tommaso Campani, Dr. Ilaria Calianiand Dr. Davide Bedocchi for their help during sampling activities.We thank the Mediterranean Marine Mammals Tissue Bank,Department of Experimental Veterinary Science (University of Pad-ua, IT) for their collaboration in the sampling of stranded finwhales.
Appendix A. Supplementary data
Supplementary data associated with this article can be found, inthe online version, at http://dx.doi.org/10.1016/j.marpolbul.2012.08.013.
References
Barnes, D.K.A., Galgani, F., Thompson, R.C., Barlaz, M., 2009. Accumulation andfragmentation of plastic debris in global environments. Philos. Trans. R. Soc. B364 (1526), 1985–1998.
Barron, M.G., Schultz, I.R., Hayton, W.L., 1989. Presystemic branchial metabolismlimits di-2-ethylhexyl phthalate accumulation in fish. Toxicol. Appl. Pharmacol.98, 49–57.
Boerger, C., Lattin, G., Moore, S.L., Moore, C.J., 2010. Plastic ingestion byplanktivorous fishes in the North Pacific Central Gyre. Mar. Pollut. Bull. 60(12), 2275–2278.
Borch, J., Axelstad, M., Vinggaard, A.M., Dalgaard, M., 2006. Diisobutyl phthalate hascomparable anti-androgenic effects to di-n-butyl phthalate in fetal rat testis.Toxicol. Lett. 163, 183–190.
Collignon, A., Hecq, J.H., Galgani, F., Voisin, P., Collard, F., Goffart, A., 2012. Neustonicmicroplastic and zooplankton in the North Western Mediterranean Sea. Mar.Pollut. Bull. 64, 861–864.
Costa, M.F., Silva-Cavalcanti, J.S., Barbosa, C.C., Portugal, J.L., Barleta, M., 2011.Plastics buried in the inter-tidal plain of a tropical estaurine eco system. J. Coast.Res. (SI 64), 339–343.
Croll, D.A., Tershy, B.R., 2002. Filter feeding. In: Perrin, W.F., Wursig, B., Thewissen,J.G.M. (Eds.), Encyclopedia of Marine Mammals. Academic Press, San Diego, pp.428–432.
Croll, D.A., Marinovic, B., Benson, S., Chavez, F.P., Black, N., Ternullo, R., Tershy, B.R.,2005. From wind to whales: trophic links in a coastal upwelling system. Mar.Ecol. Prog. Ser. 289, 117–130.
Dantas, D.V., Barleta, M., Ferreira da Costa, M., 2012. The seasonal and spatialpatterns of ingestion of polyfilamnt nylon fragments by estuarine drums(Scianidae). Environ. Sci. Pollut. Res. 19, 600–606.
Denuncio, P., Bastida, R., Dassis, M., Giardino, G., Gerpe, M., Rodriguez, D., 2011.Plastic ingestion in Franciscana dolphins, Pontoporia blainvillei (Gervais adnd’Orbigny, 1844), from Argentina. Mar. Pollut. Bull. 62, 1836–1841.
Derraik, J.G.B., 2002. The pollution of the marine environment by plastic debris: areview. Mar. Pollut. Bull. 44, 842–852.
Forcada, J., Notarbartolo di Sciara, G., Fabbri, F., 1995. Abundance of fin whales andstriped dolphins summering in the Corso Ligurian basin. Mammalia 59, 127–140.
Forcada, J., Agiolar, A., Hammond, P., Pastor, X., Aguilar, R., 1996. Distributionabundance of fin whales (Balaenoptera physalus) in the western MediterraneanSea during the summer. J. Zool. 238, 23–24.
Fossi, M.C., Urban, J., Casini, S., Maltese, S., Spinsanti, G., Panti, C., Porcelloni, S.,Panigada, S., Lauriano, G., Niño-Torres, C., Rojas-Bracho, L., Jimenez, B., Muñoz-
2378 M.C. Fossi et al. /Marine Pollution Bulletin 64 (2012) 2374–2379

Arnanz, Marsili, L., . A multi-trial diagnostic tool in fin whale (Balaenopteraphysalus) skin biopsies of the Pelagos Sanctuary (Mediterranean Sea) and theGulf of California (Mexico). Mar. Environ. Res. 69 (1), S17–S20.
Guerranti, C., Sbordoni, I., Fanello, E.L., Borghini, F., Corsi, I., Focardi, S.E., 2012.Levels of phthalates in human milk samples from central Italy. Microchem. J.,http://dx.doi.org/10.1016/j.microc.2012.06.014, in press.
Hidalgo-Ruz, V., Gutow, L., Thompson, R.C., Thiel, M., 2012. Microplastics in themarine environment: a review of the methods used for identification andquantification. Environ. Sci. Technol. 46 (6), 3060–3075.
Latini, G., 2005. Monitoring phthalate exposure in humans. Clin. Chim. Acta 361 (1),20–29.
Latini, G., De Felice, C., Verrotti, A., 2004. Plasticizers, infant nutrition andreproductive health. Reprod. Toxicol. 19, 27–33.
Latini, G., Wittassek, M., Del Vecchio, A., Presta, G., De Felice, C., Angerer, J., 2009.Lactational exposure to phthalates in Southern Italy. Environ. Int. 35, 236–239.
Lithner, D., Damberg, J., Dave, G., Larsson, A., 2009. Leachates from plastic consumerproducts – screening for toxicity with Daphniamagna. Chemosphere 74, 1195–1200.
Lithner, D., Larsson, Å., Dave, G., 2011. Environmental and health hazard rankingand assessment of plastic polymers based on chemical composition. Sci. TotalEnviron. 409, 3309–3324.
Moore, C.J., Moore, S.L., Leecaster, M.K., Weisberg, S.B., 2001. A comparison of plasticand plankton in the North Pacific Central Gyre. Mar. Pollut. Bull. 42 (12), 1297–1300.
Murray, F., Cowie, F.R., 2011. Plastic contamination in the decapod crustaceanNephrops norvegicus (Linnaeus, 1758). Mar. Pollut. Bull. 62 (6), 1207–1217.
Notarbartolo di Sciara, G., Zanardelli, M., Jahoda, M., Panigada, S., Airoldi, S., 2003.The fin whale Balaenoptera physalus (L. 1758) in the Mediterranean Sea.Mammal Rev. 33 (2), 105–150.
Oehlmann, J.R., Schulte-Oehlmann, U., Kloas, W., Jagnytsch, O., Lutz, I., Kusk, K.O.,Wollenberger, L., Santos, E.M., Paull, G.C., Van Look, K.J.W., Tyler, C.R., 2009. Acritical analysis of the biological impacts of plasticizers on wildlife. Philos.Trans. R. Soc. B 364, 2047–2062.
Orsi Relini, L., Giordano, A., 1992. Summer feeding of the fin whale, Balaenopteraphysalus, in the Liguro-Provençal Basin. Eur. Res. Cetaceans 6, 138–141.
Panigada, S., Lauriano, G., Burt, L., Pierantonio, N., Donovan, G., 2011. Monitoringwinter and summer abundance of cetaceans in the Pelagos Sanctuary(northwestern Mediterranean Sea) through aerial surveys. PLoS One 6 (7),e22878. http://dx.doi.org/10.1371/journal.pone.0022878.
Possatto, F.E., Barleta, M., Costa, M.F., Ivar do Sul, J.A., Dantas, D.V., 2011. Plasticdebris ingestion by marine catfish: an unexpected fisheries impact. Mar. Pollut.Bull. 62, 1098–1102.
Relini, G., Orsi Relini, L., Cima, C., Fasciana, C., Fiorentino, F., Palandri, G., Relini, M.,Tartaglia, M.P., Torchia, G., Zamboni, A., 1992. Macroplancton, Meganyctiphanesnorvegica, and fin whales, Balaenoptera physalus, along some transects in theLigurian Sea. Eur. Res. Cetaceans 6, 134–137.
Robards, M.D., Piatt, J.F., Wohl, K.D., 1995. Increasing frequency of plastic particlesingested by seabirds in the subarctic North Pacific. Mar. Pollut. Bull. 30, 151–157.
Takatori, S., Kitagawa, Y., Kitagawa, M., Nakazawa, H., Hori, S., 2004. Determinationof di(2-etylhexyl)phthalate and mono(2-etylhexyl)phthalates in human serumusing liquid chromatography–tandemmass spectrometry. J. Chromatogr. B 804,397–401.
Ryan, P.G., Moore, C.J., Van Franeker, J.A., Moloney, C.L., 2009. Monitoring theabundance of plastic debris in the marine environment. Philos. Trans. R. Soc. B364, 1999–2012.
Talsness, C.E., Andrade, A.J.M., Kuriyama, S.N., Taylor, J.A., vom Saal, F.S., 2009.Components of plastic: experimental studies in animals and relevance forhuman health. Philos. Trans. R. Soc. B 364, 2079–2096.
Teuten, E.L., Rowland, S.J., Galloway, T.S., Thompson, R.C., 2007. Potential for plasticsto transport hydrophobic contaminants. Environ. Sci. Technol. 41, 7759–7764.
Thompson, R.C., Olsen, Y., Mitchell, R.P., Davis, A., Rowland, S.J., John, A.W.G.,McGonigle, D., Russell, A.E., 2004. Lost at sea: where is all the plastic? Science304, 838.
Voparil, I.M., Mayer, L.M., 2000. Dissolution of sedimentary polycyclic aromatichydrocarbons into the lugworm’s (Arenicola marina) digestive fluids. Environ.Sci. Technol. 34, 1221–1228.
Williams, R., Ashe, E., O’Hara, P.D., 2011. Marine mammals and debris in coastalwaters of British Columbia, Canada. Mar. Pollut. Bull. 62, 1303–1316.
M.C. Fossi et al. /Marine Pollution Bulletin 64 (2012) 2374–2379 2379

Large filter feeding marine organisms as indicators of microplastic inthe pelagic environment: The case studies of the Mediterraneanbasking shark (Cetorhinus maximus) and fin whale (Balaenopteraphysalus)
Maria Cristina Fossi a,*, Daniele Coppola a, Matteo Baini a, Matteo Giannetti a,b,Cristiana Guerranti a, Letizia Marsili a, Cristina Panti a, Eleonora de Sabata c, Simona Clò c,d
aDepartment of Physical, Earth and Environmental Sciences, University of Siena, Via P.A. Mattioli 4, 53100 Siena, ItalybDepartment of Life Sciences, University of Siena, Via A. Moro 2, 53100 Siena, ItalycMedSharks, Via Ruggero Fauro 82, 00197 Rome, ItalydCTS, via Albalonga 3, 00183 Roma, Italy
a r t i c l e i n f o
Article history:Received 9 October 2013Received in revised form12 February 2014Accepted 14 February 2014
Keywords:MicroplasticPhthalatesOrganochlorinesBasking sharkFin whaleMediterranean Sea
a b s t r a c t
The impact of microplastics (plastic fragments smaller than 5 mm) on large filter feeding marine or-ganisms such as baleen whales and sharks are largely unknown. These species potentially are ingestingmicro-litter by filter feeding activity. Here we present the case studies of the Mediterranean fin whale(Balaenoptera physalus) and basking shark (Cetorhinus maximus) exploring the toxicological effects ofmicroplastics in these species measuring the levels of phthalates in both species. The results show higherconcentration of MEHP in the muscle of basking shark in comparison to fin whale blubber. These speciescan be proposed as indicators of microplastics in the pelagic environment in the implementation ofDescriptor 8 and 10 of the EU Marine Strategy Framework Directive (MSFD).
� 2014 Elsevier Ltd. All rights reserved.
1. Introduction
Are the largest filter feeder marine organisms affected by any ofthe smallest human debris? How can 5 mm plastic debris affect24 m long marine mammals and 7 m long sharks? In this paper weinvestigate the invisible war between the Mediterranean fin whale(Balaenoptera physalus) and basking shark (Cetorhinus maximus)against the smallest marine debris and their potential toxicologicaleffects. Why microplastics may pose a threat to these species?
In 2009, 230 million tons of plastics were produced globally,Europe is the second larger producer of plastic (PlasticsEurope,2012). According to sea-based sources such as shipping, fishingand transport activities (Derraik, 2002) and land-based sourcessuch as tourism, adjacent industries or river inputs (Browne et al.,2010), plastics are entering our seas and oceans, “posing a
complex and multi-dimensional challenge with significant impli-cations for the marine and coastal environment and human activ-ities all over the world” (UNEP, 2009).
For the Mediterranean environment marine litter (includingplastic) represents a serious concern (UNEP, 2009; UNEP/MAP,2011; MSFD, 2011). Three billions of litter items float or cover thesea bottom in the Mediterranean Sea, which 70e80% is plasticwaste. The increasing of marine litter is mainly related to wasteproduction in-land with an average amount of municipal solidwaste in the EU of 520 kg per person/year and a projected increaseto 680 kg per person/year by 2020.
The incidence of debris in the marine environment is cause forconcern. It is known to be harmful to marine organisms and tohuman health (Derraik, 2002; Gregory, 2009;Wright et al., 2013), itrepresents a hazard to maritime transport, it is aestheticallydetrimental, and may also have the potential to transport con-taminants (Mato et al., 2001; Teuten et al., 2009). Marine debris,and in particular the accumulation of plastic debris, has beenidentified as a global problem alongside other key issues such as
* Corresponding author. Tel.: þ39 0557 232883; fax: þ39 0557 232930.E-mail address: [email protected] (M.C. Fossi).
Contents lists available at ScienceDirect
Marine Environmental Research
journal homepage: www.elsevier .com/locate/marenvrev
http://dx.doi.org/10.1016/j.marenvres.2014.02.0020141-1136/� 2014 Elsevier Ltd. All rights reserved.
Marine Environmental Research xxx (2014) 1e8
Please cite this article in press as: Fossi, M.C., et al., Large filter feeding marine organisms as indicators of microplastic in the pelagicenvironment: The case studies of the Mediterranean basking shark (Cetorhinus maximus) and fin whale (Balaenoptera physalus), MarineEnvironmental Research (2014), http://dx.doi.org/10.1016/j.marenvres.2014.02.002

climate change, ocean acidification and loss of biodiversity. Impactsvary depending on the type and size of debris and the organismsaffected.
The occurrence of microplastics (MPs e generally defined asfragments less than 5 mm in dimension e NOOA) in the ocean is anemerging world-wide concern. Due to high sorption capacity ofplastics for hydrophobic organic chemicals, the adherent chemicalscan be transported by MPs traveling long distances (Lee et al.,2013). MPs can serve as carrier of persistent organic pollutants(POPs) inmarine ecosystems (Rochman et al., 2013; Koelmans et al.,2013). Small plastic particles in the environment are of particularconcern as a wide range of organisms, from plankton to largervertebrates such as turtles or whales, may ingest them (Wrightet al., 2013). In particular, while evidence of macro and micro-plastic negative effects on marine organism is growing, little sci-entific investigation has focused on the problem in theMediterranean. More information is required about plastic andmicroplastic inputs, spatial and temporal distributions, includingtransport dynamics, interactions with biota and potential accu-mulation areas.
Microplastics found in the marine environment are likely to bederived either directly or through the fragmentation of largeritems. MPs can be subdivided by usage and origin as: i) Primary,pellets used in the plastics industry, and in certain applicationssuch as abrasives; ii) Secondary, fragments resulting from thedegradation and breakdown of larger items.
Microplastics floating over water are transported by oceancurrents and are found in regions where water circulation is rela-tively stationary or on sea shores (Hidalgo-Ruz et al., 2012). Anumber of heavily produced low density plastics (e.g. poly-propylene, polyethylene, and polystyrene) have been identified asthe main components of MPs, and these have various shapes andsizes, ranging from a few micrometers to a few millimeters(Hidalgo-Ruz et al., 2012; Martins and Sobral, 2011).
Microplastics are accumulating at the sea surface, especiallywithin the neustonic habitat (Ryan et al., 2009) that included aspecifically adapted zooplankton fauna. Basking shark and partic-ularly fin whale, being characterized by a long life span, could bechronically exposed to these persistent contaminants both leachingfrom microplastic ingestion and degradation and through the foodchain.
Recent studies have identified potential effects of plastic parti-cles mainly in invertebrates and fish, including: I) transport ofpersistent, bioaccumulating and toxic (PBT) substances from plas-tics; II) leaching of additives such as phthalates from the plastics;III) physical harm (Wright et al., 2013).
However, there is still little monitoring data on the occurrenceof microplastics in largemarine vertebrates. Until the paper of Fossiet al. (2012), no data were reported on the impacts of microplasticson large filter feeding marine organisms such as baleen whales orsharks. These species potentially undergo to the ingestion of micro-litter by filtrating feeding activity.
In this paper we focus on the case study of the two large Med-iterranean filter feeders, the fin whale and basking shark.
The basking shark (C. maximus Gunnerus, 1765) is a very large,filter-feeding cold-water and migratory pelagic species. It is widelydistributed throughout temperate waters but only regularly seen infew favored coastal locations. It may be considered frequentlypresent in theMediterranean, especially in the North-Western part,mainly in spring (Mancusi et al., 2005). Basking sharks are regularseasonal visitors in coastal waters of Sardinia, where between 2005and 2012 a total of 111 individuals (including 14 captures) wererecorded within “Operazione Squalo Elefante”, the first dedicatedbasking shark research project in the Mediterranean basin (deSabata and Clò, 2010). The basking shark is one of only three
shark species that filter seawater for planktonic prey. It captureszooplankton by forward swimming with an open mouth, so thatwater passively flows across the gill-raker apparatus. The rates ofgastro-intestinal evacuation in basking sharks are unknown;however, filtration rates have been estimated using measurementsof swimming speed and mouth gape area. Seawater filtration ratefor a 7m basking shark (mouth gape area ca. 0.4 m2) swimming at aspeed of 0.85 m s�1 was calculated to be 881 m3 h�1; if it fedconstantly in food patches, a so 5e7 m long basking shark mightconsume 30.7 kg of zooplankton in a day (Sims, 2008). During thismassive filtering activities the basking shark could undergo to theingestion and degradation of microplastics.
Due to its slow growth rate, lengthy maturation time, longgestation period, probably low fecundity, probable small size ofexisting populationse some severely depleted by targeted fisheriese the basking shark is classified by the IUCN Red List of ThreatenedSpecies as “Endangered” in the North-East Atlantic Ocean and“Vulnerable” in the Mediterranean Sea (Fowler, 2009; Cavanaghand Gibson, 2007). It is listed in all four major International con-ventions (Bern, CMS, CITES, Barcelona). Every year basking sharksare accidentally caught in small-scale fisheries throughout theMediterranean region.
The fin whale (B. physalus, Linnaeus 1758), one of the largestfilter feeders in theworld, feeds primarily on planktonic euphausiidspecies. This baleen whale, the only resident mysticete in theMediterranean Sea, forms aggregations during the summer on thefeeding grounds of the Pelagos Sanctuary Marine Protected Area(MPA). The fin whale is a wide ranging cetacean. It is found inlargest water masses of the world, from the Equator to the polarregions, but, in spite of its cosmopolitan distribution, it is classifiedas “Endangered” by the IUCN Red List of Threatened Species. Finwhale feeding, in general, has been described as the largestbiomechanical event that has ever existed on earth (Croll andTershy, 2002). Fin whales capture food by initially swimmingrapidly at a prey school and then decelerating while opening themouth to gulp vast quantities of water and schooling prey. Fin andblue whales foraging on krill off the coast, concentrate theirforaging effort on dense aggregations of krill (150e300 m) in thewater column during the day, and near the surface at night (Crollet al., 2005).
With each mouthful, the fin whales can trap approximately70,000 l of water. Since their feeding activities include surfacefeeding and, they undergo to the risk of the ingestion of MPsoccurring in the sea surface and consequent degradation onceingested by the organism. Seawater filtration daily is 5893 m3 ratewith 913 kg of plankton consumed daily.
One major toxicological aspect of MPs in the marine environ-ment and, consequentially, on filter-feeding organisms, is the in-fluence that microplastics may have on enhancing the transportand bioavailability of PBT persistent, bioaccumulative, and toxicsubstances. These two large filter feeders species (fin whale andbasking shark) could therefore face risks caused by the ingestionand degradation of microplastics.
PBT compounds, such as dichlorodiphenyltrichloroethane (DDT)or polychlorinated biphenyls (PCBs), are of particular concern forhuman health and the environment. Plastic debris can be a sourceof PBT chemicals. Some plastic debris can release toxic chemicalsthat have been added to enhance the performance of the plastic(such as phthalates, nonylphenol, bisphenol A, brominated flameretardants). Plastic debris may also be a sink for toxic chemicals:toxic chemicals from the environment can sorb to the debris and tobe released once inside the organism (Engler, 2012; Lithner et al.,2011). Since PBT chemicals, generally, have low solubility in ma-rine water they tend to migrate into water microlayers where theytend to migrate to microdebris or in the sediments also
M.C. Fossi et al. / Marine Environmental Research xxx (2014) 1e82
Please cite this article in press as: Fossi, M.C., et al., Large filter feeding marine organisms as indicators of microplastic in the pelagicenvironment: The case studies of the Mediterranean basking shark (Cetorhinus maximus) and fin whale (Balaenoptera physalus), MarineEnvironmental Research (2014), http://dx.doi.org/10.1016/j.marenvres.2014.02.002
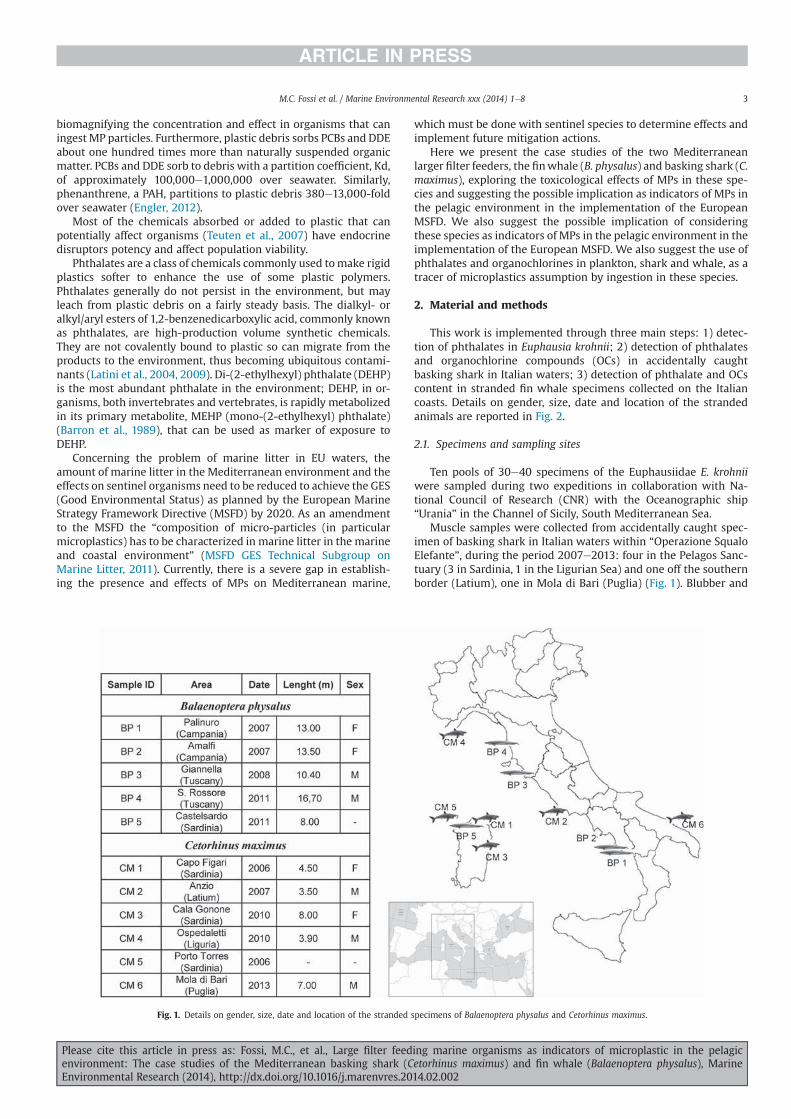
biomagnifying the concentration and effect in organisms that caningest MP particles. Furthermore, plastic debris sorbs PCBs and DDEabout one hundred times more than naturally suspended organicmatter. PCBs and DDE sorb to debris with a partition coefficient, Kd,of approximately 100,000e1,000,000 over seawater. Similarly,phenanthrene, a PAH, partitions to plastic debris 380e13,000-foldover seawater (Engler, 2012).
Most of the chemicals absorbed or added to plastic that canpotentially affect organisms (Teuten et al., 2007) have endocrinedisruptors potency and affect population viability.
Phthalates are a class of chemicals commonly used tomake rigidplastics softer to enhance the use of some plastic polymers.Phthalates generally do not persist in the environment, but mayleach from plastic debris on a fairly steady basis. The dialkyl- oralkyl/aryl esters of 1,2-benzenedicarboxylic acid, commonly knownas phthalates, are high-production volume synthetic chemicals.They are not covalently bound to plastic so can migrate from theproducts to the environment, thus becoming ubiquitous contami-nants (Latini et al., 2004, 2009). Di-(2-ethylhexyl) phthalate (DEHP)is the most abundant phthalate in the environment; DEHP, in or-ganisms, both invertebrates and vertebrates, is rapidly metabolizedin its primary metabolite, MEHP (mono-(2-ethylhexyl) phthalate)(Barron et al., 1989), that can be used as marker of exposure toDEHP.
Concerning the problem of marine litter in EU waters, theamount of marine litter in the Mediterranean environment and theeffects on sentinel organisms need to be reduced to achieve the GES(Good Environmental Status) as planned by the European MarineStrategy Framework Directive (MSFD) by 2020. As an amendmentto the MSFD the “composition of micro-particles (in particularmicroplastics) has to be characterized in marine litter in the marineand coastal environment” (MSFD GES Technical Subgroup onMarine Litter, 2011). Currently, there is a severe gap in establish-ing the presence and effects of MPs on Mediterranean marine,
which must be done with sentinel species to determine effects andimplement future mitigation actions.
Here we present the case studies of the two Mediterraneanlarger filter feeders, the finwhale (B. physalus) and basking shark (C.maximus), exploring the toxicological effects of MPs in these spe-cies and suggesting the possible implication as indicators of MPs inthe pelagic environment in the implementation of the EuropeanMSFD. We also suggest the possible implication of consideringthese species as indicators of MPs in the pelagic environment in theimplementation of the European MSFD. We also suggest the use ofphthalates and organochlorines in plankton, shark and whale, as atracer of microplastics assumption by ingestion in these species.
2. Material and methods
This work is implemented through three main steps: 1) detec-tion of phthalates in Euphausia krohnii; 2) detection of phthalatesand organochlorine compounds (OCs) in accidentally caughtbasking shark in Italian waters; 3) detection of phthalate and OCscontent in stranded fin whale specimens collected on the Italiancoasts. Details on gender, size, date and location of the strandedanimals are reported in Fig. 2.
2.1. Specimens and sampling sites
Ten pools of 30e40 specimens of the Euphausiidae E. krohniiwere sampled during two expeditions in collaboration with Na-tional Council of Research (CNR) with the Oceanographic ship“Urania” in the Channel of Sicily, South Mediterranean Sea.
Muscle samples were collected from accidentally caught spec-imen of basking shark in Italian waters within “Operazione SqualoElefante”, during the period 2007e2013: four in the Pelagos Sanc-tuary (3 in Sardinia, 1 in the Ligurian Sea) and one off the southernborder (Latium), one in Mola di Bari (Puglia) (Fig. 1). Blubber and
Fig. 1. Details on gender, size, date and location of the stranded specimens of Balaenoptera physalus and Cetorhinus maximus.
M.C. Fossi et al. / Marine Environmental Research xxx (2014) 1e8 3
Please cite this article in press as: Fossi, M.C., et al., Large filter feeding marine organisms as indicators of microplastic in the pelagicenvironment: The case studies of the Mediterranean basking shark (Cetorhinus maximus) and fin whale (Balaenoptera physalus), MarineEnvironmental Research (2014), http://dx.doi.org/10.1016/j.marenvres.2014.02.002

muscle of five stranded fin whales were collected along the Italiancoasts during the period 2006e2013 in five different locations.Details on gender and location of the stranded whales are reportedin Fig. 1.
2.2. Detection of phthalate content in euphausiids, stranded finwhale and basking shark specimens
DEHP and MEHP were extracted from E. krohnii samples (30e40individuals), plus blubber samples (1 g) and muscle (1 g) of fivestranded fin whales and in the muscle (0.5 g) of six accidentallycaught basking sharks using the described method. DEHP (di-(2-ethylhexyl) phthalate) and MEHP (mono-(2-ethylhexyl) phtha-late) were analyzed from the subsamples following a methoddescribed by Takatori et al. (2004) with few modifications. Eachsample was thawed, weighted and transferred into a 15 ml tube. Tothis were added 4 ml of acetone. The sample thus obtained wassonicated for 2 min and stirred for 5 min and then centrifuged for15 min at 3000 rpm to separate the organic part, containing DEHPand MEHP, from the remainder water. Then, 4 ml of supernatantwere placed in a further 15 ml tube. Infranatant was again added to1 ml of acetone, and was sonicated for 2 min, agitated for 5 min andcentrifuged for 15 min at 3000 rpm for a further separation of theorganic from aqueous medium. Then the supernatant phase wasrecovered and rebuilt with that resulting from the first extraction.The supernatants, mixed well, were then evaporated in a centrif-ugal evaporator. The extract was then resuspended with 0.5 ml ofacetonitrile and passed through a nylon filter. Subsequently, thefinal volume was adjusted to 0.5 ml, which were placed in anautosampler vial and injected into a LC-ESI-MS system. Theinstrumental analysis was performed using a Finnigan LTQ ThermoLC/MSn 110 with ESI interface. 5 ml of extracted sample wereinjected via autosampler in the HPLC system. A reverse phase HPLCcolumn (Wakosil3C18, 2.0 � 100 mm; Wako Pure Chemical In-dustries Ltd.) was used. The mobile phases consisted of 100%acetonitrile (A) and 0.05% aqueous acetic acid (B). Elution wasperformed using an isocratic mode (A/B: 15/85, v/v) at 0.25 ml/min.The chromatographic run for each sample had duration of 30 min.ESI-MS was operated in negative or positive ion mode dependingon the analytes (MEHP was detected in negative mode, while DEHPin the positive mode). The heated capillary and voltage weremaintained at 500 �C and �4.0 kV, respectively. The daughter ionswere formed in the collision cell using N2 gas as the collision gas.The ions used for identificationwere (parent ion/daughter ion) 277/134,120 and 391/149 for MEHP and DEHP respectively. For the
quantitative analysis four-point calibration curve, prepared byprogressive dilution of a solution of the two analytes of interest wasused. Blanks were analyzed with each set of five samples as a checkfor possible laboratory contamination and interferences. Dataquality assurance and quality control protocols included also ma-trix spikes, and continuing calibration verification. The limits ofdetection (LODs) and limits of quantification (LOQs) for the com-pounds analyzed are the value of the compound in the blanks þ3SD and þ10 SD, respectively; LOD and LOQ were 1 and 2 ng/grespectively for MEHP and 5 and 10 ng/g respectively for DEHP. Theanalytes levels below the limits of detection (<LOD) were consid-ered with a value equal to the value of the LOD, while, in the casesinwhich the analytewas present at levels between the LOD and theLOQ, the LOQ value was used.
2.3. Detection of OC concentrations in stranded fin whale andbasking shark specimens
Analysis for HCB, DDTs and PCBs were performed according tomethod of U.S. Environmental Protection Agency (EPA) 8081/8082withmodifications (Marsili and Focardi,1997). The samples of 1 g ofblubber (B. physalus) and 1 g muscle (C. maximus) were lyophilizedin an Edwards freeze drier for 2 days. The sample was extractedwith n-hexane in a Whatman cellulose thimble (i.d. 25 mm, e.d.27 mm, length 100 mm) in the Soxhlet apparatus for 9 h. Thesample was spiked with surrogate compound (2,4,6-trichlorobiphenyls e IUPAC number 30, Ballschmiter and Zell,1980) prior to extraction. This compound was quantified and itsrecovery calculated. After the extraction, the sample was purifiedwith sulfuric acid to obtain a first lipid sedimentation. The extractthen underwent liquid chromatography on a column containingFlorisil that had been dried for 1 h in an oven at 110 �C. This furtherpurified the apolar phase of lipids that could not be saponified, suchas steroids like cholesterol. Decachlorobiphenyl (DCBP e IUPACnumber 209) was used as an internal standard, added to eachsample extract prior to analysis, and included in the calibrationstandard, a mixture of specific compounds (Aroclor 1260, HCB andpp’- and op’-DDT, DDD and DDE). The analytical method used wasHigh Resolution Capillary Gas Chromatography with a Agilent6890N and a 63Ni ECD and an SBP-5 bonded phase capillary col-umn (30 m long, 0.2 mm i.d.). The carrier gas was N2 with a headpressure of 15.5 psi (splitting ratio 50/1). The scavenger gas wasargon/methane (95/5) at 40 ml/min. Oven temperature was 100 �Cfor the first 10 min, after which it was increased to 280 �C at 5C�/min. Injector and detector temperatures were 200 �C and 280 �C
Fig. 2. a) Phthalate (MEHP) and b) Organochlorines concentration (ng/g l.b.) in blubber of Mediterranean B. physalus and muscle of C. maximus. Bars show mean value � standarddeviation.
M.C. Fossi et al. / Marine Environmental Research xxx (2014) 1e84
Please cite this article in press as: Fossi, M.C., et al., Large filter feeding marine organisms as indicators of microplastic in the pelagicenvironment: The case studies of the Mediterranean basking shark (Cetorhinus maximus) and fin whale (Balaenoptera physalus), MarineEnvironmental Research (2014), http://dx.doi.org/10.1016/j.marenvres.2014.02.002

respectively. The extracted organic material (EOM%) from freeze-dried samples was calculated in all samples. Capillary gas-chromatography revealed op’- and pp’- isomers of DDT and itsderivatives DDD and DDE, and 30 PCB congeners. Total PCBs werequantified as the sum of all congeners (IUPAC no. 95, 101, 99,151,144, 135, 149, 118, 146, 153, 141, 138, 178, 187, 183, 128, 174, 177, 156,171, 202, 172, 180, 199, 170, 196, 201, 195, 194, 206). Total DDTs werecalculated as the sum of op’DDT, pp’DDT, op’DDD, pp’DDD, op’DDEand pp’DDE. The results were expressed in ng/g lipid basis (l.b.). Thedetection limit was 0.1 ng/kg (ppt) for all the OCs analyzed.
3. Results and discussion
In this study, six muscle samples of accidentally caught baskingshark in Italian waters and, plus blubber and muscle samples fromin five stranded fin whales (sub-adults and adults) between 2007and 2012 in five different sites on the Italian coast were analyzed.All these samples were analyzed for phthalates and organochlo-rines (expressed in l.b.) used as potential tracers of assumption ofmicroplastics during the filtering activities for feeding. Additionally,the crustacean E. krohnii was analyzed as one of the major prey ofthe fin whale and as component of the zooplankton.
The DEHP primary metabolite, MEHP, was analyzed in thestranded specimens and E. krohnii. The analysis showed appre-ciable levels of MEHP in all of the samples, while DEHP wasdetected in only one sample (data not shown) (Table 1).
Interestingly, concentrations of MEPH are twice as high in thecetacean species compared with the cartilaginous fish (Fig. 2a).
The same trend is shown for the organochlorine concentrations,where for the three classes of OCs investigated (HCB, DDTs andPCBs) were always markedly higher in fin whale specimenscompared to basking sharks (Fig. 2b).
Moreover as previously published by Fossi et al. (2012), thepresence of harmful chemicals in Mediterranean fin whales, thatwere hypothesized to be linked with intake of plastic derivatives bywater filtering and plankton ingestion, are confirmed by the resultsof this study, which documents relevant concentrations of MEHP inthe blubber of five out of six stranded finwhales. MEHP is a markerfor exposure to DEHP, whereas DEHP was never detected in the finwhale samples.
The concentrations of total OCs in the muscle of the three whalespecimens are always markedly higher (DDTs mean value:15,956 ng/g l.b; PCBs mean value: 16,692 ng/g l.b.) than those foundin themuscle of the basking shark (DDTsmean value: 2001 ng/g l.b;PCBs mean value: 1779 ng/g l.b.). The difference between the twospecies in the bioaccumulation of fat-soluble contaminants can belinked to a different ability of excretion related to the potential
excretory activity through the gills in fish (Barber, 2008) and bio-accumulation in adipose tissue especially in cetaceans.
The PCBs fingerprint of the two target species was comparedwith neustonic/planktonic and microplastic samples (NP-MPs)collected in the Pelagos Sanctuary (Fig. 3). Among the 30 PCBcongeners analyzed, the highest percentage (43%) is represented bythe PCB 195 in the NP-MPs samples that is the second mostabundant congener in basking shark, while it was detected in verylow percentage in finwhale. This preliminary evidence suggests theuse of this PCB congener as tracer of the absorption of POPs throughNP-MPs in surface feeding organisms. Moreover, the most abun-dant congeners in fin whale and basking shark are the PCB 153, acongener also abundant in NP-MPs samples (Fig. 3).
4. Conclusions
The initial insight into microplastic pollution on Mediterraneanscale on the concentration levels and spatial distribution ofmicroplastics in the area MPA of Pelagos Sanctuary underline thatthe mean abundance of microplastics estimated are of the sameorder of magnitude as that found for the North Pacific Gyre (Mooreet al., 2001). This suggests the high occurrence of this emergingthreat in the only pelagic MPA of the Mediterranean Sea (Collignon
Table 1Organochlorine and MEHP concentrations (ng/g l.b.) in the blubber of Mediterra-nean B. physalus (BP) and muscle of C. maximus (CM).
Sample ID Species HCB(ng/g l.b.)
PDDTs
(ng/g l.b.)
PPCBs
(ng/g l.b.)MEHP(ng/g l.b.)
BP 1 B. physalus 129.13 6580.67 9117.09 377.82a
BP 2 B. physalus 286.26 12,284.32 8155.00 110.68a
BP 3 B. physalus 157.82 21,404.45 42,778.45 332.31a
BP 4 B. physalus 180.93 26,833.64 24,060.13 61.06a
BP 5 B. physalus 201.02 15,357.34 16,410.87 1.48a
CM 1 C. maximus 41.09 1890.42 1575.57 58.06CM 2 C. maximus 9.52 2638.73 1710.69 113.94CM 3 C. maximus 41.02 2177.60 1820.77 50.39CM 4 C. maximus 10.74 1647.66 1970.62 156.67CM 5 C. maximus e e e 114.37CM 6 C. maximus 21.11 1652.64 1820.73 11.17
a From Fossi et al., 2012.
Fig. 3. PCBs fingerprint (30 congeners): bars show the percentage of each congenerscalculated on the total concentration of all the congeners analyzed in neustonic/planktonic and microplastic samples (NP-MPs), C. maximus and B. physalus. Each graph(aec) shows congeners in the same order as they are revealed by the instrument.
M.C. Fossi et al. / Marine Environmental Research xxx (2014) 1e8 5
Please cite this article in press as: Fossi, M.C., et al., Large filter feeding marine organisms as indicators of microplastic in the pelagicenvironment: The case studies of the Mediterranean basking shark (Cetorhinus maximus) and fin whale (Balaenoptera physalus), MarineEnvironmental Research (2014), http://dx.doi.org/10.1016/j.marenvres.2014.02.002

et al., 2012; Fossi et al., 2012). High presence of plastic particleshave been detected in superficial neustonic/planktonic from thePelagos Sanctuary areas investigated (mean value 0.62 items/m3),with levels approximately seven time higher in the samples fromthe Ligurian Sea (mean value 0.94 items/m3), than the samplescompared to the Sardinian Sea (mean value 0.13 items/m3). Highconcentration of phthalate MEHP and DEHP have been detected, insuperficial NP-MPs samples collected in the Pelagos Sanctuaryareas (MEHP 53.47 ng/g f.w., DEHP 20.36 ng/g f.w) (Fossi et al.,2012). Moreover, the levels of OCs and microplastic abundance inMediterranean Sea were recently detected in superficial neustonic/planktonic samples collected in Sardinian sea with PCBs rangingfrom 1889.6 ng/g d.w. to 3793.1 ng/g d.w. and DDTs from 185.0 ng/gd.w to 2130.1 ng/g d.w. (de Lucia et al., in this issue).
Until now few studies have addressed the impact of micro-plastics on filter-feeding organisms or other planktivorous animals(Boerger et al., 2010; Cole et al., 2013; Lusher et al., 2013; Murrayand Cowie, 2011; von Moos et al., 2012). A previous study byFossi et al. (2012) has reported on the potential impact on largefilter-feeding organism such as baleen whales.
In the present paper, we explore the potential routes of expo-sure and or absorption of MPs in the Mediterranean fin whale andbasking shark in relation to their different filter feeding activities(Table 2).
Basking sharks can sieve small organisms and microdebris fromthe water. Swimming with mouth open, masses of water fill thebasking shark mouth with prey flow. After closing its mouth, theshark uses gill rakers that filter the nourishment from the water.Gill rakers have thousands of bristles in the shark’s mouth that trapthe small organisms and microdebris which the shark then swal-lows. Thewater is expelled through the shark’s pairs of gill slits. Theseawater filtration rate for a 7m basking shark (mouth gape area ca.0.4 m2) swimming at a speed of 0.85 m s�1 was calculated to be881m3 h�1; we can hypothesize that in the Pelagos Sanctuary areas(mean MPs value 0.62 items/m3), this species could consumeapproximately 540 MPs items h�1, for a total daily consumption ofapproximately 13,110 microdebris items, plus any related adherentor incorporated toxic chemicals such as OCs, PAHs and phthalates(Table 2).
Fin whales exhibit one of the most extreme feeding methodsamong aquatic vertebrates. Fin whales, and other Balaenopteridae,lunge with their mouth fully agape, thereby generating dynamicpressure to stretch their mouth around a large volume of prey-ladenwater, which is then filtered by racks of baleen (Goldbogen et al.,2007). Balaenopteridae are intermittent filter feeders that ingestmouthfuls of water and separate food from the water beforeexpelling it and, subsequently, swallowing the prey captured. Thefiltering apparatus of baleen whales can be compared to a net or asieve, depending on the prey, microdebris and water conditionthrough baleen fringes (Werth, 2001). Considering the seawaterfiltration rate approximately of 5893 m3 daily we can hypothesize
that fin whale surface feeding in the Pelagos Sanctuary areas (meanMPs value 0.62 items/m3) could consume, a total daily amount ofapproximately 3653 items and the relative sink toxic chemicals(Table 2). Experiment carried out on porosity of baleens in whalesusing polymer microsphere (mean particle size 710 mm) pointed outthat suspended particles did not remain on baleen fringes and preyand items fall onto the tongue upon water expulsion (Werth, 2013).This mechanism suggests that microdebris can be ingested by thewhale together with the prey. Considering this theoretical calcula-tion, the basking shark can ingest daily approximately a total intakeof 3,6 time more MP items than the finwhale. Although, this higherintake of MPs is however coupled to values of phthalates two timelower and of OCs three times lower than those found in fin whale.The marked difference between the two species in the bio-accumulation of phthalates and organochlorines can be linked bothto a different ability of excretion of contaminants related to thepresence of a high excretory activity through the gills in the baskingshark but also to the massive ingestion of euphausiid species by finwhale (total plankton consume daily 913 kg) that show high con-centrations of plastic additives (Fossi et al., 2012). It is well knownthat the fin whale in the Mediterranean Sea feeds preferentially onthe planktonic euphausiid Meganyctiphanes norvegica, even if itfeeds on a wide spectrum of marine organisms, ranging from co-pepods to other euphausiid species, to small schooling fish (likeThysanoessa inermis, Calanus finmarchicus, E. krohnii) (Notarbartolodi Sciara et al., 2003; Relini et al., 1992). Preliminary data onMEHP concentration in samples of E. krohnii collected in SicilianChannel show high concentration of this contaminant, ranging from8.35 to 51.14 ng/g (mean values 36.92 ng/g) and suggesting thepresence of plastic additives also in planktonic species living in thewater column. Evidences of ingestion and impact of MPs by in-vertebrates, in particular zooplankton, have been reported (Coleet al., 2013; Murray and Cowie, 2011). Beside the physical harmand toxicological risk for invertebrates and zooplanktonicspecies themselves caused by MPs and through feeding activity, thetrophic transfer across the food chain represent a serious concern,especially for planktivorous species such as baleen whales andbasking sharks.
Considering both the high presence of MPs in the Mediterra-nean environment, and particularly in the MPA of Pelagos Sanctu-ary, and the detection of plastic additives and OCs in the tissues ofbasking sharks and finwhale, large filter feeding marine organismsappear to be chronically exposed to persistent and emerging con-taminants related to prey and MPs ingestion. Rochman et al. (2014)underline that several classes of compounds can be carried andreleased by MPs since organisms living in high density MPs envi-ronment show higher plastic-derived chemical pollutants accu-mulation in their tissue. The dual sources of contamination couldderive from direct leaching of contaminants (sorbed on or additive)from microplastics and assumption through already contaminatedplankton prey.
In this context, the data in this paper suggest the use ofphthalates as a tracer of microplastic ingestion by fin whale andbasking sharks. The tracer can serve as a warning signal of expo-sure to endocrine disruptors such as MEHP in the endangeredMediterranean population of this baleen whale and cartilaginousfish.
Particular attention has also been given to this new field ofresearch during the recent workshop organized by IWC andWoodsHole Oceanographic Institution in May 2013 in Woods Hole (MA,USA) on Assessing the Impacts of Marine Debris on Cetaceans. Theworkshop recommended that baleen whales and other large filterfeeders should be considered as critical indicators of the presenceand impact of microplastics in the marine environment, in nationaland international marine debris strategies. The workshop
Table 2Comparison between total volume filter daily, total plankton consume daily andtheoretical number of MP items assumed by B. physalus and C. maximus.
Balaenoptera physalus Cetorhinus maximus
Average adult body length 20 m 7 mAverage adult body mass 50,000 kg 4000 kgEngulfment volume 71 m3 e
Filtration rate e 881 m3 h�1
Number of lunges day�1 83 e
Total volume filtered daily 5893 m3 21,144 m3
Total plankton consumed daily 913 kg 30.7 kgTheoretical number of MPs
items assume daily3653 13,110
M.C. Fossi et al. / Marine Environmental Research xxx (2014) 1e86
Please cite this article in press as: Fossi, M.C., et al., Large filter feeding marine organisms as indicators of microplastic in the pelagicenvironment: The case studies of the Mediterranean basking shark (Cetorhinus maximus) and fin whale (Balaenoptera physalus), MarineEnvironmental Research (2014), http://dx.doi.org/10.1016/j.marenvres.2014.02.002

encouraged also further non-lethal research and the biomarkerdevelopment on these endangered Mediterranean species (IWC,2013).
The present study represents the first evidence of plastic addi-tives (phthalates) in Mediterranean basking sharks and it un-derlines the importance of future research both on detecting thepresence of and looking for toxicological impacts of microplastics infilter-feeders species such as cetaceans mysticete, basking sharkand devil ray. Due to the wide home-range and high-mobility ofthese species, which move in the whole basin all year round, theycould represent a wide scale integrator of the ecotoxicologicalstatus of the entire Mediterranean basin. Moreover, occupyingthese species the lowest position of the food web can be consideredas an early warning of the presence of a mixture of contaminants inthe marine food chain.
We highlight the value of these species in the implementation ofthe Descriptor 8 (contaminants) and Descriptor 10 (marine litter) inthe European MSFD, as sentinels of the plastic-related contamina-tion and presence and impact of micro-litter in the pelagicenvironment.
Acknowledgments
This project was partially supported by the Italian Ministry ofEnvironment, Territory and Sea (prot n.39752/III-17). We thank theFoundation Prince Albert II de Monaco for supporting OperazioneSqualo Elefante. We thank the Mediterranean Marine MammalsTissue Bank Department of Experimental Veterinary Science (Uni-versity of Padua, IT) for the samples of stranded finwhales, Dr. IlariaCaliani and Dr. Silvia Maltese (University of Siena) for crustaceanssampling. We thank Prof. Judit E. Smits (University of Calgary,Canada) for precious suggestions during manuscript writing.
References
Ballschmiter, K., Zell, M., 1980. Analysis of polychlorinated biphenyls (PCB) by glasscapillary gas chromatography. Fresenius Z. Anal. Chem. 302, 20e31.
Barber, M.G., 2008. Dietary uptake models using for modeling the bioaccumulationof organic contaminants in fish. Environ. Toxicol. Chem. 27, 755e777.
Barron, M.G., Schultz, I.R., Hayton, W.L., 1989. Presystemic branchial metabolismlimits di-2-ethylhexyl 239 phthalate accumulation in fish. Toxicol. Appl. Phar-macol. 98, 49e57.
Boerger, C., Lattin, G., Moore, S.L., Moore, C.J., 2010. Plastic ingestion by planktivo-rous fishes in the North Pacific Central Gyre. Mar. Pollut. Bull. 60, 2275e2278.
Browne, M.A., Galloway, T.S., Thompson, R.C., 2010. Spatial patterns of plastic debrisalong estuarine shorelines. Environ. Sci. Technol. 44, 3404e3409.
Cavanagh, R.D., Gibson, C., 2007. Overview of the Conservation Status of Cartilagi-nous Fishes (Chondrichthyans) in the Mediterranean Sea. IUCN, Gland,Switzerland and Malaga, Spain, p. 42.
Cole, M., Lindeque, P., Fileman, E., Halsband, C., Goodhead, R., Moger, J.,Galloway, T.S., 2013. Microplastic ingestion by zooplankton. Environ. Sci.Technol. 47, 6646e6655.
Collignon, A., Hecq, J.H., Galgani, F., Voisin, P., Collard, F., Goffart, A., 2012. Neustonicmicroplastic and zooplankton in the North Western Mediterranean Sea. Mar.Pollut. Bull. 64, 861e864.
Croll, D.A., Marinovic, B., Benson, S., Chavez, F.P., Black, N., Ternullo, R., Tershy, B.R.,2005. From wind to whales: trophic links in a coastal upwelling system. Mar.Ecol. Prog. Ser. 289, 117e130.
Croll, D.A., Tershy, B.R., 2002. Filter feeding. In: Perrin, W.F., Wursig, B.,Thewissen, J.G.M. (Eds.), Encyclopedia of Marine Mammals. Academic Press, SanDiego, pp. 428e432.
de Lucia, G.A., Matiddi, M., Marra, S., Camedda, A., Coppa, S., Caliani, I., Campani, T.,Giannetti, M., Coppola, D., Baini, M., Guerranti, C., Fossi, M.C., Alcaro, L., 2014.Neustonicmicroplastic in theSardinian coast (Central-WesternMediterraneanSea):amount, distribution and impact on zooplankton. Mar. Environ. Res. (in this issue).
de Sabata, E., Clò, S., 2010. Public sighting scheme reveals the seasonal presence ofCetorhinus maximus around north Sardinia, Italy. Biol. Mar. Mediterr. 1, 246e247.
Derraik, J.G.B., 2002. The pollution of the marine environment by plastic debris: areview. Mar. Pollut. Bull. 44, 842e852.
Engler, R.E., 2012. The complex interaction between marine debris and toxicchemicals in the ocean. Environ. Sci. Technol. 46, 12302e12315.
Fossi, M.C., Panti, C., Guerranti, C., Coppola, D., Giannetti, M., Marsili, L., Minutoli, R.,2012. Are baleen whales exposed to the threat of microplastics? A case study of
the Mediterranean fin whale (Balaenoptera physalus). Mar. Pollut. Bull. 64,2374e2379.
Fowler, S.L., 2009. Cetorhinus maximus (Northeast Atlantic subpopulation). In: IUCN2013. IUCN Red List of Threatened Species. Version 2013.1. www.iucnredlist.org.Downloaded on 11 September 2013.
Goldbogen, J.A., Pyenson, N.D., Shadwick, R.E., 2007. Big gulps require high drag forfin whale lunge feeding. Mar. Ecol. Prog. Ser. 349, 289e301.
Gregory, M.R., 2009. Environmental implications of plastic debris in marine settingse entanglement, ingestion, smothering, hangers-on, hitch-hiking and alieninvasions. Philos. Trans. R. Soc. Lond. B Biol. Sci. 364, 2013e2025.
Hidalgo-Ruz, V., Gutow, L., Thompson, R.C., Thiel, M., 2012. Microplastics in themarine environment: a review of the methods used for identification andquantification. Environ. Sci. Technol. 46, 3060e3075.
IWC/65A/Rep 1 Annex K, 2013. Report of the Scientific Committee. Annex K: Reportof the Standing Working Group on Environmental Concerns. InternationalWhaling Commission, Jeju Island, Republic of Korea.
Koelmans, A.A., Besseling, E., Wegner, A., Foekema, E.M., 2013. Plastic as a carrier ofPOPs to aquatic organisms: a model analysis. Environ. Sci. Technol. 47, 7812e7820. Erratum in: Environmental Science and Technology 2013 47, 8992e3.
Latini, G., De Felice, C., Verrotti, A., 2004. Plasticizers, infant nutrition and repro-ductive health. Reprod. Toxicol. 19, 27e33.
Latini, G., Wittassek, M., Del Vecchio, A., Presta, G., De Felice, C., Angerer, J., 2009.Lactational exposure to phthalates in Southern Italy. Environ. Int. 35, 236e239.
Lee, H., Shim, W.J., Kwon, J.H., 2014. Sorption capacity of plastic debris for hydro-phobic organic chemicals. Sci. Total Environ. 470e471, 1545e1552, 00937e00946, S0048-9697(13).
Lithner, D., Larsson, Å., Dave, G., 2011. Environmental and health hazard ranking andassessment of plastic polymers based on chemical composition. Sci. Total En-viron. 409, 3309e3324.
Lusher, A.L., McHugh, M., Thompson, R.C., 2013. Occurrence of microplastics in thegastrointestinal tract of pelagic and demersal fish from the English Channel.Mar. Pollut. Bull. 67, 94e99.r.
Mancusi, C., Clò, S., Affronte, M., Bradai, M., Hemida, F., Serena, F., Soldo, A.,Vacchi, M., 2005. On the presence of basking shark (Cetorhinus maximus) in theMediterranean Sea. Cybium 29, 399e405.
Marsili, L., Focardi, S., 1997. Chlorinated hydrocarbons (HCB, DDTs and PCBs) levelsin cetaceans stranded along the Italian coasts, an overview. Environ. Monit.Assess. 45, 129e180.
Martins, J., Sobral, P., 2011. Plastic marine debris on the Portuguese coastline: amatter of size? Mar. Pollut. Bull. 62, 2649e2653.
Mato, Y., Isobe, T., Takada, H., Kanehiro, H., Othake, C., Kaminuma, T., 2001. Plasticresin pellets as a transport medium for toxic chemicals in the marine envi-ronment. Environ. Sci. Technol. 35, 318e324.
Moore, C.J., Moore, S.L., Leecaster, M.K., Weisberg, S.B., 2001. A comparison of plasticand plankton in the North Pacific Central Gyre. Mar. Pollut. Bull. 42, 1297e1300.
MSFD GES Technical Subgroup on Marine Litter, 2011. Marine Litter TechnicalRecommendations for the Implementation of MSFD Requirements. EUR 25009EN e 2011.
Murray, F., Cowie, F.R., 2011. Plastic contamination in the decapod crustaceanNephrops norvegicus (Linnaeus, 1758). Mar. Pollut. Bull. 62, 1207e1217.
Notarbartolo di Sciara, G., Zanardelli, M., Jahoda, M., Panigada, S., Airoldi, S., 2003.The fin whale Balaenoptera physalus (L. 1758) in the Mediterranean Sea.Mammal. Rev. 33, 105e150.
PlasticsEurope, 10.10.2012. Plastics e the Facts 2012: an Analysis of EuropeanPlastics Production, Demand and Waste Data for 2011. http://www.plasticseurope.org/Document/plastics-the-facts-2012.aspx?FolID¼2.
Relini, G., Orsi Relini, L., Cima, C., Fasciana, C., Fiorentino, F., Palandri, G., Relini, M.,Tartaglia, M.P., Torchia, G., Zamboni, A., 1992. Macroplancton, Meganyctiphanesnorvegica, and fin whales, Balaenoptera physalus, along some transects in theLigurian Sea. Eur. Res. Cetaceans 6, 134e137.
Rochman, C.M., Browne, M.A., Halpern, B.S., Hentschel, B.T., Hoh, E.,Karapanagioti, H.K., Rios-Mendoza, L.M., Takada, H., Teh, S., Thompson, R.C.,2013. Policy: classify plastic waste as hazardous. Nature 494, 169e171.
Rochman, C.M., Lewison, R.L., Erikesen, M., Allen, H., Cook, A.M., Teh, S.J., 2014.Polybrominated diphenyl ethers (PBDEs) in fish tissue may be an indicator ofplastic contamination in marine habitats. Sci. Total Environ. 476e477, 622e633.
Ryan, P.G., Moore, C.J., Van Franeker, J.A., Moloney, C.L., 2009. Monitoring theabundance of plastic debris in the marine environment. Philos. Trans. R. Soc.Lond. Biol. Sci. 364, 1999e2012.
Sims, D.W., 2008. Sieving a living: a review of the biology, ecology and conservationstatus of the plankton-feeding basking shark Cetorhinus maximus. Adv. Mar.Biol. 54, 171e220.
Takatori, S., Kitagawa, Y., Kitagawa, M., Nakazawa, H., Hori, S., 2004. Determinationof di(2-etylhexyl)phthalate and mono(2-etylhexyl)phthalates in human serumusing liquid chromatographyetandemmass spectrometry. J. Chromatogr. B 804,397e401.
Teuten, E.L., Rowland, S.J., Galloway, T.S., Thompson, R.C., 2007. Potential for plasticsto transport hydrophobic contaminants. Environ. Sci. Technol. 41, 7759e7764.
Teuten, E.L., Saquing, J.M., Knappe, D.R., Barlaz, M.A., Jonsson, S., Björn, A.,Rowland, S.J., Thompson, R.C., Galloway, T.S., Yamashita, R., Ochi, D.,Watanuki, Y., Moore, C., Viet, P.H., Tana, T.S., Prudente, M., Boonyatumanond, R.,Zakaria, M.P., Akkhavong, K., Ogata, Y., Hirai, H., Iwasa, S., Mizukawa, K.,Hagino, Y., Imamura, A., Saha, M., Takada, H., 2009. Transport and release ofchemicals from plastics to the environment and to wildlife. Philos. Trans. R. Soc.Lond. B Biol. Sci. 364, 2027e2045.
M.C. Fossi et al. / Marine Environmental Research xxx (2014) 1e8 7
Please cite this article in press as: Fossi, M.C., et al., Large filter feeding marine organisms as indicators of microplastic in the pelagicenvironment: The case studies of the Mediterranean basking shark (Cetorhinus maximus) and fin whale (Balaenoptera physalus), MarineEnvironmental Research (2014), http://dx.doi.org/10.1016/j.marenvres.2014.02.002

UNEP, 2009. Marine Litter: a Global Challenge. UNEP, Nairobi, p. 232.UNEP/MAP, 2011. Strategic Action Programme for the Management of Marine Litter
in the Mediterranean.von Moos, N., Burkhardt-Holm, P., Köhler, A., 2012. Uptake and effects of micro-
plastics on cells and tissue of the blue mussel Mytilus edulis L. after an exper-imental exposure. Environ. Sci. Technol. 46, 11327e11335.
Werth, A.J., 2001. How do mysticetes remove prey trapped in baleen? Bull. Mus.Comp. Zool. Harv. Coll. 156, 189e203.
Werth, A.J., 2013. Flow-dependent porosity and other biomechanical properties ofmysticete baleen. J. Exp. Biol. 216, 1152e1159.
Wright, S.L., Thompson, R.C., Galloway, T.S., 2013. The physical impacts of micro-plastics on marine organisms: a review. Environ. Pollut. 178, 483e492.
M.C. Fossi et al. / Marine Environmental Research xxx (2014) 1e88
Please cite this article in press as: Fossi, M.C., et al., Large filter feeding marine organisms as indicators of microplastic in the pelagicenvironment: The case studies of the Mediterranean basking shark (Cetorhinus maximus) and fin whale (Balaenoptera physalus), MarineEnvironmental Research (2014), http://dx.doi.org/10.1016/j.marenvres.2014.02.002

Monitoring the impact of litter in large vertebrates in theMediterranean Sea within the European Marine Strategy FrameworkDirective (MSFD): Constraints, specificities and recommendations
F. Galgani a,*, F. Claro b, M. Depledge c, C. Fossi d
a Ifremer, Immeuble Agostini, ZI Furiani, 20600 Bastia, Corsica, FrancebMuseum national d’Histoire naturelle, GTMF, CP41, 57 rue Cuvier, 75231 Paris cedex 05, FrancecUniversity of Exeter, Devon EX4 4QJ, United KingdomdUniversity of Siena, Via Mattioli 4, 53100 Siena, Italy
a r t i c l e i n f o
Article history:Received 20 September 2013Received in revised form14 February 2014Accepted 15 February 2014
Keywords:Marine litterMSFDGood Environmental StatusMonitoringSea turtlesMarine mammalsSeabirdsFulmar
a b s t r a c t
In its decision (2010/477/EU) relating to the European Marine Strategy Framework Directive (MSFD,2008/56/EC), the European Commission identified the following points as focuses for monitoring:(i) 10.1.1: Trends in the amount, source and composition of litter washed ashore and/or deposited on
coastlines,(ii) 10.1.2: Trends in the amount and composition of litter in the water column and accumulation on
the sea floor,(iii) 10.1.3: Trends in the amount, distribution and composition of micro-particles (mainly micro-
plastics), and(iv) 10.2.1: Trends in the amount and composition of litter ingested by marine animals.Monitoring the impacts of litter will be considered further in 2014. At that time, the strategy will be
discussed in the context of the Mediterranean Sea, providing information on constraints, protocols,existing harm and research needed to support monitoring efforts.The definition of targets and acceptable levels of harm must take all factors into account, whether
entanglement, ingestion, the transport and release of pollutants, the transport of alien species and socio-economic impacts. It must also reflect on the practical deployment of “ingestion” measures (10.2.1). Theanalysis of existing data will reveal the potential and suitability of some higher trophic level organisms(fish, turtles, birds and mammals) for monitoring the adverse effects of litter. Sea turtles appear to beuseful indicator species, but the definition of an ecological quality objective is still needed, as well asresearch on alternative potential indicator species.
� 2014 Elsevier Ltd. All rights reserved.
1. Introduction
The Mediterranean Sea is the planet’s most highly-affected areain terms of marine litter, with densities of over 100,000 items/hafound on the sea floor, together with microplastics at892,000 items/km2 (Barnes et al., 2009; Collignon et al., 2012). Inrecent years, marine litter has caused increasing harm due toingestion, entanglement and the transport of toxic or living or-ganisms (Gregory, 2009).
In order to coordinate the protection of the marine environ-ment, the European Commission has developed the Marine
Strategy Framework Directive (MSFD) as part of its “IntegratedMaritime Policy” (Markus et al., 2011). This directive establishes aframework for each Member State to take action to achieve ormaintain Good Environmental Status for the marine environmentby 2020. Member States are obliged to follow an “action plan”,including an initial assessment of current environmental status,determinewhat Good Environmental Status (GES) is, then establisha series of environmental targets and associated indicators.
The creation and implementation of a monitoring programmefor ongoing assessment and regular target updating was launchedrecently. A series of measures designed to achieve or maintain goodenvironmental status will complete the process by 2016, with afollow-up assessment scheduled in 2018.
Among the 11 descriptors incorporating 56 indicators of GoodEnvironmental Status, descriptor 10 is identified as “Properties and
* Corresponding author.E-mail address: [email protected] (F. Galgani).
Contents lists available at ScienceDirect
Marine Environmental Research
journal homepage: www.elsevier .com/locate/marenvrev
http://dx.doi.org/10.1016/j.marenvres.2014.02.0030141-1136/� 2014 Elsevier Ltd. All rights reserved.
Marine Environmental Research xxx (2014) 1e7
Please cite this article in press as: Galgani, F., et al., Monitoring the impact of litter in large vertebrates in the Mediterranean Sea within theEuropean Marine Strategy Framework Directive (MSFD): Constraints, specificities and recommendations, Marine Environmental Research(2014), http://dx.doi.org/10.1016/j.marenvres.2014.02.003

quantities of marine litter do not cause harm to the coastal andmarine environment”. “Litter” refers to items that have been madeor used by people, then deliberately discarded or lost in the sea andon beaches, including material transported into the marine envi-ronment from land by rivers, drainage or sewage systems, or winds.Much of this litter will persist in the sea for years, decades or evencenturies. On average, three quarters of all marine litter consists ofplastics, which are known to be particularly persistent (Galganiet al., 2010).
The Commission’s Decision (2010/477/EU) of September 1st,2010 on “Criteria and methodological standards on Good Envi-ronmental Status of marine waters” identifies the following fourindicators for monitoring progress towards achieving Descriptor10:
(i) Trends in the amount of litter washed ashore and/or depos-ited on coastlines, including analysis of its composition, spatialdistribution and, where possible, source (10.1.1), (ii) Trends in theamount of litter in the water column (including floating at thesurface) and deposited on the sea floor, including analysis of itscomposition, spatial distribution and, where possible, source(10.1.2), (iii) Trends in the amount, distribution and, where possible,composition of microparticles (in particular microplastics) (10.1.3),and (iv) Trends in the amount and composition of litter ingested bymarine animals (e.g. stomach analysis) (10.2.1) for the evaluation ofits impact on marine fauna organisms.
These Indicators were drawn up by a group of specialists on thebasis of an assessment of what could be defined as Good Environ-mental Status (Galgani et al., 2010). However, knowledge relating tothe distribution of litter, its degradation and fate, and its potentiallyharmful biological, physical and chemical impacts on marine lifeand habitats is currently insufficient.
Various monitoring programmes are to be implemented by2014. The definition of targets and acceptable levels of harm willmainly rely on the practical implementation of the “ingestion” in-dicators (10.2.1) listed in the MSFD. The strategy has been well-defined for indicators of adverse impacts in the MediterraneanSea, but its limitations must be identified and its scientific basismust be made more robust. UNEP pointed out that the main legaland institutional frameworks affecting the Mediterranean on thistopic underline a general lack of available data on marine wildlifeaffected by marine litter in the Mediterranean Sea.
Marine litter has a major impact on large vertebrates, as animalsoften become entangled in discarded ropes and nets, or trapped inplastic containers and strapping bands. Many animals also mistakelitter items as prey: up to 76% of turtles have been recorded asingesting plastic bags in certain Mediterranean areas (Tomas et al.,2002), while the stomachs of 98% of Fulmars in the North Sea havebeen found to contain plastic, potentially leading to a loss ofphysical condition, breeding failure and, in severe cases, to death(Van Franeker et al., 2011). Mediterranean seals and other marinemammal species are subject to entanglement, but large vertebratesmay also be exposed to micro-litter ingestion through passiveingestion, in particular filter feeding (Fossi et al., 2012a).
The analysis of existing data reveals the potential and suitabilityof some higher trophic level organisms as indicators for monitoringthe effects of litter (Fig. 1). Here, we describe the opportunities andlimitations of using large vertebrates to evaluate the harm caused tomarine life by litter. We also highlight several key issues that mustbe addressed through research. Finally, various recommendationsare given to support the implementation of monitoring programs.
2. MSFD and the monitoring of marine litter
In Article 11 of the monitoring requirements of the MSFD, it isspecified that Member States must establish and implement
coordinatedmonitoring programmes for the ongoing assessment ofthe environmental status of their marine waters and that moni-toring programmes within given marine regions or sub-regionsmust be compatible.
The monitoring efforts will address various objectives, such asthe assessment of GES, temporal and spatial trends, the level ofachievement of environmental targets and the effectiveness ofmeasures. Monitoring will mainly consists of determining trends inthe amounts of marine litter and its adverse impacts, and theidentification of sources, in order to support measures to reduceplastic inputs. Indicators that are to be directly included in nationalmonitoring plans in 2014 and indicators requiring further devel-opment will typically be considered separately.
In the context of the Mediterranean sea and BarcelonaConvention, a Policy Document and associated Strategic Frame-work for Marine Litter management was adopted through MEDPOLin 2012 to (i) follow trends of marine litter generation and distri-bution through the establishment of a monitoring programme formarine litter based on the Ecosystem Approach, (ii) indicate sour-ces and activities leading to marine litter production, and (iii)
Fig. 1. Summary of interactions between large marine vertebrates and marine litter.Fluxes of litter in the life cycle and intensity of its effects on large marine vertebrates,(a: entanglement; b: ingestion), depending on various factors such as ingestionmechanisms (predation, active or passive filter feeding), development stage (benthic orpelagic phases for sea turtles), behaviour and foraging strategy (feeding on the seafloor, in the water column or on the surface, selectivity according to colour, shape etc,ecological plasticity in diet and habitat), types of litter (micro/macro litter) and types offishing gear (nets, hooks and lines). The thicker arrows indicate key processes.Although trophic transfer from one level to another has been demonstrated in vitro formicroplastics in plankton, it remains controversial in situ, as most ingested litter isexcreted in faeces. (For interpretation of the references to colour in this figure legend,the reader is referred to the web version of this article.)
F. Galgani et al. / Marine Environmental Research xxx (2014) 1e72
Please cite this article in press as: Galgani, F., et al., Monitoring the impact of litter in large vertebrates in the Mediterranean Sea within theEuropean Marine Strategy Framework Directive (MSFD): Constraints, specificities and recommendations, Marine Environmental Research(2014), http://dx.doi.org/10.1016/j.marenvres.2014.02.003

indicate if the adopted litter management/mitigation strategies areeffective or need further adaptation.
A litter monitoring programme is expected to be developed forthe application of the Ecosystem Approach at a regional level, withMEDPOL coordinating this activity and promoting the appropriatemethodologies. The Regional Action Plan (RAP) on marine litter,adopted in December 2013, shall become legally binding once it hasbeen adopted by the Contracting Parties of the Barcelona Conven-tion. Article 12 of the RAP refers to a Mediterranean Marine LitterMonitoring Programme for 2014, following international andregional guidelines adapted from the protocols produced by theMSFD technical group on marine litter (Galgani et al., 2011; Galganiet al., 2014). This technical group tackles the comparison and finalassessment of the various existing monitoring methods, as well asother crucial issues that must be addressed and clarified (spatialdistribution of survey sites, sampling frequency, QA/QC needs,management/handling of data/metadata, etc.).
The impacts of nano and microplastics at sea span many bio-logical levels, from molecular to ecosystem. They include chemicalandmechanical impacts due to ingestion, the release of transportedchemicals and the transport of alien species (Fossi et al., 2012a; Coleet al., 2013; Rochman et al., 2013). Entanglement by, and ingestionof, larger debris generally affect large organisms, whether on anindividual or population level. However, larger debris may alsoaffect smaller organisms and ecosystems through transportation tonew, remote habitats, albeit to a lesser extent.
Biota indicators play an important role, as they provide in-dications of possible harm. At the same time, current protocols andmethods have varying degrees of maturity. Pilot-scalemonitoring istherefore an important step towards monitoring litter harm interms of determining baselines and/or adapting the strategy tolocal areas. Regarding harm assessment in the Mediterranean sea,and in accordance with Article 11 of the MSFD, Member Statessharing a marine region or sub-region must also draw up theirmonitoring programmes in a coherent manner by ensuring moni-toring methods are consistent across the marine region or sub-region; this will facilitate the comparison of monitoring resultsand take into account relevant trans-boundary impacts and fea-tures. Without some degree of information on trends and amountsacross all compartments, a risk-based approach to litter monitoringand measures is impossible.
When defining the aims and objectives of monitoring, the Ma-rine Strategy Coordination Group (MSCG) interpreted monitoringas an assessment of whether GES has been achieved or maintained,whether environmental status is improving, stable or deteriorating,and what progress has been made towards achieving environ-mental targets.
Our current lack of knowledge with regards to harmful levels oflitter is such that absolute targets are difficult to set; as a result,many Member States are formulating trend targets instead. Theprotocol for litter ingested by Fulmars (Van Franeker and the SNSFulmar Study Group, 2011; Van Franeker et al., 2011) is an excep-tion: a quantitative target level has been formulated as an OSPAREcological Quality Objective (EcoQO) and has recently become alegal obligation in certain member states. The design of most pro-tocols enables regional adaption and the discrimination of litteritems; they are therefore likely to detect changes in litter types andenable a proper assessment of the various measures implemented.For example, monitoring of litter in Fulmar stomachs in the OSPARarea has shown decreasing trends in industrial plastic pellets aftermeasures were taken to decrease pellet spillage (Galgani et al.,2011). As major future decisions will be based on measures,monitoring efforts should be shouldered by quality control/qualityassurance (inter-comparisons, use of reference material, training,etc.) to assist survey teams. A master-standard list of categories of
litter items has been prepared by the MSCG Technical Group MLwith compatible sub-categories for the various marine compart-ments (beach, sea floor, sea surface and ingested litter). This willenable the comparison of results between regions and environ-mental compartments. Items may be attributed to a given sourcee.g. fisheries, shipping etc., or a given form of interaction e.g.entanglement, ingestion etc., hence facilitating identification of themain sources of marine litter pollution and the potential harmcaused by litter. This will enable a more target-orientated imple-mentation of measures.
Site selection strategies will focus on both sites with specificcharacteristics and sites chosen randomly in order to facilitate ex-trapolations. Regarding harm indicators in larger organisms fromthe Mediterranean sea, the implementation of sampling campaignson species (turtles, fish, mammals or birds) that are widelydistributed and may migrate over long distances, while taking intoaccount the characteristics of the sampling area (generally on abasin/subbasin level), will assist in creating a large-scale moni-toring network catering for transboundary issues, despite the dif-ficulties and costs involved in finding statistically-significanttrends. Moreover sampling/analysis will need to be coordinatedand harmonized on a basin scale, e.g. NorthwesternMediterranean,Adriatic, Ionian, Aegean and Levantine basins.
Our ability to unveil significant trends or variations may beassisted by case-specific statistical power analysis. This has beenconducted for various protocols, e.g. the Fulmar litter ingestionprotocol, and increases the probability of detecting actual changes.
Data handling and reporting for the MSFD are under consider-ation both at an EU level and a Regional Sea and sub-regional level.An online, European-wide data collection system will facilitateanalysis. The reporting process for data and information under theMSFD (Art 19.3) is being addressed by the DIKE Working Group(Data, Information Knowledge Transfer) and steered by DG Envi-ronment and the European Environmental Agency, to define datathat will be collected at a national level andmade available throughINSPIRE or EMODnet in the framework of the Water InformationSystem for Europe (WISEeMarine).
3. Adverse impacts and monitoring
The potentially harmful implications of marine litter haveescalated in recent years and currently include: (i) harm to andmortality of marine wildlife as a consequence of the ingestion of inmarine litter, (ii) entanglement in derelict nets, traps and potsleading to potential losses in biodiversity, (iii) the accumulation andtransport of persistent organic pollutants and the release ofpotentially toxic and hormonal-effective chemicals, and (iv)transport of alien species (Gregory, 2009).
Defining harm in theMSFD context is a difficult task. A variety ofapproaches or guidelines can be used to evaluate the adverse ef-fects of litter at sea. Reference documents such as the UK govern-ment’s Farm Animal Welfare Council, which takes into account 5types of effects, named freedoms, are useful (FAWC, 1979). How-ever, we do not possess a complete picture of the effects of marinelitter. Moreover, its economic impacts, as referred to in the GESdefinition, are not taken into consideration in this approach.
Litter affects marine life at various organisational levels and itsimpact varies according to the target species or population, envi-ronmental conditions and the considered region or country. Theconcept of harm itself is not obvious, as no acceptable units ofmeasure have been defined. A reassessment of what Good Envi-ronmental Status means will help better define harmwithin MSFD.However, even proven harm may not be useful for monitoringpurposes. In view of the diversity of litter and targets,
F. Galgani et al. / Marine Environmental Research xxx (2014) 1e7 3
Please cite this article in press as: Galgani, F., et al., Monitoring the impact of litter in large vertebrates in the Mediterranean Sea within theEuropean Marine Strategy Framework Directive (MSFD): Constraints, specificities and recommendations, Marine Environmental Research(2014), http://dx.doi.org/10.1016/j.marenvres.2014.02.003

measurements may prove unsuitable for the large-scale, complexharmonisation currently necessary.
For example, entanglement has been highlighted as having oneof the most harmful impacts on marine organisms, with culpritssuch as strapping bands, plastic bags and drums. As a result of theirsize and weight, larger vertebrates may continue to travel overconsiderable distances after becoming entangled in ropes, net andlines, hence transforming active fishing gear into marine debris.Reports also exist of small cetaceans, such as harbour porpoises,becoming entangled in ghost fishing gear (Butterworth et al., 2012).However, the MSFD monitoring criteria only refer to ingested litter,due to difficulties in distinguishing between entanglement in litterand active fishing gear. The European situation with regards toanimal deaths due to entanglement is somewhat diverse. In certainareas, with efficient stranding networks, entangled beached speciessuch as cetaceans are quite frequently found and could thereforecontribute to harm assessment. However, current difficulties ininterpreting data, together with the low reported numbers ofentangled beached animals and problems associated with large-scale harm assessment due to the rarity of strandings, mean thisapproach can only usefully be applied to specific areas and on thebasis of national decisions. Nevertheless, research may contributeto the development of new, more specific entanglement indicators.For example, seabird nests can be used to facilitate litter-relatedentanglement monitoring, as the litter found there cannot origi-nate from active fishing gear (Votier et al., 2011), Optimising thistype of protocol should promote a better understanding of harmfuleffects and more efficient MSFD implementation in the future.
An emerging area of concern is the accumulation of microplasticfragments (less than 5 mm) in the water column and in sediment,which also affect marine life and especially filter feeders(Thompson et al., 2004).
Several recent studies have identified the potential effects ofplastic particles, in particular on invertebrates and fish, including: 1e transport of persistent, bioaccumulating and toxic (PBT) sub-stances from plastics. 2 e leaching of additives from the plasticssuch as phthalates. 3 e physical harm (Wright et al., 2013).
However, until the recent work of Fossi et al. (2012a,b), no datahad been reported on the impact of microplastics on large filter-feeding organisms such as baleen whales or sharks, which poten-tially ingest micro-litter while filter feeding.
As no single species can actually provide full coverage of all ofEurope’s maritime zones, a range of species is needed to monitoringested litter, possibly with some spatial overlaps. An indicatorexpressing the impact of marine litter is available in the North Sea(OSPAR EcoQO); it is used tomeasure ingested litter in the NorthernFulmar (Fulmarus glacialis) with regards to a set target for accept-able ecological quality in the North Sea (Van Franeker and the SNSFulmar Study Group, 2011, Van Franeker et al., 2011). This tool isapplicable to most Northeast Atlantic countries, but research(proportions of micro and macro debris found in stomachs, parti-cles sizes, etc.) is needed, especially for the Mediterranean Sea, andfurther afield if possible. On the basis of available information andexpertise, the MSCG TG ML group reported on the development ofmonitoring protocols for other species of seabirds, sea turtles andfish. A similar approach to the Fulmar approach has been suggested,whereby various plastic categories are counted and weighed.
A protocol for sea turtle monitoring, focussing on various pa-rameters, is currently being developed for application in theMediterranean Sea and some areas of the South Atlantic Sea. Aspost-mortem examinations reveal litter in 30e80% of endangeredLoggerhead sea turtles Caretta caretta (IUCN red list status “En-dangered A1abd ver 2.3”, IUCN, 2013 and species listed in CITESAppendix I, review in Schuyler et al., 2013) stranded on beaches oraccidentally captured in the northern area of the Western
Mediterranean (Claro and Hubert, 2011; Pibot and Claro, 2011), onthe western coast of Italy (Travaglini et al., 42%, N ¼ 60 & Camedaet al., 30%, N ¼ 30, this issue), in the Adriatic Sea (Lazar and Gracan,2011), and on the coasts of Tuscany (Campani et al., 2013) and Spain(Tomas et al., 2002), this species is a good candidate for monitoringthe Mediterranean on a sub-basin scale (Northwestern Mediterra-nean, Adriatic, Ionian, Aegean and Levantine basins). This protocolwill need to be further improved through (i) more efficient net-works dedicated to the collection of stranded animals and mea-surement of the impact of fishing gear, (ii) the collection ofinformation from rescue centres, (iii) special consideration of MLinformation from existing monitoring efforts, (iv) the considerationof new findings and (v) monitoring the effects of litter in livingorganisms using a non-destructive biomarker approach. A pilotstudy evaluating methods and potential sources of bias was con-ducted in 2012 in Italy (Matiddi et al., 2011). Research must now beperformed to define a Sea Turtle EcoQO suitable for the variousareas in the context of the MSFD. This may also constitute anobjective for Southern OSPAR regions (France, Spain and Portugal).
The overall threat incurred by ingested macroplastics and otherdebris remains unclear with regards to all populations and cetaceanspecies. Debris ingestion in 43 cetacean species has been reportedin the literature, comprising 7 Mysticete and 35 Odontocete species(Baulch and Perry, 2012; International Whaling Commission, 2013).However, if we look at research on the ingestion of debris bymarinemammals, even in view of the spectacular cases of mortality due toingestion of large amounts of marine litter in the MediterraneanSea (Jacobsen et al., 2010; De Stephanis et al., 2013), the knownrates of incidence of ingested litter are generally too low to justify astandard MSFD monitoring recommendation. For example, lessthan 1% of mammals stranded on French beaches between 1972and 2006 were found to have ingested litter (Pibot and Claro, 2011).However, we do have an adequate understanding of variations inspecies distribution and behaviour at different times of the year,which can be extremely valuable integrators of environmentalquality. Discussions at the SETAC workshop in 2013 (Fossi et al.,2012c) revealed that large pelagic fish may be especially usefulfor monitoring short to medium-term changes in pelagic ecosys-tems, while marine mammals such as whales provided a moreintegrated view in the long term (Fossi et al., 2012a).
Although these are early days for suggesting a particular pro-tocol and assessing ongoing research activity, the MSFD marinelitter TSG identified the need to develop a common protocol for themonitoring of ingested litter in fish, applicable at all sites, as apriority. Information is still required on the size/types of items to beexamined and fish species that are suitable from an ecosystemperspective and for regional comparison (abundance, cycles, etc.).Regular fish monitoring campaigns are already conducted in theMediterranean Sea (http://www.sibm.it/SITO%20MEDITS/ andpelagic fish surveys), involving shared sampling efforts and usingtried and tested protocols derived from methods for analysing thecontent of fish stomachs (Cortes, 1997).
Plastic ingestion by seabirds has been widely recorded, beingProcellariiformes the most affected order (Rodríguez et al., 2012).Despite the voluminous information on ingested plastic debris byadults across the world (Van Franeker and the SNS Fulmar StudyGroup, 2011; Van Franeker et al., 2011; Rodríguez et al., 2012),only one study described however plastic ingestion in Mediterra-nean seabirds (Codina-García et al., 2013). With occurrences ofdebris in 70e94% of individuals, when the rest of species werebelow 33% the results pointed out the threatened shearwaterspecies as being particularly exposed to plastic accumulation.Implementation of monitoring may be however limited because ofthe distribution of these three endemic species, restricted to thewestern Mediterranean sea.
F. Galgani et al. / Marine Environmental Research xxx (2014) 1e74
Please cite this article in press as: Galgani, F., et al., Monitoring the impact of litter in large vertebrates in the Mediterranean Sea within theEuropean Marine Strategy Framework Directive (MSFD): Constraints, specificities and recommendations, Marine Environmental Research(2014), http://dx.doi.org/10.1016/j.marenvres.2014.02.003

If abundance of ingested debris by seals has beenmentioned as apotential indicator of marine litter in the European Marine StrategyFramework Directive, a recent study (Bravo Rebolledo et al., 2013)demonstrated however an incidence on 11% of the harbour sealfrom the Dutch coast. In the Mediterranean sea where fewer than600 individuals ofMonachus monachus are remaining, no study hasbeen performed but if observed level of incidence may be ofenvironmental concern, the distribution is patchy and the abun-dance is low in the sense of suitability for monitoring purposes.
In addition to ingestion protocols, guidelines are currently be-ing developed for litter in seabird nest structures and the associ-ated entanglement in litter in nest structures. Some species tendto incorporate marine litter in their nests, which may result inentanglement (Votier et al., 2011). Although regional occurrenceand distribution vary, nesting material and associated mortalitiescan be linked to the amounts of litter found in the natural envi-ronment in the vicinity of the breeding site, hence demonstratingthe harmful effects of litter with more ease versus litter ingestion.Monitoring can continue to focus on existing colonies that areregularly monitored in many European countries without toomuch extra effort, but research is still needed to define behaviours,breeding seasons and the types of litter brought into seabird nests,in particular any litter that may originate from land. Information isgrossly lacking on Mediterranean nesting species such as Euro-pean shags (Phalacrocorax aristotelis), but the potential remainsimportant, especially with regards to monitoring of remoteislands.
The European Shag is very common throughout the Mediter-ranean and nests on coastal areas in most European and NorthAfrican countries, together with the Black Sea coast. Litter in shags’nests is already used as indicator of marine pollution in Brittany,France (Cadiou et al., 2011) and the protocol may serve as a basis forimplementing the MSFD.
Only a limited number of reports exist on microparticle sam-pling in biota. Most of these relate to small organisms. Among thelarger vertebrates, baleen whales and, potentially, basking sharksare exposed to micro-litter ingestion as a result of their filter-feeding activity, but impacts are under investigation (Fossi et al.,2012b). These large, filtering marine organisms were recentlyselected for the MED-SDSN PLASTIC-BUSTERS project (under theUN umbrella) as wide-scale indicators of the presence and impactof microplastics throughout the Mediterranean pelagic environ-ment. The fin whale (Balaenoptera physalus), which is one of thelargest filter feeders in the world, feeds primarily on planktoniceuphausiid species. This whale, which is the only resident mysti-cete in theMediterranean Sea, gathers in the feeding grounds of thePelagos Sanctuary Marine Protected Area (MPA). With eachmouthful, the whales trap approximately 70,000 l of water, andtheir feeding activities include surface feeding. The basking shark(Cetorhinus maximus) is a large, filter-feeding, migratory andwidely-distributed pelagic species. Basking sharks feed onzooplankton captured by forward swimming with an open mouth,so that a passive water flow passes across the gillraker apparatus.Both species could face risks due to the ingestion and degradationof microplastics. The recent workshop (May 2013) organized by theInternational Whaling Commission (IWC) at the Woods HoleOceanographic Institution recommended that baleen whales andother large filter feeders be considered in national and interna-tional marine debris strategies (e.g. Descriptor 10 (marine litter) inthe EU Marine Strategy Framework Directive) as critical indicatorsof the presence and impact of microplastics in the marine envi-ronment. As this is the only example of microplastic ingestion bylarge vertebrates and the first warning of this emerging threat tobaleen whales, and despite the difficulties of sampling, thisapproach must be considered for further investigation.
Plasticizers, sealing agents and additives such as phthalates orbisphenol A have been shown to be present in the tissues of variousmarine organisms, including large vertebrates such as whales andsharks (Fossi et al., 2012b,c). Their presence in tissues such asblubber from stranded finwhales (Balaenoptera physalis) or musclefrom basking sharks (C. maximus) suggests that they could serve asa tracer of microplastic intake.
However, although these plastic derivatives have major poten-tial toxicity, their monitoring in the MSFD framework is typicallyassociated with Descriptor 8.
4. Research
In addition to the identification of sources and monitoring-based support, a better understanding of the harm to large ma-rine vertebrates caused by marine litter is needed to supportMember States in the implementation of Descriptor 10. However,there is no consolidated common understanding of what consti-tutes “harm” frommarine litter, or how it can be assessed. Researchefforts to develop robust approaches for harm assessment will needto be identified. The identification of gaps in our understanding andthe development of research programmes are key prerequisites, sothat monitoring tools and protocols can be implemented realisti-cally and cost-effectively.
The recent workshop (May 2013) organized by IWC alsoencouraged further non-lethal research in view of the promisingresearch on biomarker development. It recommended further workin this field, such as new gene expression biomarkers in cetaceansdeveloped in an “ex vivo” approach (organotypic cultures), whichexposes cetacean skin biopsies to increasing doses of contaminantmixtures.
Many European projects got underway in 2012/2013. Some havenow been completed, but most are still in progress with projectedresults in 2014e2015. The EC is currently defining the researchprogrammes for Horizon 2020, in which MSFD marine litterresearchmust be taken into account. Priority should be given to themost-affected areas, the most prominent of which is probably theMediterranean Sea. As stated by the MSCG Technical Groupregarding impacts and ingestion, monitoring implementation andshort-term research priorities will need to (i) Develop or useexisting comprehensive models to define source and destinationregions of litter (especially accumulation areas), (ii) Evaluate theenvironmental consequences of litter-related chemicals (Phtha-lates, bisphenol A, etc.) in marine organisms using specific diag-nostic biomarkers, (iii) Establish the environmental consequencesof micro-litter to establish potential physical and chemical impactson wildlife, (iv) Evaluate the effects of litter on metabolism, phys-iology, survival rate, reproductive performance and, ultimately, onpopulations or communities, (v) Study dose/response relationshipsin relation to types and quantities of marine litter, to enablescience-based definitions of threshold levels, and (vi) Rationalisemonitoring (standards/baselines; data management/quality assur-ance; extend monitoring protocols to all Mediterranean sub-regions).
The development and implementation of assessment andmonitoring campaigns, and the implementation of measures in theframework of the Mediterranean Action Plan, will also requirescientific cooperation among the Parties involved. The Secretariatof the Barcelona convention will organize and support this scien-tific cooperation, advise the EU Project in terms of scientific needsand support action on priority research topics. In view of thecommon concerns of the MSCG TG with regards to harm moni-toring, research priority will be given to (i) The development ofcomprehensive modelling tools for the evaluation and identifica-tion of sources and fate of litter in the marine environment, (ii)
F. Galgani et al. / Marine Environmental Research xxx (2014) 1e7 5
Please cite this article in press as: Galgani, F., et al., Monitoring the impact of litter in large vertebrates in the Mediterranean Sea within theEuropean Marine Strategy Framework Directive (MSFD): Constraints, specificities and recommendations, Marine Environmental Research(2014), http://dx.doi.org/10.1016/j.marenvres.2014.02.003

Effects (lethal or sub lethal) under different environmental condi-tions of entanglement, in particular on threatened and protectedspecies, (iii) Understanding how litter ingested by marine organ-isms, in particular threatened and protected species, affects theirphysiological condition and chemical burden, reduces survival andreproductive performance and ultimately affects their populationsor communities, and (iv) Developing an Ecological Quality
Objective (EcoQO) for ingestion of litter in indicator species suitablefor monitoring (sea turtles) (Tables 1 and 2).
5. Conclusions
In view of our current level of understanding of the harm tomarine life caused by marine litter and the potential of large ver-tebrates for assessing Good Environmental Status, the above rec-ommendations may help support the implementation ofmonitoring in the MSFD framework.
References
Barnes, D., Galgani, F., Thompson, R., Barlaz, M., 2009. Accumulation and frag-mentation of plastic debris in global environments. Phil. Trans. R. Soc. B July 27(364), 1985e1998.
Baulch, S., Perry, C., 2012. A sea of plastic: evaluating the impacts of marine debrison cetaceans. Report of the Scientific Committee Panama City, Panama. Reportof the Scientific Committee Panama City, Panama, 11e23 June 2012, SC/64/E10,24 pp.
Bravo Rebolledo, E., Van Franeker, J., Jansen, O., Brasseur, S., 2013. Plastic ingestionby harbour seals (Phoca vitulina) in The Netherlands. Mar. Poll. Bull. 67, 200e202.
Butterworth, A., Clegg, I., Bass, C., 2012. Marine debris: a Global Picture of theImpact on Animal Welfare and of Animal-focused Solutions. WSPA Interna-tional, 222 Grays Inn Road, London. WC1X 8HB, WSPA International, 222 GraysInn Road, London, WC1X 8HB.
Cadiou, B., Pouline, P., Dugue, L., 2011. Occurrence of marine debris in Europeanshag’s nests as indicator of marine pollution. In: Poster Presented at the SeabirdGroup 11th International Conference, 2e4 September 2011, Plymouth, UK.
Campani, T., Baini, M., Giannetti, M., Cancelli, F., Mancusi, C., Serena, F., Marsili, L.,Casini, S., Fossi, C., 2013. Presence of plastic debris in loggerhead turtle strandedalong the Tuscany coasts of the Pelagos Sanctuary for Mediterranean MarineMammals (Italy). Mar. Pollut. Bull. 74, 225e230.
Claro, F., Hubert, P., 2011. Impact des macrodéchets sur les tortues marines enFrance métropolitaine et d’Outre-mer. MNHN-SPN, Paris, p. 52. Rapport GTMF-SPN 1.
Codina-García, M., Militão, T., Moreno, J., González-Solís, J., 2013. Plastic debris inMediterranean seabirds. Mar. Pollut. Bull. 77 (1e2), 220e226.
Cole, M., Lindeque, P., Fileman, E., Halsband, C., Goodhead, R., Moger, J., Galloway, T.,2013. Micro-plastic ingestion by zooplankton. Environ. Sci. Technol. 47 (12),6646e6655.
Collignon, A., Hecq, J., Galgani, F., Voisin, P., Goffard, A., 2012. Neustonic microlasticsand zooplankton in the western Mediterranean sea. Mar. Pollut. Bull. 64, 861e864.
Cortes, E., 1997. A critical review of methods of studying fish feeding based onanalysis of stomach contents: application to elasmobranch fishes. Can. J. Fish.Aquat. Sci. 54, 726e738.
De Stephanis, R., Giménez, J., Carpinelli, E., Gutierrez-Exposito, C., Cañadas, A., 2013.As main meal for sperm whales: plastics debris. Mar. Pollut. Bull. 96, 206e214.
Farm Animal Welfare Council, FAWC, 1979. http://www.fawc.org.uk/freedoms.htm.Fossi, M., Giannetti, M., Guerranti, C., Marsili, L., Coppola, D., Panti, C., Minutoli, R.,
2012a. Are baleen whales exposed to the threat of microplastics? A case studyof the Mediterranean fin whale (Balaenoptera physalus). Mar. Pollut. Bull. 64(11), 2374e2379.
Fossi, M., Guerranti, C., Coppola, D., Baiani, M., Giannetti, M., Campani, T., Clo, S.,Desabata, S., 2012b. Preliminary assessment of microplastics threat in Medi-terranean basking sharks (Cetorhinus maximus): implication for the MSFD. In:Poster Presented at the International Conference on Prevention and Manage-ment of Marine Litter, 10e12/04/2013.
Fossi, C., Casini, S., Caliani, I., Panti, C., Marsili, L., Viarengo, A., Giangreco, R.,Notarbartolo di Sciara, N., Serena, F., Ouerghi, A., Depledge, M., 2012c. The roleof large marine vertebrates in the assessment of the quality of pelagic marineecosystems. Mar. Environ. Res. 77, 156e158.
Galgani, F., Fleet, D., Van Franeker, J., Katsavenakis, S., Maes, T., Mouat, J.,Oosterbaan, L., Poitou, I., Hanke, G., Thompson, R., Amato, E., Birkun, A.,Janssen, C., 2010. Marine strategy framework directive task group 10 reportMarine litter. In: Zampoukas, N. (Ed.), JRC Scientific and Technical Report, ICES/JRC/IFREMER Joint Report (No 31210-2009/2010), p. 57.
Galgani, F., Hanke, G., Werner, S., Piha, H., 2011. MSFD GES technical subgroup onmarine litter. In: Technical Recommendations for the Implementation of MSFDRequirements, p. 93. JRC Scientific and Technical Report, EUR 25009 EN e 2011.
Galgani, F., Hanke, G., Werner, S., Oosterbaan, L., Nilsson, P., Fleet, D., McKinsey, S.,Thompson, R., VanFraneker, J., Vlachogianni, T., Scoullos, M., Mira Veiga, J.,Palatinus, A., Matiddi, M., Maes, T., Korpinen, S., Budziak, A., Leslie, H., Gago, J.,Liebezeit, G., 2014. MSFD technical group on Marine Litter, Guidance onMonitoring of Marine Litter in European Seas. JRC Scientific and Policy reports,SJRC83985, EUR 26113 ENI, SBN 978-92-79-32709-4. ISSN: 1831-9424. http://dx.doi.org/10.2788/99475, 128.
Gregory, M.R., 2009. Environmental implications of plastic debris in marine settingse entanglement, ingestion, smothering, hangers-on, hitch-hiking, and alien
Table 1Recommendations for monitoring and research litter ingestion by large marine or-ganisms within MSFD.
A) MonitoringTurtles (high priority):- Define an EcoQO for the loggerhead turtle Caretta caretta in the Mediterra-nean Sea (High priority)
- Set up harmonised monitoring at a sub-regional level (basin level)- Improve the collection of information/samples (stranded turtles and fromfishermen)
Birds:- Evaluate the potential value of nested litter as an indicator for the evaluationof GES and as a monitoring tool
Fish:- Evaluate the potential value of fish for monitoring the ingestion of litter bymarine organisms
B) ResearchBirds:- Identify bird species suitable for the development of a Fulmar type EcoQo- Improve understanding of the impact of litter on nesting birdsTurtles:- Improve understanding of turtle migration in the Mediterranean Sea.- Improve understanding of how litter is affecting organisms (digestion,physiology, reproduction, population dynamics, etc.)
Mammals and sharks:- Understand interactions between long term marine environmental changesand litter effects on mammals for the assessment of the quality of pelagicmarine ecosystems
- Mammals: investigate how microplastics cause harm to large filter feedersOverriding:- Evaluate the types and size of litter ingested versus development stage
Table 2Recommendations for monitoring and research on litter ingestion by large marineorganisms within MSFD.
A) MonitoringTurtles (high priority):- Define an EcoQO for the loggerhead turtle Caretta caretta in the Mediterra-nean sea (High priority)
- Organize monitoring at sub regional (basin level) in a harmonised manner- Improve the collection of information/samples (stranded turtles and fromfishermen)
Birds:- Evaluate the potential value of nested litter as an indicator for the evaluationof GES and as a monitoring tool
Fish:- Evaluate the potential value of fishes for monitoring the ingestion of litter bymarine organisms
B) ResearchBirds:- Identify bird species suitable for the development of a Fulmar type EcoQo- Better understand impacts of litter on nesting birdsTurtles:- Better understand migrations of turtles in the Mediterranean.- Better understand how litter is affecting organisms (digestion, physiology,reproduction, population dynamics, etc.)
Mammals and sharks:- Understand interactions between long term marine environmental changesand litter effects on mammals for the assessment of the quality of pelagicmarine ecosystems
- Mammals: investigate how microplastics cause harm to large filter feedersOverriding:- Evaluate types and size of litter ingested in relation to the stage ofdevelopment
F. Galgani et al. / Marine Environmental Research xxx (2014) 1e76
Please cite this article in press as: Galgani, F., et al., Monitoring the impact of litter in large vertebrates in the Mediterranean Sea within theEuropean Marine Strategy Framework Directive (MSFD): Constraints, specificities and recommendations, Marine Environmental Research(2014), http://dx.doi.org/10.1016/j.marenvres.2014.02.003

invasions. Philos. Trans. R. Soc. B 364, 2013e2026. http://dx.doi.org/10.1098/rstb.2008.0265.
International Whaling Commission (IWC), 2013. Report of the 2013 IWC ScientificCommittee Workshop on Marine Debris. Woods Hole Oceanographic Institu-tion, p. 39. May 13e17 2013, SC/65a/Rep.06.
IUCN, 2013. http://www.iucnredlist.org/details/3897/0.Jacobsen, J.K., Massey, L., Gulland, F., 2010. Fatal ingestion of floating net debris by
two sperm whales (Physeter macrocephalus). Mar. Pollut. Bull. 60, 765e767.Lazar, B., Gracan, R., 2011. Ingestion of marine debris by loggerhead sea turtles,
Caretta caretta, in the Adriatic Sea. Mar. Pollut. Bull. 62, 43e47.Markus, T., Schlake, S., Maier, N., 2011. Legal implementation of integrated ocean
policies: the EU’s Marine strategy framework directive. Int. J. Mar. Coast. Law26, 59e90.
Matiddi, M., van Franeker, J.A., Sammarini, V., Travaglini, A., Alcaro, L., 2011.Monitoring litter by sea turtles: an experimental protocol in the Mediterranean.In: Proceedings of the 4th Mediterranean Conference on Sea Turtles. 7e10November, Naples.
Pibot, A., Claro, F., 2011. Impacts écologiques des déchets marins dans les Sous-régions marines du Golfe de Gascogne et de Méditerranée, pp. 12e13. Reportsof the French MSFD Initial Assessment, SRM MO & GDG. http://wwz.ifremer.fr/dcsmm/Le-Plan-d-Action-pour-le-Milieu-Marin/Evaluation-initiale/Contributions-thematiques.
Rochman, C., Hoh, E., Kurobe, T., Teh, S., 2013. Ingested plastic transfers hazardouschemicals to fish and induces hepatic stress. Nature. http://dx.doi.org/10.1038/srep03263. Scientific Reports, 3, Article 3263.
Rodríguez, A., Rodríguez, B., Nazaret Carrasco, M., 2012. High prevalence of parentaldelivery of plastic debris in Cory’s shearwaters (Calonectris diomedea). Mar.Pollut. Bull. 64, 2219e2223.
Schuyler, Q., Hardesty, B.D., Wilcox, C., Townsend, K., 2013. Global analysis ofanthropogenic ingestion by sea turtles. Conserv. Biol.. http://dx.doi.org/10.1111/cobi.12126.
Thompson, R.C., Olsen, Y., Mitchell, R.P., Davis, A., Rowland, S.J., John, A.W.G.,McGonigle, D., Russell, A.E., 2004. Lost at sea: where is all the plastic? Science304, 838 http://dx.doi.org/10.1126/science.1094559.
Tomas, J., Guitart, O., Mateo, R., Raga, J.A., 2002. Marine debris ingestion in log-gerhead sea turtles, Caretta caretta, from the Western Mediterranean. Mar.Pollut. Bull. 44, 211e216.
Van Franeker, J.A., the SNS Fulmar Study Group, 2011. Fulmar Litter EcoQO Moni-toring along Dutch and North Sea Coasts in Relation to EU Directive 2000/59/ECon Port Reception Facilities: Results to 2009. IMARES Report Nr C037/11.IMARES, Texel, 52 pp. þ2app.
Van Franeker, J.A., Blaize, C., Danielsen, J., Fairclough, K., Gollan, J., Guse, N.,Hansen, P.L., Heubeck, M., Jensen, J.-K., Le Guillou, G., Olsen, B., Olsen, K.O.,Pedersen, J., Stienen, E.W.M., Turner, D.M., 2011. Monitoring plastic ingestion bythe northern fulmar Fulmarus glacialis in the North Sea. Environ. Pollut. 159,2609e2615. http://dx.doi.org/10.1016/j.envpol.2011.06.008.
Votier, S.C., Archibald, K., Morgan, G., Morgan, L., 2011. The use of plastic debris asnesting material by a colonial seabird and associated entanglement mortality.Mar. Pollut. Bull. 62, 168e172.
F. Galgani et al. / Marine Environmental Research xxx (2014) 1e7 7
Please cite this article in press as: Galgani, F., et al., Monitoring the impact of litter in large vertebrates in the Mediterranean Sea within theEuropean Marine Strategy Framework Directive (MSFD): Constraints, specificities and recommendations, Marine Environmental Research(2014), http://dx.doi.org/10.1016/j.marenvres.2014.02.003

Elsevier Editorial System(tm) for Marine Environmental Research Manuscript Draft Manuscript Number: MERE-D-13-00353R1 Title: Amount and distribution of neustonic micro-plastic off the Western Sardinian coast (Central-Western Mediterranean Sea) Article Type: European MSFD Keywords: micro-plastics, marine litter, Marine Strategy, Sardinia, environmental impact, pollution monitoring, phthalates Corresponding Author: Dr. Giuseppe A de Lucia, Ph.D. Corresponding Author's Institution: First Author: Giuseppe A de Lucia, Ph.D. Order of Authors: Giuseppe A de Lucia, Ph.D.; Ilaria Caliani; Stefano Marra; Andrea Camedda; Stefania Coppa; Luigi Alcaro; Tommaso Campani; Matteo Giannetti; Daniele Coppola; Anna M Cicero; Cristina Panti; Matteo Baini; Cristiana Guerranti; Letizia Marsili; Giorgio Massaro; Maria C Fossi; Marco Matiddi Abstract: A plethora of different sampling methodologies has been used to document the presence of micro-plastic fragments in sea water. European Marine Strategy suggests to improve standard techniques to make future data comparable. We use Manta Trawl sampling technique to quantify abundance and distribution of micro-plastic fragments in Sardinian Sea (Western Mediterranean), and their relation with phthalates and organoclorine in the neustonic habitat. Our results highlight a quite high average plastic abundance value (0.15 items/m3), comparable to the levels detected in other areas of the Mediterranean. "Site" is the only factor that significantly explains the differences observed in micro-plastic densities. Contaminant levels show high spatial and temporal variation. In every station, HCB is the contaminant with the lowest concentration while PCBs shows the highest levels. This work, in line with Marine Strategy directives, represents a preliminary study for the analysis of plastic impact on marine environment of Sardinia.

Research highlights
Manta Trawl was used to estimate micro-plastic abundance on Sardinian Sea surface
Micro-plastic densities and contaminants levels show high variability
Hydrodynamic conditions can affect the level of plastic density
*Highlights (for review)

1 Amount and distribution of neustonic micro-plastic off the Western Sardinian 1
coast (Central-Western Mediterranean Sea)2 3 Giuseppe Andrea de Lucia a*, Ilaria Caliani b, Stefano Marra a, Andrea Camedda a,c, Stefania Coppa 4 a, Luigi Alcaro e, Tommaso Campani b, Matteo Giannetti b,d, Daniele Coppola b, Anna Maria Cicero 5 e, Cristina Panti b, Matteo Baini b, Cristiana Guerranti b, Letizia Marsili b, Giorgio Massaro f, Maria 6
Cristina Fossi b and Marco Matiddi e7 8 a National Research Council – IAMC-CNR Oristano Section, Italy9
b Department of Physical, Earth and Environmental Sciences, University of Siena, Via Mattioli, 4, 10 53100 Siena, Italy11
c Tuscia University of Viterbo, Via S.M.in Gradi 4, 01100, Viterbo, Italy12 d Department of Life Sciences, University of Siena, Siena, Italy 13
e ISPRA, National Institute for Environmental Protection and Research Rome, Italy 14 f Penisola del Sinis – Isola di Mal di Ventre MPA, Cabras, Italy 15 16
* Corresponding author. Address: IAMC-CNR Institute for Coastal Marine Environment – National 17 Research Council, loc. Sa Mardini, 09170 Oristano, Italy. 18 Telephone: +39 0783 229015; Fax: +39 0783 229135 19 E-mail address: [email protected] 20 21 22 23 24 25 Abstract 26 27 A plethora of different sampling methodologies has been used to document the presence of micro-28 plastic fragments in sea water. European Marine Strategy suggests to improve standard techniques 29 to make future data comparable. We use Manta Trawl sampling technique to quantify abundance 30 and distribution of micro-plastic fragments in Sardinian Sea (Western Mediterranean), and their 31 relation with phthalates and organoclorine in the neustonic habitat. Our results highlight a quite 32 high average plastic abundance value (0.15 items/m3), comparable to the levels detected in other 33 areas of the Mediterranean. “Site” is the only factor that significantly explains the differences 34
*ManuscriptClick here to view linked References

2 observed in micro-plastic densities. Contaminant levels show high spatial and temporal variation. In 35 every station, HCB is the contaminant with the lowest concentration while PCBs shows the highest 36 levels. This work, in line with Marine Strategy directives, represents a preliminary study for the 37 analysis of plastic impact on marine environment of Sardinia. 38 39 Key words: micro-plastics, marine litter, Marine Strategy, Sardinia, environmental impact, 40 pollution monitoring, phthalates41 42 43 1. Introduction 44 45 Plastics are synthetic organic compounds, derived from the polymerization of monomers extracted 46 from oil or gas (Rios et al., 2007). In the last fifty years, since these materials started to be utilized, 47 their presence in the marine environment has grown rapidly with the consequence that nowadays 48 40–80% of debris in the marine environment are plastic (Barnes et al., 2009; Cole et al., 2011).49 The sources of plastic debris in marine environment may be either land (e.g. domestic objects) or 50 marine-based (e.g. nylon nets and other fishing industry residual) (Andrady, 2011; Derraik, 2002; 51 Goldberg, 1997; Gregory, 2009) and the highest levels of plastic pollution are usually found nearby 52 heavy urbanized areas (Derraik, 2002). The distribution and abundance of plastic debris are strongly 53 influenced by hydrodynamics and show high spatial variability in both the open ocean and shoreline 54 waters (Barnes et al., 2009; Browne et al., 2010).55 Oceanic currents lead to high dispersion patterns (Law et al., 2010; Martinez et al., 2009; 56 Maximenko et al., 2012), which in turn permit plastic materials to reach remote areas, like islands 57 or polar regions, distant from sources of pollution (Barnes et al., 2009; Derraik, 2002; Gregory, 58 2009; Zarlf and Matthies, 2010).59 In the marine environment plastic material requires several centuries, or even thousands of years, to 60 degrade (Arthur et al., 2009; Barnes et al., 2009; Derraik, 2002; Goldberg, 1997; Gorman, 1993;61 Hansen, 1990; Moore, 2008; O’Brine and Thompson., 2010; UNESCO, 1994; Zarlf et al., 2011). 62 Debris items are usually subdivided into different size categories: mega-debris (> 10 cm); macro-63 debris (2-10 cm); meso-debris (2cm-5 mm) and micro-debris (<5mm) (Barnes et al., 2009). Micro-64 plastic particles are largely represented by plastic items, such as scrubbers and industrial pellets,65 that serve as precursors for manufactured plastic products (primary sources). A great amount of 66 marine micro-particles is also constituted by fragments and fibres, derived from the breakdown of 67 larger plastic products (secondary sources) (Hidalgo-Ruz et al., 2012). Plastic micro-fragments are 68

3 accumulating on the sea surface, especially within the neustonic habitat, and several publications 69 report increasing concentrations in oceans and seas (Collignon et al., 2012, Doyle et al., 2011; Fossi 70 et al., 2012; Law et al., 2010; Moore et al., 2001; Ryan et al., 2009).71 Plastic pollution was initially seen as a merely aesthetic problem (Galgani et al., 2013, Gregory, 72 2009), but many studies over the past decades show how several marine animals are negatively 73 affected by the presence of plastic (Boerger et al., 2010; Derraik, 2002; Galgani et al., 2013),74 mainly by entanglement and ingestion (Gregory, 2009; Laist, 1997; Thompson et al., 2009; Van 75 Franeker et al., 2011).76 The consequence of plastic ingestion could be the release and absorptions of plastic additives such 77 as phthalates, used to enhance plastic performance. Phthalates have been related to a wide range of 78 adverse health effects in several animals. Certain phthalates, such as DEHP (di-(2-79 ethylhexyl)phthalate) and its metabolite MEHP (mono-(2-ethylhexyl) phthalate)), are reproductive 80 toxicants, mainly disturbing the reproductive system (Foster et al., 2000). Plastic material can also81 adsorb toxic chemicals present at low concentrations in the water column, in particular persistent 82 organic pollutant (POPs) such as HCB, PCBs, DDTs (Rios et al, 2007; Teuten et al., 2009) which 83 can be released and absorbed by the organism after the ingestion. All these chemical pollutants,84 acting as endocrine disruptors, can potentially affect organisms and populations viability (Caserta et 85 al., 2013; Fossi et al., 2007).86 A wide variety of approaches, such as selective, bulk and volume-reduced techniques, have been 87 used to identify and quantify micro-plastics. The Manta Trawl, a modified neustonic net with 88 buoyant wings to keep the net aperture at the sea and air interface, is the most commonly used89 equipment for sea surface micro-litter analysis based on a volume-reduced methodology (Hidalgo-90 Ruz et al., 2012). The hood deflects wave crests into the submerged net, therefore capturing a 91 measurable volume of micro-debris at the sea surface.92 The European Commission (EC) released the Marine Strategy Framework Directive 93 (MSFD/2008/56/EC) which indicates the major contaminant issues related to marine environments 94 and prioritizes the topics to be investigated in order to reach a Good Environmental Status (GES). 95 Considering the increasing abundance of plastic debris in the sea, the EC chose “Marine Litter” as 96 one of the 11 environmental descriptors on the basis of which the marine environmental status is to 97 be estimated. The Marine Strategy describes GES as the condition when “Properties and quantities 98 of marine litter do not cause harm to the coastal and marine environment” (Galgani et al., 2010).99 Nevertheless, a standard methodology for the analysis of micro-plastic abundance, distribution and 100 potential effects on organisms has not been published yet. A standard methodology must be 101

4 developed and agreed upon before monitoring and mitigation activities can be initiated to support 102 the EU MSFD requirements.103 The main goal of this work was to investigate, for the first time, the distribution of neustonic micro-104 plastics in the area nearby the Gulf of Oristano (Sardinia), developing an integrated analytical 105 approach. Levels of phthalates and POPs were also estimated, in order to determine if there is a106 correlation between these contaminants and micro-plastics density.107 108 2. Material and methods 109 110 2.1 Study area 111 This study was carried out in the Gulf of Oristano and in an off-shore site nearby, in the western 112 sector of Sardinia (Central-Western Mediterranean Sea) (Fig.1). The Gulf of Oristano is a semi-113 enclosed basin connected to the Sardinian Sea through a 9 km long opening delimited by Cape San 114 Marco on the north and Cape Frasca on the south. Two large lagoon systems are present: the Cabras 115 Lagoon on the northern part of the basin and the Marceddì lagoon on the southern part. Both lagoon 116 systems discharge their water into the gulf through their respective inlets. Another water input-point 117 from the surrounding mainland is the Tirso’s river mouth located near the industrial harbour of 118 Oristano city. The typical wind patterns are the Mistral from north-west (NW), the Libeccio from 119 south-west (SW) and the Sirocco from south-east (SE). The Mistral can be considered the main 120 wind force acting in the area. The study area is included in the Algerian Basin, that presents121 strongly different dynamics mainly constituted by cyclonic eddies (Olita et al., 2013).122 123 2.2 Sampling technique 124 Thirty samples of neuston-plankton were collected using a Manta Trawl lined by a 500 μm mesh125 net. Manta Trawl sampled the top 50 cm of the sea surface at an average speed of 2 knots for 20 126 minutes. The sampling activities were conducted only with Mistral blowing conditions, when wind 127 velocity was maximum 8 knots, in order to avoid the mixing of plastic particles in the water column 128 (Kukulka et al., 2012). The Manta Trawl was always towed against the wind. No data are available 129 for current’s conditions at the time of sampling at a small spatial scale. The volume of filtered sea-130 water (m3) was evaluated by a flow meter (MF315, OceanTest Equipment, Inc.). Samplings were131 conducted in 4 coastal sites (Mal di Ventre – MDV, Caletta – CAL, Marceddì – MAR, Tirso – TIR,132 Fig. 1) within 12 nautical miles (Nm) in consecutive days at the beginning of July 2012 and July 133 2013. Off-shore samples (i.e. 20 Nm out) were also collected on the 20th July 2013, during134 “Minerva” sampling survey (MIN). The off-shore samples were collected in the morning (MIN D) 135

5 and during the night (MIN N) of the same day. For the estimation of the micro-plastic density, three 136 replicates were collected for every site and for every temporal sampling. In one of the three 137 replicates, the plastic component was removed and the remaining part was used for the estimation 138 of phthalates and organochlorine levels: for each site, samples were filtered by a 500 μm mesh net, 139 stored in liquid nitrogen and then analysed for contaminants.140 141 2.3 Micro-plastic evaluation142 For every sample, plastic items were separated from plankton and other organic matter, sorted and 143 measured under a binocular stereoscope (AxioCam ERc5s for image analysis, Carl Zeiss 144 Microlmaging GmbH, Germany. www.zeiss.de/axiocam), and only micro-materials (less than 145 5mm) were considered. Plastic items density was expressed as items/m3.146 147 2.4 Phthalates analysis 148 Di-(2-ethylhexyl) phthalate (DEHP) is the most abundant phthalate in the environment. In both 149 invertebrates and vertebrates, DEHP is rapidly metabolized in the form of its primary metabolite, 150 MEHP (mono-(2-ethylhexyl) phthalate), which can be used as a marker of exposure to DEHP151 (Barron et al., 1989). DEHP and MEHP were analysed in the neustonic/planktonic samples 152 following a method already described by Guerranti et al. (2013) and applied in plankton analysis by 153 Fossi et al. (2012), with improvement of QA/QC described by Guo and Kannan (2012) and 154 Schecter et al. (2013).155 Each sample was thawed and weighed, and acetone was added. The resulting mixture was 156 sonicated, stirred and centrifuged. Then, the supernatant was placed in a further 15 ml tube and 157 precipitant was again added to 1 ml of acetone, sonicated, agitated and centrifuged for a further 158 separation. The supernatant phase was then recovered and rebuilt with what resulted from the first 159 extraction. The supernatants were then mixed and evaporated in a centrifugal evaporator. The 160 extract was re-suspended with 0.5 ml of acetonitrile and passed through a nylon filter with pores of 161 2 μm. Subsequently, the sample was placed in an auto-sampler vial and injected into an LC-ESI-MS 162 system. The instrumental analysis was performed with a Finnigan LTQ Thermo LC/MSn 110 with 163 an ESI interface. A total of 5 μl of the extracted sample was injected via the auto-sampler into the 164 HPLC system. A HPLC column Wakosil 3C18 was used. The mobile phases consisted of 100% 165 acetonitrile (A) and 0.05% aqueous acetic acid (B). Elution was performed using an isocratic mode166 (A/B: 15/85, v/v) at 0.25 ml/min. ESI-MS was operated in the negative or positive ion mode 167 depending on the analytes (MEHP was detected in the negative mode, whereas DEHP was detected 168 in the positive mode). The heated capillary and voltage were maintained at 500°C and ±4.0 kV, 169

6 respectively. For the quantitative analysis, a five-point calibration curve, prepared by the 170 progressive dilution of a solution of the two analytes of interest, was used. Following the 171 indications of Guo and Kannan (2012) and Schecter et al. (2013), three procedural blanks were 172 analysed with each set of five samples as a check for possible laboratory contamination and 173 interference. When the concentrations of DEHP in the three procedural blanks varied widely, and if 174 the difference in concentrations among the blanks exceeded 30 ng, then all the data were discarded, 175 and samples were reanalysed. Mean blank values were subtracted from sample values for each 176 batch. The data quality assurance and quality control protocols also included a daily calibration 177 verification. The limits of detection (LODs) for the compounds analysed were the values of the 178 compound in the blanks +3 SD. The LODs were 1.5 and 9 ng/g, respectively, for MEHP and 179 DEHP. Throughout this paper the levels of analytes below the limits of detection (<LOD) were 180 specified as values equal to the value of the LOD. Values were expressed in ng/g fresh weight 181 (f.w.). 182 183 2.4 Organochlorines analysis 184 Analysis for organochlorines (OC) compounds (HCB, DDTs and PCBs) were performed according 185 to the “U.S. Environmental Protection Agency (EPA) 8081/8082” method with modifications (Fossi 186 et al., 2002). Neustonic-planktonic samples were lyophilized in an Edwards freeze drier for 2 days 187 and about 0.25 g of sample were extracted with n-hexane for gas chromatography (Merck) in a 188 Soxhlet apparatus for analysis of organochlorines compounds. Whatman cellulose thimble (i.d. 25 189 mm, e.d. 27 mm, length 100 mm) used for extraction of the sample was preheated for about 30 min 190 to 110° C and pre-extracted for 9 h in a Soxhlet apparatus with n-hexane, in order to remove any 191 organochlorine contamination. The sample was spiked with surrogate compound (2,4,6-192 trichlorobiphenyls - IUPAC number 30, Ballschmiter and Zell, 1980) prior to extraction. This 193 compound was quantified and its recovery calculated. The sample was extracted with n-hexane in 194 the thimble in the Soxhlet apparatus for 9 h. The sample was then purified with sulphuric acid 195 (Murphy, 1972) to obtain the first lipid sedimentation. The extract then underwent liquid 196 chromatography on a column containing Florisil that had been dried for 1 h in an oven at 110°C. 197 This further purified the apolar phase of lipids that could not be saponified, such as steroids like 198 cholesterol. Decachlorobiphenyl (DCBP - IUPAC number 209) was used as an internal standard, 199 added to each sample extracted prior to the analysis, and included in the calibration standard, a 200 mixture of specific compounds (Aroclor 1260, HCB and pp’- and op’-DDT, DDD and DDE). The 201 analytical method used was High Resolution Capillary Gas Chromatography with a Agilent 6890N 202 and a 63Ni ECD and an SBP-5 bonded phase capillary column (30 m long, 0.2 mm i.d.). The carrier 203

7 gas was N2 with a head pressure of 15.5 psi (splitting ratio 50/1). The scavenger gas was 204 argon/methane (95/5) at 40 ml/min. Oven temperature was 100°C for the first 10 min, after which it 205 was increased to 280°C at 5C°/min. Injector and detector temperatures were 200°C and 280°C 206 respectively. The extracted organic material (EOM%) from freeze-dried samples was calculated in 207 all samples. Capillary gas-chromatography revealed op’- and pp’- isomers of DDT and its 208 derivatives DDD and DDE, and 30 PCB congeners. Total PCBs were quantified as the sum of all 209 congeners (IUPAC no. 95, 101, 99,151, 144, 135, 149, 118, 146, 153, 141, 138, 178, 187, 183, 128, 210 174, 177, 156, 171, 202, 172, 180, 199, 170, 196, 201, 195, 194, 206). These congeners constituted 211 80% of the total peak area of PCBs in the sample. Total DDTs were calculated as the sum of 212 op'DDT, pp'DDT, op'DDD, pp'DDD, op'DDE and pp'DDE. The results were expressed in ng/g dry 213 weight (d.w.). The detection limit was 0.1 ng/kg (ppt) for all the OCs analysed. The mean water 214 content was 85.9% (SD=4.5).215 216 2.5 Statistical analysis 217 The analysis of variance on micro-plastic abundance among samples was conducted using the 218 statistical software PRIMER6 (Plymouth Marine Laboratory, UK) with PERMANOVA+ add-on 219 package (Anderson et al., 2008) on square root transformed data. Permutational ANOVA was 220 implemented using 9999 permutations, this routine was always associated with a Monte Carlo’s 221 test, which constructs an asymptotic permutation distribution for the pseudo-F statistics allowing a 222 robust analysis even in the event that too few unique permutations are possible (Anderson et al., 223 2008). Different experimental designs was implemented: “year” (two levels: 2012, 2013) was 224 treated as fixed factor while “site” (5 levels: MDV, CAL, MAR, TIR, MIN) was treated as random 225 and orthogonal to “year”. This experimental design was also repeated excluding the off-shore 226 samples, i.e. using only 4 levels for the factor “site” (MDV, CAL, MAR, TIR). A second 227 experimental design, in which “time” (two levels: Day, Night) was treated as fixed factor, was used 228 to evaluate small-scale temporal differences on the distribution of micro-litter, using samples 229 collected on the off-shore station during day hours and few hours later, by night. Finally a third 230 experimental design was implemented in order to evaluate differences between shoreline and off-231 shore samples: factor “distance” was treated as fixed, with two levels (shoreline, off-shore) while 232 factor “site” (with five levels: MDV, CAL, TIR, MAR, MIN), was treated as random and nested in 233 “distance”. When PERMANOVA detected significant differences, post-hoc pairwise tests were run. 234 Data were tested for homogeneity of dispersion using Permutational Analysis of Multivariate 235 Dispersions (PERMDISP) based on Euclidean distance.236 237

8 3. Results 238 All the samples analysed contained micro-plastic particles of different typology, described as sheet-239 like, hard plastic, foam, filaments, polystyrene and row pellets. A total of 2673 micro-plastics were 240 collected in 18418.82 m3 of filtered sea-water, with an average concentration of 0.15 items/m3. In 241 the shoreline stations, mean concentration values assessed during the two sampling surveys were 242 0.10±0.04 items/m3 for MDV, 0.01±0.00 for CAL, 0.18±0.03 for MAR and 0.14±0.08 for TIR. The 243 highest numbers of items were found in the off-shore site, with average concentrations of 0.25±0.15244 items/m3 for day-time samples (MIN D) and 0.35±0.11 items/m3 for night-time samples (MIN N).245 PERMANOVA showed that spatial location of the different sampling sites can significantly 246 influence abundance of micro-particles (p=0.04). Even when off-shore station was excluded and the 247 analysis was conducted only among MDV, CAL, MAR and TIR sites, p-value associated with 248 factor “site” remained significant (Tab 1). For every sampling site, variations observed on micro-249 plastic debris densities between 2012 and 2013 were not statistically significant. The differences250 observed between off-shore and shoreline sites were not significant. The samples collected during 251 the day on “Minerva” sampling survey were similar to samples collected at night (p=0.48).252 All the samples analysed for phthalates showed the presence of both DEHP and its metabolite 253 MEHP. The concentration of DEHP were very low, ranging from 9.00 ng/g f.w (LOD) to 13.74 254 ng/g f.w. In contrast, highest levels of MEHP were measured in the same samples, with the highest255 value in MAR 2012 (30.99 ng/g f.w). Samples showed high variability differences both for the year 256 of sampling and for station location.257 HCB, DDTs and PCBs levels were different depending on sampling sites. In every station, HCB 258 was the contaminant with the lowest concentration. Between 2012 and 2013 samples, MAR showed 259 remarkable differences in the levels of all OCs considered. In 2012 HCB and PCBs were not 260 detectable and DDTs were present at low levels (112.00 ng/g d.w.) while in 2013 all the three 261 compounds were detected, in particular the DDT concentrations were six times higher (665,3 ng/g 262 d.w) and the PCBs levels were about 2 ppm (1889.6 ng/g d.w.). Variable values were also present 263 in 2012 and 2013 samples from TIR station, with the highest values in 2012 (tab. 2). In MIN264 station, the sample collected during the night presented levels of HCB, DDTs and PCBs markedly 265 higher than those collected during the day. OCs were not detected in CAL because of a very low 266 amount of starting material.267 268 4. Discussion and conclusions 269 270

9 According to the MSFD, within the Descriptor 10 (Marine Litter), the EC member states are 271 required to develop and subsequently apply new methods to identify and quantify micro-plastics in 272 the marine environment. Additionally, the assessment of distribution and abundance of micro-273 plastics in the Mediterranean Sea is mandatory, due to the lack of information on the whole basin. 274 In order to fill this gap, this work focused on the evaluation of amount and distribution of micro-275 plastics in western Sardinia and the concentration of contaminants (phthalates and OCs) in the276 neustonic/planktonic samples.277 Plastic litter density correlates strongly with human population (Barnes et al., 2009). Even if the 278 study area is located near to a semi-enclosed basin where some input zones from the inland are 279 present, the low human density and the lack of strong industrial activities should support the 280 hypothesis of low micro-plastics presence in the area. However our results highlighted a quite high 281 average abundance value (0.15 particles/m3), comparable to the data obtained by Collignon et al.282 (2012) from a widest sampling area in the NW of the Mediterranean. These preliminary results 283 suggested that micro-plastics are widespread in the Mediterranean and are reaching areas far from 284 pollution sources, like Sardinia. When we focused on a smaller spatial scale, we founded that 285 micro-plastics abundance showed high spatial variability: the analysis showed that location of the 286 sampling sites in the study area was the only factor that can significantly explain the differences 287 observed. We found the highest amounts in the off-shore site, where a density of 0.30 particles/ m3288 was detected. 289 For the shoreline stations, that were sampled during summer 2012 and 2013, MAR site showed the 290 highest plastic contamination with mean values of 0.18 items/m3. Marceddì station is located in the 291 southern part of the Gulf of Oristano, its high abundance values are probably due to an inter-annual 292 variability lower than those observed for the other shoreline stations (Fig. 2). The lowest density of 293 plastics was present on CAL site (0.01±0.00 items/m3), which is located on Cape San Marco, the 294 promontory delimiting the Gulf on its northern part. Hydrodynamic features in this site are peculiar 295 and this may be the reason of such low (and low variable) values for this site, that pairwise test 296 showed as significantly different from the other sites (Tab. 3). Recent studies (see e.g. Olita et al., 297 2013) highlight the presence of upwelling phenomena in the west coast of Sardinia, phenomena that 298 are, however, still poorly investigated. Upwelling may determine a dilution of plastic density on the 299 water surface and, therefore, stations in proximity of such a kind of phenomena (e.g. CAL site) may 300 present levels of plastic that are lower than the sites exposed to more stable conditions. Further 301 studies that clarify coastal upwelling phenomena and correlate them with plastic abundance are 302 suggested.303

10 Pairwise test, conducted between different shoreline stations on the average between 2012 and 2013 304 values, shows that sites differ from each other, with the exception of TIR. TIR station presents high 305 variability among replicates that determine high standard error values. TIR station is located in the 306 proximity of the Tirso river’s mouth and of the harbour of Oristano, hence it would be reasonable to 307 imagine that its position had a positive influence on the level of micro-plastic on the water surface. 308 Even if the correlation with micro-plastic density was not clearly detected, the presence of an 309 harbour and a river can determine peculiar hydrodynamics and therefore explain the high variability 310 detected for micro-plastic levels in TIR station.311 The results showed that micro-plastics are ubiquitous in the sampling area. The amount of litter for 312 the off-shore station did not differ from the litter amount collected during 2013 sampling campaign 313 on shoreline stations (MDV, CAL, MAR, TIR). This could be due to the high dispersion of values, 314 both from off-shore than from shoreline stations, around the sampling average (standard error). The 315 results highlighted an high variability also for the concentrations of contaminants, both among sites 316 and among samples from the two different sampling campaigns. Phthalates were markedly different317 among the samples collected in 2012 and 2013. In particular, higher levels of MEHP and 318 undetectable levels of DEHP in the first sampling were found. On the other hand, MEHP was 319 lower, and DEHP was detectable in the second one. This could be reasonably attributed to a 320 different composition of the plastics present in the environment (a feature that will definitely be 321 assessed in the future through qualitative analysis of plastics present in the sampling site), to a 322 change in the degree of contamination of the aqueous medium or even to a more recent exposure of 323 organisms with the DEHP, which could be considered less metabolized than in the previous 324 scenario. However, especially for phthalates, such variability needs to be considered normal, given 325 the extreme rapidity with which the DEHP, and its metabolite MEHP are eliminated by organisms.326 To the authors' knowledge, there are no data in the literature showing that plankton has the capacity 327 to metabolize DEHP. However, in addition to vertebrates, some studies highlighted that phthalates328 could be degraded also by microorganisms and invertebrates (Albro et al., 1993; Taylor et al., 329 1981). In humans, for example, DEHP is rapidly cleared from the body with a short half-lives in the 330 order of a few dozen hours (Preau et al., 2010; Völkel et al., 2002). Regarding the levels of DEHP 331 and MEHP, these, on average, tend to be lower than those previously found by Fossi et al. (2012) in 332 plankton samples collected in Sardinia and Liguria (Italy); the same study confirms the high 333 variability of the levels found among samples collected in the same area. Additionally, to better 334 understand if the level of chemicals in plankton are related to the ingestion of particles more than to 335 dissolved chemicals other aspects need to be considered such as: phthalates sources (e.g. 336

11 atmospheric and degradation processes), the mechanisms of dispersion and leaching of phthalates 337 and the chemicals reactions occurring in the environment. 338 The results obtained in the present study demonstrate the need to perform a high number of 339 replicates for each sampling site due to the variability of this kind of environmental issue. 340 In conclusion, in order to respond to MSFD requirements, this work underlines the importance to 341 use an integrated and consistent approach combining data on distribution and abundance of micro-342 plastics with contaminants adsorbed to, or released by plastic. This will allow more reliable 343 measures to understand the trend of marine litter contamination and to eventually recommend344 mitigation actions to reach the Good Environmental Status of the Mediterranean Sea.345 346 Acknowledgements 347 We would like to thank the staff of “Penisola del Sinis – Isola di Mal di Ventre” MPA and of 348 “Minerva” research vessel for their logistic support; we are also grateful to the two anonymous 349 reviewers for their useful advices and to Alessandra Marra for the English revision.350 351 References 352 353 Albro, P.W., Corbett, J.T., Schroeder, J.L., 1993. The metabolism of di-(2-ethylhexyl)phthalate in 354 the earthworm Lumbricus terrestris. Comparative Biochemistry and Physiology C 104, 335-344.355 356 Anderson, M.J., Gorley, R.N., Clarke, K.R., 2008. PERMANOVA+ for PRIMER: Guide to 357 Software and Statistical Methods. PRIMER-E: Plymouth, UK. 358 359 Andrady, A.L., 2011. Microplastic in the marine environment. Marine Pollution Bulletin 62, 1596-360 1605.361 362

12 Arthur, C., Baker, J., Bamford, H., 2009. Proceedings of the International Research Workshop on 363 the Occurrence, Effects and Fate of Microplastic Marine Debris. NOAA Technical Memorandum 364 NOS-OR & R-30.NOAA, Silver Spring, 530 pp.365 366 Ballschmiter, K., Zell, M., 1980. Analysis of polychlorinated biphenyls (PCB) by glass capillary 367 gas chromatography. Fresenius Zeitschrift fur Analytische Chemie 302, 20-31.368 369 Barnes, D.K.A., Galgani, F., Thompson, R.C., Barlaz, M., 2009. Accumulation and fragmentation 370 of plastic debris in global environments. Philosophical Transactions of the Royal Society B 364, 371 1985-1998. doi:10.1098/rstb.2008.0205372 373 Barron, M.G., Schultz, I.R., Hayton, W.L., 1989. Presystemic branchial metabolism limits di-2-374 ethylhexyl phthalate accumulation in fish. Toxicology and Applied Pharmacology 98, 49-57.375 376 Boerger, C.M., Lattin, G.L., Moore, S.L., Moore, C.J., 2010. Plastic ingestion by planktivourus 377 fishes in the North Pacific Central Gyre. Marine Pollution Bulletin 60, 2275-2278.378 379 Browne, M.A., Galloway, T.S., Thompson, R.C., 2010. Spatial patterns of plastic debris along 380 Estuarine shorelines. Environmental Sciences and Technology 44, 3404-3409.381 382 Caserta, D., Bordi, G., Ciardo, F., Marci, R., La Rocca, C., Tait, S., Bergamasco, B., Stecca, L., 383 Mantovani, A., Guerranti, C., Fanello, E., Perra, G., Borghini, F., Focardi, S., Moscarini, M., 2013. 384 The influence of Endocrine Disruptors in a selected population of infertile women. Gynecological385 Endocrinology 29, 444-447.386 387

13 Cole, M., Lindeque, P., Halsband, C., Galloway, T.S., 2011. Microplastics as contaminants in the 388 marine environment: A review. Marine Pollution Bulletin 62, 2588-2597.389 doi:10.1016/j.marpolbul.2011.09.025390 391 Collignon, A., Hecq, J.H., Galgani, F., Voisin, P., Collard, F., Goffart, A., 2012. Neustonic 392 microplastic and zooplankton in the North Western Mediterranean Sea. Marine Pollution Bulletin 393 64, 861-864. doi:10.1016/j.marpolbul.2012.01.011 394 395 Derraik, J.G.B., 2002. The pollution of the marine environment by plastic debris: a review. Marine 396 Pollution Bulletin 44, 842-852.397 398 Doyle, M., Watson, W., Bowlin, N., Sheavly, S., 2011. Plastic particles in coastal pelagic 399 ecosystems of the Northeast Pacific ocean. Marine Environmental Research 71, 41-52.400 401 Fossi, M.C., Borsani, J.F., Di Mento, R., Marsili, L., Casini, S., Neri, G., Mori, G., Ancora, S., 402 Leonzio, C., Minutoli, R. and Notarbartolo di Sciara, G., 2002. Multi-trial biomarker approach in 403 Meganyctiphanes norvegica: a potential early indicator of health status of the Mediterranean 404 ‘‘whale sanctuary’’. Marine Environmental Research 54, 761-767.405 406 Fossi M.C., Casini S., Marsili L. (2007). Potential hazard due to endocrine-disrupting chemicals on 407 Mediterranean top predators: State of art, gender differences and methodological tools. 408 Environmental Research 104: 174-182409 410 Fossi, M.C., Panti, C., Guerranti, C., Coppola, D., Giannetti, M., Marsili, L., Minutoli, R., 2012. 411 Are baleen whales exposed to the threat of microplastics? A case study of the Mediterranean fin 412

14 whale (Balaenoptera physalus). Marine Pollution Bulletin 64, 2374-2379. 413 doi.org/10.1016/j.marpolbul.2012.08.013414 415 Foster, P.M.D., Cattley, R.C., Mylchreest, E., 2000. Effects of di-n-butyl phthalate (DBP) on male 416 reproductive development in the rat: implications for human risk assessment. Food Chemistry and 417 Toxicology 38, S97-S99.418 419 Galgani, F., Fleet, D., van Franeker, J., Katsanevakis, S., Maes, T., Mouat, J., Oosterbaan, L., 420 Poitou, I., Hanke, G., Thompson, R., Amato, E., Birkun, A., Janssen, C., 2010. Marine Strategy 421 Framework Directive - Task Group 10 Report Marine Litter. JRC Scientific and Technical Reports 422 Publications Office of the European Union – EUR 24340 EN OPOCE LB-NA-24340-EN-N, 57 pp.423 424 Galgani, F., Hanke, G., Werner, S., Oosterbaan, L., Nilsson, P., Fleet, D., Kinsey, S., Thompson, 425 R.C., van Franeker, J., Vlachogianni, T., Scoullos, M., Veiga, J.M., Palatinus, A., Matiddi, M., 426 Maes, T., Korpinen, S., Budziak, A., Leslie, H., Gago, J., Liebezeit, G., 2013. Guidance on 427 Monitoring of Marine Litter in European Seas. EUR Scientific and technical research series, 128 428 pp. DOI:10.2788/99475429 430 Goldberg, E.D., 1997. Plasticizing the seafloor: an overview. Environmental Technology 18, 195-431 202. DOI: 10.1080/09593331808616527432 433 Gorman, M., 1993. Environmental Hazards: Marine Pollution. ABC-CLIO Inc., Santa Barbara, 434 252pp.435 436

15 Gregory M.R., 2009. Environmental implications of plastic debris in marine settings-entanglement, 437 ingestion, smothering, hangers-on, hitch-hiking and alien invasions. Philosophical Transactions of 438 the Royal Society B 364, 2013-2025. doi: 10.1098/rstb.2008.0265439 440 Guerranti, C., Sbordoni, I., Fanello, E.L., Borghini, F., Corsi, I., Focardi, S.E., 2013. Levels of 441 phthalates in human milk samples from central Italy. Microchemical Journal 107, 178-181.442 443 Guo Y., Kannan K., 2012. Challenges encountered in the analysis of phthalate esters in foodstuffs 444 and other biological matrices. Analytical and Bioanalytical Chemistry 404, 2539–2554.445 446 Hansen, J., 1990. Draft position statement on plastic debris in marine environments. Fisheries 15, 447 16-17.448 449 Hidalgo-Ruz V., Gutow L., Thompson R.C., Thiel M., 2012. Microplastics in the Marine 450 Environment: A Review of the Methods Used for Identification and Quantification. Environmental451 Science and Technology. 2012, 46, 3060-3075. doi.org/10.1021/es2031505452 453 Kukulka, T., Proskurowski, G., Morét-Ferguson, S., Meyer, D.W., Law, K.L., 2012. The effect of 454 wind mixing on the vertical distribution of buoyant plastic debris. Geophysical Research Letters 39,455 1-6. doi:10.1029/2012GL051116456 457 Laist, D.W., 1997. Impacts of marine debris entanglement of marine life in marine debris including 458 a comprehensive list of species with entanglement and ingestion records. In: Coe, J.M., Rogers, 459 D.B. (Eds.), Marine Debris––Sources, Impact and Solutions. Springer-Verlag, New York, pp. 99-460 139.461 462

16 Law, K. L., Morét-Ferguson, S., Maximenko, N., Proskurowski, G., Peacock, E., Hafner, J., Reddy, 463 C., 2010. Plastic accumulation in the North Atlantic Subtropical Gyre. Science 329, 1185-1188.464 465 Martinez, E., Maamaatuaiahutapu, K., Taillandier, V., 2009. Floating marine debris surface drift: 466 Convergence and accumulation toward the South Pacific subtropical gyre. Marine Pollution 467 Bulletin 58, 1347-1355. doi:10.1016/j.marpolbul.2009.04.022468 469 Maximenko, N., Hafner, J., Niiler, P., 2012. Pathways of marine debris derived from trajectories of 470 Lagrangian drifters. Marine Pollution Bulletin 65, 51-62.471 472 Moore, C.J., Moore, S.L., Leecaster, M.K., Weisberg, S.B., 2001. A comparison of plastic and 473 plankton in the North Pacific Central Gyre. Marine Pollution Bulletin 42, 1297-1300.474 475 Moore, C.J., 2008. Synthetic polymers in the marine environment: A rapidly increasing, long-term 476 threat. Environmental Research 108, 131-139. doi:10.1016/j.envres.2008.07.025477 478 Murphy, P. 1972. Sulfuric acid clean up of animal tissue for the analysis of acid-stable chlorinated 479 hydrocarbon residues. Journal of the Association of Official Analytical Chemists 55, 1360-1362.480 481 O’Brine, T., Thompson, R.C., 2010. Degradation of plastic carrier bags in the marine environment. 482 Marine Pollution Bulletin 60, 2279-2283. doi:10.1016/j.marpolbul.2010.08.005483 484 Olita, A., Ribotti, A., Fazioli, L., Perilli, A., Sorgente, R., 2013. Surface circulation and upwelling 485 in the Sardinia Sea: A numerical study. Continental Shelf Research 71, 95–108.486 487

17 Preau, J.L.Jr., ,Wong, L.Y., Silva, M.J. Needham, L.L., Calafat, A.M., 2010. Variability over 1 488 week in the urinary concentrations of metabolites of diethyl phthalate and di(2-ethylhexyl) 489 phthalate among eight adults: an observational study. Environmental Health Perspectives 118, 490 1748-1754.491 492 Rios L.M., Moore C., Jones P.R., 2007. Persistent organic pollutants carried by synthetic polymers 493 in the ocean environment. Marine Pollution Bulletin 54, 1230-1237. 494 doi:10.1016/j.marpolbul.2007.03.022495 496 Ryan, P.G., Moore, C. J., van Franeker, J.A., Moloney, C. L., 2009. Monitoring the abundance of 497 plastic debris in the marine environment. Philosophical Transactions of Royal Society B 364, 1999-498 2012. doi:10.1098/rstb.2008.0207.499 500 Schecter A., Lorber M., Guo Y., Wu Q., Yun S.H., Kannan K., Hommel M., Imran N., Hynan L.S., 501 Cheng D., Colacino J.A., Birnbaum L.S., 2013. Phthalate Concentrations and Dietary Exposure 502 from Food Purchased in New York State. Environmental Health Perspectives 121, 473-479.503 504 Taylor, B.F., Curry, R.W., Corcoran, E.F., 1981. Potential for biodegradation of Phthalic Acid 505 esters in marine regions. Applied Environmental Microbiology 42, 590-595.506 507 Teuten, E.L., Saquing, J.M., Knappe, D.R.U., Barlaz, M.A., Jonsson, S., Björn, A., Rowland, S.J., 508 Thompson, R.C., Galloway, T.S., Yamashita, R., Ochi, D., Watanuki, Y., Moore, C., Viet, P.H., 509 Tana, T.S., Prudente, M., Boonyatumanond, R., Zakaria, M.P., Akkhavong, K., Ogata, Y., Hirai, 510 H., Iwasa, S., Mizukawa, K., Hagino, Y., Imamura, A., Saha, M., Takada, H., 2009. Transport and 511 release of chemicals from plastics to the environment and to wildlife. Philosophical Transactions of 512 the Royal Society B 364, 2027-2045.513

18 514
Thompson, R.C., Moore, C.J., vom Saal, F.S., Swan, S. H., 2009. Plastics, the environment and 515 human health: current consensus and future trends. Philosophical Transaction of the Royal Society 516 B 364, 2153-2166. (doi:10.1098/rstb.2009.0053)517 518 UNESCO, 1994. Marine Debris: Solid Waste Management Action Plan for the Wider Caribbean, 519 IOC Technical Series 41, Paris.520 521 Van Franeker, J.A., Blaize, C., Danielsen, J., Fairclough, K., Gollan, J., Guse, N., Hansen, P.L., 522 Heubeck, M., Jensen, J.-K., Le Guillou, G., Olsen, B., Olsen, K.O., Pedersen, J., Stienen, E.W.M., 523 Turner, D.M. 2011. Monitoring plastic ingestion by the northern fulmar Fulmarus glacialis in the 524 North Sea. Environmental Pollution 159, 2609-2615. doi:10.1016/j.envpol.2011.06.008525 526 Völkel, W., Colnot, T., Csanady, G.A., Filser, J.G., Dekant, W., 2002. Metabolism and kinetics of 527 bisphenol a in humans at low doses following oral administration. Chemical Research and 528 Toxicology 15, 1281-1287.529 530 Zarlf, C., Fleet, D., Fries, E., Galgani, F., Gerdts, G., Hanke, G., 2011. Microplastics in oceans. 531 Marine Pollution Bulletin 62, 1589-1591.532 533 Zarlf, C., Matthies M., 2010. Are marine plastic particles transport vectors for organic pollutants to 534 the Arctic? Marine Pollution Bulletin 60, 1810-1814. doi:10.1016/j.marpolbul.2010.05.026. 535 536 537 538

19 Table 1. Results of PERMANOVA on square root transformed data. df: degree of freedom; SS: 539 Sum of Squares; MS: Mean Square; Pseudo-F: value of the Pseudo-F statistic; P: p-value; n.s.: non-540 significant. Significant results are reported in bold.541
542 543

20 Table 2. Mean micro-plastic items density and levels of contaminants (phthalates and 544 organochlorines) for each sampling station (MDV: Mal di Ventre; CAL: Caletta; MAR: Marceddì; 545 TIR: Tirso; MIN D: Minerva/off-shore day-time MIN.N: Minerva/off-shore night-time). Values are 546 expressed as items/m3 for micro-plastics; as ng/g dry weight for phthalates and as ng/g fresh weight 547 for organochlorines. Starting-ending coordinates and volume of water filtered (express as m3) are 548 reported for every replicate.549 550
m3 items/m3
sampling station replicate starting point ending point water filtered micro-plastic HCB DDTs PCBs MEHP DEHPa N39 46 23.7 E8 29 59.6 N39 47 12.4 E8 29 30.5 827b N39 46 21.5 E8 29 35.6 N39 47 05.7 E8 29 11.2 729c N39 46 24.7 E8 29 31.6 N39 47 09.1 E8 29 05.3 729
a N39 45 36.5 E8 28 59.9 N39 46 11.4 E8 29 17.7 438b N39 45 28.9 E8 28 51.4 N39 46 3.2 E8 29 9.6 347c N39 45 35.8 E8 28 58.0 N39 46 5.5 E8 29 24.06 357
a N39 52 41.0 E8 32 04.2 N39 52 18.0 E8 30 45.2 924b N39 52 23.4 E8 31 26.0 N39 51 58.9 E8 30 22.0 754c N39 52 21.2 E8 31 26.7 N39 51 57.7 E8 30 26.8 707
a N39 53 9.1 E8 32 18.2 N39 53 17.7 E8 31 29.1 454b N39 53 5.3 E8 32 6.9 N39 53 22.9 E8 31 38.0 323c N39 53 7.9 E8 32 17.0 N39 53 30.5 E8 31 51.0 401
a N40 00 00.6 E8 18 30.3 N40 00 25.2 E8 17 39.8 868b N40 00 21.3 E8 17 38.7 N40 00 34.9 E8 16 39.8 868c N40 00 13.8 E8 16 43.9 N40 00 22.4 E8 15 44.7 814
a N39 59 51.4 E8 17 15.6 N39 59 19.7 E8 17 19.7 631b N40 0 2.1 E8 17 26.9 N39 59 25.0 E8 17 16.6 537c N39 59 50.1 E8 17 12.7 N39 59 10.1 E8 17 14.6 596
a N39 52 34.4 E8 27 18.0 N39 51 45.9 E8 26 42.5 850b N39 51 58.4 E8 27 24.2 N39 51 19.4 E8 26 34.8 870c N39 52 42.4 E8 27 06.0 N39 51 44.6 E8 26 52.7 790
a N39 51 49.9 E8 26 42.2 N39 51 11.6 E8 26 33.6 467b N39 51 48.9 E8 26 38.0 N39 51 16.6 E8 26 17.9 335c N39 51 51.0 E8 26 33.4 N39 51 24.0 E8 26 14.9 292
a N39 43 58.9 E8 03 07.2 N39 44 39.1 E8 03 07.0 671b N39 46 12.2 E8 03 07.5 N39 46 52.3 E8 03 07.3 685c N39 48 01.5 E8 03 07.2 N39 48 40.2 E8 03 07.8 722
a N39 50 18.7 E8 02 43.7 N39 49 34.2 E8 02 40.6 468b N39 48 14.3 E8 02 31.3 N39 47 30.8 E8 02 32.5 542c N39 46 02.1 E8 02 37.2 N39 45 23.0 E8 02 34.9 420
0,021 ± 0,00 _ _ _ _ _
MDV 2013
ng/g
CAL 2012
n.d. 112,00 n.d. 30,99 9,00
8,90 2130,10 3793,10 25,62 9,00
_
MDV 2012
CAL 2013
MIN D
MIN N
0.20 ± 0.03
0.09 ± 0.08
0.01 ± 0.00
0.25 ± 0.15
0.35 ± 0.11
0.02 ± 0.01
0.19 ± 0.04
0.19 ± 0.15
0.17 ± 0.06
MAR 2012
MAR 2013
TIR 2012
TIR 2013
_ _ 16,45 9,00
0,64 185,40 n.d. 3,34 11,37
_ _ _ 3,45 11,14
8,30 760,30 2025,80 2,55 10,64
13,70 1166,60 3224,50 3,15 13,74
4,90 547,80 2256,60 1,64 9,63
8,10 665,30 1889,60 2,56 10,24
551 552

21 Table 3. Pair-wise comparisons between sites (MDV: Mal di Ventre; CAL: Caletta; MAR: 553 Marceddì; MIN: Minerva/off-shore) conducted on the average between 2012 and 2013 values of 554 micro-plastic density. t: value of the test; P: p-value. Significant results are reported in bold.555 556 Groups t PMDV, CAL 5,82 <0.001MDV, MAR 3,01 <0.05CAL, MAR 7,15 <0.001CAL, MIN 2,6 <0.05
PAIR-WISE COMPARISON
557 558 559

22 Figure captions: 560 Figure 1. Study area with the different sampling stations. For each sampling station, year and time, 561 the levels phthalates (ng/g d.w.) and organochlorines (ng/g f.w.) are reported in relation to micro-562 plastic density (items/m3). Different columns represent the percentage respect the maximum value 563 observed in the study area. 564 Figure 2. Micro-plastic density levels (mean SE) for each sampling station (MDV: Mal di Ventre; 565 CAL: Caletta; MAR: Marceddì; TIR: Tirso; MIN D: Minerva/off-shore day-time MIN N: 566 Minerva/off-shore night-time). Grey columns: samples from 2012 campaign; Black columns: 567 samples from 2013 campaign. 568

Figu
reC
lick
here
to d
ownl
oad
high
reso
lutio
n im
age

Figu
reC
lick
here
to d
ownl
oad
high
reso
lutio
n im
age

Short communication
Plastic litter in the sea
M.H. Depledge a, F. Galgani b, C. Panti c, I. Caliani c, S. Casini c, M.C. Fossi c,*a European Centre for Environment and Human Health, University of Exeter Medical School, Heavitree Road, Exeter EX1 2LU, United Kingdomb Ifremer, Immeuble Agostini, ZI Furiani, 20600 Bastia, Corsica, FrancecDipartimento di Scienze Fisiche, della Terra e dell’Ambiente, Università di Siena, Via P.A. Mattioli 4, 53100 Siena, Italy
a r t i c l e i n f o
Article history:Received 16 September 2013Received in revised form30 September 2013Accepted 3 October 2013
Keywords:European MSFDMarine litterMicroplastics
a b s t r a c t
On June 2013 a workshop at the University of Siena (Italy) was organized to review current knowledgeand to clarify what is known, and what remains to be investigated, concerning plastic litter in the sea.The content of the workshop was designed to contribute further to the European Marine StrategyFramework Directive (MSFD) following an inaugural workshop in 2012. Here we report a number ofstatements relevant to policymakers and scientists that was overwhelming agreement from the par-ticipants. Many might view this as already providing sufficient grounds for policy action. At the veryleast, this early warning of the problems that lie ahead should be taken seriously, and serve as a stimulusfor further research.
� 2013 Elsevier Ltd. All rights reserved.
1. Introduction
Plastic litter is now almost ubiquitous in the World’s oceans,extending from the coast far out to sea, and down onto the sea floor.Macroscopic plastic (bottles, plastic bags, old toys, etc.) is in evi-dence onmost tourist beaches, in harbours andmarinas, and can bereadily spotted from the decks of ferryboats, cruise ships and lei-sure craft. One of the main causes of this global problem isincreasing plastic production. The annual production has increaseddramatically from 1.5 million tonnes in the 1950s to approximately280 million tonnes in 2011. Microplastic fragments (smaller than5 mm) potentially less obvious nanoscale plastic, is readilydetectable in sand, sediment and even in marine biota. The lattermay originate directly in themicro or nano forms, or result from thebreakdown or abrasion of larger pieces of plastic. Microplasticshave been accumulating in oceans globally over at least the last fourdecades and have invaded even the most remote marine environ-ments. Knowledge about the effects of this micro-debris is limited,but nonetheless, a horizon scan of global conservation issuesrecently identified microplastics as one of the main globalemerging environmental threats.
Numerous non-governmental organisations, wildlife charitiesand environmental agencies have drawn attention to the plasticlitter issue, yet the scale of the problem is not widely appreciated by
the public or politicians. Few, if any, practical measures have beenput in place to manage the situation. Concerns extend from theunsightliness of macroplastics affecting coastal tourism, to variouseffects on ecosystem structure and functions, through adverseimpacts on particular species and even the death of individuals(Browne et al., 2011).
Recently, a significant positive relationship between micro-plastics abundance and human population-density was demon-strated. Since the human population continues to increase, theprevalence of microplastics will also probably increase (Rochmanet al., 2013).
Academics and other researchers have now published severalauthoritative reports on the effects of plastic litter on marine birds,turtles, marine mammals and other marine vertebrates and in-vertebrates (Wright et al., 2013). Their studies have identifiedplastic fragments in the water column, in sandy and muddy sedi-ment and in the guts, respiratory structures and tissues of marinespecies.
On the 5th and 6th June, 2013, ca.100 scientists from 6 countriesmet for a workshop at the University of Siena, Italy, to reviewcurrent knowledge and to clarify what is known, and what remainsto be investigated, concerning plastic litter in the sea. The contentof the workshop was designed to contribute further to the Euro-pean Marine Strategy Framework Directive (MSFD) following aninaugural workshop in 2012 (see Fossi et al., 2012). In addition, anumber of statements relevant to policymakers were prepared bythe organisers at the end of the meeting which are presented here,and which had the overwhelming support of the workshopparticipants.
* Corresponding author. Tel.: þ39 0577 232913; fax: þ39 0577 232930.E-mail addresses: [email protected] (C. Panti), [email protected] (M.C. Fossi).
Contents lists available at ScienceDirect
Marine Environmental Research
journal homepage: www.elsevier .com/locate/marenvrev
0141-1136/$ e see front matter � 2013 Elsevier Ltd. All rights reserved.http://dx.doi.org/10.1016/j.marenvres.2013.10.002
Marine Environmental Research 92 (2013) 279e281

2. What we know concerning plastic litter in the sea
Several key facts were highlighted at the workshop:
1) Plastic litter is diverse and now very widely distributed in themarine environment.
2) Many kinds of plastic litter are extremely persistent, often forseveral decades.
3) Some kinds of marine organisms are particularly vulnerable toplastic litter, including turtles, marine mammals, suspensionfeeders and deposit feeders.
4) Some plastics components and their constituent chemicals canbe transferred through marine food webs (eg. phthalates).
5) Plastic litter can play a role in facilitating the introduction ofinvasive species into new localities, thereby influencing bothbiodiversity and ecosystem structure and functions in someareas.
6) The use of plastics is continuing unabated and will increase inthe future.
7) Hydrodynamics and degradability determine the fate of litter atsea.
8) Policymakers, politicians and the public remain largely unawareof the extent of the problem and the magnitude of the threat tomarine ecosystems.
3. Emerging questions
Following the presentation of research papers at the workshopand in subsequent discussions of each session, a number of ques-tions were identified where further research is required to provideanswers. They included the following:
1) How much plastic is getting into the marine environmenteach year?
2) What are the key sources?3) What are geographic distributions of plastic litter of different
sizes?4) What are the relative proportions of macro, micro and
nanoplastic entering the marine environment and whichpose the greatest threat?
5) Where do the different types of plastic litter accumulate?6) How long does each type persist?7) Is plastic taken up by marine organisms?8) Is it damaging to them? Is harm well understood?9) Which kinds of marine organisms most impacted by macro
and microplastics?10) What are the mechanisms by which damage occurs?11) How does plastic interact with other environmental pollut-
ants and influence their toxicity?12) What is the extent of economic, environmental and human
health costs resulting from the presence of plastic litter in themarine environment?
4. What can be done?
During the course of the workshop, various needs and measureswere discussed that might form the basis for beginning to addressthreats posed by plastic litter. They included:
1) the need to increase awareness of the scale and severity of theissue through public education programmes,
2) clear identification of who is responsible for managing plasticproduction and levels of release into the environment,
3) provision of guidelines on the safe disposal of plastics,4) development of regulations to ensure the safe disposal of plastic
e and their enforcement,5) reduction of the use of plastics worldwide through international
agreements,6) finding environmentally friendly alternative to plastics,7) development and implementation of programmes for the
collection and proper disposal of plastics (for example, beachclean ups, collection for recycling and reuse, etc.),
8) monitoring trends and effects of marine litter at sea,9) evaluation of the presence and effects of marine debris
(particularly microplastic) in marine environment using marineorganisms as sentinel species and applying new integratedmonitoring tools.
5. Summary and conclusions
There is clearly much to be done to bring the issue of plasticlitter in the seas to the attention of the public, policymakers andpoliticians. Fortunately, the European Commission and otherfunding organisations around the World have at last begun tosupport research work in this area (see for example, EU projectssuch as CLEANSEA, MICRO, PERSEUS, MARELITT, MARLISCO, KIMO,etc.). Nonetheless, positive action to curtail and manage of the useof plastics and their disposal is still urgently needed. In this regard,within the European MSFD a proper descriptor (Descriptor 10) wasdedicated to marine litter. Task group 10 defines marine litter as“any persistent, manufactured or processed solid material dis-carded, disposed of or abandoned in the marine and coastal envi-ronment” (Galgani et al., 2010) with a view to using mitigationmeasures to achieve the Good Environmental Status in Europeanwaters by 2020.
A recent initiative (July 2013) was proposed by the Universityof Siena, under the umbrella of the United Nations SustainableDevelopment Solutions Network MED Solution (directed byProfessor Jeffrey D. Sachs e Earth Institute, Columbia University).The main objective of the Solution Project (PLASTIC-BUSTERS)will be to evaluate the presence and effects of marine debris(particularly microplastics) in the Mediterranean environmentusing marine organisms as sentinel species and applying a newintegrated monitoring tool. The international project will help toreinforce existing Mediterranean international efforts toharmonize monitoring and mitigation activities in the entirebasin.
In the final session of the Siena workshop, three statementswere presented to the participants:
i) Do you agree that there is robust scientific evidence thatindividuals of some species of marine organisms havealready been adversely affected by plastic litter in the seas?
ii) Do you agree that marine ecosystem services are beingadversely affected by plastic litter?
iii) Do you agree that there is robust evidence that plastic litterhas, in some cases, damaged human health, wellbeing orprosperity?
There was overwhelming agreement from the participants (andno voices of dissent) as to the veracity of these statements. Manymight view this as already providing sufficient grounds for policyaction. At the very least, this early warning of the problems that lieahead should be taken seriously, and as a stimulus for furtherresearch.
Further details of research into the impact of plastic litter in themarine environment and particularly the potential use of large
M.H. Depledge et al. / Marine Environmental Research 92 (2013) 279e281280
marine vertebrates (ranging from large pelagic fish, sea turtles, seabirds and cetaceans) in determining the environmental status ofmarine ecosystems (descriptors1, 8 and 10 e Directive 2008/56/ECof the European Parliament and of the Council of 17 June 2008)will be reported in the proceedings of the 2013 workshop to bepublished in a special issue of Marine Environmental Research in2014.
Acknowledgement
The Workshop was sponsored by SIBM (Società Italiana di Bio-logia Marina) and CNR Oristano and supported by Society ofEnvironmental Toxicology and Chemistry (SETAC e Italian Branch),Tuscany Region and Accademia dei Fisiocritici.
References
Browne, M.A., Crump, P., Niven, S.J., Teuten, E., Tonkin, A., Galloway, T.,Thompson, R., 2011. Accumulation of microplastic on shorelines worldwide:sources and sinks. Environ. Sci. Technol. 45 (21), 9175e9179.
Fossi, M.C., Casini, S., Caliani, I., Panti, C., Marsili, L., Viarengo, A., Giangreco, R.,Notarbartolo di Sciara, G., Serena, F., Ouerghi, A., Depledge, M.H., 2012. The roleof large marine vertebrates in the assessment of the quality of pelagic marineecosystems. Mar. Environ. Res. 77, 156e158.
Galgani, F., Fleet, D., Van Franeker, J., Katsanevakis, S., Maes, T., Mouat, J.,Oosterbaan, L., Poitou, I., Hanke, G., Thompson, R., Amato, E., Birkun, A.,Janssen, C., 2010. Marine Strategy Framework Directivedtask Group 10 ReportMarine Litter. In: Scientific and Technical Research Series. Office for OfficialPublications of the European Communities, Luxembourg, p. 48.
Rochman, C.M., Browne, M.A., Halpern, B.S., Hentschel, B.T., Hoh, E.,Karapanagioti, H.K., Rios-Mendoza, L.M., Takada, H., The, S., Thompson, R.C.,2013. Policy: classify plastic waste as hazardous. Nature 494 (7436), 169e171.
Wright, S.L., Thompson, R.C., Galloway, T.S., 2013. The physical impacts of micro-plastics on marine organisms: a review. Environ. Pollut. 178, 483e492.
M.H. Depledge et al. / Marine Environmental Research 92 (2013) 279e281 281