Meldola blue immobilized on a new SiO 2/TiO 2/graphite composite for electrocatalytic oxidation of...
9
Available online at www.sciencedirect.com Electrochimica Acta 53 (2008) 4167–4175 Meldola blue immobilized on a new SiO 2 /TiO 2 /graphite composite for electrocatalytic oxidation of NADH Camila M. Maroneze a , Leliz T. Arenas a , Rita C.S. Luz a , Edilson V. Benvenutti b , Richard Landers c , Yoshitaka Gushikem a,∗ a Instituto de Qu´ ımica, Universidade Estadual de Campinas, P.O. Box 6154, 13084-971 Campinas, SP, Brazil b Instituto de Qu´ ımica, Universidade Federal do Rio Grande do Sul, Porto Alegre, RS, Brazil c Instituto de F´ ısica Gleb Wataghin, Universidade Estadual de Campinas, 13084-971 Campinas, SP, Brazil Received 24 October 2007; received in revised form 11 December 2007; accepted 23 December 2007 Available online 6 January 2008 Abstract Meldola blue immobilized on a new SiO 2 /TiO 2 /graphite composite was applied in the electrocatalytic oxidation of NADH. The materials were prepared by the sol–gel processing method and characterized by several techniques including scanning electronic microscopy coupled to energy dispersive spectroscopy (SEM–EDS), X-ray photoelectron spectroscopy (XPS) and high-resolution transmission electronic microscopy (HRTEM). Si and Ti mapping profiles on the surface showed a homogeneous distribution of the components. Ti2p binding energy peaks indicate that the formation of Si–O–Ti linkage is presumably the responsible for the high rigidity of the matrices. The good electrical conductivity presented by the composites (5 and 11 S cm −1 ) can be related to a homogeneous distribution of graphite particles observed by TEM. After the materials characterization, a SiO 2 /TiO 2 /graphite electrode was prepared and some chemical modifications were performed on its surface to promote the adsorption of meldola blue. The resulting system presented electrocatalytic properties toward the oxidation of NADH, decreasing the oxidation potential to −120 mV. The proposed sensor showed a wide linear response range from 0.018 to 7.29 mmol l −1 and limit of detection of 0.008 mmol l −1 . SiO 2 /TiO 2 /graphite has shown to be a promising material to be used as a suitable support in the construction of new electrochemical sensors. © 2008 Elsevier Ltd. All rights reserved. Keywords: SiO 2 /TiO 2 /graphite composite material; Meldola blue; Electrocatalytic oxidation; NADH 1. Introduction Silica–titania mixed oxides have been prepared by the sol–gel processing method [1] and the resulting materials, designated as SiO 2 /TiO 2 , have received considerable attention since they have been extensively applied in different areas such as catalysis [2], chromatography [3–5], gas sensors [6] and electroanalysis [7–10]. The mixed oxide shows the advantage of combining the mechanical strength and thermal stability of SiO 2 allied to the reactivity properties of TiO 2 . An additional advantage refers to the method of preparation which has allowed in obtaining mate- rials in which the components are highly and homogeneously dispersed [11–14]. ∗ Corresponding author. Tel.: +55 19 3521 3109; fax: +55 19 3521 3023. E-mail address: [email protected] (Y. Gushikem). The mixed oxide SiO 2 /TiO 2 , in which the TiO 2 is confined in the ceramic matrix, can be modified by reacting it with phospho- ric or antimony(V) acids [15,16]. These immobilized acids can furthermore be used as an efficient ion exchanger and then be able to retain several cationic electroactive species on the solid surfaces. The resulting modified ceramic materials have been used to fabricate very stable electrochemical sensors in which the electroactive species are strongly confined in the pores of the matrices. But one problem presented by these ceramic materi- als is the high electrical resistance which is not desired in such electrochemical devices, i.e. sensors and biosensors. To overcome this problem, the sol–gel method allows the incorporation of graphite particles inside the material, with high degree of dispersion, in order to assure that the par- ticles are well interconnected, increasing considerably the conductivity of the system prepared according to this new procedure [17]. The literature describes such carbon-based materials as having a wide range of applications, including solar 0013-4686/$ – see front matter © 2008 Elsevier Ltd. All rights reserved. doi:10.1016/j.electacta.2007.12.072
-
Upload
independent -
Category
Documents
-
view
1 -
download
0
Transcript of Meldola blue immobilized on a new SiO 2/TiO 2/graphite composite for electrocatalytic oxidation of...

A
we(tptpo0s©
K
1
pah[[mrtrd
0d
Available online at www.sciencedirect.com
Electrochimica Acta 53 (2008) 4167–4175
Meldola blue immobilized on a new SiO2/TiO2/graphite compositefor electrocatalytic oxidation of NADH
Camila M. Maroneze a, Leliz T. Arenas a, Rita C.S. Luz a, Edilson V. Benvenutti b,Richard Landers c, Yoshitaka Gushikem a,∗
a Instituto de Quımica, Universidade Estadual de Campinas, P.O. Box 6154, 13084-971 Campinas, SP, Brazilb Instituto de Quımica, Universidade Federal do Rio Grande do Sul, Porto Alegre, RS, Brazil
c Instituto de Fısica Gleb Wataghin, Universidade Estadual de Campinas, 13084-971 Campinas, SP, Brazil
Received 24 October 2007; received in revised form 11 December 2007; accepted 23 December 2007Available online 6 January 2008
bstract
Meldola blue immobilized on a new SiO2/TiO2/graphite composite was applied in the electrocatalytic oxidation of NADH. The materialsere prepared by the sol–gel processing method and characterized by several techniques including scanning electronic microscopy coupled to
nergy dispersive spectroscopy (SEM–EDS), X-ray photoelectron spectroscopy (XPS) and high-resolution transmission electronic microscopyHRTEM). Si and Ti mapping profiles on the surface showed a homogeneous distribution of the components. Ti2p binding energy peaks indicatehat the formation of Si–O–Ti linkage is presumably the responsible for the high rigidity of the matrices. The good electrical conductivityresented by the composites (5 and 11 S cm−1) can be related to a homogeneous distribution of graphite particles observed by TEM. Afterhe materials characterization, a SiO2/TiO2/graphite electrode was prepared and some chemical modifications were performed on its surface to
romote the adsorption of meldola blue. The resulting system presented electrocatalytic properties toward the oxidation of NADH, decreasing thexidation potential to −120 mV. The proposed sensor showed a wide linear response range from 0.018 to 7.29 mmol l−1 and limit of detection of.008 mmol l−1. SiO2/TiO2/graphite has shown to be a promising material to be used as a suitable support in the construction of new electrochemicalensors.2008 Elsevier Ltd. All rights reserved.
ytic o
trfasutmae
eywords: SiO2/TiO2/graphite composite material; Meldola blue; Electrocatal
. Introduction
Silica–titania mixed oxides have been prepared by the sol–gelrocessing method [1] and the resulting materials, designateds SiO2/TiO2, have received considerable attention since theyave been extensively applied in different areas such as catalysis2], chromatography [3–5], gas sensors [6] and electroanalysis7–10]. The mixed oxide shows the advantage of combining theechanical strength and thermal stability of SiO2 allied to the
eactivity properties of TiO2. An additional advantage refers tohe method of preparation which has allowed in obtaining mate-
ials in which the components are highly and homogeneouslyispersed [11–14].∗ Corresponding author. Tel.: +55 19 3521 3109; fax: +55 19 3521 3023.E-mail address: [email protected] (Y. Gushikem).
ihtcpm
013-4686/$ – see front matter © 2008 Elsevier Ltd. All rights reserved.oi:10.1016/j.electacta.2007.12.072
xidation; NADH
The mixed oxide SiO2/TiO2, in which the TiO2 is confined inhe ceramic matrix, can be modified by reacting it with phospho-ic or antimony(V) acids [15,16]. These immobilized acids canurthermore be used as an efficient ion exchanger and then beble to retain several cationic electroactive species on the solidurfaces. The resulting modified ceramic materials have beensed to fabricate very stable electrochemical sensors in whichhe electroactive species are strongly confined in the pores of the
atrices. But one problem presented by these ceramic materi-ls is the high electrical resistance which is not desired in suchlectrochemical devices, i.e. sensors and biosensors.
To overcome this problem, the sol–gel method allows thencorporation of graphite particles inside the material, withigh degree of dispersion, in order to assure that the par-
icles are well interconnected, increasing considerably theonductivity of the system prepared according to this newrocedure [17]. The literature describes such carbon-basedaterials as having a wide range of applications, including solar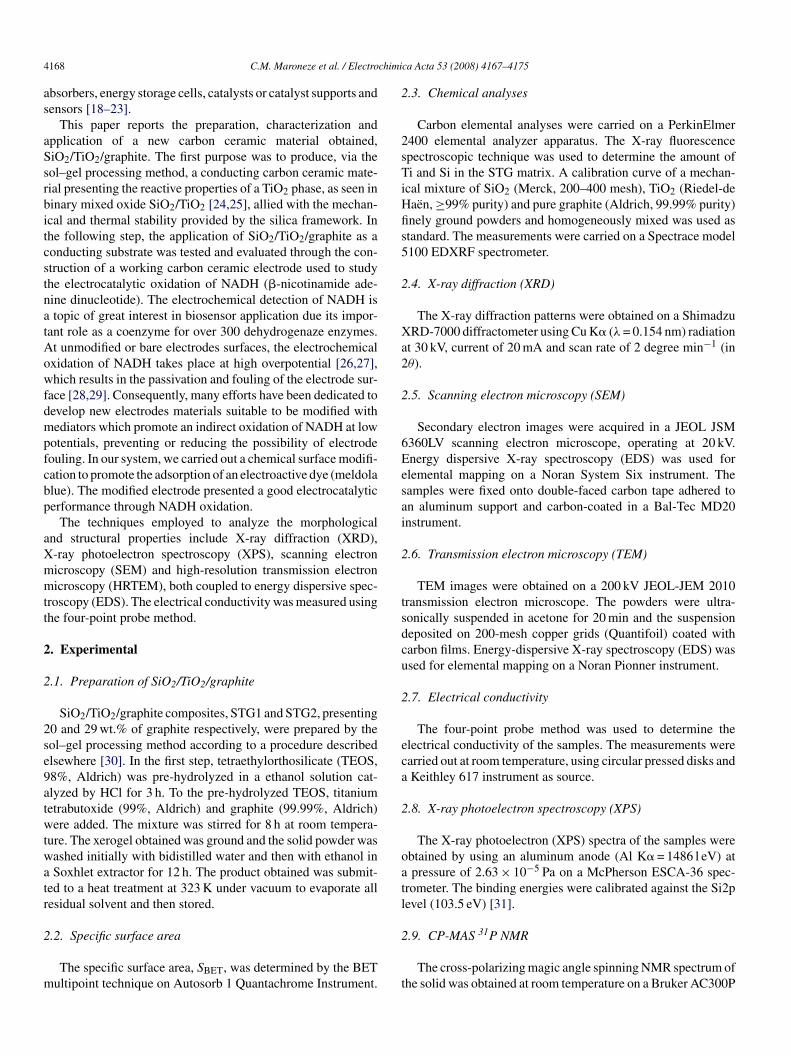
4 chimi
as
aSsrbitcstnatAowfdmpfcbp
aXmmtt
2
2
2se9atwtwatr
2
m
2
2sTiHfis5
2
Xa2
2
6Eesai
2
tsdcu
2
eca
2
oatl
168 C.M. Maroneze et al. / Electro
bsorbers, energy storage cells, catalysts or catalyst supports andensors [18–23].
This paper reports the preparation, characterization andpplication of a new carbon ceramic material obtained,iO2/TiO2/graphite. The first purpose was to produce, via theol–gel processing method, a conducting carbon ceramic mate-ial presenting the reactive properties of a TiO2 phase, as seen ininary mixed oxide SiO2/TiO2 [24,25], allied with the mechan-cal and thermal stability provided by the silica framework. Inhe following step, the application of SiO2/TiO2/graphite as aonducting substrate was tested and evaluated through the con-truction of a working carbon ceramic electrode used to studyhe electrocatalytic oxidation of NADH (�-nicotinamide ade-ine dinucleotide). The electrochemical detection of NADH istopic of great interest in biosensor application due its impor-
ant role as a coenzyme for over 300 dehydrogenaze enzymes.t unmodified or bare electrodes surfaces, the electrochemicalxidation of NADH takes place at high overpotential [26,27],hich results in the passivation and fouling of the electrode sur-
ace [28,29]. Consequently, many efforts have been dedicated toevelop new electrodes materials suitable to be modified withediators which promote an indirect oxidation of NADH at low
otentials, preventing or reducing the possibility of electrodeouling. In our system, we carried out a chemical surface modifi-ation to promote the adsorption of an electroactive dye (meldolalue). The modified electrode presented a good electrocatalyticerformance through NADH oxidation.
The techniques employed to analyze the morphologicalnd structural properties include X-ray diffraction (XRD),-ray photoelectron spectroscopy (XPS), scanning electronicroscopy (SEM) and high-resolution transmission electronicroscopy (HRTEM), both coupled to energy dispersive spec-
roscopy (EDS). The electrical conductivity was measured usinghe four-point probe method.
. Experimental
.1. Preparation of SiO2/TiO2/graphite
SiO2/TiO2/graphite composites, STG1 and STG2, presenting0 and 29 wt.% of graphite respectively, were prepared by theol–gel processing method according to a procedure describedlsewhere [30]. In the first step, tetraethylorthosilicate (TEOS,8%, Aldrich) was pre-hydrolyzed in a ethanol solution cat-lyzed by HCl for 3 h. To the pre-hydrolyzed TEOS, titaniumetrabutoxide (99%, Aldrich) and graphite (99.99%, Aldrich)ere added. The mixture was stirred for 8 h at room tempera-
ure. The xerogel obtained was ground and the solid powder wasashed initially with bidistilled water and then with ethanol inSoxhlet extractor for 12 h. The product obtained was submit-
ed to a heat treatment at 323 K under vacuum to evaporate allesidual solvent and then stored.
.2. Specific surface area
The specific surface area, SBET, was determined by the BETultipoint technique on Autosorb 1 Quantachrome Instrument.
2
t
ca Acta 53 (2008) 4167–4175
.3. Chemical analyses
Carbon elemental analyses were carried on a PerkinElmer400 elemental analyzer apparatus. The X-ray fluorescencepectroscopic technique was used to determine the amount ofi and Si in the STG matrix. A calibration curve of a mechan-
cal mixture of SiO2 (Merck, 200–400 mesh), TiO2 (Riedel-deaen, ≥99% purity) and pure graphite (Aldrich, 99.99% purity)nely ground powders and homogeneously mixed was used astandard. The measurements were carried on a Spectrace model100 EDXRF spectrometer.
.4. X-ray diffraction (XRD)
The X-ray diffraction patterns were obtained on a ShimadzuRD-7000 diffractometer using Cu K� (λ = 0.154 nm) radiation
t 30 kV, current of 20 mA and scan rate of 2 degree min−1 (inθ).
.5. Scanning electron microscopy (SEM)
Secondary electron images were acquired in a JEOL JSM360LV scanning electron microscope, operating at 20 kV.nergy dispersive X-ray spectroscopy (EDS) was used forlemental mapping on a Noran System Six instrument. Theamples were fixed onto double-faced carbon tape adhered ton aluminum support and carbon-coated in a Bal-Tec MD20nstrument.
.6. Transmission electron microscopy (TEM)
TEM images were obtained on a 200 kV JEOL-JEM 2010ransmission electron microscope. The powders were ultra-onically suspended in acetone for 20 min and the suspensioneposited on 200-mesh copper grids (Quantifoil) coated witharbon films. Energy-dispersive X-ray spectroscopy (EDS) wassed for elemental mapping on a Noran Pionner instrument.
.7. Electrical conductivity
The four-point probe method was used to determine thelectrical conductivity of the samples. The measurements werearried out at room temperature, using circular pressed disks andKeithley 617 instrument as source.
.8. X-ray photoelectron spectroscopy (XPS)
The X-ray photoelectron (XPS) spectra of the samples werebtained by using an aluminum anode (Al K� = 1486 l eV) atpressure of 2.63 × 10⁻⁵ Pa on a McPherson ESCA-36 spec-
rometer. The binding energies were calibrated against the Si2pevel (103.5 eV) [31].
.9. CP-MAS 31P NMR
The cross-polarizing magic angle spinning NMR spectrum ofhe solid was obtained at room temperature on a Bruker AC300P

C.M. Maroneze et al. / Electrochimi
Table 1Chemical analyzes and specific surface areas for SiO2/TiO2/C–graphite
Sample SiO2 (wt.%) TiO2 (wt.%) Graphite (wt.%) SBET (m2 g−1)
SS
st1u
2
S((bc
bsafb
2
Aa(eep
3
3
ap
at2
3
srdttwtoch
3
oS
sOr0
p4tTtaethr
TX
S
SSSTC
*
TG1 56 16 20 273TG2 45 18 29 258
pectrometer operating at 121 MHz. A sequential pulse with con-act time of 1 ms, 2 s between the pulses, and acquisition time of1 ms were the conditions used. Phosphoric acid (85 wt.%) wassed as standard.
.10. Preparation of the working electrode
The working electrode was prepared by pressing 30 mg ofTG2 under a pressure of 5 t. The resulting self-supported diskgeometric area 0.28 cm2) was glued to the end of a glass tube6 mm i.d. and 15 cm length). A copper wire linked to the disky graphite powder inserted inside the tube made the electricalontact.
The immobilization of the electroactive dye was carried outy immersing the working electrode in a 1.0 mol l−1 aqueousolution of phosphoric acid for half an hour and further into1.0 × 10−4 mol l−1 aqueous solution of meldola blue (MB+)
or more half an hour. The electrode was finally washed withidistilled water.
.11. Electrochemical measurements
The electrochemical measurements were carried out on anutolab PGSTAT 20 potentiostat–galvanostat apparatus, usingclassical three-electrode cell. A saturated calomel electrode
SCE) was used as the reference, a platinum foil as the auxiliarylectrode and pressed disks of SiO2/TiO2/C–graphite as workinglectrodes. All measurements were carried out in 0.1 mol l−1
hosphate buffer solution pH 7.5.
. Results and discussion
.1. Characteristics of the materials
Table 1 summarizes the chemical analysis results as wells the specific surface areas (SBET) for samples prepared,ossessing two different compositions. The samples STG1
tiia
able 2PS binding energies (BE) obtained for STG1 e STG2
ample Binding energies (eV)
O 1s Ti 2p
O(i) O(ii) Ti 2p3/2
TG1 530.4 (2.0)# 532.9 (2.6)# 459.6 (2.8)#
TG2 530.2 (2.4)# 532.8 (2.4)# 459.5 (2.4)#
iO2* – 532.5 –iO2* 529.9 – 458.8* – – –
Ref. [31], #full width at half-maximum of the peaks.
ca Acta 53 (2008) 4167–4175 4169
nd STG2, presenting 20 and 29 wt.% of graphite, respec-ively, are porous materials with specific surface areas 273 and58 m2 g−1.
.2. X-ray diffraction (XRD)
X-ray diffraction patterns for both samples, STG1 and STG2,howed only one diffraction peak at 26.7 degree (2θ) which cor-esponds to the interplanar distances of 0.33 nm (plane 0 0 2)ue to the graphite crystalline phase [32]. No peaks assignableo SiO2 and TiO2 crystalline phases were detected [33]. In ordero study the thermal stability of both matrices, the samplesere heated in situ under nitrogen atmosphere and the spec-
ra recorded in real time up to 1073 K. The diffraction patternsbtained were the same of those for STG1 and STG2 as obtained,learly indicating that the SiO2 and TiO2 particles are highly andomogeneously dispersed in the both matrices.
.3. X-ray photoelectron spectroscopy (XPS)
Table 2 summarizes the XPS binding energy (BE) valuesbtained for STG1 and STG2 matrices, compared with those ofiO2–, TiO2– and C–graphite.
The BE peaks of O1s for oxygen bonded to Ti are repre-ented by O(i), and bonded to Si, O(ii). The lower intensity of(i) peak compared to O(ii) takes into account the Ti/Si atom
atios determined by XPS on the surface, 0.08 for STG1 and.12 for STG2.
It is also shown the doublet Ti2p3/2 and Ti2p1/2 BE energyeaks observed at 459.6 and 464.9 eV for STG1 and 459.5 and65.0 eV for STG2. For the TiO2 rutile phase the BE peaks ofhe corresponding doublets are observed at 458.8 and 464.5 eV.hese dislocations of Ti2p to higher energies are directly related
o the formation of Si–O–Ti heterolinkages formed in the STG1nd STG2 systems [34–40]. Considering that the Si atom is morelectronegative than Ti, polarization of the bond will decreasehe electron density on the Ti atom, shifting the Ti2p BE towardigher energy in comparison with Ti–O–Ti linkage in the TiO2utile phase.
The chemical bond Si–O–Ti formed at the interface between
he SiO2 and TiO2 particles, as suggested by the XPS exper-ments, take into account that titania particles are confinedn the silica matrix, since the latter is present in the largermount.Si 2p C 1s
Ti 2p1/2
464.9 (3.5)# 103.5 (2.5)# 284.4 (1.7)#
465.0 (3.6)# 103.5 (2.7)# 284.3 (1.6)#
– 103.5 –464.5 – –
– – 284.5
4170 C.M. Maroneze et al. / Electrochimi
Fs
3
1tb
cap
ccgicc
3
atTTd
ig. 1. Electrical conductivity values for STG1 (�) and STG2 (�) calcined ineveral temperatures.
.4. Electrical conductivity
The electrical conductivity values obtained are 5 and1 S cm−1 for STG1 and STG2, respectively. In magnitude,hese values are similar to values reported for a SiO2/graphiteinary system presenting much more graphite [22]. The electri-
pspd
Fig. 2. Scanning electron microscopic images of STG1 (a) and STG2 (
ca Acta 53 (2008) 4167–4175
al conductivity presented by samples calcined under nitrogentmosphere up to 1273 K was also measured. The results areresented in Fig. 1.
The results show that there is no alteration in the electri-al conductivity character of the solids since the values do nothange. The high values for both materials indicate that theraphite particles are incorporated and are well interconnectednside the SiO2/TiO2 matrices, decreasing the internal electri-al resistance to electron flow, resulting in a good conductingeramic material.
.5. Scanning electron microscopy and EDS mapping
Scanning electron microscopic images of STG1 and STG2re presented in Fig. 2(a) and (b) and the representative elemen-al maps of Ti and Si are shown in Fig. 2(c)–(f), respectively.hese images indicate that, within the magnification used, noiO2–, SiO2– and C–graphite segregated particles phases areetected.
The distributions of Ti and Si under such conditions were
robed and the results are shown in Fig. 3(a) and (b). Themall signal count oscillations for both elements observed on thearticle also support, within the resolution used, their uniformistribution on both matrix surfaces.b); Ti mapping images are shown in (c), (d) and Si in (e) and (f).

C.M. Maroneze et al. / Electrochimica Acta 53 (2008) 4167–4175 4171
F(
3
aScdatth
FMS
rit
3e
Fc
ig. 3. Distribution of Ti and Si atoms over a particle of STG1 (a) and STG2b).
.6. Transmission electron microscopy
Transmission electron microscopic images were obtainediming to evaluate the dispersion degree of graphite inside theiO2/TiO2 matrices. Fig. 4(a) shows the bright field and theorresponding dark-field images 4(b) of crystalline graphiteomains in STG2. The bright domains in the dark-field images
re produced by diffraction from graphite crystallites that fulfillhe Bragg condition. As graphite is the only crystalline phase,hese domains show where the graphite particles are located andow they are distributed.hwf
ig. 4. Transmission electron microscopy images of STG1. Bright-field image (a) andenter region is shown in (c).
ig. 5. Cyclic voltamogramms of the (a) STGP and (b) STGP/MB electrodes.easurements carried out in 0.1 mol l−1 phosphate buffer solution (pH 7.5).
can rate: 20 mV s−1.
The most important observation is that graphite is incorpo-ated throughout the particles, where its uniform distributions responsible for the high electrical conductivity already men-ioned.
.7. Modification of the working electrode andlectrochemical measurements
The matrix presenting higher electrical conductivity, STG2,ereafter designated simply as STG, was used to prepare theorking electrode. All the subsequent steps involved in the sur-
ace modification of the working are shown in Scheme 1. STG
the correspondent dark-field images in (b). Energy dispersive spectrum of the
4172 C.M. Maroneze et al. / Electrochimica Acta 53 (2008) 4167–4175
S adsorp
wtmt(
stt(r
((7
v0iae(
t
t
F6
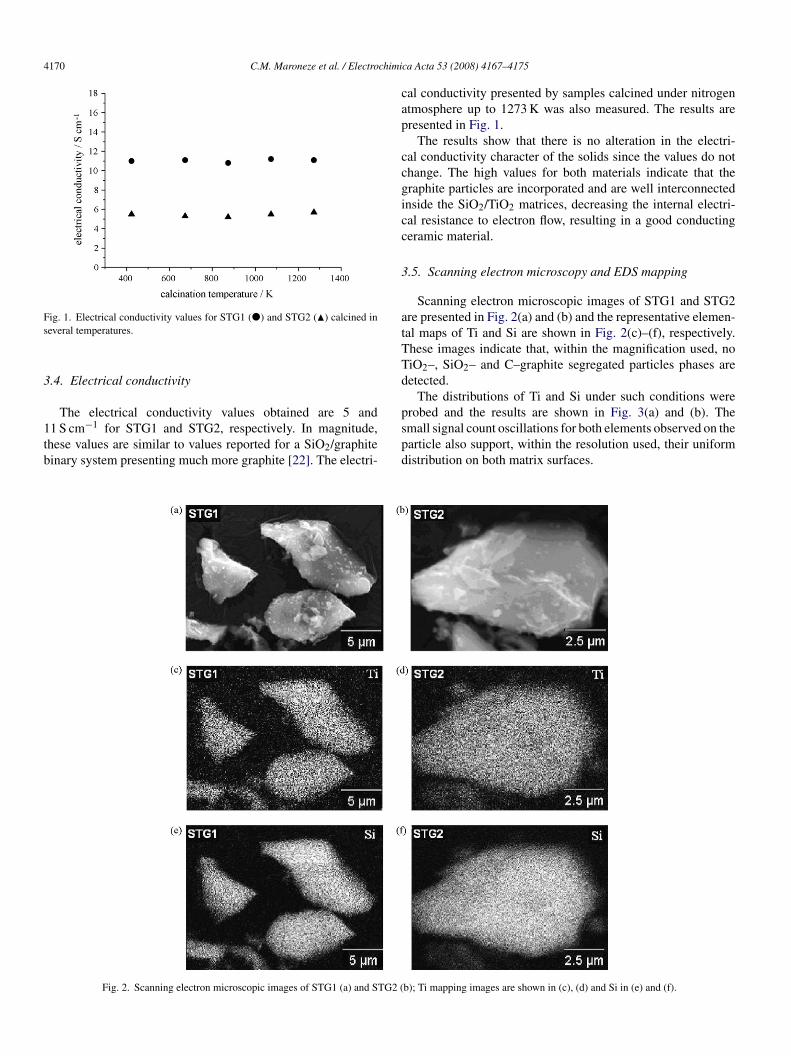
cheme 1. Chemisorption of phosphoric acid on STG surface (reaction a) and
as firstly immersed in an aqueous solution of phosphoric acido promote the chemical adsorption of acid species onto the
atrix surface, where ≡TiOH is the reactive specie bonded tohe STG matrix (I) and the adsorbed phosphate on STG/HPO4II) (Scheme 1, reaction a).
The 31P NMR spectrum of the modified material STGP (II)hows the chemical shift δ = −15.1 ppm (c) which is assignedo the HPO4
2− species [41,42]. This attached acid species canhen adsorb the electroactive dye MB+ from aqueous solutionSTGP/MB-III) by an ion exchange reaction process (Scheme 1eaction b).
Fig. 5 shows the cyclic voltammograms of the STGP beforecurve (a)) and after modifying the electrode with meldola blueMB) (curve (b)) in 0.1 mol l−1 phosphate buffer solution (pH.5).
Fehp
ig. 6. (a) Cyclic voltamogramms of the STGP/MB electrode in 0.1 mol l−1 phosph0; (5) 80 and (6) 100 mV s−1; (b) plot of Ip–ν obtained from (a) and (c) Plot of Ip–ν
tion of MB+ by an ion exchange reaction (reaction b); (c) 31P NMR of (II).
As shown in the figure, no redox peak was observed for cyclicoltammogram of the STGP electrode at potential range −0.4 to.2 V (Fig. 5, curve (a)). Thus this STGP electrode is suitable fornvestigating the voltammetric behavior of meldola blue (MB)t applied potential range. After immobilization of MB on thelectrode surface, a well-defined redox system was observedFig. 5, curve (b)), due to the redox reaction.
Fig. 6a shows the cyclic voltammograms of STGP/MB elec-rode in PBS (pH 7.5) at various potential scan rates.
The peak currents of the redox couple were directly propor-ional to the scan rate in the range below 0.1 V s−1 as shown in
ig. 6b, which is characteristic of the adsorptive process at thelectrode surface or a surface confined redox process [43]. Atigher scan rate (200–1000 mV s−1), the peak currents becomeroportional to the square root of the scan rate (Fig. 6c) indi-ate buffer solution (pH 7.5) at potential scan rate of: (1) 10; (2) 20; (3) 40; (4)1/2 at potential scan rate of 200–1000 mV s−1.

C.M. Maroneze et al. / Electrochimica Acta 53 (2008) 4167–4175 4173
Fig. 7. Influence of pH on: (a) the peak current and (b) average peak potential for the STGP/MB electrode. Measurements carried out in 0.1 mol l−1 phosphate buffersolution (pH 7.5). Scan rate: 20 mV s−1.
F ) and( DH (c
cte
b(
I
T1ss
a5
bFa(pr
3S
STGP electrode at three concentrations of NADH (1, 3 and5 mmol l−1).
As can be seen in this figure, in absence of MB noredox process is observed. However, Fig. 8b shows the cyclic
ig. 8. Cyclic voltammograms for the: (a) STGP electrode in absence (curve 1b) STGP/MB in absence (curve 1) and presence of three concentrations of NA
ating the diffusional controlled process, which can be relatedo the limitation of the diffusion of the counter ions into thelectrode to keep the electroneutrality.
The surface concentration of electroactive species, Γ , cane calculated from the slope of the plot of Ipa versus scan ratev < 100 mV s−1) by the following equation [44]:
p = n2F2νAΓ
4RT(1)
he calculated value can be approximately 1.91 ×0−8 mol cm−2 for STGP/MB electrode, where v is theweep rate, A is the geometric surface area and the otherymbols have their usual meaning.
The solution pH dependence of the STGP/MB electrode waslso investigated using 0.1 mol l−1 phosphate buffer at pH 5.0,
.5, 6.0, 6.5, 7.0, 7.5 and 8.0 (Fig. 7a).This study showed that the peak current was not affectedy the pH of the solution in the investigated range of pH. Inig. 8b the formal potential of the surface redox couple, takens the average of positive and negative peak potentials [Em = 1/2Epa + Epc)], was pH dependent (5.0–8.0) with a slope of 25 mVer unit of pH (next to 30 mV) indicating that the electrodeeaction involve one proton and two electrons.
Fts
presence of three concentrations of NADH (curves 2–4: 1, 3 and 5 mmol l−1);urves 2, 3 and 4: 1, 3 and 5 mmol l−1).
.8. Electrocatalytic oxidation of NADH on the STGP andTGP/MB electrode
Fig. 8a shows the cyclic voltammograms obtained with
ig. 9. (a) Variation of the anodic peak current Ipvs. square root of the poten-ial scan rate ν1/2 for the STGP/MB electrode in 0.1 mol l−1 phosphate bufferolution (pH 7.5) containing 3 mmol l−1 NADH. Scan rate 5–100 mV s−1.
4174 C.M. Maroneze et al. / Electrochimica Acta 53 (2008) 4167–4175
F for thf , 3.77
vcodoSi[ewf
wmo
wa
tvpTes
3
wd7
ia
I
ws
eNeb0io[
rnmea
4
ihmuTnrtlaoTwr
dibs
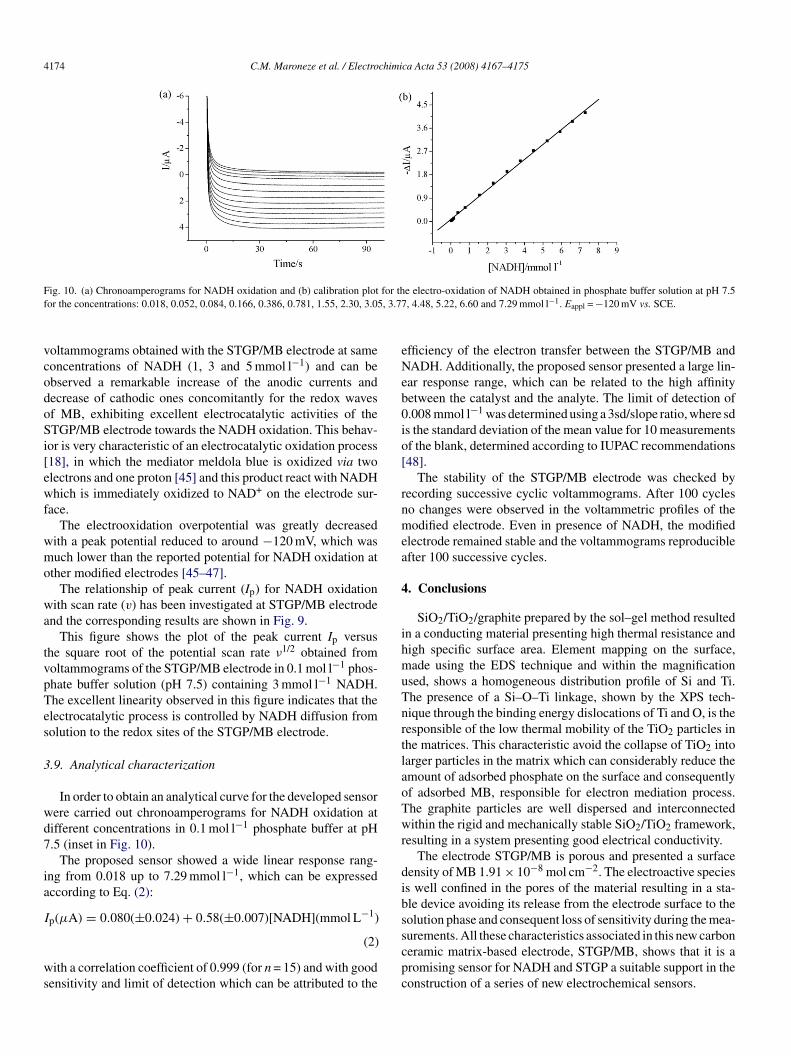
ig. 10. (a) Chronoamperograms for NADH oxidation and (b) calibration plotor the concentrations: 0.018, 0.052, 0.084, 0.166, 0.386, 0.781, 1.55, 2.30, 3.05
oltammograms obtained with the STGP/MB electrode at sameoncentrations of NADH (1, 3 and 5 mmol l−1) and can bebserved a remarkable increase of the anodic currents andecrease of cathodic ones concomitantly for the redox wavesf MB, exhibiting excellent electrocatalytic activities of theTGP/MB electrode towards the NADH oxidation. This behav-
or is very characteristic of an electrocatalytic oxidation process18], in which the mediator meldola blue is oxidized via twolectrons and one proton [45] and this product react with NADHhich is immediately oxidized to NAD+ on the electrode sur-
ace.The electrooxidation overpotential was greatly decreased
ith a peak potential reduced to around −120 mV, which wasuch lower than the reported potential for NADH oxidation at
ther modified electrodes [45–47].The relationship of peak current (Ip) for NADH oxidation
ith scan rate (v) has been investigated at STGP/MB electrodend the corresponding results are shown in Fig. 9.
This figure shows the plot of the peak current Ip versushe square root of the potential scan rate ν1/2 obtained fromoltammograms of the STGP/MB electrode in 0.1 mol l−1 phos-hate buffer solution (pH 7.5) containing 3 mmol l−1 NADH.he excellent linearity observed in this figure indicates that thelectrocatalytic process is controlled by NADH diffusion fromolution to the redox sites of the STGP/MB electrode.
.9. Analytical characterization
In order to obtain an analytical curve for the developed sensorere carried out chronoamperograms for NADH oxidation atifferent concentrations in 0.1 mol l−1 phosphate buffer at pH.5 (inset in Fig. 10).
The proposed sensor showed a wide linear response rang-ng from 0.018 up to 7.29 mmol l−1, which can be expressedccording to Eq. (2):
p(μA) = 0.080(±0.024) + 0.58(±0.007)[NADH](mmol L−1)
(2)
ith a correlation coefficient of 0.999 (for n = 15) and with goodensitivity and limit of detection which can be attributed to the
scpc
e electro-oxidation of NADH obtained in phosphate buffer solution at pH 7.5, 4.48, 5.22, 6.60 and 7.29 mmol l−1. Eappl = −120 mV vs. SCE.
fficiency of the electron transfer between the STGP/MB andADH. Additionally, the proposed sensor presented a large lin-ar response range, which can be related to the high affinityetween the catalyst and the analyte. The limit of detection of.008 mmol l−1 was determined using a 3sd/slope ratio, where sds the standard deviation of the mean value for 10 measurementsf the blank, determined according to IUPAC recommendations48].
The stability of the STGP/MB electrode was checked byecording successive cyclic voltammograms. After 100 cycleso changes were observed in the voltammetric profiles of theodified electrode. Even in presence of NADH, the modified
lectrode remained stable and the voltammograms reproduciblefter 100 successive cycles.
. Conclusions
SiO2/TiO2/graphite prepared by the sol–gel method resultedn a conducting material presenting high thermal resistance andigh specific surface area. Element mapping on the surface,ade using the EDS technique and within the magnification
sed, shows a homogeneous distribution profile of Si and Ti.he presence of a Si–O–Ti linkage, shown by the XPS tech-ique through the binding energy dislocations of Ti and O, is theesponsible of the low thermal mobility of the TiO2 particles inhe matrices. This characteristic avoid the collapse of TiO2 intoarger particles in the matrix which can considerably reduce themount of adsorbed phosphate on the surface and consequentlyf adsorbed MB, responsible for electron mediation process.he graphite particles are well dispersed and interconnectedithin the rigid and mechanically stable SiO2/TiO2 framework,
esulting in a system presenting good electrical conductivity.The electrode STGP/MB is porous and presented a surface
ensity of MB 1.91 × 10⁻⁸ mol cm−2. The electroactive speciess well confined in the pores of the material resulting in a sta-le device avoiding its release from the electrode surface to theolution phase and consequent loss of sensitivity during the mea-
urements. All these characteristics associated in this new carboneramic matrix-based electrode, STGP/MB, shows that it is aromising sensor for NADH and STGP a suitable support in theonstruction of a series of new electrochemical sensors.
chimi
A
Sfig
R
[
[[
[
[[[
[[[[[
[[[[[[[[
[
[[
[[
[[[[
[
[
[
[[
[[
C.M. Maroneze et al. / Electro
cknowledgements
C.M.M. is indebted to FAPESP (Sao Paulo State Researchupport Foundation) for a PhD fellowship and YG is indebtedor financial support (grant 00/11103-5). The authors are alsondebted to CNPq (National Research Council) for researchrants and Prof. C.H. Collins for manuscript revision.
eferences
[1] J.E. Goncalves, S.C. Castro, A.Y. Ramos, M.C.M. Alves, Y. Gushikem, J.Electron. Spectrosc. Relat. Phenom. 307 (2001) 114.
[2] S. Zhang, F. Zhang, K. Chan, Appl. Catal. A 284 (2005) 193.[3] R.B. Silva, K.E. Collins, C.H. Collins, J. Chromatogr. A 869 (2000) 137.[4] R.B. Silva, C.H. Collins, J. Chromatogr. A 845 (1999) 417.[5] R.B. Silva, Y. Gushikem, C.H. Collins, J. Sep. Sci. 24 (2001) 49.[6] A.A.S. Alfaya, Y. Gushikem, S.C. de Castro, Micropor. Mesopor. Mater.
39 (2000) 57.[7] A. Walcarius, Electroanalysis 13 (2001) 701.[8] A. Walcarius, Electroanalysis 10 (1998) 1217.[9] A. Walcarius, M. Etienne, B. Lebeau, Chem. Mater. 15 (2003) 2161.10] E.S. Ribeiro, S.S. Rosatto, L.T. Kubota, Y. Gushikem, J. Solid State Elec-
trochem. 7 (2003) 665.11] A.A.S. Alfaya, Y. Gushikem, S.C. de Castro, Chem. Mater. 10 (1998) 909.12] C.J. Brinker, G.W. Scherer, Sol–Gel Science. The Physics and Chemistry
of Sol–Gel Processing, Academic Press, San Diego, 1990.13] Z.-G. Wu, Y.-X. Zhao, D.-S. Liu, Micropor. Mesopor. Mater. 68 (2004)
127.14] H.J.M. Bosman, A.P. Pijpers, Q.W.M.A. Jaspers, J. Catal. 161 (1996) 551.15] A.M. Castellani, Y. Gushikem, J. Colloid Interface Sci. 230 (2000) 195.16] A.M. Castellani, J.E. Goncalves, Y. Gushikem, Electroanalysis 13 (2001)
1165.17] M. Tsionky, G. Gun, V. Glezer, O. Lev, Anal. Chem. 66 (1994) 1747.
18] Y. Mastai, S. Polarz, M. Antonietti, Adv. Funct. Mater. 12 (2002) 197.19] A. Salimi, S. Pourbeyram, Talanta 60 (2003) 205.20] S. Wu, H. Ju, Y. Liu, Adv. Funct. Mater. 17 (2007) 585.21] T.J. Bandosz, M. Seredych, J. Allen, J. Wood, E. Rosenberg, Chem. Mater.19 (2007) 2500.
[
[
[
ca Acta 53 (2008) 4167–4175 4175
22] G. Oskam, P.C. Searson, J. Phys. Chem. B 102 (1998) 2464.23] L. Rabinovich, O. Lev, Electroanalysis 13 (2000) 265.24] X. Gao, I.E. Wachs, Catal. Today 51 (1999) 233.25] R.J. Davis, Z.F. Liu, Chem. Mater. 9 (1997) 2311.26] J. Moiroux, P.J. Elving, Anal. Chem. 50 (1978) 1056.27] H. Jaegfeldt, J. Electroanal. Chem. 110 (1980) 295.28] J. Wang, L. Anges, T. Martinez, Bioelectrochem. Bioenerg. 29 (1992) 215.29] M. Musameh, J. Wang, A. Merkoci, Y. Lin, Electrochem. Commun. 4
(2002) 743.30] Y. Gushikem, E.V. Benvenutti, E.S. Ribeiro, “Silica–titania–graphite elec-
trical conducting material obtained by the sol–gel processing method”,Brazilian Patent INPI-PI 0303303-1, 2003.
31] Handbook of Photoelectron Spectroscopy, PerkinElmer, 1992.32] JCPDS 23-0064, International Centre for Diffraction Data. PCPDFWIN
version 1.30 1997.33] J. Yang, J.M.F. Ferreira, Mater. Lett. 36 (1998) 320.34] Z. Li, B. Hou, Y. Xu, D. Wu, Y. Sun, W. Hu, F. Deng, J. Solid State Chem.
178 (2005) 1395.35] S.M. Mukhopadhyay, S.H. Garofalini, J. Non-Cryst. Solids 126 (1990) 202.36] O.K. Park, Y.S. Kang, Colloids Surf. A 257/258 (2005) 261.37] R. Castillo, B. Koch, P. Ruiz, B. Delmon, J. Catal. 161 (1996) 524.38] S. Orignac, H.C. Vasconcelos, R.M. Almeida, J. Non-Cryst. Solids 217
(1997) 155.39] X. Gao, S.R. Bare, J.L. Fierro, M.A. Banares, I.E. Wachs, J. Phys. Chem.
B 102 (1998) 5653.40] Z. Li, B. Hou, Y. Xu, D. Wu, Y. Sun, J. Colloid Interface Sci. 288 (2005)
149.41] T.V. Kovalchuk, H. Shifi, A.S. Koechev, V.G. Il’in, V.N. Zaitsev, Fraissard,
J. Phys. Chem. B 109 (2005) 13948.42] L. Mafra, F.A. Paz, J. Rocha, Chem. Mater. 17 (2005) 6287.43] P. Manisankar, A. Gomathi, D. Velayutham, J. Solid State Electrochem. 9
(2005) 601.44] J. Wang, Analytical Electrochemistry, VCH, New York, 1994.45] L. Zhu, J. Zhai, R. Yang, C. Tian, L. Guo, Biosens. Bioeletron. 22 (2007)
2768.
46] R. Antiochia, I. Lavagnini, P. Pastore, F. Magno, Bioelectrochemistry 64(2004) 157.47] Q. Wang, H. Tang, Q. Xie, L. Tan, Y. Zhang, B. Li, S. Yao, Electrochim.
Acta 52 (2007) 6630.48] Analytical Methods Commitee, Analyst 112 (1987) 199.


![Resonant Raman effect enhanced by surface plasmon excitation of CdSe nanocrystals embedded in thin SiO[sub 2] films](https://static.fdokumen.com/doc/165x107/634518516cfb3d40640985a1/resonant-raman-effect-enhanced-by-surface-plasmon-excitation-of-cdse-nanocrystals.jpg)