Single component and competitive adsorption of propane, carbon dioxide and butane on Vycor glass
Upload
independentCategory
view
0download
0
Journal of Catalysis 256 (2008) 45–61
www.elsevier.com/locate/jcat
V2O5–SiO2 systems prepared by flame pyrolysis as catalystsfor the oxidative dehydrogenation of propane
I. Rossetti a, L. Fabbrini a, N. Ballarini b, C. Oliva a, F. Cavani b, A. Cericola b, B. Bonelli c,M. Piumetti c, E. Garrone c, H. Dyrbeck d, E.A. Blekkan d, L. Forni a,∗
a Dipartimento CFE e ISTM-CNR, Università di Milano, via C.Golgi, 19 20133 Milano, Italyb Dipartimento di Chimica Industriale e dei Materiali, Università di Bologna, INSTM, Research Unit of Bologna, NoE Idecat partner (FP6 of EU), Italy
c Dipartimento di Scienza dei Materiali ed Ingegneria Chimica, Politecnico di Torino, Torino, INSTM Unit Torino Politecnico, Italyd Department of Chemical Engineering, Norwegian University of Science and Technology, N-7491 Trondheim, Norway
Received 13 December 2007; revised 25 February 2008; accepted 27 February 2008
Available online 2 April 2008
Abstract
VOx /SiO2 catalysts were prepared through an innovative flame pyrolysis (FP) technique and tested for the oxidative dehydrogenation ofpropane. The samples, of different V loadings, were characterized by electron paramagnetic resonance (EPR), micro-Raman, and FT-IR spec-troscopy to assess the nature of the vanadium active sites in comparison with a sample prepared by impregnation. The active sites of theFP-prepared catalysts appeared as highly dispersed V5+O groups partly incorporated into the silica matrix and interacting poorly with oneanother. Lower dispersion can be achieved at the same V loading with the catalyst prepared by impregnation. EPR revealed V4+O groups point-ing out normally from the catalyst surface and sitting in the center of a surface array of oxygen atoms. These V4+ groups helped demonstratethe difference in catalytic behavior of the various samples. Catalytic activity measured under both aerobic and anaerobic conditions revealed apromisingly high selectivity with the FP-prepared samples. The best results were obtained with a 10 wt% V loading, which provided the bestpropylene yield among the samples, especially under anaerobic conditions (up to 80% selectivity at 10% propane conversion). This is likelyrelated to the much higher dispersion of the VOx species in the FP-prepared samples, which also helps reduce the coke formation triggered byexposed surface acid sites.© 2008 Elsevier Inc. All rights reserved.
Keywords: Propane ODH; Flame pyrolysis; Silica-supported vanadium; Anaerobic and co-feed reaction conditions
1. Introduction
Oxidative dehydrogenation (ODH) of light alkanes offers apotentially attractive route to alkenes, because the overall reac-tion pathway is exothermic, and the thermodynamic constraintsof nonoxidative routes are avoided [1–5]. Furthermore, carbondeposition is limited, allowing for more stable catalytic activ-ity. However, the yield of alkenes obtained on most catalysts isdecreased by parallel or consecutive reactions, mainly the com-bustion of reactant and products to CO and CO2 and formationof oxygenated byproducts, such as acetic acid [6]. Along with
* Corresponding author. Fax: +39 02 50314300.E-mail address: [email protected] (L. Forni).
0021-9517/$ – see front matter © 2008 Elsevier Inc. All rights reserved.doi:10.1016/j.jcat.2008.02.028
selectivity problems, the co-feeding of oxygen also can entailrisks, which can be decreased through appropriate process en-gineering. On the other hand, selectivity problems also can bepartly overcome by optimizing the catalyst formulation.
Among the possible active phases, V oxide (VOx) has beenthe most widely investigated, because when loaded in a properamount on a suitable support, it leads to promising yields ofethylene [7–10], propylene [6,7,11,12], or butenes [8]. Manydifferent supports have been tested, including ZrO2 [13,14],TiO2 [12], V-substituted zeolites or silicalites [15], SiO2 [9,13,16], and Al2O3, usually as the γ -phase [6–8,10–13,17]. Mostof the previous investigations have examined the effect of Vloading in determining active species distribution and the roleof the support on V surface dispersion. The acidity of the sup-port can negatively affect selectivity when low V loading leaves
46 I. Rossetti et al. / Journal of Catalysis 256 (2008) 45–61
naked acid sites, particularly in the case of alumina-supportedsamples [8].
The reaction can be kinetically modeled through a Mars–van Krevelen mechanism centered on V reduction and subse-quent reoxidation [6,12]. Indeed, the first reaction step involvesV5+, which reduces to V4+ and then to V3+. The active ox-idized VOx sites can be promptly restored by oxygen whenco-fed with the paraffin. The nature of such active sites hasbeen widely investigated [13,18,19]; it seems that V5+ is dis-persed on the support in the form of isolated vanadate species,which progressively oligomerize and polymerize with increas-ing V loading until a monolayer is formed. Different V load-ings and/or V surface densities corresponding to monolayerformation have been reported, depending on the support andon calcination conditions [10,13,18,20,21]. High activity is as-cribed to vanadate species, either isolated or polymerized upto the formation of a VOx monolayer, whereas lower activityis usually associated with the presence of bulk V2O5. As forselectivity, a possible role of the support cannot be excluded,especially with samples characterized by strong Lewis acid-ity [11]. In such cases, high selectivity can be achieved whena VOx monolayer completely covers the support. V loadingcorresponding to monolayer formation is different for differ-ent supports, depending on the V–support affinity. It has beenshown [13] that samples supported on SiO2 mainly constituteisolated VOx species up to a surface density of ca. 2 V/nm2.On a further increase in V loading, V2O5 formed, thereby di-minishing catalyst performance. In contrast, alumina- or titania-supported samples showed higher surface density (7–8 V/nm2),corresponding to polymeric vanadyl species. With the lattersupports, it was difficult to attain high V dispersion except byexcessively decreasing V loading, with a consequent deteriora-tion of catalytic activity.
The catalysts described so far are usually prepared by im-pregnation, leading to deposition of vanadium onto the surfaceof the selected support. To the best of our knowledge, to dateno study has been carried out on the possible preparation ofnanostructured V-supported catalysts for the present applica-tion. A new procedure based on flame pyrolysis (FP) of anorganic solution of metal ion precursors has been devised forthe preparation of different single or mixed oxides [22–29].Consequently, the catalysts considered in the present work wereprepared by FP, with the aim of developing systems in which theactive component is dispersed inside the inert matrix (silica inthe present case) instead of being deposited over it. In principle,the dilution inside porous silica should allow better dispersionof the active component, thereby providing also better controlof the heat generated by the reaction and hence a decrease inlocal hot spots, which may be detrimental to process selectiv-ity. A similar result can be achieved by the sol–gel method,which also leads to the incorporation/occlusion of metal oxidenanoparticles inside silica [30] or alumina. But with respect tothe sol–gel method, FP offers the advantage of (i) better controlof the preparation procedure and hence of the physicochemicalproperties of the final material, and (ii) preferred formation ofnanosized agglomerates. Furthermore, the classical preparationprocedures for silica- (or siliceous materials-) supported vana-
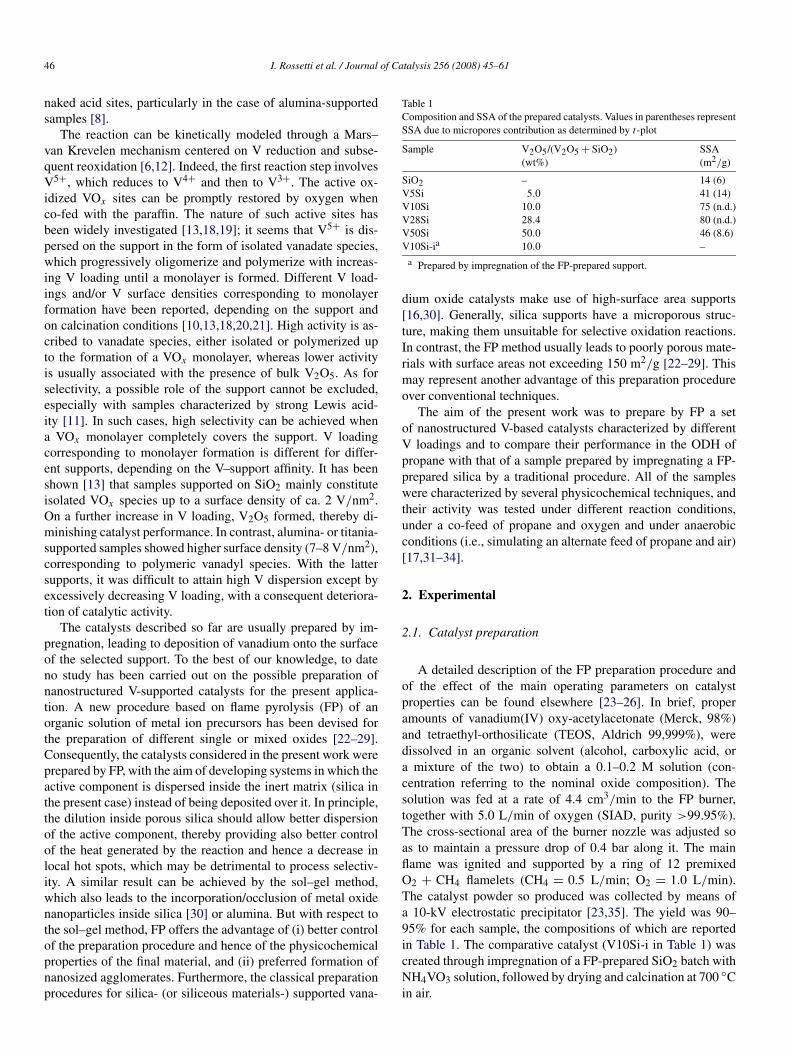
Table 1Composition and SSA of the prepared catalysts. Values in parentheses representSSA due to micropores contribution as determined by t -plot
Sample V2O5/(V2O5 + SiO2)(wt%)
SSA(m2/g)
SiO2 – 14 (6)V5Si 5.0 41 (14)V10Si 10.0 75 (n.d.)V28Si 28.4 80 (n.d.)V50Si 50.0 46 (8.6)V10Si-ia 10.0 –
a Prepared by impregnation of the FP-prepared support.
dium oxide catalysts make use of high-surface area supports[16,30]. Generally, silica supports have a microporous struc-ture, making them unsuitable for selective oxidation reactions.In contrast, the FP method usually leads to poorly porous mate-rials with surface areas not exceeding 150 m2/g [22–29]. Thismay represent another advantage of this preparation procedureover conventional techniques.
The aim of the present work was to prepare by FP a setof nanostructured V-based catalysts characterized by differentV loadings and to compare their performance in the ODH ofpropane with that of a sample prepared by impregnating a FP-prepared silica by a traditional procedure. All of the sampleswere characterized by several physicochemical techniques, andtheir activity was tested under different reaction conditions,under a co-feed of propane and oxygen and under anaerobicconditions (i.e., simulating an alternate feed of propane and air)[17,31–34].
2. Experimental
2.1. Catalyst preparation
A detailed description of the FP preparation procedure andof the effect of the main operating parameters on catalystproperties can be found elsewhere [23–26]. In brief, properamounts of vanadium(IV) oxy-acetylacetonate (Merck, 98%)and tetraethyl-orthosilicate (TEOS, Aldrich 99,999%), weredissolved in an organic solvent (alcohol, carboxylic acid, ora mixture of the two) to obtain a 0.1–0.2 M solution (con-centration referring to the nominal oxide composition). Thesolution was fed at a rate of 4.4 cm3/min to the FP burner,together with 5.0 L/min of oxygen (SIAD, purity >99.95%).The cross-sectional area of the burner nozzle was adjusted soas to maintain a pressure drop of 0.4 bar along it. The mainflame was ignited and supported by a ring of 12 premixedO2 + CH4 flamelets (CH4 = 0.5 L/min; O2 = 1.0 L/min).The catalyst powder so produced was collected by means ofa 10-kV electrostatic precipitator [23,35]. The yield was 90–95% for each sample, the compositions of which are reportedin Table 1. The comparative catalyst (V10Si-i in Table 1) wascreated through impregnation of a FP-prepared SiO2 batch withNH4VO3 solution, followed by drying and calcination at 700 ◦Cin air.

I. Rossetti et al. / Journal of Catalysis 256 (2008) 45–61 47
2.2. Catalyst characterization
Specific surface area (SSA) was measured by N2 adsorp-tion/desorption at the temperature of liquid nitrogen on a Mi-cromeritics ASAP 2010 apparatus. Microporosity, when rele-vant, was determined by the t -plot procedure. Morphologicalanalysis was done with a LEICA LEO 1430 scanning elec-tron microscope. XRD analysis was conducted using a PhilipsPW1820 powder diffractometer with a Ni-filtered CuKα radi-ation source (λ = 1.5148 Å). The diffractograms thus obtainedwere compared with literature data for phase recognition [36].Thermogravimetric analysis (TGA) of the as-prepared powderwas done in flowing air using a Perkin–Elmer TGA7 analyzer.Electron paramagnetic resonance (EPR) spectra were collectedbetween −153 and 27 ◦C in air using a Bruker Elexsys instru-ment, equipped with a standard rectangular ER4102ST cav-ity and operated at X band, 6.36-mW microwave power, and100-kHz Gauss modulating amplitude. The intensity of themagnetic field was carefully checked with a Bruker ER35MTeslameter, and the microwave frequency was measured witha HP 5340A frequency meter. Spectral simulations, when re-quired, were done using the Bruker SimFonia program.
Laser-Raman spectra were obtained using a Renishaw 1000instrument coupled with a Linkam thermal cell TS 1500; thesamples were excited with the 514-nm Ar line under N2 at-mosphere. For FT-IR measurements in the low wavenumberrange, powder samples were mixed with optical-grade KBr.For further FT-IR measurements, powder samples were pressedinto thin, self-supporting wafers and pretreated in high vac-uum (residual pressure <10−3 mbar) using a standard vacuumframe, in a IR cell equipped with KBr windows. Spectra werecollected at 2-cm−1 resolution on a Bruker FTIR Equinox 55spectrophotometer equipped with an MCT detector. To removemoisture and other atmospheric contaminants, the wafers wereoutgassed for 1 h at 150, 300, and 500 ◦C before adsorptionof CO or NH3. CO adsorption spectra were collected at thetemperature of liquid nitrogen by dosing increasing amountsof CO (in the 0.05–15.0 mbar equilibrium pressure range)on outgassed samples, inside a special quartz IR cell that al-lowed simultaneous dosing of carbon monoxide and additionof liquid N2. NH3 was dosed at room temperature in the 0.01–23.0 mbar equilibrium pressure range, after which the reversiblefraction of adsorbate was removed by prolonged evacuation.After each experiment, an evacuation step was performed tostudy the reversibility of the interaction.
2.3. Catalytic activity tests
Catalytic activity was measured by means of a continuousquartz tubular reactor (7 mm i.d.) heated by an electric fur-nace. The catalyst (0.90 mL, 0.5–0.6 g, 425–600 µm particlesize) was activated before each run in 20 cm3/min of flow-ing air as the temperature was increasing by 10 ◦C/min up to550 ◦C, then maintained there for 1 h. The flow rate of the re-actant mixture for the co-feeding mode test was 11 cm3/min ofC3H8 (20 mol%)+11 cm3/min of O2 (20 mol%)+28 cm3/minof He + 4 cm3/min of N2 (60 mol% inert). For the anaero-
bic mode, flow rates were 6 cm3/min of C3H8 (22 mol%) +19 cm3/min of He + 2 cm3/min of N2. Contact time was 1 sfor the former testing mode and 2 s for the latter testing mode.The exiting gas was analyzed by means of a micro gas chro-matograph (Agilent 3000A), equipped with Plot-Q, OV-1, andMS-5A columns for complete detection of the effluent products.Propane conversion was calculated as the conversion over fedpropane mol. The selectivity to the ith product was calculatedas mol of generated ith species over mol of converted propane,normalized with respect to the reaction stoichiometry. Carbonbalance was calculated as the sum of selectivity to the variousspecies.
3. Results and discussion
3.1. Catalyst preparation and characterization
Solubility tests revealed that the best solvent with fuel prop-erties for the V precursor was ethanol, whereas good misci-bility of the Si precursor was found with both ethanol andpropionic acid. But when the latter solvent was used in a1:1 (vol/vol) ratio with the ethanol solution of V, some prob-lems were encountered at low V loadings (�10%), involvinga much more difficult precursor decomposition in the flame.This very likely was due to the lower amount of VOx phaseformed, which plays a role in catalyzing the oxidation of boththe solvent and the organic compounds during synthesis (videinfra). Furthermore, a lower flame temperature was attainedwith the ethanol + propionic acid mixture, likely leading togreater surface area and smaller particle size with respect tothe ethanol + 1-octanol fuel mixture [26], which was added toincrease the combustion enthalpy of the solvent mixture.
During FP, complete combustion of the organic compounds(both solvent and reagents) should be achieved, along with si-multaneous formation of the desired oxides. However, someunburnt carbonaceous residue usually is found in the latter;their amounts can be estimated through TGA analysis in flow-ing air (Table 2). Basically, two peaks were observed, one atlow temperature (80–170 ◦C), attributed to residual solvent, andthe other at higher temperature (500–550 ◦C), attributed to un-burnt carbonaceous species. At low V content, the area of thelower-temperature TGA peak was comparable to that of thehigh-temperature TGA peak. Furthermore, the latter shifted to-ward lower temperature and decreased in intensity with increas-ing V-loading. This indicates that during catalyst preparation,the presence of a phase active for oxidation reactions facili-tates precursor decomposition. In addition, the samples with
Table 2Weight loss during TGA analysis and temperature of the main peaks observed
Sample 1st peak T
(◦C)2nd peak T
(◦C)Totalwt% loss
2nd peakwt% loss
SiO2 80 515 3.7 1.7V5Si 170 550 6.3 1.4V10Si 170 520 2.9 0.7V28Si 90 520 7.8 1.0V50Si 105 495 5.5 0.3

48 I. Rossetti et al. / Journal of Catalysis 256 (2008) 45–61
Fig. 1. SEM micrographs of the prepared samples. Marker size: 500 nm except for V28Si (1 µm).
low V-loading also demonstrated additional peaks between 150and 350 ◦C, confirming the difficult decomposition of the pre-cursors.
XRD analysis revealed amorphous or sub-microcrystallinepowders only, along with the absence of V-based phases for Vloadings <28%. A fully reliable V-based phase identificationwas possible only for the V50Si sample, which demonstratedthe V2O5 phase reflection peaks [36, file 009-0387]; however,these results must be compared with those from Raman andIR spectroscopy (vide infra), which can reveal the presence ofvanadia down to V loadings below than that demonstrated byXRD.
SEM images (Fig. 1) showed a poorly defined morphologyfor every sample, likely associated with the amorphous struc-ture. However, at high V loading (V50Si), the sample seemedto organize in small (ca. 100 nm) spheroidal particles.
Our findings are partly associated with the nature of the se-lected materials and partly associated with solvent/fuel choice.Indeed, the use of alcohols did not yield small and homoge-
neous particle sizes for other catalyst compositions [27,28];however, the increased particle size uniformity at high V load-ings seems to confirm the beneficial effect of this element dur-ing catalyst preparation.
SSA was minimal for the pure silica support (Table 1), in-creased with increasing V loading up to 28% V (sample V28Si),and then decreased thereafter. Higher SSAs can be expectedwhen using carboxylic acids, basically because of their decom-position route, involving acid decarboxylation with formationof a low-boiling alkane, allowing further fragmentation of theforming particles during solvent flash [37]. Comparing micro-porous area (as determined by t -plot analysis) with BET SSA(Table 1) demonstrates that despite the low surface area of SiO2,44% of that value can be ascribed to the contribution of microp-ores. It should be noted that in the FP-prepared nanosized sam-ples, microporosity is likely related to interparticle voids ratherthan to intraparticle porosity. On the addition of V, microporesurface area decreased progressively with increasing V loading.Keeping in mind the aforementioned considerations on catalyst

I. Rossetti et al. / Journal of Catalysis 256 (2008) 45–61 49
Fig. 2. EPR spectrum of sample V50Si. Upper track, experimental; lower track,computer simulation with the spectral parameters reported in Table 3 and cor-responding to isolated (monovadates) V4+Ox species.
Table 3EPR experimental parameters
g‖ g⊥ Ba A‖(G)
A⊥(G)
�W‖(G)b
�W⊥(G)b
V10Si 1.940 1.985 3.60 194 77 20 15V10Si-i 1.942 1.985 3.50 194 77 20 15
a From Eq. (1).b Lorentzian-shaped line width.
morphology, the decrease in particle size can be indirectly con-firmed. Indeed, a slightly higher surface area was obtained withincreasing V loading (along with a decreased contribution ofmicropores).
3.2. EPR analysis
The EPR spectral profile of the VOx /SiO2 samples wasnearly independent of V loading, whereas the samples’ spectralintensity increased ca. fourfold with increasing V concentra-tion from 5 to 10%, then remained approximately constant athigher V concentrations. Fig. 2 compares the most intense EPRpattern, obtained with the V50Si sample, with the simulationobtained with the parameters reported in Table 3, which are typ-ical of V4+ ions.
With V2O5/SiO2 catalysts, EPR spectra of this kind havebeen attributed to V4+ species in monolayers and double layersof V2O5 supported on SiO2 in average C4v symmetry [38,39].This corresponds to an array of oxygen ligands lying parallelto the surface around a V4+–O bond perpendicular to it. Thefinding that g‖ < g⊥ can be attributed to tetragonal distortion.It has been shown [40] that a higher value of the parameter
(1)B = (g‖ − ge)/(g⊥ − ge)
indicates a shortened V4+–O bond or an increased distance ofthe oxygen ligands in the basal plane. Both of these situationswould lead to strengthening of the V4+–O bond. In the presentcase, B ∼= 3.60 (Table 3) is considerably higher than the val-ues obtainable with the data reported previously for SiO2–V4+monolayers (B ca. 2.41–3.10) and SiO2–V4+ double layers(B ca. 2.24–2.65) [40]. Thus, our relatively high value for B in-dicates that no more than a monolayer of SiO2–V4+ was presenton the surface.
Thermal treatment in vacuo at 300 ◦C, with likely conse-quent loss of oxygen, had no significant effect on the spectral
Fig. 3. EPR spectra at r.t. of sample V28Si: (a) as prepared, (b) after deoxy-genation, (c) after catalytic use under anaerobic conditions and deoxygenation.
Fig. 4. EPR spectra of sample V10Si-i at (a) −154 ◦C, (b) 25 ◦C and (c) 127 ◦C.F1, F2 and F3 indicate ferromagnetic resonance features.
profile and sometimes simply increased its intensity slightly(Fig. 3b). In contrast, the spectral intensity increased markedlyafter the catalytic reaction under anaerobic conditions (Fig. 3c);this can be explained by considering that the catalytically activecenters are V5+, which reduce during reaction in the absence ofco-fed oxygen, leading to an increase in the EPR-active V4+species. Therefore, the latter represent an intermediate of thecatalytic process.
Unlike FP samples, which exhibited EPR spectra related toisolated V4+ species, the spectrum of the V10Si-i sample com-prised three regions (Fig. 4): the first (F1) centered at ca. 250 G,the second (F2) centered at ca. 2500 G, and the third (F3) cen-tered at ca. 3390 G (corresponding to g = 1.98). Bands likethese have been attributed to ferromagnetic resonance (FMR)of clusters of particles of different shapes and sizes [41–45].Systems of this kind were not observed with our FP-preparedsamples, in which the V-based active centers were likely dis-persed uniformly and not interacting with each other.
A further paramagnetic contribution, P, was added to F3(Fig. 4a). Its hyperfine pattern can be easily interpreted by sub-tracting the component F3 of the spectra of Fig. 4 spectrumb or c (multiplied by a proper factor) from the spectral regionF3 + P of spectrum a. In this way, the EPR pattern P appeared,very similar to that of the FP samples (Fig. 2). The only dif-ference is that here the value of g‖, 1.942, is slightly higher

50 I. Rossetti et al. / Journal of Catalysis 256 (2008) 45–61
Fig. 5. Raman spectra, in the 200–1200 cm−1 range, recorded with samples V10Si, V28Si, V50Si and V10Si-i (curves a, b, c and d, respectively). Inset to figure:magnification of curve a (V10Si).
than that of 1.940 characterizing the FP-prepared sample. Thespectral simulation (not reported) confirms this very small dif-ference, leading to a value B ∼= 3.5 for V10Si-i, lower than thevalue B = 3.6 found for V10Si, the former corresponding to aslightly lower V4+–O bond strength in the V10Si-i catalyst.
3.3. Micro-Raman spectroscopy
Fig. 5 reports the Raman spectra of powder samples in the200–1200 cm−1 range. The inset reports the magnified spec-trum of sample V10Si (curve a), which shows two weak bandsat 1027 and 512 cm−1, which can be readily assigned to iso-lated V=O species [46]. At higher V loadings (curves b and c)and with sample V10Si-i (dotted curve d), the typical bands ofcrystalline V2O5 can be seen at 285, 304, 404, 482, 525, 701,and 995 cm−1 [46–48], whereas no bands were observed on theV5Si sample, which had the lowest V content (results not re-ported). On the whole, monovanadates were detected only withsample V10Si, whereas both at higher V loadings and after im-pregnation, the preferential formation of bulk vanadia occurred.
Possibly formed even with silica-supported samples pre-pared following this new synthetic procedure, oligomericspecies would be evidenced by the appearance of Raman bandsat 750–900 cm−1 due to V–O–V stretching in spectra col-lected on dehydrated samples. In contrast, the band appearingat 1027 cm−1 in dehydrated samples and ascribed to V=O isdue to both isolated and oligomeric species. Raman spectra ofthe V10Si sample are reported in Fig. 6, with the data collectedwith prolonged accumulation to increase the signal resolution.Very intense bands due to monomeric species were present, andno oligomeric species were observed on both the fresh sampleand after dehydration at 200 ◦C. It is interesting that no dra-matic change in spectral profile occurred after dehydration.
3.4. FT-IR analysis: KBr pellets
Fig. 7 reports the FT-IR spectra of powders in KBr pelletsin the 1500–600 cm−1 range, where vibrational modes of thesolid absorb. Band envelopes 1 (1300–1100 cm−1) and 2 (ca.800 cm−1) can be assigned to the asymmetric and symmetricstretch vibrations of Si–O–Si (siloxane) groups of silica, re-spectively [49]. With all of the samples except V10Si-i (curvesa–d), band 3 was seen at 930 cm−1. This band was previouslyobserved in V/silica and V/silicalite systems [48,49] (i.e., amor-phous silica and all-silica zeolite incorporating V) and was as-signed to the vibration of SiO4 groups strongly polarized bythe presence of framework vanadium. Such species were notseen with the sample obtained by impregnation (dotted curvee), demonstrating the incorporation of vanadium in the silicaframework in samples prepared by FP.
At higher vanadium content (curves b–d), a component de-veloped at 1010 cm−1 (band 4), which can be assigned [46–48]to crystalline V2O5, in agreement with Raman spectra (Fig. 5).
3.5. FT-IR analysis: Hydroxyl spectra
Fig. 8A reports the FT-IR spectra in the hydroxyl range(3800–3100 cm−1) of sample V10Si outgassed at 150, 300,and 500 ◦C. The spectra exhibited a band at 3745–3742 cm−1,assigned to isolated silanols, which are commonly seen at thesurface of amorphous silica [50]. On V10Si outgassed at 150and 300 ◦C (curves a and b), the bands of H-bonded silanolsappeared as a weak component at about 3720 cm−1 (asterisk)and a broad absorption below 3700 cm−1. The former can be as-signed to terminal silanols of H-bonded SiOH chains, whereasH-bonded silanols inside the chains absorb below 3700 cm−1

I. Rossetti et al. / Journal of Catalysis 256 (2008) 45–61 51
Fig. 6. Raman spectra of sample V10Si (prolonged acquisition time). Comparison between the fresh sample and after dehydration at 200 ◦C.
Fig. 7. FT-IR spectra, in the 1500–600 cm−1 range of samples V5Si, V10Si, V28Si, V50Si and V10Si-i (curves a, b, c, d and e, respectively) in KBr pellets.
Fig. 8. (A) FT-IR spectra, in the 3800–3000 cm−1 range, of sample V10Si outgassed at 150 (curve a), 300 (curve b) and 500 ◦C (curve c). (B) Normalized FT-IRspectra, in the 3800–3000 cm−1 range, of samples V5Si (curve a), V10Si (curve b), V28Si (curve c) and V10Si-i (curve d) out gassed at 500 ◦C.
52 I. Rossetti et al. / Journal of Catalysis 256 (2008) 45–61
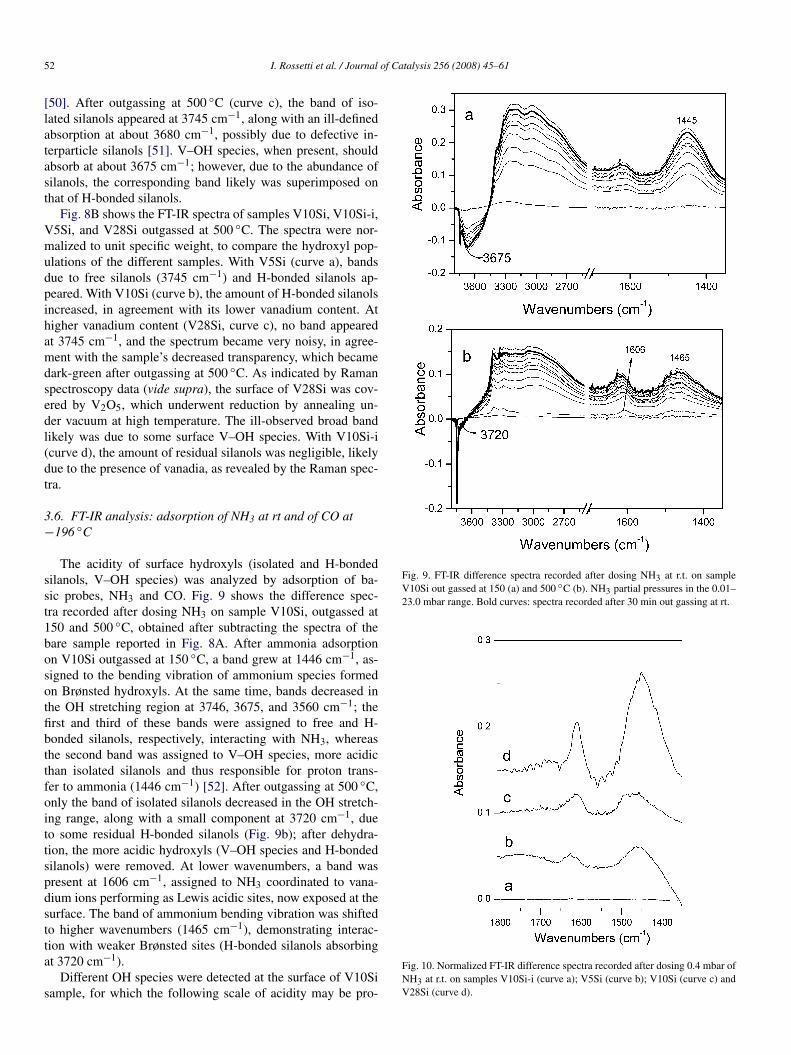
[50]. After outgassing at 500 ◦C (curve c), the band of iso-lated silanols appeared at 3745 cm−1, along with an ill-definedabsorption at about 3680 cm−1, possibly due to defective in-terparticle silanols [51]. V–OH species, when present, shouldabsorb at about 3675 cm−1; however, due to the abundance ofsilanols, the corresponding band likely was superimposed onthat of H-bonded silanols.
Fig. 8B shows the FT-IR spectra of samples V10Si, V10Si-i,V5Si, and V28Si outgassed at 500 ◦C. The spectra were nor-malized to unit specific weight, to compare the hydroxyl pop-ulations of the different samples. With V5Si (curve a), bandsdue to free silanols (3745 cm−1) and H-bonded silanols ap-peared. With V10Si (curve b), the amount of H-bonded silanolsincreased, in agreement with its lower vanadium content. Athigher vanadium content (V28Si, curve c), no band appearedat 3745 cm−1, and the spectrum became very noisy, in agree-ment with the sample’s decreased transparency, which becamedark-green after outgassing at 500 ◦C. As indicated by Ramanspectroscopy data (vide supra), the surface of V28Si was cov-ered by V2O5, which underwent reduction by annealing un-der vacuum at high temperature. The ill-observed broad bandlikely was due to some surface V–OH species. With V10Si-i(curve d), the amount of residual silanols was negligible, likelydue to the presence of vanadia, as revealed by the Raman spec-tra.
3.6. FT-IR analysis: adsorption of NH3 at rt and of CO at−196 ◦C
The acidity of surface hydroxyls (isolated and H-bondedsilanols, V–OH species) was analyzed by adsorption of ba-sic probes, NH3 and CO. Fig. 9 shows the difference spec-tra recorded after dosing NH3 on sample V10Si, outgassed at150 and 500 ◦C, obtained after subtracting the spectra of thebare sample reported in Fig. 8A. After ammonia adsorptionon V10Si outgassed at 150 ◦C, a band grew at 1446 cm−1, as-signed to the bending vibration of ammonium species formedon Brønsted hydroxyls. At the same time, bands decreased inthe OH stretching region at 3746, 3675, and 3560 cm−1; thefirst and third of these bands were assigned to free and H-bonded silanols, respectively, interacting with NH3, whereasthe second band was assigned to V–OH species, more acidicthan isolated silanols and thus responsible for proton trans-fer to ammonia (1446 cm−1) [52]. After outgassing at 500 ◦C,only the band of isolated silanols decreased in the OH stretch-ing range, along with a small component at 3720 cm−1, dueto some residual H-bonded silanols (Fig. 9b); after dehydra-tion, the more acidic hydroxyls (V–OH species and H-bondedsilanols) were removed. At lower wavenumbers, a band waspresent at 1606 cm−1, assigned to NH3 coordinated to vana-dium ions performing as Lewis acidic sites, now exposed at thesurface. The band of ammonium bending vibration was shiftedto higher wavenumbers (1465 cm−1), demonstrating interac-tion with weaker Brønsted sites (H-bonded silanols absorbingat 3720 cm−1).
Different OH species were detected at the surface of V10Sisample, for which the following scale of acidity may be pro-
Fig. 9. FT-IR difference spectra recorded after dosing NH3 at r.t. on sampleV10Si out gassed at 150 (a) and 500 ◦C (b). NH3 partial pressures in the 0.01–23.0 mbar range. Bold curves: spectra recorded after 30 min out gassing at rt.
Fig. 10. Normalized FT-IR difference spectra recorded after dosing 0.4 mbar ofNH3 at r.t. on samples V10Si-i (curve a); V5Si (curve b); V10Si (curve c) andV28Si (curve d).
I. Rossetti et al. / Journal of Catalysis 256 (2008) 45–61 53
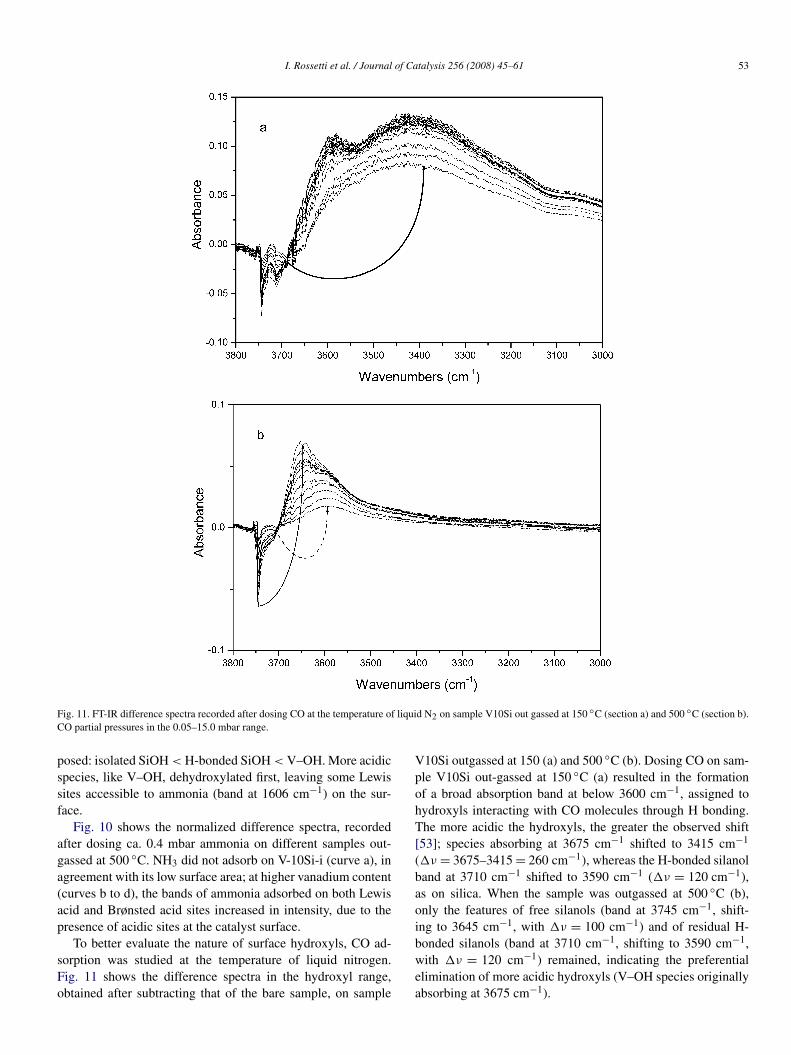
Fig. 11. FT-IR difference spectra recorded after dosing CO at the temperature of liquid N2 on sample V10Si out gassed at 150 ◦C (section a) and 500 ◦C (section b).CO partial pressures in the 0.05–15.0 mbar range.
posed: isolated SiOH < H-bonded SiOH < V–OH. More acidicspecies, like V–OH, dehydroxylated first, leaving some Lewissites accessible to ammonia (band at 1606 cm−1) on the sur-face.
Fig. 10 shows the normalized difference spectra, recordedafter dosing ca. 0.4 mbar ammonia on different samples out-gassed at 500 ◦C. NH3 did not adsorb on V-10Si-i (curve a), inagreement with its low surface area; at higher vanadium content(curves b to d), the bands of ammonia adsorbed on both Lewisacid and Brønsted acid sites increased in intensity, due to thepresence of acidic sites at the catalyst surface.
To better evaluate the nature of surface hydroxyls, CO ad-sorption was studied at the temperature of liquid nitrogen.Fig. 11 shows the difference spectra in the hydroxyl range,obtained after subtracting that of the bare sample, on sample
V10Si outgassed at 150 (a) and 500 ◦C (b). Dosing CO on sam-ple V10Si out-gassed at 150 ◦C (a) resulted in the formationof a broad absorption band at below 3600 cm−1, assigned tohydroxyls interacting with CO molecules through H bonding.The more acidic the hydroxyls, the greater the observed shift[53]; species absorbing at 3675 cm−1 shifted to 3415 cm−1
(�ν = 3675–3415 = 260 cm−1), whereas the H-bonded silanolband at 3710 cm−1 shifted to 3590 cm−1 (�ν = 120 cm−1),as on silica. When the sample was outgassed at 500 ◦C (b),only the features of free silanols (band at 3745 cm−1, shift-ing to 3645 cm−1, with �ν = 100 cm−1) and of residual H-bonded silanols (band at 3710 cm−1, shifting to 3590 cm−1,with �ν = 120 cm−1) remained, indicating the preferentialelimination of more acidic hydroxyls (V–OH species originallyabsorbing at 3675 cm−1).
54 I. Rossetti et al. / Journal of Catalysis 256 (2008) 45–61
The high concentration of Si–OH groups and also of V–OH,given the relatively low surface area of the samples, is likelydue to the development of a metastable oxide at the high tem-perature at which oxide formation occurred in the flame. Theadopted preparation method led to materials in which V waspartly embedded in the silica matrix and the rapid dehydra-tion forced the structure to adopt V–O–Si and Si–O–Si strainedbonds, which were rapidly hydrolyzed during cooling in wetair. This gave rise to V–OH species with acidity close to thatof the V–OH found in V/silicalite [49] and V supported onhigh surface SiO2 [48], but formed through a different process.An alternative explanation can be sought in the complex rad-ical reactions occurring in the flame, where OH can attackthe V and Si precursors as well as peroxide radicals, whichsubsequently evolve into the oxide. The intermediate hydroxylshould decompose by dehydration, but this cannot occur if rapidquenching occurs. Similar phenomena have been observed withdifferent materials with residual carbonate species, although theflame temperature during synthesis was far higher than that ofcarbonate decomposition [24–26]. This effect would explain thehigh concentration of hydroxyls in our FP samples and the sta-bilization of vanadium into the silica matrix.
3.7. Catalytic activity
The catalytic activity of all samples was compared both byco-feeding propane and oxygen (co-feeding mode) and underanaerobic conditions corresponding to the first step of the cyclicredox-decoupling mode, in which the feed of the hydrocarbon isalternated with that of oxygen. The latter procedure allows theinvestigator to alternate reaction and regeneration steps, therebypreventing the co-presence of propane and oxygen. This pro-vides for safer operation and can improve catalyst selectivity topropylene.
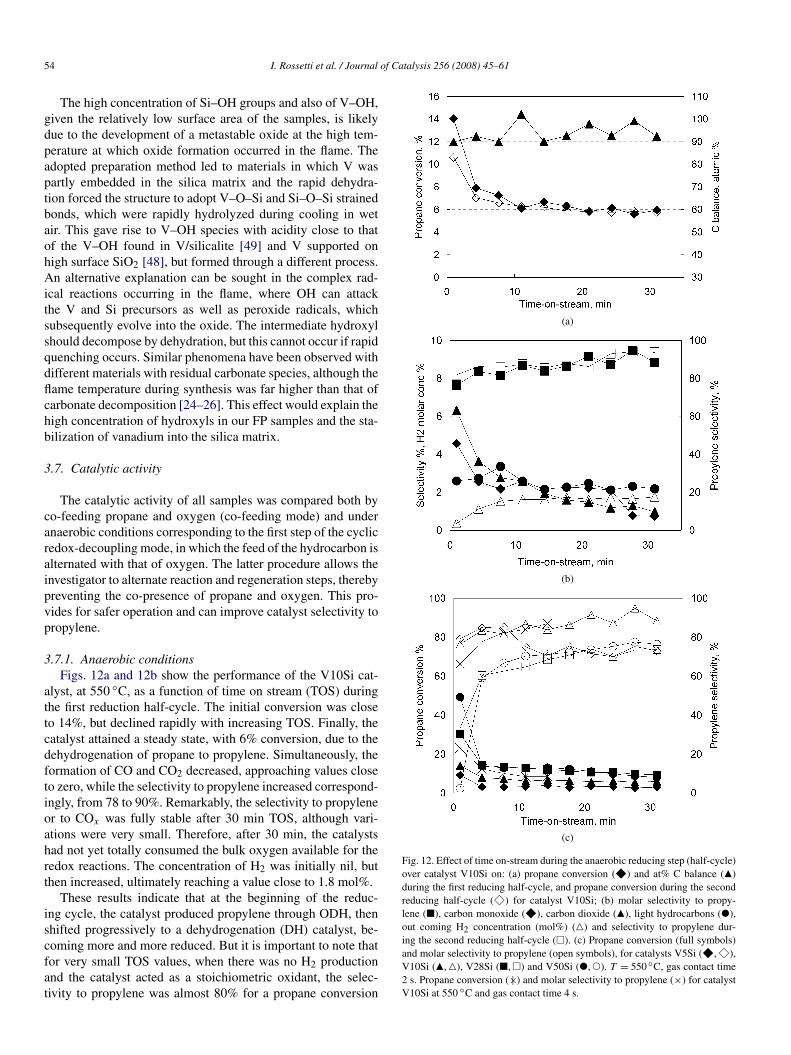
3.7.1. Anaerobic conditionsFigs. 12a and 12b show the performance of the V10Si cat-
alyst, at 550 ◦C, as a function of time on stream (TOS) duringthe first reduction half-cycle. The initial conversion was closeto 14%, but declined rapidly with increasing TOS. Finally, thecatalyst attained a steady state, with 6% conversion, due to thedehydrogenation of propane to propylene. Simultaneously, theformation of CO and CO2 decreased, approaching values closeto zero, while the selectivity to propylene increased correspond-ingly, from 78 to 90%. Remarkably, the selectivity to propyleneor to COx was fully stable after 30 min TOS, although vari-ations were very small. Therefore, after 30 min, the catalystshad not yet totally consumed the bulk oxygen available for theredox reactions. The concentration of H2 was initially nil, butthen increased, ultimately reaching a value close to 1.8 mol%.
These results indicate that at the beginning of the reduc-ing cycle, the catalyst produced propylene through ODH, thenshifted progressively to a dehydrogenation (DH) catalyst, be-coming more and more reduced. But it is important to note thatfor very small TOS values, when there was no H2 productionand the catalyst acted as a stoichiometric oxidant, the selec-tivity to propylene was almost 80% for a propane conversion
(a)
(b)
(c)
Fig. 12. Effect of time on-stream during the anaerobic reducing step (half-cycle)over catalyst V10Si on: (a) propane conversion (F) and at% C balance (Q)during the first reducing half-cycle, and propane conversion during the secondreducing half-cycle (E) for catalyst V10Si; (b) molar selectivity to propy-lene (2), carbon monoxide (F), carbon dioxide (Q), light hydrocarbons ("),out coming H2 concentration (mol%) (P) and selectivity to propylene dur-ing the second reducing half-cycle (1). (c) Propane conversion (full symbols)and molar selectivity to propylene (open symbols), for catalysts V5Si (F,E),V10Si (Q,P), V28Si (2,1) and V50Si (",!). T = 550 ◦C, gas contact time2 s. Propane conversion (×| ) and molar selectivity to propylene (×) for catalystV10Si at 550 ◦C and gas contact time 4 s.
I. Rossetti et al. / Journal of Catalysis 256 (2008) 45–61 55
of 12%. This confirms that the redox-decoupling concept mayindeed lead to an effective improvement of selectivity with re-spect to the co-feeding operation (vide infra).
Figs. 12a and 12b also show the catalytic performance forthe second reduction half-cycle, that is, after the reoxidationtreatment in air at 550 ◦C after the first cycle. The activity wasslightly lower than that observed after the first cycle. This ef-fect can be attributed to incomplete reoxidation of the reducedvanadium species, to incomplete removal of coke, or again tosome rearrangement of the V oxide structure as a consequenceof the highly exothermal oxidation treatment and the high lo-cal temperature developing on the catalyst surface during thistreatment.
Fig. 12c summarizes the catalytic performance for increas-ing amounts of vanadium oxide. The progressive reduction ofcatalyst led to improved selectivity to propylene, due to bothlower consecutive propylene oxidation and an increased contri-bution of propane dehydrogenation. The higher the V content,the greater the propane conversion, both at the very beginningof the reduction step (i.e., fully oxidized catalyst) and after30 min TOS. But the activity after 30 min was not directly pro-portional to the V content; in fact, the conversion achieved withthe V50Si sample matched that achieved with the V28Si sam-ple. This effect may be attributed to the significantly lower SSAvalue of the V50Si catalyst compared with the V28Si sample.
Furthermore, it is noteworthy that whereas V5Si and V10Siallowed stable performance already after 10 min TOS, V28Siand V50Si were not completely stable even after 30 min. Thisfinding can be attributed to two contrasting factors: (i) the pro-gressive migration of bulk O2− toward the surface, which stillallowed the catalyst to sustain the ODH reaction even afterprolonged exposure to the hydrocarbon feed, and (ii) the pro-gressive deactivation, most likely due to coke accumulation,resulting in a decline in catalyst activity.
For all of the catalysts, the amount of V oxide available forreduction was lower than the theoretical amount. Indeed, forV5Si, V10Si, and V28Si, the experimental weight loss (as cal-culated from the stoichiometry of reactions involved and fromthe integral values of propane conversion and selectivity toproducts) was approximately 25–30% that calculated for thecomplete reduction of V5+ to V3+. This is likely due to the factthat a fraction of the V oxide was embedded inside the catalystparticles and thus not in contact with the gas phase. Only for theV50Si catalyst did the fraction of V oxide that delivered oxy-gen attain 70% of the theoretical value. Moreover, for V/Si/Ocatalysts prepared by the co-gelation procedure [30], <50% ofV oxide was available for the reaction under anaerobic con-ditions. It should be noted that V4+ concentration, calculatedsemiquantitatively from EPR data, seemed to increase abruptlyfrom V5Si to V10Si, then levelled off with further increases inV loading. This can be explained by considering that when Vis highly dispersed and incorporated into the silica matrix, itcan more readily assume different oxidation states. In contrast,when significant V2O5 segregation occurs, a similar concentra-tion of V4+ is expected despite the increased V loading.
The hypothesis of coke accumulation on the catalyst duringanaerobic operation is supported by various experimental evi-
dence, including (i) the low final activity of V28Si and V50Si,in line with FT-IR data on NH3 and CO adsorption (vide supra);(ii) the experimental trend for H2 formation (vide infra); and(iii) the selectivity to propylene (close to 75%) after prolongedexposure to the hydrocarbon feed, which was lower than that(90–95%) obtained with V10Si (although comparable with thatof V5Si). The lower selectivity to the olefin was due to thepoorer C balance, on average 80–85% for V28Si and V50Si butclose to 95% for V10Si (Fig. 12a). This indicates the accumu-lation of coke on the catalyst surface. It is noteworthy that alsofor V5Si, the average C balance at 20–30 min TOS was closeto 85% and the selectivity to propylene was close to 75%. Thisindicates that under anaerobic conditions, the accumulation ofcoke was favored with those catalysts with the lowest (V5Si)and the highest (V28Si and V50Si) vanadium oxide content,demonstrating the relevant role of the support acidity in pro-moting coke formation with V5Si and also of the acidity of theV sites with high a degree of aggregation (i.e., in bulk vanadiumoxide) with V28Si and V50Si.
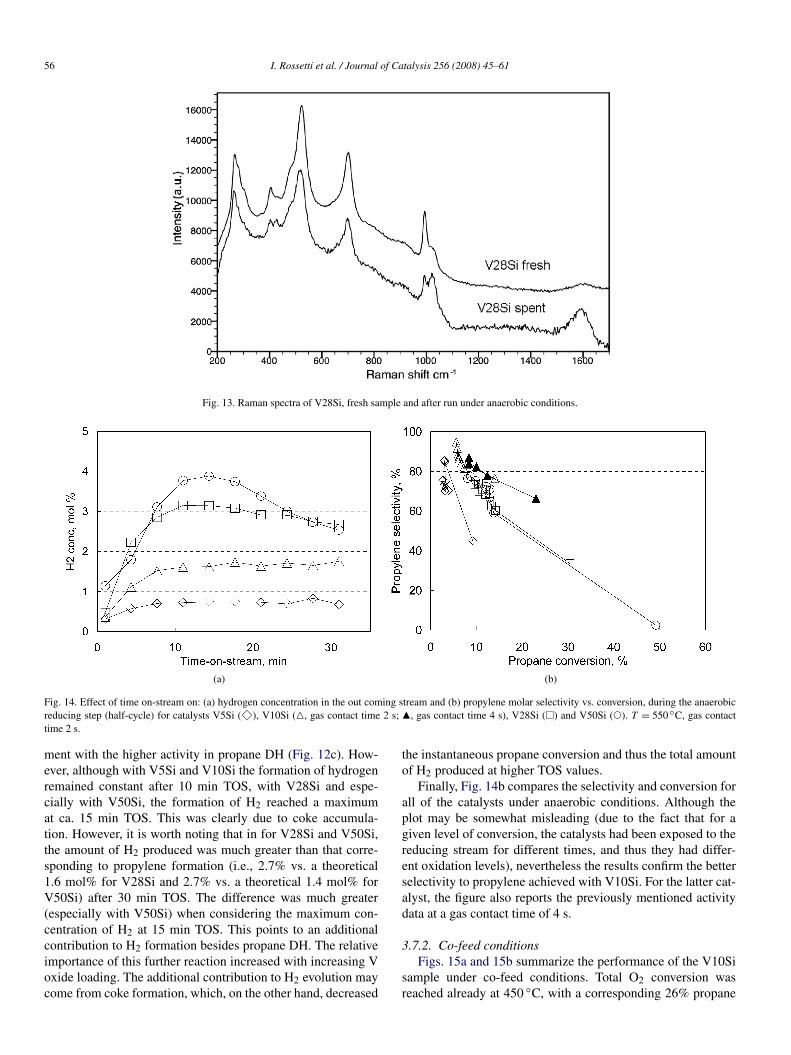
Further evidence of the formation of coke under anaerobicconditions was provided by the Raman spectra of spent cat-alysts (i.e., analyzed after the reducing step). Typical Ramanfeatures associated with the presence of coke were observed(Fig. 13). Furthermore, during the half-cycle reoxidation stepfor the reduced catalyst, the formation of CO2, along with mi-nor amounts of CO, was observed. The formation of these com-pounds was greatest during the first 8–10 min of treatment andbecame practically nil after approximately 15 min.
Taking the initial performance into consideration, the highactivity of V28Si and V50Si also corresponded to a lower se-lectivity to propylene. This is the consequence of the higheralkane conversion and greater degree of V aggregation, both ofwhich favor the consecutive reaction of propylene combustion.The V5Si and V10Si catalysts demonstrated the greatest initialselectivity; however, the former sample showed a decline in se-lectivity after the initial period. Thus, V10Si seems to representthe best compromise between the need to expose as much aspossible of the active component at the catalyst surface and theneed to maintain a high degree of V oxide dispersion.
To compare the performance of the differently loaded ma-terials (with strongly different activities) at a similar degreeof conversion and a similar degree of reduction, we carriedout tests with the V10Si catalyst at a gas contact time of 4 s(Fig. 12c). Under these conditions, the fully oxidized V10Sicatalyst allowed 23% propane conversion, with 66% selectiv-ity to propylene. This result can be compared with the perfor-mance of the fully oxidized V28Si catalyst, which allowed 30%propane conversion and 33% selectivity to propylene at 2 s ofgas contact time. It is evident that the V10Si catalyst, whichdoes not contain bulk vanadium oxide, was more selective topropylene than V28Si, which contains a certain amount of bulkvanadium oxide (as determined by spectroscopic analysis, suchas Raman).
The observed H2 formation (Fig. 14a) was close to zero forall catalysts at the beginning of the reaction and increased pro-gressively thereafter. The amount of hydrogen produced wasgreater for the samples with higher V oxide content, in agree-
56 I. Rossetti et al. / Journal of Catalysis 256 (2008) 45–61
Fig. 13. Raman spectra of V28Si, fresh sample and after run under anaerobic conditions.
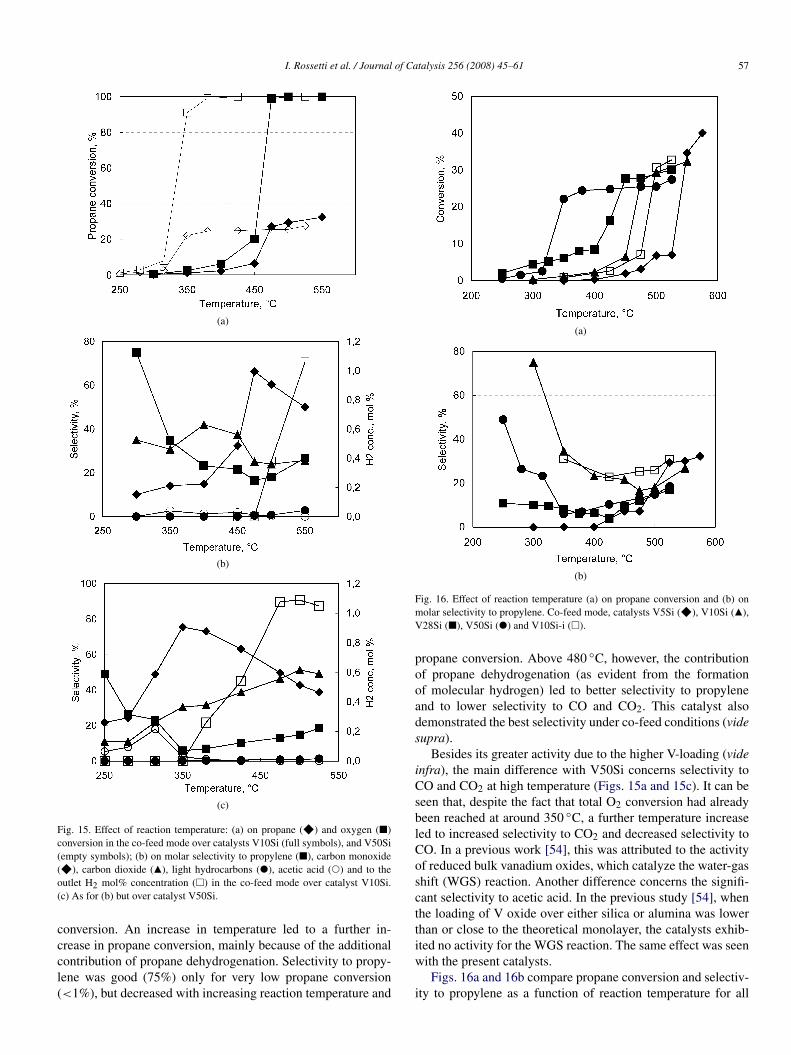
(a) (b)
Fig. 14. Effect of time on-stream on: (a) hydrogen concentration in the out coming stream and (b) propylene molar selectivity vs. conversion, during the anaerobicreducing step (half-cycle) for catalysts V5Si (E), V10Si (P, gas contact time 2 s; Q, gas contact time 4 s), V28Si (1) and V50Si (!). T = 550 ◦C, gas contact
time 2 s.ment with the higher activity in propane DH (Fig. 12c). How-ever, although with V5Si and V10Si the formation of hydrogenremained constant after 10 min TOS, with V28Si and espe-cially with V50Si, the formation of H2 reached a maximumat ca. 15 min TOS. This was clearly due to coke accumula-tion. However, it is worth noting that in for V28Si and V50Si,the amount of H2 produced was much greater than that corre-sponding to propylene formation (i.e., 2.7% vs. a theoretical1.6 mol% for V28Si and 2.7% vs. a theoretical 1.4 mol% forV50Si) after 30 min TOS. The difference was much greater(especially with V50Si) when considering the maximum con-centration of H2 at 15 min TOS. This points to an additionalcontribution to H2 formation besides propane DH. The relativeimportance of this further reaction increased with increasing Voxide loading. The additional contribution to H2 evolution maycome from coke formation, which, on the other hand, decreased
the instantaneous propane conversion and thus the total amountof H2 produced at higher TOS values.
Finally, Fig. 14b compares the selectivity and conversion forall of the catalysts under anaerobic conditions. Although theplot may be somewhat misleading (due to the fact that for agiven level of conversion, the catalysts had been exposed to thereducing stream for different times, and thus they had differ-ent oxidation levels), nevertheless the results confirm the betterselectivity to propylene achieved with V10Si. For the latter cat-alyst, the figure also reports the previously mentioned activitydata at a gas contact time of 4 s.
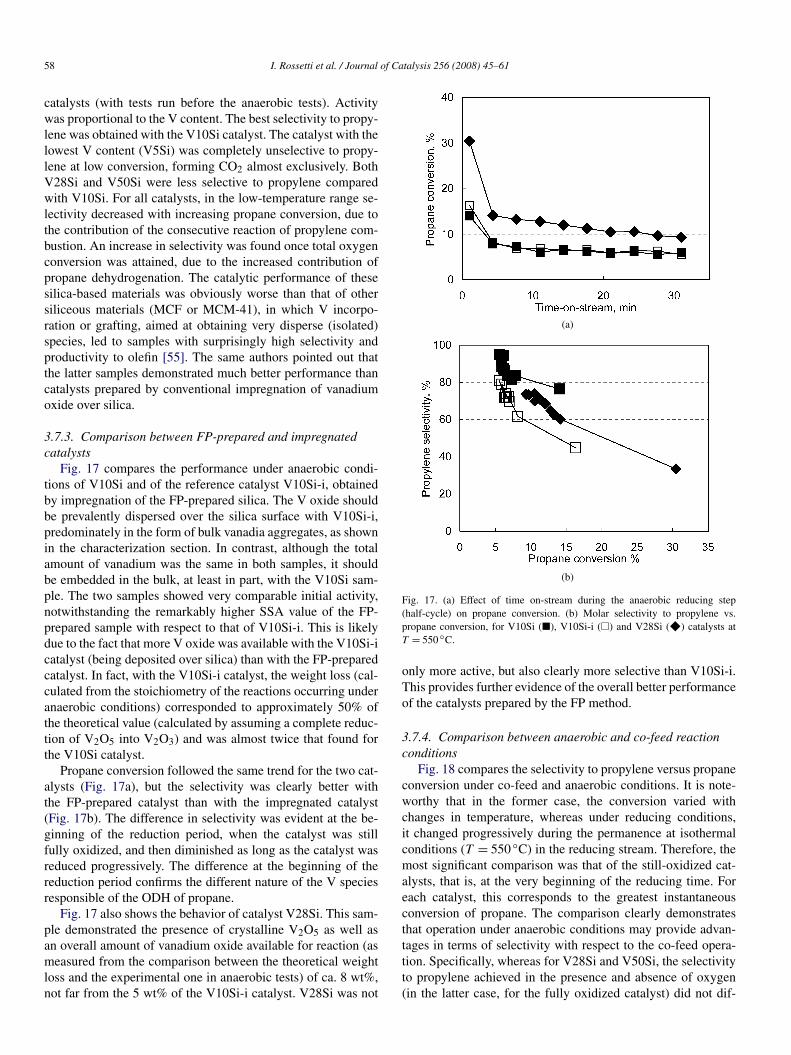
3.7.2. Co-feed conditionsFigs. 15a and 15b summarize the performance of the V10Si
sample under co-feed conditions. Total O2 conversion wasreached already at 450 ◦C, with a corresponding 26% propane
I. Rossetti et al. / Journal of Catalysis 256 (2008) 45–61 57
(a)
(b)
(c)
Fig. 15. Effect of reaction temperature: (a) on propane (F) and oxygen (2)conversion in the co-feed mode over catalysts V10Si (full symbols), and V50Si(empty symbols); (b) on molar selectivity to propylene (2), carbon monoxide(F), carbon dioxide (Q), light hydrocarbons ("), acetic acid (!) and to theoutlet H2 mol% concentration (1) in the co-feed mode over catalyst V10Si.(c) As for (b) but over catalyst V50Si.
conversion. An increase in temperature led to a further in-crease in propane conversion, mainly because of the additionalcontribution of propane dehydrogenation. Selectivity to propy-lene was good (75%) only for very low propane conversion(<1%), but decreased with increasing reaction temperature and
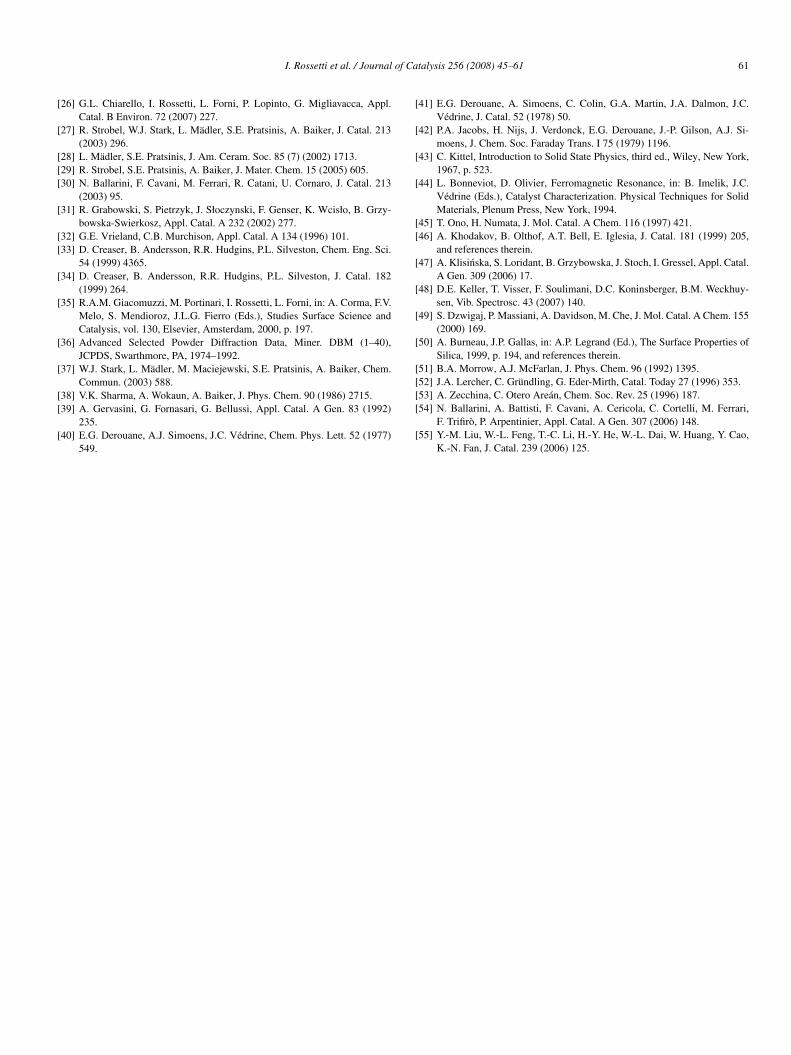
(a)
(b)
Fig. 16. Effect of reaction temperature (a) on propane conversion and (b) onmolar selectivity to propylene. Co-feed mode, catalysts V5Si (F), V10Si (Q),V28Si (2), V50Si (") and V10Si-i (1).
propane conversion. Above 480 ◦C, however, the contributionof propane dehydrogenation (as evident from the formationof molecular hydrogen) led to better selectivity to propyleneand to lower selectivity to CO and CO2. This catalyst alsodemonstrated the best selectivity under co-feed conditions (videsupra).
Besides its greater activity due to the higher V-loading (videinfra), the main difference with V50Si concerns selectivity toCO and CO2 at high temperature (Figs. 15a and 15c). It can beseen that, despite the fact that total O2 conversion had alreadybeen reached at around 350 ◦C, a further temperature increaseled to increased selectivity to CO2 and decreased selectivity toCO. In a previous work [54], this was attributed to the activityof reduced bulk vanadium oxides, which catalyze the water-gasshift (WGS) reaction. Another difference concerns the signifi-cant selectivity to acetic acid. In the previous study [54], whenthe loading of V oxide over either silica or alumina was lowerthan or close to the theoretical monolayer, the catalysts exhib-ited no activity for the WGS reaction. The same effect was seenwith the present catalysts.
Figs. 16a and 16b compare propane conversion and selectiv-ity to propylene as a function of reaction temperature for all
58 I. Rossetti et al. / Journal of Catalysis 256 (2008) 45–61
catalysts (with tests run before the anaerobic tests). Activitywas proportional to the V content. The best selectivity to propy-lene was obtained with the V10Si catalyst. The catalyst with thelowest V content (V5Si) was completely unselective to propy-lene at low conversion, forming CO2 almost exclusively. BothV28Si and V50Si were less selective to propylene comparedwith V10Si. For all catalysts, in the low-temperature range se-lectivity decreased with increasing propane conversion, due tothe contribution of the consecutive reaction of propylene com-bustion. An increase in selectivity was found once total oxygenconversion was attained, due to the increased contribution ofpropane dehydrogenation. The catalytic performance of thesesilica-based materials was obviously worse than that of othersiliceous materials (MCF or MCM-41), in which V incorpo-ration or grafting, aimed at obtaining very disperse (isolated)species, led to samples with surprisingly high selectivity andproductivity to olefin [55]. The same authors pointed out thatthe latter samples demonstrated much better performance thancatalysts prepared by conventional impregnation of vanadiumoxide over silica.
3.7.3. Comparison between FP-prepared and impregnatedcatalysts
Fig. 17 compares the performance under anaerobic condi-tions of V10Si and of the reference catalyst V10Si-i, obtainedby impregnation of the FP-prepared silica. The V oxide shouldbe prevalently dispersed over the silica surface with V10Si-i,predominately in the form of bulk vanadia aggregates, as shownin the characterization section. In contrast, although the totalamount of vanadium was the same in both samples, it shouldbe embedded in the bulk, at least in part, with the V10Si sam-ple. The two samples showed very comparable initial activity,notwithstanding the remarkably higher SSA value of the FP-prepared sample with respect to that of V10Si-i. This is likelydue to the fact that more V oxide was available with the V10Si-icatalyst (being deposited over silica) than with the FP-preparedcatalyst. In fact, with the V10Si-i catalyst, the weight loss (cal-culated from the stoichiometry of the reactions occurring underanaerobic conditions) corresponded to approximately 50% ofthe theoretical value (calculated by assuming a complete reduc-tion of V2O5 into V2O3) and was almost twice that found forthe V10Si catalyst.
Propane conversion followed the same trend for the two cat-alysts (Fig. 17a), but the selectivity was clearly better withthe FP-prepared catalyst than with the impregnated catalyst(Fig. 17b). The difference in selectivity was evident at the be-ginning of the reduction period, when the catalyst was stillfully oxidized, and then diminished as long as the catalyst wasreduced progressively. The difference at the beginning of thereduction period confirms the different nature of the V speciesresponsible of the ODH of propane.
Fig. 17 also shows the behavior of catalyst V28Si. This sam-ple demonstrated the presence of crystalline V2O5 as well asan overall amount of vanadium oxide available for reaction (asmeasured from the comparison between the theoretical weightloss and the experimental one in anaerobic tests) of ca. 8 wt%,not far from the 5 wt% of the V10Si-i catalyst. V28Si was not
(a)
(b)
Fig. 17. (a) Effect of time on-stream during the anaerobic reducing step(half-cycle) on propane conversion. (b) Molar selectivity to propylene vs.propane conversion, for V10Si (2), V10Si-i (1) and V28Si (F) catalysts atT = 550 ◦C.
only more active, but also clearly more selective than V10Si-i.This provides further evidence of the overall better performanceof the catalysts prepared by the FP method.
3.7.4. Comparison between anaerobic and co-feed reactionconditions
Fig. 18 compares the selectivity to propylene versus propaneconversion under co-feed and anaerobic conditions. It is note-worthy that in the former case, the conversion varied withchanges in temperature, whereas under reducing conditions,it changed progressively during the permanence at isothermalconditions (T = 550 ◦C) in the reducing stream. Therefore, themost significant comparison was that of the still-oxidized cat-alysts, that is, at the very beginning of the reducing time. Foreach catalyst, this corresponds to the greatest instantaneousconversion of propane. The comparison clearly demonstratesthat operation under anaerobic conditions may provide advan-tages in terms of selectivity with respect to the co-feed opera-tion. Specifically, whereas for V28Si and V50Si, the selectivityto propylene achieved in the presence and absence of oxygen(in the latter case, for the fully oxidized catalyst) did not dif-

I. Rossetti et al. / Journal of Catalysis 256 (2008) 45–61 59
Fig. 18. Molar selectivity to propylene vs. propane conversion for the anaero-bic (full symbols) and co-feed (open symbols) modes. Catalysts V5Si (F,E),V10Si (Q,P), V28Si (2,1), V50Si (",!) and V10Si-i (×| , ×). T = 550 ◦C,gas contact time 2 s.
fer much, for V5Si and V10Si, significantly greater selectivitywas obtained under anaerobic conditions. Especially with thelatter catalyst, selectivity to propylene at the beginning of thereduction time (at ca. 15% conversion) was >60% greater thanthat obtained in the presence of oxygen at comparable propaneconversion. In fact, Figs. 15a and 15b show that between 450and 475 ◦C in the co-feed mode, propane conversion increasedfrom 7 to 27%, oxygen conversion increased from 20 to 98%,and selectivity to propylene decreased from 22 to 17%. The lat-ter value was considerably lower than that obtained with theV10Si sample in the absence of molecular oxygen.
In a previous work on V2O5–SiO2 catalysts with VOx dis-persed in the gel [30], the reaction under anaerobic conditionsled to improved selectivity to propylene (around 25–30% higherfor a 35–40% propane conversion) compared with that underco-feed conditions. The best selectivity was achieved at the verybeginning of the reduction step, when the catalyst was still fullyoxidized and acted as a true ODH catalyst even in the absenceof molecular oxygen. Remarkably, this property was specific tothe V2O5–SiO2 system. In fact, when vanadium oxide was sup-ported over either alumina or titania, no effective improvementin propylene selectivity was observed for the anaerobic opera-tion with respect to the co-feed mode [17].
In the present investigation, the best performance in propaneODH under both co-feed and anaerobic conditions was ob-served with the catalyst containing 10 wt% V2O5. Only VOx
isolated species (with no vanadium-oxide aggregates) werepresent in this catalyst, as determined by Raman spectroscopy(vide supra). This is an advantage associated with the FP prepa-ration technique, which allows higher V loading before V2O5
begins to segregate. In contrast, when silica is used as a sup-port, the amount of vanadium oxide exceeds that required formonolayer formation, leading to V2O5 formation at V loadingsbelow those for the present FP-prepared samples. This is likelydue to the peculiarity of the latter samples, which exhibitedmuch higher-than-expected surface Si–OH concentrations thatdecreased with increasing V loadings, as shown by FT-IR data
(vide supra). Furthermore, as evidenced by the spectroscopiccharacterization, the development of V–O–Si bonds confirmsthat a prerequisite for the formation of isolated VOx specieswas the presence of a high concentration of surface hydroxylgroups. It can be hypothesized that after the high-temperatureflash vaporization and pyrolysis of the precursor organic so-lution in the flame, the development of a metastable oxidewas followed by the opening of strained Me–O–Me bonds andgeneration of Me–OH moieties during quenching in the wetatmosphere. On the other hand, the FP method favored the for-mation of V–O–Si bonds and thus the generation of isolatedVOx species at concentrations greater than are usually obtainedwith impregnated silica. The successive calcination treatmentat 550 ◦C also may have favored the development of additionalV–O–Si bonds and the generation of isolated VOx species.This also occurred with the V5Si catalyst, in which, however,a greater fraction of exposed silica caused a deterioration ofperformance and resulting lower selectivity to propylene, dueto a more abundant formation of carbon oxides under the co-feed mode and of coke under anaerobic conditions. In contrast,with the V28Si and V50Si samples, the characterization clearlyshowed the formation of bulk vanadia aggregates, which wereresponsible for the formation of carbon oxides and acetic acidin the co-feed mode and of carbon oxides under anaerobic re-action conditions.
Comparing the catalyst prepared with the sol–gel methodcontaining 7 wt% V2O5 [30] and the V10Si catalyst reportedhere demonstrates that the two samples behaved similarly un-der anaerobic conditions (with very similar plots of selectivityto propylene as a function of conversion), but the sol–gel cat-alyst gave better selectivity than the FP catalyst under co-feedconditions. This difference can be attributed to the greater ex-posure of the V–OH and Si–OH groups for the FP-preparedcatalyst. But under anaerobic conditions, the V10Si catalystdemonstrated much greater selectivity to propylene than thecorresponding sol–gel catalyst. This indicates that the hydroxylgroups did not play a negative role in selectivity when the reac-tion was carried out in the absence of molecular oxygen.
Our findings confirm significant differences in the nature ofV sites of the FP-prepared samples and the impregnated sam-ples and those in samples prepared by conventional techniques,such as sol–gel [30]. Indeed, high V dispersion was evidentfor the FP-prepared samples, at least up to 10 wt% V2O5.In the V10Si catalyst, no segregated vanadia was detected byXRD, Raman, or FT-IR analysis, and no V4+ ferromagneticdomains were demonstrated on EPR spectroscopy, in contrastto the V10Si-i sample (Fig. 4). These EPR results provide in-sight into the local structure of the V-based active sites. Indeed,the EPR features due to V4+ maintained a constant profile butgrew markedly in intensity after reaction under anaerobic con-ditions (Fig. 3), indicating not only that a considerable amountof V4+–based species formed on reduction of V5+ during thecatalytic process without reoxidation, but also that in thesespecies, the V4+–O bond was slightly stronger in V10Si thanin V10Si-i (vide supra). This finding suggests that the bondsbetween surface V and O likely were stronger in the formersample than in the latter sample also in the V5+ active cen-

60 I. Rossetti et al. / Journal of Catalysis 256 (2008) 45–61
ters. This is in agreement with the activity data showing thatthe samples with stronger V4+ to O bonds were characterizedby lower oxygen availability (i.e., lower activity) but higher se-lectivity.
Comparing the V10Si and V10Si-i catalysts also providedadditional insights. The two samples exhibited very similar per-formance in the co-feed mode, but the V10Si sample demon-strated higher selectivity to propylene under anaerobic condi-tions. Because the two catalysts exhibited very similar activity,this difference can be attributed to the different nature of theVOx species. Of note, IR bands due to vibration of SiO4 groupsperturbed by the presence of neighboring V ions were not seenfor the V10Si-i sample. This indicates that only the FP method(involving concomitant FP of the V–Si complex species) ledto the partial incorporation of V ions in silica. The hydrolysisof surface Me–O–Me strained bonds can lead to the exposureof subsurface VOx species. These species are located in a nestsurrounded by Si–OH species, which also contribute to the iso-lation of the V ion. The finding of a greater concentration ofisolated VOx species in V10Si with respect to V10Si-i demon-strates the positive effect on selectivity to propylene, but onlywhen the reaction was carried out under anaerobic conditions.The same effect was observed for V2O5/SiO2 co-gel systems[30] and was attributed to the fact that when the reaction is car-ried out in the presence of molecular oxygen, the generation ofunselective O2− species (rather than the dispersion of the ac-tive sites) controls the selectivity of the process. When insteadthe reaction is carried out in the absence of molecular oxygen,the better isolation of the active sites may effectively control theavailability of surface O2− sites and thereby limit the consecu-tive and parallel total combustion reactions.
Fig. 18 shows that the V10Si-i catalyst gave better selec-tivity to propylene under anaerobic conditions than in the co-feed mode. The gain in selectivity was around 25–30% at 15–20% propane conversion. This figure also shows a consider-ably greater improvement in selectivity (by ca. 50–60%) withthe V10Si catalyst. It is evident that the concomitant genera-tion of the V and Si oxides achieved by the FP method led toa system that provides superior performance under anaerobicconditions due to the increased concentration of isolated VOx
sites.
4. Conclusion
VOx /SiO2 catalysts with different V loading were preparedby the FP technique. Their physicochemical and catalytic prop-erties for the ODH of propane differed significantly from thoseof a comparative sample prepared by impregnation. Muchhigher V dispersion was achieved for the FP-prepared samplecompared with the impregnated catalyst at the same V loading.Higher selectivity to propylene also was achieved with the FPsamples, especially under anaerobic conditions. The active sitesof the FP-prepared catalysts contained highly dispersed V5+Ogroups, partly incorporated into the silica matrix and poorly in-teracting with one another. EPR characterization allowed iden-tification of the V4+ site structure as consisting of V4+O groupsin the center of a surface array of oxygen atoms. High V site iso-
lation was found, especially for the FP samples at up to 10 wt%V loading, along with the absence of oligomeric species. Butat higher V loadings, bulk vanadia began to segregate, with aconsequent decrease in catalyst selectivity. The unexpectedlyhigh surface hydroxyl concentrations detected on the FP sam-ples despite the high calcination temperature attained duringsynthesis, very likely helps stabilize these dispersed V species.Thus, the advantage of the present FP preparation method overother preparation procedures is the possibility of hosting higherV concentrations without V2O5 segregation, thereby permittinggreater selectivity compared with that provided by traditionallyprepared catalysts.
Acknowledgments
This work was supported by the Italian Ministry of Univer-sity and Research through the COFIN program (2005038244).The authors thank INSTM for a PhD grant to A.C., the Norwe-gian Research Council for a PhD grant and travel grant for H.D.through the KOSK program, and S. Cappelli for EPR spectracollection.
References
[1] F. Cavani, F. Trifirò, Catal. Today 24 (1995) 307.[2] E.A. Mamedov, V. Cortes-Corberan, Appl. Catal. A 127 (1995) 1.[3] T. Blasco, J.M. Lopez Nieto, Appl. Catal. A 157 (1997) 117.[4] F. Cavani, F. Trifirò, in: M. Baerns (Ed.), Basic Principles in Applied
Catalysis, in: Ser. Chem. Phys., vol. 75, Springer, Berlin, 2003, p. 21.[5] N. Ballarini, F. Cavani, A. Cericola, Catal. Today 127 (2007) 113.[6] A. Bottino, G. Capannelli, A. Comite, S. Storace, R. Di Felice, Chem.
Eng. J. 94 (2003) 11.[7] M.D. Argyle, K. Chen, A.T. Bell, E. Iglesia, J. Catal. 208 (2002) 139.[8] T. Blasco, A. Galli, J.M. Lòpez Nieto, F. Trifirò, J. Catal. 169 (1997) 203.[9] Z. Zhao, Y. Yamada, A. Ueda, H. Sakurai, T. Kobayashi, Catal. Today 93–
95 (2004) 163.[10] M.V. Martìnez-Huerta, X. Gao, H. Tian, I.E. Wachs, J.L.G. Fierro, M.A.
Bañares, Catal. Today 118 (2006) 279.[11] E.V. Kondratenko, N. Steinfeldt, M. Baerns, Phys. Chem. Chem. Phys. 8
(2006) 1624.[12] D. Shee, T.V. Malleswara Rao, G. Deo, Catal. Today 118 (2006) 288.[13] H. Tian, E.I. Ross, I.E. Wachs, J. Phys. Chem. B 110 (19) (2006) 9593.[14] K. Chen, E. Iglesia, A.T. Bell, J. Catal. 192 (2000) 197.[15] S. Dzwigaj, I. Gressel, B. Grzybowska, K. Samson, Catal. Today 114
(2006) 237.[16] N. Ballarini, A. Battisti, F. Cavani, A. Cericola, C. Lucarelli, S. Racioppi,
P. Arpentinier, Catal. Today 116 (2006) 313.[17] N. Ballarini, F. Cavani, A. Cericola, C. Cortelli, M. Ferrari, F. Trifirò, G.
Capannelli, A. Comite, R. Catani, U. Cornaro, Catal. Today 91–92 (2004)99.
[18] M.D. Argyle, K. Chen, C. Resini, C. Krebs, A.T. Bell, E. Iglesia, J. Phys.Chem. B 108 (2004) 2345.
[19] N. Steinfeldt, D. Müller, H. Berndt, Appl. Catal. A Gen. 272 (2004) 201.[20] X. Gao, S.R. Bare, J.L.G. Fierro, I.E. Wachs, J. Phys. Chem. B 103 (1999)
618.[21] X. Gao, J.L.G. Fierro, I.E. Wachs, Langmuir 15 (1999) 3169.[22] W.J. Stark, L. Mädler, S.E. Pratsinis, EP 1,378,489 A1 (2004), to ETH,
Zurich.[23] G.L. Chiarello, I. Rossetti, L. Forni, J. Catal. 236 (2005) 251.[24] G.L. Chiarello, I. Rossetti, P. Lopinto, G. Migliavacca, L. Forni, Catal.
Today 117 (2006) 549.[25] G.L. Chiarello, I. Rossetti, L. Forni, P. Lopinto, G. Migliavacca, Appl.
Catal. B Environ. 72 (2007) 218.
I. Rossetti et al. / Journal of Catalysis 256 (2008) 45–61 61
[26] G.L. Chiarello, I. Rossetti, L. Forni, P. Lopinto, G. Migliavacca, Appl.Catal. B Environ. 72 (2007) 227.
[27] R. Strobel, W.J. Stark, L. Mädler, S.E. Pratsinis, A. Baiker, J. Catal. 213(2003) 296.
[28] L. Mädler, S.E. Pratsinis, J. Am. Ceram. Soc. 85 (7) (2002) 1713.[29] R. Strobel, S.E. Pratsinis, A. Baiker, J. Mater. Chem. 15 (2005) 605.[30] N. Ballarini, F. Cavani, M. Ferrari, R. Catani, U. Cornaro, J. Catal. 213
(2003) 95.[31] R. Grabowski, S. Pietrzyk, J. Słoczynski, F. Genser, K. Wcisło, B. Grzy-
bowska-Swierkosz, Appl. Catal. A 232 (2002) 277.[32] G.E. Vrieland, C.B. Murchison, Appl. Catal. A 134 (1996) 101.[33] D. Creaser, B. Andersson, R.R. Hudgins, P.L. Silveston, Chem. Eng. Sci.
54 (1999) 4365.[34] D. Creaser, B. Andersson, R.R. Hudgins, P.L. Silveston, J. Catal. 182
(1999) 264.[35] R.A.M. Giacomuzzi, M. Portinari, I. Rossetti, L. Forni, in: A. Corma, F.V.
Melo, S. Mendioroz, J.L.G. Fierro (Eds.), Studies Surface Science andCatalysis, vol. 130, Elsevier, Amsterdam, 2000, p. 197.
[36] Advanced Selected Powder Diffraction Data, Miner. DBM (1–40),JCPDS, Swarthmore, PA, 1974–1992.
[37] W.J. Stark, L. Mädler, M. Maciejewski, S.E. Pratsinis, A. Baiker, Chem.Commun. (2003) 588.
[38] V.K. Sharma, A. Wokaun, A. Baiker, J. Phys. Chem. 90 (1986) 2715.[39] A. Gervasini, G. Fornasari, G. Bellussi, Appl. Catal. A Gen. 83 (1992)
235.[40] E.G. Derouane, A.J. Simoens, J.C. Védrine, Chem. Phys. Lett. 52 (1977)
549.
[41] E.G. Derouane, A. Simoens, C. Colin, G.A. Martin, J.A. Dalmon, J.C.Védrine, J. Catal. 52 (1978) 50.
[42] P.A. Jacobs, H. Nijs, J. Verdonck, E.G. Derouane, J.-P. Gilson, A.J. Si-moens, J. Chem. Soc. Faraday Trans. I 75 (1979) 1196.
[43] C. Kittel, Introduction to Solid State Physics, third ed., Wiley, New York,1967, p. 523.
[44] L. Bonneviot, D. Olivier, Ferromagnetic Resonance, in: B. Imelik, J.C.Védrine (Eds.), Catalyst Characterization. Physical Techniques for SolidMaterials, Plenum Press, New York, 1994.
[45] T. Ono, H. Numata, J. Mol. Catal. A Chem. 116 (1997) 421.[46] A. Khodakov, B. Olthof, A.T. Bell, E. Iglesia, J. Catal. 181 (1999) 205,
and references therein.[47] A. Klisinska, S. Loridant, B. Grzybowska, J. Stoch, I. Gressel, Appl. Catal.
A Gen. 309 (2006) 17.[48] D.E. Keller, T. Visser, F. Soulimani, D.C. Koninsberger, B.M. Weckhuy-
sen, Vib. Spectrosc. 43 (2007) 140.[49] S. Dzwigaj, P. Massiani, A. Davidson, M. Che, J. Mol. Catal. A Chem. 155
(2000) 169.[50] A. Burneau, J.P. Gallas, in: A.P. Legrand (Ed.), The Surface Properties of
Silica, 1999, p. 194, and references therein.[51] B.A. Morrow, A.J. McFarlan, J. Phys. Chem. 96 (1992) 1395.[52] J.A. Lercher, C. Gründling, G. Eder-Mirth, Catal. Today 27 (1996) 353.[53] A. Zecchina, C. Otero Areán, Chem. Soc. Rev. 25 (1996) 187.[54] N. Ballarini, A. Battisti, F. Cavani, A. Cericola, C. Cortelli, M. Ferrari,
F. Trifirò, P. Arpentinier, Appl. Catal. A Gen. 307 (2006) 148.[55] Y.-M. Liu, W.-L. Feng, T.-C. Li, H.-Y. He, W.-L. Dai, W. Huang, Y. Cao,
K.-N. Fan, J. Catal. 239 (2006) 125.
Copyright © 2022 FDOKUMEN