Galactic chimney sweeping: the effect of 'gradual' stellar ...
arX
iv:a
stro
-ph/
9704
006v
1 1
Apr
199
7
Manuscript draft: June 19, 1996
SiO emission from the Galactic Center Molecular Clouds
J. Martın-Pintado, P. de Vicente, A. Fuente, P. PlanesasObservatorio Astronomico Nacional (IGN), Campus Universitario, Apartado 1143, E-28800
Alcala de Henares, Spain
ABSTRACT
We have mapped the J=1 → 0 line of SiO in a 1◦×12′(l×b) region around
the Galactic center (GC) with an angular resolution of 2′ (∼4 pc). In contrast
to the spatial distribution of other high dipole moment molecules like CS,
whose emission is nearly uniform, the SiO emission is very fragmented and it
is only associated with some molecular clouds. In particular, it is remarkable
that the SiO emission closely follows the non-thermal radio arc in the GC.
The SiO clouds are more extended than the beam with typical sizes between 4
and 20 pc. High angular resolution (26′′) mapping in the J=2 → 1 line of SiO
toward the molecular clouds in Sgr B2 and Sgr A shows that the SiO emission
is relatively smooth with structures of typically 2 pc. From the line intensities
of the J=2 → 1 , J=3 → 2 and J=5 → 4 transitions of SiO we derive H2
densities for these clouds of a few 104 cm−3 . The SiO fractional abundances
are ∼ 10−9 for the SiO clouds and <
∼ 10−10 for the other molecular clouds in the
GC. The characteristics (size and H2 densities) of the SiO emission in the GC
are completely different from those observed in the Galactic disk, where the SiO
emission arises from much smaller regions with larger H2 densities. We briefly
discuss the implications of the SiO emission in the molecular clouds of the GC.
We conclude that the particular chemistry in these clouds is probably related to
large scale fast shocks occurring in the Galactic center region.
Subject headings: Galaxy: center— ISM: molecules — ISM: clouds — ISM:
structure — ISM: abundances— radio lines: ISM
1. Introduction
The physical conditions of the molecular clouds in the Galactic center (GC) differ
substantially from those of the molecular clouds in the Galactic disk (see e.g. Gusten 1989).
– 2 –
High gas kinetic temperatures (Tkin>
∼80 K) are found in these molecular clouds (Gusten,
Walmsley & Pauls 1981; Morris et al. 1983; Huttemeister et al. 1993). The gas kinetic
temperatures are clearly above the dust color temperatures, ∼30 K, derived from the FIR
emission (Odenwald and Fazio 1984). To explain the high kinetic temperatures of the
molecular gas, several heating mechanisms which act only on the gas have been discussed.
In particular, the large linewidth (>
∼15 km s−1 ) that the molecular lines exhibit in these
molecular clouds and its possible correlation with the kinetic temperature suggest that
dissipation of turbulence driven by differential Galactic rotation is an attractive heating
mechanism for the GC molecular clouds (Wilson et al. 1982; Gusten 1989).
If supersonic turbulence is an efficient heating mechanism, it is expected to produce
shocks which will heat the gas and also influence the chemical composition of the molecular
clouds in the GC. In fact, ionizing shocks have also been proposed as the origin of the
ionization in the Galactic center (Morris 1989). Molecular species which are formed by
shock chemistry are then expected to be enhanced in these molecular clouds. Since the
discovery of SiO emission in interstellar clouds, it is rather well established that SiO is
an unambiguous tracer of high temperature and/or shock chemistry in interstellar clouds
(Downes et al. 1982; Ziurys, Fribeg & Irvine 1989; Martın-Pintado, Bachiller & Fuente
1992 )
In this letter we report the detection of widespread SiO emission toward some giant
molecular clouds in the Galactic center. In contrast to the star-forming regions, the SiO
maps reveal very extended emission which does not seem to be associated with recently
formed stars, but most likely with large scale shocks in the Galactic center region.
2. Observations and Results
The large scale mapping of the molecular clouds in the J=1 → 0 line of SiO was
carried out with the 14-m telescope of the Centro Astronomico de Yebes (Spain). The
Half Power Beamwidth (HPBW) of the telescope was 2′. The receiver, equipped with a
cooled Schottky mixer, had a double side band temperature of 75 K. The typical single side
band system temperature was 250-300 K. The spectrometer was a 512 channel acusto-optic
device with a resolution of 108 kHz (0.74 km s−1 ). The calibration was made by using the
standard chopper wheel method. The observations were made in position switching with
the reference 15′ away from the Galactic plane. In view of the unexpected large extent of
the SiO emision, the most critical positions in our map have been checked for contamination
with emission from the reference. The typical noise in the map is 0.15 K. The SiO profiles
show broad lines with typical widths to half power of 30-60 km s−1 , with most of their
– 3 –
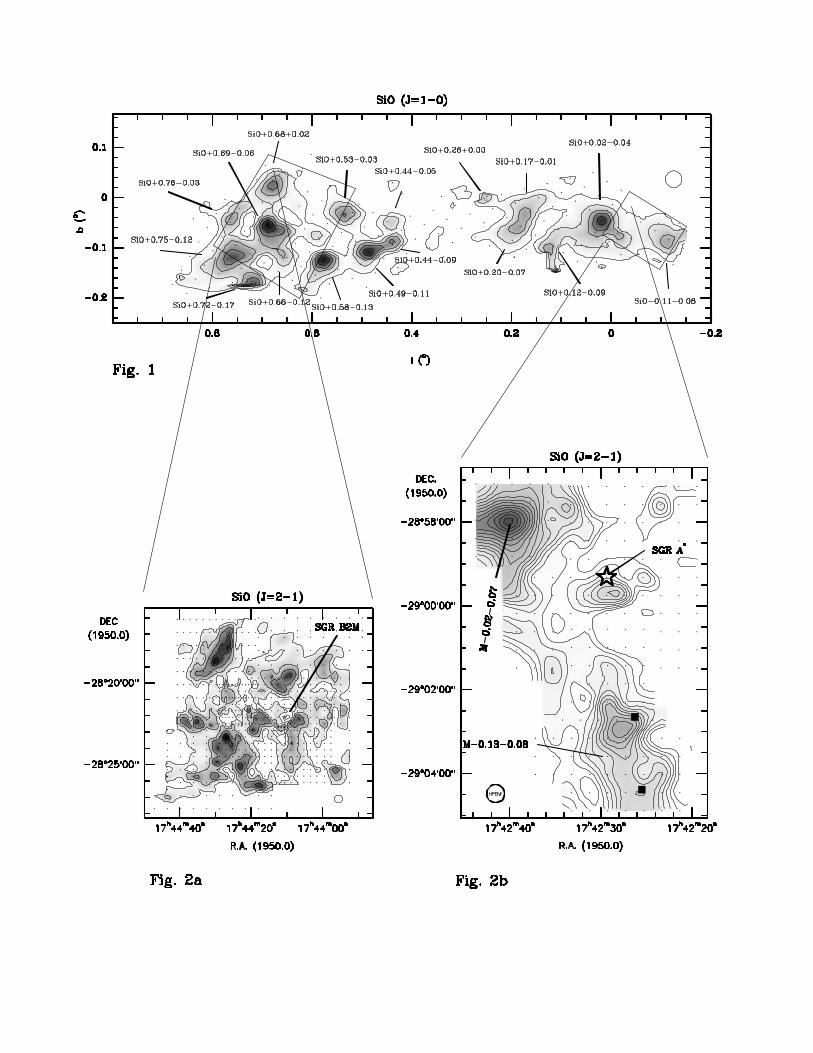
emission concentrated at radial velocities between −10 to 90 km s−1 . Fig. 1 shows the
integrated intensity map of the J=1 → 0 line of SiO for the velocity range between −10 to
90 km s−1 . The SiO emission shows a very fragmented distribution concentrating in 17
molecular clouds which are designated in Fig. 1 by their Galactic coordinates.
The fragmented SiO emission is in contrast with the fairly uniform distribution of the
CS emission (Bally et al. 1987) obtained with the same angular resolution than the SiO
data. The SiO emission is also different from that of CS for negative radial velocities. While
CS shows relatively strong emission for radial velocities from −50 to −10 km s−1 toward
thermal arched filaments, SiO is not detected to our limit of 0.15 K. Along the Galactic
plane, the SiO emission shows a similar spatial distribution to that of the hot gas observed
in NH3 emission (Morris et al. 1983). Both lines are not detected for Galactic longitudes
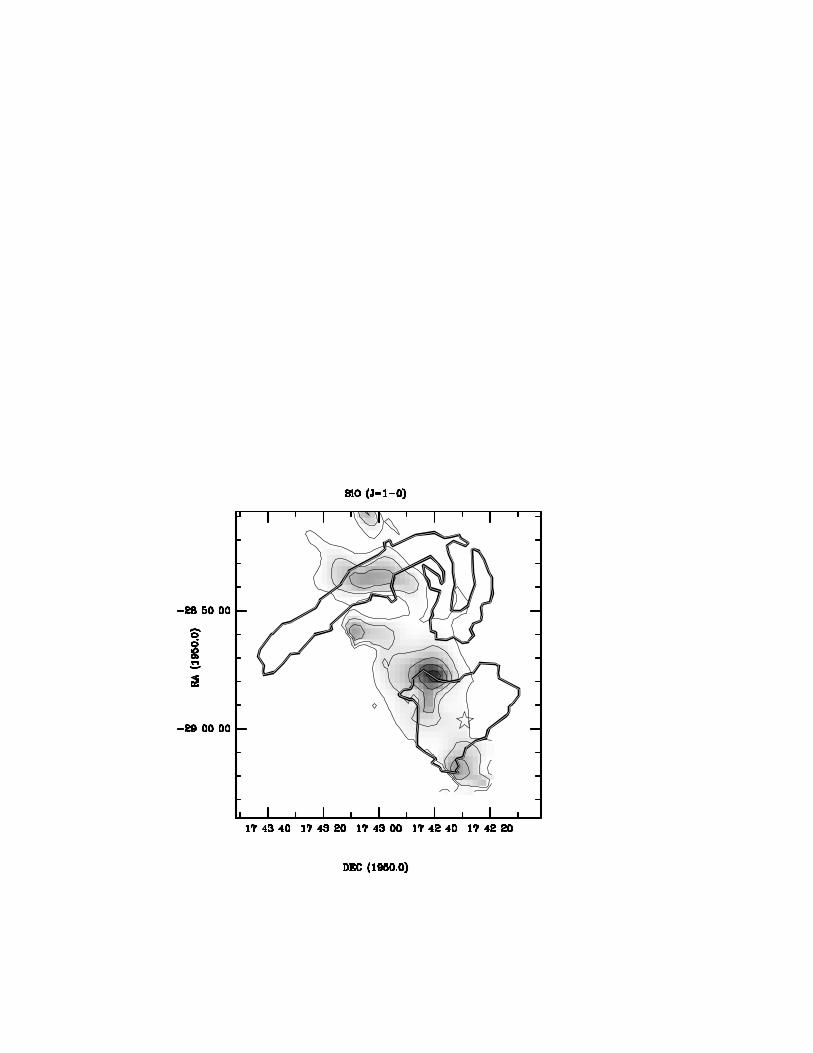
between 0.3◦ and 0.4◦. There are three major groups of SiO clouds. The first one, located
south of Sgr A, surrounds the southern edge of the radio continuum emission from Sgr A
East. Fig. 3 shows a comparison of the SiO emission with the main radiocontinuum features
within 50 pc of Sgr A*. The second one is found towards the Galactic center non-thermal
radio arc at l∼0.2◦. It is remarkable that the SiO emission is not only restricted to the
molecular cloud M0.20-0.03 (Bally et al. 1987; Serabyn & Gusten 1991; Lindqvist et al.
1995), but it shows the same morphology as the non-thermal radio arc over scales of several
parsecs (see Fig. 3). The third SiO complex is found toward the star forming regions Sgr B1
and Sgr B2. The SiO emission does not show a clear correlation neither with the emission
at 60µm nor with the radio continuum emission (Altenhoff et al. 1979) observed with
similar angular resolution. This indicates that the bulk of the SiO clouds are not associated
with newly formed OB stars.
The SiO emission is more extended than the beam with typical sizes of 4-8′ (9-20pc).
High angular resolution (26′′) maps in the J=2 → 1 line of SiO of the two molecular clouds
associated with Sgr A and Sgr B2 shows that the SiO emission is not highly clumply in the
2′ beam of the J=1 → 0 line. These observations were made with the IRAM 30-m telescope
at Pico Veleta (Spain) and the observing procedure has been described by Martın-Pintado
et al (1992). Figs. 2a and 2b show the integrated intensity maps of the J=2 → 1 line of SiO
towards the Sgr B2 and Sgr A molecular clouds respectively. These data will be analyzed
in more detail elsewhere (Martın-Pintado et al 1996). Simultaneously with the J=2 → 1
line we also observed the J=3 → 2 and J=5 → 4 lines of SiO. The HPBW of the telecopes
for the J=3 → 2 and J=5 → 4 lines were 17′′ and 13′′ respectively. To derive the physical
conditions, fully sampled maps (5×5 point) in the J=5 → 4 line were also made at selected
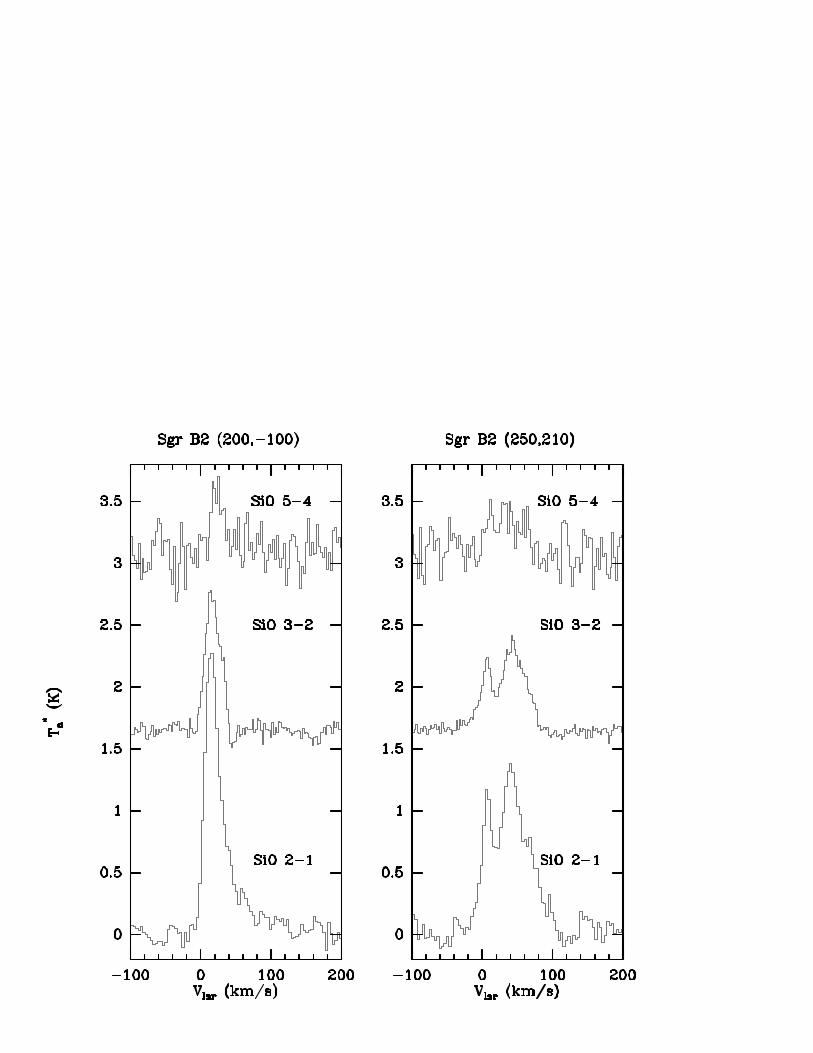
positions. Fig. 4 shows the typical line profiles of the SiO lines towards two positions in the
Sgr B2 molecular cloud. The SiO profiles are very broad with linewidths to zero intensity
up to 100 km s−1 .
– 4 –
The SiO emission south of Sgr A (Fig. 2b) is elongated (8 pc×16 pc) along the
Galactic plane with two main clouds, M-0.13-0.08 (the 20 km s−1 cloud) and M-0.02-0.07
(the 50 km s−1 cloud) and a condensation close to Sgr A*. Like at large scale, the overall
morphology of the SiO emission from these clouds is similar to that of the hot gas observed
in the (3,3) line of NH3(Gusten, Walmsley & Pauls 1981; Ho et al. 1991). The SiO emission,
however, does not show the prominent cold and dense FIR condensations observed at
1.3 mm (Mezger et al. 1989). The SiO emission toward Sgr B2 extends over a region of
at least ∼24×24 pc and presents a fragmented distribution. The typical size of the SiO
condensations is >
∼1′(>
∼2 pc). The SiO lines show doubled peaked profiles. While the gas
with low radial velocities, ∼0 km s−1 , appears to the east of the star forming region, the
high velocity gas, 60-80 km s−1 , appears mainly to the west. The very broad SiO lines and
the systematic trend observed in radial velocities suggest that in the envelope of Sgr B2
very energetic events are taking place. Furthermore, from the integrated emission one can
recognize several shell-like structures. The largest one, centered on Sgr B2M, surrounds the
hot ring observed in CH3CN( de Vicente et al. 1996)
3. Physical conditions in the SiO clouds
The main characteristic of the SiO lines in the GC clouds is that the intensity of
the J=5 → 4 line is typically 6-10 times weaker than that of the J=2 → 1 line, except
for the star-forming regions Sgr B2M and Sgr B2N. The line intensity ratios have been
derived after smoothing the J=5 → 4 and the J=3 → 2 lines to the the same resolution
of the J=2 → 1 line. The low intensity ratios in the GC clouds is in contrast with
those found in star-forming regions in the Galactic disk where ratios of ∼1 are observed
(Martın-Pintado, Bachiller & Fuente 1992). The low J=5 → 4 /J=2 → 1 line intensity
ratio in the GC suggests that the SiO emission in these clouds arises from material with
moderate H2 densities. Model calculations of the excitation of SiO using the Large Velocity
Gradient Approximation (LVG) indicate that H2 densities of a few 104 cm−3 can explain
the observed line intensity ratios for the typical kinetic temperature, >
∼50 K, of the GC
molecular clouds (Gusten, Walmsley & Pauls 1981; Morris et al. 1983; Huttermeister et
al. 1993). The derived H2 densities are basically independent of the kinetic temperatures
for kinetic temperatures larger than 50 K. For the typical physical conditions of the GC
molecular clouds (H2 density of 5 104 cm−3 and a kinetic temperature of 80 K), the LVG
analysis gives SiO column densities of 0.7-3 1014 cm−2 .
Asuming the same physical conditions for the clouds where the SiO emission is not
detected, we derive upper limits to the SiO column density of ∼ 1013 cm−2 . For both
– 5 –
types of clouds, the column densities estimated from LVG calculations for CS and HCO+
are typically of 2-5 1014 cm−2 , similar to those derived from multitransition LVG analysis
of CS towards some molecular clouds in the GC (Serabyn & Gusten 1987). The derived
SiO column densities are similar to those of CS for the SiO clouds and a factor of, at
least, 10 smaller for the other clouds. Since SiO and CS have similar dipole moments and
energy level distributions, the derived column density ratio between these molecules is
basically independent of the assumed physical conditions. Assuming the standard fractional
abundance for CS and HCO+, we estimate the fractional abundance of SiO for the SiO
clouds to be ∼ 10−9. The fractional abundance of SiO is, at least, one order of magnitude
smaller, <
∼ 10−10 , for the clouds where SiO emission has not been detected. Similar upper
limits to the SiO abundances are derived for the molecular material with negative radial
velocities associated with the thermal arched filaments in the GC. From the derived H2
densities and the measured sizes, the SiO clouds have typical masses of a few 105 M⊙ .
4. Discussion
In the molecular clouds of the Galactic disk, the SiO emission is mainly associated
with energetic mass outflows powered by young stars. This peculiar chemistry has led to
the conclusion that Si is highly depleted in the molecular clouds and SiO appears only in
very small regions where shock disruption of grains releases Si or SiO to the gas phase
(Martın-Pintado, Bachiller & Fuente 1992). The variation of the SiO abundance in the GC
molecular clouds also indicates a peculiar chemistry for this molecule in the GC region.
However, the main characteristics (very widespread and moderate H2 densities) of the SiO
emission in the GC are substantially different from those observed in the Galactic disk.
The GC SiO molecular clouds seem to be associated with warm gas, and high temperature
chemistry (Ziurys, Fribeg & Irvine 1989; Langer & Glassgold 1990) could explain the SiO
abundances if Si is less depleted in the GC clouds than in the clouds of the disk. Also,
desorption of silicon bearing compounds from warm grains could explain the large SiO
abundance in the GC clouds (Turner 1992a; MacKay 1995). However, chemistry schemes
based only on high temperatures cannot explain the low SiO emission abundance found
in the hot (>
∼80 K, Serabyn & Gusten 1987) material associated with the thermal arched
filaments. The low SiO abundance in the thermal arched filaments is very likely related
to the heating of these filaments. The main heating mechanism is thought to be the UV
radiation from OB stars (Poglitsch et al. 1991). This will produce hot photodissociation
regions but low SiO abundances. The low SiO/CS abundance ratio is unlikely to be related
to the photodissociation of SiO since this molecule is expected to be more resistent than CS
(Sternberg & Dalgarno 1986).
– 6 –
It has been proposed that the high temperatures in most of the GC clouds are related
to cloud-cloud collisions which are expected to be more frequent in the GC region than in
the disk (Wilson et al. 1982). Low velocity shocks associated with cloud-cloud collisions
have also been claimed to explain the SiO abundances derived from absorption lines toward
Sgr B2M (Huttemeister et al. 1995; Peng et al. 1996). The presence of low-velocity
shocks were inferred from the narrow linewidths (∼10 km s−1 ) of the absorption lines.
However, the absorption lines only sample a very particular line of sight of the envelope
and the line width might not represent the complete kinematics of the envelope. Indeed,
the SiO emission in the envelope of Sgr B2 (Fig. 2) shows much broader profiles than the
absorption lines with radial velocities of up to ± 50 km s−1 . For shock velocities larger
than 40 km s−1 grain destruction becomes important (Seab & Shull 1983; Tielens et al.
1994) and Si and/or SiO can be released to gas phase. Therefore the SiO emission in the
GC molecular clouds could be associated with relatively fast shocks.
The fast shocks in the SiO molecular clouds are very likely of different origin for the
different SiO complexes. For the molecular clouds south of Sgr A, there are several evidences
suggesting that these molecular clouds are interacting with nearby supernova remnants (Ho
et al. 1991; Mezger et al. 1989). In fact the broad lines and the large SiO abundances in
the GC clouds resemble those observed in the molecular gas interacting with the supernova
remnant IC443 (Turner et al. 1992b). The clouds SiO+0.17-0.01 and SiO+0.20-0.07 clearly
follow at large scale the GC radio arc suggesting a physical association with this feature
(Fig. 3). The SiO emission probably traces the interaction of the molecular material with
the non-thermal filaments. Strong shocks will occur either in the case that the relativistic
particles present along the filaments impact on the molecular cloud or, conversely, that the
relativistic particles originate in the molecular cloud by magnetic field reconnection between
the magnetic fields in the molecular cloud and in the radio arc (Serabyn & Gusten 1991;
Serabyn & Morris 1994). The origin of strong shocks in the SiO clouds of the Sgr B complex
could be due to large scale cloud collisions (Hasegawa et al 1994), expanding bubbles driven
by supernovas or HII regions (Soufe 1990, de Vicente et al. 1996) and sources with strong
stellar winds like Wolf Rayet stars (Martın Pintado et al. 1996). Further high angular
resolution observations of molecular and atomic lines are needed to establish the origin of
the peculiar chemistry in the GC molecular clouds.
We would like to thank the staffs of the 14-m and 30-m telescopes for support during
the observations and P. T. P. Ho for the critical reading of the manuscript. This work has
been partially supported by the Spanish CICYT under grant number PB93-048.
– 7 –
REFERENCES
Altenhoff, W.J., Downes, D., Pauls, T., Schraml, J. 1979, A&AS 35, 23
Bally, J., Stark, A.A., Wilson, R.W. & Henkel, C. 1987, A&A 136, 243
de Vicente, P., Martın-Pintado, J., Wilson, T.L., 1996, A&A, in press
Downes, D., Genzel, R., Hjalmarson, A., Nyman, L.A. & Ronnang, B. 1982, ApJ, 252, L29
Gusten, R., Walmsley, C.M. & Pauls, T.A. 1981, A&A, 103, 197
Gusten, R., 1989, in IAU Symposium 136, The Galactic Center of the Galaxy, ed. M.
Morris, Kluwer Academic Publisher, p. 89
Hasegawa, T., Sato, F., Whiteoak, J.B., Miyawaki, R. 1994, ApJ, 429, L77
Ho, P. T. P., Ho, L. C., Szczepanski, J. C., Jackson, J. M. & Armstrong, J. T. 1991, Nature
350, 309
Huttemeister, S., Wilson, T. L., Mauersberger, R., Lemme, C., Dahmen, G. & Henkel, C.
1995, A&A 294, 667
Huttemeister, S., Wilson, T. L., Bania, T. M. & Martın-Pintado, J. 1993, A&A 280, 255
Langer, W.D. & Glassgold, A.E. 1990, ApJ, 352, 121
Lindqvist, M., Sandqvist, A., Winnberg, A., Johansson, L. E. B. & Nyman, L. A. 1995,
A&AS113, 257
Mackay, D.D.S. 1995, MNRAS, 274, 694
Martın-Pintado, J., Bachiller, R. & Fuente, A. 1992, A&A, 54, 315
Martın-Pintado, J., de Vicente, P., Wilson, T.L., Gaume, R., 1996, in ESO-IRAM-NFRA-
Osala Workshop on ”Science with Large Millimeter Arrays”, in press
Martın-Pintado, J., de Vicente, P., Fuente, A. 1996, A&A, in preparation
Mezger, P. G., Zylka, R., Chini, R., Salter, C. J. & Wink, J. E. 1989, A&A, 209, 337
Morris, M., Polish, N., Zuckerman, B., Kaifu, N. 1983, AJ, 88, 1228
Morris, M., 1989, in IAU Symposium 136, The Galactic Center of the Galaxy, ed. M.
Morris, Kluwer Academic Publisher, p. 213

– 8 –
Odenwald, S.F. & Fazio, G.G. 1984, ApJ, 283, 601
Peng, Y., Vogel, S.N.& Carlstrom, J.E. 1996, ApJ, in press
Poglitsch, A., Stacey, G. J., Geis, N., Haggerty, M., Jackson, J.,Rumitz, M. Genzel, R. &
Townes, C. H. 1991, ApJ, 374, 33
Seab, C. G. & Shull, J. M. 1983, ApJ113, 257
Serabyn, E. & Gusten, R. 1987, A&A 184, 133
Serabyn, E. & Gusten, R. 1991, A&A,242, 376
Serabyn, E. & Morris, M., 1994, ApJ, 424, L91
Soufe, Y. 1990, PASJ, 42, 827
Stemberberg, A.. & Dalgarno A. 1995, ApJS, 99, 565
Tielens, A. G. G. M., McKee, C. F.,Seab, C. G. & Hollenbach, D. J. 1994, ApJ, 431, 321
Turner, B.E. 1992a, ApJ, 388, L35
Turner, B. E., Chan, Kin-Wing, Green, S., Lubowich, D. A. 1992b, ApJ, 399, 114
Wilson, T.L., Ruf, K., Walmsley, C.M., Martin, R.N., Pauls, T.A. & Batrla, W. 1982,
A&A115, 185
Ysef-Zadeh, F. 1986, in The Center of teh Galaxy, ed. M. Morris, Dordrecht: Kluwer) p.
243
Ziurys, L.M. & Friberg, P. 1987, ApJ, 314, L49
This preprint was prepared with the AAS LATEX macros v4.0.
– 9 –
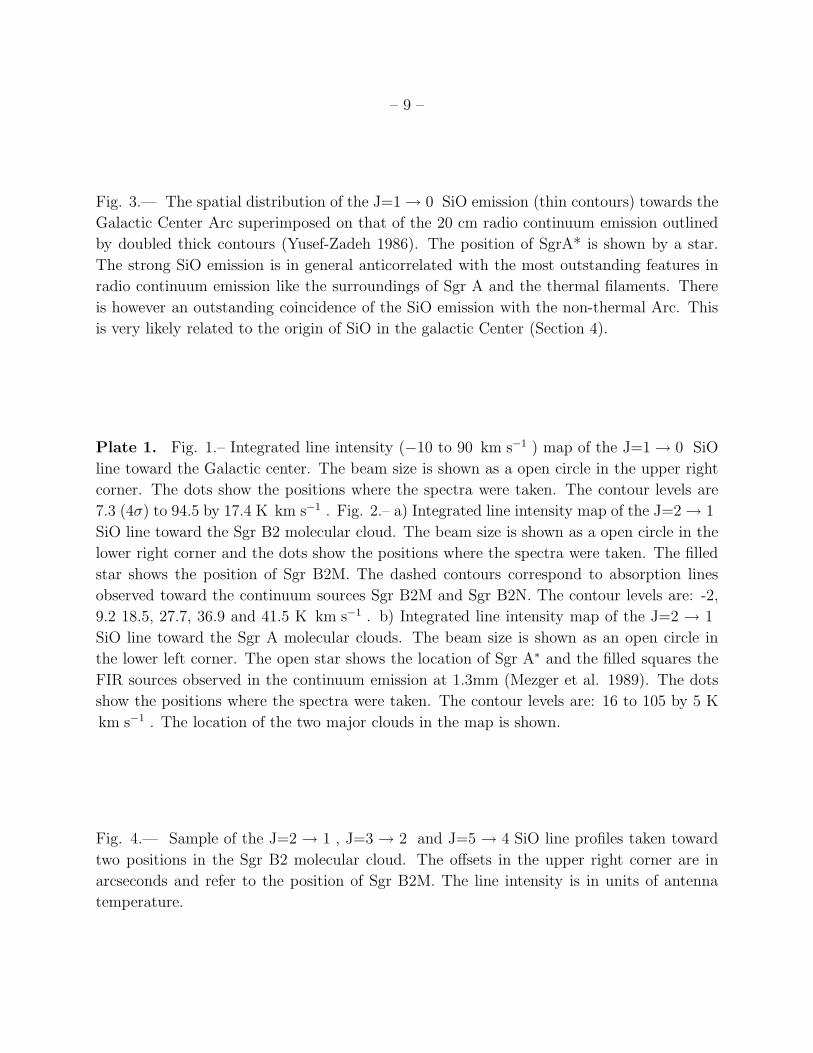
Fig. 3.— The spatial distribution of the J=1 → 0 SiO emission (thin contours) towards the
Galactic Center Arc superimposed on that of the 20 cm radio continuum emission outlined
by doubled thick contours (Yusef-Zadeh 1986). The position of SgrA* is shown by a star.
The strong SiO emission is in general anticorrelated with the most outstanding features in
radio continuum emission like the surroundings of Sgr A and the thermal filaments. There
is however an outstanding coincidence of the SiO emission with the non-thermal Arc. This
is very likely related to the origin of SiO in the galactic Center (Section 4).
Plate 1. Fig. 1.– Integrated line intensity (−10 to 90 km s−1 ) map of the J=1 → 0 SiO
line toward the Galactic center. The beam size is shown as a open circle in the upper right
corner. The dots show the positions where the spectra were taken. The contour levels are
7.3 (4σ) to 94.5 by 17.4 K km s−1 . Fig. 2.– a) Integrated line intensity map of the J=2 → 1
SiO line toward the Sgr B2 molecular cloud. The beam size is shown as a open circle in the
lower right corner and the dots show the positions where the spectra were taken. The filled
star shows the position of Sgr B2M. The dashed contours correspond to absorption lines
observed toward the continuum sources Sgr B2M and Sgr B2N. The contour levels are: -2,
9.2 18.5, 27.7, 36.9 and 41.5 K km s−1 . b) Integrated line intensity map of the J=2 → 1
SiO line toward the Sgr A molecular clouds. The beam size is shown as an open circle in
the lower left corner. The open star shows the location of Sgr A∗ and the filled squares the
FIR sources observed in the continuum emission at 1.3mm (Mezger et al. 1989). The dots
show the positions where the spectra were taken. The contour levels are: 16 to 105 by 5 K
km s−1 . The location of the two major clouds in the map is shown.
Fig. 4.— Sample of the J=2 → 1 , J=3 → 2 and J=5 → 4 SiO line profiles taken toward
two positions in the Sgr B2 molecular cloud. The offsets in the upper right corner are in
arcseconds and refer to the position of Sgr B2M. The line intensity is in units of antenna
temperature.
Copyright © 2022 FDOKUMEN