Hard real-time tasks' scheduling considering voltage scaling, precedence and exclusion relations
Upload
khangminh22Category
view
1download
0
HAL Id: tel-01436822https://tel.archives-ouvertes.fr/tel-01436822v2
Submitted on 16 Jan 2017
HAL is a multi-disciplinary open accessarchive for the deposit and dissemination of sci-entific research documents, whether they are pub-lished or not. The documents may come fromteaching and research institutions in France orabroad, or from public or private research centers.
L’archive ouverte pluridisciplinaire HAL, estdestinée au dépôt et à la diffusion de documentsscientifiques de niveau recherche, publiés ou non,émanant des établissements d’enseignement et derecherche français ou étrangers, des laboratoirespublics ou privés.
Scheduling on Clouds considering energy consumptionand performance trade-offs : from modelization to
industrial applicationsDaniel Balouek-Thomert
To cite this version:Daniel Balouek-Thomert. Scheduling on Clouds considering energy consumption and performancetrade-offs : from modelization to industrial applications. Distributed, Parallel, and Cluster Computing[cs.DC]. Université de Lyon, 2016. English. �NNT : 2016LYSEN058�. �tel-01436822v2�
Numéro National de Thèse : 2016LYSEN058
THESE de DOCTORAT DE L’UNIVERSITE DE LYON opérée par
l’Ecole Normale Supérieure de Lyon
Ecole Doctorale N° 512 en Informatique et Mathématiques de Lyon
Spécialité de doctorat :Informatique
Soutenue publiquement le 5 décembre 2016, par :
Daniel BALOUEK-THOMERT
Scheduling on Clouds considering energy consumption and performance trade-offs:
from modelization to industrial applications
Ordonnancement sur Clouds avec arbitrage entre la performance et la consommation d'énergie : de la
modélisation aux applications industrielles
Devant le jury composé de :
CARON Eddy Maître de Conférences - ENS Lyon CERIN Christophe Professeur - Université Paris 13 LEFEVRE Laurent Chargé de Recherches - Inria ENS Lyon DE PALMA Noel Professeur - Université Grenoble Alpes MORIN Christine Directrice de Recherches - Inria Rennes PARASHAR Manish Professeur - Rutgers University SONIGO Veronika Maîtresse de Conférences - IUT Besançon-Vesoul STOLF Patricia Maîtresse de Conférences - IUT Blagnac
Directeur Rapporteur Co-Encadrant Examinateur Examinatrice Rapporteur Examinatrice Examinatrice


A ma mere (et ses bons conseils...)
”Ne reste pas trop longtemps sur l’ordinateur, ce n’est pas bon pour la sante”
iii

iv

Acknowledgements
A toutes celles et ceux qui m’ont soutenu et encourage pendant ces trois annees, sans qui
rien de tout cela n’aurait ete possible. La these est une chance, et je me sens privilegie
d’avoir pu l’effectuer dans un cadre de travail tel que l’ENS et le LIP.
Je suis particulierement reconnaissant a l’ensemble des membres du jury, en par-
ticulier, Christophe Cerin et Manish Parashar pour avoir relu ce manuscrit en detail.
Ensuite, Christine Morin, Patricia Stolf, Veronika Sonigo et Noel de Palma pour avoir
accepte de rejoindre le jury.
Je remercie egalement Eddy, Laurent, Marcos, Helene, Issam, Julie-Anne pour leurs
relectures de la these et les quelques milliers de fautes qu’ils ont decele. Eddy, Laurent,
il est assez clair que je n’en serais pas la sans vous. Merci de m’avoir fait confiance tres
tot dans cette these et avoir toujours repondu a mes questions quelque soit le lieu, le
moment ou meme le fuseau horaire. Je vous serais eternellement reconnaissant d’avoir
partage vos methodes de travail, votre gout de la recherche et votre honnetete durant ces
trois annees. Vous avez su adapter le challenge de la these a mes envies et mes ambitions
sans en sacrifier la difficulte. Je peux imaginer qu’il aura fallu de la patience, et je vous
en remercie. J’espere avoir ete a la hauteur de vos attentes.
Eddy, pour l’ecoute, les vannes incessantes, la rigueur de travail parfois extreme mais
toujours bienveillante et constructive, les playlist de travail, le bapteme de moto et pour
la fois ou j’ai failli mourir dans un restaurant indien victime de la folie alimentaire de
notre guide.
Laurent, pour la bonne humeur, les recits d’aventures aux quatre coins du monde, la
curiosite scientifique et la volonte constante de desamorcer les conflits.
La societe NewGeneration-SR, pour avoir finance mes travaux et permis d’achever
cette these. Un clin d’oeil a ceux que j’ai croise ou avec qui j’ai collabore durant ma
these, Heri, Francois R., Francois A., Pierre, Gilles.
L’ensemble de l’equipe Avalon pour les discussions animees, les pauses cafe, les mis-
sions, evenements d’equipe et ce fameux dixieme bar que tres peu ont atteint.
Christian, pour m’avoir donne ma chance au sein d’Avalon apres mon Master, pour
avoir continue de suivre mes travaux de these et s’assurer que les conditions de travail
etaient bonnes, en tant que chef d’equipe et en tant que collegue.
v

Mathieu, pour m’avoir encadre durant mes annees d’ingenieur a travers un paquet de
bonnes pratiques, et pour m’avoir fait decouvrir Jurassic 5.
Julien, Simon, Cecile, Florent, pour m’avoir accueilli et integre dans l’equipe.
Marcos, Radu, mais egalement Issam et Mathilde, pour avoir ete mes co-bureaux
durant cette derniere annee de these. Beaucoup de rires et de discussions scientifiques
ont facilite l’ecriture de ce manuscrit.
Issam, pour le rap, H, les tacos a payer en liquide et la recherche vener, la vraie.
Helene, pour la decouverte du floorball, la bonne humeur et la super equipe de l’UE
parallelisme.
Adrian, George, pour des moments inoubliables au sein de notre bureau. Les dis-
cussions scientifiques, les graphiques et collaborations non-scientifiques, l’expedition a
Amsterdam, les bars lyonnais, les sessions skypes, les mauvaises blagues sur les grecs.
Matei, pour les soirees ligue des champions, les invitations toujours chaleureuses et
les plaintes sur nos theses respectives.
Laurent P., pour une amitie debutee sur les terrains et poursuivie en tant que collegues,
pour le gout du code propre et bien fait, pour ton aide constante et toujours bienveillante
malgre nos grands differents footballistiques.
Landri, pour le partage d’un peu de ton capital cool avec nous autres, simples mortels.
Pour les conseils de these, les barbecues dans ton manoir et pour m’avoir dit de ne jamais
ouvrir tes prototypes de recherche.
Noua, pour le mec le mieux habille de Lyon, les visites au chicken house, l’expertise
des soirees grenobloises, ta franchise et ta sincerite.
Fabien Rico et Nicolas Louvet, pour votre envie d’enseigner et pour m’avoir confie
vos eleves (en meme temps que vos corrections).
Flavien Quesnel et Adrien Lebre, pour les nuits passees sur Grid’5000 a debugguer
Flauncher. Je n’aurais jamais continue en these sans la passion et la motivation con-
tagieuses que vous avez deploye dans ce projet.
Yvan, Elise, Matthieu, Catherine, Lucille, Thomas, Jeremie, Marianne, fideles parmi
les fideles. Pour le meilleur groupe de potes au monde et la meme joie de vous retrouver
annees apres annees.
Brian, my brother from another mother. Pour cette amitie qui a marque nos annees
de recherche, presente dans les bons moments comme dans les coups durs, de Tokyo a
Paris en passant par Lisbonne. Pour toutes les visites surprises et les poignees de main
ratees par manque de coordination.
Yanri, pour les 400 coups sur Paris, les kebabs illicites et le fait d’avoir toujours pu
compter sur toi. Merci de m’avoir choisi comme temoin pour cette magnifique union.
Samir et Salimatou, mes comperes de la premiere heure. Paris 5 est loin mais je
n’oublierai pas cette aventure.
vi

Mayu, for visiting me in Lyon and maintaining our friendship across time and conti-
nents.
Ashley and Greg, for the true meaning of friendship and the hope we will not wait
another 15 years to share some drinks.
Steve, pour les aventures toulousaines et pour avoir toujours empeche ton chien de
me manger.
Stevens, pour tous les projets serieux et moins serieux sur lesquels nous avons colla-
bores.
Vincent C., pour nos racines parisiennes et avoir toujours garde le contact.
Louison, Didier, Frederic, Sylvain, pour votre chaleureux accueil a MEC, les repas du
soir et leurs fous rires.
Louison, pour ton gout de l’aventure et ta gentillesse.
Arya, Karunakar, for those days spent at exchanging knowledge and discussing cul-
tural backgrounds.
Hiba, pour tous les bons moments passes ensemble, ta connaissance encyclopedique
et communicative du cinema, les nuits avec Adrian Paul et Larry David, et ton soutien
de tous les instants.
Marie, pour les 20 ans d’amitie, les expeditions nocturnes dans les rues de Lyon, les
Tiger Wok a rallonges, les boissons fortes de basse qualite et ton coeur en or.
The Vogt Family, for giving me the spirit of travels and friendship.
Arrate, Pedro, Alex, Olatz y Javi, aunque sigamos caminos distintos, siempre os
agradecere como me habeis acogido y el tiempo que disfrutamos juntos
Les copains du foot, du basket et de la boxe. ENS Lyon, Futsal du LIP, Oranges
Mecaniques, U.S. Meloise, pour avoir continue a me passer le ballon malgre un nombre
d’occasions ratees seulement egal aux nombre de tacles juges litigieux par nos adversaires.
La famille. Doudou, Tonton Noel, Tonton Olivier, Cesar, Tantine Rosette, Tata Juju,
Tantine Georgette. Merci a ma mere qui a toujours cherche a comprendre ce qui pouvait
me faire aimer dans l’informatique et, a veille sur moi toutes ces annees.
Lauriane, pour etre une cousine exemplaire et ma partenaire de crime preferee.
Galou, parce que ton frere est a la fois ton pire ennemi et ton meilleur allie. Pour
les virees en voiture/bus/avion, les raclees nocturnes sur console, les mauvais matchs de
foot, les repas gigantesques et plus que tout, l’esprit de famille.
Julie-Anne, pour tout. Pour la lecture, les lectures, les relectures, les figures et le
reste; pour les secret handshakes, les road trips, la chasse aux pokemons rares, la peche,
le Mud day, les tacles dans l’herbe, la complicite et la belle vie qui nous attend.
Everlast, Chester Himes, Cudi, Omar Little, Lily, Rodman, Marshall Matters, Dil-
bert, Bruno Beausir, Celtics, De La Soul, Iggy, Milenko, Aquemini, Amy, Gambino pour
l’inspiration.
vii

Des lieux aussi, les gens qui les habitent et tous les souvenirs que j’emporte avec
moi: Lyon, la Normandie, Hyderabad, Austin, Marrakech, Tokyo. Et, par-dessus tout,
Chateau-rouge, la ou tout a commence.
viii

Table of Contents
Acknowledgements . . . . . . . . . . . . . . . . . . . . . . . . . . . . . . . . v
Table of Contents . . . . . . . . . . . . . . . . . . . . . . . . . . . . . . . . . ix
Abstract . . . . . . . . . . . . . . . . . . . . . . . . . . . . . . . . . . . . . . xiii
Resume en francais . . . . . . . . . . . . . . . . . . . . . . . . . . . . . . . . xv
1 Introduction . . . . . . . . . . . . . . . . . . . . . . . . . . . . . . . . 11.1 Energy consumption and performance trade-offs on clouds platforms . 21.2 Industrial impact and strategic stakes . . . . . . . . . . . . . . . . . . 51.3 Problems and objectives . . . . . . . . . . . . . . . . . . . . . . . . . 81.4 Methodology . . . . . . . . . . . . . . . . . . . . . . . . . . . . . . . . 91.5 Contributions . . . . . . . . . . . . . . . . . . . . . . . . . . . . . . . 91.6 Thesis organisation . . . . . . . . . . . . . . . . . . . . . . . . . . . . 10
I Scientific contributions 13
2 Energy efficiency in clouds and large scale platforms . . . . . . . . 152.1 Measurements and evaluation of energy efficiency . . . . . . . . . . . 152.1.1 Metrics . . . . . . . . . . . . . . . . . . . . . . . . . . . . . . . . 152.1.2 Node level . . . . . . . . . . . . . . . . . . . . . . . . . . . . . . . 20
2.2 Resource management . . . . . . . . . . . . . . . . . . . . . . . . . . 212.2.1 Objectives . . . . . . . . . . . . . . . . . . . . . . . . . . . . . . . 212.2.2 Virtualization . . . . . . . . . . . . . . . . . . . . . . . . . . . . . 222.2.3 Multi-objective optimization . . . . . . . . . . . . . . . . . . . . . 23
2.3 Cloud Ecosystem . . . . . . . . . . . . . . . . . . . . . . . . . . . . . 232.3.1 Providers . . . . . . . . . . . . . . . . . . . . . . . . . . . . . . . 232.3.2 Federations . . . . . . . . . . . . . . . . . . . . . . . . . . . . . . 24
3 GreenDIET: A framework for energy-aware scheduling consideringproviders and users tradeoffs . . . . . . . . . . . . . . . . . . . . . . 273.1 Introduction . . . . . . . . . . . . . . . . . . . . . . . . . . . . . . . . 273.2 GreenPerf . . . . . . . . . . . . . . . . . . . . . . . . . . . . . . . . . 283.3 Expression of user and provider involvement . . . . . . . . . . . . . . 303.3.1 Provider Preference . . . . . . . . . . . . . . . . . . . . . . . . . . 303.3.2 User Preference . . . . . . . . . . . . . . . . . . . . . . . . . . . . 31
ix

3.4 The DIET middleware . . . . . . . . . . . . . . . . . . . . . . . . . . 323.4.1 Overview . . . . . . . . . . . . . . . . . . . . . . . . . . . . . . . 323.4.2 DIET Plug-in Schedulers . . . . . . . . . . . . . . . . . . . . . . . 333.4.3 Adding Green capabilities . . . . . . . . . . . . . . . . . . . . . . 34
3.5 Validation . . . . . . . . . . . . . . . . . . . . . . . . . . . . . . . . . 373.5.1 Grid’5000: A testbed dedicated to experimental research . . . . 373.5.2 Simulations . . . . . . . . . . . . . . . . . . . . . . . . . . . . . . 393.5.3 Experiments . . . . . . . . . . . . . . . . . . . . . . . . . . . . . . 41
3.6 Conclusion . . . . . . . . . . . . . . . . . . . . . . . . . . . . . . . . . 45
4 Application to multi-criteria and evolutionnary computing . . . . 474.1 Introduction . . . . . . . . . . . . . . . . . . . . . . . . . . . . . . . . 474.2 Genetic metaheuristics . . . . . . . . . . . . . . . . . . . . . . . . . . 484.3 Non Sorting Differential Evolution II (NSDE-II) . . . . . . . . . . . . 504.3.1 Baseline Differential Evolution . . . . . . . . . . . . . . . . . . . . 514.3.2 Multi-Objective Differential Evolution NSDE-II . . . . . . . . . . 52
4.4 Problem Formulation . . . . . . . . . . . . . . . . . . . . . . . . . . . 544.4.1 Decision parameters . . . . . . . . . . . . . . . . . . . . . . . . . 544.4.2 Objective functions . . . . . . . . . . . . . . . . . . . . . . . . . . 55
4.5 Implementation . . . . . . . . . . . . . . . . . . . . . . . . . . . . . . 564.5.1 Diet Workflow capabilities . . . . . . . . . . . . . . . . . . . . . . 574.5.2 Optimization sequence . . . . . . . . . . . . . . . . . . . . . . . . 57
4.6 Experiments . . . . . . . . . . . . . . . . . . . . . . . . . . . . . . . . 594.6.1 Dataset . . . . . . . . . . . . . . . . . . . . . . . . . . . . . . . . 594.6.2 Settings . . . . . . . . . . . . . . . . . . . . . . . . . . . . . . . . 604.6.3 Parallelization . . . . . . . . . . . . . . . . . . . . . . . . . . . . . 614.6.4 Generation of solutions and Pareto fronts . . . . . . . . . . . . . . 624.6.5 Scalability and Reactivity . . . . . . . . . . . . . . . . . . . . . . 644.6.6 Workload placement . . . . . . . . . . . . . . . . . . . . . . . . . 65
4.7 Conclusion . . . . . . . . . . . . . . . . . . . . . . . . . . . . . . . . . 67
II Transfer of technology 71
5 Towards a national cloud computing service, the Nu@ge project . 735.1 Consortium . . . . . . . . . . . . . . . . . . . . . . . . . . . . . . . . 745.1.1 Motivation . . . . . . . . . . . . . . . . . . . . . . . . . . . . . . . 745.1.2 Consortium . . . . . . . . . . . . . . . . . . . . . . . . . . . . . . 74
5.2 Approach . . . . . . . . . . . . . . . . . . . . . . . . . . . . . . . . . 745.2.1 Overview . . . . . . . . . . . . . . . . . . . . . . . . . . . . . . . 755.2.2 V-node . . . . . . . . . . . . . . . . . . . . . . . . . . . . . . . . . 765.2.3 Storage node . . . . . . . . . . . . . . . . . . . . . . . . . . . . . 775.2.4 Network infrastructure . . . . . . . . . . . . . . . . . . . . . . . . 77
5.3 Related work . . . . . . . . . . . . . . . . . . . . . . . . . . . . . . . 795.3.1 Modular datacenters . . . . . . . . . . . . . . . . . . . . . . . . . 795.3.2 Distributed storage . . . . . . . . . . . . . . . . . . . . . . . . . . 79
x

5.4 Realizing the architecture with open components . . . . . . . . . . . . 815.4.1 OpenStack . . . . . . . . . . . . . . . . . . . . . . . . . . . . . . . 815.4.2 Federation scheduler using DIET Cloud . . . . . . . . . . . . . . . 82
5.5 Prototype . . . . . . . . . . . . . . . . . . . . . . . . . . . . . . . . . 845.5.1 StarDC . . . . . . . . . . . . . . . . . . . . . . . . . . . . . . . . 845.5.2 Building of an IaaS . . . . . . . . . . . . . . . . . . . . . . . . . . 855.5.3 Storage cluster . . . . . . . . . . . . . . . . . . . . . . . . . . . . 865.5.4 Supervision . . . . . . . . . . . . . . . . . . . . . . . . . . . . . . 87
5.6 PUE of Nu@ge . . . . . . . . . . . . . . . . . . . . . . . . . . . . . . 875.7 Energy-aware management . . . . . . . . . . . . . . . . . . . . . . . . 895.7.1 Autonomic and Adaptive Resource Provisioning . . . . . . . . . . 90
5.8 Conclusion . . . . . . . . . . . . . . . . . . . . . . . . . . . . . . . . . 93
6 Nuvea: An audit platform for energy-aware virtual machine man-agement . . . . . . . . . . . . . . . . . . . . . . . . . . . . . . . . . . . 956.1 Context . . . . . . . . . . . . . . . . . . . . . . . . . . . . . . . . . . 956.2 Approach . . . . . . . . . . . . . . . . . . . . . . . . . . . . . . . . . 976.2.1 Field survey of practitioners . . . . . . . . . . . . . . . . . . . . . 97
6.3 Analysis: A multi-layer solution . . . . . . . . . . . . . . . . . . . . . 1006.3.1 Market situation . . . . . . . . . . . . . . . . . . . . . . . . . . . 1016.3.2 Technical locks . . . . . . . . . . . . . . . . . . . . . . . . . . . . 102
6.4 Project management . . . . . . . . . . . . . . . . . . . . . . . . . . . 1036.5 Architecture . . . . . . . . . . . . . . . . . . . . . . . . . . . . . . . . 1056.6 Modules . . . . . . . . . . . . . . . . . . . . . . . . . . . . . . . . . . 1066.6.1 Data collection Engine . . . . . . . . . . . . . . . . . . . . . . . . 1066.6.2 Communication Bus . . . . . . . . . . . . . . . . . . . . . . . . . 1076.6.3 Analysis Engine . . . . . . . . . . . . . . . . . . . . . . . . . . . . 1076.6.4 Decision Engine . . . . . . . . . . . . . . . . . . . . . . . . . . . . 1086.6.5 Reporting Engine . . . . . . . . . . . . . . . . . . . . . . . . . . . 108
6.7 Implementation . . . . . . . . . . . . . . . . . . . . . . . . . . . . . . 1086.7.1 Nuvea Drivers . . . . . . . . . . . . . . . . . . . . . . . . . . . . . 1086.7.2 Bus . . . . . . . . . . . . . . . . . . . . . . . . . . . . . . . . . . . 1116.7.3 Storage . . . . . . . . . . . . . . . . . . . . . . . . . . . . . . . . 1126.7.4 Load injector . . . . . . . . . . . . . . . . . . . . . . . . . . . . . 1156.7.5 Nuvea actions . . . . . . . . . . . . . . . . . . . . . . . . . . . . . 1176.7.6 Characterization . . . . . . . . . . . . . . . . . . . . . . . . . . . 1186.7.7 Alert management . . . . . . . . . . . . . . . . . . . . . . . . . . 1196.7.8 Reporting and visualisation . . . . . . . . . . . . . . . . . . . . . 120
6.8 Conclusion . . . . . . . . . . . . . . . . . . . . . . . . . . . . . . . . . 126
7 Conclusion and Perspectives . . . . . . . . . . . . . . . . . . . . . . . 1297.1 Conclusion . . . . . . . . . . . . . . . . . . . . . . . . . . . . . . . . . 1297.2 Perspectives . . . . . . . . . . . . . . . . . . . . . . . . . . . . . . . . 1307.2.1 Exploiting virtual machine dependencies . . . . . . . . . . . . . . 1307.2.2 Exploiting virtual machine usage patterns . . . . . . . . . . . . . 1317.2.3 Integrating thermal-aware scheduling . . . . . . . . . . . . . . . . 131
xi

Bibliography . . . . . . . . . . . . . . . . . . . . . . . . . . . . . . . . . . . . 133
Tables . . . . . . . . . . . . . . . . . . . . . . . . . . . . . . . . . . . . . . . . 144
Figures . . . . . . . . . . . . . . . . . . . . . . . . . . . . . . . . . . . . . . . 146
xii

Abstract
Modern society relies heavily on the use of computational resources. Over the last
decades, the number of connected users and devices has dramatically increased, lead-
ing to the consideration of decentralized on-demand computing as a utility, commonly
named ”The Cloud”. Numerous fields of application such as High Performance Comput-
ing (HPC), medical research, movie rendering, industrial factory processes or smart city
management, benefit from recent advances of on-demand computation.
The maturity of Cloud technologies led to a democratization and to an explosion of
connected services for companies, researchers, techies and even mere mortals, using those
resources in a pay-per-use fashion. In particular, since the Cloud Computing paradigm
has since been adopted in companies. A significant reason is that the hardware running
the cloud and processing the data does not reside at a company physical site, which
means that the company does not have to build computer rooms (known as CAPEX,
CAPital EXpenditures) or buy equipment, nor to fill and maintain that equipment over
a normal life-cycle (known as OPEX, Operational EXpenditures).
This thesis revolves around the energy efficiency of Cloud platforms by proposing an
extensible and multi-criteria framework, which intends to improve the efficiency of het-
erogeneous platforms from an energy consumption perspective. We propose an approach
based on user involvement using the notion of a cursor offering the ability to aggregate
cloud operator and end user preferences to establish scheduling policies. The objective is
the right sizing of active servers and computing equipments while considering exploitation
constraints, thus reducing the environmental impact associated to energy wastage.
This research work has been validated on experiments and simulations on the Grid’5000
platform, the biggest shared network in Europe dedicated to research. It has been in-
tegrated to the DIET middleware, and a industrial valorisation has been done in the
NUVEA commercial platform, designed during this thesis. This platform constitutes an
audit and optimization tool of large scale infrastructures for operators and end users.
xiii

xiv

Resume en francais
La societe moderne s’appuie sur les ressources de calcul de facon intensive. Ces dernieres
annees, le nombre d’utilisateurs et d’appareils connectes a augmente de facon significa-
tive, conduisant a une adoptation de l’informatique decentralisee en tant que commodite,
communement appelee ”le Cloud”.
De nombreux champs d’applications tel que le calcul haute performance (HPC), la
recherche medicale, les procedes de fabrication industrielle et les reseaux de capteurs,
beneficient des avancees du calcul a la demande. L’avancement des technologies de Cloud
leur a permis de se democratiser et a conduit a l’explosion de services connectes pour les
entreprises, les chercheurs, techniciens et meme pour le commun des mortels qui peuvent
acheter un acces a ces ressources en fonction de leur usage personnel. Surtout, depuis
que le paradigme de Cloud Computing a ete adopte par les entreprises. Le materiel
qui fait fonctionner le Cloud et qui gere les donnees ne reside pas physiquement dans
l’entreprise qui l’utilise, ce qui evite donc a l’entreprise de dedier ou construire des pieces
informatiques, ou meme d’avoir a acheter et entretenir des equipements tout au long de
leur vie.
Malgre les benefices financiers et de fonctionnement, le Cloud peut avoir un im-
pact negatif sur l’environnement en termes de consommation d’energie. Des resultats
recents montrent que la consommation energetique IT represente 5% de la consomma-
tion energetique mondiale, ce qui souleve des problemes politiques et environnemen-
taux. L’empreinte carbone generee par l’alimentation et le refroidissement de nombreux
equipements tels que des serveurs est prohibitive pour la croissance de cette technologie.
A cause de la popularite de cette methode de stockage, le nombre total de serveurs sur
le globe a ete multiplie plus de 150 fois en moins de dix ans. D’autres etudes estiment
l’utilisation de ces serveurs a 18% de leur capacite totale, alors que 75% des couts lies a
l’informatique d’une entreprise sont des depenses energetiques.
Pour faire face a ce probleme d’utilisation abondante d’energie, il est necessaire de
trouver des ressources informatiques qui prennent en compte l’efficacite energetique. En
particulier, le fait de trop equiper, en prevision des pics de consommation, conduit a
la sous-utilisation de ressources le reste du temps, est extremement energivore. Par
consequent, garder des serveurs peu utilises est un enorme gaspillage en terme de con-
xv

sommation d’energie. Plusieurs approches peuvent etre mises en place afin de resoudre
ce probleme ; comme par exemple, la conception des installations, l’amelioration des
materiels ou encore la gestion des logiciels. Cette these propose une approche innovante
a ce sujet, en utilisant des trade-offs efficaces du point de vue energetique sur une plate-
forme a large echelle. L’idee cle est de generer un large eventail de solutions et de les
utiliser a bon escient afin de satisfaire aussi bien les utilisateurs que les fournisseurs, en
fonction des caracteristiques des ressources et des applications. Les evaluations sont faites
a partir de simulations mais aussi a partir d’experiences sur des traces d’exploitation reelle
de Clouds.
Le focus de cette these est le provisionnement efficace des resources et le placement
des applications, tout en considerant la volonte des utilisateurs et des fournisseurs de
services de reduire leur consommation energetique. Les travaux de these mettent l’accent
sur l’implementation et l’aspect pratique des solutions proposees. La Figure 1 expose une
vision simple de ce probleme.
(1) (2) (3) (4) (5) (1) (2) (3) (4) (5)
Manager
Provider User
Load
Server
capacity
Figure 1: Une schematisation de l’utilisation des serveurs et la visualisation des operationsd’optimisation.
Dans la premiere configuration, les serveurs sont tous actifs et faiblement utilises.
Dans la seconde configuration, en tirant parti de l’implication des utilisateurs et des four-
nisseurs, le gestionnaire de cloud execute unepolitique de provisionnement efficace des
serveurs dans le but de reduire le nombre de resource active et d’augmenter l’utilisation
des serveurs. L’efficacite energetique de cette petite infrastructure a ete ameliore en met-
tant a disposition les serveurs (2), (3) et (5) pour d’autres usages ou un fonctionnement
en basse consommation (veille, extinction).
Cette these presente deux applications industrielle des travaux de recherches. Chacune
xvi

des applications decrit des contraintes et challenges associes a des cas d’utilisation sur des
plateformes Cloud. Un datacenter represente une exploitation intensive de capital pour
assurer une continuite de service. Dans ce contexte, la valeur ajoutee de nos travaiux
peut-etre decrite sur la Figure 2.
Low Power
Mode
(OPEX)
New
Usage / Customers
(CAPEX)
Figure 2: Proposition de valeur ajoutee
Reduction des depenses d’exploitation (OPEX) Reduire le nombre de serveurs ac-
tifs reduit les couts d’exploitation en influant directement sur la facture energetique,
par la soustraction monetaire des equipements d’alimentation electrique et de re-
froidissement des serveurs
Reduction du capital d’exploitation (CAPEX) Des serveurs ”libres” peuvent etre
utilises pour de nouveaux usages clients ou de nouveaux services. Ils peuvent etre
egalement utilises pour des activites internes telles que l’analyse de donnees et la
sauvegarde.
Ethique environemmentale Une utilisation minimale d’energie promeut a une ex-
ploitation responsable, et peut procurer une avantage competitif
Les chapitres consistuant le coeur de cette these sont structures selon le schema
presente en Figure 3, et sont principalement issus de publications.
Le Chapitre 2 presente une analyse de la litterature associe aux mesures d’efficacite
energetique et a la gestion de resource dans les Clouds. Cette analyse a permis d’identifier
les challenges et verrous technologiques afin de determiner les directions prises dans la
suite du document.
Base sur cette analyse, le Chapitre 3 decrit la proposition d’une metrique d’evalutation
de l’efficacite energetique d’une resource, independamment de toute application. La
metrique, GreenPerf, est base sur la mesure de l’energie consomme durant la completion
d’un ensemble de service. Cette metrique est extensible en fonction de la quantite
d’iinformation disponible. Ces travaux ont ete integres dans le middleware DIET en
xvii

CHAPTER 2 CHAPTER 3 CHAPTER 4 CHAPTER 5 CHAPTER 6
Contribution
Approach
State-of-
the-art
Experiments,
software implementation
Production platform,
interoperability
Survey Requirement
analysis and
tradeo�s
Genetic
algorithms
Suggestion
engine
Standalone
platform
Figure 3: Thesis organisation
tant que GreenDIET, et utilises pour la creation de politique d’ordonnancement basee
sur la volonte des utilisateurs et fournisseurs de service d’economiser de l’energie.
Le Chapitre 4 etant cette approche en utilisant des meta-heuristiques prenant en
compte des taches dependantes, dit flux de travails (workflows). Nous avons etudies un
alforithme genetique dont la qualite des solutions de placement augemente par iterations
successives, mettant en lumiere les affinites entre les taches et les serveurs au regard de
la consommation energetique. La validation de cette proposition a ete effectuee sur des
traces d’execution reelles, avec un reduction signififcative de l’energie consomme et des
ameliorations dans la performance globale.
La premiere application industrielle est decrite dans le Chapitre 5. Le projet nu@ge
est motive par les problemes de souverainete des donnees dans le domaine du Cloud Com-
puting, et preopose l’implementation d’une federation de datacenters a taille reduite sur
le territoire Francais. Notre contribution prend la forme d’un aggregateur d’information
et de contraintes dans le but de selectionner les meilleurs serveurs de calcul et de placer
des machines virtuels a l’echelle nationale.
La plateforme Nuvea constitue la seconde contribution industrielle (Chapitre 6). Cette
platforme a ete cree selon deux perspectives: une utilisation commerciale au sein de la
societe NewGeneration-SR en tant que moteur d’optimisation pour la gestion dynamique
des infrastuctures de Cloud, et en tant que support de recherche au sein de l’equipe
Avalon. Le resultat de ces travaux a ete presente au sein de la communaute scientifique
et egalement integre a l’offre commerciale.
La gestion des datacenters et des plateformes de Cloud en considerant un arbitrage en-
tre la consommation enegetique et la performance pemettra aux fournisseyrs de proposer
des services correctements dimensionner, et ainsi evite une surconsommation energetique.
La recherche dans le domaine de l’efficacite energetique, telle que presente dans cette
these, combine a des modeles d’exploitation commerciale innovants permettra sans au-
cun doute des avancees dans le devellopement responsable des futurs services de calcul.
xviii

Chapter 1
Introduction
Modern society relies heavily on the use of computational resources. Over the last
decades, the number of connected users and devices has dramatically increased, lead-
ing to the consideration of decentralized on-demand computing as a utility, commonly
named ”The Cloud”. Numerous fields of application such as High Performance Comput-
ing (HPC), medical research, movie rendering, industrial factory processes or smart city
management, benefit from recent advances of on-demand computation.
The maturity of Cloud technologies led to a democratization and to an explosion of
connected services for companies, researchers, techies and even mere mortals, using those
resources in a pay-per-use fashion. In particular, since the Cloud Computing paradigm
has since been adopted in companies. A significant reason is that the hardware running
the cloud and processing the data does not reside at a company physical site, which
means that the company does not have to build computer rooms (known as CAPEX,
CAPital EXpenditures) or buy equipment, nor to fill and maintain that equipment over
a normal life-cycle (known as OPEX, Operational EXpenditures).
Despite its financial and operational benefits, the Cloud can have a negative impact
on environment in terms of energy consumption [1]. Recent figures calculate IT power
consumption as 5% of the global worldwide energy consumption, leading to environmental
and political issues [2]. The carbon footprint generated by powering and cooling a large
set of servers is prohibitive to the growth of the technology. Following this technology’s
popularity, the total number of servers on the globe has increased over 150 times in less
than a decade [3]. Other studies estimate the average load of these servers to 18% of their
capacity, while energy represents around 75% of the total cost of information technologies
(IT) infrastructures ownership [4].
To address this concern of high energy usage, it is necessary to deliver computational
resources with consideration of energy efficiency. In particular, over-provisioning, caused
by dimensioning infrastructures for peak times, leads to underutilized resources the rest of
the time, causing an unnecessary consumption of energy. Therefore, keeping servers un-
1

derutilized is a huge waste from the energy consumption perspective. Several approaches
can be considered to solve that matter such as facility design, hardware improvement or
software management.
This thesis proposes an innovative approach to this problem by using energy-efficient
trade-offs on large scale platform. The key idea is to generate a large spectrum of solutions
and use them to involve and satisfy both users and providers, based on the characteriza-
tion of resources and applications. Evaluations use simulations as well as real experiments
on synthetic workloads and real cloud traces. Prototypes were deployed and validated on
the Grid’5000 platform. Based on the academic results, production systems have been
developed in two industrial projects. This research work takes place in a context of a
collaboration between the industrial group NewGeneration-SR1 and the Avalon research
team2.
1.1 Energy consumption and performance trade-offs
on clouds platforms
All Cloud infrastructures offer the same characteristic: they give the possibility to the
user to obtain and dispose of the resources on demand and the ability to get access to
them from anywhere in the world. Different categories of services exist, based on the
model of delivering:
• Software as a Service (SaaS): the Software as Service Cloud enables the duplication
of a software, shared by multiple customers. The provider proposes an instance of
the code to each user and satisfy requests simultaneously.
• Platform as a Service (PaaS): This type of Cloud offers preconfigured environments
to facilitate and minimize the development effort. It advertises scalability and
adaptivity compare to traditional application development.
• Infrastructure as a Service (IaaS): IaaS constitutes the basis of Cloud models. One
can rent hardware resource without investing in a datacenter and have an infras-
tructure that fit to their needs and budget. An advantage is the use of up-to-date
hardware for the customer without maintenance or renewal concerns.
The proposed work in this manuscript deal with IaaS, where the platform or datacenter
presents a pool of remote resources, such as CPUs, GPUs, storage disks, etc. to be booked
via a network. It usually involves the following components as shown in Figure 1.1:
1NewGeneration-SR is a consulting company oriented on economic development and sustainability.2The INRIA Avalon research team is located in the LIP at the Ecole Normale Superieure de Lyon.
Thematics revolves around Algorithms and Software Architectures for Distributed and HPC Platforms
2

Users Users can request computational resources as (i) a service (the user will submit
data/tasks for a given application), or (ii) a platform (a set of virtual servers or
physical servers with minimal installation, mainly for further customization of the
software stack)
Access node(s) This is the front-end to the cloud platform, as the recipient of requests.
It often exposes an API to demand resource (i.e. the way to formulate requests).
Depending of the size and configuration of the cloud, it can be coupled with the
manager
Manager The manager operates as the brain of the platform. It contains the information
and availability of resources and selects the nodes based on a provisioning policy
and/or pricing
Compute nodes These servers read/receive the data, process it and deliver the service.
Nodes tend to be grouped in compute farms, and can be virtualized as a ”super
server” that can be sliced into virtual servers with different specifications of CPUs,
memory or internal storage
Storage Cloud storage is always a type of shared storage that can be connected to
multiple compute nodes simultaneously. Storage in the cloud can have different
features such as redundancy, guaranteed I/O rate or high availability.
In traditional schemes, users request resources based on hardware requirements and
specifications. The provider, that owns the resources, put them in place and share in-
formation with the manager. Following those, the manager aggregates the designated
and available resources and finds the best combination possible to match with the cus-
tomer needs. From an energy efficiency perspective the appropriate way to perform this
mapping is to set a combination of servers that is proportional to the real demand and
workload of the application. Methods have been considered to solve that issue. Relying
on virtualization technologies, dynamic consolidations allow the live migration of entire
systems (packed in virtual machines) from a physical node to another, with the purpose
of maximizing the utilization of hosts. Another possibility is brought by the use of hybrid
architectures. It implies the use of different hardware devices into one server unit with
different ranges of performance and energy consumption along the workload life-cycle.
Those techniques are often combined with the transition of unused nodes to low power
modes.
However, these approaches are not trivial due to the difficulty of profiling highly
variable workload patterns or developed multi-platform applications, and they enable
hybrid scheduling, leading to difficulty of adoption among cloud actors. In a context of
3

StorageCompute
nodes
Manager
Access node(s)
Users
Connection and
task submission
Storage of
users’ data
Task
scheduling
Figure 1.1: User vision of a Cloud platform
on-demand platforms, only a few approaches considers variables related to energy savings
into their provisioning schemes.
The scope of this thesis is the efficient provisioning of resources and the mapping of
applications while considering users and providers willingness to reduce energy consump-
tion, with an emphasis on the implementation and practicality of the solution. Figure
1.2 expose a simple vision of this problem. On the first configuration, all the servers
are active and lightly loaded. On the second configuration, with benefits of user and
provider involvement, the manager execute a smarter provisioning scheme to reduce the
number of active resource and increase the utilization of servers. The energy efficiency
consumption of this small platform has increased as servers (2),(4) and (5) can be used in
a better fashion or shutdown. In particular, it is necessary to handle heterogeneous work-
load since independent users dynamically request resources and execute various types of
applications. It means that the resource provider must be application-agnostic.
This thesis focuses on the efficient sizing and provisioning of computational resources
with consideration of reducing the target platform’s energy consumption and ensuring
the performance level requested by customers.
4

(1) (2) (3) (4) (5) (1) (2) (3) (4) (5)
Manager
Provider User
Load
Server
capacity
Figure 1.2: A schematization of servers load and visualization of optimization operations
1.2 Industrial impact and strategic stakes
Industrials and companies not only use the cloud technologies for the large amount of
resources but, more generally, as a vehicle for growth and transformation.
From the perspective of small businesses, cloud economical models allow to focus on
the speed of innovation and compete with larger groups by externalizing the burden of
hardware management and maintenance. The reduction of time to market (period of time
to propose a commercial offer), reduction of costs and improved collaboration enhanced
by connected organization tools are some of the main reasons for a young business to
capitalize on a cloud platform. As an example, Netflix is a company offering a subscription
service for streaming movies and TV shows. As it needs to support peak demands
during the times of highest usage, their Cloud-based model3 ensure them flexibility on a
worldwide pool of customers without the cost of IT ownership.
On the other side, large companies present different needs related to cloud services.
They often depends on software solutions and hardware infrastructures that cannot be
easily replaced due to past investments and integration into larger organizations. They
need to manage the legacy of their strategies while answering the demand of customers
and integration of new services.
We can summarize those requirements by a need of consolidation/improvement of ex-
3in this specific example, relying on Amazon Web Services
5

isting infrastructure and a unified access to a distributed infrastructure to start new mar-
kets. The critical increase in power consumption of the IT sector is ofter under-considered
by the current market situation. The rush for enhanced performance, supported by even
more powerful machines, has left many levers for energy management and optimization
unexplored. The current market is driven by providers offers but does not allow clients
to access to the full premise of cloud computing, therefore, having little knowledge of
energy concerns.
The large spectrum of offers and associated vendor locking4 tends to put customers
under a single technology without the ability to reconsider their strategies. In this context,
we intend to challenge the existing vendor locking system in the cloud market and ease
the adoption of energy efficient software and practices.
In articulation with the research work, we approach this a mult layer problem divided
into different ideas:
• Understanding the existing infrastructure and activity of customers
• Creating and offering customizable and non intrusive levers for optimization
• Ease the interoperability to favor market challenges
An emphasis will be put on fast industrial transfer and agile management to enable
a circle of innovation close from the reality of market. This strategic vision and the
associated objective can be structured under four perspectives, following Kaplan’s method
[5] presented in Figure 1.3.
The Learning and Growth perspective represents the creation of an innovation
process. It puts an emphasis on the ability to depict activities and objectives from
conception to implementation while building skills and expertise for the team members.
The definition of metrics and quality and performance along with the identification of
risks allows the fulfillment of business plans and their adaptability to reach the market.
The Customer perspective considers the customer needs and their proper character-
ization. The customer loyalty relies on the success of this process, by understanding and
proposing relevant solutions to its business machinery.
The Internal Business Process perspective is associated to internal management
and collaboration between partners. An efficient organization, in particular between
research and industrial partners increase collaboration and feedback, while conceding
antagonist goals (academic publication, intellectual property, early communication, etc.).
Finally, the Financial perspective takes into account the funding and costs of activ-
ities to ensure profitability of the company.
4also known as proprietary lock-in or customer lock-in, makes a customer dependent on a vendor forproducts and services, unable to use another vendor without substantial switching costs.(Wikipedia)
6

S t r a t e g i c V i s i o nCustomer
Internal
Business
Process
Financial Perspective
Learning & Growth
Figure 1.3: Perspectives on the creation of a cloud product following Kaplan’s method
This thesis document presents two industrial applications of our research work. Both
projects present concerns and challenges related to the existing cloud situations along
with management and situations constraints. As a datacenter requires capital-intensive
infrastructure to ensure continued operation, the value proposition of this work can be
seen as depicted in Figure 1.4):
Low Power
Mode
(OPEX)
New
Usage / Customers
(CAPEX)
Figure 1.4: Value proposition
Reduction of OPerational EXpenses (OPEX) Reducing the number of active servers
saves exploitation costs by cutting on the electricity bill to power servers and cooling
systems that remove excess heats from those.
7

Reduction of CAPital EXpenses (CAPEX) Freed servers can provide extra capac-
ity to sign new customers and develop new services, such as leasing. They can also
be used for in-house activities such as backup and data analysis.
Environmental ethic Using as few energy as possible promotes sustainability, and can
also create a competitive advantage among the market.
1.3 Problems and objectives
This thesis tackles the research challenges in relation with the energy-efficient scheduling
of a set of computing tasks associated to an application or a service on a large scale
on-demand platform. In particular, the following research problems are investigated:
How to define an application-independent metric for measuring energy efficiency
Applications or services of various types can be executed in the cloud. It is necessary
to characterize the behavior of a resource workload execution with an independent
metric within a given period.
How to express the willingness of actors to save energy The problem consists in
taking into account the context of operation described by the provider (servers
availability, energy price, etc.) and the performance level requested by the users to
determine an appropriate subset of servers with minimal energy consumption
How to search and express trade-offs in a multi-objective space Balancing actors
preferences when scheduling the requests over the physical nodes expresses objec-
tives of contradictory nature. The search and computation of these solutions is
a NP-Hard problem, which can be formulated as an optimization problem with
multiple contrary objectives: minimizing both energy consumption and completion
time.
To deal with the challenges associated with the above research problems, the following
objectives have been delineated:
• Explore and analyze the research work in the area of energy-efficient scheduling to
understand the current approaches
• Propose a metric to contextualize the behavior of the platform in terms of perfor-
mance and energy consumption
• Conduct simulations and experimentation using the metric to obtain insights on
the design of algorithms for energy-aware resource management
8

• Implement those mechanisms into an existing middleware for validation with cloud
traces and industrialization on production platforms
• Extend the approach to other schemes and the use of third party tools to ease its
utilization and adoption in other contexts or within the scientific community.
1.4 Methodology
The research methodology followed in this thesis consists in several consecutive steps
summarized below:
1. Conduct theoretical analysis of metrics for energy efficiency;
2. Evaluate the different placement policies in terms of performance loss and energy
reduction by executing a synthetic workload;
3. Implement a research prototype based on an existing middleware and the consid-
eration of provider and user preferences;
4. Extend the approach to generate larger spectrum of placement solutions and take
into account workloads of mixed demands using a genetic algorithm;
5. Evaluate the prototype with real cloud traces on a testbed;
6. Industrialization on production platforms with an emphasis on open source and
interoperable libraries;
1.5 Contributions
The contributions of this thesis can be broadly divided into 3 categories: (i) novel ap-
proach for energy and performance trade-offs, (ii) implementation of a framework for
multi-objective and under constraints placement, (iii) application to industrial projects
and production environments.
1. A state-of-the-art for measurement, evaluation and resource management of energy
efficient cloud resources
2. Characterization of resources using an application-independent metric
3. Software implementation of the GreenDIET framework for energy-aware workload
placement
4. Novel differential evolution approach for multi-objective scheduling
9

5. Software implementation of the Nu@ge project scheduler
6. Architecture description and implementation of the Nuvea platform
1.6 Thesis organisation
CHAPTER 2 CHAPTER 3 CHAPTER 4 CHAPTER 5 CHAPTER 6
Contribution
Approach
State-of-
the-art
Experiments,
software implementation
Production platform,
interoperability
Survey Requirement
analysis and
tradeo�s
Genetic
algorithms
Suggestion
engine
Standalone
platform
Figure 1.5: Thesis organisation
The core chapters of this thesis are structured as shown in Figure 1.5 and are derived
from articles and journals published during the PhD candidature. The remainder of the
thesis is organized as follows:
• Chapter 2 gives an overview of the related work for energy efficiency in datacenters.
• Chapter 3 presents the design, implementation and evaluation of GreenDIET, a
framework for energy-aware provisioning based on the diet middleware, relying on
a metric for energy efficiency.
Chapter 3 is derived from [6]:
– Daniel Balouek-Thomert, Eddy Caron, and Laurent Lefevre. Energy-aware
server provisioning by introducing middleware-level dynamic green schedul-
ing. In Workshop HPPAC’15. High-Performance, Power-Aware Computing,
Hyderabad, India, May 2015. In conjunction with IPDPS 2015
• Chapter 4 proposes the use of differential evolution algorithm for a deeper search
of trade-offs between energy reduction and performance. This chapter is derived
from [7]:
– Daniel Balouek-Thomert, Arya K. Bhattacharya, Eddy Caron, Gadireddy Karunakar,
and Laurent Lefevre. Parallel differential evolution approach for cloud work-
flow placements under simultaneous optimization of multiple objectives. In
10

Congress on Evolutionary Computation (IEEE CEC 2016), Vancouver, Canada,
July 2016
• Chapter 5 describes the architecture and implementation of an energy-aware sched-
uler within the Nu@ge project, a national mesh of container-sized datacenter over
the French territory. This chapter is derived from [8] [9]:
– Daniel Balouek-Thomert, Eddy Caron, Pascal Gallard, and Laurent Lefevre.
Nu@ge: Towards a solidary and responsible cloud computing service. In CloudTech’2015,
Marrakesh, Morocco, June 2015
– Daniel Balouek-Thomert, Eddy Caron, Pascal Gallard, and Laurent Lefevre.
Nu@ge : A container-based cloud computing service federation. In Concur-
rency and Computation: Practice and Experience (CCPE), John Wiley and
Sons, Ltd, USA, 2016 (in review)
• Chapter 6 describes the features of the Nuvea platform, dedicated to the evaluation
and optimization of cloud platform, along with the technical locks and challenges
associated with the projects.
• Chapter 7 concludes the thesis with a summary of main findings, discussion of
future research directions, and final remarks.
11

12

Part I
Scientific contributions
13


Chapter 2
Energy efficiency in clouds and large
scale platforms
Chapter 1 has presented the scope of this document: we aim at addressing the concern of
energy-aware management in a context of resource management and workload placement.
This chapter describes existing work from the literature related to this concern.
Datacenters can be seen as complex cyber-physical systems. The on-going activity
determine the physical properties such as power consumption and generated heat. En-
ergy efficiency can be considered at different levels: the facility level (physical site or
construction that contains the servers) and the server/node level. These two aspects are
presented in the first section. We discuss the relevancy of those work and their influence
on this thesis orientation.
After discussing the efficiency of resources, we investigate resource management and
workload placement. From Grids to Clouds, the placement of services to resources has
been well studied. The focus of the study will be put on systems that considers energy
consumption when mapping applications to resources.
Finally, we present an overview of the Cloud ecosystem with a list of major providers
and their features.
2.1 Measurements and evaluation of energy efficiency
2.1.1 Metrics
The facility represents the datacenter or any room with an aggregation of servers, and of-
ten the presence of power supplies and cooling systems. An average data center consumes
as much energy as 25,000 households [10].
Several metrics have been proposed and discussed for evaluating the energy efficiency
of datacenters [11, 12, 13, 14, 15]. The most influential metrics are presented in the
15

following section.
PUE Power Usage Effectiveness (PUE) is the most widely used metric nowadays. PUE
divides a facility’s total power draw by the amount of power used solely by the data
center’s IT equipment:
PUE =TotalFacilityEnergy
ITEquipmentEnergy(2.1)
IT Equipment Energy considers the energy consumed by servers, networking de-
vices, storage units and peripheral items. Total Facility Energy includes IT equip-
ment and all data center-related primary electrical systems (power distribution
units and electrical switching gear), standby power systems (Uninterruptible Power
Sources [UPS]), cooling components, and other infrastructure elements. The closer
the value is to 1 (the minimum possible score, all the power provided is used by
IT equipment), the more efficient the data center is considered to be: a lower PUE
indicates that a greater portion of the power going to a data center is used for its
essential tasks and is not going wasted. For example, a PUE of 1.5 means a data
center needs half as much additional power as is solely needed for the IT equip-
ment to operate, whereas a PUE of 3.0 means a data center needs twice as much
additional power for non-IT elements as it does for IT hardware.
Despite its de facto standard in the datacenter industry, one can argue that the
PUE has several limitations; namely it can greatly vary depending on:
• IT load: A datacenter might exhibit a lower PUE when under high load, but
most of them are not used that way all the time. Plus a high IT load increase
power consumption of IT systems but cooling systems do not scale accordingly.
• Different local temperatures outside the DC: The power dedicated to cooling
highly systems will depend on location and duration of the tests. A datacenter
might exhibit a lower PUE if located in cold areas or if the measure was
performed in a specific season.
• Redundancy: High availability can require additional equipments to ensure
continuity of service in case of power outages or hardware failures. These
equipments would increase the PUE, resulting in an unfair comparison with
more simple datacenters.
Hence, PUE needs additional contextual information to perform proper comparison
of datacenters [16].
DCIE the Data Center Infrastructure Efficiency (DCIE) is a variant of the PUE as,
16

where IT equipment power is divided by total facility power:
DCIE =ITEquipmentEnergy
TotalFacilityEnergy(2.2)
DCIE is expressed as an inverted PUE (Figure 2.1) to obtain a percentage value:
For example if a data center’s PUE is 1.5, DCIE shows that 2/3 (1/1.5=66 percent)
of the data center power is consumed by the IT equipment. DCIE is sometimes
preferred to the PUE because increasing values indicate a higher energy efficiency
(i.e. higher is better).
33% 40% 44% 50% 57% 67% 80%
3.00 2.50 2.25 2.00 1.75 1.50 1.25
DCIE
PUE
LESS EFFICIENT MORE EFFICIENT
Figure 2.1: Visualization of the PUE and DCIE metrics
DCP Data Center Productivity not only measures the consumption of a data center-
related resource, but also quantifies the useful work that a data center produces
based on the amount of energy it consumes. In short, DCP tries to define what a
data center accomplishes in relation to what it consumes. The formula for DCP is:
DCP =UsefulWorkproducedbydatacenter
ResourceConsumedproducingthework(2.3)
However, while DCP seems a simple and straightforward metric, it is hard to know
what each organization will consider as useful work for a data center, so this makes
it a subjective metric, unreliable when comparing different data centers. DCP is
more valuable for an operator in order to compare its own lever of optimization or
comparing two datacenters executing the same workload.
CADE McKinsey & Co. and the Uptime Institute introduced the Corporate Average
Data Center Efficiency (CADE) metric to measure data center performance in a
way that encompasses both IT and facilities’ technologies. CADE is composed by
four elements:
• Facility energy efficiency: how much of the power drawn from the electric grid
by the data center is being used by IT equipment;
17

• Facility asset utilization: how much of the data center’s maximum electrical
capacity is in use; IT asset utilization: the average CPU utilization of servers
in the data center;
• IT energy efficiency: this measurement has not been precisely formulated yet,
but is intended to describe how efficiently servers, networking equipment and
storage units use the power they are drawing to perform their functions
Combining the first two factors determines the efficiency of the facility; combining
the second two determines the efficiency of the IT assets. Each factor is expressed
as a percentage and then multiplied by the other:
• FE = Facility Energy Efficiency x Facility Utilization
• AE = IT Energy Efficiency x IT Utilization
• CADE = FE x AE
CADE can be seen as an incentive to increase IT utilization. As the definition of
IT energy efficiency has not been precisely formulate yet, it can seems pretty hard
to define. We see it as a metric for operational efficiency as removal of unused/old
servers or demand management have a direct impact on CADE.
DH-UR Deployed Hardware Utilization Ratio (DH-UR) determines which fraction of IT
equipment is not running any application or handling important data. This metric
is designed because most IT equipment is always switched on -unless specifically
intended not to - regardless whether a given component is doing something impor-
tant or not. As a result, such ’dormant’ equipment can waste significant amount of
power during their lifetime. DH-UR can be defined for both servers, as follows:
DH-UR(servers) =Slive
Stotal
(2.4)
where S live indicates the number of server running live applications and S total
indicates total number of deployed servers, or for storage elements as follows:
DH-UR(storage) =Dataaccessed
Datatotal(2.5)
where Dataaccessed indicates the number of terabytes of storage holding frequently
accessed data and Datatotal indicates the total terabytes of deployed storage.
DH-UE Deployed Hardware Utilization Efficiency (DH-UE) is a dimensionless ratio that
expresses the level of underutilization of servers and storage units. This metric is
18

designed because, in non-virtualized environments, servers typically run a single ap-
plication, using only 10-30% of their computing load - a situation commonly known
as “server sprawl” [17]. Since servers running at low computation loads often draw
nearly as much power as those running at high loads, a large number of such partly
loaded servers can quickly consume valuable UPS and HVAC capacity and raise
the electricity bill. When the DH-UE is significantly below 1 (the theoretical max-
imum), implementing virtualization is advised in order to increase the utilization
rate. DH-UE for servers is defined as follows:
DH-UE(servers) =Smin
Stotal
(2.6)
where Smin indicates the minimum number of server needed to handle peak com-
puting load and Stotal indicates total number of deployed servers.
SI-POM The Site Infrastructure Power Overhead Multiplier (SI-POM) determines the
amount of overhead a data center consumes to power its critical IT equipment. It
is defined as follows:
SI-POM =PDC
PIT
(2.7)
where PDC expresses the data center consumption at utility meter and PIT expresses
the total hardware power consumption at the plug for all IT equipment. SI-POM,
proposed by the Uptime Institute, is basically equivalent to the PUE, as it includes
all the conversion losses in transformers, UPS, PDU and critical power distribution
losses, as well as cooling systems, lights and other minor building loads. The main
difference is that SI-POM explicitly mentions “overhead” rather than “efficiency”,
hence lower values are more intuitively linked to higher efficiency.
H-POM The Hardware Power Overhead Multiplier (H-POM) determines the amount of
power wasted in power supply conversion losses or diverted to internal fans, rather
than in useful computing power. For a single device, H-POM is defined as follows:
H-POM =PAC
PDC
(2.8)
where PAC expresses the Alternating Current hardware load at the plug and PDC
expresses the Direct Current hardware load before the power supply.
The previously described metric can be generally expressed as a ratio between a useful
measure of activity/consumption and its total value. PUE and DCIE are widely popular
in the industry. These two metrics are often used as a sales argument when it comes
to new facilities. However, their usability and computation is restricted: one need a
19

fair amount of information that is usually restricted to the manufacturer (equipment
specifications, etc.) and the conditions of evaluation (duration, location, effective load)
are often hidden. Consequently, in practice, most of the research work focus on the
computing units themselves to measure the energy efficiency of an infrastructure.
The second category of metrics focuses on the IT equipment. With regards to the low
proportionality of hardware and ”server sprawl” concerns, these metrics integrates the
utilization rate of resources. Combining DH-UR (portion of active hardware) and DH-
UE (portion of hardware necessary to peak periods) promotes good practices in terms
of characterization of servers activity regarding the application usage. CADE combines
those approaches with the consideration of facility electrical capacity. These metrics do
not require additional hardware or software to be computed and data can be fairly easy
to come by. It can be possible to compare relative productivity of different datacenter
management system using the same application set. The main disadvantage is the relative
difficulty to compute them without knowledge of the overlying applications running, in
particular, if one has to determine if the cpu utilization of a certain node comes from a
dormant usage or a critical operation.
Finally the Power Overhead Multiplier metrics, SI-POM and H-POM, are focused in
electric leakages in power distribution and transformers. We consider them manufacturer-
oriented as workload placement by software management will have a minimal impact on
them.
2.1.2 Node level
Before the raising concerns around energy consumption, the problem of capturing the
overall performance of a system has been well studied.
Giladi [18] investigated the FLoating-point Operations Per Second (FLOPS) metric
as a measure of computer performance, useful in fields of scientific calculations that
make heavy use of floating-point calculations. He used statistical analysis to validate
the relevancy of the M(ega)FLOPS metric over different problem sizes and applications.
The FLOPS don’t consider factors as load (heavy/light load or regular patterns) or
the different categories of operations. It is currently use in the HPC field to evaluate
supercomputers [19] [20].
Hsu et al. compared several metrics in [21] and concluded that the performance-power
ratio was appropriate to represent energy efficiency. A metric to aggregate the energy
efficiency of all components of a system in a single number has been proposed by Subrama-
niam et al. [22], using benchmarks which produces different metric as output. Regarding
to energy consumption of nodes, several studies indicates that the CPU presents the main
consumption of a server [23] [24] [25].
Table 2.1.2 shows the energy consumed by a typical rack server [25].
20

Component Peak power Count Total Percentage
CPU 40 W 2 80 W 37.6 %
Memory 9 W 4 36 W 16.9 %
Disk 12 W 1 12 W 5.6 %
PCI slots 25 W 2 50 W 23.5 %
Motherboard 25 W 1 25 W 11.7 %
Fan 10 W 1 10 W 4.7 %
System total 213 W
Table 2.1: Component peak power breakdown for a typical server
Energy consumption of computing resources can be determined by physical energy
sensors (like wattmeters) or estimated by energy models. Deploying energy sensors can
present a significant cost and/or encounter space constraints if not done at the time of
setting the infrastructure. On the other hand, the use of energy models can ofter interfere
with the system they try to estimate [25][26].
A few software utility were developed from the energy consumption perspective. Pow-
ertop is a linux tool developed by Intel and whose goal is ”find the software component(s)
that make a laptop use more power than necessary while it is idle”. It uses ACPI1 and
present settings that influence the battery life and discharge rate. Microsoft Joulemeter
[27] estimates the power consumption by tracking internal information on different hard-
ware components. The operating system restriction can be prohibitive for customization
and experimentation purposes. PowerAPI [28] enables the creation of software defined
powermeters through configurable libraries. It requires the knowledge and implementa-
tion of energy models by the developer, and is functional for a restrictive set of Intel
hardware.
2.2 Resource management
2.2.1 Objectives
In the context of Cloud computing, resource management is understood as the process
of allocating computing, storage, networking and (indirectly) energy resources to a set
of applications [29], in order to jointly meet the performance objectives of applications,
infrastructures (i.e., datacenter), providers and users of the cloud resources. An example
1ACPI is a standard developed by Hewlett-Packard, Intel, Microsoft, Phoenix Technologies andToshiba. Its goals are to reduce a computer’s power consumption by switching off its components,whereas the operating system manages the power supply of each component.
21

of typical objective of Cloud providers is the Amazon EC2 service [30], which defines an
availability objective of monthly uptime percentage of at least 99,95% for Amazon EC2
within a region.
In addition to management objectives related to satisfying customer Service Level
Agreement (SLA), the provider may pursue objectives specifically related to the man-
agement of its own datacenter infrastructure. Such objective could, for example, include:
load balancing, whereby resources should be allocated in a fashion that utilization is
balanced across all resources of particular type [31, 32, 33, 34]; fault tolerance, whereby
resources are allocated in a manner such that the impact of a failure is minimized [35],[36];
or energy use minimization, whereby data center resources are allocated in a manner that
the amount of energy to execute a given workload is minimized.
This section will focus on techniques that consider energy use minimization in the
management of the infrastructure.
2.2.2 Virtualization
Virtualization is the most used technique for energy efficiency. A research from Gartner
and VMware in 2012 estimates overall adoption rates to be 50-75%. However, despite
the wide adaptation of virtualization, the server utilization rate from 2006 to 2012 has
remained unchanged between 12 and 18 percent [37] [38].
With virtualization, the computer’s physical resources, such as servers, network, mem-
ory and storage, are abstractly presented after conversion, so that users can use those
resources through customizable virtual machines. Live migration refers to the process
of moving a running virtual machine or application between different physical machines
without disconnecting the client or application. Memory, storage, and network con-
nectivity of the virtual machine are transferred from the original host machine to the
destination.
Early work by Orgerie et al. [39] proposed energy-aware framework using ON/OFF
models combined with prediction solutions. The described solution act as an overlay to
usual Cloud manager to aggregate resources reservations and apply green policies while
avoiding frequent ON/OFF cycles. Stoess et al. [40] proposed a framework for energy
management on virtualized servers using power limits dictated by a power generator or
thermal constraints. Beloglazov [41] rely on virtualization using a threshold-based ap-
proach to perform live migrations as a host gets under/overloaded and consolidate virtual
machines on a minimal number of hosts, thus reducing energy by shutting down the oth-
ers. In [42], authors uses soft scaling and server consolidation to minimize energy under
performance constraints. Garg [43] leverages heterogeneity of hardware to minimize CO2
emissions while considering the profit of the provider. While those works are only con-
sidering CPU, Kumar et al. [44] take into account CPU, RAM and network to minimize
22

power under performance and budget constraints based on Dynamic Voltage Frequence
Scaling (DVFS). Other works proposes to increase energy proportionality by considering
placement on hybrid processors depending on the effective load of applications [45].
2.2.3 Multi-objective optimization
Several approaches using multi-objective optimization to manage workload placement are
present in the literature [46, 47]. Objectives refer to load balancing [48], load prediction
or platform reconfiguration [49], among others. A Pliant logic approach is used in [50] to
improve energy efficiency in simulation based experiments. The authors conclude with the
need to find trade-offs between energy consumption and execution time for optimization.
Although most of the above works deal with workflow scheduling on Clouds using Multi-
Objective Evolutionary algorithms, they have not explored the parallelism potential of
the Cloud infrastructure in the scheduling process itself. One of the first developments
in that direction is seen in [51], where a Genetic Algorithm is used for optimization and
Dynamic Voltage Scaling to minimize energy consumption. A comprehensive review of
the state of the field is presented in [52]; work on parallelism of Differential Evolution
algorithms in this context is yet to be reported.
In Chapter 4, we propose the design, implementation of a differential evolution algo-
rithm for workflow placement on heterogeneous resources. Evaluation is performed on a
real life testbed and considers the CPU, disk and network resources described in a cloud
trace. More details about evolutionary heuristics are also presented.
2.3 Cloud Ecosystem
2.3.1 Providers
There exists several surveys on cloud providers [53] [54]. Table I shows a classification
of the current major public IaaS providers. The list of providers, extracted from [55],
is by no means exhaustive, but it includes current major players in the European and
North American markets. Most Cloud providers operate according to their own models
and protocols. This problem can lead to vendor lock-in and restrict the transition and
interoperability across providers [56]. Furthermore, the headquarters and datacenters
location columns show that most providers are based in the USA while only a few are
based in Europe.
A means to avoid vendor lock-in is to use open IaaS stack such as OpenStack 2 or
VMWare vCloud [57], for creating and managing infrastructure cloud services in private,
public, and hybrid clouds.
2Openstack, https://www.openstack.org/
23

2.3.2 Federations
The Cloud federation approach [58] aims to resolve issues of both providing a unified
platform for managing resources at different levels and abstracting interaction models of
different cloud providers. Several European projects are providing stacks and/or adapta-
tion of cloud-based systems at IaaS levels. Contrail [59], [60] aims at solving the vendor
lock-in problem by allowing the seamless switch among cloud providers. InterCloud [58]
is a federated cloud computing environment that aims at provisioning application in a
scalable computing environment, achieving QoS under variable workload, resource and
network conditions. In the Reservoir project [61], the authors propose an architecture for
an open federated cloud computing platform. In such architecture, each resource provider
is an autonomous entity with its own business goals. Celesti et al. [62], proposes the
Dynamic Cloud Collaboration, an approach for setting up highly dynamic cloud federa-
tions. A distributed agreement must be reached among the already federated partners to
dynamically federate a new provider.
Chapter 5 and 6 presents applications of our research work on industrial use cases.
24

Provider Headquarters Datacenters location
Amazon AWS USA USA, Brazil, Ireland, Japan, Singapore, Australia
AT&T Cloud USA USA
GoogleComputeEngine
USA USA, UK
Hosting.com USA USA
GoGrid USA USA
MicrosoftWindows Azure
USA USA, Ireland, Netherlands, Hong Kong, Singapore
Rackspace USA USA, UK, Hong Kong
OpSource USA USA, France, UK
Terramark USA USA, Canada, Brazil, Colombia, Dominican Republic,Belgium, France, Germany, Ireland, Italy,
Luxembourg, Netherlands, Spain, Sweden, Turkey, UK,China, Japan, Singapore, Australia
Softlayer USA USA, Netherlands, Singapore
Aruba Cloud Italy Italy
CloudSigma Switzerland Switzerland, USA
Gandi France France, USA
GreenQloud Iceland Iceland
Lunacloud UK France, Germany, Latvia, Portugal
CloudWatt France France
Numergy France France
Table 2.2: Major Cloud providers with location of their infrastructure.
25

26

Chapter 3
GreenDIET: A framework for
energy-aware scheduling considering
providers and users tradeoffs
3.1 Introduction
The chapter proposes a metric for evaluating the energy efficiency of resources by estab-
lishing a relationship between the performance of hardware and its energy consumption
for a specific application. Next, the expression of user and provider preferences are de-
scribed. We aim at offer the ability to express levels of performance between energy
consumption and performance when allocating resources.
Then, this Chapter presents the design of an energy-aware framework for resource
management, that provides control for informed and automated provisioning an the
scheduler level. The framework provides developers (administrator or end-user) with
an abstract layer to implement aggregation and resource ranking based on contextual in-
formation such as infrastructure status, users preferences, and the energy-related external
events that can occur over time. The validation is twofold: (i) proving the relevancy of the
metric by the means of simulations and (ii) scheduling tasks on a cluster using different
scheduling policies to demonstrate the applicability of the solution.
This work differs from the prior literature in the way the system and user involvement
are modeled. Rather than implementing a complete manager, we focused on a framework-
like approach with an emphasis on the use of customization. The design of the metric and
modelization of preferences were project-driven in answer to the problematic of the Nu@ge
project, described in Chapter 5. In this context, the framework is at the intersection of
highly heterogeneous set of resources: complete datacenters, clusters with restricted-
access, cloud front-ends, etc. Therefore, a need for a simple metric is needed to perform
global decisions on all resources. This approach can be used within a cluster to determine
27

the best node or at the federation level to choose the best datacenter and delegate the
problem to the local scheduler.
In the definition and analysis of the problem in this Chapter, it is assumed that all
resources present a measure or an estimation of energy. Although this assumption may
not be satisfied for all types of real-world workload, we assume that the applications
are request-based with a sufficient enough number of request to study fluctuations of
workload. This hypothesis models a cloud platform where multiple independent users
execute identified tasks, and the provider is not necessarily aware of the computational
nature of the service.
3.2 GreenPerf
The resources were tasks are computed present a significant impact on the overall energy
consumption. Applications can require different demands, often leading to an application-
dependent energy efficiency of resources.
Additionally, many works assume that nodes from a homogeneous cluster have the
same power consumption. In practice, due to their different uses, fluctuations caused by
the external environments or even power leakage , nodes can present different ranges of
performance and energy consumption over time compared to their specifications, thus
we propose a metric taking into account a dynamic monitoring of resources. In this
context, the energy efficiency of a node will be highly dependent on the workload that is
submitted.
It appears necessary to base the scheduling of independent tasks of resources on the
live behavior of the node and adjust decisions on the fly.
We propose a metric for the sorting of available computing nodes according to a hybrid
of their electric consumption and a secondary parameter, the performance of the node.
Following the study in Chapter 2, we observed that most of the metrics require a
complete hand on the facility exploitation metrics to be compute. In a project-driven
study, where nature of resources are not guaranteed, we need to be able to measure energy
efficiency with minimal information.
Assuming that power consumption and performance are able to be gathered at all
times, we propose the usage of a ratio reflecting the power effectiveness of a server related
to a specific set of requests. GreenPerf is defined as:
PowerConsumption
Performance(3.1)
where PowerConsumption is the measured energy during the completion time of a
set r of requests and Performance, a unit of completion for an application. We consider
28

Performance as a number of tasks or requests completed. The lower the value, the
more efficient the server is considered to be for that application. Within a comparison, a
lower value indicates that a larger amount of work is performed for the same amount of
energy consumed. The computation of the metric implies a “bootstrap” phase, where all
the servers receive a fix amount of requests. Then, GreenPerf is computed to establish
a ranking of nodes and favors energy efficient servers. Table 3.1 describes the behavior
of 5 servers offering the same image conversion service within a fixed period of time.
Considering only the energy consumption, S4 may be considered the best server of the
cluster. If one reports the service completion, S2 appears to be the server according to
GreenPerf and the most energy efficient.
Server Name Completedrequests
EnergyConsumption
GreenPerf
S1 50 213 4,26
S2 65 118 2,72
S3 50 260 5,2
S4 13 97 7,4
S5 55 190 3,45
Table 3.1: Example of GreenPerf computation with a request-based service executed by5 servers
The amount of information needed to benchmark the servers and compute the metric
can be determined in two ways: (i) time based by re-evaluating the ranking of servers
every given unit of time or (ii) request based by considering the re-evaluation every time
a server completes a certain number of requests and record that value.
The definition of GreenPerf is inspired from the DCP and the Performance Per Watt
metrics. The DCP metric (described in Chapter 2) is expressed as:
DCP =UsefulWorkproducedbydatacenter
ResourceConsumedproducingthework(3.2)
It is known as a subjective metric in the datacenter community because of the difficulty
to quantify useful work in a facility. GreenPerf relies on the notion of requests linked to
an application to quantify the amount of work performed. It can be seen as an application
of DCP at the server level. However, GreenPerf can also be applied using application
that can be quantified in terms of operations, in particular with floating-point operation
per second (FLOPS). Using FLOPS as the performance, it becomes a variant of the
performance per watt metric. It literally measures the rate of computation that can be
delivered for every watt consumed. Other criteria exist in the literature, involving the
29

consideration of idle consumption [63] or the use rate [64] of the physical nodes.
When discussing GreenPerf, the pros are:
• There is no need of additional software or hardware to compute it under different
management systems. It relies straightforwardly on the monitoring of resource.
The same scheme can be apply to any kind of devices present in the infrastructure,
not only computational servers.
• It can be used to compare the relative productivity of different datacenters with
the same application sets.
Green Perf presents disadvantages as it does not comprehend the portion of resources
that is not directly tied to the application performing the useful work (i.e. operating
systems, management agent, ...). An approach to subtract that cost would be to execute
some benchmark on all nodes and measure the idle consumption on each node. The
method can induce an extra complexity and is not significant for long period of times.
We recommend a more dynamic approach based on the recent behavior of the node.
3.3 Expression of user and provider involvement
Most of the Cloud decisions and optimizations are executed in an automatic fashion,
without taking the actors (users and providers) into consideration. By considering that
the sizing and selection of resource must balance the actors requirements , we propose an
approach that provides users and providers with an easy way to participate in energy-
aware decisions. Applications or virtual machines are black boxes from the cloud provider
perspective. So, the user is the only one to express its preference related to the behavior
of the application. Given that the Cloud provider offers him different types of servers,
he could accept to gave slower (less powerful) resources to save energy. This constitutes
a lever for energy minimization, and an early step towards a pay-per-energy-consumed
cloud. A few energy-aware economical models starts to be proposed to save energy [65]
or use renewable sources [66]. This section presents the modelization of providers and
users preferences.
3.3.1 Provider Preference
The targeted providers are administrators managing server provisioning in a datacen-
ter. In the context of the Nu@ge project (Chapter 5), administrators of container-sized
datacenters have knowledge of electricity price and schedule, as contracted with the elec-
tricity provider. Historical data is also often known via logs and monitoring systems.
30

This can be used to establish resource forecast by identifying usage patterns and ensure
the responsiveness of the platform during peak periods.
We use two variables to model the provider preference as a weighted average between
resource usage and electricity cost. Other factors can be easily integrated based on the
nature of the available data. Equation 3.3 presents the expression of provider preference.
Let c, u ∈ [0, 1] for each time period:
Preferenceprovider(u, c) → α(1− c) + βu (3.3)
where c is the cost of electricity define as a ratio between the cost for a given period
and the theoretical maximum cost. u represents the resource utilization defined as a ratio
between the energy consumption over a given period and the total consumed energy. u
can be extend (or replaced) by the metrics CADE, DHUE ou DHUR, described in Chapter
2. α and β represent weighting factors as integer values representing the importance of
its respective metric compared to another.
We obtain a Preferenceprovider(u, c) ∈ [0, 1]. By adjusting the weighting factors α, β,
one can favor a specific metric. The higher the value of Preferenceprovider(u, c), the
larger the number of available servers for a time period.
One can also establishes predefined behaviors based on the value of Preferenceprovider
3.3.2 User Preference
We offer the user the ability to indicate how his/her application is to be executed. Its
interest in the consideration of energy efficiency is defined as Preferenceuser. It can be
seen as slider (Figure 3.1) between different modes, which is set during request submission
as
Preferenceuser
−1 : maximize performance
0 : no preference
1 : maximize energy efficiency
(3.4)
Energy e�ciency Performance
-1 +10
Figure 3.1: Preference of User as the choice between two modes of preference: energyefficiency and performance. The absence of choice leaves it to a neutral mode, withoutany preference.
Under Preferenceuser = 1, a user agrees to an energy efficient mode with resources
presenting the lower value of GreenPerf, meaning that servers will present the best
31

PowerConsumptionPerformance
value. As the metric is dynamically computed over the recent requests, it
is guaranteed to be power efficient, not necessarily energy efficient.
Under Preferenceuser = 0,the user does not present any influence over the provision-
ing process.
Preferenceuser = −1, the user indicates a preference for the most powerful nodes
with no regards of energy consumption.
The remainder of this Chapter presents the DIET middleware, and then describes the
integration of the GreenPerf metric in the scheduling engine. Validations are performed
by the means of simulations and real task placement.
3.4 The DIET middleware
3.4.1 Overview
The diet open-source project [67] is focused on the development of a scalable middleware
with initial efforts relying on distributing the scheduling problem across a hierarchy of
agents. It is implemented in CORBA1 and benefits from the many standardized, stable
services provided by freely-available, high-performance CORBA implementations.
The diet toolkit present several features:
• Data management
• Task migration
• Cloud capabilities
• Fault tolerance
• Replication of agents
• Workflow execution support
It has been applied validated in different contexts [68], in particular when it comes
to scalabilty and ability to be extended. A DIET service consist of the encapsulation of
a computing service or program with its input/output parameters and its declaration on
an infrastructure to enable remote queries.
The diet toolkit is composed of several elements, illustrated in Fig. 3.2. The first
element is a Client, an application that uses the diet infrastructure to remotely solve
problems. The second element is the SeD (Server Daemon) which acts as the service
1The Common Object Request Broker Architecture (CORBA) is a standard defined by the ObjectManagement Group (OMG) designed to facilitate the communication of systems between systems ondifferent operating systems, programming languages, and computing hardware.
32

Figure 3.2: A diet hierarchy.
provider, exposing functionality through a standardized computational service interface;
a single SeD can offer any number of computational services. The third element of the
diet architecture is the agent. Deployed alone or in a hierarchy, the agent facilitates
the service location and invocation interactions between clients and SeDs. Collectively,
a hierarchy of agents provides higher-level and scalable services such as scheduling and
data management. The head of a hierarchy of agents is called a Master Agent (MA)
while the others are Local Agents (LA).
3.4.2 DIET Plug-in Schedulers
By default, when a user request arrives at a SeD, an estimation vector is created via a
default estimation function; typically, this function populates the vector with standard
values which are identified by system-defined tags. Table 3.2 lists the tags that may be
generated by a standard installation.
Consequently, applications targeted for the diet platform are able to exert a degree
of control over the scheduling subsystem via plug-in schedulers. For example, a SeD
that provides a service to query particular databases may need to include information
about which databases are currently resident in its disk cache, so that an appropriate
server may be identified for each client request. If the application developer includes
a custom performance estimation function in the implementation of the SeD, the
diet framework will associate the estimation function with the registered service.
Each time a user request is received by a SeD associated with such an estimation
function, that function, instead of the default estimation procedure, is called to generate
the performance estimation values. These features are invoked after a user has submitted
a service request to the MA, which broadcasts the request to its agent hierarchy.
33

As the physical infrastructures that are to be used vary greatly in terms of demands,
we used this diet plug-in scheduler facility at the server level to express contextual
information about performance and power consumption, that will taken into account
when servers are provisioned. Such vectors are then the basis on which the suitability of
different SeDs regarding to energy efficiency is evaluated.
Information tag Explanationstarts with EST
TCOMP the predicted time to solve a problem
TIMESINCELASTSOLVE time since last solve has been made (sec)
FREECPU amount of free CPU between 0 and 1
LOADAVG CPU load average
FREEMEM amount of free memory (Mb)
NBCPU number of available processors
CPUSPEED frequency of CPUs (MHz)
TOTALMEM total memory size (Mb)
BOGOMIPS the BogoMips
CACHECPU cache size CPUs (Kb)
NETWORKBANDWIDTH network bandwidth (Mb/sec)
NETWORKLATENCY network latency (sec)
TOTALSIZEDISK size of the partition (Mb)
FREESIZEDISK amount of free place on partition (Mb)
DISKACCESREAD average time to read from disk (Mb/sec)
DISKACCESWRITE average time to write to disk (Mb/sec)
ALLINFOS [empty] fill all possible fields
Table 3.2: Explanation of the standard estimation tags used by the DIET Plug-in sched-uler engine.
3.4.3 Adding Green capabilities
Estimation vector
We use this DIET plug-in scheduler facility at the server level to express contextual infor-
mation about application performance and power consumption. These values are taken
into account when servers are processioned. Such vectors are then the basis on which
suitability of different SeDs is evaluated. Table 3.3 presents the additional estimation
34

tags used in the performance estimation vector. The methods of this ranking process
comprises an agreggation method, which is simply the logical process by which servers
responses are sorted according to the GreenPerf metric.
Information tag Explanationstarts with EST
ENERGYAVG average energy consumption on solved requests (J)
FLOPS Node performance (Gflops)
Table 3.3: Explanation of the customized estimation tags added to the DIET Plug-inscheduler engine.
Scheduling process
The first scenario of application of GreenDIET is related to the modelization of prefer-
ences described in the previous section.
We couple this preferences with consideration of energy-related events such as fluc-
tuations of energy cost or heat peaks. Energy cost can be seen as an adjustment metric
that helps the administrator to define the number of servers/portion of the datacenter
to be available. In this context, we consider that a low price is an incentive to use more
servers at a given time. Heat peaks and temperature conditions are use to define thresh-
old regarding to normal conditions of exploitation. The knowledge of these information
enables the scheduler to check the health of a datacenter before performing provisioning
decisions. In Chapter 5, a deeper evaluation of that feature is performed with autonomic
decisions and considerations of threshold.
The scheduling process and the role of each DIET agent is described below.
1. The client submits a service request that contains its Preferenceuser in the service
parameters
2. Master Agent receives a request describing a task and a value for Preferenceuser.
3. A request is propagated and estimation vectors are computed on SeDs retrieved.
4. The scheduler checks the temperature and energy costs thresholds defined by the ad-
ministrator and adjusts the number of candidate nodes according to Preferenceprovider(u, c).
5. The list of candidates is sorted according to the scheduling criteria (at each level of
hierarchy of agents).
6. When the Master Agent is reached, the candidates remaining is returned to the
client.
35

To select the appropriate node based on a client request, we consider the ability to
estimate the duration of pending tasks. The following information is assumed to be
known for each server at any time:
fs Number of FLoating-point Operations Per Second (FLOPS) for the server s
cs Average power consumption when the server s is fully loaded (Watts).
bcs Consumption during the boot process of server s (Watts).
bts Boot time for server s (seconds).
ws Estimation of tasks waiting queue on server s (seconds).
P Preferenceuser
ni Number of FLOPS to perform the task i.
The knowledge of these variables enables the scheduler to consider inactive nodes in
the decision process and thus evaluate the costs of turning servers on if necessary. The
execution time of a task i is defined by the number of operations and the performance of
server s is (ni
fs). Both the total computation time and the energy consumed to perform a
task depend on the state of the assigned server at the moment of the scheduling decision.
The computation time (3.5) and energy consumption (3.6) of a task i on a server s can
be divided into two cases, depending on the state of the server.
computationtime =
{
ws +ni
fsactive server
bts +ni
fsinactive server
(3.5)
energyconsumption =
{
cs ×ni
fsactive server
bts × bcs + cs ×ns
fsinactive server
(3.6)
Using these two functions, the scheduler can assign a score Sc to each server and
establish a sorting (3.7).
Sc : P → (computationtime )
2
P+1−1 × (
energyconsumption) (3.7)
This score is coherent with our expectations regarding the previous definitions of
Preferenceuser and Preferenceprovider (3.8):
Sc :
P → −0.9 ⇒ Sc ∼ computation time
P → 0 ⇒ Sc ∼ (computationtime )× (
energyconsumption)
P → 0.9 ⇒ Sc ∼ energy consumption
(3.8)
36

When creating a list of candidate nodes, we aim to minimize the total energy consumed
by the active servers by maximizing the use of the most energy efficient servers. We do
not consider any bound for makespan and assume that servers have steady performance.
We use a greedy algorithm for selecting candidate servers with the objective of minimizing
the power consumed by servers (Algorithm 1).
Let T be the list of servers sorted according to GreenPerf, RES be the result set
of servers, PTotal be the accumulated power of each server and Prequired be the required
power among the candidate nodes.
Algorithm 1: Selection of candidate servers considering a power consumption cap.
1 PTotal ← 02 for server ∈ T do3 PTotal+ = server.get power()4 end5 Prequired ← Preferenceprovider × PTotal
6 P ← 07 RES ← []8 while P < Prequired do9 P+ = T.get first element().get power()
10 RES.add(T.get first element()))11 T.remove first element()
12 end13 return RES
3.5 Validation
3.5.1 Grid’5000: A testbed dedicated to experimental research
Experiments used resources from Grid’5000, a testbed designed to support experiment-
driven research in parallel and distributed systems. Located in France, Grid’5000
comprises 29 heterogeneous clusters, with 1,100 nodes, 7,400 CPU cores with various
generations of technology spanning 10 physical sites interconnected by a dedicated 10
Gbps backbone network (Figure 3.3). By providing bare-metal resource deployment,
Grid’5000 enables users to experiment on all layers of the software stack of distributed
infrastructures, including high-performance computing, grids, peer-to-peer, and cloud
computing architectures.
The power measurement in the studied clusters is performed with an energy-sensing
infrastructure composed of external wattmeters produced by the SME Omegawatt [69].
This energy-sensing infrastructure, also used in previous work [70], collects at every second
37

Figure 3.3: Grid’5000
Tool Description
OAR Finding and booking avalaible nodes
Kadeploy Cloning, configuring (post installation) and managingcluster nodes
Execo Prototyping experiments on distributed systems
Kavlan Level 2 Network isolation from other experiments
VM5K Easy and reproducible way to deploy virtual machines
DIET* Middleware for high-performance computing in distributedenvironments
Kwapi* Driver-based energy and network monitoring software
OpenStack* Control pools of compute, storage and network resources
Table 3.4: Tools used on Grid’5000. The tools designated with (*) are platform-independent tools
38

the power consumption in watts of each monitored node [71]. A node’s consumption
is determined by averaging past consumption over more than 3600 measurements per
second, whereas its performance is given by the number of FLOPS achieved when using
all CPU cores to execute benchmarks are using atlas2, hpl3 and Open mpi4.
Additionally, Grid’5000 gives the ease the advantage to ease the separation of the
experimental process from metrology concerns. A typical experiment scenario involves:(i)
Finding and booking available nodes (ii) Configuring nodes and installing dependencies
(iii) Deploying a DIET hierarchy (iv) running an experiment. The monitoring itself is
seamlessly performed for the end user. Energy data and logs are available on demand
through a web API and can be retrieved in live or post-experiments.
The validation of this framework is performed in two scenario. First, a simulation of
placement using the greenperf metric to get an intuition of potential benefits. Next, we
performed a real deployment of GreenDIET to evaluate the placement of 1000+ tasks on
Grid’5000.
3.5.2 Simulations
Scenario
We evaluate the GreenPerf metric as a means to establish the relevancy of the ratioPower Consumption
Performancein high and low heterogeneity environments. We use a simulation to
manage the level of heterogeneity. After performing an initial benchmark on the physical
nodes of Grid’5000, we obtained for each server its mean computation time for a single
task along with its peak and idle power consumptions. These values are used to compute
the energy consumed by the whole infrastructure during the simulations. Each task is
computed with the maximal performance and power of the servers. During the simulation,
each server is limited to the computation of one task. Table 3.5 presents the specification
of the nodes.
The simulation aims to compare the completion time and energy consumption of a
set of task on Grid’5000 considering different variants of the metric, namely PERFOR-
MANCE, POWER, GreenPerf and RANDOM. PERFORMANCE and POWER corre-
spond, respectively, to giving priority to the fastest and to most energy-efficient nodes
to hence establishing the bounds of the GreenPerf metric. The RANDOM policy selects
servers at random. The values presented are the average of 15 consecutive runs.
2Automatically Tuned Linear Algebra Software: http://sourceforge.net/projects/math-atlas/3Portable Implementation of the High-Performance Linpack Benchmark for Distributed-Memory
Computers: http://www.netlib.org/benchmark/hpl/4High Performance Message Passing Library: http://www.open-mpi.org/
39

Cluster Nodes CPU Memory
Capricorne 3 2x2cores @2Ghz 2GB
Sagittaire 2 2x1core @2.40Ghz 2GB
Table 3.5: Experimental Infrastructure for the evaluation of GreenPerf (simulations)
Results
Low heterogeneity of hardware
Figure 3.4 shows the comparison of metrics for a low heterogeneity environment. In this
scenario, we use 2 different types of servers with similar specifications (Table 3.5). The
coordinates of G, GP and P represent the average values obtained of, respectively, the
POWER, GreenPerf and PERFORMANCE metrics. The shadings represent the area
of RANDOM values. One can observe that performance is stable among the different
metrics. It is a representation of the completion time of the slowest server to complete
its tasks. As the platform only has two different types of hardware, that slowest node ap-
pears to always be the same. The range of energy onsumption values for the RANDOM
metric illustrates the various combinations of scheduling. Those results are expected:
the POWER policy consumes less than GreenPerf, that consumes less than PERFOR-
MANCE but it does not present any tradeoffs between the algorithms.
G, GP1
P
R
9293
100
90
80
70
Completion
time (s)
Energy
consumption (J)78.929
78 80 82 84 86 88
79.722 85.752 87.978
Figure 3.4: Comparison of metrics with 2 different types of servers and 2 clients submit-ting requests.
40

High heterogeneity of hardware
In a second scenario, we consider the addition of two simulated clusters to increase the
heterogeneity of the platform. Table 4.2 presents the energy consumption of those servers
regarding the tasks submitted in the experiment. As a result, Figure 3.5 shows a better
tradeoff between POWER and PERFORMANCE, highlighting the need for a sufficient
diversity of hardware to efficiently use GreenPerf and the benefits of green scheduling
through an online decision mechanism.
G
GP
P
R
93
100
90
80
70
78
72
Completion
time (s)
Energy
consumption (J)36.530
36 38 40 42 44 46
37.233 38.415 44.904
Figure 3.5: Comparison of metrics with 4 different types of servers and 2 clients submit-ting requests.
Cluster Idle consumption Peak consumption
Simulated cluster 1 190 230
Simulated cluster 2 160 190
Table 3.6: Energy consumption of simulated clusters for evaluation of GreenPerf in ahighly heterogeneous environment
3.5.3 Experiments
Workload Placement
The evaluation aims to compare the distribution of tasks among nodes on Grid’5000
considering three different policies, namely PERFORMANCE, POWER and RANDOM.
41

PERFORMANCE and POWER correspond, respectively, to giving priority to the fastest
and to most energy-efficient nodes to hence establishing the bounds of the GreenPerf
metric. The RANDOM policy selects servers at random.
A client submits a set of tasks, wherein a single task is a CPU-bound problem which
consists in 1e8 successive additions, enabling the distinction of nodes in terms of perfor-
mance. As each task uses a single core, a server cannot execute a number of tasks greater
than its number of cores.
Cluster Nodes CPU Memory Role
Orion 4 2x6cores @2.30Ghz 32GB SeD
Sagittaire 4 2x1core @2.40Ghz 2GB SeD
Taurus 4 2x6cores @2.30Ghz 32GB SeD
Sagittaire 1 2x1core @2.40Ghz 2GB MA
Sagittaire 1 2x1core @2.40Ghz 2GB Client
Table 3.7: Experimental Infrastructure for the evaluation of GreenPerf (real-life deploy-ments).
The total number of client requests depends on the number of available cores. We
consider a number of 10 client requests per available core in this experiment.
The temporal distribution of jobs contains a burst phase, when the client submits
r simultaneous requests and a continuous phase when the client submits requests at an
arbitrary rate of two requests/second.
We deploy the diet middleware on 14 physical nodes as follows: 12 dedicated nodes
for SeD’s, 1 dedicated node for the Master Agent and 1 dedicated node for the Client.
The machines are picked among three different clusters as presented in Table 3.7. The
nodes are connected to a switch with a bandwidth of 1Gbit/s and run the Debian Wheezy
operating system.
Considering that the scheduler does not have specific information on the nodes and
does not make assumptions about the hardware, the dynamic information is gathered
as tasks are computed by the servers. Figures 3.6, 3.7 and 3.8 show the results of this
experiment. The x-axis presents the different nodes available to solve the problem; the
y-axis shows the number of tasks executed by the node.
Figure 3.6 shows the distribution according to energy consumption. We observe that
most jobs are computed by Taurus nodes, which appear to be the most energy-efficient.
Execution on Orion and Sagittaire occurs during the “learning” phase or when Taurus
nodes are overloaded.
Figure 3.7 shows the distribution of tasks when performance is the criterion for se-
lecting a node. The load balancing of jobs is similar to Figure 3.6, with the majority
42

Figure 3.6: Tasks distribution using power consumption as placement criterion.
Figure 3.7: Tasks distribution using performance as placement criterion.
of tasks executed on Orion nodes. In Figure 3.8, despite a random distribution of jobs,
Sagittaire nodes compute less tasks than other nodes. That is explained by the fact that
a single task is computed slower on those nodes, thus, they are less frequently available
when decisions are made.
43

Figure 3.8: Tasks distribution with random placement.
Figure 3.9: Cumulated energy consumption per cluster under POWER, PERFOR-MANCE and RANDOM scheduling policies.
Figure 3.9 presents the energy consumption of the whole infrastructure grouped by
clusters. The energy consumption measured on the diet agents was constant when
executing the three algorithms and does not present any influence on the comparison. We
44

can observe that distributing the workload using the RANDOM policy is not particularly
energy efficient as it guarantees that all the resources are in use during the experiment.
RANDOM POWER PERFORMANCE
Makespan (s) 2,336 2,321 2,228
Energy (J) 6,041,436 4,528,547 5,618,175
Table 3.8: Experimental Results of POWER, PERFORMANCE and RANDOM schedul-ing policies
Table 3.8 compares makespan and energy consumption metrics among the schedul-
ing policies. Considering performance, the best case is giving priority to nodes with
higher number of FLOPS (PERFORMANCE). Comparing that value with the POWER
makespan, we noticed a loss of performance of up to 6%. In terms of energy consumption,
POWER presents a gain of 25% when compared to RANDOM, and up to 19% compared
to PERFORMANCE.
RANDOM appears, in average, to be the worst case because it ensures that all the
nodes are in use, resulting in higher energy consumption. The use of slow nodes is also
impacting the performance, but this effect is hidden by the fact that fast nodes will
compute more tasks in parallel.
3.6 Conclusion
In this chapter, GreenDIET, a framework for provisioning resources and distributing re-
quests with the objective of meeting performance requirements while reducing energy con-
sumption, was presented. We validated our strategy through experiments using the diet
toolkit and the Grid’5000 experimental testbed. Comparing three different scheduling
policies by enabling users and providers to specify trade-offs between performance and
energy consumption, results show a reduction of energy consumption of 25% with a minor
performance loss (6%).
The effectiveness of this approach strongly relies on the heterogeneity of servers. Re-
sults show a reactive scheduling, allowing policy management to be abstracted into a soft-
ware layer that can be automated and controlled centrally. We expect this approach to be
very useful when applied to provisioning servers, using contextual data from third-party
predicting or monitoring tools. The motivation to propose the underlying GreenPerf met-
ric was project-driven with often restricted knowledge of a whole datacenter monitoring.
Therefore, we rely on a straightforward, yet extensible, metric to be able to characterize
all resources.
The following chapters will revolve around a deeper search of workload placement
45

solutions by considering genetic algorithms and affinities between resources and tasks on
real cloud traces. We also describe the application of this framework in industrial use
cases.
46

Chapter 4
Application to multi-criteria and
evolutionnary computing
This Chapter presents a joint work with Mahindra Ecole Centrale (Hyderabad, India).
The context of this collaboration emerges from the result of Chapter 3 and the evaluation
of GreenDIET. Online decisions could benefit from the potential of heuristics to consider
affinity between nodes and tasks while searching better solutions of placement.
This research has been supported in part by CEFIPRA (Indo-French Center for pro-
motion of Advanced Research) through its Raman-Charpak Fellowship program, following
early discussions at the presentation of [6] at IPDPS 2015 between Avalon and Mahindra
Ecole Centrale researchers.
4.1 Introduction
Multiple objective optimization, also known as Pareto optimization is an area of multi-
ple criteria decision making, involving one or more objective functions to be optimized
simultaneously. It has been applied in many field of science where optimal decisions need
to be taken in the presence of tradeoffs between two or more contradictory objectives.
There exists different families of solutions and goals when setting and solving them.
This principles have been investigated using the early results of GreenPerf (Chapter 3).
Figure 4.1 presents the simulation results described in the previous chapter. Based on the
value of the resulting values of scheduling policies, G (Energy savings), P (Performance),
GP (GreenPerf for energy efficiency), one can observe that there is not a single solution
that simultaneously minimize the energy consumption and maximize the performance.
That range of solution is called Non-dominated or Pareto optimal, as non of the objective
function can be improved in value without degrading some of the other objectives.
The curve on Figure 4.1 is a conceptual Pareto front representing the trade-off curve
of potential solutions. It informs how one objective is related to the deterioration of the
47

Figure 4.1: A visualisation of the GreenPerf evaluation as a conceptual Pareto optimiza-tion where completion time and energy consumption represent objectives to be minimized.
second one. The use of Pareto optimization can enable the full potential of GreenPerf by
computing intermediates, yet satisfying, solutions for the user and the provider. Among
the family of multi-objective optimization, our work revolves around Evolutionary opti-
mization techniques.
Evolutionary Optimization techniques that from theoretical principles are guaranteed
to provide globally optimum solutions, are among the most powerful tools to achieve such
optimal placements. Multi-Objective Evolutionary algorithms by design work upon con-
tradictory objectives, gradually evolving across generations towards a converged Pareto
front representing optimal decision variables – in this case the mapping of tasks to re-
sources on clusters. However the computation time taken by such algorithms for conver-
gence makes them prohibitive for real time placements because of the adverse impact on
makespan. In this work, we have used Non-Dominated Sorting Differential Evolution to
obtain the best Pareto front with a spectrum of solutions representing minimum energy
at one end of the front and minimum makespan (completion time) at the other.
This chapter introduces several contributions: (i) an evolutionary approach to work-
flow placement (ii) a choice of solutions to the user based on his priorities, ranging from
best-energy to best-performance, and intermediates, (iii) development and launching of
a parallel variant of evolutionary optimization on the Grid’5000 testbed using real cloud
traces. The solutions under different scheduling policies demonstrate significant reduction
in energy consumption with some improvement in performance.
4.2 Genetic metaheuristics
Metaheuristics allows to tackle large-size problems instances by delivering satisfactory
solutions in reasonable time [72]. They do not present guarantees to find global opti-
mal solutions or even bounded solutions. Applications of metaheuristics falls into two
main families. The first branch includes the single-solution based metaheuristics (S-)
48

and the second the population-based metaheuristics (P-). Those two families of meta-
heuristics share several principles but are complementary in their behaviors. While the
S-metaheuristics have more a local search based on iterations that help to transform
and improve one solution by intensifying the research around its neighborhood, the P-
metaheuristics explore a bigger search space by involving the whole set of individuals
(population). The individuals evolve together for more diversification in the search space
toward better solutions. The rest of this Chapter focuses on the population-based meta-
heuristics (P-).
The principle of P-metaheuristics mimics the “survival of the fittest”. It relies on the
evolution of an initial population of solutions through iterations in order to generate a
new population that will replace the previous one (Figure 4.2). Among the best known
P-metaheuristic algorithms are evolutionary algorithms, scatter search, estimation of dis-
tribution algorithms, particle swarm optimization, bee colony. In this Chapter, we deal
with evolutionary algorithms, more specifically genetic algorithms. In genetic algorithm,
the population contains a number of encoded individuals, where each one represents a po-
tential solution. The first population (initial population) is usually generated randomly.
Each iteration of the algorithm is called a generation. During a generation a set of solu-
tions is selected. Those selected solutions are recombined using the evolution operators
to provide new solutions. The new solutions replace following a certain policy the worst
solutions of the previous population. The algorithm relies on the fitness of the solutions
to carry out this operation. The fitness is computed with an evaluation function. This
operation is repeated until reaching a termination criterion.
Figure 4.2: Generic flow of operations in a genetic algortihm.
Techniques using evolutionary algorithms, has advanced significantly since the first
attempt [73] using Genetic Algorithms, and is widely used today in numerous applica-
49

tions. Among the most noteworthy developments rank the SPEA2 algorithm by Zitzler
and al. [74] and NSGA-II algorithm by Deb and al. [75].
The developments in Multi-Objective Evolutionary Algorithms referred in the previ-
ous paragraph have been along the track of Genetic Algorithm (GA) [76], the baseline
Evolutionary optimization approach, applied to the direct multi-objective paradigm. At
the basic algorithm level, Differential Evolution (DE) was formulated as an alternate
approach to GA by Storn and Price [77]. Bhattacharya and al. have applied both GA
and DE in a few complex industrial processes [78, 79, 80]; the latter work also provides a
comparison in computational efficiency for that industrial process between GA and DE
demonstrating that DE comes out favourably. Due to these developments the authors de-
cided to use their version of DE as the baseline algorithm for the current multi-objective
problem.
Evolutionary Algorithms that work concurrently on a population of candidate solu-
tions are naturally amenable to parallelization and consequent speedup, because a signif-
icant percent of the computations operate on individual candidates independent of the
others. There are two broad paradigms for parallelization, the “master-slave” model [81],
where the main computation (the master) generates many subproblems, which are fired
off to be executed by slave threads/processors and the “island” model [82], where each
subpopulation is assigned to a separate processor/thread.
Evolutionary Algorithms have also been successfully parallelized on Cloud frame-
works. Lee and al [83] implemented a parallel GA-PSO method for inferring gene
networks in a Cloud computing environment using the Hadoop MapReduce program-
ming model. Tang and al [84] parallelized the DE algorithm using a resilient distributed
datasets model, and compared consequent performance improvements relative to MapRe-
duce on a wide range of benchmark problems. The above examples represent paralleliza-
tion of single-objective evolutionary algorithms on Cloud clusters to solve specific opti-
mization problems, and not scheduling of actual workflows based on multiple objectives.
We propose a solution based on a parallelized differential evolution algorithm. It
brings a contribution to the field by combining an energy aware approach with the
scheduling of workflows based on multiple objectives.
4.3 Non Sorting Differential Evolution II (NSDE-II)
Differential Evolution (DE) belongs to the broad class of evolutionary optimization tech-
niques that developed as distinctive variants of classical Genetic Algorithms (GA). DE
was selected as the evolutionary method of choice on the basis of the authors’ prior studies
on the relative efficiency and merits of this against GA, as reported in [78]. The following
section presents the concept of differential evolution for a single objective and the key
50

aspects to adapt it to Multi-Objective Differential Evolution.
This class of features has certains common features with Genetic Algorithm optimisa-
tion, namely, they work in parallel on a population of candidate solutions, are stochastic
in nature, do not require the objective function to be analytic or even mathematically
tractable, and are much less likely to get stuck in local optima as compared to gradient
based methods. They differ from one another primarily in the manner in which candidate
solutions in a new generation are synthesized from solutions in the current one, which
effectively translates into their method of search of the total solution space for a global
solution. The fitness of each candidate, as defined by one (or more) objective function(s),
plays an important part in the evolution.
The core idea in DE is to superpose the difference between two randomly selected
solution vectors (where the elements of a vector correspond to the values in dimensions of
the solution space) on a third solution vector with each solution vector being a member of
candidate population sets to obtain a new solution. Initially when (and if) the candidate
solutions are spread across the solution space, the differences and hence the changes
in solution vectors are large, and as the solutions converge to the global optimum, the
changes get finer enabling attainment of the optimum faster. This is in contrast to
classical GA where the changes on a solution vector are neutral to the level of evolution
towards the global optimum.
This section presents the concept of differential evolution for a single objective and
the key aspects to adapt it to Multi-Objective Differential Evolution.
4.3.1 Baseline Differential Evolution
Formally, if the dimensionality of the solution space is denoted as D and the number
of candidate solutions is N , then the elements of the ith vector of the solution Xi,G at
generation G may be denoted as
Xi,G = (X1,i,G, X2,i,G, X3,i,G, ..., XD,i,G) for all i ∈ N (4.1)
The Differential Evolution (DE) process fundamentally generates new solutions from
the current candidate set by adding the weighted difference between two randomly se-
lected candidate solution vectors to a third to generate a mutant vector, and then creating
a crossover between an existing vector and the mutant that is called the “trial” vector.
The latter is allowed to replace the existing vector only if it is found to be more fit, the
complexity of this fitness determination exercise depending entirely upon the nature of
the problem under consideration. If Vi,G represents the mutant vector, then according to
51

the baseline DE process called DE/rand/1 [85, 77, 86]
Vi,G = Xr1,G + F × (Xr2,G −Xr3,G) (4.2)
where r1,r2 and r3 are random integers less than N , different from each other and from i,
and F usually lies between 0.5 and 1. There are many variations of this baseline process
where two instead of one difference terms are sometimes considered, the best solution in
a population is taken into account, etc.; descriptions of alternative schemes may be seen
in [87], among others.
Crossover is performed between the mutant vector Vi,G and the target vector Xi,G to
generate a trial vector Zi,G according to
zj,i,G =
{
vj,i,G if randj(0, 1) ≤ Cr
xj,i,G otherwise(4.3)
where zj,i,G is the element j of the trial vector Zi,G, randj(0, 1) denotes a random
number between 0 and 1 applied to the element j, Cr is the crossover threshold usually
set between 0.4 and 1. Eq. (4.3) simply states that the element j of the trial vector Zi,G
is taken from the mutant vector if the corresponding random number generated with seed
j is less than Cr, else the original value is left unchanged for that element.
At the final selection step the choice for candidate i in the next generation is made
between Zi,G and Xi,G on the basis of higher fitness by direct one-to-one comparison.
The present work generates the mutant vector according to the alternate scheme
(proposed in [77] and also used by current authors in [78] where it is found to work better
than other DE variants)
Xi,G = Xr1,G +R× (Xbest,G −Xr1,G) + F × (Xr2,G −Xr3,G) (4.4)
where R is set at 0.5 and F varies randomly between -2 and +2 across generations (and
are same for all i within a generation). The crossover probability Cr in eq. 4.3 is set at
0.7.
4.3.2 Multi-Objective Differential Evolution NSDE-II
Compared to single-objective Differential Evolution (DE), the mechanisms for multi-
objective DE are radically different. The basis for this difference follows from the altered
conditions of selection that relate to this statement in the section above the “choice for
candidate i in the next generation is made between Zi,G and Xi,G on the basis of higher
fitness by direct one-to-one comparison”. That works for a single objective which tags a
fitness value to both the solutions, enabling comparison. But if there is more than one
52

objective, it is quite possible that one of them is more fit with respect to one objective,
and the second for some other objective. And hence one cannot conclude which solution
is more fit, upsetting the basic mechanism of single-objective DE.
This work has adopted the basic multiple-objective selection techniques of NSGA-II
[75] while replacing the baseline GA operations to those of the DE variant outlined in
Eqs. (4.3) and (4.4) for generation of a trial vector. Hence this is named as NSDE-II.
In a problem with K objectives FFk, k ∈ 1...K, a candidate solution vector Xp is said to
dominate another solution Xq if
FFk(Xp) > FFk(Xq), k ∈ 1...K (4.5)
and for at least one k, FFk(Xp) > FFk(Xq); where p, q ∈ 1...N , N is population size;
and in turn Xq is said to be dominated by Xp. This definition is used immediately below.
Now it is apparent that for a population of candidate solutions and with multiple
objectives, there will be either one of three types of relations between any pair of candidate
solutions. Either one dominates the other according to Eq. (4.5), or one is dominated
by the other (i.e. converse to the first relation), or neither dominates or is dominated by
the other, i.e. for some objectives one is better and for the balance objectives the other
is the better.
This brings us to the NSDE-II selection process from one generation to the next.
Steps of Non-dominated selection:
1. A population of size N , taken for all parent vectors and all trial vectors thus forming
a collective pool of size 2N .
2. To every pool-member i allocate a number ni and a vector Si, where the former
denotes the number of members that dominate it and the latter contains the identi-
fication index of all members that it dominates. This implies that Si is a set whose
size can vary from the null to at most 2N − 1.
3. Place all members having ni = 0 into a sub-pool called Front F1, which is an
accumulation of the fittest members (i.e. those not dominated by any others).
Thus the original pool is now depleted by the number of members shifted to F1.
4. Traversing all i put in F1, go over all the members j that are listed in Si and
reduce the corresponding value of nj by 1. This implies that once a non-dominated
member is shifted out of the pool, each remaining member of the depleted pool who
was originally dominated by that removed member, is now dominated by one less
member in this pool.
5. Now repeat steps 2-4, with the rider that the new set of ni = 0 members (that
53

emerge upon reducing the cardinality of domination by one) are put into the second
front F2, and then F3, and so on.
At this point we have segregated the members of pool into a series of fronts with
descending degree of non-dominance.
6. If the size of front F1 is less than N , select all members of F1 into the next
generation.
7. Now if the size of front F2 is such that #(F1 + F2) < N , then select all members
of F2 also into the next generation (symbol # denotes cardinality of a set).
8. In this way move on to F3, F4 till one comes to some Fq where the size say sq is
larger than the number of unfilled spaces in gen-next, say uq, i.e.
uq ={
N −∑q−1
m=1 #Fm
}
, and sq > uq
9. Use the Crowding Distance Algorithm to select uq out of sq.
The core concept of the Crowding Distance Algorithm [75] is to select solutions
that maximize diversity, i.e. if one solution is in a dense zone with many other solutions
around, and another in a relatively sparse zone, then other aspects being equal, the
solution from the sparse zone is selected. The algorithm quantifies the density of a point
in terms of the distance between its two straddling neighbors in every dimension of the
objective space, rather than of the parameter space.
4.4 Problem Formulation
The aim of this work is to improve the energy efficiency of a set of machines while con-
currently reducing completion time of a given set of jobs, through optimized workload
placement. In most cases, faster machines (low completion time for a task) will have
higher energy consumption (demanding hardware), implying that minimizing simultane-
ously both objectives is strongly contradictory — forming the basis of multi-objective
optimization. A server (computing node) is modeled with three resources: cpu, disk
and network and runs processes which consume these resources. Each task is treated
as a design variable to be assigned to a single machine, and cannot be moved from one
machine to another.
4.4.1 Decision parameters
Any optimization problem will have design parameters whose best possible values from
the viewpoint of the objectives are sought to be attained in the optimization process.
54

The optimization task here is to map a given set of tasks in a certain sequence onto the
available resources.
Suppose there are m number of resources and n tasks. Then, for any resource j,
∀j ∈ [1...m], all possible permutations of subsets of all sizes of the set of tasks of size n,
constitute the total solution space. If we call the size of this solution space as Sj, then
Sj =n
∑
k=0
P (n, k) where P (n, k) =n!
(n− k)!(4.6)
Since Sj is independent of j, we may write it simply as S. It then follows that the
size of the total solution space is mS.
The information presented in Table 4.1 is assumed to be known for each server s at
any time. The knowledge of these variables enables the scheduler to consider the energy
efficiency related to the completion of tasks.
Element Description
fs Number of FLoating-point Operations Per Second (FLOPS)
dws Disk Writing rate
drs Disk Reading rate
nets Available Network bandwidth
cs Average power consumption
nfi Number of FLOPS to perform the task i
nbwi Number of bytes written on disk by the task i.
nbri Number of bytes read on disk by the task i
nneti Number of bytes exchanged by the task over the network bythe task i.
Table 4.1: Information available for the scheduler related to each task
4.4.2 Objective functions
We have two objective functions:
1. Minimize Makespan (i.e. time taken for completion of all tasks in the workflow)
The completion time of the workflow is given by
Tmn =m∑
s=1
n∑
i=1
Tis (4.7)
55

Makespan, defined as the time for completion of the last job on any of the servers,
is then expressed as:
Tmn = maxs∈(1..m)
n∑
i=1
Tis (4.8)
2. Minimize Energy consumption (i.e. total energy consumed in a workflow)
If Cis is the energy consumption of the task i per unit time when running on server
s, then energy consumption required for the workflow is expressed as
Ws =n
∑
i=1
CisTis (4.9)
and the total energy consumed is
Wmn =m∑
s=1
Ws =n
∑
i=1
m∑
s=1
CisTis (4.10)
In most cases, faster machines (low Ti) will have higher energy consumption (high Cs),
implying that objectives Tmn and Wmn are contradictory — forming the basis of multi-
objective optimization.
4.5 Implementation
We intend to integrate NSDE-2 as a Multi-Objective Optimization engine within a large
scale infrastructure. NSDE-2 would be accessible as a remote service that accepts a
workflow as an input and computes a set of placement solution that minimizes energy
consumption and makespan as an output. This output is to be placed and executed on
the infrastructure using the GreenDIET extension of the DIET Middleware (introduced
in Chapter 3), along with ots workflow management capabilities. In this framework,
the time spent on NSDE-2 optimization contributes to the makespan, hence this work
addresses speedup of NSDE-2 through parallelization. The current version uses only
energy and makespan as the objectives for concurrent minimization, the intention is to
gradually integrate more independent objectives into the optimization process. The aim
of the current framework is twofold: (i) to relieve researchers of the burden of dealing
with deployment, resource selection and workload fluctuations when they evaluate new
optimization engines and (ii) to offer the possibility to compare them.
56

4.5.1 Diet Workflow capabilities
The DIET middleware was introduced in Chapter 3. Its plug-in scheduler feature en-
able the consideration of new metrics, namely energy consumption by the means of the
GreenDIET extension. Among other features of the toolkit, DIET presents the ability to
workflow execution.
Workflow applications consist of multiple components (tasks) related by precedence
constraints that usually follow the data flow between them, i.e., data files generated by
one task are needed to start another task. Although this is the most common situation,
precedence constraints may exist for other reasons, and be arbitrarily defined by the user.
This kind of application can be modeled as a DAG (Directed Acyclic Graph) where
each vertex is a task with given input data and service name, and each edge can either
be a data link between two tasks or a basic precedence constraint. The DIET workflow
engine can handle that kind of workflow by assigning those tasks to SeDs using one DIET
service call. This assignment is made internally and dynamically when the task is ready
to be executed (i.e., all predecessors are done) depending on the service performance
properties and on available resources on the grid.
A specific agent called the Master Agent DAG (MA) provides DAG workflow schedul-
ing. This agent serves as the entry point to the DIET Hierarchy for a client that wants
to submit a workflow.
4.5.2 Optimization sequence
The workflow execution is performed in 3 phases (Figure 4.3): (i) service discovery, (ii)
computation of mapping solutions and (iii) workload placement. The service discovery
phase corresponds to the search of an optimization engine within the infrastructure by
a given client. As multiple engines can be instantiated on the platform, the user can
submit its workload to different engines and compare the cost of generated solutions. The
computation of mapping solutions is performed by at least one server (multiple servers
can be put in cooperation using the same service, based on the engine requirements) with
a platform performance description provided by the Master Agent. This description is
either based on historical data (past computations) or user-defined benchmarks. Finally,
the workload placement is performed and results are returned to the client based on
the platform available metrics and monitoring resolution. Mapping solutions are defined
as a collection of JSON objects. Each solution contains the mapping between a SeD
and a task and an associated cost in terms of workflow completion time and energy
consumption.
57

Client
loop [for all jobs]
Sumits a work�ow
Searches for best available server among all Server Daemons
Retrieves energy consumption and performance estimation of past jobs
Replies with server capabilities and performance estimations
Selects best available server
Optimization resquest (Platform performance and job descriptions)
Optimization request
Generates mapping solutions
Returns a set of possible mappings with associated costs
Chooses a mapping solution
Work�ow is accepted
Submits job i
Submits next job
Picks SeD from mapping solution
Sends job i
Computes job i
Work�ow is done
Noti�es job i is over
Master Agent Server Daemon Optimization Engine
Client Master Agent Server Daemon Optimization Engine
Figure 4.3: Optimisation and workflow execution sequence of DIET and NSDE-2
58

4.6 Experiments
Two kinds of experiments have been performed to validate this approach. The objective
of the first one is to evaluate the computation phase of the engine (i.e., the step where the
optimization engine generates a spectrum of solutions) while the second is a comparison
of algorithms to evaluate the concrete gain of NSDE-2 compared to an online placement
of workload.
4.6.1 Dataset
We have used real-world trace files of an international company called Prezi Inc 1, who
offers a presentation editing service, which is available on multiple platforms, therefore
they have to convert some of their created media files to other formats before they can
display them on all devices. The origin of the Prezi Inc dataset is a competition for
engineers to apply their knowledge of control and queueing theories on real-life problems.
At the time to evaluate our approach, we searched for original traces that presents:
• Heterogeneous workload
• Frequent arrival of tasks
• Dependencies between tasks
Such datasets appears to be hard to obtain due to privacy issues and relevancy to the
evaluations. In general, the difficulty to obtain access or trace logs to real infrastructures
prevents a research work close from the concerns and reality of the Cloud market. That
quest for logs have been a hard lock within this thesis as they are needed when modeling
a problem to gather understanding, but also to evaluate and to validate propositions.
Cloud traces present a competitive advantage for research teams and companies, often
resulting in non-reproducible techniques and optimizations.
Prezi’s conversion processes are carried out on virtual machines: at peak times, they
need to launch more instances of these VMs, but over the weekend they can stop most of
them. They published log files on their website containing workload traces for two weeks
of utilization, which serves as a basis for algorithmic experimentations. They operate
three queues in their Cloud system for the jobs participating in the conversion processes:
• export: contains jobs which result in downloadable zipped Prezi files.
• url: these jobs download an image from a URL and insert them into a Prezi file.
• general: all other conversion jobs (audio, video, pdf, ppt, etc.).
1http://prezi.com/scale/
59

The lines of the published workload traces have the following format:
2012-12-14 21:35:12 237 general 9.134963
This means that at the given time, a job enters the general queue with the id 237,
and the job will take 9.134963 seconds to run. The available trace files contain more than
2000000 lines, and their submitted (and processed) jobs highly varies over the 14 days.
To represent the job heterogeneity and their hardware requirements, we created a
generic multi-thread program in charge of interpreting and executing requests based on
a log trace description. Each task is represented by an execution of a bounded number
of operations.
An operation is based on the completion of three functions, simultaneously executed
by three different threads:
• A cpu-intensive operation consisting in the multiplication of two randomly filled
matrices of size 1000x1000 (cpu).
• A disk-intensive operation consisting in the writing and reading on disk of a 20MB
file (disk).
• A network-intensive operation consisting in downloading a 5MB file from a remote
server (net).
In the context of this experiment, each of the three threads is in charge of the sequen-
tial execution of n functions of the same type, n being the weight of each function. Each
queue has a weighted sum of functions. We consider the following mapping for each type
of job:
export 2× cpu+ 1× disk + 1× net
url 1× cpu+ 2× disk + 3× net
general 3× cpu+ 1× disk + 1× net
As an example, a job with the id 237 from the general queue will be completed after
the execution of 10 general operations.
4.6.2 Settings
We consider all the nodes with energy monitoring capabilities of the Grid’5000 platform.
We deploy the diet middleware on 113 physical nodes as follows: 111 dedicated nodes for
SeD’s, 1 dedicated node for the Master Agent and 1 dedicated node for the Client. The
machines are picked among six different clusters located on four different geographical
sites as presented in Table 4.2.
60

Cluster Nodes CPU Site Role
Orion 4 2x6 cores @2.30Ghz Lyon SeD
Sagittaire 38 2x1 core @2.40Ghz Lyon SeD
Taurus 10 2x6 cores @2.30Ghz Lyon SeD
Stremi 38 2x12 cores @1.7Ghz Reims SeD
Graphite 4 2x6 cores @2.00Ghz Nancy SeD
Parasilo 17 2x6 cores @2.40Ghz Rennes SeD
Parasilo 1 2x6 cores @2.40Ghz Rennes MA
Parasilo 1 2x6cores @2.40Ghz Rennes Client
Table 4.2: Experimental Infrastructure using 113 nodes with energy monitoring capabil-ities on four different geographical sites from the Grid’5000 platform
4.6.3 Parallelization
Evolutionary Optimization algorithms are naturally amenable to parallelization: In a
program, any iterative loop where computations in different passes are independent of
consequence of computations in other passes, can be parallelized by distributing the passes
across parallel threads In EA’s, bulk of computation done on a candidate of population
(everything other than the selection process) is independent of all other candidates in a
given generation In our NSDE-II program, all the non-parallelizable aspects take about
4.5% of total computation time in a fully sequential run
We first investigate parallelization of the NSDE-2 algorithm on a handy 8-core Intel
laptop with chipset [email protected]. These are offline simulations using data for a set
of 500 tasks to be placed on 85 servers, where task and server data have been extracted
from the Grid’5000 testbed. A population size of 200 is considered for all simulations as
well as online optimization executions. The master-slave approach is followed in paral-
lelization, using the Open MP Library [88].
In the NSDE program the functions not amenable to parallelization include the se-
lection operations using non-dominated sorting and crowding distance algorithms that
take up about 3.3% of runtime, and some I/O operations taking approximately another
1%. It follows from Amdahl’s law that the Theoretical Maximum Speedup factor is ap-
proximately 22. Table 4.3 shows results obtained using the sequential NSDE-2 program,
parallelized NSDE-2 program running on a single core, and on 4 cores.
The data shows computation times and the average values over all candidates for the
two objectives, energy and makespan, for a workflow of 500 tasks on 85 servers. The
relevance of the average values in these multi-objective simulations is purely to check if
the sequential and 1-core-parallel solutions match exactly, which they are observed to
61

Parallelization Time for 3000 100 generations 3000 generations
generations Makespan Energy Makespan Energy
Sequential 33:52 39.36 4491.4 37.05 3546.6
1-core 33:49 39.36 4491.4 37.05 3546.6
4-core 14:22 40.46 4874.8 35.85 4061.3
Table 4.3: Evaluation of the parallel variant of the framework on 1-core and 4-corehardware. Time is expressed in minutes, Energy in kJ
do. This, first and foremost, demonstrates the correctness of parallelization. Second,
it shows that the speedup factor on 4 cores is 2.36. An interesting observation from
Table 4.3 is that the speed of evolution of candidates across generations varies between
the parallel solutions and the sequential, reflected in different numerical values of the
objectives at the same generation levels. It may be difficult to pinpoint the reasons for
this; the evolutionary algorithm being a stochastic process is likely to behave differently
when executed concurrently on different numbers of nodes, and these differences are likely
to amplify over generations.
Figure 4.4 shows the parallelization speedup factor when running selected sets of 100
and 1000 tasks on 85 servers, real time on the Grid’5000 testbed on a Stremi node (see
Table 4.2). It may be noted that in the NSDE solution framework, each task is effectively
a decision (design) variable, and obtaining optimized solution with 1000 variables is itself
a challenging task.
In fact, this number has been extended to 5000 decision variables on 85 servers
launched in parallel on 24 nodes, though comparative sequential runs could not be ob-
tained due to runtime constraints. Figure 4.4 shows that as the size of the workflow
increases, the parallelization speedup factor gradually approaches its maximum limit.
4.6.4 Generation of solutions and Pareto fronts
NSDE-2 being an evolutionary multi-objective algorithm works on a population of can-
didate solutions which improve on all objectives across generations. The solution at any
generation is presented in the form of a Pareto front which represents the position of
each candidate in the multi-objective reference frame. Here we work on a population
of size 200. Figure 4.5 shows the evolution of the Pareto front from an initial stage of
100 generations up to 10000 generations, with minimization of energy consumption and
makespan as the objectives. Each dot represents a candidate solution. At any selected
generation, at one end of the Pareto front we have the “best energy” solution, and at the
other end, the “best makespan” solution.
We can observe that the quality of solutions improves as the number of generations
62

11.81
3.53
5.97
8.03
12.73
Theoretical Maximum Speed-up
0
5
10
15
20
25
Number of Jobs on 85 Servers
Sp
ee
d-u
p F
act
or
1 1.03
100 1000
3.85
7.53
10.45
17.99
1-core
2-core
4-core
8-core
12-core
24-core
Figure 4.4: Speedup analysis of NSDE-2 on two different size of jobs sets
Figure 4.5: Pareto fronts and quality of the solutions generated by NSDE-2 as the numberof generations increases. Each dot represents a solution of placement
63

increases. The computation time increases linearly as the number of generations increase.
We choose to retrieve the solution at 3000 generations, after which the improvement of
the solution becomes less significant.
It may be noted that if jobs are submitted on the Cloud for execution after prior
reservation, then it can be valuable to drive the NSDE-2 to its full potential to obtain
the best optimal solution placement.
4.6.5 Scalability and Reactivity
Figure 4.6: NSDE-2 execution time for generating mapping solutions related to 4 datasetsand 111 servers
We compared 4 different sizes of the dataset. Due to availability, the experimental
servers are a subset of servers presented in Table 4.2. The machine that runs NSDE-2 is
a node from the Stremi cluster (Table 4.2) with 24 cores. We can observe a significant
improvement in NSDE-2 execution time with increasing parallelization. One can observe
that the computation time for 100 jobs and 500 jobs are pretty similar, indicating the
importance of disposing enough data to take advantage of parallelization. Plus, increasing
the number of threads above the actual number of cores does not impact the performance,
independently of the dataset.
64

4.6.6 Workload placement
This evaluation aims to compare the distribution of tasks among nodes on Grid’5000
considering three different policies, namely NSDE-2 Best Energy, NSDE-2 Best Perfor-
mance and FIRST FIT. NSDE-2 Best Energy and NSDE-2 Best Performance correspond,
respectively, to the smallest energy consumption and the smallest makespan. These so-
lutions establish the bounds of the Pareto Front. The FIRST FIT policy consists in the
selection of the first available server in an ordered list accroding to the GreenPerf metric
as a non-weighted average ratio between performance and energy consumption for the
said type of task.
In each scenario, we consider the first entries of the trace file. For any of considered
cases there exists a proper balance between short and long tasks within the dataset. A
server is restricted to the execution of, at most, one task at a given time.
Considering that the scheduler does not have specific information on the nodes and
does not make assumptions about the hardware, the dynamic information is gathered
as a sample of each tasks is computed by the servers prior to the experiment. Figures
4.7, 4.8, 4.9 and 4.10 show the results of this experiment. The x-axis presents the dif-
ferent algorithms used to execute the workflow; the y-left-axis shows the total energy
consumption of the solution and the y-right-axis shows the makespan value.
Figure 4.7: Energy and Makespan comparison for 100 jobs and 111 servers
We observe an influence of the ratio jobs/servers on the global results. The larger
the dataset (specifically in terms of large tasks), the worst FIRST FIT performs as it
65

Figure 4.8: Energy and Makespan comparison for 200 jobs and 111 servers
Figure 4.9: Energy and Makespan comparison for 500 jobs and 111 servers
66

Figure 4.10: Energy and Makespan comparison for 1000 jobs and 111 servers
prevents the packing of tasks on the most energy-efficient nodes, resulting in more uses
of least energy-efficient nodes, thus in higher energy consumption. On small dataset, this
effect is hidden by the fact that fast nodes will compute more tasks in parallel.
Tables 4.4,4.5,4.6 show actual values obtained in terms of energy and time for the
three allocation policies, for the 4 illustrated cases with 111 servers. It may be seen
that NSDE-2 improves for any of the scenarios (except in the smallest case (Figure 4.7),
and for the larger cases improves makespan as well. The user may choose to select
an intermediate solution on the Pareto front that improves both energy and makespan,
trading-off between the two objectives. It is worth noting that when the NSDE-2 solution
was run up to 10000 generations, it provided a 30% saving in energy with a 50% reduction
in makespan. Considering the computation time of the Pareto Front, this can be of value
in cases of jobs submitted by prior reservation.
4.7 Conclusion
In this work, we report on design, implementation and evaluation of an energy-efficient
resource management system that build upon DIET, an open source middleware and
NSDE-II, an Evolutionary Multi-Objective Optimization engine. Our implementation
supports an IaaS Cloud and currently provides placement of workflows, considering non-
divisble tasks with precedences constraints. Real-life experiment of our approach on
67

CasesNo ofJobs
NSDE-2Best Makespan
(kJ)
NSDE-2Best Energy
(kJ)
First FitGreenPerf
(kJ)
1 100 338.9 338.9 339.8
2 200 1158.1 1020.3 1233.3
3 500 4287.1 4067.7 4901.7
4 1000 8632.5 7943.5 10482
Table 4.4: Energy consumption comparison between NSDE-2 variants and the First Fitalgorithms
CasesNo ofJobs
NSDE-2Best Makespan
(m)
NSDE-2Best Energy
(m)
First FitGreenPerf
(m)1 100 3.94 3.94 4.07
2 200 19.33 26.6 20.56
3 500 30.63 48.0 51.89
4 1000 33.64 47.29 64.47
Table 4.5: Makespan comparison between NSDE-2 variants and the First Fit algorithms
CasesNo ofjobs
NSDE-2Computation
time ofsolutions
(m)
MakespanNSDE-2
Performance(%)
MakespanNSDE-2Energy(%)
EnergyNSDE-2
Performance(%)
EnergyNSDE-2Energy(%)
1 100 3.46 -82 -82 0 0
2 200 6.0 -23 -59 6.1 17.3
3 500 13.63 15 -19 12.5 17.1
4 1000 26.5 7 -14 17.6 24.3
Table 4.6: Comparative improvements using NSDE-2 in makespan and energy
68

the Grid’5000 testbed demonstrates the effectiveness of our approach in a dynamic
environment. Results shows that our method can provide providers and decision makers
an aid to make their decision when conflicting objectives are present or when in search
for realistic tradeoff for a given problem.
As future work, it would be valuable to consider (i) multicore integration for the
placement of jobs and (ii) platform dynamicity. As Datacenters often present a high rate
of hardware issues and availability of servers can rapidly change, the ability to retrieve
a server from the population of solution without restarting the generation process would
improve the reactivity of the algorithm.
69

70

Part II
Transfer of technology
71


Chapter 5
Towards a national cloud computing
service, the Nu@ge project
Cloud computing represents a significant evolution of information and communication
technologies, either in terms of usage and organization. This field is an enabler for new
markets and is expected to grow up to 29% per year until 2019 [89]. Not all companies
apprehends the Cloud in the same way, as discussed in Chapter 1. In particulae, small
or recent businesses transition to the cloud for accessing a large amount of resources
and setting collaboration between entities, with proportional investments regarding their
activity. Despite its benefits to users, Cloud computing raises several concerns of ap-
plications, data storage and processing. Cloud providers reveal few information about
geographical location and process of data and applications. As information converted and
stored in binary digital form is subject to the laws of the country in which it is located,
several concerns are raised from a legal standpoint. Third-party entities or governments
could take control of sensible data, and legal protections may not apply if one’s data
is located outside her country. Additionally, data from a company could be physically
hosted with data from others. This causes security risks as one company may attempt
to access data of another.
The data sovereignty and the lack of major French cloud providers constituted a mo-
tivation for the French government to invest in major public cloud projects in 2010, with
funding estimated to 150 millions of euros. The ambition was twofold: (i) creating concur-
rence on the cloud provider market with a french and European alternative (ii) ensuring
guarantees from a legal standpoint to the digital data. These projects encountered mixed
outcomes but it raised awareness on the topic and opened the door for other national
projects. On a different scale, the Nu@ge consortium was gathered with the ambition of
creating a federation of small-sized datacenters and resources with the purpose of offering
tools to administrators in order to manage their Cloud.
73

5.1 Consortium
5.1.1 Motivation
The Nu@ge project started in 2012 1. The goal of this project is to describe and imple-
ment a federated architecture to provision virtual clusters of resources via the network
while providing administrators with control over data location and Quality of Service.
The proposed solution is based on innovative container-sized datacenters that enables de-
ployment of a cost effective and high performance environment in any location meshing
regional company owned datacenters.
5.1.2 Consortium
The Nu@ge consortium comprises 6 SMEs (Small and Medium-sized Entreprise) and 2
research team. Table 5.1 presents each partner and its business activity.
The Nu@ge consortium2 is composed of the following members:
• NON STOP Systems, secure cloud solutions provider and leading architect of the
project
• CELESTE, Internet provider and manufacturer of the StarDC
• Oodrive, online storage specialist
• DotRiver, virtual desktop and environment provider
• Init Sys, private network operator
• New GenerationSR, Green IT consulting
• LIP6, laboratory and its research team REGAL and PHARE of UPMC University,
Paris.
5.2 Approach
Nu@ge defines a software stack as a coherent set of tools to homogenize management and
exploitation of the resources. This section describes the Nu@ge architecture and its main
components.
1I joined the project in February 2013.2Nu@ge is a research project funded by the FSN (Fund for the Digital Society, BPI France) as part
of the Investissements d’Avenir program.
74

Partner Activity
Cloud software Editor
Storage solutions
Telecommunication services provider
Servers hosting and Internet provider for business
Editor of Virtual Work Environment
Business consulting
Computer science research laboratory
Computer science research laboratory
Table 5.1: Partners involved in the Nu@ge project
5.2.1 Overview
The architecture of the Nu@ge project addresses several system administration concerns,
namely providing a single and shared vision of the whole infrastructure; simplifying ser-
vice implementation; and managing virtual clusters and associated QoS. Nu@ge aims to
virtualize any service. This choice breaks the link between logical resources and physical
resources. In particular, we consider only the QoS of virtual/logical resources, ignoring
the underlying hardware. Nu@ge is modular and favors the autonomy of each compo-
nent. In this context, a virtual resource can be migrated depending on the following
circumstances:
• Hardware failures;
• Performance optimization;
75

• Energy efficiency improvement; and
• Respect of QoS constraint.
A rack, the unit of administration contains:
• Equipments dedicated to virtualization, called V-nodes;
• Equipments dedicated to storage, called storage nodes;
• Network equipments dedicated to internal communications within the rack;
• Network equipments dedicated to communication with other datacenters; and
• Electrical equipments allowing the supervision and interventions.
The high-level components and their features are described in the following sub-
sections.
5.2.2 V-node
A V-node is a physical node dedicated to the execution of virtual systems. Several
infrastructures services are required, including:
• Interconnection between Nu@ge and the various IaaS providers.
• Setting up of network services.
• Piloting process of power supply
The main virtual machines deployed in the system are:
Internet Gateway: Provides Internet access to nodes, physical or virtual, present
in the Nu@ge infrastructure. This machine enables the creation of filtering rules (firewall)
in order to set a first level of security for network services.
VPN Gateway: Offers a secure access to Nu@ge’s internal resources. Identifica-
tion, authentication and data encryption are performed with digital certificates which are
created and managed individually for each Nu@ge user.
IaaS Gateway: This is the component that links Nu@ge to the IaaS platform for the
end-user. This virtual equipment is the separation between Nu@ge’s area of responsibility
and the IaaS administrators.
DNS Service: DNS is a primary service of Internet enabling the resolution of iden-
tifiers; required for Internet browsing.
Storage Access Service: Creates storage units dynamically for the IaaS platforms.
The storage units are available as file systems or hard drives. This service is linked to an
IaaS exposing a dedicated storage zone to the Nu@ge infrastructure.
76

5.2.3 Storage node
The main objectives of the distributed storage system are availability, traceability, in-
tegrity and safety.
For each IaaS hosted in the Nu@ge architecture, a storage cluster is created. The
number and the location of hosts depend on the contract established with the IaaS owner.
Storage nodes are machines with significant storage resources. High performance disks
allow improved writing/reading operations while traditional disks offer larger storage
capacity with greater access time and latency.
Storage nodes are connected using a dedicated subnetwork, as they need to securely
exchange user’s data. For that purpose, the nodes have two Gbits/Ethernet interfaces and
an InfiniBand interface. The QoS is guaranteed, in particular during data replication, to
ensure resiliency in case a datacenter is suddenly not available. Additionally, the system
keeps a journal of data modifications.
Unlike V-nodes, a storage node provides locally to the nearby V-nodes storage re-
sources. A storage node has a high storage capacity sets of hard drives, each set containing
dozens of hard drives.
5.2.4 Network infrastructure
We use two kinds of networks within the Nu@ge architecture: internal, dedicated to the
communication between the different IaaS and external, used for the interconnection with
end-users.
The internal network allows the creation of private networks between a user’s nodes.
Private networks require an IP addressing intra and inter-datacenter, in which the flows
of information are encapsulated. As the interconnection with end-user is performed via
third-party internet providers, it is necessary to have several networks, depending on the
segmentation set by the internet providers.
External communication between the datacenters:
A simple method would consist of a star network topology, built around a central site
with a full redundancy among the links. In a star topology, every node is connected
to a central node called a switch. The switch acts as a server and the peripherals as
clients [90]. However, for reasons of cost and architecture consistency, we do not consider
this solution.
Ensuring continuity of service, without a star network topology, requires a number of
links superior to the number of Nu@ge datacenters. Without any protocol, the intercon-
nection of those links would cause a loop and prevents the delivery of packets.
77

STP (Spanning Tree Protocol) is a level 2 protocol (Ethernet) allowing the construc-
tion of an Ethernet network without loop3. STP presents a simple approach of the
problem by cutting some links, to obtain a tree architecture. Due to its simple function-
ing, STP is widely used despite a few limitations such as the poor repartition of flows
and a convergence time up to 30 seconds.
While several extensions to STP address those limitations, a new protocol named
TRILL is gaining popularity. TRILL (Transparent Interconnection of Lots of Links) is
an IETF standard4. This protocol presents the avantages of the routers and the network
bridges by creating a level 2 network on the different links available.
Then, the protocol sets dynamic routing tables with MAC addresses. Using this level
2 routing, the protocol ensures to always have the shortest path to route packets. In the
context of Nu@ge, we use TRILL in order to manage Ethernet segmentation.
Virtual Machine Mobility:
In a context of user mobility and network virtualization, getting a proper identification of
an end-user over the network can be a difficult task due to the various possibilities of In-
ternet access. The protocol LISP (Locator/ID Separation Protocol) tackles this problem
by enabling migration over network while maintaining the same IP address. LISP is a
protocol where IP addresses have two roles, namely localization and identification5. LISP
aims to solve problems related to the growing size of IPv4 routing tables. Additionally,
the protocol enables users to break the link with a single internet access provider (mobile
users). LISP addresses this issue by separating the location from the identification. An
IP address is used in two ways:
• Identify a machine present in a network
• Locate the identifier of the machine to route the traffic in an IP network
A distributed table of matches allows to find a locator, RLOC (Routing LOCator) from
an identifier EID (Endpoint Identifier). LISP is independent of the IP version and can
be deployed in an incremental fashion, without the necessity of having the full Internet
architecture supporting it.
3STP is defined in IEEE 802.1d-20044TRILL is defined in the RFC 63255LISP is defined in the RFC 6830
78

5.3 Related work
5.3.1 Modular datacenters
Clouds depend on datacenters, large facilities used to house computer systems and asso-
ciated components, such as telecommunications and storage systems. A modular data-
center system is a portable method of deploying data center capacity. As an alternative
to the traditional datacenter, a modular datacenter can be placed wherever data capacity
is needed.
Modular datacenter systems consist of purpose-engineered modules and components
to offer scalable data center capacity with multiple power and cooling options. Numerous
manufacturers such as Google, IBM, Sun,Verrari or HP built modular datacenters into
standard intermodal containers (shipping containers) with the following key features:
High Density: Maximum accommodation of servers, storage and network equip-
ments within a limited surface.
Cost Reduction: By comparison to the building and exploitation of a traditional
raised-floor data center.
Self-contained Cooling: Self-contained cooling technologies, which can enable a
cost savings and improve system reliability.
Environmentally Responsible: Minimal carbon footprint.
Disaster Recovery and Security: Characterized by the time of autonomy of
the container and the physical equipments dedicated to ensure its integrity.
Fast deployment: Usually expected to be less than 6 months to be put in service
after order to the manufacturer.
Industry relies on the TIA-942 specification [91] to classify the minimum require-
ments for telecommunications infrastructure of data centers and computer rooms into 4
categories, presented in Table 5.2.
5.3.2 Distributed storage
As explained later, the Nu@ge project requires resiliency. In case of the loss of connec-
tivity of a datacenter, the data storage must be distributed among the federation while
traceability, integrity and security of data must be ensured. Additionally, the storage
system must keep a journal of data modifications to retrieve a coherent state after an
incident. The following part evaluates existing distributed storage solutions with the
purpose of integrating one suiting Nu@ge needs.
There are two main categories of storage [92][93], Network Attached Storage (NAS)
and Storage Area Network (SAN). NAS is file-level computer data storage server con-
79

Characteristics of the site infrastructure design topology Theoreticalavailability
Tier 1Single path for power and cooling distribution.No redundant components.
99.671%
Tier 2Single path for power and cooling distribution.Includes redundant components
99.741%
Tier 3
Multiple power and cooling distribution paths.Only one active path.Includes redundant components.Concurrently maintainable.
99.982%
Tier 4
Multiple power and cooling distribution paths.All paths are active.Includes redundant components.Concurrently maintainable.Fault tolerant.
99.995%
Table 5.2: Characteristics and availability of the TIA-942 Tier system
nected to a computer network providing data access to a heterogeneous group of clients,
while SAN is a dedicated network that provides access to consolidated, block level data
storage.
Network attached storage:
HDFS [94] is conceived to distribute computations between several nodes. One of the
nodes, the namenode is a necessary gateway to the system. It constitutes a serious
bottleneck and is inappropriate for Nu@ge architecture.
GlusterFS, MooseFS, Pohmelfs and XtreemFS presented various limitations. Unsta-
bility issues, troubles with operating system support or lack of contribution support led
us to exclude those projects from our choices.
Although the Ceph project [95] is quite close from our requirements, a cluster can
only handle one file system, which is a serious technical restriction.
Storage area network:
Despite its lack of journaling support, Ceph project [95] features an extensive block data
storage. Nevertheless, Ceph cluster gives no information about data location. In this
context, data traceability, one of the main objective of Nu@ge, could be achieved only
by creating a Ceph cluster per datacenter. This solution is not worth considering due
to the high resource consumption of Ceph. The Sheepdog initative [96] seems relatively
inactive and only works with QEMU/KVM virtualization technologies. Some of Sheepdog
technical choices would lead to scalability problems in terms of storage or number of
80

datacenters.
Since no project provided both means to specify data location and journaling support,
we decide to initiate a new project over a SAN, as it is less complex to implement. Unlike
a NAS that needs the installation of a software on the client desktop, block level data
storage can be access through standard protocols (specifically iSCSI [97], supported in a
native fashion by numerous operating systems).
5.4 Realizing the architecture with open components
In this section, we describe how we leverage OpenStack and DIET Cloud for realising
the Nu@ge federation architecture. As we consider the datacenter as a complete re-
source (just like memory, storage, cpu or network), its management can be integrated
to the conception and exploitation of cloud. We use DIET Cloud, an extension of the
DIET middleware to collect information from different IaaS and perform federation-wide
decisions.
5.4.1 OpenStack
OpenStack is an open-source cloud computing platform for both private and public clouds.
The OpenStack project was announced in July of 2010 by Rackspace and NASA, who
made the initial code contributions. The OpenStack software consists of several indepen-
dently developed components with well-defined APIs. The core component that provides
IaaS functionality is OpenStack Compute (also called Nova). It handles provisioning and
life-cycle management of virtual machines and supports most available hypervisors. Neu-
tron is the component for building virtual network topologies that live on top of hardware
from different vendors. Cinder is the Block Storage, a scalable storage service similar
to Amazon S3. Horizon is a web-based GUI, primarily for management purposes such
as starting/stopping virtual machines and managing user/group configurations. Further
components are available such as Image Service and Identity management. The imple-
mentation described in this paper is based on the Grizzly release of the OpenStack and it
uses Compute, Neutron, Cinder and Horizon which we have extended for our purposes.
In particular, a Block Storage Service was implemented within Cinder. Eguan pro-
vides a working backend driver for OpenStack’s cinder block storage service with High
availability, real-time data replication and history features. OpenStack volumes and snap-
shots can be hosted on one or multiples eguan instances with integrity checks and precise
location of the data. The project’s source code is available under the Apache 2.0 license.
Implementations details are out of the scope of this thesis.
81

5.4.2 Federation scheduler using DIET Cloud
We rely on diet [67], an open-source middleware that enables the execution of applica-
tions using tasks that are scheduled on distributed resources using a hierarchy of agents
for scalability. diet comprises several elements, including:
• Client application that uses the diet infrastructure for remote problem solving.
• Server Daemon (SeD) which acts as a service provider exposing functionality
through a standardized computational service interface. A single SeD can offer
any number of computational services.
• Agents, deployed alone or in a hierarchy, which facilitates service location and
interaction between clients and SeDs. Collectively, a hierarchy of agents provides
high-level and scalable services such as scheduling and data management. The head
of a hierarchy is termed as Master Agent (MA) whereas the others are Local
Agents (LA).
The steps of the scheduling process are explained below:
1. Submission of a virtual machine creation request
A client issues a request describing a virtual machine template. If none of the
datacenter is able to create new instances, a notification is returned to the client.
2. Propagation of a request
The request is propagated through a hierarchy of agents.
3. Collection of estimation values
Each agent computes and gathers its metrics, particularly performance and energy
consumption. A reply containing these values is sent back to the scheduler.
4. Sorting of candidates
Once the scheduler retrieves all replies, it proceeds to a sort according to specific
criteria. The first ranked node is then elected and notified.
5. Virtual machine creation
The virtual machine is created on the elected node.
diet [67] implements many prerequisites, such as service calls, scalable scheduling
and data management. This allows us to implement a Cloud middleware with minimal
effort.
82

Figure 5.1: Federation scheduling using DIET Cloud
The aim of the diet Cloud is to provide an architecture that handles a large number
of Cloud middleware and Cloud Service Providers. Thus it hides the complexity and
heterogeneity of the Cloud API layer, thanks to δ-Cloud [98]. δ-Cloud is a Cloud adapter
that provides a library that eases the interfacing with different Clouds. δ-Cloud offers a
standardized API definition for IaaS Clouds with drivers for a range of different Clouds.
It can be seen as a meta-API. The δ-Cloud API is designed as a RESTful web service
and comes with client libraries for all major programming languages.
Using this Cloud extension, diet can act as a federation scheduler by benefiting
from the different IaaS capabilities and manage Virtual Machines. Virtual Machine man-
agement decisions will be taken according to the monitor systems from the underlying
datacenters.
The federation (See Figure 5.1) establishes relationships between the physical infras-
tructure and its logical behavior by providing developers (administrator) with an abstract
layer to implement aggregation and resource ranking based on contextual information
such as infrastructure status, users preferences and requirement, and the energy-related
external events that can occur over time.
To perform a placement, information on datacenter health status, energy monitoring
and capacity must be obtained.
These metrics are incorporated into diet SeD to populate its estimation vector using
new tags. Every time a client submits a request for a virtual machine, each datacenter
retrieves its metrics over the local monitoring tools. Once this information is collected,
83

Figure 5.2: Nation-wide deployment over four locations in France
servers are advised to populate and forward an estimation vector to the Master Agent,
which in turn uses an aggregation method to sort server responses according to the
chosen criteria and select the appropriate resource to execute the client request. Each
diet agent of the hierarchy performs the selection following the plug-in scheduler.
5.5 Prototype
This section briefly describes a prototype implementation of the Nu@ge architecture as
depicted in Figure 5.4. Such implementation has been used for evaluating the performance
and feasibility of the proposed approach. The prototype has been deployed and validated
over 4 different geographical locations in France.
5.5.1 StarDC
The StarDC (Figure 5.3) features 4 service units of 19 inch racks and can hold up to
168 computing servers. The container provides 15 square meters of floor space, a power
capacity of 18 kilowatts and a Power Usage Effectiveness (PUE) of 1.24. The StarDC is
built within Tier 3 specifications and is the subject of a patent.
Unlike most modular datacenters, the StarDC does not use water cooling. It a broader
range of physical locations and an eco-responsible behavior since free cooling is used to
cool the container. StarDC uses a mechanism of temperature using outdoor air as a free
84

Figure 5.3: The public presentation of the StarDC container occured on September 18th2014 during Nu@ge inauguration in CELESTE headquarters, Marne-la-vallee, France.
cooling source. The purpose is to take advantage of outdoor temperature to naturaly
cool of equipments. When the air is injected into machines, its temperature raises by a
delta number of 10˚(common value among commercialized servers). When the outdoor
temperature is higher than a threshold, we use air conditioning to cool it.
The Nu@ge customer is in charge of setting up the cold aisle temperature. If he
chooses a temperature of 20˚to have a safety margin, the air conditioning will be active
approximately 20% of the year (varies depending on the location). Choosing a temper-
ature value up to 25˚and more results in less air conditioning and a better ecological
impact. We discuss the evaluation of PUE in Section 5.6.
5.5.2 Building of an IaaS
The creation of a new IaaS does not impact the architecture of Nu@ge. The main
changes concerns virtual nodes allowing the sharing of physical resources. In particular,
the instantiation of a storage access point; an IaaS access point; and a virtual switch
interconnecting the IaaS equipments. As a result, several storage nodes and V-nodes can
be used by multiple IaaS.
85

Figure 5.4: Nu@ge architecture including gateways and a IaaS
5.5.3 Storage cluster
Nu@ge racks contains two storage nodes. As storage management can require large
computational resources, a storage node features dual-core CPUs for a total of 24 threads
and 256 gigabytes of RAM. Deployment of storage nodes is performed via the following
steps:
1. Booting via PXE / TFTP protocols.
2. Configuration using Puppet.
3. Creation and configuration of an object storage in RAID1.
4. Creation and configuration of RAID6 objects.
5. Creation of logical volumes.
Once created, the node executes an OpenStack storage service specific to the newly
created IaaS, and the storage server. This organization is coherent with Nu@ge objectives
of data isolation between IaaS and data traceability for the administrators.
86

5.5.4 Supervision
An interface has been built to visualize information about datacenters and customers.
It provides the visualisation of the dynamic mapping of virtual machine deployment on
physical infrastructure along with analysis of performance in terms of user activity and
alerts related to usage incidents.
This platform acts as an autonomous webboard displaying information about a local
datacenter and to the global federation. It can be used as a complement or integrated into
OpenStack’s Horizon (Figure 5.5). Logging has been performed using Nagios Core [99]
and SNMP, an Internet-standard protocol for managing devices on IP networks, for non-
standard devices.
5.6 PUE of Nu@ge
The PUE (Power Usage Effectiveness) is a metric used to evaluate the energy efficiency
of a datacenter [100], also detailled in Chpater 2. From a practical point of view, it
measures how much energy is used by the computing equipment in comparison to cooling
and other overhead. As discussed in Chapter 2, the PUE is expressed by the ratio:
PUE =TotalFacilityPower
ITEquipementPower(5.1)
Nevertheless, it is very hard to know the real PUE from a company because the area
of Equipment Power can be debatable. As an example, for the Google Data center,
considering only servers and air conditioning gives a PUE of 1.06. However, if Google
includes generators, transformers, site substations and natural gas then the PUE is 1.14.
Green Datacenter from green.ch company (Switzerland) was designed with energy
efficiency and reduction consideration. This project is based on energy-optimized data
center architecture, latest generation of air conditioners, heat exchangers, waste heat
utilization in new office building.
The container-sized datacenter designed by Nu@ge aims at keeping the PUE under
the value of 1.30, using two cooling operating modes:
• Total free cooling when the room temperature is within the server specifications.
That range is set by the customer resulting in a PUE value of 1.16.
• Air recycling with air conditioning when the temperature is out of range, resulting
in a PUE value of 1.55.
Thus, the PUE relies strongly on the climate conditions, and customer-defined rules. In
the case of Nu@ge’s StarDC at Marne-La-Vallee (France), weather forecast indicates that
87

Figure 5.5: Web Interface for the visualisation and management of datacenters
88

80% of the time, the temperature is below 23˚C. The theoretical maximal value for the
PUE is then:
PUENu@ge = 80%× 1.16 + 20%× 1.55 = 1.24 (5.2)
Data Center Company PUE
Prineville DC Facebook 1.07
Google DC Google 1.14
StarDC Nu@ge 1.24
Green Datacenter grench.ch 1.4
Table 5.3: PUE comparison of different datacenters. Those values are given by eachproject but no independent evaluation was done.
Among the datacenters in Table 5.3, it is worth noting that StarDC is the only
mobile product. Additionally, it can be produced in series and available to third party
companies in constrast to more efficient but proprietary datacenters. Recent regulations,
in particular Sweden [1], does not allow the construction of datacenter with a PUE above
1.4, putting in perspective the positive PUE value of Nu@ge.
5.7 Energy-aware management
The purpose of the energy-aware management is to evaluate the benefit of green schedul-
ing for reducing electric consumption while matching performance objectives for the vir-
tual machines.
The performance criteria are CPU oriented, and based on a measure of the node
performance using all its CPU cores. It produces a value in flops, indicating the number
of floating points operations per second. Those benchmarks are based on measurements
using atlas6, hpl7 and Open mpi8. Other criteria exist in the literature, involving the
consideration of idle consumption [63] or the use rate [64] of the physical nodes.
Regarding the consumption criteria, two approaches are possible. A static way would
imply to execute a task on all nodes before starting and measure the power consumption
corresponding to the completion time on each node. This method is not significant for
long periods because the power consumption of the machine may vary depending on the
actual load or external conditions, such as the physical location of the server.
6Automatically Tuned Linear Algebra Software.7Portable Implementation of the High-Performance Linpack Benchmark for Distributed-Memory
Computers.8High Performance Message Passing Library.
89

We use a more dynamic approach where the electric consumption metric is based on
the number of requests handled by a computational node weighted by the power consump-
tion measured during execution. Every time a client submits a request, a computational
node will report its electric consumption and total number of requests.
We coupled the scheduling process to resource provisioning while taking into account
energy-related events such as fluctuations of electricity prices or heat peaks. Based on
previous work [6] described in Chapter 3, we proposed methods for provisioning resources
and distributing requests with the objective of meeting performance requirements while
reducing energy consumption. GreenPerf, a hybrid metric, was introduced as a ratio
of performance and power consumption for energy efficiency. Based on this work, we
enable autonomic decisions from the scheduler by checking pre-defined threshold before
executing placement/provisioning decisions.
5.7.1 Autonomic and Adaptive Resource Provisioning
We demonstrate the behaviour of the scheduler by considering fluctuations of two metrics
over time, namely the cost of electricity and temperature. We inject energy-related events
at the scheduler level while a client, aware of the number of available nodes, submits a
continuous flow of requests intending to reach the capacity of the infrastructure. Requests
are scheduled as they arrive to ensure dynamicity.
The infrastructure is deployed on Grid’5000, on the nodes defined in Table 5.4. The
experiment starts with an energy cost of 1.0 and a Preferenceprovider(u, c) giving priority
to energy-efficient nodes. The Preferenceuser is not having any influence in the current
scenario as the client dynamically adjusts its flow of request to reach the capacity of
available nodes. The StarDC was not fully operational, in particular in terms of sensors,
at the time of the experiment. Thus, we evaluated this prototype on Grid’5000 with a
simulation of energy and temperature parameters.
Cluster Nodes CPU Memory Role
Orion 4 2x6cores @2.30Ghz 32GB SeD
Sagittaire 4 2x1core @2.40Ghz 2GB SeD
Taurus 4 2x6cores @2.30Ghz 32GB SeD
Sagittaire 1 2x1core @2.40Ghz 2GB MA
Sagittaire 1 2x1core @2.40Ghz 2GB Client
Table 5.4: Experimental Infrastructure.
For the sake of simplicity, the cost of energy is defined as a ratio between the cost
over a given period and the theoretical maximum cost. Related to the cost of energy, we
90

defined three states:
• Regular time, when the electricity cost is the highest (1.0).
• Off-peak time 1, when the electricity cost is less expensive than during regular time
(0.8).
• Off-peak time 2, when the electricity cost is the least expensive (0.5).
Heat measurements are defined through two states, depending of the temperature of
utilization: in-range temperature (< 25 degrees) and out-of-range temperature (> 25
degrees).
The status of the platform corresponds to the value of the exploited metrics at t time.
The master agent checks the status of the platform every 10 minutes, with the ability
to get information about the scheduled events occurring at t + 20. Figure 5.6 presents
a sample of provisioning planning, which is a shared XML file using a readers-writers
lock that refers to a specific time-stamp. For each sample, we defined three tags, namely
temperature, candidates and electricity cost. At each time interval, the scheduler performs
decisions according to the value of the tags. Thus, future information, such as forecasts,
can be added to the provisioning planning, ensuring a dynamic behavior regarding to
the various contexts. The tags and time interval are customizable variables that can be
adjusted to fit specific contexts.
<timestamp value="1385896446">
<temperature >23.5</temperature >
<candidates >8</candidates >
<electricity_cost >0.6</electricity_cost >
</timestamp >
Figure 5.6: Sample of the server status describing the XML structure.
We set thresholds whose values trigger the execution of actions. Actions can be
defined through scripts or commands to be called by the scheduler. In this example, we
implemented five behaviors associated with the experiment metrics. Let c be the cost of
energy for a given period and T the temperature measured at t.
• if T > 25 then candidate nodes = 20% of all nodes
• if 1.0 ≥ c > 0.8 then candidate nodes = 40% of all nodes
• if 0.8 ≥ c > 0.5 then candidate nodes = 70% of all nodes
• if c < 0.5 then candidate nodes = 100% of all nodes
91

Figure 5.7: Evolution of candidate nodes and power consumption through context andenergy related events.
Four different types of events are injected in the provisioning planning made by the
scheduler. These events, in turn, fall into two categories, namely scheduled and unex-
pected. Figure 5.7 presents how the number of candidate nodes and the energy consump-
tion evolve over time. The left y-axis shows the total number of nodes in the infrastruc-
ture; The plain line presents the number of candidates during the experiment; The line
with crosses is the evolution of the energy consumption, using the right y-axis. Each
cross describes an average value of energy consumption measured during the previous 10
minutes. The x-axis represents the time with a total of 260 minutes.
Event 1 (scheduled) is a decrease of the electricity cost occurring at t + 60 min.
The Master Agent becomes aware of the information at t + 40 min. Observing a future
cost of 0.8, the agent plans ahead to provide 8 candidates nodes at t + 60 min. The
set of candidates is incremented slowly to obtain a progressive start, at t + 50 min and
t + 60 min. (It avoids heat peaks due to side effect of simultaneous starts.) We observe
a linear increase of electric consumption through the infrastructure. After each request
completion, the client is notified of the current amount of candidates nodes, and is free
to adjust its request rate.
Event 2 (scheduled), similar to Event 1; the electricity cost allows the use of every
available node in the architecture. The nodes are added to the set of candidates during
the following 20 minutes, resulting in a use of all possible nodes between t + 120 and
92

t+ 160 min.
Event 3 (unexpected) simulates an instant rise of temperature, detected by the Mas-
ter Agent at t+160 min. According to administrator rules, the predefined behavior is to
reduce the number of candidates nodes to 2. It is performed in 3 steps, in order to cause
a drop of heat and energy consumption. We allow tasks in progress to complete, resulting
in a delayed drop of energy consumption. The system keeps on working with 2 candidates
until an acceptable temperature is measured at t+240 min (Event 4 (unexpected)). The
master agent then starts to provision the pool of candidates every 10 minutes to reach
again the value of 12.
The scenario of this experiment shows the reactivity of the scheduler and its ability
to manage energy-related events by adapting dynamically the number of provisioned
resources of the physical infrastructure, therefore the power consumption.
5.8 Conclusion
The Nu@ge project aims at designing and building a network of modular datacenters ded-
icated to virtualize IT services. This Cloud architecture offers guarantees of Control over
the underlying infrastructure, knowledge of data location and control over the different
QoS. By using Nu@ge, a final user (i.e. the administrator of an IT system) can focus on
the management of a virtual cluster seamlessly spread across a collection of datacenters
with support on infrastructure supervision.
The project design and implementation are based upon OpenStack components with
an emphasis on extensibility and customization. Administrators are also given a degree of
control over the scheduling subsystem using diet mechanisms (plug-in schedulers) that
use information gathered within the federation by the mean of pro-active monitoring.
Our contribution to this project focused on the collection of information from het-
erogeneous sources in order to specify a model and ensure server provisioning while con-
sidering energy related events. Extension of the GreenDIET middleware (described in
Chapter 3), interaction with the OpenStack software stack and datacenters supervision
engine were developed and integrated to the Nu@ge prototype, later released as commer-
cial offer. Validation was performed on real nodes and showed a reactive provisioning to
temperature and energy costs.
93

94

Chapter 6
Nuvea: An audit platform for
energy-aware virtual machine
management
This chapter presents the Nuvea project, a cloud optimization-oriented platform. Cloud
computing has evolved from a risky and confusing concept to a strategy that small and
large organizations are beginning to adopt as part as their overall computing strategy.
Companies are now starting to ask not whether they should think about cloud computing
but what types of cloud computing models are best suited to solve their business models.
Armed with the experience of previous projects (particularly Nu@ge, described in Chapter
5) and the scientific contributions described in this thesis, the NewGeneration-SR group
and the Avalon research team decided to gather their expertise in a standalone product,
dedicated to the evaluation and optimization of energy efficiency in IT and Cloud plat-
form. The Nuvea platform ambitions to allow Cloud customers to permanently measure,
take over, manage, benchmark and optimize their distributed IT infrastructure in a highly
flexible and real time manner. The remainer of this chapter describes the motivation,
architecture and current implementation of the Nuvea platform.
6.1 Context
Cloud computing technologies supports the major share of ICT sector, currently identified
as the fastest growing sector of the global economy. Worldwide, the cloud computing
services market is expected to be worth $127 billions by 2017 [101]. As discussed in
previous chapters, the critical increase in power consumption constitutes a negative side
effect and the market is inefficient to control it. Computers in datacenters run 24/7 and
95

consume close to 5% of the global worldwide electricity [10]. As an example, Google1 is
supposedly holding more than 900,000 servers with an estimated consumption of 260MW.
US datacenters has an estimated 12 millions servers collectively, with a cost of powering
datacenters estimated to exceed 7B per year since 2011 [102]. The reduction of energy
consumption represents one of the main objectives of NewGeneration-SR in the IT sector.
Additionally, the IaaS2 Cloud market present several inefficiencies that could be lev-
ered by Nuvea customers. From the perspective of providers, power wastage may repre-
sent up to 50% additional cost in what providers bill client for service. This asset-based
business models is very sensitive to price, and represents a strong argument to identify
and gain clients. From the perspective of customers, the current cloud computing land-
scape hinders making a straightforward comparison between providers and cloud service
offerings. It goes along with negative side effects:
No elasticity Traditional Cloud providers sell fixed-sized virtual machines.
No flexibility Evaluating performance across all of the datacenters of multiple cloud
providers is a complicated task. Performance evaluation quickly become out-of-
date and tools must be continuously redesigned.
No interoperability Proprietary solutions makes a customer dependent on a vendor for
products and services, unable to use another vendor without substantial switching
costs (known as vendor lock-in).
No transparency Customers have little knowledge and control over the infrastructure
hosting their applications. Due to the virtualization of the hardware used in cloud
computing, providers may use resource sharing practices that degrade the perfor-
mance of a cloud application.
In this context, NewGeneration-SR, intends to challenge the existing vendor lock-in
threat in the cloud infrastructure market.
The ability to manage workload placement with an extendable metric for energy
efficiency (Chapter 3), the benefits of state-of-the art heuristics to consider multi-criteria
decisions (Chapter 4) constituted the early reflexions of a solution that aims at optimizing
the yield of management of datacenters while giving more flexibility to customers.
1Google is accountable for several green incentives. https://www.google.com/green/2In an IaaS model, a third-party provider hosts hardware, software, servers, storage and other infras-
tructure components on behalf of its users.
96

6.2 Approach
6.2.1 Field survey of practitioners
As we begin the reflexion on a new product, it is important to understand the different
types of customers that could benefit our solution and understand the day-to-day reality
of their computing strategy. Despite the effort of multiples agencies to address energy
efficiency, there is still little knowledge among practitioners on the topic. This section
presents an investigation of state-of-the-art practices as an interview of 8 practitioners
from companies of different size. We used this survey as a research methodology to explore
both the issues to consider for Nuvea as well as the implementation considerations. The
following interviews were conducted with industrial partners, potential new customers
and early adopters of the Nuvea platform. The following list describes each existing
company. For privacy and confidentiality, the name of companies are changed to a single
letter.
• Company A: A large size company based in India that develops and provides IT
services for others business. The discussion were conducted with the head of Cloud
Solutions and an associated engineer.
• Company B: A large size company based in India with an international presence
and ownership of datacenters.
• Company C: A large sized company based in France with a business core in sales.
They own their IT infrastructure.
• Company D: A small-medium size company based in France. Their core of business
in Internet providing and server hosting.
• Company E: A small size company employing approximately 10 employees which
provides hosting solutions. Company F owns a datacenter.
• Company G: A small french company employing less than 10 employees which
provides hosting solutions. Company H does not own its datacenter but rents
space in another one. Discussion was conducted with the CTO who is responsible
for the technical, hardware and software implementations.
• Company H: A small french company employing less than 10 employees which
provides hosting solutions. Company H does not own its datacenter but rents
space in another one.
Table 6.1 depicts the results of the interviews and the practice adoption among compa-
nies. Table 6.2 presents the main concerns regarding optimization of their computational
infrastructure.
97

Practices CompanyA
CompanyB
CompanyC
CompanyD
CompanyE
CompanyF
CompanyG
CompanyH
Consolidation X X X XVirtualization X X X X X X XEfficient cooling X
Energy management systems X XMonitoring server utilization X X X X X X
Demand management X X XWorkload estimation X X X X X
Dynamic Power ScalingRenewable energy sources XSwitch off unused devicesEnergy-efficient hardware X X
Green IT budget X X XDedicated Facilities Manager X X X X X
Hardware upgrades X X X
Table 6.1: Practice adoption among companies
98

Company Core business Interests in the Nuvea solution Concerns regarding optimization
A Cloud services andapplication hosting
Energy reduction, Cost reduction Failure to provide the right ITsolutions to customers
B IT Outsourcing Research and Developmentcollaboration in energy management
Continuous availability, failure tointegrate the solution to their existingprocess, failure of using manpower
C Sales Cost reduction Loss of control over the critical process
D Internet provider Energy management, advancemonitoring
Loss of performance, extra costs
E IT Outsourcing andSoftware Editor
Energy management expertise Interoperability and integration withexisting solutions
F Server hosting Meeting environmental regulation andpolicies, developing energy
management
Settings costs, failure to providequantitative results
G Server hosting Cost reduction, space reduction Integration to production environment
H Collaborative solution Energy management Excessive manpower, extra cost
Table 6.2: Practitioners activities and main concerns
99

Table 6.2 presents the concerns expressed by the practitioners regarding an optimiza-
tion of their infrastructure. This short survey is not meant to be exhaustive nor presenting
a representative set of practitioners.
Some factors were put in light: the lack of measurements/control over the workload
and the difficulty to characterize the target production environment. Very few practition-
ers described a monitoring system with energy capabilities. They often have the amount
of the yearly energy bill but the lack of fine-grained measurement (rack or node level)
makes it difficult to characterize any potential gain.
Based on those answers, a partial conclusion is that a key factor of Nuvea’s success will
rely in an efficient management and monitoring of workload. Management, in this context,
refers to how the resources are assigned in order to process workloads. As assignments
could be based on resource availability, business priorities, events, geolocation and much
more, it makes it difficult to perform any operation without the customer support.
Without careful management and monitoring of current activities, the target organi-
zation cannot achieve the right level of performance. The existence or ability to provide a
testbed is a key to demonstrate predictable performance while minimizing risk on the tar-
get platform. Additionally, it could happen that the customer does not have an accurate
expertise of its own infrastructure.
This constitutes one of the early features offered by Nuvea: the ability to audit a target
platform, characterize its activity and identify situation-specific levers for performance
and energy efficiency. Another important aspect is the importance of APIs. API allows
communication to occur between services and specifies the rules and interfaces. In a land
of proprietary solutions, it eases the integration on an optimization solution by enabling
the pre-development of reference products. In the next phase, they could allow Nuvea to
be available as a connected service or as a toolbox for expert users.
6.3 Analysis: A multi-layer solution
The Nuvea platform is composed of a scheduling engine, in a form of a middleware that
generates placement or migration decisions on virtual machines. Before discussing the
principles and challenges of the solution, we explain the following terms and details their
signification in the context of Nuvea.
Task A task is defined as a fixed unit of workload to be executed on a physical machine
that produces a result
Virtual Machine (VM) A virtual machine is defined (by analogy with a physical ma-
chine) by a certain number of static capacity specifications. These specifications,
namely CPU, RAM, Hard Drive (HD) capacity, constitute the template of the vir-
100

tual machine. Once the VM is started, the monitoring gives report to its dynamic
utilization and its operational performance (number of tasks performed in a given
time).
Physical Machine (PM) The resources are defined by their location and their capacity
(CPU, RAM, HD). They presents different variable of dynamic exploitation such
as latency, temperature, energy consumption, etc.
Placement The placement, or mapping, is the action of assigning a VM to a PM. The
scheduler determines that placement.
Migration The migration refers to the process of moving a running virtual machines
between different physical machines without disconnecting the client or application.
Memory, storage, and network connectivity of the virtual machine are transferred
from the original PM to the destination.
The main idea behind Nuvea is the ability to get the best applicative performance by
affecting the VM to the available PM that fits the most. From an operational point of
view, it implies the ability to establish a ranking of resource and the capacity to apply the
related placement decisions. This is a pretty straightforward problem if some hypothesis
are made on the knowledge of the load (constant and predictable) and status of resources
(fixed amount with predictable performance).
These hypotheses can be non-realistic when discussing complex tasks. A simple task
can be “anticipated” in terms of completion time or resources demand. A virtual machine
hosting several tasks exposes a fluctuating workload during its life-cycle and won’t prob-
ably used all the resources of its template. The current state of the resources is highly
variable. It evolves depending on time, external conditions and hardware failures. The
initial state and the succession of decisions is often not enough to determine the current
situations.
The placement of virtual machines cannot be considered as independent decisions
when it comes to resources demands. If the demand for a shared resource exceeds the
supply, known as contention, performance degradation will result. Basically, when several
VM are racing to utilize the same resource, one of them will win and the rest will have
to wait, with negative impacts on operational performance.
6.3.1 Market situation
The major cloud providers operate exclusively in terms of reservation of capacity: the
virtual machine, defined by their template at their creation, are placed by reservation
on environments in the limits of their respective host capacity. Two main strategies are
employed:
101

Extensive strategy of isolation by reservation of capacity of physical machines. The
virtual machines of a client are placed on a physical machine dedicated to that
client, turned on and exclusively booked.
Intensive strategy of saturation of physical resources: virtual machines are affected to
a physical machines until it disposes of enough resources.
The extensive strategy is inefficient because it tends to multiply the numbers of active
resource with a low utilization. The intensive strategy reaches its limits because it does
not address the concerns of colocation side effects such as congestion.
In general, large systems are closed to the customer: he can not expresses specific
needs other than templates of virtual machines. The virtual machines placement does
not offer guarantees on colocation side effects in a way that a customer can not know
the real reasons of performance degradation observed in applications. The reservation of
physical capacity is not enough to guarantee all aspects of a Quality of Service.
To our knowledge, current market situation leave unexplored two problematics:
• The negative effects of colocation are not addressed by current schedulers. Most
offers relies on templates and uptime guarantees without performance specification.
• The gap between the created/reserved templates and their resource consumption
constitutes a wasted of additional value that actual schedulers are not taking ad-
vantage of.
6.3.2 Technical locks
The expression of the above problematic raises several locks. With the intent to reduce
the time-to-market, an emphasis has been put on practical solutions and fast prototyping.
Definition of criteria related to a Nuvea QoS/SLA Specifications of a Quality of
Service that outreach the simple notion of reservation and presents encouraging/-
better results that the intensive and extensive strategies. This approach will be done
by analyzing existing logs and simulations to evaluate the potential gain between
reservations and actual usages.
Observation and characterization of virtual machines The quality of scheduling
policies depends on the ability to characterize the effective load and behavior of
virtual machines. An environment-independent metric would allow the definition
of execution profiles. This work should be done by consideration a non-intrusive
observation of the virtual machine (i.e. no software agent running on the virtual
machine system would be imposed to the client).
102

Observation and characterization of resources and physical machines The dy-
namicity of a set of servers (failures, add/removal of nodes) should be taken into
account to perform valid placement. Creating a reconfiguration plan implies to
have a time window when decisions are still valid or could be re-adjusted without
additional cost.
Generation of placement solution and reconfigurations Once the physical and vir-
tual machines are properly characterized, one must be able to evaluate the optimal-
ity of a placement plan, identify better solution and execute them by interacting
with hypervisors, operators or middleware.
Learning on colocation side effects The comprehension of colocation side effects, the
capacity to perform placement with respect to resources demands (CPU, RAM, HD,
network) are necessary to improve the schedulers decisions. These phenomena are
well studied in the literature but very few systems implements it in production.
The approach to solve those issues is a learning model representing the correlations
between decisions and consequences on the resources.
6.4 Project management
The pace of this project constitutes a challenge for the coordination of action between
internal teams. With the common ambition of pushing an innovative product that answers
customers concern while integrating state-of-the-art technologies, an agile organization
was set to coordinate the teams. This section explores the strategy and role of the
different teams.
At the start of this project3, we can identify 3 major entities:
• The research team4
• The engineering team5
• The marketing team6
The agile method describes a set of principles for software development under which re-
quirements and solutions evolves through the collaborative effort of self-organizing teams
3The Nuvea project has started in 2014. Initial partners are NewGeneration-SR and the Avalon teamfrom Ecole Normale Superieure de Lyon. I was in charge of coordinating the research and engineeringaspects.
4Two researchers (Associate professor and permanent researcher)5One employee (CTO)6One employee (CEO)
103

cross-functional team [103]. In a context of continuous exchanges with potential cus-
tomers and early adopters, along with tests and prototypes of state-of-the-art technology,
agile methods promotes continuous improvement and flexible response to change.
Figure 6.1 presents the application of those concepts to the Nuvea project.
1 MONTH 2 MONTHS
Start of iteration End of iteration
2 days ‘’o�’’
demonstration
retrospective
W E E K LY R E V I E W S
RESEARCH TEAM
MARKETING TEAM
ENGINEERING TEAM
Figure 6.1: Iterative organization of the Nuvea project
The beginning of an iteration constitutes a definition of goals. The engineering team
takes into account the suggestions brought by the marketing team and their search of
adopters. A major interaction intervenes after one month to discuss progression and early
results. The weekly review describes the progression and keeps everyone informed. The
research team proceeds to define a research plan based on the technical locks identified
as the investigation of new mechanism. The research agenda notably includes commu-
nication of scientific results in the community. The marketing team keeps in touch with
the project and is devoted to the interactions with investors and customers.
On a 2 month basis, all team gather to present their respective results and sets goals
for the next iteration. This organization allows each team to progress at its own pace,
independently of other but with frequent synchronization and consideration of the global
project roadmap. Through the iteration, an emphasis is put on:
Correctness: maintaining a platform that answers major concerns of customers
Usability: ease of installation, configuration and deployment for the internal teams
Compatibility: the use of loosely coupled patterns to ensure interoperability and inte-
gration with new comers and their respective architecture
104

Modularity: each feature needs to be a separate and independently functional module
to ensure the development of experimental/new processes by the research team
The ambition of the Nuvea taskforce is to release a complete solution on the market
is 2017. The study related to the impact, market estimation and pricing are available
on demand within the current commercial offer7 but considered out of the scope of this
thesis. The remainder of this chapter describes the architecture and current state of the
infrastructure.
6.5 Architecture
The major objective of the Nuvea platform is to improve the utilization of physical
resources and reduce energy consumption by (re)allocating virtual machines according
to their real-time resource demand and transitioning idle hosts to low power mode. For
example, assume that two virtual machines are placed on two different hosts, but the
combined resource capacity required by the virtual machines to serve the current load
can be provided by just one of the hosts. Then, one of the virtual machines can be
migrated to the host serving the other virtual machine, and the idle host can be switched
to a low power mode to save energy. Another use case is the observation that a virtual
machine is using very few resources compare to its template/specification. The manager
can restrict this specification to match actual/effective virtual demand.
Apart from virtual machine and consolidation, the system should be able to react to
increases in the resource demand and deconsolidate virtual machine to avoid performance
degradation.
Figure 6.2 expose the logical components and data stores of the Nuvea Infrastructure.
In the following sections, we discuss the design and interaction between modules.
The system is composed of four main modules:
The data collection engine a component that is deployed on the target platform. It is
responsible for collecting data about the resource usage of physical machines, virtual
machines or the various sensors present in the target infrastructure. It transmits
the data in real-time or under a defined periodical interval trough a dedicated bus.
The analysis engine a component that is deployed on the management platform and
interprets the collected metrics to raise alerts or identify utilization patterns.
The execution engine a component that is deployed on the management hosts and
takes management decisions such as mapping virtual machines on hosts or reduce
the template of a virtual machine.
7http://www.nuvea.eu
105

Communicat ion bus
Data collection engine Analysis engine Decision engine
Nuvea drivers Characterization
Optimizer
Replay
Alert
Load injection
API
Action
Figure 6.2: Nuvea modules
The visualization engine a component that is deployed on the management hosts and
expose a reporting portal for monitoring utilization and services performance.
6.6 Modules
6.6.1 Data collection Engine
The data collection engine is deployed on every infrastructure and is executed periodically
to collect utilization, energy and user-defined metrics for any resource. The collected data
is the transmitted on a dedicated bus between the target platform and Nuvea servers.
The deployment may be adapted depending on the target platform. It is possible to:
• Execute agents on each physical host
• Connect to the hypervisor
• Connect to an existing monitoring system
• Allow the client to report its data
The retrieval of data is managed by the Nuvea drivers, based on the Kwapi monitoring
tool [69]. Kwapi is a software toolbox that enables monitoring from different sources with
drivers threads. Each thread is associated to a technology or a specific metric and in
charge of listening and decoding measured values. In the context of Nuvea, we extend
that approach to software source such as systems or user-defined metrics. This approach
allows a simple extensibility of the monitoring systems with independent drivers. Nuvea
106

drivers are instantiated by a driver manager. They send measurements and execute
actions. The driver manager loads all drivers according to a configuration file, regularly
check that they are alive, and reloads them if they are crashed.
6.6.2 Communication Bus
The communication bus is the interface between Nuvea drivers and other modules, in
particular the database of the Analysis engine. Two types of data exchange happen on
the bus:
• Metrics issued from the data collection engine
• Actions issued for decisions
6.6.3 Analysis Engine
The analysis engine is deployed on Nuvea servers. It contains the central database that
is used for storing monitoring values and the various modules of analysis to extract
knowledge and enable decisions on the target platform. The analysis engine exposes a
REST API to query to the database. A measurement is timestamped and associated to
a metric from a particular machine.
Among other modules, it features four operational engines: Characterization, Opti-
mizer, Replay and Alert. Characterization is used to characterize the behavior of an
entity regarding to resource demands or pattern of utilization. This information is then
used to provide a classification of resource or perform informed decisions.
Optimizer evaluates the cost of placement configurations (i.e. placement of tasks/vir-
tual machines on servers). The evaluation is performed in terms of performance degrada-
tion among the virtual machines. It also determines the feasibility of a new configuration
based on the number of required migration and the current status of the infrastructure.
Replay allows the study and comparison of algorithms on a given dataset. The task
information (size, arrival, deadline, etc.) are read from a trace file and executed on
a target platform according developer-defined scheduling policies. At the end of the
execution, Replay provides statistics such as the energy consumption, time, number of
migrations and number of machines used for each policy.
Finally, Alert is in charge of settings alarms to receive notifications or take other
automated actions when a metric crosses a specific threshold. An alarm watches a single
metric over a a defined time period, and performs one or more actions based on the value
of the metric relative to a given threshold over a number of time periods.
107

6.6.4 Decision Engine
The execution engine is deployed on Nuvea servers and communicates with others mod-
ules via the communication bus to retrieve information and execute actions related to the
target platform. It exposes a REST web API which accepts requests from other modules.
The execution engine is in charge of performing placement and interaction with existing
schedulers. It is composed of two modules: load injection and actions. Load injection
performs the execution of user-defined workload in the virtual machines. This tool enable
the study of scheduling policies and the interaction between virtual machines of differ-
ent types. Actions is in charge of executing operations defined by the decision engine.
Operations are transmitted via the bus to the corresponding resources in order change
their active state (shutdown mechanisms) or limit their resource demands (restriction of
bandwidth, disk access rate, etc.).
6.6.5 Reporting Engine
The reporting is essentially a dashboard that provides a monitoring web interface with
dynamic graphs generated from the database. This constitutes an evolution from the
Nu@ge webboard (see Chapter 5) in terms of features. The Nuvea webboard displays
the resource demands of any resource of the system, the possible interactions with the
schedulers and the real-time status of resources. As presented in Figure 6.3, it is directed
to IT administrators and end users for their respectives actions and must be accessible
in a multi-tenant fashion with profiles and permissions. It also constitutes a key element
of Nuvea marketing offer as a visual and concrete representation of the product features.
6.7 Implementation
This section describes the current state of implementation of the Nuvea project. It gives
insights on the main features.
6.7.1 Nuvea Drivers
Nuvea-drivers, part of the Data Collection engine, are in charge of collecting monitored
information on the various source (system, energy sensors, etc.). Table 6.3 presents some
of the drivers implemented in the system.
Their execution is based on a configuration file description. It sets the communica-
tion bus endpoints (ports that receive/send the information) and the different variables
available. The following code section presents the parameters and declaration of a lib-
108

Monitoring resource
utilization
Monitoring service
performance
Managing scheduling
policies
Task submission
VM creation
Shutdown of nodes
Restriction of virtual
machine resources
Reporting Engine
Customer IT administrator
Figure 6.3: Use case diagram of the Reporting engine based on user profile
Drivers Description
Ipmi Power management using the Ipmitools suite8
JsonUrl Energy monitoring based on API querying onGrid’5000
QoS Service performance monitoring
LibvirtInstances Virtual machines monitoring using the libvirt API
ProxmoxVms Virtual machines monitoring dedicated to the Proxmoxvirtualisation solution
SNMP Physical machines and equipment monitoring using anadministration protocol9
PowerVM Virtual machines monitoring dedicated to thePowerVM solution10
VMWare Virtual machines monitoring dedicated to the VMwaresolution11
OpenStack Infrastructure management using OpenStack publicAPIs
Table 6.3: Description of nuvea-drivers implemented
109

virt12[104] driver, dedicated to the monitoring of virtual machine by direct access to the
hypervisor.
# Communication
monitoring endpoint = tcp://0.0.0.0:5010
action requests endpoint = tcp://0.0.0.0:5011
action responses endpoint = tcp://0.0.0.0:5012
# Log f i l e s
log file = /var/log/nuvea−drivers.log
verbose = true
# L i b v i r t i n s t an c e s
[libvirt]
driver = LibvirtInstances
hypervisor uri = qemu+ssh://login@host/system
interval = 5
A driver offers the ability to collect metrics and register actions to be triggered. In
the context of a libvirt drive, we precise quota actions (restricting resources of a VM at
the hypervisor level) and migration capabilities. Those will allow the decision engine to
execute these actions.
class LibvirtInstances(Driver):
””” Driver f o r L i b v i r t ”””
def init (self, ∗∗kwargs):
””” I n i t i a l i z e t he L i b v i r t d r i v e r ”””
Driver. init (self, ∗∗kwargs)
self.interval = int(kwargs.get(’interval’, 5))
self.register action(self.cpu quota)
self.register action(self.disk io quota)
self.register action(self.network bandwidth quota)
self.register action(self.migration)
self.conn = None
The monitoring an data collection can be performed in different ways based on the
access and context of monitoring set on the target infrastructure:
12Libvirt interact with the virtualization capabilities of recent versions of Linux and major virtualiza-tion software solutions
110
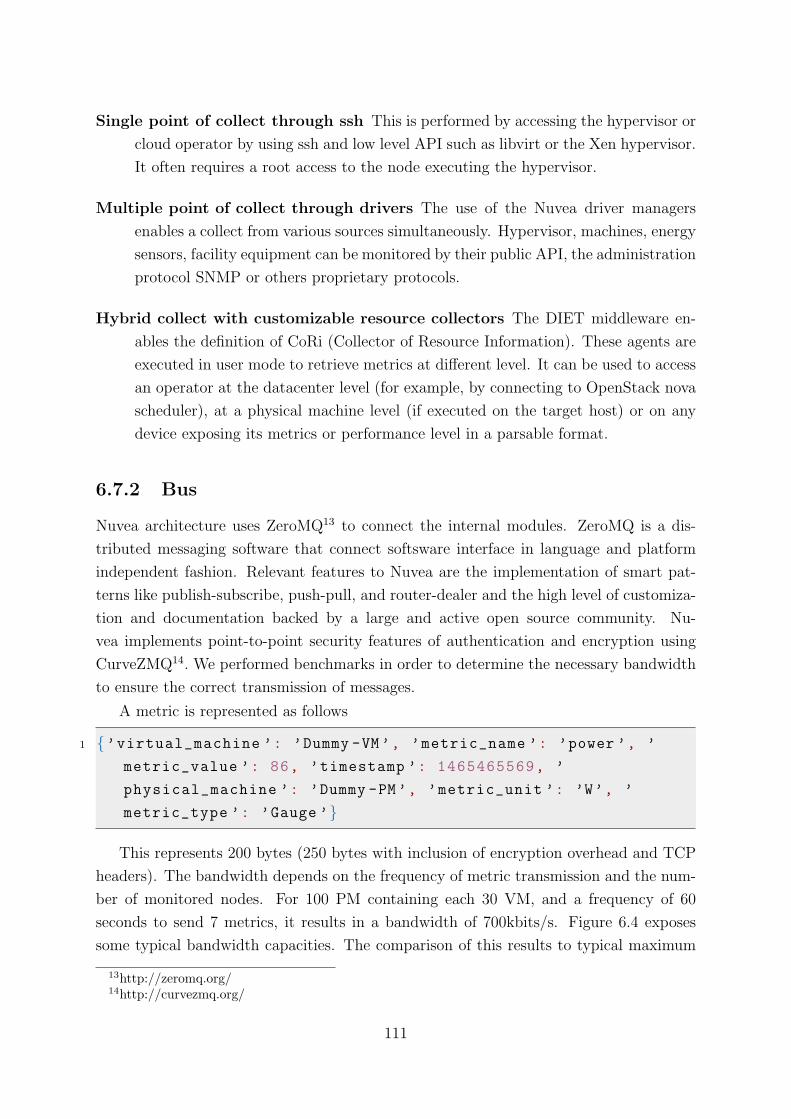
Single point of collect through ssh This is performed by accessing the hypervisor or
cloud operator by using ssh and low level API such as libvirt or the Xen hypervisor.
It often requires a root access to the node executing the hypervisor.
Multiple point of collect through drivers The use of the Nuvea driver managers
enables a collect from various sources simultaneously. Hypervisor, machines, energy
sensors, facility equipment can be monitored by their public API, the administration
protocol SNMP or others proprietary protocols.
Hybrid collect with customizable resource collectors The DIET middleware en-
ables the definition of CoRi (Collector of Resource Information). These agents are
executed in user mode to retrieve metrics at different level. It can be used to access
an operator at the datacenter level (for example, by connecting to OpenStack nova
scheduler), at a physical machine level (if executed on the target host) or on any
device exposing its metrics or performance level in a parsable format.
6.7.2 Bus
Nuvea architecture uses ZeroMQ13 to connect the internal modules. ZeroMQ is a dis-
tributed messaging software that connect softsware interface in language and platform
independent fashion. Relevant features to Nuvea are the implementation of smart pat-
terns like publish-subscribe, push-pull, and router-dealer and the high level of customiza-
tion and documentation backed by a large and active open source community. Nu-
vea implements point-to-point security features of authentication and encryption using
CurveZMQ14. We performed benchmarks in order to determine the necessary bandwidth
to ensure the correct transmission of messages.
A metric is represented as follows
1 {’virtual_machine ’: ’Dummy -VM ’, ’metric_name ’: ’power ’, ’
metric_value ’: 86, ’timestamp ’: 1465465569, ’
physical_machine ’: ’Dummy -PM ’, ’metric_unit ’: ’W’, ’
metric_type ’: ’Gauge ’}
This represents 200 bytes (250 bytes with inclusion of encryption overhead and TCP
headers). The bandwidth depends on the frequency of metric transmission and the num-
ber of monitored nodes. For 100 PM containing each 30 VM, and a frequency of 60
seconds to send 7 metrics, it results in a bandwidth of 700kbits/s. Figure 6.4 exposes
some typical bandwidth capacities. The comparison of this results to typical maximum
13http://zeromq.org/14http://curvezmq.org/
111

rates of transmission technologies shows that Nuvea bus can be implemented over stan-
dard technologies with competitive performance.
4.096
5.6
10
Broadband (Cable & DSL)
Nuvea Bus Bandwidth
Local Area Network (Ethernet cabling)
Figure 6.4: Comparison of Nuvea bandwidth requirements to typical bandwidth capaci-ties. Values are expressed in Mbps
6.7.3 Storage
The main database of Nuvea relies on MongoDB. MongoDB belongs to the family of
NoSQL database. It avoids traditional table-based relational database structure in favor
of JSON-like documents with dynamic schemas. This allows flexibility in the structure
of the data collection recordings as some target platforms may produces partial data
compared to others ones. The database is populated by the collection engine via the bus.
It contains 9 tables:
• customer
• endpoint
• job
• machine
• measurement
• metric
• png
• replay
• rrd
• alarm
The storage configuration accepts 3 modes that can be used simultaneously.
112

#Storage c on f i g u r a t i o n modes
mongo storage = true
csv storage = true
rrd storage = true
Originally, recordings of monitoring were stored in the MongoDB according to the
mongo storage mode. It describes a collection as presented in Figure 6.5.
1 n n 1
machine
_id
customer
physical_machine
virtual_machine
status
measurement
_id
machine_id
metric_id
timestamp
value
metric
_id
name
unit
type
Figure 6.5: Structure of the measurement collection in the mongo database
Benchmarking exposed some limitations in terms of access and writing rates. Table 6.4
presents different situations and their respective performance. Each benchmark represents
a sample of 34440 metrics transmitted from the data collection. The benchmarking
conditions varies from an non realistic case (Emission without reception) to the real
conditions where metrics are received and indexed in the database. We can observe that
use of indexes presents serious limitations to the received metric rate. A database index
is a data structure that improves the speed of data retrieval operations (queries) on a
database table at the cost of additional writes and storage space to maintain the index
data structure. This overhead was not acceptable at the time of evaluation by allowing
only 180 metrics to be effectively received each second.
To leverage this problem, we considered a raw writing of metrics in plain files. This
mechanism can be coupled with a consolidation of metrics (removal of useless informa-
tion) before a delayed writing in the MongoDB. This alternative approach uses the CSV
file format, an open comma-separated representation. Table 6.5 presents the gain of per-
formance between the two approaches. The machine used for this benchmark is a AMD
Opteron @1.7 Ghz (cache=512Kb).
Use case
Company C (see Table 6.1) ordered an estimation of necessary storage and described an
infrastructure of 40 PM containing each 12 VM and 10 metrics to monitored every 10
seconds. It results in a value of 3444 metrics per second to be transmitted to the storage
module. Using the CSV mode, it would required a 1-CPU machine to collect and store
the information.
113

Benchmarking conditions Number of metricsreceived per second
Emission without reception (storage moduledesactived)
20021
Emission/reception without writings 10976
Emission/Reception without indexes 2163
Emission/Reception with indexes (same metric writtenin a loop)
1655
Emission/Reception with indexes in real conditions(independant metrics)
180
Table 6.4: Benchmarking of the storage module when using the MongoDB (mongo storagemode)
Mongo storage mode CSV storage mode
1 CPU 174 metrics per second 7824 metrics per second
4 CPU 410 metrics per second 60244 metrics per second
Table 6.5: Evaluation of performance between storage modes
A CSV recording has the following structure, approximately 100b per measurement.
Fields represent the metric identifier, the physical machine name, the metric name, the
measured value, the unit and the source.
1461593407,stremi -40. reims.grid5000.fr,8ee85c0a -7a78 -4a13 -8
f38 -7 e21bfa9107f,power,94,W,Gauge
It would require 30Go of storage per day of analysis for Company C with a total of
1.35To for an analysis of 45 days.
Related work on database performance issues
We identified performance loss and bottleneck when writing data in the MongoDB. This
is mainly due to data type conversion cost and indexing mechanism. Those issues are an
active research topic within the database community.
Many applications already avoid using database systems, e.g., scientific data analysis
and social networks, due to the complexity and the increased data-to-query time. This
is often describe as a data deluge where we have much more data than what we can
move, store, let alone analyze. A growing part of the database community recognizes this
need for significant and fundamental changes to database design, ranging from low-level
architectural redesigns to changes in the way users interact with the system [105, 106,
114

107, 108]
In particular, Alagiannis et al. [109] introduces the NoDB (for No DataBases) philos-
ophy. Authors performed the conversion of a traditional PostGreSQL database (row-like
organisation of data) into raw files and discovered that the main bottleneck is the re-
peated access and parsing of raw files. Their prototype system based on in situ quering
(ability to query the data without retructuration or indexing) has been evaluated with
different types of files and benchmarks and demonstrates competitive performance with
traditional systems. Other research work enables users to write SQL queries directly
over structured flat files and gradually transfers data from the files to the DBMS [110].
Abouzied et al. [111] relies on the Hadoop framework to hide the cost of loading informa-
tion into a database. As MapReduce jobs already performs parsing of data to organize
it in tuples, they load the data at that exact time into a database to allow future queries
to run faster.
Very large data processing is increasingly becoming a necessity for modern applications
in businesses and in sciences. The proposition of an hybrid solution between raw and
indexed storage for Nuvea constitutes a future work to ensure the relevance of the platform
for the incoming data deluge area.
6.7.4 Load injector
The load injector is in charge of executing a synthetic or a real workload on each deployed
virtual machine. This tool has been developed for research and testing purposes in order
to recreate virtual machine placement for the evaluation of scheduling policies. It uses a
generic multi-thread server (described in details in Chapter 4) that produces a token as
the output of the completion of a workflow. The workflow completion is a task that need
the execution of 3 steps based on operations using CPU, Network and Disk resources.
Token
NetworkCPU Disk
Figure 6.6: Workflow of a token production
A weight factor is defined for each parameter to increase the number of steps to
perform the task (i.e. producing the token). The adjustment of this weight can be used
115

to represent any kind of non-fluctuating workload based on those three resources. The
produced token acts as a service. By monitoring the produced tokens rate of a certain set
of weights, it is possible to establish Service Level Objectives. The Server Level Objective
constitutes the produced token rate for a given configuration. This tool constitutes the
base of the analysis of virtual machine placement and the consequences on performance
degradation.
We make use of this tool to execute trace on the Nuvea infrastructure and evaluate
scheduling policies. Figure 6.7 presents a workflow diagram of trace log execution.
Figure 6.7: Workflow of a trace log replay
The scenario is described with OpenStack installed as the Cloud manager. At the
beginning of the trace log replay, a scheduling policy has to be indicated to the manager.
The manager reads the trace log as the job inputs to take into account the characteristics
of jobs (such as time of arrival, duration, type, dependencies.) It create a script based on
the load injector template with appropriate weightings for the token production steps.
The script is transmitted to Cloud init, a technology that supports automated configu-
ration of instances at boot time. Using the Openstack nova API, a virtual machine is
created and executes the script according to the underlying job description of the task.
Once all job from the trace logs has been executed, the manager generates statistics as-
sociated to the background monitoring of resources to determine the value of number of
active servers, energy consumed, etc. related to the trace log replay.
116

Replays are stored in the replay and job collections (Figure 6.8). They can be analyzed
offline post-experiment.
Figure 6.8: Representation of replay collection in the database
6.7.5 Nuvea actions
The Nuvea-actions module is in charge of executing decision on resources by the means of
scripts and commands. As part of the decision engine, it transmits orders via the bus to
any part of the infrastructure. We use that module to implement energy savings levers. In
the current version of Nuvea, two major actions are possible: the transition of resources
to low power modes (standby/shutdown) and the limitation of available resource for the
virtual machines.
The shutdown lever relies on Intelligent Platform Management Interface (IPMI). IPMI
is a standardized management interface, present on most of recent servers, that enables
the control of hardware components whether the node is active or not. This is a tool
of choice to shutdown servers or start idle nodes. IPMI-enabled devices typically al-
lows the management energy and temperature sensors, cooling systems or servers status
(on/off/reset/reboot). The following code section shows the integration of the ipmitool
command on Nuvea drivers.
def power(self, physical machine , value):
””” Set p h y s i c a l machine power s t a t u s ”””
command = ’ipmitool ’
command += ’−I ’ + self.interface + ’ ’
command += ’−H ’ + self.host + ’ ’
command += ’−U ’ + self.username + ’ ’
command += ’−P ’ + self.password + ’ ’
if value == ’ON’:
command += ’chassis power on’
#Turn on the s e r v e r
else:
117

command += ’chassis power soft’
#Turn o f f t h e s e r v e r
The limitation of virtual machine resource, namely the shrink lever, is the application
of quota values for a specific system resource. The hypervisor is the layer between the
physical machine and the virtual machine. Using the unique identifier of the virtual
machine (UUID), the shrink lever connects to the hypervisor and submits quotas. The
following code section presents the limitation of network resource by setting inbound and
outbound averages.
def network bandwidth quota(self, virtual machine , quota):
””” Set network quota ”””
domain = self.conn.lookupByUUIDString(virtual machine)
for dev in self.getDevices(domain, ’interface’):
domain.setInterfaceParameters(dev,
{’inbound.average’: int(quota)})
domain.setInterfaceParameters(dev,
{’outbound.average’: int(quota)})
LOG.info(’Network I/O quota for %s is %s’ %
(virtual machine , quota))
6.7.6 Characterization
The characterization module is in charge of profiling and identifying the resources de-
mands of a virtual machine. The purpose is twofold:
Improving the physical machine utilization Energy wastage is often cause by ex-
cessive reservations of capacity due to oversized virtual machines. Besides at peak
times, the low utilization on average keeps more active nodes than necessary. By
having knowledge of effective virtual machines demands, one could perform consol-
idation mechanisms limit the number of active resources.
Minimizing the performance degradation between virtual machines. Typically,
Cloud systems are dynamic with multiple jobs coming and leaving in an unpre-
dictable fashion, sharing the physical machine capacity. Contention for resources
is causing degradation of services performance. By having knowledge of virtual
machines demands, one could eliminate excessive share on physical machines and
guaranteed Service Level Objectives [112].
The profiling of virtual machines demands is performed while considering the virtual
machines as black boxes : no software is installed inside the virtual machines so any
118

observations or monitoring must be performed from external sources. This is highly
relevant in terms of non intrusivity regarding the end user applications.
In this context, we rely on the end user to report metrics of activity completion. By
analogy with the load injection workflow (Figure 6.6), an application-reported metric can
be associated with a Service Level Objective. Application-reported metrics can be any
indicator of the applicative workload over a time period: number completed task, number
of downloads, number of user connected, etc. We believe these values could be reported
without context information to preserve the client privacy.
The key idea of the characterization is to evaluate of a set of system metrics (CPU,
network, HD) relates to application-reported variables and establish a correlation analysis
to define a virtual machine resource profile. We use Canonical Correlation Analysis
(CCA) as the statistical method to obtain workload correlation.
Canonical correlation analysis is used to identify and measure the associations among
two sets of variables. Canonical correlation is appropriate in the same situations where
multiple regression would be, but where are there are multiple intercorrelated outcome
variables. Canonical correlation analysis determines a set of canonical variates, orthogo-
nal linear combinations of the variables within each set that best explain the variability
both within and between sets.
Current version of the scheduler shows encouraging results using the CCA approach.
Implementation details and evaluation will be released soon by an engineer of NewGeneration-
SR.
Related work on correlation-aware techniques
Several research work [113] [114] [115] proposed to estimate historical workload as a
static single value to allow VM placement to be abstracted and solved as a single value.
It considers the physical servers as bins whose sizes are the capacities of a computing
resource such as CPU, memory usage, disk I/O or network bandwidth.
Xiaoqiao et al. demonstrates that summarizing historical workloads with a single
value can lose too much information [116]. Their method proposed a correlation-aware
VM selection technique that forms pairs of negatively correlated VMs, and placed each
negatively correlated on a physical server.
6.7.7 Alert management
The alert module is set to read metrics as they are transmitted to the analysis engine.
Any metric present in the database with a unique identifier can be monitored.
The action following the raise of an alarm can be actions from the Nuvea action
module (shutdown or shrink of a resource) or notifications sent to a specific modules or
119

a user. An alarm can have three possible states:
OK The metric is within the defined threshold
ALARM The metric is outside the defined threshold
NONE The metric is not available, or not enough data is available for the metric to
determine the alarm state
The following code segment shows the definition of an alarm related to the temperature
of a physical machine.
class AlertManager(Driver):
”””Management o f A l e r t ”””
def set alarm(Alert):
””” I n i t i a l i z e t he L i b v i r t d r i v e r ”””
Alert.define resource = resource id
Alert.define metric id = metric id
Alert.define action = Action.shutdown
Alert.define thresold = 28
Alert.define thresold limit = "up"
Alert.register period number = 3
Alert.register period time = 5
In this example, if the temperature of the resource is monitored 3 times (3 periods
of 5 seconds) over the value 28, the node will be shutdown. It is possible to register a
sequence of actions to be performed.
6.7.8 Reporting and visualisation
Nuvea dashboard provides a system-wide visibility into resource utilization, application
performance, and operational health. It is implemented as monitoring web interface that
enables the creation of dynamic graphs based on any metric monitored. The graphs are
generated from RRD files by quering the Nuvea database recordings. The dashboard sup-
ports multi-tenant management with profiles and associated permissions. The librairies
described in Table 6.6 were used during the development.
The left part of the menu bar shows different metrics: energy, CPU, RAM, disk,
network and QoS for a set of resources. On the right side, one can select a different
customer, the view mode (PMs or VMs) and the display scale. The following Figures
presents screenshots of the web interface. The summary graph shows a stack of all
measurements.
120

Name Description
Flask Python framework for web development
Jform Java based component for generating userinput forms
JQuery JavaScript library for client-side scripting
Table 6.6: Libraries used for the development of the webboard
Figure 6.9: Nuvea’s dashboard summary
121

Figure 6.10: Creation of a new administrator account with target endpoints for messageexchange and certificate for bus authentication
122

Figure 6.11: Nuvea’s replay screen with selection of algorithm to evaluate and statisticsof previous executions
123

Figure 6.12: Screen of Nuvea replay before an optimization decision. Each line representsa different physical machine. Grey slots represents available resource. Green slots rep-resents active virtual machine. Before optimization, the virtual machines are scatteredwith a large number of active resources.
124

Figure 6.13: Screen of Nuvea replay after an optimization decision. Each line representsa different physical machine. Grey slots represents available resource. Green slots repre-sents active virtual machine. After optimization, the virtual machines are packed on areduced amount of resources.
125

6.8 Conclusion
The Nuvea platform is an initiative motivated by the current situation of the Cloud
computing market regarding energy wastage and customer access to full premises. The
identification of levers related to consolidation of resource according to their effective
usage and characterization of resource presents various challenges. From a research per-
spective, some elements of this topic have been well studied but methods remains hard to
implement in real situations. From the industrial perspective, adoption of optimization
tools while minimizing risks in production environment limits the adoption state-of-the-
art mechanisms. The organization of this project relies on an iterative organization and
a coordination between internal teams to maintain a feedback loop according to the cus-
tomer specifications. Surveys has confirmed the need for such a tool and put in light the
lack of control of end users and managers on their own premises.
In this Chapter, the architecture and modules of Nuvea have been proposed and de-
scribed. Nuvea relies on three engines: (i) the data collection engine that monitors all
kind of physical or virtual equipment (ii) the analysis engine that extracts knowledge
from real-time situation historical data and (iii) the decision engine that applies levers
and interacts with schedulers. The current implementation of the modules has shown
promising results and open doors to several contributions from research works and cus-
tomer use cases.
In 2014 and 2016, Nuvea has been granted by European commission through the selec-
tive H2020 ICT Disruptive technologies program15. This award highlights our potential
to become a major actor in the European Cloud market. The platform has been pre-
sented at several scientific and industrial events, in particular at national Inria-Industry
Meetings (Paris, France) focused on “Power transition””. A demonstration of live op-
timization has been performed at Super Computing 2015 in Austin, Texas. Following
our collaboration with Mahindra Ecole Centrale (Hyderabad, India), NewGeneration has
been invited to take part of the French presidential delegation to visit India and establish
partnerships with Indian companies. Recently, Nuvea has received the Award for Energy
Transition and Digital Technologies for its energy reduction on datacenters by the Usine
Digitale 16.
We believe that the next generation of Cloud business models and management sys-
tems will need to be adopted by the practice. Current offers often advertized encouraging
figures of performance and cost reduction but they often neglect the cost of integration
within legacy systems. The DevOps profile constitutes a rising trend and is issued from
a practice that emphasizes the collaboration and communication of both software devel-
15http://cordis.europa.eu/project/rcn/196492 en.html16http://www.usine-digitale.fr/article/nuvea-new-generation-sr-prix-digitalisation-des-trophees-de-la-
transition-energetique.N396012 (in french)
126

opers and other IT professionals while automating the process of software delivery and
infrastructure changes [117, 118, 119]. Suggesting innovative tools with consideration of
integration, extension and customization will ease the promotion of news practices and
their adoption in production environments.
New features, users specification and results from research investigations are contin-
uously integrated into the platform. Figure 6.14 concludes this chapter with a represen-
tation of Nuvea’s ecosystem.
127

Multi-tenant
environment
with secured
access
Management portal
Analysis engine
Data collection
engine Decision engine
Alert
Characterization
Replay
Optimizer Load injector
Action
Manager
E�cient storage
in structured
and raw format
Dashboard- Resource utilization
- Service management
- Instance creation
Continuous monitoring- Physical server
- Virtual machines
- Cooling and power systems
- PDU, wattmeters
- Hypervisor APIs
High-speed bus
with encryption
and authentication
Rest API
supporting major
Cloud providers
Bus
Virtual machine
Physical
servers
Senso
rs
IT administrator
Figure 6.14: Nuvea ecosystem
128

Chapter 7
Conclusion and Perspectives
7.1 Conclusion
Cloud computing has change the habits of numerical usage. The advances in technology
and network access pushes the perception of remote computing resources as a fifth utility
[120]. Following this increase of services, users and devices, the number of Cloud datacen-
ters and infrastructures is expected to grow and consume a large portion of the worldwide
energy consumption. In this context, an energy-aware management of datacenters is a
critical issue in regard to financial and environmental concerns.
This thesis has investigated the problem of scheduling on Clouds by using trade-offs
mechanisms between the performance and the energy consumption of resources. These
trade-offs enable the involvement of users and providers of Clouds in order to deliver a
service that is proportional to the effective demand and eliminate energy wastage often
due to over-provisioning.
In addition to the scientific contributions, we took the challenge to apply this tech-
niques on industrial use cases within two major projects. The pace and constraints of
the Cloud market imposes a fast transfer of research work to the industry while taking
into account operational constraints. To address the formulated issues, this thesis has
achieved each of the objectives delineated in Chapter 1.
Chapter 2 presents an analysis of the area of energy-efficiency measurement and re-
source management in Clouds. The research literature analysis has helped to identify
gaps, open challenges and clearly determine the research directions taken in this thesis.
Based on this analysis, Chapter 3 has proposed an application-independent metric
that can be used to evaluate the energy-efficiency of a resource. The proposed GreenPerf
metric is based on the measurement of energy consumed over the completion of a set of
service requests. The metric can easily be extended according to the level of information
available. It was integrated in the DIET middleware as GreenDIET, and used to design
scheduling policies based on users and providers willingness to save energy.
129

Chapter 4 has extended the approach by using metaheuristics considering workflow
placement. We investigated a genetic algorithm that improves the quality of solutions
by the means of successive iterations, highlighting the affinity between tasks and servers
from an energy reduction perspective. Evaluation was performed on real Cloud traces
with significant reduction in energy consumption and improvements in performance on
a large set of solutions, enabling the possibility of trade-offs based on the context of
execution.
The first industrial application of this research work is depicted in Chapter 5. The
Nu@ge project is motivated by data sovereignty concerns in Cloud Computing, and pro-
pose to implement a mesh of container-sized datacenters on the French territory. Our
contribution takes places in the aggregation of information and constraints to enable
server provisioning and virtual machine placement within a nationwide federation. Apart
from the global evaluation of the project, this work resulted in several specifications and
improvements of the GreenDIET scheduler by considering energy cost and temperature.
My contribution is the exploitation of those concepts in a standalone platorm, Nuvea,
introduced in Chapter 6. The platform has been designed and implemented to both be
released as a commercial product dedicated to yield management of datacenters for the
NewGeneration-SR start-up and used as a tool in further academic research within the
Avalon team. Nuvea constitutes a solution for dynamic virtual machine placement and
consolidation based on the collection and analysis of data issued from datacenters and
computing resources. Outcomes have been presented within the scientific community and
integrated as a commercial product.
Management of datacenters and Cloud resources with the consideration of tradeoffs
between energy consumption and performance will enable providers to ensure the delivery
of well-dimensioned services with minimal energy wastage. Research in energy-efficient
management, such as presented in this thesis, combined with innovative Cloud business
models will undoubtedly drive further advances in development and sustainability of next
generation computing systems.
7.2 Perspectives
The contributions and investigations presented in this thesis put in light several open
research problems that need to be addressed in order to further advance the area.
7.2.1 Exploiting virtual machine dependencies
Virtual machines are requested by end users to provide services. Typical services can
express complex patterns of communications between virtual machines (data access, ex-
change of information, ...). However, due to lack of specifications, non-optimized alloca-
130

tions or migration operations, communicating virtual machines may end up on distant
nodes or locations, resulting in costly network transfers between them.
To reduce that communication cost, it is necessary to take into account the depen-
dencies or the topology of virtual machines. Scheduling policies would benefit from mod-
elization of network equipments to estimate their energy consumption and their influence
in the infrastructure. It would ensure that data and virtual machines operation cost does
not exceed the benefits of optimization.
7.2.2 Exploiting virtual machine usage patterns
Cloud infrastructures allow end user to deploy any kind of applications and workload.
Workload can present fluctuations or present irregular resources utilization in terms of
data, network or compute demands. The mutualisation of resources, in particular by
the means of virtualization, implies a share of system resources. Applications can be
impacted by this co-allocation and suffer performance degradation. Usage patterns, load
forecasting or user involvement would lead to a more efficient resource provisioning and
increase the guarantee of a satisfying servers use rate.
7.2.3 Integrating thermal-aware scheduling
Datacenters are manufactured with constraints on their efficient use of energy. A signifi-
cant part of energy is used for the cooling of resource as high temperature of components
is known to cause hardware failures and degrade availability. The resource allocation can
be combined with the cooling problem by considering heat dissipation and hotspots. With
benefits of cross-disciplinary studies in cyber-physical models of datacenters, preserving
a safe temperature of resources and specific spatial areas of a datacenter would present
additional constraints in regard to a multi-criteria optimization approach (Chapter 4).
131

132

Bibliography
[1] Gary Cook. How clean is your cloud. Catalysing an energy revolution, page 11,
2012.
[2] Etienne Espagne et al. Climate finance at cop21 and after: Lessons learnt. CEPII,
Policy Brief, (9), 2016.
[3] Rich Miller. Who has the most web servers. Data Center Knowledge,
http://www. datacenterknowledge. com/archives/2009/05/14/whos-got-the-most-
web-servers, 2009.
[4] Neil Rasmussen. Determining total cost of ownership for data center and network
room infrastructure.
[5] Robert S Kaplan and David P Norton. Using the balanced scorecard as a strategic
management system, 1996.
[6] Daniel Balouek-Thomert, Eddy Caron, and Laurent Lefevre. Energy-aware server
provisioning by introducing middleware-level dynamic green scheduling. In Work-
shop HPPAC’15. High-Performance, Power-Aware Computing, Hyderabad, India,
May 2015. In conjunction with IPDPS 2015.
[7] Daniel Balouek-Thomert, Arya K. Bhattacharya, Eddy Caron, Gadireddy
Karunakar, and Laurent Lefevre. Parallel differential evolution approach for cloud
workflow placements under simultaneous optimization of multiple objectives. In
Congress on Evolutionary Computation (IEEE CEC 2016), Vancouver, Canada,
July 2016.
[8] Daniel Balouek-Thomert, Eddy Caron, Pascal Gallard, and Laurent Lefevre.
Nu@ge: Towards a solidary and responsible cloud computing service. In
CloudTech’2015, Marrakesh, Morocco, June 2015.
[9] Daniel Balouek-Thomert, Eddy Caron, Pascal Gallard, and Laurent Lefevre.
Nu@ge : A container-based cloud computing service federation. In Concurrency
133

and Computation: Practice and Experience (CCPE), John Wiley and Sons, Ltd,
USA, 2016 (in review).
[10] James M Kaplan, William Forrest, and Noah Kindler. Revolutionizing data center
energy efficiency. Technical report, Technical report, McKinsey & Company, 2008.
[11] European Commission. Code of conduct on data centres energy efficiency (version
2): Endorser guidelines and registration forms. Technical report, 2009.
[12] A Rawson, J Pfleuger, and T Cader. Data center power efficiency metrics: Pue and
dcie. The Green Grid, page 120, 2007.
[13] Junaid Shuja, Kashif Bilal, Sajjad Ahmad Madani, and Samee U Khan. Data center
energy efficient resource scheduling. Cluster Computing, 17(4):1265–1277, 2014.
[14] Richard Brown et al. Report to congress on server and data center energy efficiency:
Public law 109-431. Lawrence Berkeley National Laboratory, 2008.
[15] Tugrul Daim, Jay Justice, Mark Krampits, Matthew Letts, Ganesh Subramanian,
and Mukundan Thirumalai. Data center metrics: An energy efficiency model for
information technology managers. Management of Environmental Quality: An In-
ternational Journal, 20(6):712–731, 2009.
[16] Gemma A BRADY, Nikil KAPUR, Jonathan L SUMMERS, and Harvey M
THOMPSON. A case study and critical assessment in calculating power usage
effectiveness for a data centre. Energy conversion and management, 76:155–161,
2013.
[17] Gunjan Khanna, Kirk Beaty, Gautam Kar, and Andrzej Kochut. Application per-
formance management in virtualized server environments. In 2006 IEEE/IFIP Net-
work Operations and Management Symposium NOMS 2006, pages 373–381. IEEE,
2006.
[18] Ran Giladi. Evaluating the mflops measure. IEEE Micro, 16(4):69–75, 1996.
[19] Wu-chun Feng and Kirk Cameron. The green500 list: Encouraging sustainable
supercomputing. Computer, 40(12):50–55, 2007.
[20] Jack J Dongarra, Piotr Luszczek, and Antoine Petitet. The linpack benchmark:
past, present and future. Concurrency and Computation: practice and experience,
15(9):803–820, 2003.
[21] C-H Hsu et al. Towards efficient supercomputing: A quest for the right metric.
In Parallel and Distributed Processing Symposium, 2005. Proceedings. 19th IEEE
International, pages 8–pp. IEEE, 2005.
134

[22] Balaji Subramaniam and Wu-chun Feng. The green index: A metric for evaluating
system-wide energy efficiency in hpc systems. In Parallel and Distributed Processing
Symposium Workshops & PhD Forum (IPDPSW), 2012 IEEE 26th International,
pages 1007–1013. IEEE, 2012.
[23] Andrea Castagnetti, Cecile Belleudy, Sebastien Bilavarn, and Michel Auguin. Power
consumption modeling for dvfs exploitation. In Digital System Design: Architec-
tures, Methods and Tools (DSD), 2010 13th Euromicro Conference on, pages 579–
586. IEEE, 2010.
[24] Anne-Cecile Orgerie, Marcos Dias de Assuncao, and Laurent Lefevre. A survey on
techniques for improving the energy efficiency of large-scale distributed systems.
ACM Computing Surveys (CSUR), 46(4):47, 2014.
[25] Xiaobo Fan, Wolf-Dietrich Weber, and Luiz Andre Barroso. Power provisioning
for a warehouse-sized computer. In ACM SIGARCH Computer Architecture News,
volume 35, pages 13–23. ACM, 2007.
[26] Andreas Merkel and Frank Bellosa. Balancing power consumption in multiprocessor
systems. In ACM SIGOPS Operating Systems Review, volume 40, pages 403–414.
ACM, 2006.
[27] P Hernandez. Microsoft joulemeter: Using software to green the data center, 2010.
[28] Aurelien Bourdon, Adel Noureddine, Romain Rouvoy, and Lionel Seinturier. Power-
api: A software library to monitor the energy consumed at the processlevel. ERCIM
News, 2013(92), 2013.
[29] Brendan Jennings and Rolf Stadler. Resource management in clouds: Survey and
research challenges. Journal of Network and Systems Management, 23(3):567–619,
2015.
[30] EC Amazon. Amazon elastic compute cloud (amazon ec2). Amazon Elastic Com-
pute Cloud (Amazon EC2), 2010.
[31] Martin Randles, David Lamb, and A Taleb-Bendiab. A comparative study into dis-
tributed load balancing algorithms for cloud computing. In Advanced Information
Networking and Applications Workshops (WAINA), 2010 IEEE 24th International
Conference on, pages 551–556. IEEE, 2010.
[32] Jinhua Hu, Jianhua Gu, Guofei Sun, and Tianhai Zhao. A scheduling strategy
on load balancing of virtual machine resources in cloud computing environment.
In 2010 3rd International symposium on parallel architectures, algorithms and pro-
gramming, pages 89–96. IEEE, 2010.
135

[33] Anton Beloglazov, Jemal Abawajy, and Rajkumar Buyya. Energy-aware resource
allocation heuristics for efficient management of data centers for cloud computing.
Future generation computer systems, 28(5):755–768, 2012.
[34] Amandeep Kaur Sidhu and Supriya Kinger. Analysis of load balancing techniques in
cloud computing. International Journal of Computers & Technology, 4(2):737–41,
2013.
[35] Wenbing Zhao, PM Melliar-Smith, and Louise E Moser. Fault tolerance middle-
ware for cloud computing. In 2010 IEEE 3rd International Conference on Cloud
Computing, pages 67–74. IEEE, 2010.
[36] Anju Bala and Inderveer Chana. Fault tolerance-challenges, techniques and imple-
mentation in cloud computing. IJCSI International Journal of Computer Science
Issues, 9(1):1694–0814, 2012.
[37] Michael Pawlish, Aparna S Varde, and Stefan A Robila. Analyzing utilization rates
in data centers for optimizing energy management. In Green Computing Conference
(IGCC), 2012 International, pages 1–6. IEEE, 2012.
[38] J Whitney and P Delforge. Data center efficiency assessment–scaling up energy
efficiency across the data center industry: Evaluating key drivers and barriers.
NRDC and Anthesis, Rep. IP, pages 14–08, 2014.
[39] Anne-Cecile Orgerie and Laurent Lefevre. When clouds become green: the
green open cloud architecture. In International Conference on Parallel Comput-
ing (ParCo), volume 19, pages 228–237, 2009.
[40] Jan Stoess, Christian Lang, and Frank Bellosa. Energy management for hypervisor-
based virtual machines. In USENIX annual technical conference, pages 1–14, 2007.
[41] Anton Beloglazov and Rajkumar Buyya. Openstack neat: a framework for dy-
namic and energy-efficient consolidation of virtual machines in openstack clouds.
Concurrency and Computation: Practice and Experience, 27(5):1310–1333, 2015.
[42] Ripal Nathuji, Canturk Isci, and Eugene Gorbatov. Exploiting platform hetero-
geneity for power efficient data centers. In Fourth International Conference on
Autonomic Computing (ICAC’07), pages 5–5. IEEE, 2007.
[43] Saurabh Kumar Garg, Chee Shin Yeo, Arun Anandasivam, and Rajkumar Buyya.
Environment-conscious scheduling of hpc applications on distributed cloud-oriented
data centers. Journal of Parallel and Distributed Computing, 71(6):732–749, 2011.
136

[44] Sanjay Kumar, Vanish Talwar, Vibhore Kumar, Parthasarathy Ranganathan, and
Karsten Schwan. vmanage: loosely coupled platform and virtualization manage-
ment in data centers. In Proceedings of the 6th international conference on Auto-
nomic computing, pages 127–136. ACM, 2009.
[45] Violaine Villebonnet, Georges Da Costa, Laurent Lefevre, Jean-Marc Pierson, and
Patricia Stolf. Towards generalizing” big little” for energy proportional hpc and
cloud infrastructures. In Big Data and Cloud Computing (BdCloud), 2014 IEEE
Fourth International Conference on, pages 703–710. IEEE, 2014.
[46] AKM Talukder, Michael Kirley, and Rajkumar Buyya. Multiobjective differential
evolution for scheduling workflow applications on global grids. Concurrency and
Computation: Practice and Experience, 21(13):1742–1756, 2009.
[47] Jinn-Tsong Tsai, Jia-Cen Fang, and Jyh-Horng Chou. Optimized task scheduling
and resource allocation on cloud computing environment using improved differential
evolution algorithm. Computers & Operations Research, 40(12):3045–3055, 2013.
[48] Abdulhussein Abdulmohson, Sudha Pelluri, and Ramachandram Sirandas. Energy
efficient load balancing of virtual machines in cloud environments. International
Journal of Cloud-Computing and Super-Computing, 2(1):21–34, 2015.
[49] Francois Legillon, Nouredine Melab, Didier Renard, and El-Ghazali Talbi. A multi-
objective evolutionary algorithm for cloud platform reconfiguration. In Parallel and
Distributed Processing Symposium Workshop (IPDPSW), 2015 IEEE International,
pages 286–291. IEEE, 2015.
[50] Attila Benyi, Jozsef Daniel Dombi, and Attila Kertesz. Energy-aware vm scheduling
in iaas clouds using pliant logic. In CLOSER, pages 519–526, 2014.
[51] Mohand Mezmaz, Nouredine Melab, Yacine Kessaci, Young Choon Lee, E-G Talbi,
Albert Y Zomaya, and Daniel Tuyttens. A parallel bi-objective hybrid metaheuristic
for energy-aware scheduling for cloud computing systems. Journal of Parallel and
Distributed Computing, 71(11):1497–1508, 2011.
[52] Chun-Wei Tsai and Joel JPC Rodrigues. Metaheuristic scheduling for cloud: A
survey. IEEE Systems Journal, 8(1):279–291, 2014.
[53] Bhaskar Prasad Rimal, Eunmi Choi, and Ian Lumb. A taxonomy and survey of
cloud computing systems. In INC, IMS and IDC, 2009. NCM’09. Fifth Interna-
tional Joint Conference on, pages 44–51. Ieee, 2009.
137

[54] Radu Prodan and Simon Ostermann. A survey and taxonomy of infrastructure as a
service and web hosting cloud providers. In Grid Computing, 2009 10th IEEE/ACM
International Conference on, pages 17–25. IEEE, 2009.
[55] Nicolas Ferry, Alessandro Rossini, Franck Chauvel, Brice Morin, and Arnor Solberg.
Towards model-driven provisioning, deployment, monitoring, and adaptation of
multi-cloud systems. In CLOUD 2013: IEEE 6th International Conference on
Cloud Computing, pages 887–894, 2013.
[56] Benjamin Satzger, Waldemar Hummer, Christian Inzinger, Philipp Leitner, and
Schahram Dustdar. Winds of change: From vendor lock-in to the meta cloud.
IEEE internet computing, 17(1):69–73, 2013.
[57] Mendel Rosenblum. Vmware’s virtual platformTM. In Proceedings of hot chips,
volume 1999, pages 185–196, 1999.
[58] Rajkumar Buyya, Rajiv Ranjan, and Rodrigo N Calheiros. Intercloud: Utility-
oriented federation of cloud computing environments for scaling of application ser-
vices. In Algorithms and architectures for parallel processing, pages 13–31. Springer,
2010.
[59] Roberto G. Cascella, Christine Morin, Piyush Harsh, and Yvon Jegou. Contrail:
A reliable and trustworthy cloud platform. In Proceedings of the 1st European
Workshop on Dependable Cloud Computing, EWDCC ’12, pages 6:1–6:2, New York,
NY, USA, 2012. ACM.
[60] Emanuele Carlini, Massimo Coppola, Patrizio Dazzi, Laura Ricci, and Giacomo
Righetti. Cloud federations in contrail. In Euro-Par 2011: Parallel Processing
Workshops, pages 159–168. Springer, 2012.
[61] Benny Rochwerger, David Breitgand, Eliezer Levy, Alex Galis, Kenneth Nagin,
Ignacio Martın Llorente, Ruben Montero, Yaron Wolfsthal, Erik Elmroth, Juan
Caceres, et al. The reservoir model and architecture for open federated cloud
computing. IBM Journal of Research and Development, 53(4):4–1, 2009.
[62] Antonio Celesti, Francesco Tusa, Massimo Villari, and Antonio Puliafito. How
to enhance cloud architectures to enable cross-federation. In Cloud Computing
(CLOUD), 2010 IEEE 3rd International Conference on, pages 337–345. IEEE,
2010.
[63] Mohammed El Mehdi Diouri et al. Your cluster is not power homogeneous: Take
care when designing green schedulers! In IGCC-4th IEEE International Green
Computing Conference, 2013.
138

[64] Seung-Hwan Lim et al. A dynamic energy management scheme for multi-tier data
centers. In ISPASS, pages 257–266. IEEE Computer Society, 2011.
[65] Ata E Husain Bohra and Vipin Chaudhary. Vmeter: Power modelling for virtu-
alized clouds. In Parallel & Distributed Processing, Workshops and Phd Forum
(IPDPSW), 2010 IEEE International Symposium on, pages 1–8. Ieee, 2010.
[66] Md E Haque, Kien Le, Inigo Goiri, Ricardo Bianchini, and Thu D Nguyen. Pro-
viding green slas in high performance computing clouds. In Green Computing
Conference (IGCC), 2013 International, pages 1–11. IEEE, 2013.
[67] Eddy Caron and Frederic Desprez. DIET: A scalable toolbox to build network
enabled servers on the grid. International Journal of High Performance Computing
Applications, 20(3):335–352, 2006.
[68] Eddy Caron. Contribution to the management of large scale platforms: the Diet
experience. PhD thesis, Ecole normale superieure de lyon-ENS LYON, 2010.
[69] Florentin Clouet, Simon Delamare, Jean-Patrick Gelas, Laurent Lefevre, Lucas
Nussbaum, Clement Parisot, Laurent Pouilloux, and Francois Rossigneux. A
unified monitoring framework for energy consumption and network traffic. In
TRIDENTCOM-International Conference on Testbeds and Research Infrastructures
for the Development of Networks & Communities, page 10, 2015.
[70] Marcos Dias De Assuncao, A-C Orgerie, and Laurent Lefevre. An analysis of power
consumption logs from a monitored grid site. In Green Computing and Communi-
cations (GreenCom), 2010 IEEE/ACM Int’l Conference on & Int’l Conference on
Cyber, Physical and Social Computing (CPSCom), pages 61–68. IEEE, 2010.
[71] Marcos Dias De Assuncao et al. The green grid’5000: Instrumenting and using
a grid with energy sensors. In Remote Instrumentation for eScience and Related
Aspects, pages 25–42. Springer, 2012.
[72] El-Ghazali Talbi. Metaheuristics: from design to implementation, volume 74. John
Wiley & Sons, 2009.
[73] J David Schaffer. Multiple objective optimization with vector evaluated genetic
algorithms. In Proceedings of the 1st International Conference on Genetic Algo-
rithms, Pittsburgh, PA, USA, July 1985, pages 93–100, 1985.
[74] E Zitzler, M Laumanns, and L Thiele. Spea2: Improved the performance of the
strength pareto evolutionary algorithm. Technical report, Technical Report 103,
Computer Engineering and Communication Networks Lac (TIK), Swiss Federal
institute of Technology (ETH) Zurich, 2001.
139

[75] Kalyanmoy Deb, Amrit Pratap, Sameer Agarwal, and TAMT Meyarivan. A fast
and elitist multiobjective genetic algorithm: Nsga-ii. Evolutionary Computation,
IEEE Transactions on, 6(2):182–197, 2002.
[76] John H Holland. Adaptation in natural and artificial systems: an introductory
analysis with applications to biology, control, and artificial intelligence. U Michigan
Press, 1975.
[77] Rainer Storn and Kenneth Price. Differential evolution: a simple and efficient
heuristic for global optimization over continuous spaces. Journal of global opti-
mization, 11(4):341–359, 1997.
[78] Arya K Bhattacharya, Debjani Aditya, and Debjani Sambasivam. Estimation of
operating blast furnace reactor invisible interior surface using differential evolution.
Applied Soft Computing, 13(5):2767–2789, 2013.
[79] Arya K Bhattacharya, S Debjani, Abhik Roychowdhury, and Jadav Das. Opti-
mization of continuous casting mould oscillation parameters in steel manufacturing
process using genetic algorithms. In 2007 IEEE Congress on Evolutionary Compu-
tation, pages 3998–4004. IEEE, 2007.
[80] Arya K Bhattacharya and Debjani Sambasivam. Optimization of oscillation pa-
rameters in continuous casting process of steel manufacturing: Genetic Algorithms
versus Differential Evolution. INTECH Open Access Publisher, 2009.
[81] Jouni Lampinen. Differential evolution- new naturally parallel approach for engi-
neering design optimization. Developments in computational mechanics with high
performance computing, pages 217–228, 1999.
[82] Dimitris K Tasoulis, Nicos G Pavlidis, Vassilis P Plagianakos, and Michael N Vra-
hatis. Parallel differential evolution. In Evolutionary Computation, 2004. CEC2004.
Congress on, volume 2, pages 2023–2029. IEEE, 2004.
[83] Wei-Po Lee, Yu-Ting Hsiao, and Wei-Che Hwang. Designing a parallel evolutionary
algorithm for inferring gene networks on the cloud computing environment. BMC
systems biology, 8(1):1, 2014.
[84] Changshou Deng, Xujie Tan, Xiaogang Dong, and Yucheng Tan. A parallel ver-
sion of differential evolution based on resilient distributed datasets model. In Bio-
Inspired Computing-Theories and Applications, pages 84–93. Springer, 2015.
[85] Rainer Storn and Kenneth Price. Differential evolution-a simple and efficient adap-
tive scheme for global optimization over continuous spaces, volume 3. ICSI Berkeley,
1995.
140

[86] Carlos Coello Coello, Gary B Lamont, and David A Van Veldhuizen. Evolutionary
algorithms for solving multi-objective problems. Springer Science & Business Media,
2007.
[87] Swagatam Das and Ponnuthurai Nagaratnam Suganthan. Differential evolution: a
survey of the state-of-the-art. Evolutionary Computation, IEEE Transactions on,
15(1):4–31, 2011.
[88] Leonardo Dagum and Ramesh Menon. Openmp: an industry standard api
for shared-memory programming. IEEE computational science and engineering,
5(1):46–55, 1998.
[89] Susan Moore. Gartner says worldwide cloud infrastructure-as-a-service spending to
grow 32.8 percent in 2015, May 2015. [Online; posted 18-May-2015].
[90] Lawrence G. Roberts and Barry D. Wessler. Computer network development to
achieve resource sharing. In Proceedings of the May 5-7, 1970, Spring Joint Com-
puter Conference, AFIPS ’70 (Spring), pages 543–549, New York, NY, USA, 1970.
ACM.
[91] Telecommunication Industry Association. Tia-942 data center standards overview.
White Paper, 2006.
[92] Garth A Gibson and Rodney Van Meter. Network attached storage architecture.
Communications of the ACM, 43(11):37–45, 2000.
[93] David Sacks. Demystifying storage networking das, san, nas, nas gateways, fibre
channel, and iscsi. IBM Storage Networking, pages 3–11, 2001.
[94] Konstantin Shvachko, Hairong Kuang, Sanjay Radia, and Robert Chansler. The
hadoop distributed file system. In Proceedings of the 2010 IEEE 26th Symposium
on Mass Storage Systems and Technologies (MSST), MSST ’10, pages 1–10, Wash-
ington, DC, USA, 2010. IEEE Computer Society.
[95] Sage A. Weil, Scott A. Brandt, Ethan L. Miller, Darrell D. E. Long, and Carlos
Maltzahn. Ceph: A scalable, high-performance distributed file system. In In Pro-
ceedings of the 7th Symposium on Operating Systems Design and Implementation
(OSDI, pages 307–320, 2006.
[96] Kazutaka Morita. Sheepdog: Distributed storage system for qemu/kvm. LCA 2010
DS&R miniconf, 2010.
[97] J. Satran, K. Meth, C. Sapuntzakis, M. Chadalapaka, and E. Zeidner. Internet
small computer systems interface (iscsi), 2004.
141

[98] Eddy Caron, Lamiel Toch, and Jonathan Rouzaud-Cornabas. Comparison on Open-
Stack and OpenNebula performance to improve multi-Cloud architecture on cos-
mological simulation use case. Research Report RR-8421, INRIA, December 2013.
[99] Wolfgang Barth. Nagios: System and network monitoring. No Starch Press, 2008.
[100] Christian Belady, Andy Rawson, John Pfleuger, and Tahir Cader. Green grid data
center power efficiency metrics: PUE and DCIE. Technical Report White Paper 6,
The Green Grid, 2008.
[101] Louis Columbus. Roundup of cloud computing forecasts and market estimates,
2016. Forbes Magazine, 2016.
[102] David Meisner, Brian T. Gold, and Thomas F. Wenisch. Powernap: Eliminating
server idle power. In Proceedings of the 14th International Conference on Architec-
tural Support for Programming Languages and Operating Systems, ASPLOS XIV,
pages 205–216, New York, NY, USA, 2009. ACM.
[103] Kent Beck, Mike Beedle, Arie Van Bennekum, Alistair Cockburn, Ward Cunning-
ham, Martin Fowler, James Grenning, Jim Highsmith, Andrew Hunt, Ron Jeffries,
et al. Manifesto for agile software development. 2001.
[104] Red Hat. libvirt: The virtualization api. , http://libvirt. org, 2012.
[105] Anastasia Ailamaki, Verena Kantere, and Debabrata Dash. Managing scientific
data. Communications of the ACM, 53(6):68–78, 2010.
[106] Martin L Kersten, Stratos Idreos, Stefan Manegold, Erietta Liarou, et al. The
researcher’s guide to the data deluge: Querying a scientific database in just a few
seconds. PVLDB Challenges and Visions, 3, 2011.
[107] Arnab Nandi and HV Jagadish. Guided interaction: Rethinking the query-result
paradigm. Proceedings of the VLDB Endowment, 4(12):1466–1469, 2011.
[108] Michael Stonebraker, Jacek Becla, David J DeWitt, Kian-Tat Lim, David Maier,
Oliver Ratzesberger, and Stanley B Zdonik. Requirements for science data bases
and scidb. In CIDR, volume 7, pages 173–184, 2009.
[109] Ioannis Alagiannis, Renata Borovica, Miguel Branco, Stratos Idreos, and Anastasia
Ailamaki. Nodb: efficient query execution on raw data files. In Proceedings of the
2012 ACM SIGMOD International Conference on Management of Data, pages 241–
252. ACM, 2012.
142

[110] Stratos Idreos, Ioannis Alagiannis, Ryan Johnson, and Anastasia Ailamaki. Here
are my data files. here are my queries. where are my results? In Proceedings of 5th
Biennial Conference on Innovative Data Systems Research, number EPFL-CONF-
161489, 2011.
[111] Azza Abouzied, Daniel J Abadi, and Avi Silberschatz. Invisible loading: access-
driven data transfer from raw files into database systems. In Proceedings of the 16th
International Conference on Extending Database Technology, pages 1–10. ACM,
2013.
[112] Edward Wustenhoff and Sun BluePrints. Service level agreement in the data center.
Sun Microsystems Professional Series, 2, 2002.
[113] Balaji Viswanathan, Akshat Verma, and Sourav Dutta. Cloudmap: workload-aware
placement in private heterogeneous clouds. In 2012 IEEE Network Operations and
Management Symposium, pages 9–16. IEEE, 2012.
[114] Eugen Feller, Louis Rilling, and Christine Morin. Energy-aware ant colony based
workload placement in clouds. In Proceedings of the 2011 IEEE/ACM 12th In-
ternational Conference on Grid Computing, pages 26–33. IEEE Computer Society,
2011.
[115] Ming Chen, Hui Zhang, Ya-Yunn Su, Xiaorui Wang, Guofei Jiang, and Kenji Yoshi-
hira. Effective vm sizing in virtualized data centers. In 12th IFIP/IEEE Interna-
tional Symposium on Integrated Network Management (IM 2011) and Workshops,
pages 594–601. IEEE, 2011.
[116] Xiaoqiao Meng, Canturk Isci, Jeffrey Kephart, Li Zhang, Eric Bouillet, and Dim-
itrios Pendarakis. Efficient resource provisioning in compute clouds via vm multi-
plexing. In Proceedings of the 7th international conference on Autonomic computing,
pages 11–20. ACM, 2010.
[117] Mike Loukides. What is DevOps? ” O’Reilly Media, Inc.”, 2012.
[118] Soon K Bang, Sam Chung, Young Choh, and Marc Dupuis. A grounded theory
analysis of modern web applications: knowledge, skills, and abilities for devops. In
Proceedings of the 2nd annual conference on Research in information technology,
pages 61–62. ACM, 2013.
[119] Michael Httermann. DevOps for developers. Apress, 2012.
[120] Rajkumar Buyya and Kris Bubendorfer. Market-oriented grid and utility comput-
ing. Wiley Online Library, 2010.
143

Tables
2.1 Component peak power breakdown for a typical server . . . . . . . . . . 21
2.2 Major Cloud providers with location of their infrastructure. . . . . . . . . 25
3.1 Example of GreenPerf computation with a request-based service executed
by 5 servers . . . . . . . . . . . . . . . . . . . . . . . . . . . . . . . . . . 29
3.2 Explanation of the standard estimation tags used by the DIET Plug-in
scheduler engine. . . . . . . . . . . . . . . . . . . . . . . . . . . . . . . . 34
3.3 Explanation of the customized estimation tags added to the DIET Plug-in
scheduler engine. . . . . . . . . . . . . . . . . . . . . . . . . . . . . . . . 35
3.4 Tools used on Grid’5000. The tools designated with (*) are platform-
independent tools . . . . . . . . . . . . . . . . . . . . . . . . . . . . . . 38
3.5 Experimental Infrastructure for the evaluation of GreenPerf (simulations) 40
3.6 Energy consumption of simulated clusters for evaluation of GreenPerf in a
highly heterogeneous environment . . . . . . . . . . . . . . . . . . . . . . 41
3.7 Experimental Infrastructure for the evaluation of GreenPerf (real-life de-
ployments). . . . . . . . . . . . . . . . . . . . . . . . . . . . . . . . . . . 42
3.8 Experimental Results of POWER, PERFORMANCE and RANDOM schedul-
ing policies . . . . . . . . . . . . . . . . . . . . . . . . . . . . . . . . . . . 45
4.1 Information available for the scheduler related to each task . . . . . . . . 55
4.2 Experimental Infrastructure using 113 nodes with energy monitoring ca-
pabilities on four different geographical sites from the Grid’5000 platform 61
4.3 Evaluation of the parallel variant of the framework on 1-core and 4-core
hardware. Time is expressed in minutes, Energy in kJ . . . . . . . . . . . 62
4.4 Energy consumption comparison between NSDE-2 variants and the First
Fit algorithms . . . . . . . . . . . . . . . . . . . . . . . . . . . . . . . . . 68
4.5 Makespan comparison between NSDE-2 variants and the First Fit algorithms 68
4.6 Comparative improvements using NSDE-2 in makespan and energy . . . 68
5.1 Partners involved in the Nu@ge project . . . . . . . . . . . . . . . . . . . 75
5.2 Characteristics and availability of the TIA-942 Tier system . . . . . . . . 80
144

5.3 PUE comparison of different datacenters. Those values are given by each
project but no independent evaluation was done. . . . . . . . . . . . . . . 89
5.4 Experimental Infrastructure. . . . . . . . . . . . . . . . . . . . . . . . . . 90
6.1 Practice adoption among companies . . . . . . . . . . . . . . . . . . . . . 98
6.2 Practitioners activities and main concerns . . . . . . . . . . . . . . . . . 99
6.3 Description of nuvea-drivers implemented . . . . . . . . . . . . . . . . . . 109
6.4 Benchmarking of the storage module when using the MongoDB (mongo storage
mode) . . . . . . . . . . . . . . . . . . . . . . . . . . . . . . . . . . . . . 114
6.5 Evaluation of performance between storage modes . . . . . . . . . . . . . 114
6.6 Libraries used for the development of the webboard . . . . . . . . . . . . 121
145

Figures
1 Une schematisation de l’utilisation des serveurs et la visualisation des
operations d’optimisation. . . . . . . . . . . . . . . . . . . . . . . . . . . xvi
2 Proposition de valeur ajoutee . . . . . . . . . . . . . . . . . . . . . . . . xvii
3 Thesis organisation . . . . . . . . . . . . . . . . . . . . . . . . . . . . . . xviii
1.1 User vision of a Cloud platform . . . . . . . . . . . . . . . . . . . . . . . 4
1.2 A schematization of servers load and visualization of optimization opera-
tions . . . . . . . . . . . . . . . . . . . . . . . . . . . . . . . . . . . . . . 5
1.3 Perspectives on the creation of a cloud product following Kaplan’s method 7
1.4 Value proposition . . . . . . . . . . . . . . . . . . . . . . . . . . . . . . . 7
1.5 Thesis organisation . . . . . . . . . . . . . . . . . . . . . . . . . . . . . . 10
2.1 Visualization of the PUE and DCIE metrics . . . . . . . . . . . . . . . . 17
3.1 Preference of User as the choice between two modes of preference: energy
efficiency and performance. The absence of choice leaves it to a neutral
mode, without any preference. . . . . . . . . . . . . . . . . . . . . . . . . 31
3.2 A diet hierarchy. . . . . . . . . . . . . . . . . . . . . . . . . . . . . . . . 33
3.3 Grid’5000 . . . . . . . . . . . . . . . . . . . . . . . . . . . . . . . . . . 38
3.4 Comparison of metrics with 2 different types of servers and 2 clients sub-
mitting requests. . . . . . . . . . . . . . . . . . . . . . . . . . . . . . . . 40
3.5 Comparison of metrics with 4 different types of servers and 2 clients sub-
mitting requests. . . . . . . . . . . . . . . . . . . . . . . . . . . . . . . . 41
3.6 Tasks distribution using power consumption as placement criterion. . . . 43
3.7 Tasks distribution using performance as placement criterion. . . . . . . . 43
3.8 Tasks distribution with random placement. . . . . . . . . . . . . . . . . . 44
3.9 Cumulated energy consumption per cluster under POWER, PERFOR-
MANCE and RANDOM scheduling policies. . . . . . . . . . . . . . . . . 44
4.1 A visualisation of the GreenPerf evaluation as a conceptual Pareto opti-
mization where completion time and energy consumption represent objec-
tives to be minimized. . . . . . . . . . . . . . . . . . . . . . . . . . . . . 48
146

4.2 Generic flow of operations in a genetic algortihm. . . . . . . . . . . . . . 49
4.3 Optimisation and workflow execution sequence of DIET and NSDE-2 . . 58
4.4 Speedup analysis of NSDE-2 on two different size of jobs sets . . . . . . . 63
4.5 Pareto fronts and quality of the solutions generated by NSDE-2 as the
number of generations increases. Each dot represents a solution of placement 63
4.6 NSDE-2 execution time for generating mapping solutions related to 4
datasets and 111 servers . . . . . . . . . . . . . . . . . . . . . . . . . . . 64
4.7 Energy and Makespan comparison for 100 jobs and 111 servers . . . . . . 65
4.8 Energy and Makespan comparison for 200 jobs and 111 servers . . . . . . 66
4.9 Energy and Makespan comparison for 500 jobs and 111 servers . . . . . . 66
4.10 Energy and Makespan comparison for 1000 jobs and 111 servers . . . . . 67
5.1 Federation scheduling using DIET Cloud . . . . . . . . . . . . . . . . . . 83
5.2 Nation-wide deployment over four locations in France . . . . . . . . . . 84
5.3 The public presentation of the StarDC container occured on September
18th 2014 during Nu@ge inauguration in CELESTE headquarters, Marne-
la-vallee, France. . . . . . . . . . . . . . . . . . . . . . . . . . . . . . . . 85
5.4 Nu@ge architecture including gateways and a IaaS . . . . . . . . . . . . . 86
5.5 Web Interface for the visualisation and management of datacenters . . . 88
5.6 Sample of the server status describing the XML structure. . . . . . . . . 91
5.7 Evolution of candidate nodes and power consumption through context and
energy related events. . . . . . . . . . . . . . . . . . . . . . . . . . . . . . 92
6.1 Iterative organization of the Nuvea project . . . . . . . . . . . . . . . . . 104
6.2 Nuvea modules . . . . . . . . . . . . . . . . . . . . . . . . . . . . . . . . 106
6.3 Use case diagram of the Reporting engine based on user profile . . . . . . 109
6.4 Comparison of Nuvea bandwidth requirements to typical bandwidth ca-
pacities. Values are expressed in Mbps . . . . . . . . . . . . . . . . . . . 112
6.5 Structure of the measurement collection in the mongo database . . . . . 113
6.6 Workflow of a token production . . . . . . . . . . . . . . . . . . . . . . . 115
6.7 Workflow of a trace log replay . . . . . . . . . . . . . . . . . . . . . . . . 116
6.8 Representation of replay collection in the database . . . . . . . . . . . . . 117
6.9 Nuvea’s dashboard summary . . . . . . . . . . . . . . . . . . . . . . . . . 121
6.10 Creation of a new administrator account with target endpoints for message
exchange and certificate for bus authentication . . . . . . . . . . . . . . . 122
6.11 Nuvea’s replay screen with selection of algorithm to evaluate and statistics
of previous executions . . . . . . . . . . . . . . . . . . . . . . . . . . . . 123
147

6.12 Screen of Nuvea replay before an optimization decision. Each line repre-
sents a different physical machine. Grey slots represents available resource.
Green slots represents active virtual machine. Before optimization, the vir-
tual machines are scattered with a large number of active resources. . . 124
6.13 Screen of Nuvea replay after an optimization decision. Each line repre-
sents a different physical machine. Grey slots represents available resource.
Green slots represents active virtual machine. After optimization, the vir-
tual machines are packed on a reduced amount of resources. . . . . . . . 125
6.14 Nuvea ecosystem . . . . . . . . . . . . . . . . . . . . . . . . . . . . . . . 128
148
Copyright © 2022 FDOKUMEN