DIANA Scheduling Hierarchies for Optimizing Bulk Job Scheduling
Upload
khangminh22Category
view
0download
0
7/14/2010
1
Operations SchedulingOperations SchedulingJ
J – 1Copyright © 2010 Pearson Education, Inc. Publishing as Prentice Hall.
For For Operations Management, 9eOperations Management, 9e by by Krajewski/Ritzman/Malhotra Krajewski/Ritzman/Malhotra © 2010 Pearson Education© 2010 Pearson Education
PowerPoint Slides PowerPoint Slides by Jeff Heylby Jeff Heyl
The scheduling techniques cut across the various process types found in services
Scheduling Service and Scheduling Service and Manufacturing Processes Manufacturing Processes
various process types found in services and manufacturing
Front-office process with high customer contact, divergent work flows, customization, and a complex scheduling environmentBack-office process has low customer involvement uses more line work flows and
J – 2Copyright © 2010 Pearson Education, Inc. Publishing as Prentice Hall.
involvement, uses more line work flows, and provides standardized services
7/14/2010
2
Performance MeasuresPerformance Measures
Flow time is the amount of time a job spends in the service or manufacturing
tsystemPast due (tardiness) is the amount of time by which a job missed its due dateMakespan is the total amount of time required to complete a group of jobs
J – 3Copyright © 2010 Pearson Education, Inc. Publishing as Prentice Hall.
Makespan = Time of completion of last job – Starting time
of first job
Performance MeasuresPerformance Measures
Total inventory is used to measure the effectiveness of schedules for
f t imanufacturing processes.
Total Inventory = Scheduled receipts
for all items + On-hand inventories of all items
Utilization is the percentage of work time
J – 4Copyright © 2010 Pearson Education, Inc. Publishing as Prentice Hall.
that is productively spent by an employee or a machine
7/14/2010
3
Sequencing JobsSequencing Jobs
Operations schedules are short-term plans designed to implement the sales and operations planoperations planAn operation with divergent flows is often called a job shop
Low-to medium-volume productionUtilizes job or batch processesThe front office would be the equivalent for a
J – 5Copyright © 2010 Pearson Education, Inc. Publishing as Prentice Hall.
qservice providerDifficult to schedule because of the variability in job routings and the continual introduction of new jobs to be processed
Sequencing JobsSequencing Jobs
An operation with line flow is often called a flow shop
Medium- to high-volume productionUtilizes line or continuous flow processesThe back office would be the equivalent for a service provider Tasks are easier to schedule because the jobs have a common flow pattern through the
J – 6Copyright © 2010 Pearson Education, Inc. Publishing as Prentice Hall.
have a common flow pattern through the system
7/14/2010
4
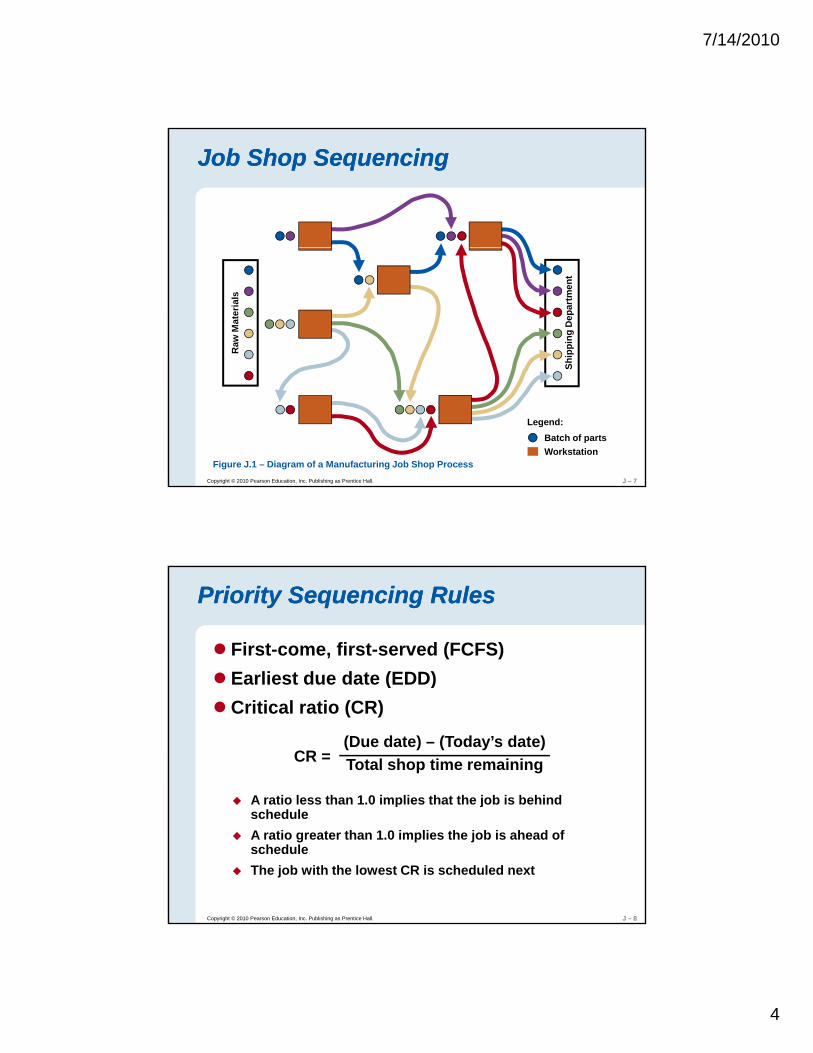
Job Shop SequencingJob Shop Sequencing
Ship
ping
Dep
artm
ent
Raw
Mat
eria
ls
J – 7Copyright © 2010 Pearson Education, Inc. Publishing as Prentice Hall.
S
Legend:Batch of partsWorkstation
Figure J.1 – Diagram of a Manufacturing Job Shop Process
First-come, first-served (FCFS) Earliest due date (EDD)
Priority Sequencing RulesPriority Sequencing Rules
( )Critical ratio (CR)
A ratio less than 1.0 implies that the job is behind
CR =(Due date) – (Today’s date)Total shop time remaining
J – 8Copyright © 2010 Pearson Education, Inc. Publishing as Prentice Hall.
p jscheduleA ratio greater than 1.0 implies the job is ahead of scheduleThe job with the lowest CR is scheduled next
7/14/2010
5
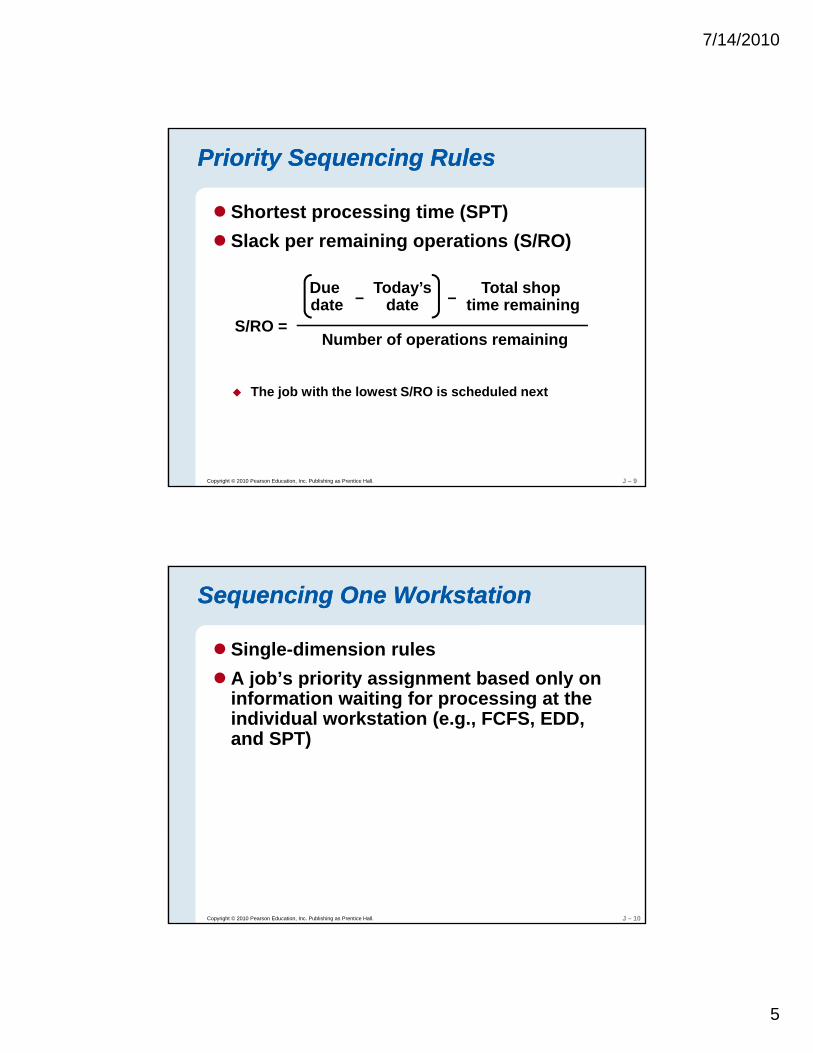
Shortest processing time (SPT)Slack per remaining operations (S/RO)
Priority Sequencing RulesPriority Sequencing Rules
p g p ( )
S/RO =
Duedate
Today’sdate
Total shop time remaining– –
Number of operations remaining
J – 9Copyright © 2010 Pearson Education, Inc. Publishing as Prentice Hall.
The job with the lowest S/RO is scheduled next
Single-dimension rulesA job’s priority assignment based only on
Sequencing One WorkstationSequencing One Workstation
j p y g yinformation waiting for processing at the individual workstation (e.g., FCFS, EDD, and SPT)
J – 10Copyright © 2010 Pearson Education, Inc. Publishing as Prentice Hall.
7/14/2010
6
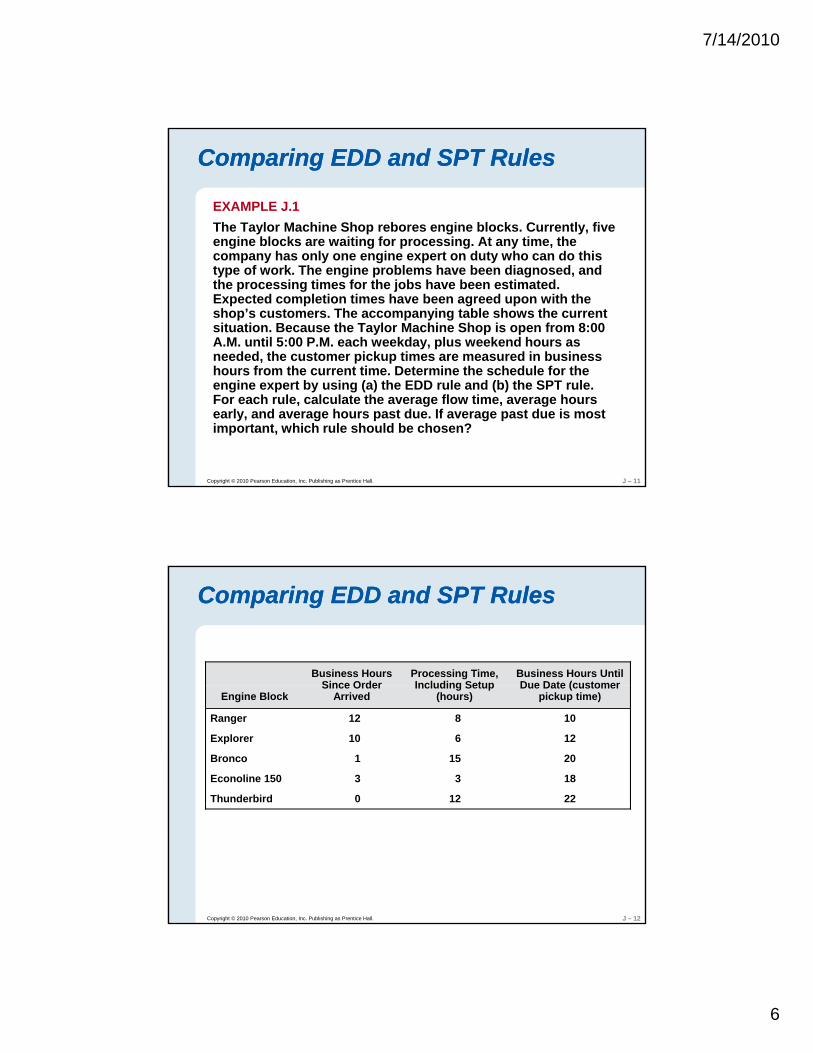
Comparing EDD and SPT RulesComparing EDD and SPT Rules
EXAMPLE J.1The Taylor Machine Shop rebores engine blocks. Currently, five engine blocks are waiting for processing. At any time, the g g p g y ,company has only one engine expert on duty who can do this type of work. The engine problems have been diagnosed, and the processing times for the jobs have been estimated. Expected completion times have been agreed upon with the shop’s customers. The accompanying table shows the current situation. Because the Taylor Machine Shop is open from 8:00 A.M. until 5:00 P.M. each weekday, plus weekend hours as needed, the customer pickup times are measured in business h f th t ti D t i th h d l f th
J – 11Copyright © 2010 Pearson Education, Inc. Publishing as Prentice Hall.
hours from the current time. Determine the schedule for the engine expert by using (a) the EDD rule and (b) the SPT rule. For each rule, calculate the average flow time, average hours early, and average hours past due. If average past due is most important, which rule should be chosen?
Comparing EDD and SPT RulesComparing EDD and SPT Rules
Business Hours Since Order
Processing Time, Including Setup
Business Hours Until Due Date (customer
Engine BlockSince Order
ArrivedIncluding Setup
(hours)Due Date (customer
pickup time)
Ranger 12 8 10
Explorer 10 6 12
Bronco 1 15 20
Econoline 150 3 3 18
Thunderbird 0 12 22
J – 12Copyright © 2010 Pearson Education, Inc. Publishing as Prentice Hall.
7/14/2010
7
Comparing EDD and SPT RulesComparing EDD and SPT Rules
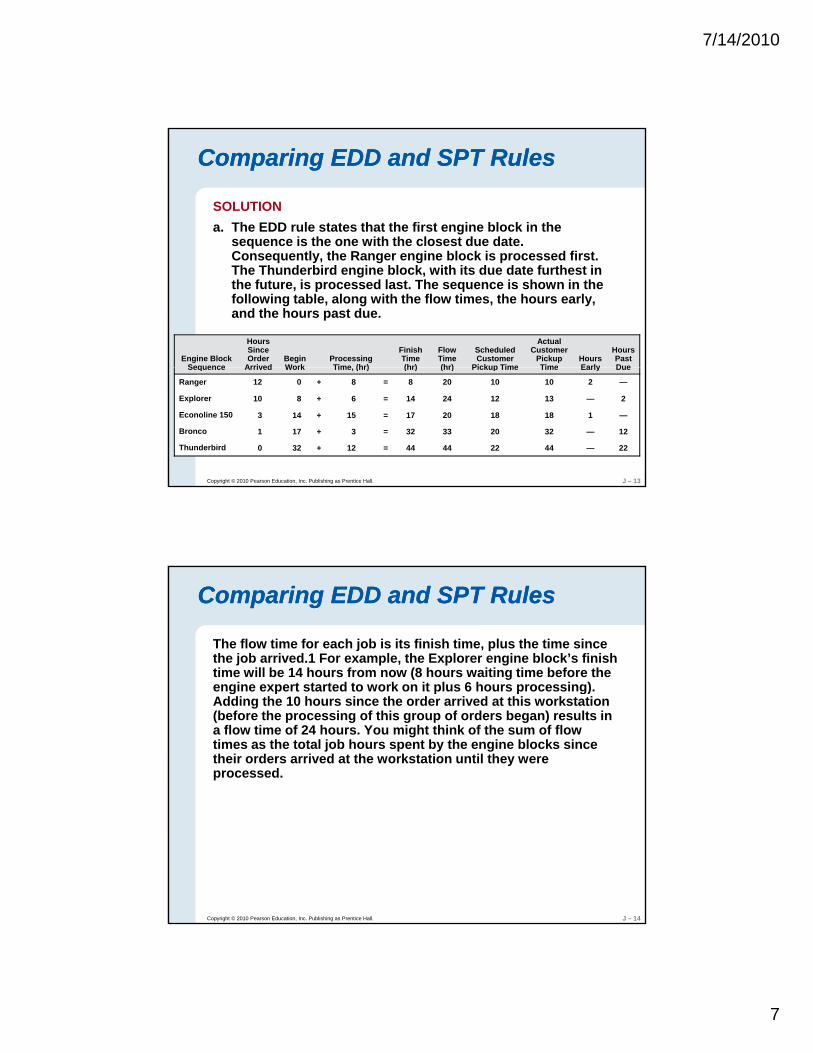
SOLUTIONa. The EDD rule states that the first engine block in the
sequence is the one with the closest due date.
Engine Block Sequence
Hours Since Order
ArrivedBegin Work
Processing Time (hr)
Finish Time (hr)
Flow Time (hr)
Scheduled Customer
Pickup Time
Actual Customer
Pickup Time
Hours Early
Hours Past Due
qConsequently, the Ranger engine block is processed first. The Thunderbird engine block, with its due date furthest in the future, is processed last. The sequence is shown in the following table, along with the flow times, the hours early, and the hours past due.
J – 13Copyright © 2010 Pearson Education, Inc. Publishing as Prentice Hall.
Sequence Arrived Work Time, (hr) (hr) (hr) Pickup Time Time Early Due
Ranger
Explorer
Econoline 150
Bronco
Thunderbird
12 0 + 8 = 8 20 10 10 2 —
10 8 + 6 = 14 24 12 13 — 2
3 14 + 15 = 17 20 18 18 1 —
1 17 + 3 = 32 33 20 32 — 12
0 32 + 12 = 44 44 22 44 — 22
Comparing EDD and SPT RulesComparing EDD and SPT Rules
The flow time for each job is its finish time, plus the time since the job arrived.1 For example, the Explorer engine block’s finish time will be 14 hours from now (8 hours waiting time before the engine expert started to work on it plus 6 hours processing)engine expert started to work on it plus 6 hours processing). Adding the 10 hours since the order arrived at this workstation (before the processing of this group of orders began) results in a flow time of 24 hours. You might think of the sum of flow times as the total job hours spent by the engine blocks since their orders arrived at the workstation until they were processed.
J – 14Copyright © 2010 Pearson Education, Inc. Publishing as Prentice Hall.
7/14/2010
8
Comparing EDD and SPT RulesComparing EDD and SPT Rules
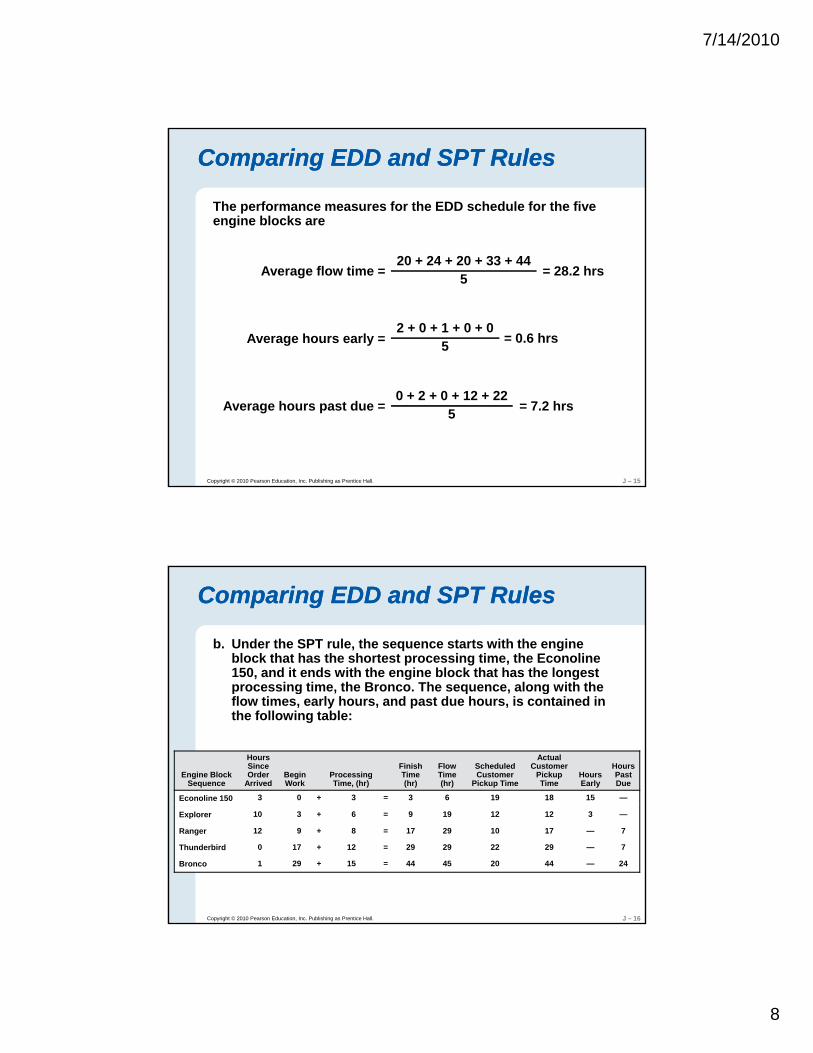
The performance measures for the EDD schedule for the five engine blocks are
Average flow time =
Average hours early =
20 + 24 + 20 + 33 + 445 = 28.2 hrs
2 + 0 + 1 + 0 + 05 = 0.6 hrs
J – 15Copyright © 2010 Pearson Education, Inc. Publishing as Prentice Hall.
Average hours past due =0 + 2 + 0 + 12 + 22
5 = 7.2 hrs
Comparing EDD and SPT RulesComparing EDD and SPT Rules
b. Under the SPT rule, the sequence starts with the engine block that has the shortest processing time, the Econoline 150, and it ends with the engine block that has the longest processing time the Bronco The sequence along with the
Engine Block Sequence
Hours Since Order
ArrivedBegin Work
Processing Time, (hr)
Finish Time (hr)
Flow Time (hr)
Scheduled Customer
Pickup Time
Actual Customer
Pickup Time
Hours Early
Hours Past Due
Econoline 150 3 0 + 3 = 3 6 19 18 15 —
processing time, the Bronco. The sequence, along with the flow times, early hours, and past due hours, is contained in the following table:
J – 16Copyright © 2010 Pearson Education, Inc. Publishing as Prentice Hall.
Explorer
Ranger
Thunderbird
Bronco
10 3 + 6 = 9 19 12 12 3 —
12 9 + 8 = 17 29 10 17 — 7
0 17 + 12 = 29 29 22 29 — 7
1 29 + 15 = 44 45 20 44 — 24
7/14/2010
9
Comparing EDD and SPT RulesComparing EDD and SPT Rules
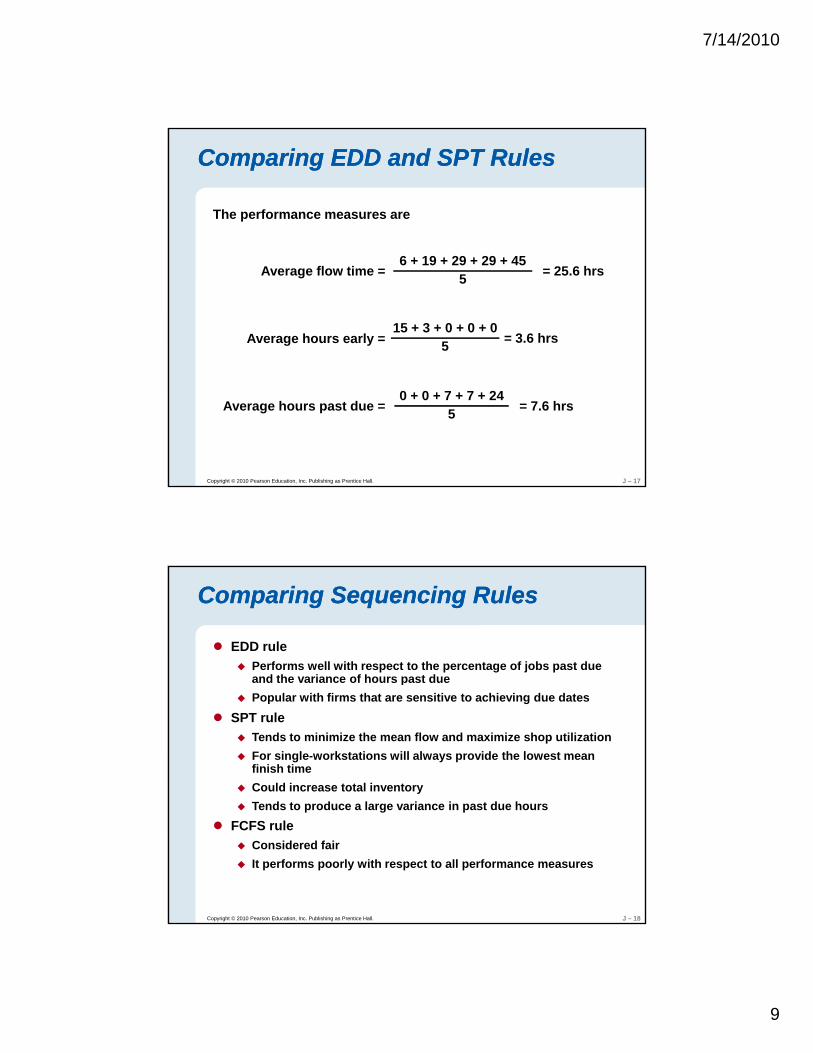
The performance measures are
Average flow time =
Average hours early =
6 + 19 + 29 + 29 + 455 = 25.6 hrs
15 + 3 + 0 + 0 + 05 = 3.6 hrs
J – 17Copyright © 2010 Pearson Education, Inc. Publishing as Prentice Hall.
Average hours past due =0 + 0 + 7 + 7 + 24
5 = 7.6 hrs
Comparing Sequencing RulesComparing Sequencing Rules
EDD rulePerforms well with respect to the percentage of jobs past due and the variance of hours past duepPopular with firms that are sensitive to achieving due dates
SPT rule Tends to minimize the mean flow and maximize shop utilizationFor single-workstations will always provide the lowest mean finish timeCould increase total inventory Tends to produce a large variance in past due hours
J – 18Copyright © 2010 Pearson Education, Inc. Publishing as Prentice Hall.
Tends to produce a large variance in past due hoursFCFS rule
Considered fairIt performs poorly with respect to all performance measures
7/14/2010
10
Application J.1Application J.1
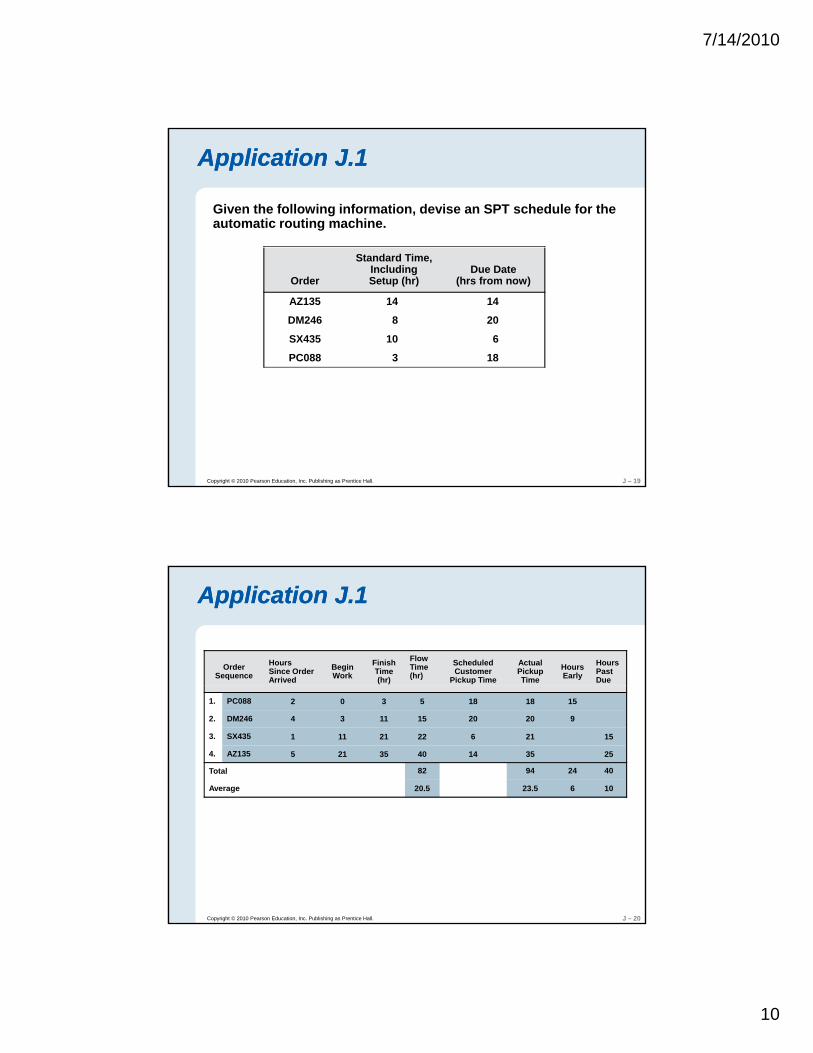
Given the following information, devise an SPT schedule for the automatic routing machine.
Order
Standard Time, Including Setup (hr)
Due Date(hrs from now)
AZ135 14 14
DM246 8 20
SX435 10 6
PC088 3 18
J – 19Copyright © 2010 Pearson Education, Inc. Publishing as Prentice Hall.
Order Sequence
HoursSince Order Arrived
Begin Work
Finish Time (hr)
FlowTime(hr)
Scheduled Customer
Pickup Time
Actual Pickup Time
Hours Early
Hours Past Due
Application J.1Application J.1
1.
2.
3.
4.
Total
Average
PC088
DM246
SX435
AZ135
2 0 3 5 18 18 15
4 3 11 15 20 20 9
1 11 21 22 6 21 15
5 21 35 40 14 35 25
82 94 24 40
20.5 23.5 6 10
J – 20Copyright © 2010 Pearson Education, Inc. Publishing as Prentice Hall.
7/14/2010
11
MultipleMultiple--Dimension RulesDimension Rules
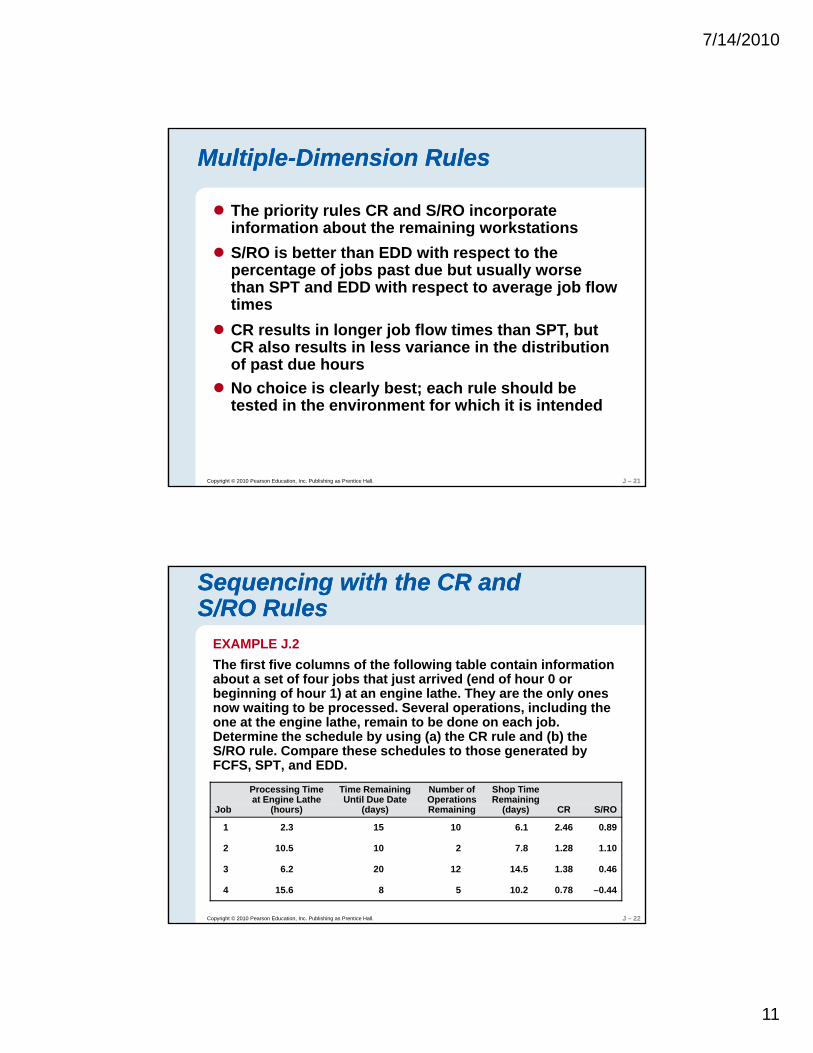
The priority rules CR and S/RO incorporate information about the remaining workstationsS/RO i b tt th EDD ith t t thS/RO is better than EDD with respect to the percentage of jobs past due but usually worse than SPT and EDD with respect to average job flow timesCR results in longer job flow times than SPT, but CR also results in less variance in the distribution of past due hours
J – 21Copyright © 2010 Pearson Education, Inc. Publishing as Prentice Hall.
of past due hoursNo choice is clearly best; each rule should be tested in the environment for which it is intended
Sequencing with the CR and Sequencing with the CR and S/RO RulesS/RO Rules
EXAMPLE J.2The first five columns of the following table contain information about a set of four jobs that just arrived (end of hour 0 or j j (beginning of hour 1) at an engine lathe. They are the only ones now waiting to be processed. Several operations, including the one at the engine lathe, remain to be done on each job. Determine the schedule by using (a) the CR rule and (b) the S/RO rule. Compare these schedules to those generated by FCFS, SPT, and EDD.
Processing Time at Engine Lathe
Time Remaining Until Due Date
Number of Operations
Shop Time Remaining
J – 22Copyright © 2010 Pearson Education, Inc. Publishing as Prentice Hall.
Job (hours) (days) Remaining (days) CR S/RO
1 2.3 15 10 6.1 2.46 0.89
2 10.5 10 2 7.8 1.28 1.10
3 6.2 20 12 14.5 1.38 0.46
4 15.6 8 5 10.2 0.78 –0.44
7/14/2010
12
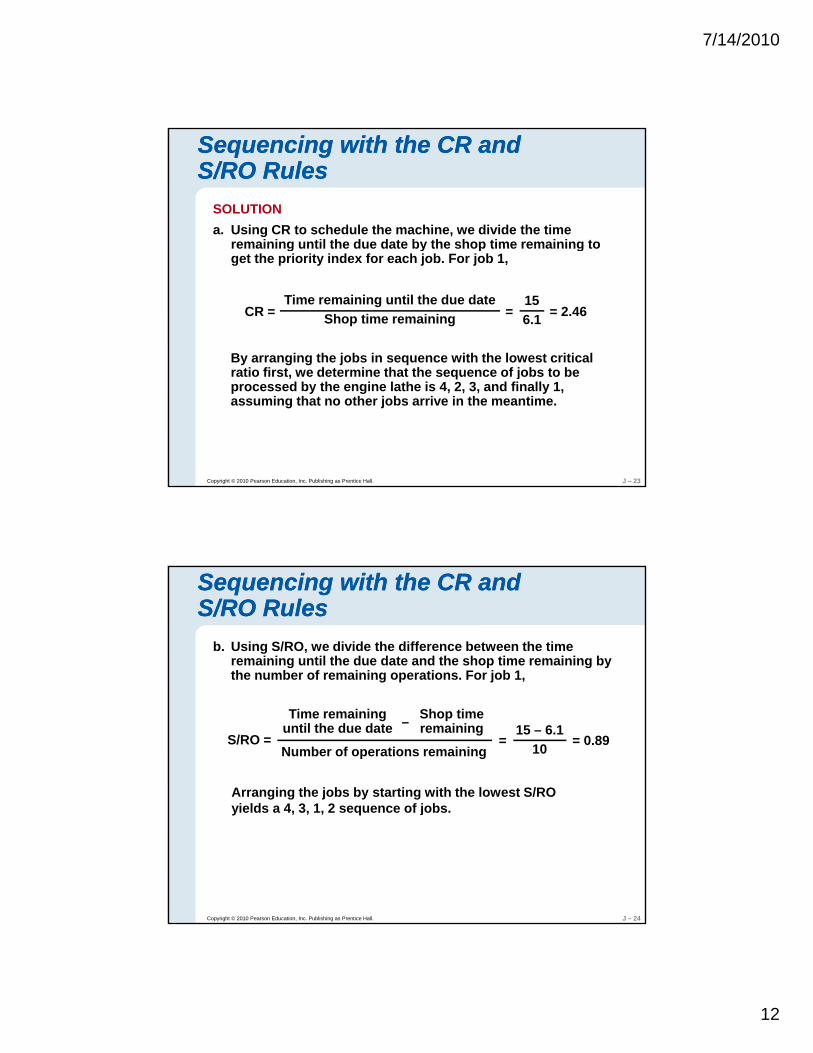
Sequencing with the CR and Sequencing with the CR and S/RO RulesS/RO Rules
SOLUTIONa. Using CR to schedule the machine, we divide the time
remaining until the due date by the shop time remaining toremaining until the due date by the shop time remaining to get the priority index for each job. For job 1,
CR =Time remaining until the due date
Shop time remaining = = 2.46156.1
By arranging the jobs in sequence with the lowest critical i fi d i h h f j b b
J – 23Copyright © 2010 Pearson Education, Inc. Publishing as Prentice Hall.
ratio first, we determine that the sequence of jobs to be processed by the engine lathe is 4, 2, 3, and finally 1, assuming that no other jobs arrive in the meantime.
Sequencing with the CR and Sequencing with the CR and S/RO RulesS/RO Rules
b. Using S/RO, we divide the difference between the time remaining until the due date and the shop time remaining by the number of remaining operations. For job 1,
S/RO =
Time remaininguntil the due date
Shop timeremaining–
Number of operations remaining = = 0.89
15 – 6.110
Arranging the jobs by starting with the lowest S/RO i ld 4 3 1 2 f j b
J – 24Copyright © 2010 Pearson Education, Inc. Publishing as Prentice Hall.
yields a 4, 3, 1, 2 sequence of jobs.

7/14/2010
13
Sequencing with the CR and Sequencing with the CR and S/RO RulesS/RO Rules
Priority Rule Summary
FCFS SPT EDD CR S/RO
Average flow time 17.175 16.100 26.175 27.150 24.025
Average early time 3.425 6.050 0 0 0
Average past due 7.350 8.900 12.925 13.900 10.775
J – 25Copyright © 2010 Pearson Education, Inc. Publishing as Prentice Hall.
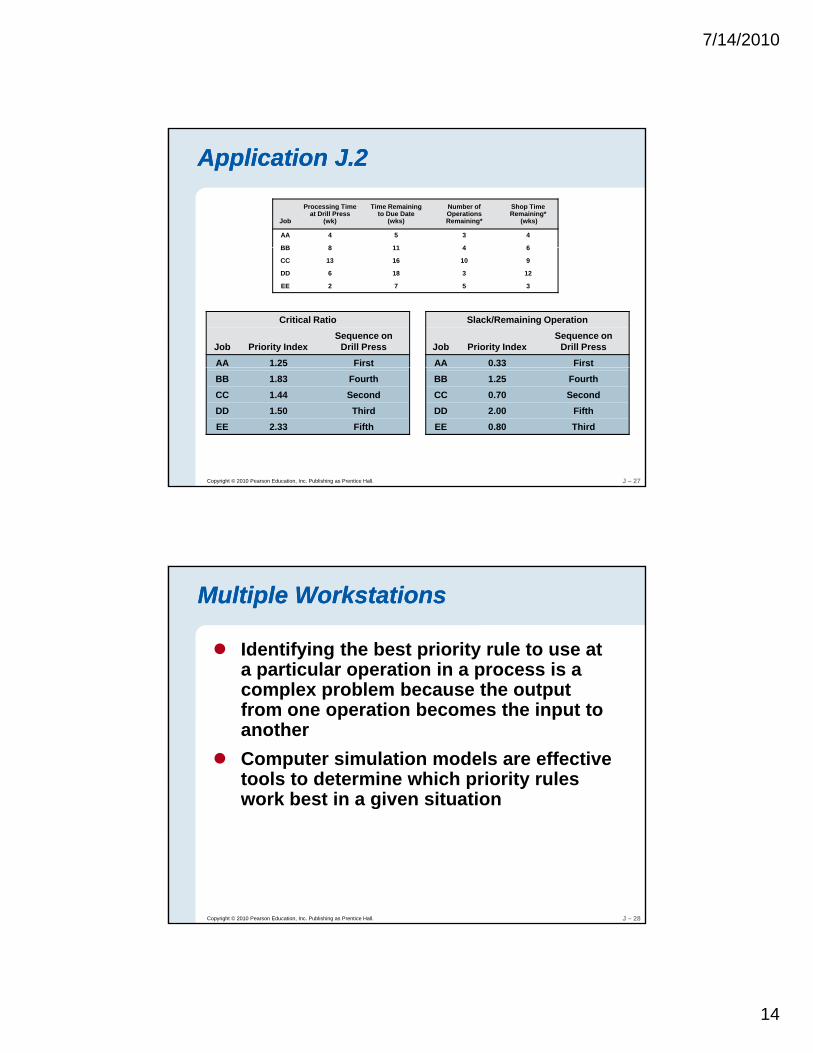
Application J.2Application J.2
The following four jobs have just arrived at an idle drill process and must be scheduled.
Job
Processing Time at Drill Press
(wk)
Time Remaining to Due Date
(wks)
Number of Operations Remaining*
Shop Time Remaining*
(wks)
AA 4 5 3 4
BB 8 11 4 6
CC 13 16 10 9
DD 6 18 3 12
J – 26Copyright © 2010 Pearson Education, Inc. Publishing as Prentice Hall.
EE 2 7 5 3
* including drill press
Create the sequences for two schedules, one using the Critical Ratio rule and one using the S/RO rule.
7/14/2010
14
Application J.2Application J.2
Job
Processing Time at Drill Press
(wk)
Time Remaining to Due Date
(wks)
Number of Operations Remaining*
Shop Time Remaining*
(wks)
AA 4 5 3 4
BB 8 11 4 6
Critical Ratio Slack/Remaining Operation
Job Priority IndexSequence on
Drill Press Job Priority IndexSequence on
Drill Press
BB 8 11 4 6
CC 13 16 10 9
DD 6 18 3 12
EE 2 7 5 3
AA 1.25 First AA 0.33 First
J – 27Copyright © 2010 Pearson Education, Inc. Publishing as Prentice Hall.
BBCCDDEE
1.831.441.502.33
FourthSecondThirdFifth
BBCCDDEE
1.250.702.000.80
FourthSecond
FifthThird
Identifying the best priority rule to use at a particular operation in a process is a
l bl b th t t
Multiple WorkstationsMultiple Workstations
complex problem because the output from one operation becomes the input to anotherComputer simulation models are effective tools to determine which priority rules work best in a given situation
J – 28Copyright © 2010 Pearson Education, Inc. Publishing as Prentice Hall.
work best in a given situation
7/14/2010
15
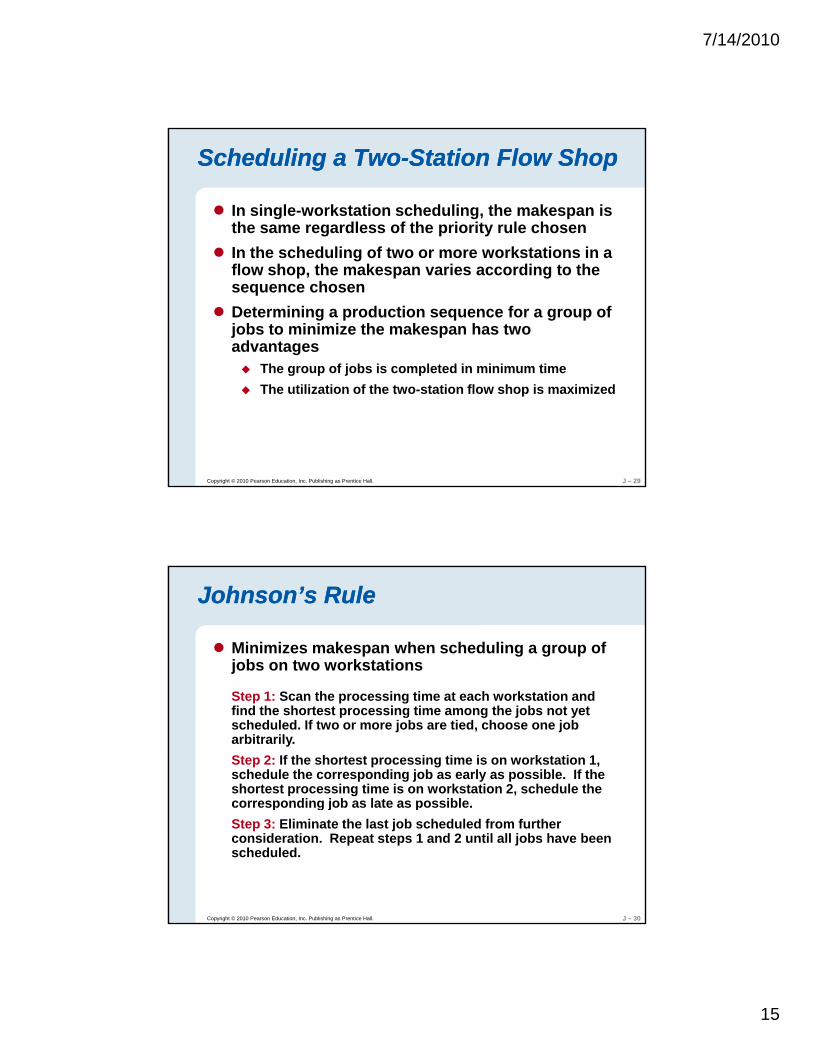
In single-workstation scheduling, the makespan is the same regardless of the priority rule chosenI th h d li f t k t ti i
Scheduling a TwoScheduling a Two--Station Flow ShopStation Flow Shop
In the scheduling of two or more workstations in a flow shop, the makespan varies according to the sequence chosenDetermining a production sequence for a group of jobs to minimize the makespan has two advantages
The group of jobs is completed in minimum time
J – 29Copyright © 2010 Pearson Education, Inc. Publishing as Prentice Hall.
The group of jobs is completed in minimum timeThe utilization of the two-station flow shop is maximized
Johnson’s RuleJohnson’s Rule
Minimizes makespan when scheduling a group of jobs on two workstations
Step 1: Scan the processing time at each workstation and find the shortest processing time among the jobs not yet scheduled. If two or more jobs are tied, choose one job arbitrarily.Step 2: If the shortest processing time is on workstation 1, schedule the corresponding job as early as possible. If the shortest processing time is on workstation 2, schedule the corresponding job as late as possible
J – 30Copyright © 2010 Pearson Education, Inc. Publishing as Prentice Hall.
corresponding job as late as possible.Step 3: Eliminate the last job scheduled from further consideration. Repeat steps 1 and 2 until all jobs have been scheduled.
7/14/2010
16
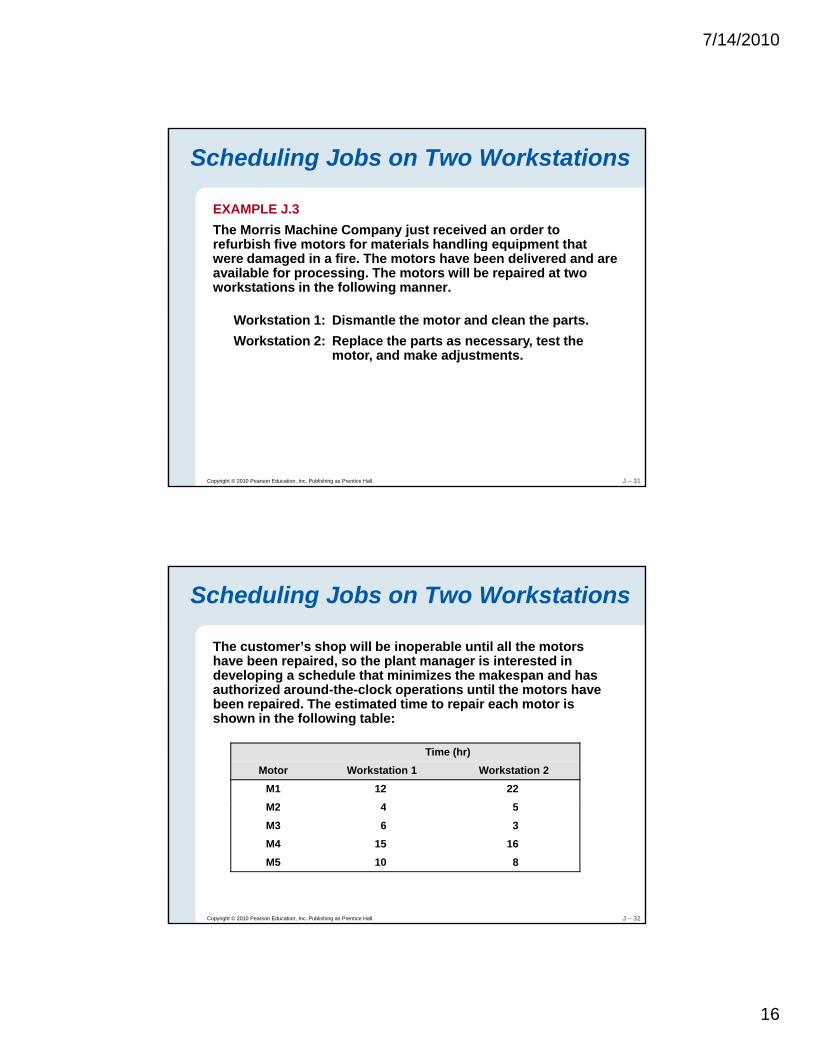
Scheduling Jobs on Two Workstations
EXAMPLE J.3The Morris Machine Company just received an order to refurbish five motors for materials handling equipment thatrefurbish five motors for materials handling equipment that were damaged in a fire. The motors have been delivered and are available for processing. The motors will be repaired at two workstations in the following manner.
Workstation 1: Dismantle the motor and clean the parts.Workstation 2: Replace the parts as necessary, test the
motor, and make adjustments.
J – 31Copyright © 2010 Pearson Education, Inc. Publishing as Prentice Hall.
Scheduling Jobs on Two Workstations
The customer’s shop will be inoperable until all the motors have been repaired, so the plant manager is interested in developing a schedule that minimizes the makespan and has
th i d d th l k ti til th t hauthorized around-the-clock operations until the motors have been repaired. The estimated time to repair each motor is shown in the following table:
Time (hr)Motor Workstation 1 Workstation 2
M1 12 22M2 4 5
J – 32Copyright © 2010 Pearson Education, Inc. Publishing as Prentice Hall.
M2 4 5
M3 6 3M4 15 16M5 10 8
7/14/2010
17
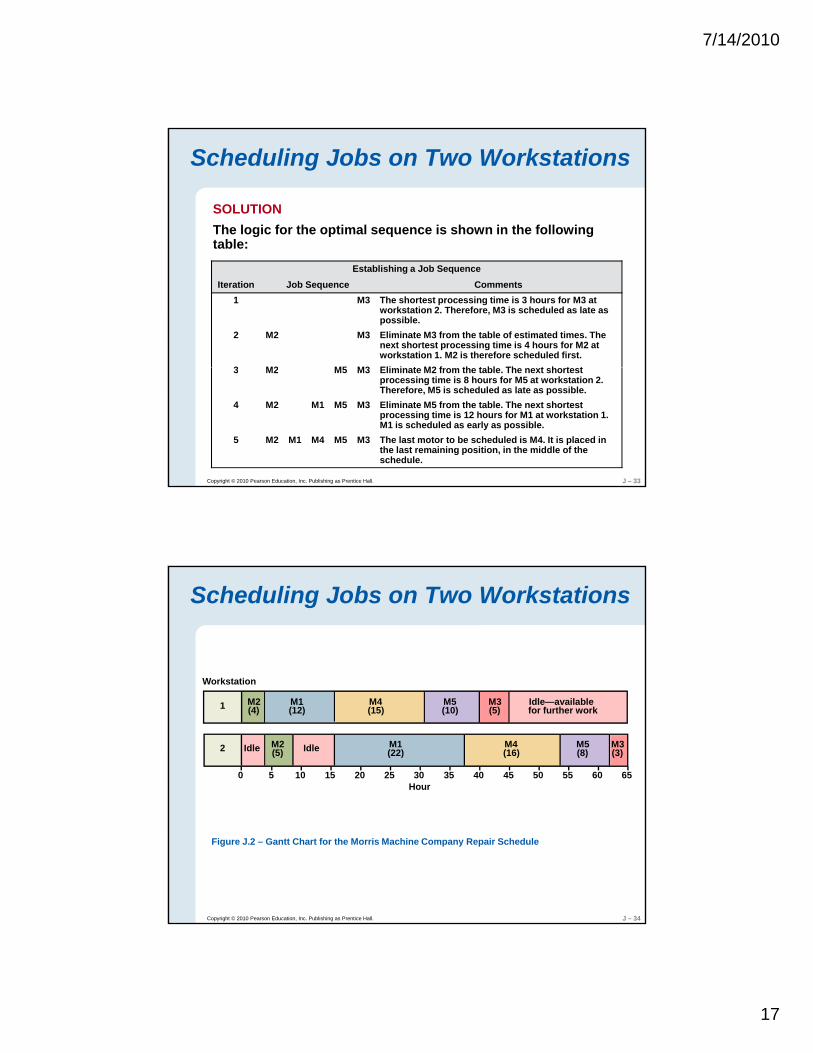
Scheduling Jobs on Two Workstations
SOLUTIONThe logic for the optimal sequence is shown in the following table:table:
Establishing a Job SequenceIteration Job Sequence Comments
1 M3 The shortest processing time is 3 hours for M3 at workstation 2. Therefore, M3 is scheduled as late as possible.
2 M2 M3 Eliminate M3 from the table of estimated times. The next shortest processing time is 4 hours for M2 at workstation 1. M2 is therefore scheduled first.
3 M2 M5 M3 Eli i t M2 f th t bl Th t h t t
J – 33Copyright © 2010 Pearson Education, Inc. Publishing as Prentice Hall.
3 M2 M5 M3 Eliminate M2 from the table. The next shortest processing time is 8 hours for M5 at workstation 2. Therefore, M5 is scheduled as late as possible.
4 M2 M1 M5 M3 Eliminate M5 from the table. The next shortest processing time is 12 hours for M1 at workstation 1. M1 is scheduled as early as possible.
5 M2 M1 M4 M5 M3 The last motor to be scheduled is M4. It is placed in the last remaining position, in the middle of the schedule.
Scheduling Jobs on Two Workstations
Workstation
M2 (4)
M1 (12)
M4 (15)
M5 (10)
M3 (5)
Idle—available for further work
Idle M2 (5)
M1 (22)
M4 (16)
M5 (8)Idle (3)
M3
0 5 10 15 20 25 30Hour
35 40 45 50 55 60 65
1
2
J – 34Copyright © 2010 Pearson Education, Inc. Publishing as Prentice Hall.
Figure J.2 – Gantt Chart for the Morris Machine Company Repair Schedule
7/14/2010
18
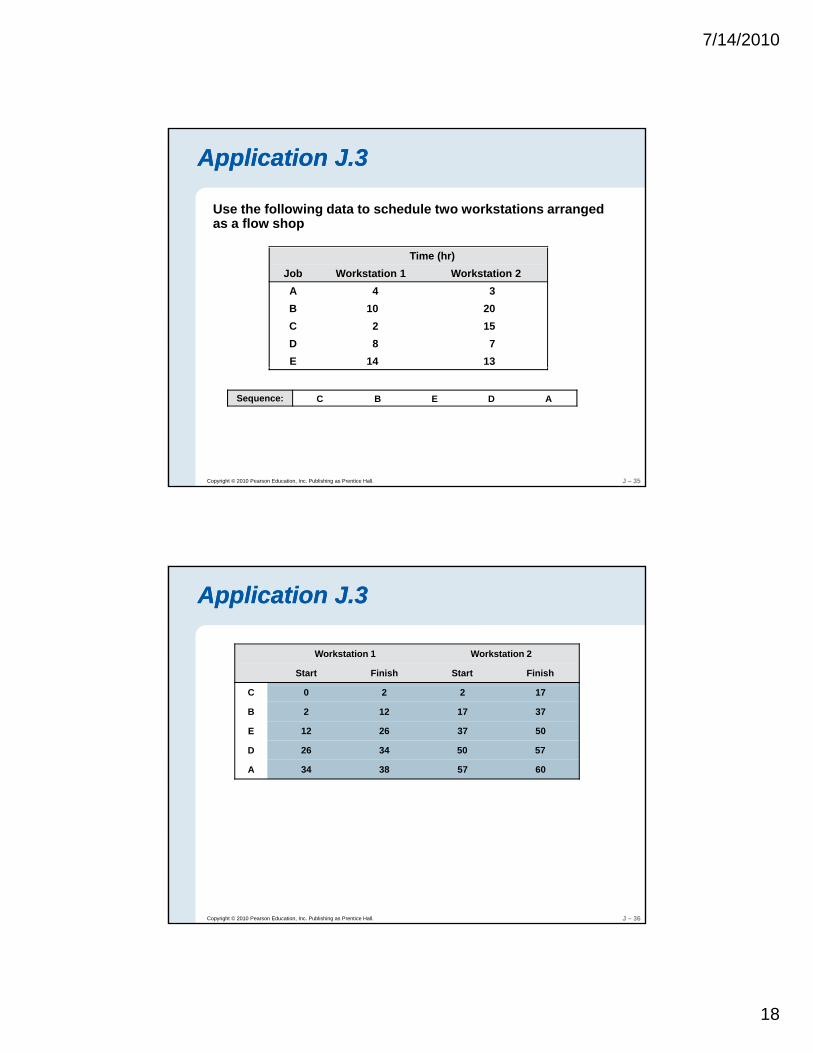
Application J.3Application J.3
Use the following data to schedule two workstations arranged as a flow shop
Time (hr)Job Workstation 1 Workstation 2A 4 3B 10 20C 2 15D 8 7E 14 13
J – 35Copyright © 2010 Pearson Education, Inc. Publishing as Prentice Hall.
Sequence: C B E D A
Application J.3Application J.3
Workstation 1 Workstation 2
Start Finish Start Finish
C
B
E
D
A
0 2
2 12
12 26
26 34
34 38
2 17
17 37
37 50
50 57
57 60
J – 36Copyright © 2010 Pearson Education, Inc. Publishing as Prentice Hall.
7/14/2010
19
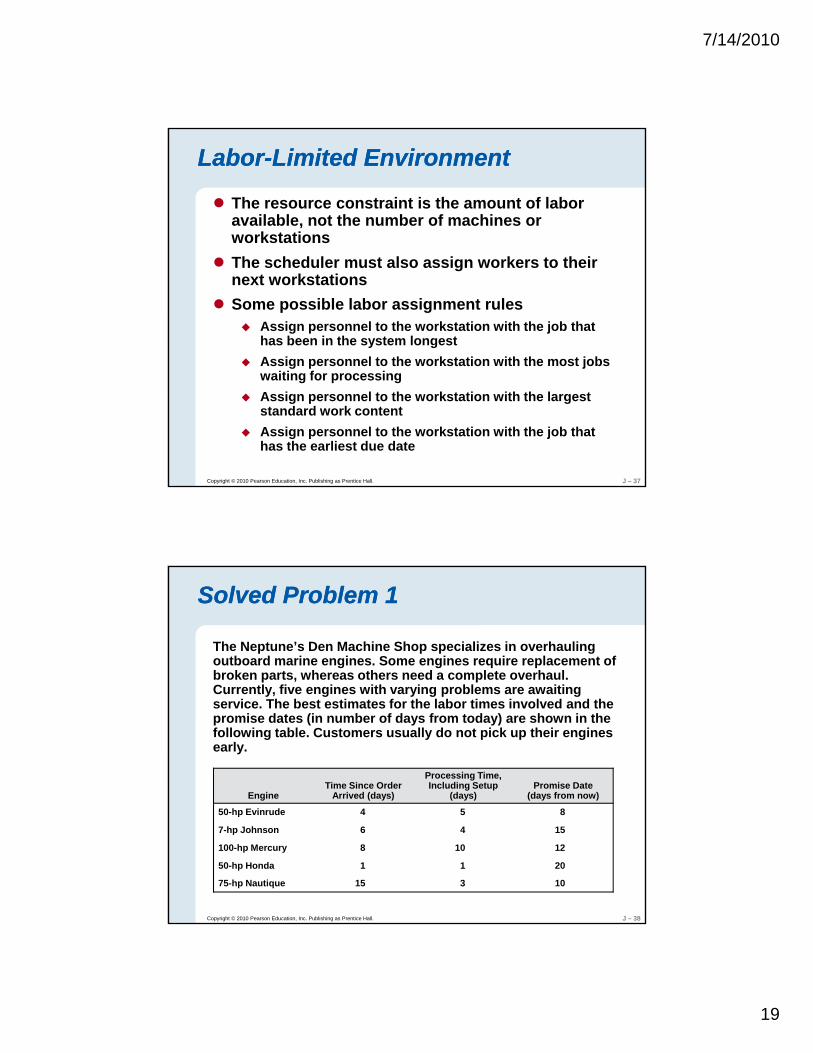
The resource constraint is the amount of labor available, not the number of machines or workstations
LaborLabor--Limited EnvironmentLimited Environment
The scheduler must also assign workers to their next workstationsSome possible labor assignment rules
Assign personnel to the workstation with the job that has been in the system longestAssign personnel to the workstation with the most jobs
J – 37Copyright © 2010 Pearson Education, Inc. Publishing as Prentice Hall.
g p jwaiting for processingAssign personnel to the workstation with the largest standard work contentAssign personnel to the workstation with the job that has the earliest due date
The Neptune’s Den Machine Shop specializes in overhauling outboard marine engines. Some engines require replacement of broken parts, whereas others need a complete overhaul. C tl fi i ith i bl iti
Solved Problem 1Solved Problem 1
Currently, five engines with varying problems are awaiting service. The best estimates for the labor times involved and the promise dates (in number of days from today) are shown in the following table. Customers usually do not pick up their engines early.
EngineTime Since Order
Arrived (days)
Processing Time, Including Setup
(days)Promise Date
(days from now)
J – 38Copyright © 2010 Pearson Education, Inc. Publishing as Prentice Hall.
50-hp Evinrude 4 5 8
7-hp Johnson 6 4 15
100-hp Mercury 8 10 12
50-hp Honda 1 1 20
75-hp Nautique 15 3 10
7/14/2010
20
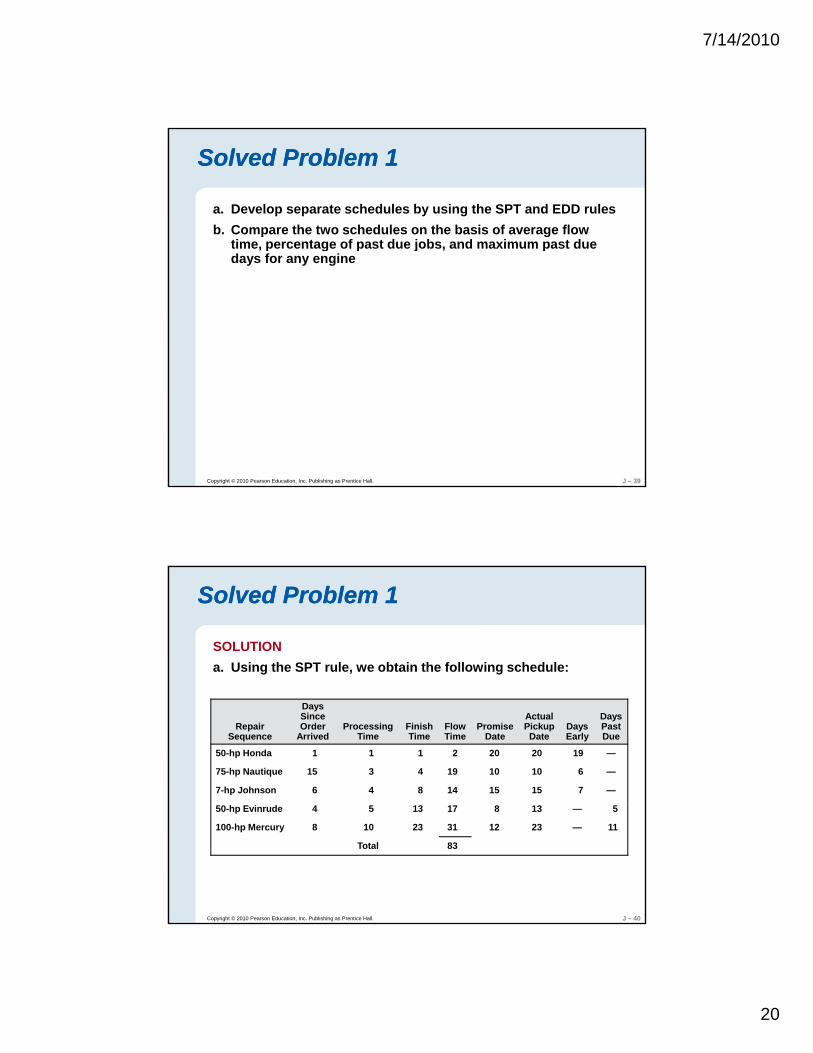
Solved Problem 1Solved Problem 1
a. Develop separate schedules by using the SPT and EDD rulesb. Compare the two schedules on the basis of average flow
time, percentage of past due jobs, and maximum past duetime, percentage of past due jobs, and maximum past due days for any engine
J – 39Copyright © 2010 Pearson Education, Inc. Publishing as Prentice Hall.
Solved Problem 1Solved Problem 1
SOLUTIONa. Using the SPT rule, we obtain the following schedule:
Repair Sequence
Days Since Order
ArrivedProcessing
TimeFinish Time
Flow Time
Promise Date
Actual Pickup Date
Days Early
Days Past Due
50-hp Honda 1 1 1 2 20 20 19 —
75-hp Nautique 15 3 4 19 10 10 6 —
7-hp Johnson 6 4 8 14 15 15 7 —
J – 40Copyright © 2010 Pearson Education, Inc. Publishing as Prentice Hall.
50-hp Evinrude 4 5 13 17 8 13 — 5
100-hp Mercury 8 10 23 31 12 23 — 11
Total 83
7/14/2010
21
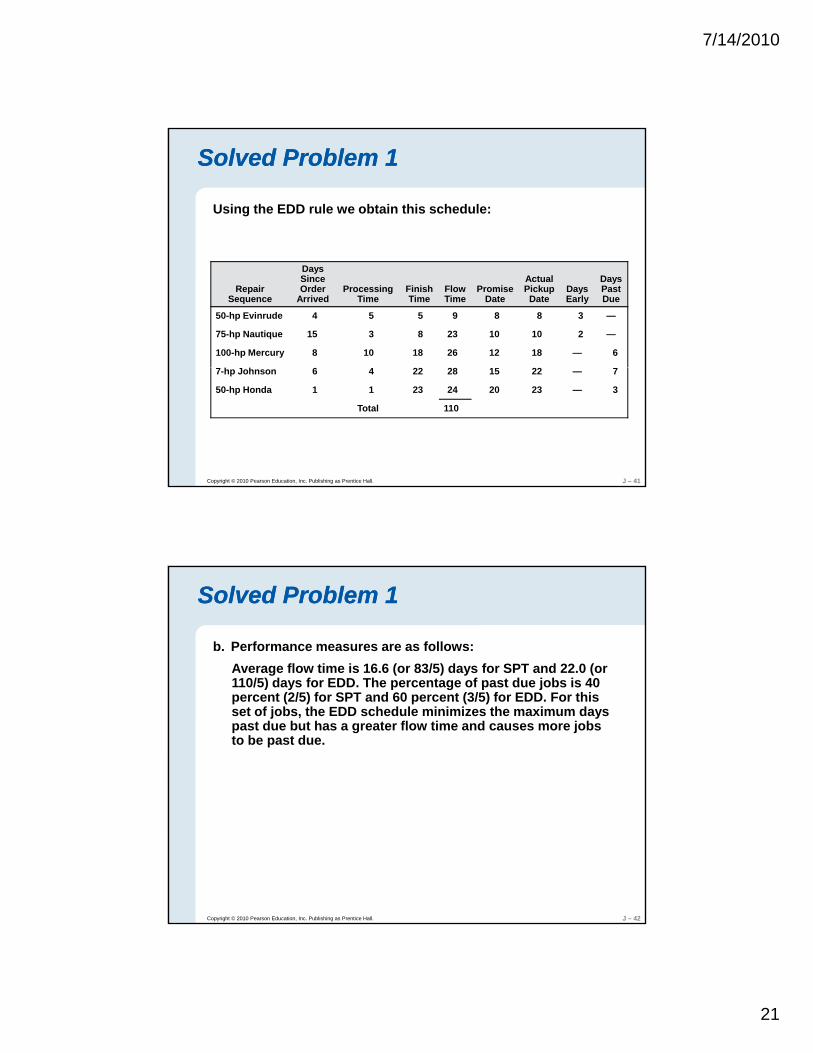
Solved Problem 1Solved Problem 1
Using the EDD rule we obtain this schedule:
Repair Sequence
Days Since Order
ArrivedProcessing
TimeFinish Time
Flow Time
Promise Date
Actual Pickup Date
Days Early
Days Past Due
50-hp Evinrude 4 5 5 9 8 8 3 —
75-hp Nautique 15 3 8 23 10 10 2 —
100-hp Mercury 8 10 18 26 12 18 — 6
J – 41Copyright © 2010 Pearson Education, Inc. Publishing as Prentice Hall.
7-hp Johnson 6 4 22 28 15 22 — 7
50-hp Honda 1 1 23 24 20 23 — 3
Total 110
Solved Problem 1Solved Problem 1
b. Performance measures are as follows:Average flow time is 16.6 (or 83/5) days for SPT and 22.0 (or 110/5) days for EDD The percentage of past due jobs is 40110/5) days for EDD. The percentage of past due jobs is 40 percent (2/5) for SPT and 60 percent (3/5) for EDD. For this set of jobs, the EDD schedule minimizes the maximum days past due but has a greater flow time and causes more jobs to be past due.
J – 42Copyright © 2010 Pearson Education, Inc. Publishing as Prentice Hall.
7/14/2010
22
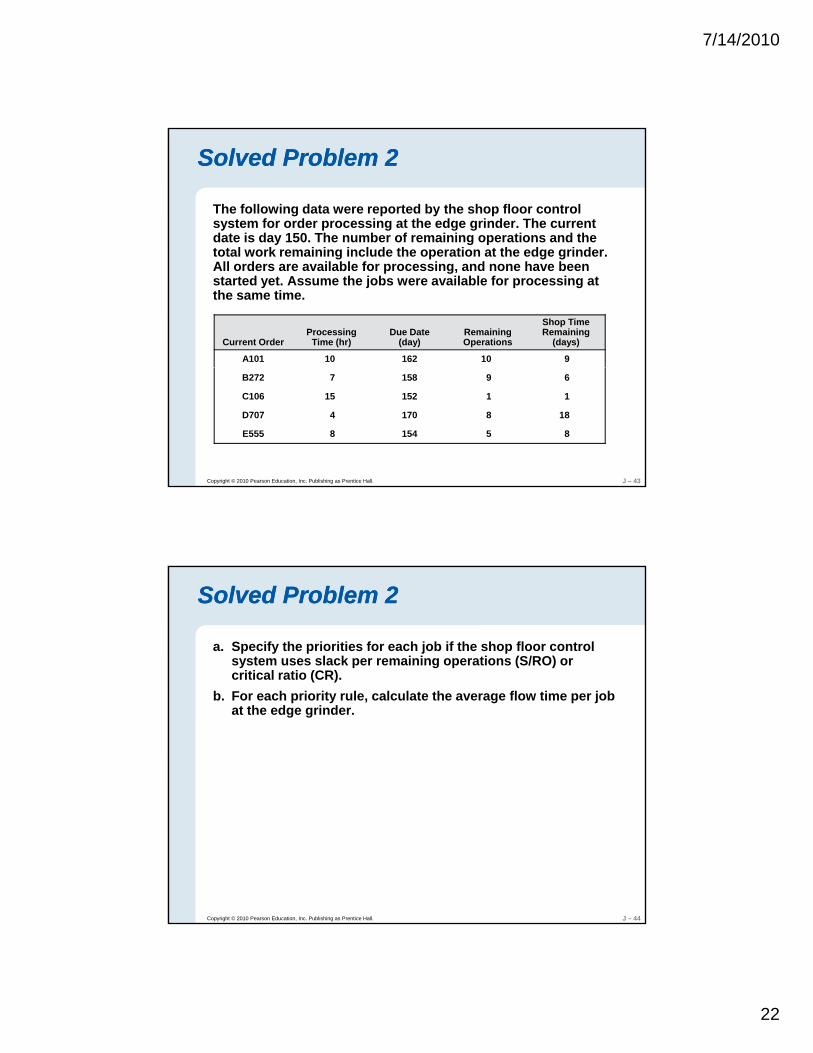
Solved Problem 2Solved Problem 2
The following data were reported by the shop floor control system for order processing at the edge grinder. The current date is day 150. The number of remaining operations and the t t l k i i i l d th ti t th d i dtotal work remaining include the operation at the edge grinder. All orders are available for processing, and none have been started yet. Assume the jobs were available for processing at the same time.
Current OrderProcessing
Time (hr)Due Date
(day)Remaining Operations
Shop Time Remaining
(days)
A101 10 162 10 9
J – 43Copyright © 2010 Pearson Education, Inc. Publishing as Prentice Hall.
B272 7 158 9 6
C106 15 152 1 1
D707 4 170 8 18
E555 8 154 5 8
Solved Problem 2Solved Problem 2
a. Specify the priorities for each job if the shop floor control system uses slack per remaining operations (S/RO) or critical ratio (CR).
b. For each priority rule, calculate the average flow time per job at the edge grinder.
J – 44Copyright © 2010 Pearson Education, Inc. Publishing as Prentice Hall.
7/14/2010
23
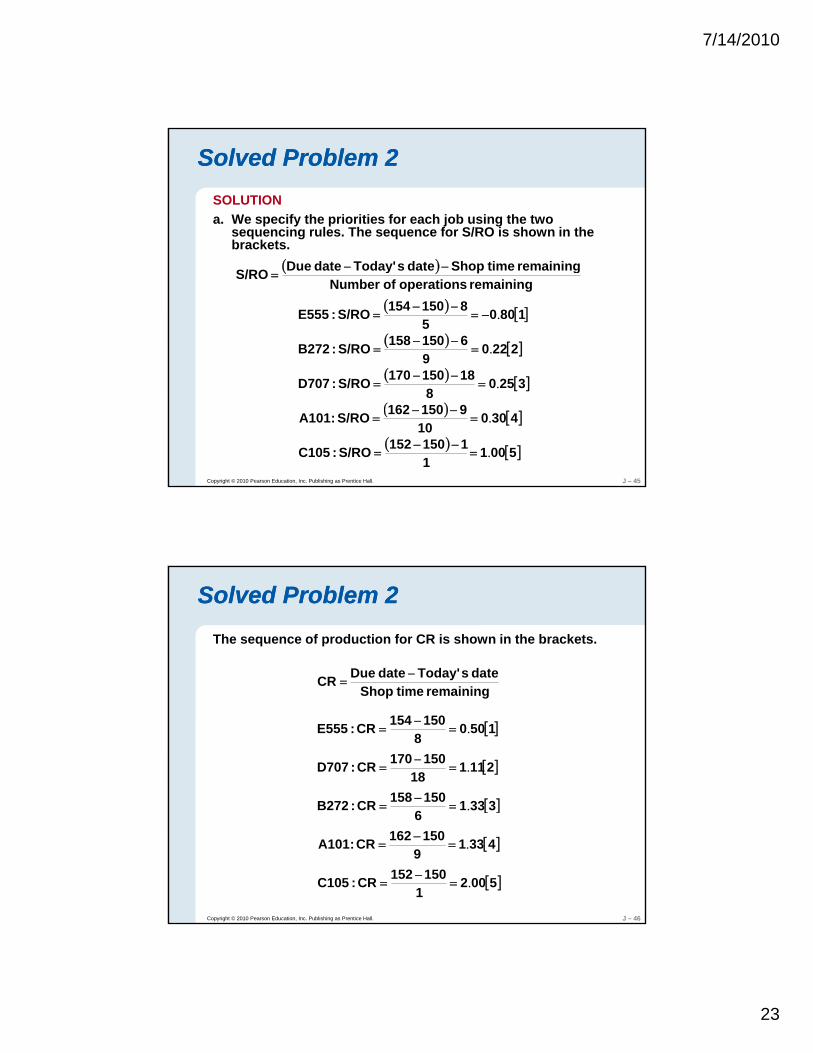
Solved Problem 2Solved Problem 2SOLUTIONa. We specify the priorities for each job using the two
sequencing rules. The sequence for S/RO is shown in the brackets.brackets.
( )remaining operations of Number
remainingtimeShopdatesToday'date DueS/RO −−=
( ) [ ]18005
8150154S/RO:E555 .−=−−
=
( ) [ ]22209
6150158S/RO:B272 .=−−
=
J – 45Copyright © 2010 Pearson Education, Inc. Publishing as Prentice Hall.
( ) [ ]32508
18150170S/RO:D707 .=−−
=
( ) [ ]430010
9150162S/RO:A101 .=−−
=
( ) [ ]50011
1150152S/RO:C105 .=−−
=
Solved Problem 2Solved Problem 2The sequence of production for CR is shown in the brackets.
datesToday'dateDueCR −=
remainingtimeShopCR
[ ]15008
150154CR:E555 .=−
=
[ ]3331150158CR:B272 −
[ ]211118
150170CR:D707 .=−
=
J – 46Copyright © 2010 Pearson Education, Inc. Publishing as Prentice Hall.
[ ]33316
CR:B272 .==
[ ]43319
150162CR:A101 .=−
=
[ ]50021
150152CR:C105 .=−
=
7/14/2010
24
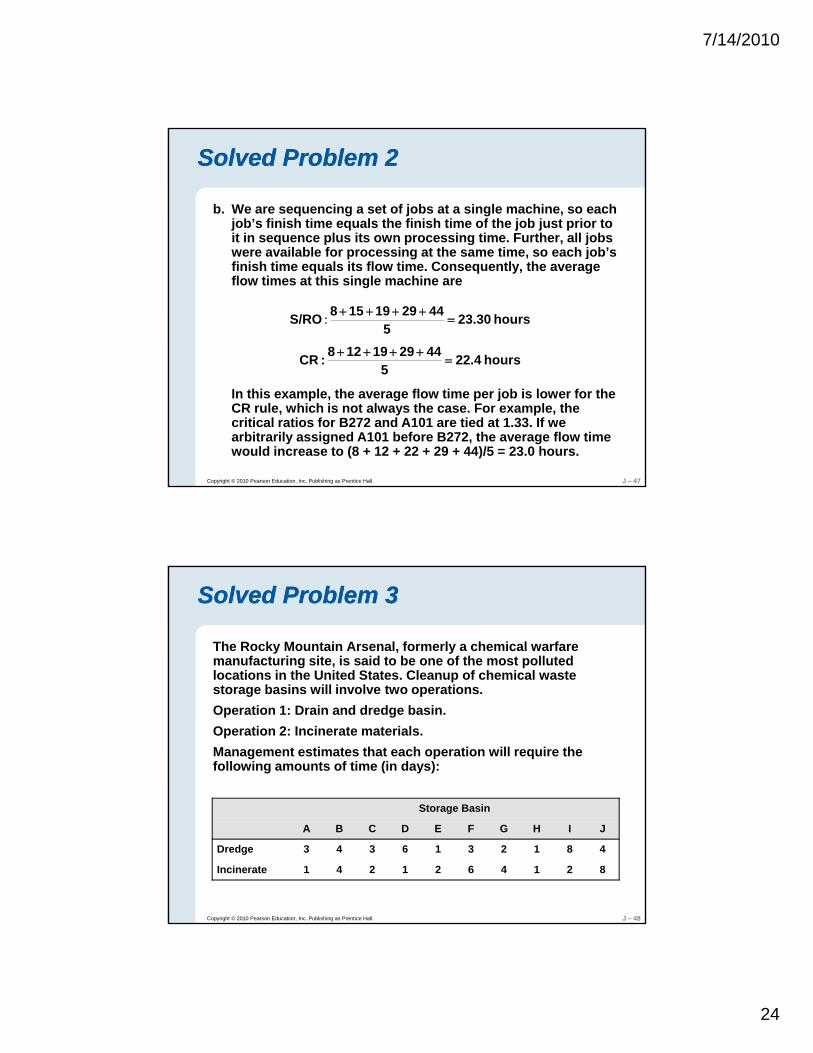
Solved Problem 2Solved Problem 2
b. We are sequencing a set of jobs at a single machine, so each job’s finish time equals the finish time of the job just prior to it in sequence plus its own processing time. Further, all jobs
il bl f i t th ti h j b’were available for processing at the same time, so each job’s finish time equals its flow time. Consequently, the average flow times at this single machine are
hours 23.305
442919158S/RO =++++:
hours 22.45
442919128:CR =++++
J – 47Copyright © 2010 Pearson Education, Inc. Publishing as Prentice Hall.
5
In this example, the average flow time per job is lower for the CR rule, which is not always the case. For example, the critical ratios for B272 and A101 are tied at 1.33. If we arbitrarily assigned A101 before B272, the average flow time would increase to (8 + 12 + 22 + 29 + 44)/5 = 23.0 hours.
Solved Problem 3Solved Problem 3
The Rocky Mountain Arsenal, formerly a chemical warfare manufacturing site, is said to be one of the most polluted locations in the United States. Cleanup of chemical waste
t b i ill i l t tistorage basins will involve two operations.Operation 1: Drain and dredge basin.Operation 2: Incinerate materials.Management estimates that each operation will require the following amounts of time (in days):
St B i
J – 48Copyright © 2010 Pearson Education, Inc. Publishing as Prentice Hall.
Storage Basin
A B C D E F G H I J
Dredge 3 4 3 6 1 3 2 1 8 4
Incinerate 1 4 2 1 2 6 4 1 2 8
7/14/2010
25
Solved Problem 3Solved Problem 3
Management’s objective is to minimize the makespan of the cleanup operations. All storage basins are available for processing right now. First, find a schedule that minimizes the
k Th l l t th fl ti f tmakespan. Then calculate the average flow time of a storage basin through the two operations. What is the total elapsed time for cleaning all 10 basins? Display the schedule in a Gantt machine chart.
SOLUTIONWe can use Johnson’s rule to find the schedule that minimizes th t t l k F j b ti d f th h t t
J – 49Copyright © 2010 Pearson Education, Inc. Publishing as Prentice Hall.
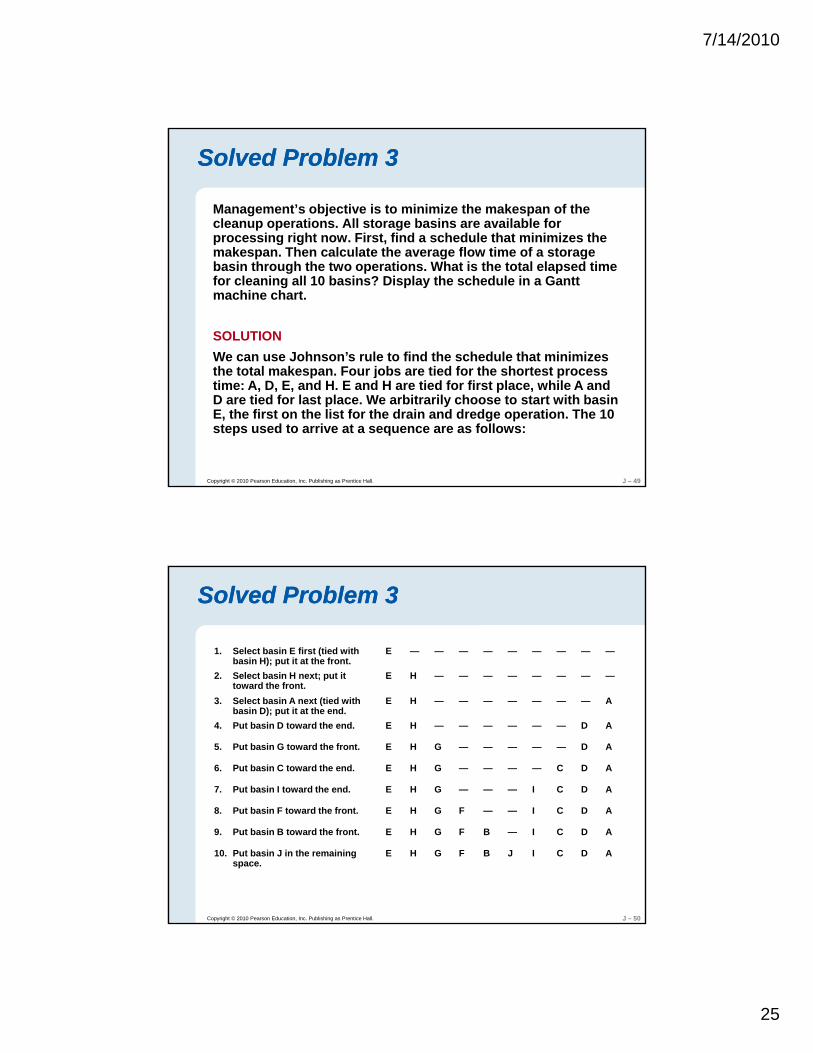
the total makespan. Four jobs are tied for the shortest process time: A, D, E, and H. E and H are tied for first place, while A and D are tied for last place. We arbitrarily choose to start with basin E, the first on the list for the drain and dredge operation. The 10 steps used to arrive at a sequence are as follows:
Solved Problem 3Solved Problem 3
2. Select basin H next; put it toward the front
E H — — — — — — — —
1. Select basin E first (tied with basin H); put it at the front.
E — — — — — — — — —
toward the front.3. Select basin A next (tied with
basin D); put it at the end.E H — — — — — — — A
4. Put basin D toward the end. E H — — — — — — D A
5. Put basin G toward the front. E H G — — — — — D A
7. Put basin I toward the end. E H G — — — I C D A
6. Put basin C toward the end. E H G — — — — C D A
J – 50Copyright © 2010 Pearson Education, Inc. Publishing as Prentice Hall.
8. Put basin F toward the front. E H G F — — I C D A
9. Put basin B toward the front. E H G F B — I C D A
10. Put basin J in the remaining space.
E H G F B J I C D A
7/14/2010
26
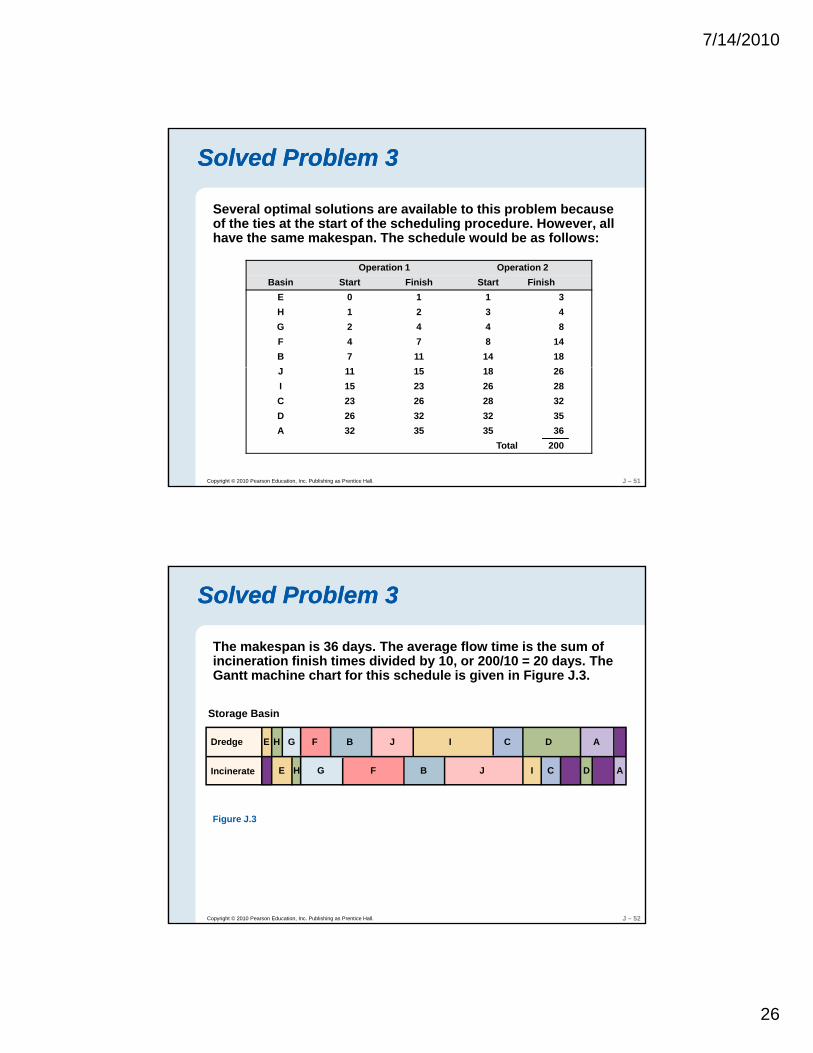
Solved Problem 3Solved Problem 3
Several optimal solutions are available to this problem because of the ties at the start of the scheduling procedure. However, all have the same makespan. The schedule would be as follows:
Operation 1 Operation 2Basin Start Finish Start Finish
E 0 1 1 3H 1 2 3 4G 2 4 4 8F 4 7 8 14B 7 11 14 18
J – 51Copyright © 2010 Pearson Education, Inc. Publishing as Prentice Hall.
J 11 15 18 26I 15 23 26 28C 23 26 28 32D 26 32 32 35A 32 35 35 36
Total 200
Solved Problem 3Solved Problem 3
The makespan is 36 days. The average flow time is the sum of incineration finish times divided by 10, or 200/10 = 20 days. The Gantt machine chart for this schedule is given in Figure J.3.
E H G F B J I C D A
E H G F B J I C D A
Storage Basin
Dredge
Incinerate
J – 52Copyright © 2010 Pearson Education, Inc. Publishing as Prentice Hall.
Figure J.3
7/14/2010
27
J – 53Copyright © 2010 Pearson Education, Inc. Publishing as Prentice Hall.
Copyright © 2022 FDOKUMEN