![Semester V (Third year] Branch/Course Civil Engineering V ...](https://static.fdokumen.com/doc/165x107/6321a517ae0f5e8191058b94/semester-v-third-year-branchcourse-civil-engineering-v-.jpg)
Semester V (Third year] Branch/Course Civil Engineering V ...
Upload
khangminh22Category
view
0download
0
AUGUST 01, 2001
OPERATIONS ENGINEERING COURSE
STUDY BOOK
EMPRESA BRASILEIRA DE AERONÁUTICA S.A. AV. BRIGADEIRO FARIA LIMA, 2170 - P.O.BOX 8050
SÃO JOSÉ DOS CAMPOS - SÃO PAULO - BRASIL CEP 12227-901
[email protected] phn 55-12-3945-1706 fax: 55 12 3945-2477

OPERATIONS ENGINEERING COURSE
AUGUST 01, 2001 2 FOR TRAINING PURPOSES ONLY
INDEX
1. INTRODUCTION........................................................................................................................4
2. JET AIRPLANE AERODYNAMICS........................................................................................5 2.1 LOW SPEED CHARACTERISTICS.........................................................................................5 2.2 HIGH SPEED CHARACTERISTICS .......................................................................................11
3. DATA ACQUISITION AND MEASUREMENT ....................................................................15 3.1 INTERNATIONAL STANDARD ATMOSPHERE - ISA............................................................15 3.2 ALTITUDE MEASUREMENT...................................................................................................18 3.3 AIRSPEED MEASUREMENT..................................................................................................24 3.4 TEMPERATURE MEASUREMENT.........................................................................................28 3.5 PERFORMANCE CALCULATION ON NON-STANDARD ATMOSPHERE...........................29
4. JET ENGINES..........................................................................................................................30 4.1 ENGINE THRUST RATINGS...................................................................................................30 4.2 THRUST TOLERANCE - MINIMUM, AVERAGE AND MAXIMUM THRUST............................32 4.3 FACTORS AFFECTING ENGINE THRUST............................................................................32 4.4 AUTOMATIC TAKEOFF THRUST CONTROL SYSTEM (ATTCS)........................................36
5. TAKEOFF PERFORMANCE.................................................................................................37 5.1 TAKEOFF PROFILE...............................................................................................................37 5.2 TAKEOFF SPEEDS DEFINITIONS ........................................................................................38 5.3 TAKEOFF DISTANCE DEFINITIONS:....................................................................................42 5.4 TAKEOFF WEIGHT LIMITATIONS..........................................................................................44 5.5 FIELD LENGTH LIMITED TAKEOFF WEIGHT.......................................................................45 5.6 V1min LIMITED TAKEOFF WEIGHT .......................................................................................50 5.7 WET, CONTAMINATED AND SLIPPERY RUNWAYS ...........................................................51 5.8 MAXIMUM BRAKE ENERGY LIMITED TAKEOFF WEIGHT...................................................55 5.9 TIRE SPEED LIMITED TAKEOFF WEIGHT...........................................................................55 5.10 CLIMB LIMITED TAKEOFF WEIGHT .....................................................................................56 5.11 OBSTACLE LIMITED TAKEOFF WEIGHT ............................................................................58 5.12 5-MINUTES THRUST LIMITED TAKEOFF WEIGHT .............................................................65 5.13 EXTENDED SECOND SEGMENT ........................................................................................65 5.14 WIND CORRECTIONS..........................................................................................................66 5.15 EFFECT OF FLAP SETTING.................................................................................................66 5.16 INCREASED V2 OR IMPROVED CLIMB...............................................................................67 5.17 FIRST PRINCIPLES PERFORMANCE..................................................................................69 5.18 REDUCED AND DERATED TAKEOFF THRUST OPERATIONS........................................70 5.19 ALIGNMENT ALLOWANCE....................................................................................................73 5.20 PAVEMENT STRENGTH LIMITATIONS.................................................................................74
6. ENROUTE CLIMB...................................................................................................................75
7. CRUISE, FLIGHT PLANNING AND DRIFTDOWN ...........................................................77 7.1 SPEED SELECTION..............................................................................................................77 7.2 ALTITUDE SELECTION..........................................................................................................80 7.3 FLIGHT PLANNING..................................................................................................................86 7.4 FUEL TANKERING..................................................................................................................89 7.5 CG POSITION FOR FUEL SAVING........................................................................................90 7.6 AIRPLANE LIMITING WEIGHTS VERIFICATION....................................................................91 7.7 DRIFTDOWN..........................................................................................................................92 7.8 EMERGENCY DESCENT AND OXYGEN REQUIREMENTS................................................97 7.9 ETOPS....................................................................................................................................98 7.10 EXTENDED OVERWATER OPERATIONS ..........................................................................99

OPERATIONS ENGINEERING COURSE
AUGUST 01, 2001 3 FOR TRAINING PURPOSES ONLY
8. APPROACH AND LANDING PERFORMANCE............................................................. 100 8.1 CLIMB LIMITED LANDING WEIGHT .....................................................................................100 8.2 LANDING FIELD LENGTH.....................................................................................................101 8.3 QUICK TURN AROUND WEIGHT ........................................................................................103
9. WEIGHT AND BALANCE................................................................................................... 104 9.1 STANDARD TERMS AND DEFINITIONS .............................................................................104 9.2 FORCES AND MOMENTS ...................................................................................................106 9.3 CENTER OF GRAVITY LIMITS.............................................................................................109 9.4 CENTER OF GRAVITY CURTAILMENTS ............................................................................112 9.5 INDEX SYSTEM....................................................................................................................113 9.6 BASIC OPERATING WEIGHT AND BASIC OPERATING INDEX CALCULATION..............114 9.7 BALANCE CHART.................................................................................................................115
10. REFERENCES.................................................................................................................. 118

OPERATIONS ENGINEERING COURSE
AUGUST 01, 2001 4 FOR TRAINING PURPOSES ONLY
1. INTRODUCTION
This study book presents basic concepts about aircraft performance and weight and balance, providing information on performance and weight and balance concepts, applicable regulations and definitions that are related to the Embraer Operations Engineering course.
This book presents generic data, not applicable to any specific airplane models and is intended for study purposes only.
In case of discrepancy between the information presented herein and any Embraer approved Airplane Flight Manual (AFM), the AFM must prevail.
In case of discrepancy between the information presented herein and any Airworthiness regulations, the regulations must prevail.

OPERATIONS ENGINEERING COURSE
AUGUST 01, 2001 5 FOR TRAINING PURPOSES ONLY
2. JET AIRPLANE AERODYNAMICS
The objective of this section is to present the main aerodynamics differences between jet and turboprop airplanes, taking as example the EMB 135/145. 2.1 LOW SPEED CHARACTERISTICS
The EMB 135/145 was designed having the turboprop pilot in view. Designed to be safe to operate by pilots without previous jet experience, the end result is an aircraft that is simple to manage and that has excellent handling characteristics. In some aspects it is even easier to handle than the average high performance turboprop. However some important differences exist when compared to turboprops: 2.1.1 Swept-back wing: A swept back wing is required to avoid the occurrence of sonic shock waves at cruise speeds. The existence of shock waves may cause substantial drag increase as well as control and stability problems and buffeting (transonic flow is discussed further ahead in section 2.2 High Speed Characteristics). We will for the time being address the low speed characteristics of a swept back wing.
The use of a swept back wing brings along some penalties:
1. Slow lift response to a change in angle of attack; 2. Higher dihedral effect 3. Unfavorable spanwise lift distribution 4. Added interference drag with the fuselage
Each of these characteristics is discussed below: 2.1.1.1 Swept-back wing slow lift response to changes in angle of attack: The swept back wing reduces the wing response to angles of attack. The figure below shows this difference:

OPERATIONS ENGINEERING COURSE
AUGUST 01, 2001 6 FOR TRAINING PURPOSES ONLY
To produce the same relative lift increment a smaller angle of attack change is required:
α1 > α2 This slow response to changes of angle of attack means that things like a quick flare during landing are less likely to be successful, so stabilized approaches with normal rotation rates during flare become more important. 2.1.1.2 Swept-back wing higher than normal dihedral effect: Every pilot knows that when one of the pedals is displaced forward in flight the aileron has to be deflected to the opposite side to prevent the aircraft from rolling.
This is caused by the so called dihedral effect. When the wings are designed so that they are "bent" upward they are said to have a geometric dihedral. This geometric dihedral produces the following aerodynamic effect: If in flight for any reason one of the wings drop, the consequent sideslip causes the aircraft to roll back to wings level. In other terms: dihedral provides roll due to sideslip.
The wing sweepback reacts to sideslip very much as a geometric dihedral, that is, if a sideslip occurs the sweep back causes the wing to roll. This is because the wing that advances relative to the airflow generates more lift (and more drag), causing the aircraft to roll as well as to yaw back to the no-sideslip condition.
The figure below illustrates these characteristics.
The dihedral effect on a swept back wing aircraft is normally stronger than that of a straight wing aircraft. Consequently pilots must be aware that rapid application of large rudder
α1 α2

OPERATIONS ENGINEERING COURSE
AUGUST 01, 2001 7 FOR TRAINING PURPOSES ONLY
displacements or rapid application of large asymmetric thrust changes on such aircraft may create control difficulties. In other words: rudder and asymmetric thrust inputs must be made carefully and smoothly. Absence of dihedral effect is not good. However, excess of dihedral effect may cause some problems too, because excess dihedral effect may make uncoordinated flight more difficult. There are situations where the uncoordinated flight is necessary, like on a landing flare with turbulence and crosswind, for example. Excess dihedral effect also usually exacerbates dutch roll. A yaw damper may be used to improve the dutch roll characteristics, but obviously it is preferable to have an aircraft with good natural dutch roll characteristics. So, there is an optimum balance in regards to dihedral effect, and the EMB 135/145 was designed to be close to this optimum balance. 2.1.1.3 Swept-back wing unfavorable span wise lift distribution: One of the most critical design aspects of a wing is how the lift is distributed along the wingspan. Improper lift distribution causes unnecessarily high bending stresses, increases the induced drag and, probably most serious of all, may turn a stall into a dangerous, uncontrollable maneuver where abnormal attitudes can be expected. Lift on swept back wings is more concentrated at the tips when compared to lift on straight wings. This is an undesirable characteristic. The figure below illustrates typical lift distributions on several wing geometries.
The best span wise lift distribution is the one that minimizes induced drag but allows roll control even at near-stall speeds. To have that roll control, stall propagation from root to tip is desirable, that is, higher lift at the root than at the tip. That pattern keeps normal airflow over the ailerons until the whole wing is stalled. How to achieve that with a swept back wing where

OPERATIONS ENGINEERING COURSE
AUGUST 01, 2001 8 FOR TRAINING PURPOSES ONLY
typically lift is higher near the tip ? There are several means to achieve that: by wing torsion, by changing the airfoil thickness and camber along the span, by use of vortilons, through the use of local aerodynamic devices, etc. The EMB 135/145 does make use of torsion and of some other resources like vortilons. Wing torsion is to be used with care, as excess wing torsion means drag and consequently loss of performance. So, the EMB 135/145 uses torsion just to the extent necessary (4 degrees). The vortilons are devices located on the lower leading edge of the wing forward of the ailerons. In cruise angles of attack the drag associated is negligible, but at higher angles of attack they create vortex that flow over the wing adding energy to the boundary layer, delaying its separation and, consequently, increasing ailerons control effectiveness even when the wing root stalls. Tests in wind tunnel revealed an increase of two degrees (for EMB 145) in the wing stall angle of attack, improved maximum lifting capability and, as a result, increased payload. Through the use of these aerodynamic resources, the EMB 145/135 has full roll control throughout the normal operating range down to stick pusher speeds. 2.1.1.4 Swept-back wing added interference drag with the fuselage: One of the characteristics of a swept back wing is the fact that the streamline flow over the wing changes direction along the wing chord (see illustration below).
The curvature is due to the deceleration and acceleration of the flow component in the plane perpendicular to the quarter chord line. This span wise flow component cannot happen near the fuselage sides because the fuselage sides are straight. This interference between the natural flow over the wing and the fuselage causes drag and may cause some higher speed

OPERATIONS ENGINEERING COURSE
AUGUST 01, 2001 9 FOR TRAINING PURPOSES ONLY
airflow at some spots, which would possibly cause premature shock waves. So the engineers normally change the wing design near the root to minimize this interference. One of the possibilities would be to use variable fuselage cross sections along the wing chord. This variable cross section technique has nothing to do with the so called "coke bottle rule" first stated by Withcomb. The "coke bottle rule" minimizes transonic/supersonic drag while we are talking about subsonic speeds here. In any way, use of variable cross section would create big manufacturing and interior arrangement problems. Another well known technique is to reduce or even invert the airfoil camber near the root but maintaining the fuselage cross section. Almost all commercial jet aircraft have this technique incorporated. The EMB 135/145 is no exception. 2.1.2 Variable-incidence stabilizer: The use of variable-incidence stabilizer is usually adopted because of the large speed range usually possible with the use of sweptback wing. If a fixed-incidence stabilizer were used, it would probably not provide the adequate level of longitudinal control authority throughout the range of speeds and flap configurations. However a variable-incidence stabilizer presents some characteristics that are different from those found in a traditional trim tab system.
On some aircraft if the wrong setting is used, the pilot may face not only higher than normal forces but also an insufficient control authority where even with full elevator deflection the aircraft response to the pilot's command may be somewhat limited. The EMB 135/145 has been tested with mistrimmed stabilizer and it was demonstrated that if the stabilizer is anywhere within the green range (no aural warning in the cockpit) the aircraft can safely takeoff. EMB 145 wind tunnel and computational data indicate that in flight no matter how badly the aircraft is mistrimmed the pilot will likely not have lack of longitudinal control authority. Rather, he will have higher than normal elevator forces only. 2.1.3 Different low speed flying qualities: Jet aircraft normally have an extended backside of the power/thrust curve. What is the back side of the power/thrust curve ? Also known as the second regime, it is the low end of the speed vs. drag curve (also known as required power/thrust curve) where reducing the speed

OPERATIONS ENGINEERING COURSE
AUGUST 01, 2001 10 FOR TRAINING PURPOSES ONLY
actually increases the drag and therefore the required thrust or power to maintain level flight. Flight in the backside of the power/thrust curve may pose some difficulty since the use of elevator to control angle of descent (or climb) seems unconventional. Flight path in these situations is normally corrected by increasing or reducing thrust in addition to elevator inputs. There is no reason to fly in this region except in case of short field approaches. Embraer does not recommend any approach with speed other the ones set forth in the AFM, though. Some straight wing aircraft do show the backside of the power/thrust curve too, like STOL aircraft on STOL operations. But the backside of the power/thrust curve is far more common in swept-wing, high performance aircraft. The backside of the power/thrust curve on the EMB 145 is not large and the aircraft has excellent handling qualities at low speeds. Yet, when compared to a straight wing turboprop there are differences. Obviously pilots are not supposed to fly at very low speeds on an O.E.I. situation for controllability reasons, but even if control is not a factor it is very important that the low speed end of the envelope be avoided when the performance is marginal to prevent a no-acceleration-no-climb situation from happening. And if it happens, the pilot must be aware that reducing speed will not increase flight path angle (except momentarily due to inertia). The figure below illustrates the difference between a jet and a turboprop in this regard.

OPERATIONS ENGINEERING COURSE
AUGUST 01, 2001 11 FOR TRAINING PURPOSES ONLY
2.1.4 Spoilers: Spoiler is a flight control surface usually found on jet aircraft. Their existence is due to several reasons:
• They improve steep descent characteristics by increasing the aircraft aerodynamic drag
• They improve landing performance by increasing the aircraft drag and decreasing lift when the aircraft is on ground, which improves wheel brakes effectiveness.
• They improve lateral control (not used on the 135/145 aircraft: spoilers do not act as roll spoilers)
However the use of spoilers demand attention: They can not be forgotten in the deployed position. Such a mistake can significantly penalize the aircraft performance in some critical flight phase. Pilot techniques such as keeping the hand on the spoiler handle until it is stowed may help prevent that. 2.2 HIGH SPEED CHARACTERISTICS
2.2.1 Shock Waves: What happens when an aircraft wing accelerates to transonic speeds? The most important thing is the appearance of shock waves. As we know, the speed of the airflow over a wing varies along the chord. If, say, at a few dozen feet ahead of the aircraft the airflow is at M .75 relative to the aircraft at some points over the wing it may be at M .95. When the airflow at some point over the wing reaches M 1.0 a shock waves appears. The free-stream Mach number at which a local Mach number of 1.0 is attained at any point on the aircraft is called the critical Mach number. The shock waves themselves are not a problem. However, other things come along with them: changes in the pressure distribution over the aircraft surfaces, drag and buffeting. The figure below shows the location of the most significant shock waves that may occur on the EMB 135/145. The presence of significant shock waves can be noticed by the presence of buffeting.

OPERATIONS ENGINEERING COURSE
AUGUST 01, 2001 12 FOR TRAINING PURPOSES ONLY
The reason the shock wave over the tail is on the under surface is the fact that the horizontal tail has negative camber because it has to provide negative lift since the CG of the aircraft is normally ahead of the wing lift forces. 2.2.2 Mach Tuck: For most of the aircraft the point where the airflow is fastest is over the wing. So that is where shock waves appear first. The figure below shows the differences in pressure distribution along the wing chord between subsonic flow and transonic flow.
As the figure illustrates, in transonic flow the lift forces act at a point further downstream. This shift causes a pitch down tendency. Another characteristic of the transonic flow is that the greater the angle of attack, the more intense the shock waves are and as a consequence heavier the pitch down tendency is. This is a potentially hazardous situation that can cause the aircraft to rapidly accelerate to excessively high speeds. This phenomenon is referred to as the "Mach Tuck". The pilot has to decrease thrust or increase drag or both to get out of such a situation. Some aircraft have a Mach Trim system to provide automatic elevator (or horizontal stabilizer) input when the airplane exceeds certain airspeeds to compensate for the tendency of the airplane to tuck. Some other aircraft are such that in transonic speeds if the pilot pulls the yoke to counteract the pitch down tendency the associated increase of angle of attack shifts the lift forces even further downstream to the point that the end result is inverted: the aircraft tends to pitch down further instead of recovering. The EMB 135/145 has very favorable characteristics on that regard. The aircraft was extensively flown to Mach .85 and no tendency like the "Mach Tuck" was observed, and as a result no Mach Trim system is installed on it. At speeds in the vicinity of and a little above

OPERATIONS ENGINEERING COURSE
AUGUST 01, 2001 13 FOR TRAINING PURPOSES ONLY
Mach .85 one can expect some pitch down tendency but all the tests that were made indicate that this mild pitch down tendency can safely be counteracted conventionally, that is, if the yoke is pulled the aircraft will recover normally. However as a general policy the recovery should be done first by changing thrust and drag, then by using the elevator. And it should be done as smoothly as possible but not too slow to allow the aircraft to accelerate to even higher speeds. Speed brake may be used to increase the drag. Embraer tested the use of speed brake at speeds up to M .85 with the aircraft trimmed for M .78 and it showed no abnormal pitch tendency whatsoever. It is expected that the use of speed brake with the aircraft trimmed for Mach numbers higher than .78 will induce some pitch down tendency. So probably the best recovery technique is to use the speed brake and gently pull back the elevator column at pilot's discretion. 2.2.3 Flow detachment and buffeting: Whenever there is a shock wave there is flow detachment behind it. Flow detachment means transfer of energy to the surrounding air. Flow detachment, if severe enough, causes buffeting. And transfer of energy to the surrounding air means drag. The figure below illustrates the mentioned flow detachment:
As the aircraft accelerates towards transonic speeds, it reaches a Mach number where at some point over the wing the first shock waves that appear are weak and the amount of flow detachment is reduced. However, as the aircraft accelerates, further stronger shock waves take place, flow detachment behind the wave becomes more intense and drag increases noticeably. So, there is a Mach number where the drag raise due to transonic flow becomes significant. This Mach number is called the Divergent Drag Mach number. This flow detachment may induce phenomena such as aileron vibration (due to detachment in front of them) and wing rocking (due to detachment moving back and forth along the wingspan). Some of the earlier transonic aircraft had a marked tendency to rock the wings, while some aircraft need to use vortex generators to eliminate the tendency to induce aileron vibration. None of these tendencies were observed on the EMB 135/145 at Mach numbers as high as .85.

OPERATIONS ENGINEERING COURSE
AUGUST 01, 2001 14 FOR TRAINING PURPOSES ONLY
2.2.4 Stall Protection System at high speeds As we mentioned before, in a transonic flow the greater the angle of attack, the more intense the shock waves are. The onset of shock waves happens earlier at higher angles of attack. An associated fact is that the closer to M 1.0, the lower the stall angle of attack. For this reason the EMB 135/145 has a stall protection system that activates the stick shaker and the stick pusher at lower angles of attack if the altitude is high and therefore the Mach number is high even at low indicated airspeeds. This Mach compensation logic is shown in the graph below:

OPERATIONS ENGINEERING COURSE
AUGUST 01, 2001 15 FOR TRAINING PURPOSES ONLY
3. DATA ACQUISITION AND MEASUREMENT
3.1 INTERNATIONAL STANDARD ATMOSPHERE - ISA
The performance of the airplane and engine depends on the generation of forces by the interaction between the airplane or engine and the air mass through which it flies. Thus, it is necessary to examine the properties of the Earth’s atmosphere.
The atmosphere is dynamic. Seasonal weather and movement of air masses have a pronounced effect on the temperature, pressure and density of the air. To provide a basis for estimating and comparing airplane and engine performance, it is necessary to have a standard.
The International Civil Aviation Organization (ICAO) established the standard normally used by airplane and engine manufacturers: International Standard Atmosphere, or ISA. It is an atmosphere model determined by averaging data gathered over a long period of time. The standard atmosphere considers, among other factors, that the air is a perfect gas, without humidity, winds or turbulence.
Since the studies were conducted in the mid latitudes of the north hemisphere, the standard is most representative of the conditions in these regions. However, even though the expected deviations from this standard may be much larger in polar or equatorial regions, the same standard is used as a reference. Presented below are the standard values for air temperature, pressure and density on a ISA atmosphere at sea level:
• Standard Temperature To = 15ºC (288.15 K) • Standard Pressure Po = 29.92 in Hg = 1013.2 milibars • Standard Density ρo = 0.002377 slug per cubic feet 3.1.1 TEMPERATURE VARIATION WITH ALTITUDE
According to the International Standard Atmosphere (ISA), temperature decreases by 1.9812°C per thousand feet up to the tropopause (36,080 ft or 11,000 m), and it has a constant temperature of -56.5°C in the tropopause (at higher altitudes, above normal aircraft operating altitudes, the tropopause ends and temperature variation starts again).
-56,5 0 15 AIR TEMPERATURE º C
11.000 m TROPOPAUSE
ALTITUDE
SEA LEVEL

OPERATIONS ENGINEERING COURSE
AUGUST 01, 2001 16 FOR TRAINING PURPOSES ONLY
3.1.2 INTERNATIONAL STANDARD ATMOSPHERE (ISA) CONDITIONS

OPERATIONS ENGINEERING COURSE
AUGUST 01, 2001 17 FOR TRAINING PURPOSES ONLY
STANDARD ATMOSPHERE PROPERTIES

OPERATIONS ENGINEERING COURSE
AUGUST 01, 2001 18 FOR TRAINING PURPOSES ONLY
3.2 ALTITUDE MEASUREMENT
In order to calculate the performance of an airplane it is necessary to know the altitude for which the performance is to be computed, since airplane performance depends on air pressure, among other factors.
It is physically difficult to measure the true height of an airplane above the ground. So, measurement of altitude is generally done by barometric instruments. The barometric altitude measurement is a measurement of the air pressure, and the barometric (or pressure) altitude is the height on ISA that corresponds to the measured air pressure. The relation between air pressure and pressure altitude is given by the standard atmosphere and is shown in the figure below. The air pressure is taken from the static ports on the outer skin of the fuselage or from the pitot-static system.
The measured air pressure is different from the actual static pressure because of equipment installation errors (variations in the aircraft outer skin, inefficiencies in the system, etc).
This error, which depends on the direction and the velocity of the air flow, is called position error. The same error occurs when measuring airspeed. 3.2.1 FLIGHT LEVEL SEPARATION: The altimeter precision is directly related to its efficiency in measuring air pressure variations. At low altitudes an altitude variation is easily measured by a large change in air pressure (23.5 mb between 14000 and 15000 ft, for example), while at high altitudes small variations in air pressure lead to big changes in altitude (9.3 mb between 39000 and 40000 ft).
For this reason, flight level separation at high altitudes is 2000 ft, while at low altitudes the separation is 1000 ft.
RVSM (Reduced Vertical Separation Minimums) airspaces, where flight level separation is 1000 ft at the higher altitudes, require high precision altimeters.
Altitude
S.L.
1013.2 mb Air Pressure

OPERATIONS ENGINEERING COURSE
AUGUST 01, 2001 19 FOR TRAINING PURPOSES ONLY
3.2.2 GEOMETRIC (TRUE) ALTITUDE VARIATION WITH ISA Pressure altimeters are calibrated to indicate true altitude under International Standard Atmosphere (ISA) conditions. Any deviation from ISA will therefore result in an erroneous reading on the altimeter (if compared to actual geometric altitude):
• In the case when the temperature is higher than ISA, the altimeter will show an altitude lower than the actual geometric altitude of the aircraft.
• In the case when the temperature is lower than ISA, the altimeter will show an altitude higher than the actual geometric altitude of the aircraft.
The altimeter error may be significant under conditions of extremely cold temperature (refer to ICAO PANS-OPS Vol I 3.5.4.5.2).

OPERATIONS ENGINEERING COURSE
AUGUST 01, 2001 20 FOR TRAINING PURPOSES ONLY
AERODROME
TEMP. (oC)
HEIGHT ABOVE THE ELEVATION OF THE ALTIMETER SETTING SOURCE
(feet) (ft) 200 300 400 500 600 700 800 0 0 20 20 20 20 20 40
-10 20 20 40 40 40 60 60 -20 20 40 40 60 80 80 100 -30 40 60 60 80 100 120 140 -40 40 60 80 100 140 160 180 -50 60 80 100 140 160 200 220
AERODROME
TEMP. (oC)
HEIGHT ABOVE THE ELEVATION OF THE ALTIMETER SETTING SOURCE
(feet) (ft) 900 1000 1500 2000 3000 4000 5000 0 40 40 60 80 120 160 200
-10 80 80 120 160 240 320 400 -20 100 120 180 240 360 500 620 -30 160 160 260 340 500 680 860 -40 200 220 320 440 660 880 1100 -50 240 280 400 540 820 110 1380
NOTE: The tables above are based on aerodrome elevation of 2000 ft; however, they can be used operationally at any aerodrome.
Example: Airport elevation:....................................................... 1500 ft Airport Temperature................................................. -20 oC Obstacle Height above airport elevation................ 800 ft Altimeter adjusted to airport QNH (on ground altimeter reads 1500 ft) Enter table with 800 ft and -20 oC and read 100 ft. So, when the airplane reaches the obstacle geometric height, the altimeter will read 1500 + 800 + 100 = 2400 ft.
Altimeter reads 2400 ft
800 ft
Elevation = 1500 ft T = -20 oC Altimeter reads 1500ft

OPERATIONS ENGINEERING COURSE
AUGUST 01, 2001 21 FOR TRAINING PURPOSES ONLY
3.2.3 ALTIMETER SETTINGS - QNH, QFE, QNE
Altimeters measure static atmospheric pressure and display to the pilot the altitude at which he would be flying in the International Standard Atmosphere. If an altimeter setting is 1013 mb / 29.92 inHg, the altimeter reads pressure altitude (QNE), whether in a standard or a non-standard atmosphere. An altimeter setting other than 1013 mb / 29.92 inHg moves the scale so that the altimeter indicates field elevation (QNH) or zero (QFE) when the aircraft touches the ground.
OPERATIONS ENGINEERING COURSE
AUGUST 01, 2001 22 FOR TRAINING PURPOSES ONLY
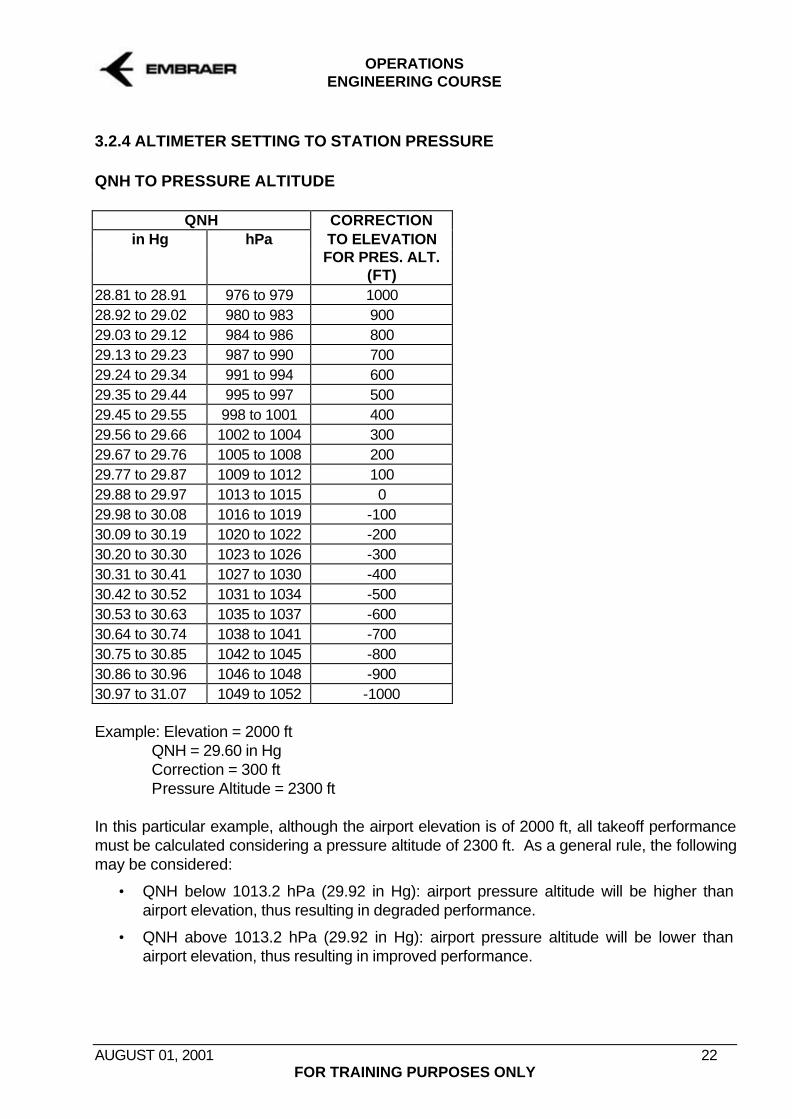
3.2.4 ALTIMETER SETTING TO STATION PRESSURE QNH TO PRESSURE ALTITUDE
QNH CORRECTION in Hg hPa TO ELEVATION
FOR PRES. ALT. (FT)
28.81 to 28.91 976 to 979 1000 28.92 to 29.02 980 to 983 900 29.03 to 29.12 984 to 986 800 29.13 to 29.23 987 to 990 700 29.24 to 29.34 991 to 994 600 29.35 to 29.44 995 to 997 500 29.45 to 29.55 998 to 1001 400 29.56 to 29.66 1002 to 1004 300 29.67 to 29.76 1005 to 1008 200 29.77 to 29.87 1009 to 1012 100 29.88 to 29.97 1013 to 1015 0 29.98 to 30.08 1016 to 1019 -100 30.09 to 30.19 1020 to 1022 -200 30.20 to 30.30 1023 to 1026 -300 30.31 to 30.41 1027 to 1030 -400 30.42 to 30.52 1031 to 1034 -500 30.53 to 30.63 1035 to 1037 -600 30.64 to 30.74 1038 to 1041 -700 30.75 to 30.85 1042 to 1045 -800 30.86 to 30.96 1046 to 1048 -900 30.97 to 31.07 1049 to 1052 -1000 Example: Elevation = 2000 ft QNH = 29.60 in Hg Correction = 300 ft Pressure Altitude = 2300 ft In this particular example, although the airport elevation is of 2000 ft, all takeoff performance must be calculated considering a pressure altitude of 2300 ft. As a general rule, the following may be considered:
• QNH below 1013.2 hPa (29.92 in Hg): airport pressure altitude will be higher than airport elevation, thus resulting in degraded performance.
• QNH above 1013.2 hPa (29.92 in Hg): airport pressure altitude will be lower than airport elevation, thus resulting in improved performance.

OPERATIONS ENGINEERING COURSE
AUGUST 01, 2001 23 FOR TRAINING PURPOSES ONLY
QFE TO STATION PRESSURE
QFE PRESSURE QFE PRESSURE in Hg hPa ALTITUDE in Hg hPa ALTITUDE
(ft) (ft)
31.01 1050 -989 25.55 865 4313 30.86 1045 -856 25.40 860 4468 30.71 1040 -723 25.25 855 4625 30.57 1035 -589 25.10 850 4781 30.42 1030 -454 24.96 845 4939 30.27 1025 -319 24.81 840 5097 30.12 1020 -184 24.66 835 5257 29.98 1015 -48 24.51 830 5417 29.83 1010 89 24.36 825 5579 29.68 1005 227 24.21 820 5740 29.53 1000 364 24.07 815 5903 29.38 995 503 23.92 810 6065 29.23 990 641 23.77 805 6230 29.09 985 781 23.62 800 6394 28.94 980 921 23.48 795 6561 28.79 975 1062 23.33 790 6727 28.64 970 1202 23.18 785 6895 28.50 965 1344 23.03 780 7063 28.35 960 1486 22.89 775 7233 28.20 955 1630 22.74 770 7402 28.05 950 1773 22.59 765 7574 27.91 945 1918 22.44 760 7745 27.76 940 2062 22.30 755 7920 27.61 935 2208 22.15 750 8095 27.46 930 2353 22.00 745 8269 27.32 925 2500 21.85 740 8442 27.17 920 2647 21.71 735 8619 27.02 915 2796 21.56 730 8796 26.87 910 2944 21.41 725 8975 26.73 905 3094 21.26 720 9154 26.58 900 3243 21.12 715 9335 26.43 895 3394 20.97 710 9516 26.28 890 3545 20.82 705 9699 26.14 885 3698 20.67 700 9882 25.99 880 3850 20.53 695 10068 25.84 875 4004 20.38 690 10253 25.69 870 4157 20.19 685 10439

OPERATIONS ENGINEERING COURSE
AUGUST 01, 2001 24 FOR TRAINING PURPOSES ONLY
3.3 AIRSPEED MEASUREMENT
To retain simplicity, airspeed indicators measure only the difference between total and static pressures, and display to the pilot the true airspeed he would be flying if he were at sea level (and only sea level) on a standard day (assuming zero error in the system). Other types of airspeed indicators designed to give the pilot a better indication of his true airspeed could be built. However, they would require the measurement of an additional atmospheric variable (temperature or density) and either complex mechanical gearing or electronic computation, both of which would likely degrade reliability and accuracy. Both total and static pressures may be measured in flight using a pitot-static system. Subtracting the static pressure from the total pressure yields dynamic pressure:
q = pt - ps (1) Where: q = Dynamic pressure pt = Total pressure ps = Static pressure The dynamic pressure may also be determined using the equations below:
• For incompressible regime: Vq 2
2×=
ρ (2)
• For compressible regime:
+⋅⋅
−+−⋅=
−12 1
11
γγ
ργ
γV
ppq
s
ss (3)
Where: q = Dynamic pressure
sp = Static air pressure
sρ = Static air density
γ = Adiabatic constant (1.4 for air).
V = True air speed It is possible to demonstrate that equation (3) above can also be written in the following format:
⋅+××≅ 22
411
2Mq Vsρ (3a)
Where: M = Mach number

OPERATIONS ENGINEERING COURSE
AUGUST 01, 2001 25 FOR TRAINING PURPOSES ONLY
True Airspeed (TAS) It is the real speed that the aircraft has in relation to the air. Equivalent Airspeed (EAS) Per definition it is the following:
O
sTASEASρρ
= (4)
Where: ρs = static air density ρo = standard air density at sea level It can be observed that at sea level and ISA, TAS = EAS ( sρ / oρ = 1).
It can also be observed that the incompressible dynamic pressure (q) is a function of EAS:
Vq 2
2×=
ρ = TAS
2
2×
ρ = EASO 2
2×
ρ (5)
As the aerodynamic forces are proportional to the incompressible dynamic pressure ( 22 22 EASSCVSCL oLL ⋅⋅⋅=⋅⋅⋅= ρρ , for example), we can conclude that the aerodynamic
forces have a direct relationship to the Equivalent Air Speed (EAS). So, ideally, the airspeed indicators should present EAS to the pilots in order to provide an indication directly related to the aerodynamic forces. Unfortunately, as we will see, it is not feasible to build an airspeed indicator that provides EAS. Using equation (5) above we can write:
O
qEAS
ρ2
= (6)
The equation above could be used to build an airspeed indicator if the air were incompressible. But, as in fact the air is compressible, equation (6) may not be used and another equation developed using (3) can be written:
−
+⋅⋅
−=
−
111
21
γγ
ργγ
so
s
pqp
EAS (7)
Equation (7) above could be used to develop an EAS airspeed indicator, but in addition to the measurement of the dynamic pressure ( st ppq −= ), it would require an additional
measurement of the static pressure ( sp ).

OPERATIONS ENGINEERING COURSE
AUGUST 01, 2001 26 FOR TRAINING PURPOSES ONLY
Calibrated Airspeed (CAS) For simplification, airspeed instruments on aircraft use equation (7) replacing sp with the sea
level, standard pressure op . The resulting speed is called Calibrated Air Speed (CAS):
−
+⋅⋅
−=
−
111
21
γγ
ργγ
oo
o
pqp
CAS (8)
It can be observed that at sea level and ISA conditions, TAS = EAS = CAS (as sρ = oρ and
sp = op ). Also, at sea level EAS = CAS (as sp = op ).
In addition, it can also be demonstrated that in the incompressible regime (M ≤ 0.4) the compressible effect is negligible and EAS = CAS. Indicated Airspeed (IAS) It is the reading on the airspeed indicator (knots), as installed in the airplane, uncorrected for instrument position error. The IAS is the most common speed available to the crew when working with performance charts and tables, and for flying at low speeds. Correcting the IAS for the position error results in the Calibrated Airspeed (CAS). See in the next figure, an example of relationship between the various airspeeds: Ground Speed (GS) It is the aircraft speed in relation to the ground.
GS = TAS + wind (tailwind is positive and headwind is negative)
SPEED
IAS = 300 kt
TAS=EAS=CAS= 298 kt POSITION ERROR CORRECTION
IAS = 300 kt
CAS = 302 kt
EAS = 295 kt
TAS = 400 kt
SEA LEVEL
20,000 FT POSITION ERROR CORRECTION
COMPRESSIBILITY CORRECTION
Density correction + 115 kt -7 kt
+2kt
-2 kt
ALTITUDE
OPERATIONS ENGINEERING COURSE
AUGUST 01, 2001 27 FOR TRAINING PURPOSES ONLY
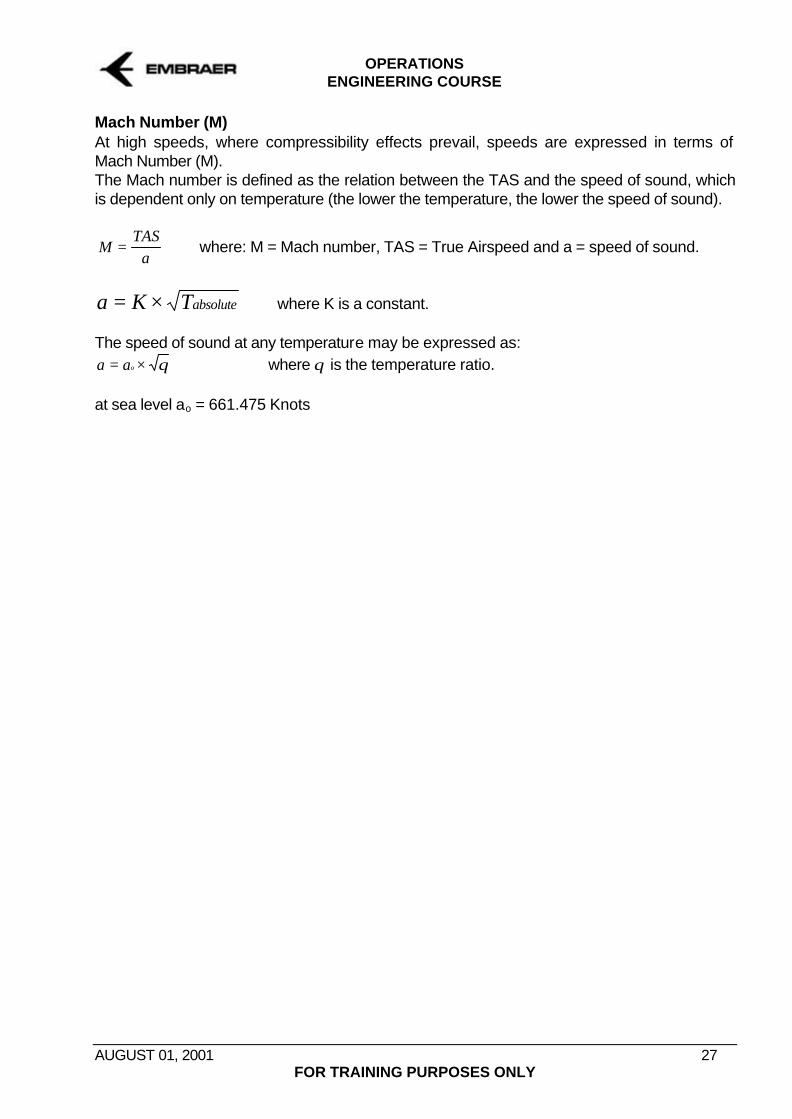
Mach Number (M) At high speeds, where compressibility effects prevail, speeds are expressed in terms of Mach Number (M). The Mach number is defined as the relation between the TAS and the speed of sound, which is dependent only on temperature (the lower the temperature, the lower the speed of sound).
MTAS
a= where: M = Mach number, TAS = True Airspeed and a = speed of sound.
a K Tabsolute= × where K is a constant. The speed of sound at any temperature may be expressed as: a ao= × θ where θ is the temperature ratio. at sea level ao = 661.475 Knots

OPERATIONS ENGINEERING COURSE
AUGUST 01, 2001 28 FOR TRAINING PURPOSES ONLY
3.4 TEMPERATURE MEASUREMENT
For the temperature analysis the following terms are defined:
Terms SAT (Static Air Temperature) and OAT (Outside Air Temperature) are synonyms and refer to the free air static (ambient) temperature without any perturbation.
Term TAT (Total Air Temperature) is the SAT plus the adiabatic temperature increase caused by the compressibility effect (air stagnation). The term RAT (Ram Air Temperature) is the TAT affected by the instrument error. Relationship between Temperatures:
]2
11[ 2MSATTAT
−+×= γ
For air the value of γ is 1.4, then:
]2.01[ 2MSATTAT ×+×=
ISA DEVIATION As explained earlier, the ISA atmosphere considers that the sea level standard temperature is 15°C, and that it decreases 1.9812°C per thousand feet up to the tropopause (36,080 ft or 11,000 m), where it stays constant at -56.5°C. The term ISA Deviation refers to a temperature deviation from the standard temperatures defined for ISA. Example: Pressure Altitude = 31000 ft and OAT = -40°C The ISA temperature at 31000 ft is: 15 - 1.9812 x 31 = -46.4°C The ISA deviation is: -40 - (-46.4) = +6.4°C I.e., the ISA deviation of +6.4°C means that the actual air temperature (OAT) at 31000 ft is 6.4°C warmer than the standard ISA temperature at that altitude (-40°C vs -46.4°C).
-56,5 0 15 AIR TEMPERATURE º C
11.000 m TROPOPAUSE
ALTITUDE
SEA LEVEL

OPERATIONS ENGINEERING COURSE
AUGUST 01, 2001 29 FOR TRAINING PURPOSES ONLY
3.5 PERFORMANCE CALCULATION ON NON-STANDARD ATMOSPHERE
The International Standard Atmosphere - ISA is an atmosphere model used by aircraft manufacturers to generate aircraft performance data. As actual atmospheric conditions may differ from those established by ISA, aircraft performance data must be made available for non-standard conditions. In order to fulfill this requirement, aircraft manufacturers publish performance data as a function of pressure altitude and actual air temperature (OAT) or ISA deviation. Air density variations corrections are not necessary, because it is implicitly considered when pressure and temperature are defined (remember that air is considered a perfect gas, so that only two of the three variables pressure, temperature and density are needed to define the third variable). Let's say for example that we have an airport that is located 2000 ft above sea level (geometric height), and that on a particular day the QNH adjustment at this airport is 1020 hPa and the actual air temperature (OAT) is 30°C:
• The altitude correction for a QNH of 1020 hPa is -200 ft. So, the pressure altitude of this airport on this particular day is: 2000 - 200 = 1800 ft.
• For a pressure altitude of 1800 ft the standard (ISA) temperature is: +15 - 1.9812 x 1.8 = +11.4°C. So, the ISA deviation is: 30 - 11.4 = +18.6°C.
• For this airport on this particular day, the aircraft performance must be calculated using the manufacturer's performance charts for a pressure altitude of 1800 ft and a temperature of 30°C (or ISA deviation +18.6°C).

OPERATIONS ENGINEERING COURSE
AUGUST 01, 2001 30 FOR TRAINING PURPOSES ONLY
4. JET ENGINES
A jet engine is a machine designed for the purpose of creating large volumes of high-velocity exhaust gases. It does this in order to produce thrust needed to overcome the aerodynamic drag of an airplane.
The jet engines also produce electric power, hydraulic power, pneumatic power for air conditioning and pressurization, and hot air for icing protection. 4.1 ENGINE THRUST RATINGS
The lack of better heat-resistant and stress-resistant materials restricts engine limits. To obtain a reasonable life expectancy of even the most stressed components, the engine has to be throttled, i.e., engine thrust must be kept within certain limits. The main restrictions imposed upon the engine are the limit of rotor speed, temperature, pressure and operation time. When maximum power must be developed from the engine, it is necessary to observe restrictions to the thrust settings in order to avoid exceeding the engine design limitations. These thrust setting limitations are referred to as thrust setting ratings.
The figure below shows how the life expectancy of an engine deteriorates with increasing thrust (thus increasing stress):
ENGINE LIFE
Max. Takeoff Max.
Continuous Max. Cruise
INCREASING THRUST

OPERATIONS ENGINEERING COURSE
AUGUST 01, 2001 31 FOR TRAINING PURPOSES ONLY
Different thrust ratings apply at different times during flight. The following is a description of the current standard thrust ratings for jet engines and its terminology on the EMB-145: TAKEOFF THRUST (EMB-145: T/O-1) It is used for takeoff only. This rating is time-limited to a maximum of 5 minutes (10 minutes takeoff power is permitted for some airplanes). This thrust rating is specified in the Airplane Flight Manual (AFM). DERATED TAKEOFF THRUST (EMB-145: ALT/TO-1) It is an engine rating lower than the takeoff thrust, intended to allow a longer engine life (due to lower turbine temperatures). It is also limited to 5 minutes and is specified in the AFM with specific performance charts. GO-AROUND THRUST (INFLIGHT TAKEOFF THRUST) - (EMB-145: T/O-1) The amount of thrust is the same as for the takeoff case, but the N1% setting is different because the effect of the airplane’s velocity during go around is taken into consideration. Go-around thrust is also time-limited to 5 minutes. It is used in case of a missed approach, where maximum power is needed in order to provide maximum climb gradients. MAXIMUM CONTINUOUS THRUST (EMB-145: CON) It represents the highest thrust level for continuous use. This is a special thrust rating, sometimes called MCT or CON, and has no time limitation. Maximum Continuous Thrust is to be used whenever pilot judgment indicates it is necessary for safety reasons (1 engine inoperative, severe icing, etc). Takeoff, Go Around and Maximum Continuous Thrust are certified ratings, i.e. they have to be approved by the certification authorities. MAXIMUM CLIMB THRUST (EMB-145: CLB) It is usually below the maximum continuous rating (for some airplanes, maximum continuous thrust and maximum climb thrust are the same). This thrust rating, sometimes called MCLT, has no time limit. It is intended for use during the following normal operations (all engines operating): climb to cruise flight level, step climb and for the acceleration to cruise speed. MAXIMUM CRUISE THRUST (EMB-145: CRZ) This thrust rating has no time limit. It is the maximum thrust available for normal cruise with all engines operating.

OPERATIONS ENGINEERING COURSE
AUGUST 01, 2001 32 FOR TRAINING PURPOSES ONLY
4.2 THRUST TOLERANCE - MINIMUM, AVERAGE AND MAXIMUM THRUST
It is obvious that engines of a specific type cannot be 100% identical after assembly. There are small differences between engines of the same type due to manufacturing tolerances, so that for a given power setting, thrust produced is not the same for every engine.
Minimum thrust is the lowest level of thrust (lower limit) of the acceptable variation range. The manufacturer’s guaranteed minimum engine thrust conservatively represents the output of all engines of the same type. For this reason minimum thrust is used in performance calculations where performance is critical, such as takeoff.
Average thrust is the thrust of the average engine (an engine having thrust in the middle of the thrust variation range). Average thrust is used in performance calculations where performance is not critical, such as flight planning.
Maximum Thrust: Similar to Minimum Thrust, Maximum Thrust is the upper limit of the acceptable variation range. It is used on those performance calculations where thrust increase represents degradation of performance, like minimum control speeds determination (VMCG and VMCA). 4.3 FACTORS AFFECTING ENGINE THRUST
• Temperature • Altitude • Speed • Humidity • Water Injection • Bleed Air extraction • Fuel Temperature
THRUST
AVERAGE THRUST
THRUST
MINIMUM THRUST
MAXIMUM THRUST

OPERATIONS ENGINEERING COURSE
AUGUST 01, 2001 33 FOR TRAINING PURPOSES ONLY
4.3.1 TEMPERATURE
Temperature can affect engine thrust in two ways. The first consideration is that as temperature increases the air density decreases, reducing engine thrust. The second effect of temperature is related to the thrust ratings. As explained earlier, the thrust is limited in order to allow a longer life expectancy to the engine. Commercial jet engines are throttled so that 2 regions are defined: Flat Rated: On this region the thrust is constant, not changing with the temperature. This region is defined mainly by limitations due to engine internal stresses (high pressure, centrifugal forces).
Temperature Limited: On this region the engine has a constant temperature margin between the takeoff thrust EGT (Exhaust Gas Temperature) and the engine temperature limit. May also be expressed as ITT (Inter turbine temperature) margin. If an engine operates at a temperature higher than the flat rated temperature, its available thrust decreases with temperature. Takeoff N1 and EPR variation with temperature: The pilot sets a thrust rating by moving the throttles to a target position. Depending on engine manufacturer's philosophy, the target position may be defined by either Engine Pressure Ratio - EPR (typical on Pratt&Whitney engines), or Percentage of Fan Speed - N1% (typical on GE, CFM and Rolls-Royce engines). One important point to consider is that EPR is a direct measurement of thrust, i.e., at a given altitude a fixed EPR provides a constant thrust independently of temperature. It is also valid to say that at a given altitude the higher the EPR is, the higher the thrust will be.
THRUST
TAT Flat Rated - Pressure limited
EGT MARGIN
Temperature limited

OPERATIONS ENGINEERING COURSE
AUGUST 01, 2001 34 FOR TRAINING PURPOSES ONLY
On the other hand, the same affirmative is not valid for N1%. At a given altitude a difference of N1% between two temperatures does not necessarily means that the higher N1% is providing more thrust. Typical N1%, EPR and thrust variation with temperature and altitude is shown in the figures below:
4.3.2 ALTITUDE
As an aircraft climbs, the effect of the decreasing air pressure on the thrust is not totally compensated by the decreasing temperature. Thus, the thrust decreases with increasing altitude. Since the air temperature remains constant at the tropopause (~36000 ft) up to an altitude of about 80.000 ft., thrust decreases with altitude more rapidly in the tropopause.
THRUST
ALTITUDE
Tropopause
TEMPERATURE
N1%
TEMPERATURE
EPR
Sea Level
Above Sea Level
Sea Level
Above Sea Level
TEMPERATURE
THRUST
Sea Level
Above Sea Level

OPERATIONS ENGINEERING COURSE
AUGUST 01, 2001 35 FOR TRAINING PURPOSES ONLY
4.3.3 SPEED
For a constant EPR (or N1%) the thrust equation F m V V= × −& ( )1 2 will be adversely affected
by a speed increase (V1 is the air exhaust speed, and V2 is the air inlet speed). Increasing the engine inlet speed (V2) results a Speed Effect that decreases the thrust. But V2 increase also causes Pt2 (inlet total pressure) to increase, so that a constant EPR will result in a
greater Pt7 (outlet total pressure). The greater Pt7 allows a larger gas expansion in the nozzle and subsequent greater V1, increasing the thrust (Ram Effect).
4.3.4 BLEED AIR EXTRACTION
Turning the packs off allows higher thrust because energy (bleed air) is not being extracted from the engines to the packs, and hence a greater amount of energy is being used to produce thrust. For some aircraft types, packs off takeoffs are used if maximum allowable thrust is needed for the required takeoff weight.
Thermal engine and wing anti-ice systems (common on jet engined aircraft) require large bleed air extractions, resulting in considerable thrust reductions. As a result, two sets of performance charts are usually provided for aircraft with thermal anti-icing systems installed: one for performance with anti-ice systems off and another for performance with anti-ice systems on.
Turboprop aircraft, which are usually fitted with pneumatic boots for anti-icing protection, do not have performance penalties when the boots are operating, as its bleed air extraction is negligible. 4.3.5 POWER EXTRACTION
Mechanical power is extracted from the engines for operation of hydraulic pumps and electric generators. This relatively small power extraction is already taken into account in thrust calculations as well as in the aircraft performance. 4.3.6 AIR HUMIDITY and FUEL TEMPERATURE may be disregarded, as they have negligible effect on engine thrust.

OPERATIONS ENGINEERING COURSE
AUGUST 01, 2001 36 FOR TRAINING PURPOSES ONLY
4.4 AUTOMATIC TAKEOFF THRUST CONTROL SYSTEM (ATTCS)
Automatic Takeoff Thrust Control System (ATTCS), also known as Automatic Power Reserve (APR), is a system designed for saving engine life, derating the engine thrust and only allowing maximum thrust in case of emergency. During takeoff, if an engine failure is detected, the ATTCS automatically resets thrust on the remaining engine from Alternate (derated) Takeoff thrust to Maximum Takeoff thrust. In addition, depending on takeoff thrust setting and ambient conditions, the FADEC may generate an ECS OFF signal to close the Pack Valves, further increasing the available thrust.

OPERATIONS ENGINEERING COURSE
AUGUST 01, 2001 37 FOR TRAINING PURPOSES ONLY
5. TAKEOFF PERFORMANCE
5.1 TAKEOFF PROFILE
The takeoff consists of the following phases:
• Takeoff Distance: Roll, failure of the critical engine immediately before V1, rotation, lift-off and V2 at 35 ft height, using takeoff thrust on all engines up to the engine failure speed, and then takeoff thrust on operating engines. Takeoff flaps are set since the beginning of the takeoff roll.
• 1st segment: Begins at the point where the aircraft is at V2 and 35 ft high and ends at the point where the landing gear is fully retracted, with speed equal V2, critical engine inoperative, takeoff thrust on operating engines and takeoff flaps.
• 2nd segment: From the point where the landing gear is fully retracted up to the point at which the aircraft levels off for flap retraction. The level off height depends on obstacles and must be at least 400 ft above the runway. Throughout the 2nd segment, with the critical engine inoperative, takeoff thrust on operating engines and takeoff flaps are maintained.
• 3rd segment: From the end of the 2nd segment, up to the point at which the climb configuration (flaps up, final segment climb speed) is reached, with the critical engine inoperative, and takeoff thrust on operating engines. This segment is used for level flight, acceleration and flap retraction at a height of at least 400 feet.
• 4th. segment: From the point at which the climb configuration is reached, up to a 1500 ft above the runway (or more if required for obstacle clearance). Flaps up and Maximum Continuous Thrust on operating engines is used throughout the 4th segment.
TAKEOFF DISTANCE
TAKEOFF THRUST
TAKEOFF FLAPS
Acceleration to V2
1st Segment
T.O. THRUST
T.O. FLAPS
V2
Gear Retraction
2nd Segment
T.O. THRUST
T.O. FLAPS
V2
Gear Up
3rd Segment
T.O. THRUST
Flap Retraction
Acceleration to
FINAL CLIMB SPEED
4th / Final Segment
Max Continuous THRUST
FLAPS UP
CLIMB SPEED
ENROUTE CLIMB
ALL ENGINES
VEF
35 ft
ONE ENGINE INOPERATIVE
35 ft V2
GEAR UP
GROSS PATH
35 ft
NET PATH
MINIMUM HEIGHT 400 FT
Net Flight Path = Gross Path - 0.8%
1500 ft
TAKEOFF PROFILE

OPERATIONS ENGINEERING COURSE
AUGUST 01, 2001 38 FOR TRAINING PURPOSES ONLY
5.2 TAKEOFF SPEEDS DEFINITIONS
V1, VR and V2 are indicated airspeeds (IAS) and are the speeds used by the pilot during takeoff. The other speeds are certification speeds used for takeoff performance calculations.
These certification speeds are necessary to make sure that the operational speeds are safe from the standpoint of controllability, braking and tire speed. These constraints are all common sense. Take VLOF ≤≤ VMAX TIRE, for example. This is to ensure that ground roll does no exceed the tire limit; or V1min ≤≤ V1: this grants that, should an engine fail close to V1, directional control can be maintained if the pilot elects to continue the take off; or 1.1VMCA ≤≤ V2: this grants that adequate engine-out directional control exists in the airborne part of the take off. And so on. VEF ENGINE FAILURE SPEED - The speed at which the critical engine is assumed
to become inoperative. May not be less than VMCG.
VMCG MINIMUM CONTROL SPEED ON THE GROUND - The speed during the takeoff ground run at which, when the critical engine is made suddenly inoperative and if the takeoff is continued, it is possible to maintain directional control of the airplane using primary aerodynamic controls only (nose wheel steering not allowed), without deviating from the runway centerline by more than 30 ft.
VMCG VEF
V1 VR V2
V1min
VMCG ≤≤ VEF
V1min ≤≤ V1 ≤≤ VR
VR ≥≥ 1.05VMCA
VEF VEF VLOF VMU
VLOF ≥≥ 1.10VMU all eng
VLOF ≥≥ 1.05VMU eng out
V1 ≥≥ VMBE VLOF ≥≥ VMax Tire
V2 ≥≥ 1.20VS
or V2 ≥≥ 1.13VS-
V2 ≥≥ 1.1VMCA
35 ft

OPERATIONS ENGINEERING COURSE
AUGUST 01, 2001 39 FOR TRAINING PURPOSES ONLY
V1min MINIMUM V1 - The speed at which the aircraft will be after the pilot recognizes the critical engine failure that occurred at VEF and takes the first action to bring the aircraft to a stop.
V1 DECISION SPEED - The speed at which, following a failure of one engine at VEF, pilot's decision to continue or not the takeoff will result in:
- A takeoff distance to the screen height at V2 speed, that will not exceed the available takeoff distance; or
- The distance to bring the aircraft to a full stop that will not exceed the available accelerate-stop distance.
V1 is selected to ensure it is: • Greater than or equal to V1min • Less than or equal to VR • Less than or equal VMBE
Piloting techniques define that the takeoff should be continued unless the stopping maneuver has already been initiated at V1.
VR ROTATION SPEED - The speed at which the pilot initiates action to raise the nose gear off the ground. It may not be less than V1, or 1.05 VMCA.
V2 TAKEOFF CLIMB SPEED - The speed attained at the screen height (e.g. 35 ft), assuming one engine inoperative and rotation initiated at VR.
V2 is selected to ensure it is: • Greater than or equal to 1.1 VMCA • Greater than or equal to 1.2 VS (or 1.13 Vs-1g) • Greater than or equal to VR
VMBE MAXIMUM BRAKE ENERGY SPEED - The highest speed from which the airplane may be brought to a stop without exceeding the maximum energy absorption capability of the brakes. V1 may not exceed VMBE.
VMU MINIMUM UNSTICK SPEED - The speed at which at and above it the aircraft can safely lift off the ground and continue the takeoff without showing any hazardous characteristics. VMU is normally defined when the elevator has enough power to rotate the aircraft to an attitude that it can get airborne. An aircraft is defined as geometry limited when the tail contacts the ground before the attitude that would generate enough lift to get airborne is reached. In this case, the aircraft will have the tail skidding the ground until it accelerates to a higher speed at which the geometry limited attitude provides enough lift to get airborne.
VMAX TIRE MAXIMUM TIRE SPEED - The maximum ground speed for which the tires were structurally certified. Above VMAX TIRE the strength limits of the tires are exceeded and they may not resist to the centrifugal forces (caused by high wheel spinning) they are subject to.
VLOF LIFT-OFF SPEED - The speed at which the airplane becomes airborne (i.e., no contact with the runway). VLOF cannot be less than 1.10 VMU (All Engines Operating, AEO) or 1.05 VMU (One Engine Inoperative, OEI), except for

OPERATIONS ENGINEERING COURSE
AUGUST 01, 2001 40 FOR TRAINING PURPOSES ONLY
geometry limited aircraft where VLOF cannot be less than 1.08 VMU (AEO) or 1.04 VMU (OEI). In addition, VLOF cannot be less than VMAX TIRE.
VMCA MINIMUM CONTROL SPEED ON THE AIR - The speed, at which, when the critical engine is suddenly made inoperative, it is possible to maintain control of the airplane with that engine still inoperative, and maintain straight flight with an angle of bank of not more than 5 degrees.
VFR FLAP RETRACTION SPEED - Is the speed (or speed schedule) at which the takeoff flaps retraction should be initiated during the 3rd segment in case of engine failure during takeoff. VFR is normally defined as V2 + ∆, where the ∆ speed varies as a function of the initial takeoff flap setting. For All Engines Operating (AEO) takeoff, VFR is just a reference of the minimum speed at which the flaps retraction should be initiated.
VFS TAKEOFF FINAL SEGMENT CLIMB SPEED - Is the speed to be achieved during final segment, with landing gear up and flaps retracted. Must be greater than or equal to 1.25 VS (or 1.18 Vs-1g).
VS STALL SPEED - The minimum speed reached during the stall maneuver as described below.
The flight tests for determining the stall speed are performed with the most adverse CG position and idle thrust, decreasing the aircraft airspeed and increasing the angle of attack by applying elevator control so that the airspeed reduction do not exceed more than one knot per second.
The airplane is considered to be fully stalled when any one or a combination of the characteristics listed below occurs to give the pilot a clear and distinctive indication that he should stop any further increase in angle of attack. The stall speed is defined as the minimum speed reached during the maneuver.
a) The pitch controls reaches the aft stop and is held full aft for two seconds, or until the pitch attitude stops increasing, whichever occurs first.
b) An uncommanded, distinctive and easily recognizable nose down pitch that cannot be readily arrested.
c) The airplane demonstrates an unmistakable, inherent aerodynamic warning of a magnitude and severity that is a strong and effective deterrent to further speed reduction.
d) The activation point of a stall identification device that is strong and effective deterrent to further speed reduction (stick pusher).
VS-1g 1-G STALL SPEED - Is the stall speed corrected for 1-g flight conditions.
The VS stall speed as defined above is the minimum airspeed attained in the stall maneuver. For many high speed swept wing aircraft this has resulted in the VS being defined with a flight load factor considerably less than one, which has led to inconsistent and non-repeatable reference stall speeds. Additionally, because the minimum speed in the maneuver typically occurs near the point at which the airplane spontaneously pitches nose down or where the pilot defines the level of buffet as deterrent, inconsistencies can also be introduced into the definition of the minimum speed by pilot technique and judgment.

OPERATIONS ENGINEERING COURSE
AUGUST 01, 2001 41 FOR TRAINING PURPOSES ONLY
Since FAR/JAR Part 25 defines operating speeds as multiples of the VS stall speed, the resulting operating speed margins to stall are not representative of the actual lift margin available (i.e., the margin to the speed at which wing lift alone can support the weight of the airplane in 1-g flight). To remedy this situation, procedures and requirements that are interpreted as being equivalent to the current stall-related regulations have been developed to define a reference stall speed that exists when the wing is generating maximum usable lift in a 1-g flight condition; this speed is referred to as the 1-g stall speed (VS-
1g).
The figure below represents a sample flight test result that shows the determination of the VS stall speed. The VS-1g stall speed is determined by correcting VS assuming 1-g flight conditions.
As the VS-1g is higher (faster) than VS, new speed margins to the operating speeds where defined, keeping the same safety levels:
V / VS V / VS-1g
Takeoff Climb Speed - V2 ≥1.2 ≥1.13
Takeoff Final Segment Climb Speed - VFS ≥1.25 ≥1.18
Landing Reference Speed - VREF ≥1.3 ≥1.23
Approach Climb Speed - VAPPCLB or VGA ≤1.5 ≤1.4

OPERATIONS ENGINEERING COURSE
AUGUST 01, 2001 42 FOR TRAINING PURPOSES ONLY
5.3 TAKEOFF DISTANCE DEFINITIONS:
5.3.1 ALL ENGINES TAKEOFF DISTANCE
Is the distance from the start of takeoff up to the point at which the airplane is 35 feet above the takeoff surface, with All Engines Operating (AEO).
5.3.2 ACCELERATE-GO DISTANCE (AGD)
The accelerate-go distance (AGD) is the distance necessary to accelerate the airplane to VEF with All Engines Operating (AEO), and then continue the takeoff with One Engine Inoperative (OEI) to a screen height of 35 ft above the runway surface under the assumption of the critical engine failure at VEF. 5.3.3 ACCELERATE-STOP DISTANCE (ASD)
The accelerate-stop distance (ASD) is the greater of:
• Distance required to accelerate the airplane to V1, maintain this speed for a period of 2 seconds, and then decelerate to a complete stop with All Engines Operating (AEO).
• Distance required to accelerate the airplane to VEF with AEO, then accelerate to V1 with One Engine Inoperative (OEI), maintain this speed for a period of 2 seconds, and then decelerate to a complete stop (OEI).
Note: Modern certification rules require that aircraft acceleration should be considered during the 2 seconds period mentioned above, instead of constant speed. EMB-135/140/145 certification uses the old rules, i.e., 2 seconds of constant speed at V1.
The aircraft deceleration considers the use of Maximum Manual Braking and Speedbrakes extended. Reverse thrust is not considered for dry runway accelerate-stop distance, but may be used for wet or contaminated runways.
The calculated accelerate-stop distances in the Airplane Flight Manual (AFM) account for demonstration times for transitioning the aircraft to the rejected takeoff configuration (idle thrust, full brakes and full spoilers). The following time intervals are considered:
• Time to recognize the critical engine failure that occurred at VEF and take the first action to bring the aircraft to a stop (throttles to idle). Demonstrated in flight tests, but may not be less than 1 second.
• 2 seconds interval at V1.
• Time interval between throttles to idle and full brakes application, demonstrated in flight tests.
• Time interval between full brakes application and spoilers extension, also demonstrated in flight tests.
Note: Calculated ASD considers that the engine thrust is kept constant during the engine spool down time (time interval between throttles to idle and actual idle thrust).

OPERATIONS ENGINEERING COURSE
AUGUST 01, 2001 43 FOR TRAINING PURPOSES ONLY
5.3.4 CLEARWAY
The clearway is an area beyond the runway end with the following characteristics: • minimum 500 feet wide; • centrally located around the extended centerline of the runway; • must be under control of airport authorities; • no obstacle protruding above 1.25% slope plane, except threshold lights located at the
sides of runway with a height lower than 26 feet.
Takeoff field length calculation allow the aircraft to reach the 35 ft screen height position above the clearway area, provided at least one half of the flare distance between VLOF and V2 is made above the runway.
5.3.5 STOPWAY
The stopway is an area beyond the runway end with the following characteristics: • must be as wide as the runway; • centered around the extended centerline of the runway; • must be able to support the airplane weight, without causing structural damage to the
airplane; • designated by the airport authorities for use in decelerating the airplane during an aborted
takeoff.

OPERATIONS ENGINEERING COURSE
AUGUST 01, 2001 44 FOR TRAINING PURPOSES ONLY
5.3.6 TAKEOFF RUN AVAILABLE (TORA): is the runway length.
5.3.7 TAKEOFF DISTANCE AVAILABLE (TODA): is the runway length plus available clearway.
5.3.8 ACCELERATE STOP DISTANCE AVAILABLE (ASDA): is the runway length plus available stopway.
5.4 TAKEOFF WEIGHT LIMITATIONS
There are seven factors that must be considered for determining the airplane takeoff weight limitation:
An airplane shall takeoff only if its actual weight does not exceed the weights for which requirements above are met, in accordance with the Airplane Flight Manual (AFM). All corrections for pressure altitude, outside air temperature, runway slope, wind components and obstacle clearance must be taken into account for the runway in use at the time of the takeoff.
LDA
TORA
ASDA
TODA
SWY CWY

OPERATIONS ENGINEERING COURSE
AUGUST 01, 2001 45 FOR TRAINING PURPOSES ONLY
5.5 FIELD LENGTH LIMITED TAKEOFF WEIGHT
The Takeoff Field Length is the longer of:
a) Accelerate-Go Distance (AGD): V2
b) Accelerate-Stop Distance (ASD):
c) 115% of the All Engines Takeoff Distance:
VR VLOF
BRAKE RELEASE
15%
35 ft
ALL ENGINES ACCELERATION
BRAKE RELEASE 35 FT
VEF V1 VR VLOF
ALL ENGINES ACCELERATION
ONE ENGINE INOP ACCELERATION
V = 0 BRAKE
RELEASE VEF V1
ALL ENGINES ACCELERATION

OPERATIONS ENGINEERING COURSE
AUGUST 01, 2001 46 FOR TRAINING PURPOSES ONLY
5.5.1 EFFECT OF V1 SPEED ON TAKEOFF WEIGHT (FIXED RUNWAY LENGTH)
For a fixed runway length an increase in V1 will result in a higher continued takeoff weight (Accelerate-Go) due to the reduction of time and distance for acceleration between VEF and VR, and a lower rejected takeoff weight (Accelerate-Stop) due to the greater amount of kinetic energy to be absorbed during the braking maneuver. Similarly, a lower V1 results in a lower continued takeoff weight (Accelerate-Go) and a higher rejected takeoff weight (Accelerate-Stop).
The intersection of the “Rejected takeoff” and the “Continued takeoff” lines defines the maximum airplane weight that will satisfy both Accelerate-Go and Accelerate-Stop criteria. If this weight is less than the all-engine field length limit weight, it then becomes the Field Length limiting weight for the takeoff.
The takeoff is then described as being at a “Balanced Field Limit Weight” because the “GO” and “STOP” distances are equal. It is characterized by the fact that the airplane will require the entire runway length to reach 35 ft or to stop if the RTO is initiated at V1. 5.5.2 BALANCED V1 SPEED
Airplane weight
35 ft BRAKE RELEASE
GO
STOP

OPERATIONS ENGINEERING COURSE
AUGUST 01, 2001 47 FOR TRAINING PURPOSES ONLY
5.5.3 BALANCED FIELD LENGTH
Balanced Field Length conditions means that the Accelerate-Go distance is equal to the Accelerate-Stop distance.
If an engine failure occurs, in a typical operational situation where the actual airplane weight is less than the Field Length Limit Weight, the pilot can either continue or reject the takeoff (depending on when the engine failure occurred relative to V1), and achieve 35 ft or stop before reaching the end of the runway. Although the takeoff was planned using “balanced V1”, there was excess runway available for both the GO and STOP cases.
In either case, the associated V1 speed is correctly referred to as a “Balanced V1 Speed”. However, many pilots assume that they are field length limited because they are using balanced V1 speed, which is obviously not the case. 5.5.4 UNBALANCED FIELD LENGTH
Standard - For a standard takeoff (balanced V1), the horizontal distance that the airplane uses to climb to 35 ft is equal to the distance required to stop the airplane from V1.
Clearway - If clearway is available, the point where the airplane reaches 35 ft can be over that clearway. This allows a higher weight because of the greater distance available to reach 35 ft. The higher weight requires a lower V1 to still be able to stop on the available runway. In this case we say that the Field Length and V1 is unbalanced.
Stopway - If stopway is available, the distance to stop the airplane from V1 is increased. This permits a higher takeoff weight, but it requires a higher V1 to ensure that the airplane can still climb to 35 ft by the end of the runway. In this case we say that the Field Length and V1 is unbalanced.

OPERATIONS ENGINEERING COURSE
AUGUST 01, 2001 48 FOR TRAINING PURPOSES ONLY
Where: V1 OPT is the optimized V1 calculated using both clearway and stopway.
On the graph above, V1 CLW, V1 SWY and V1 OPT are unbalanced V1. The maximum Field Length Limited takeoff weight is WOPT, and V1 OPT may be higher or lower than V1 BAL depending on which factor affects more the increase in weight: clearway or stopway.
As a general rule, V1 CWY will always be lower than V1 BAL, and V1 SWY will always be higher than V1 BAL (clearway use decreases the V1 and stopway use increases V1).
Rejected Takeoff with stopway
Continued Takeoff with clearway
Continued Takeoff without clearway
Rejected takeoff without stopway
V1
WEIGHT
V1 V1 V1 V1 CWY BAL OPT SWY
WSWY
WCWY
WBAL
WOPT

OPERATIONS ENGINEERING COURSE
AUGUST 01, 2001 49 FOR TRAINING PURPOSES ONLY
5.5.5 MAXIMUM AND MINIMUM VALUES FOR V1
On the figure below it is possible to observe that there is a range of valid V1 that can be used if the actual takeoff weight is lower than the Field Length Limited weight.
The use of the minimum V1 on the range will result in the aircraft reaching the 35 ft screen height (accelerate-go) at the end of the runway, but stopping the aircraft from V1 (accelerate-stop) before the end of the runway.
The use of the maximum V1 on the range will result in the aircraft reaching the 35 ft screen height (accelerate-go) before the end of the runway, but stopping the aircraft from V1 (accelerate-stop) at the end of the runway.
The use of a V1 between the maximum and minimum V1 values will result in accelerate-go and accelerate-stop occurring before the end of the runway.
5.5.6 FIXED V1
In order to simplify the pilot procedures regarding takeoff speeds determination, some airlines prefer to use a Fixed V1 concept.
Let's say for example that an airline has decided to always use a V1 equal to VR (V1/VR = 1.0). In this case the pilot procedure for determining V1 is simplified (V1 will always be equal to VR, no matter which is the actual takeoff weight, temperature or wind), but, as a result, the Field Limit Weight may be penalized (see figure below).

OPERATIONS ENGINEERING COURSE
AUGUST 01, 2001 50 FOR TRAINING PURPOSES ONLY
5.6 V1min LIMITED TAKEOFF WEIGHT
On unbalanced takeoff performance calculations, where a range of V1 may be used, it may occur that the optimum V1 results lower than the V1 MIN. This occurs more frequently on wet and slippery takeoff calculations, where V1 is low due to the poor accelerate-stop performance.
When this occurs, it is necessary to select a higher V1/VR ratio, thus penalizing the takeoff weight. In this case we say that the takeoff weight is V1min Limited.
In some situations it is possible to overcome the V1min limitation by reducing the aircraft thrust, i.e., increase the takeoff limited weight by decreasing the takeoff thrust. This is possible because a reduction of takeoff thrust (use of derated thrust) will result in a reduction of VMCG, thus reducing V1min. The figure below shows a certain field length region where the reduction of takeoff thrust is beneficial to the maximum takeoff weight.
Full Thrust V1min
Derated Thrust V1min
LENGTH
WEIGHT
In this region derated thrust results in higher weights than full thrust

OPERATIONS ENGINEERING COURSE
AUGUST 01, 2001 51 FOR TRAINING PURPOSES ONLY
5.7 WET, CONTAMINATED AND SLIPPERY RUNWAYS
Wet Runway: is defined as a thoroughly soaked pavement, shiny in appearance and depth less than 1/8 inch (3 mm) of water. A wet runway is not considered a contaminated runway.
Until 1998 the FAA did not require wet runway accountability, but it is now required for airplanes certified post FAR 25 Amendment 25-92, i.e., applicable for the ERJ-170/190. JAA requires wet runway performance accountability for all aircraft models.
Contaminated Runway: a runway is considered as contaminated when more than 25% of the surface to be used is covered by standing water more than 1/8 inch (3 mm) deep. Runways covered by snow and slush are also considered contaminated, depending on the snow/slush depth, as it will be seen later.
Slippery Runway: a runway is considered slippery if it has an accumulation of compacted snow or ice, with decreased braking efficiency during aircraft deceleration. Retarding forces during aircraft acceleration (caused by precipitation drag) are negligible on slippery runways.
Slippery and contaminated performance accountability are required by JAR, but not by FAR. FAA allows the operators to use it at their discretion (see FAA AC 91-6A and Draft AC 91-6B).
If the runway coverage requirements above are not met, but if contaminants are lying on that portion of the runway where the high speed part of the takeoff roll will occur, it may be appropriate to consider the runway contaminated (or slippery/wet). 5.7.1 IMPACT ON FIELD LENGTH LIMIT
Contaminated runways result in two effects on the takeoff distances:
• Lower aircraft braking friction due to the water/slush/snow accumulated on the runway, causing an increase on the distance required to decelerate the aircraft to a full stop from V1.
• Increased precipitation drag (landing gear displacement drag and spray impingement drag) due to the water/slush/snow accumulated on the runway, causing an increase on the distance to accelerate to V1, accelerate-go distance and the AEO takeoff distance, but decreasing the distance required to decelerate the aircraft to a full stop from V1.
Wet and slippery runways have no precipitation drag, so the distance required to accelerate to V1 speed is not affected, the same occurring to the accelerate-go and AEO takeoff distance. But, the distance to decelerate to a full stop from V1 is greatly increased due to the lower aircraft braking friction associated to a wet/slippery runway.
Therefore, for a certain fixed takeoff weight the takeoff distances will increase, thus also affecting the obstacle limited weights.
Due to the reasons explained above, the V1 is recalculated, and typically the V1 reduction will be greater on a wet/slippery runway than on a contaminated runway.
V1min problems may occur due to the V1 reductions associated with the wet/slippery/contaminated runways, consequently requiring further takeoff weight reductions.

OPERATIONS ENGINEERING COURSE
AUGUST 01, 2001 52 FOR TRAINING PURPOSES ONLY
5.7.2 SCREEN HEIGHT AT END OF RUNWAY
In order not to excessively penalize the operators when operating on wet, slippery or contaminated runways, JAA allows a screen height of 15 ft at the end of the takeoff distance and accelerate-go distance, and clear the obstacles by 15 ft (net path), instead of 35 ft of the dry runway performance. 5.7.3 AIRCRAFT BRAKING COEFFICIENT
The aircraft braking coefficient used for generating the AFM dry takeoff performance charts is obtained through flight tests. It is a function of aircraft ground speed and its average value is typically near 0.40.
For wet runways, JAR 25x1591 provides a correction factor as a function of ground speed to be applied to the dry runway aircraft braking coefficient. Typically, the wet runway average braking coefficient is near 0.23.
For contaminated runways, JAR 25x1591 requires the manufacturer to generate the AFM takeoff performance charts using 25% of the dry runway aircraft braking coefficient. Precipitation drag (landing gear displacement drag and spray impingement drag) effects are considered as a function of contaminant depth.
For slippery runways, JAR 25x1591 defines two types of runway conditions: Wet Ice and Compacted Snow. For Wet Ice a fixed aircraft braking coefficient of 0.05 is used, and for Compacted Snow a fixed aircraft braking coefficient of 0.20 is used. 5.7.4 REPORTED BRAKING ACTION AND REPORTED FRICTION COEFFICIENT
Airport authorities report the friction characteristics of the runways using friction measuring devices. These reported friction characteristics, however, do not represent the actual aircraft braking friction, as many variables like aircraft weight, speed, braking mechanism, tire and undercarriage characteristics are not considered on its determination. In addition, the precipitation drag (landing gear displacement drag and spray impingement drag) is not measured, as it is also a function of aircraft characteristics and speed.
The measured characteristics are reported by the airport authorities as "Reported Braking Action" or "Reported Friction Coefficient":
Reported Braking Action Reported Friction Coefficient Good 0.40 and above Medium to good 0.39 to 0.36 Medium 0.35 to 0.30 Medium to poor 0.29 to 0.26 Poor 0.25 and below
If the braking action is reported as good, pilots should not expect to find conditions as good as on a clean dry runway (where the available friction may be well greater). The value good is a comparative value and is intended to mean that airplanes should not experience directional control or braking difficulties.
As explained above, the reported friction characteristics do not represent the actual aircraft braking characteristics. However, many times the reported braking action or reported friction

OPERATIONS ENGINEERING COURSE
AUGUST 01, 2001 53 FOR TRAINING PURPOSES ONLY
coefficient is the only reference an airline has in relation to the runway condition for calculating the takeoff and landing performance of the aircraft.
In this case, if the runway is slippery, it is possible to approximately correlate the reported braking action or friction coefficient using the graph below. For example, the AFM Compacted Snow performance charts can be used when Braking Action is reported as Good (reported friction 0.40), and the AFM Wet Ice performance charts can be used when Braking Action is reported as Poor (reported friction 0.20). Performance may be calculated for intermediary values of Braking Action by interpolating the AFM Compacted Snow and Wet Ice performance charts.
If the runway is contaminated, the use of the graph above is not allowed (mainly because braking action does not consider the precipitation drag). In this case, the airline has to determine the actual contaminant depth and use the associated AFM performance charts. 5.7.5 WATER EQUIVALENT DEPTH
Deposits of water, slush or snow may cause a runway to be considered contaminated. As each of these contaminants have different characteristics, it would be necessary to develop individual AFM charts for each type of contaminant. In addition, snow may be present in various stages, like Wet Snow, Dry Snow or Loose Dry Snow, further increasing the number of AFM charts required.
In order to reduce the number of contaminated runway charts in the AFM, aircraft manufacturers usually present the contaminated runway performance in the AFM as a function of WED - Water Equivalent Depth.
For each contaminant type and depth there is an associated precipitation drag (landing gear displacement drag and spray impingement drag), for which there always exist a certain water depth that results in the same precipitation drag (landing gear displacement drag and spray

OPERATIONS ENGINEERING COURSE
AUGUST 01, 2001 54 FOR TRAINING PURPOSES ONLY
impingement drag). This equivalent water depth is called WED. The WED is the contaminant depth multiplied by its specific gravity.
The graph below shows the relationship between contaminant depth and WED, as a function of contaminant specific gravity:
The average specific gravity for slush is 0.85, for wet snow is 0.4, for dry snow is 0.2 and for loose dry snow is 0.125. As a runway is considered contaminated if it has more than 3 mm of water, it may also be considered contaminated if:
a) It has more than 3 / 0.85 = 3.6 mm of slush; or b) it has more than 3 / 0.4 = 7.5 mm of wet snow; or c) it has more than 3 / 0.2 = 15mm of dry snow; or d) it has more than 3 / 0.125 = 24 mm of loose dry snow.
5.7.6 OPERATION IN ICING CONDITIONS
Icing conditions may exist whenever the Static Air Temperature (SAT) on the ground or for takeoff, or Total Air Temperature (TAT) inflight, is 10°C or below and visible moisture in any form is present (such as clouds, fog with visibility of one mile or less, rain, snow, sleet, and ice crystals).
Icing conditions may also exist when the SAT on the ground and for takeoff is 10°C or below when operating on ramps, taxyways, or runways where surface snow, ice, standing water, or slush may be ingested by the engines, or freeze on engines, nacelles, or engine sensor probes.
Engine Anti-ice ON must be used during all ground operations when icing conditions exist or are anticipated.

OPERATIONS ENGINEERING COURSE
AUGUST 01, 2001 55 FOR TRAINING PURPOSES ONLY
5.8 MAXIMUM BRAKE ENERGY LIMITED TAKEOFF WEIGHT
During brakes application, kinetic energy is transformed into heat energy. The brakes must be able to absorb this heat energy. If more heat energy is generated than the brakes are able to absorb, they will overheat and can be destroyed. Therefore, there is a maximum speed for full braking to a complete stop. This speed is the maximum brake energy speed (VMBE).
VMBE depends on the takeoff weight, ambient temperature, ambient pressure, runway slope and wind component along the runway.
When the optimum V1 has to be reduced in order not to exceed VMBE, there is degradation on the takeoff limited weight. This degraded weight is then called Maximum Brake Energy Limited Takeoff Weight. 5.9 TIRE SPEED LIMITED TAKEOFF WEIGHT
The tire speed limitation represents the maximum ground speed for which the tires were structurally certified. Above VMAX TIRE the strength limits of the tires are exceeded and they may not resist to the centrifugal forces (caused by high wheel spinning) they are subject to.
When the VLOF has to be reduced in order not to exceed VMAX TIRE, there is degradation on the takeoff limited weight. This degraded weight is then called Tire Speed Limited Takeoff Weight.

OPERATIONS ENGINEERING COURSE
AUGUST 01, 2001 56 FOR TRAINING PURPOSES ONLY
5.10 CLIMB LIMITED TAKEOFF WEIGHT
The Climb Limited Takeoff weight (also called WAT - Weight Limited by Altitude and Temperature) is related to minimum climb gradients along the takeoff flight path. The takeoff flight path is divided in various segments as described below:
TAKEOFF DISTANCE
TAKEOFF THRUST
TAKEOFF FLAPS
Acceleration to V2
1st Segment
T.O. THRUST
T.O. FLAPS
V2
Gear Retraction
2nd Segment
T.O. THRUST
T.O. FLAPS
V2
Gear Up
3rd Segment
T.O. THRUST
Flap Retraction
Acceleration to
FINAL CLIMB SPEED
4th / Final Segment
Max Continuous THRUST
FLAPS UP
CLIMB SPEED
ENROUTE CLIMB
ALL ENGINES
The takeoff flight path is the flight profile from a standing start up to the point at which the aircraft attains a height of 1500ft above the runway surface or completes the transition to the en-route configuration (in terms of altitude), whichever is the highest altitude; at a speed not less than 1.25Vs, with one engine out.
The above requirements are made on the principle that the aircraft is accelerated to VEF, at which point the critical engine is made inoperative and remains inoperative for the rest of the take-off, and that the take-off safety speed V2 is attained before the 35ft screen height. The Take-Off Flight Path begins at the end of the Take-off Distance (TOD) at the screen height of 35ft.
First segment: This is the element from VLOF to the point where the landing gear is fully retracted. The required gross gradient of climb must be positive at all times for two-engined aircraft, not less than 0.3% for three-engined aircraft and not less than 0.5% for four- engined aircraft, all from VLOF.
Second segment: This segment commences when the landing gear is fully retracted, and may extend up to any point where a level flight acceleration element is introduced, with the lower level set at 400ft. The upper limit is dictated by the point at which takeoff power must be reduced to maximum continuous power, after retracting flaps and accelerating to the single engine climb speed. This segment is flown with the landing gear up and the flaps at the takeoff setting. In addition, no changes to thrust or power may be made by the pilot until the aircraft is 400ft above the runway surface. The required gross climb gradients are not less
VEF
35 ft
ONE ENGINE INOPERATIVE
35 ft V2
GEAR UP
GROSS PATH
35 ft
NET PATH
MINIMUM HEIGHT 400 FT
Net Flight Path = Gross Path - 0.8%
1500 ft
TAKEOFF PROFILE

OPERATIONS ENGINEERING COURSE
AUGUST 01, 2001 57 FOR TRAINING PURPOSES ONLY
than 2.4% for two-engined aircraft, 2.7% for three-engined aircraft and 3.0% for four-engined aircraft. During this segment, the aircraft must be flown as close as possible to V2.
Third segment: This segment is also known as the Acceleration Segment and is the first of the ‘optional’ segments. It may be used when obstacle clearance considerations permit the aircraft to level out and a horizontal attitude to be assumed. During this segment the aircraft is accelerated up to the Flap Retraction Speed (VFR), after which the aircraft is in the en route configuration or, as it is more usually referred to, ‘clean’. Once the aircraft is ‘cleaned-up’ the climb is resumed at Takeoff Final Segment Climb Speed (VFS). The Third Segment may not be initiated at a height less than 400ft above the take-off surface.
Takeoff final climb segment: Also called as 4th segment, this comprises the segment existing from the chosen acceleration height up to an altitude of 1500ft. The required gross gradients of climb for this segment, which are determined at maximum continuous thrust, are not less than 1.2% for two-engined aircraft, 1.5% for three-engined aircraft and 1.7% for four-engined aircraft, flown at a speed not less than 1.25Vs.
The table below summarizes the climb gradient requirements in each takeoff segment:
CONFIGURATION MINIMUM GRADIENT
Number of Engines Segment Gear Flaps Thrust Speed 2 3 4
1
down
positive
0.3 %
0.5 %
2
takeoff position
V2
2.4 %
2.7 %
3.0 %
3
transition
Takeoff thrust on operating engines
acceleration
4
up
retracted
Max. Continuous
VFS
1.2 %
1.5 %
1.7 %
The Climb Limited Takeoff Weight is the maximum weight at which the aircraft climb gradient on each takeoff segment is equal or above the gradients listed above. Typically, the second segment climb gradient is the most limiting among all gradients requirements, but this may not be considered as a general rule.
Since air distance is used instead of ground distance, the wind has no influence on climb gradient.
For a certain aircraft configuration and takeoff thrust, the climb gradient (and as a consequence the climb limited weight) is a function of temperature and altitude only.

OPERATIONS ENGINEERING COURSE
AUGUST 01, 2001 58 FOR TRAINING PURPOSES ONLY
5.11 OBSTACLE LIMITED TAKEOFF WEIGHT
Obstacle clearance during takeoff must be observed by verifying if the net takeoff flight path (as defined below) clears all obstacles by at least 35 ft vertically. Net takeoff flight path: Is a calculated flight path for verification of obstacle clearance. Starts at the 35 ft screen height point and must be calculated by subtracting the following margins from the OEI climb gradients:
• 0.8% for two-engined aircraft; • 0.9% for three-engined aircraft; • 1.0% for four-engined aircraft.
These margins are a safety factor to guarantee obstacle clearance in case of any errors introduced during the scheduling of the take-off, and to allow for any aircraft performance worse than expected. The OEI climb gradients subtracted by these margins are called net gradients.
Although the screen height during a takeoff on wet/contaminated/slippery runways is of 15 ft, the net takeoff flight path is considered to start at 35 ft. In fact, in this case the net takeoff flight path may be considered starting at the screen height of 15 ft, but with a 15 ft instead of 35 ft obstacle clearance. 5.11.1 METHODS FOR OBSTACLE CLEARANCE
The first step to verify obstacle clearance on a takeoff is by constructing a net flight path based on the Field Length Limiting Weight (picture A below). On this case the net flight path starts at 35 ft exactly at the end of the runway. If the net flight path does not clear the obstacles by 35 ft, it is necessary to reduce the takeoff weight, in order to increase the climb gradient, until the net flight path clears all obstacles. There are 3 ways of doing this weight reduction, described below:
• The first method, shown in picture B below, is to reduce the takeoff weight not taking credit of the shorter takeoff distance. In this case, the point where the net flight path starts remains the same (35 ft at the end of the runway), and the takeoff weight is reduced until the increased climb gradient allows obstacle clearance.
35 ft
GROSS (ACTUAL) PATH
NET (CALCULATED) PATH
35 ft
35 ft

OPERATIONS ENGINEERING COURSE
AUGUST 01, 2001 59 FOR TRAINING PURPOSES ONLY
• The second method, shown in picture C below, is to reduce the takeoff weight, taking credit of the shorter takeoff distance, but maintaining a balanced field length.
• The third method, shown in picture D below, is to reduce the takeoff weight taking credit of the shorter takeoff distance, but using the entire available runway for accelerate-stop (i.e., unbalancing the takeoff).
The weight WF shown in picture A is the Field Length Limiting Weight. The methods shown on pictures B, C and D will result in different Obstacle Limited Takeoff Weights, W1, W2 and W3, respectively. It can be said that:
WF > W3 > W2 > W1 As explained above, method D will result in the better (heavier) Obstacle Limited Weight by unbalancing the takeoff. This field unbalancing will result in a high V1, eventually as high as VR, i.e., V1 = VR.
V2
VSTOP
WF
V2
VSTOP
W1
V2
VSTOP
W2
V2
VSTOP
W3
A
B
C
D

OPERATIONS ENGINEERING COURSE
AUGUST 01, 2001 60 FOR TRAINING PURPOSES ONLY
5.11.2 SOURCES OF OBSTACLE DATA Operators are expected to use the best and most accurate available obstacle data for a particular airport at the time of analysis. Operators should be aware that an Airport Obstruction Chart (OC), Type A chart (AIP-AGA), or any other single source may not include all the pertinent information necessary for doing a takeoff analysis.
a. Frangible structures fixed by function with an aeronautical purpose such as antennas, approach lights, and signs need not be considered in an obstacle analysis.
b. Accountability must be made for local temporary or transient obstacles such as ships, cranes, or trains. The clearance height allowances for vehicles above roads, railroads, etc., contained in FAR part 77 and/or on the OC or Type A charts shall be used. If the operator has a means to determine the absence of a movable object at the time of takeoff, then it need not be accounted for in the analysis.
c. Reasonable judgment must be used to account for the height of indeterminate objects (objects without recorded height) displayed on topographic maps. Indeterminate objects include such items as trees, buildings, flagpoles, chimneys, transmission lines, etc. The operator needs to use sound judgment in determining the best available data sources when conflicts occur between heights and locations of obstacles in the various sources.
d. If adequate takeoff weights cannot be obtained, an obstacle removal program should be considered.
e. Operators should establish an appropriate review cycle to periodically assure the suitability of their performance data and procedures. In addition, operators should evaluate the effect of changes that occur outside of normal information or charting cycles. These changes may occur as a result of issuance of an operationally significant NOTAM, temporary obstacle information, new construction, ATIS procedural constraints, navaid outages, etc.
5.11.3 OBSTACLE ACCOUNTABILITY AREAS
The obstacle accountability area is an area within which all obstacles must be cleared vertically.
Each operating regulation defines a different obstacle accountability area. The ICAO, JAA, FAA and Brazilian CTA definitions are presented below: ICAO (annex 6 and 14) and JAA (JAR-OPS 1.495): It is an area on the shape of a cone, starting at the end of the runway and centered around the intended flight track. The area initiates with a half width of 90m, increasing at a rate of 1:8 to its length (i.e., half width = 90 + 0.125D, where D is the distance along the intended flight path from the end of runway in meters). The area half width may extend up to 300m, 600m or 900m as a function of meteorological conditions and heading change in case of turns.

OPERATIONS ENGINEERING COURSE
AUGUST 01, 2001 61 FOR TRAINING PURPOSES ONLY
Condition Heading Change Half Width VMC by day < 15 Degrees 300 m VMC by day > 15 Degrees 600 m IMC / VMC Night < 15 Degrees 600 m IMC / VMC Night > 15 Degrees 900 m
FAA (FAR 121.189) and CTA (RBHA 121.189): Is a corridor that has the following half widths:
a) 200 feet horizontally within the airport boundaries b) 300 feet horizontally outside airport boundaries
FAA (Draft AC 120-OBS): Although not yet an official FAA document, Draft AC 120-OBS is used by many US airlines to develop obstacle clearance analyses. As the use of the corridor as defined in FAR 121.189 would require the operator to account for factors that could cause a difference between the intended and actual ground track, such as crosswind and available course guidance, Draft AC 120-OBS provides a method for calculating an obstacle accountability area similar to ICAO's and JAA's.
The FAA Draft AC 120-OBS defines an area on the shape of a cone, starting at the end of the runway and centered around the intended flight track.
The area initiates with a half width of 200 ft within the airport boundaries, increasing at a rate of 1:16 to its length (i.e., half width = 200 + 0.0625D, where D the distance along the intended flight path from the end of runway in feet). The minimum area half width outside the airport boundaries is 300 ft. The area half width extends up to 2000 ft in straight flight or if the heading change is less than 15 degrees.
In case of turns changing the track in more than 15 degrees, the minimum half width where the turn begins is 300 ft, and the half width from this point and beyond will increase at a rate of 1:8

OPERATIONS ENGINEERING COURSE
AUGUST 01, 2001 62 FOR TRAINING PURPOSES ONLY
(i.e., half width increase = 0.125D1, where D1 is the distance along the intended flight path from the beginning of the turn). In this case, the area half width may extend up to 3000 ft.
5.11.4 TURN ANALYSIS
In many situations it is interesting to consider turns during departure in order to: • eliminate the need to consider limiting obstacles, increasing the Maximum Takeoff Weight
(increases payload and/or range); • contingency procedures may be required to provide instructions to the pilots if an engine
fails during takeoff and the airplane is unable to maintain the SID (Standard Instrument Departure procedure) required climb gradients.
The following items must be considered when doing turn analysis:
• The possibility of introducing new obstacles in the flight path; • A limit to V2 speed in order to restrict the maximum turn radius; • A decrease in the climb gradient during the turn.
Limiting obstacles may be avoided by doing a turn, but other obstacles may need to be considered

OPERATIONS ENGINEERING COURSE
AUGUST 01, 2001 63 FOR TRAINING PURPOSES ONLY
For FAA and CTA operators, the legal minimum height to begin a turn is 50 ft and the maximum bank angle may not be more than 15 degrees (FAR 121.189(f) and RBHA 121.189(f)). According FAA Draft AC 120-OBS, bank angles of up to 25o are accepted, provided speed increments and gradient of climb penalties are applied. For JAA operators, according JAR-OPS 1.495, the maximum bank angles during a turn are the following:
Maximum bank angle: All Engines Operative: 25o at V2 + 10 One Engine Inoperative: 15o at V2
One Engine Inoperative: 20o at V2 + 5
One Engine Inoperative: 25o at V2 + 10
Note: According JAR OPS 1.495 (c), if the airplane is banked by more than 15o, the net path
must clear all obstacles during the banked turn by 50 ft instead of 35 ft. In addition, JAR OPS 1.495 (c) defines at which height a turn may be started.
As explained above, if bank angles of more than 15° are used, V2 speeds may have to be increased to provide an equivalent level of stall margin protection and adequate controllability. The following are examples of acceptable methods for accounting this speed increment:
(i) If available, AFM data for "improved climb", "overspeed" or "increased V2" performance may be used to determine weight decrements for the desired increase to V1, VR, and V2.
(ii) Account for the acceleration above V2 by trading the climb gradient for speed increase. Integrate this climb gradient loss over the distance required to accelerate to determine an equivalent height increment to be added to all subsequent obstacles.
In case of banked flight, climb gradient reductions have to be applied, due to the effect of bank angle in the climb gradient. The gradient corrections are normally provided by the aircraft manufacturers on a graph called "Gradient Loss due to a Steady Turn"', which shows the gradient loss as a function of bank angle.
Gradient loss
Bank Angle

OPERATIONS ENGINEERING COURSE
AUGUST 01, 2001 64 FOR TRAINING PURPOSES ONLY
Gradient loss in turns may be accounted for by increasing the obstacle height by the gradient loss multiplied by the flight path distance in the turn, in order to arrive at an equivalent obstacle height that can be analyzed as a "straight-out" obstacle in the operator's airport analysis programs.
Obstacle Distance:
d1 + (R x θθ ) + d2 Obstacle Height:
h1 + (R x θθ x GradLoss) (*)
(*) An extra 15 ft margin must be added to the adjusted obstacle height if the obstacle is cleared during a turn with bank angle greater than 15 degrees (JAR-OPS 1.495(c)(2): 50ft net clearance instead of 35ft).
h1

OPERATIONS ENGINEERING COURSE
AUGUST 01, 2001 65 FOR TRAINING PURPOSES ONLY
5.12 5-MINUTES THRUST LIMITED TAKEOFF WEIGHT
Most of the aircraft engines are certified for a maximum of 5 minutes at Takeoff Thrust (some are certified for 10 minutes). As takeoff thrust is used until the end of the 3rd segment, a time restriction of 5 minutes between the brake release and level flight acceleration to VFS must be observed.
If the time to reach the end of the 3rd segment exceeds 5 minutes, the takeoff weight has to be decreased in order to allow better climb gradients and acceleration. This reduced weight is called the 5-Minutes Thrust Limited Takeoff Weight.
The 5-Minutes Thrust Limited Takeoff Weight is also known as Level-Off Limited Takeoff Weight, because for every level-off selected there is an associated weight which will result in completing the 5 minutes period at the end of the 3rd segment.
Maximum Level Off: for a certain aircraft weight, it is the maximum height at which the 3rd segment can be completed before the time limit on the use of takeoff thrust expires.
5.13 EXTENDED SECOND SEGMENT
Some aircraft are certified for extended second segment, i.e., a takeoff profile where the 2nd segment is extended up to the point where the 5 (or 10) minutes takeoff thrust limit is reached, and then the 3rd segment is completed with Maximum Continuous Thrust. The use of extended second segment allows an optimization of the obstacle limited takeoff weight in case of high and distant obstacles.
Maximum time: 5 minutes
5 minutes
Max Continuous Thrust

OPERATIONS ENGINEERING COURSE
AUGUST 01, 2001 66 FOR TRAINING PURPOSES ONLY
5.14 WIND CORRECTIONS
The wind velocity reported by the airport tower is measured at a 10 meter height.
Field, Brake Energy, Tire Speed and Obstacle limited takeoff weights are affected by wind during takeoff. Headwinds improve takeoff performance due to the smaller distances required for aircraft acceleration, lower ground speeds and steeper climb in relation to the ground. Tailwinds degrade the takeoff performance due to the greater acceleration distances, higher ground speeds and degraded climb gradients in relation to the ground.
Performance regulations require that the aircraft manufacturer must consider the following factors when developing the AFM charts:
• AFM charts must be developed considering only 50% of the reported headwind and 150% of the reported tailwind. This is to guarantee appropriate performance margins in case the actual headwind is weaker than the reported one, or if the actual tailwind is stronger than the reported one.
• The wind reported by the airport tower (V10 = wind measured at 10 meter height) must be corrected for the aircraft actual height above ground by using the following formula: VH = V10 x (H/10)1/7 , where H = aircraft wing height above ground level.
The AFM charts already incorporate these wind adjustments, so that no additional corrections need to be made when using the AFM charts (actual tower reported wind, without corrections, must be used when calculating the takeoff performance from the AFM).
5.15 EFFECT OF FLAP SETTING
Aircraft usually have 2 or more takeoff flap positions. The flap choice for takeoff depends on the circumstances, each one having its own advantages.
Basically, a low flap setting allows better climb while a higher flap setting results in lower take off speeds and consequently allows shorter ground rolls. So if the takeoff is to be performed from a short runway, the higher flap setting probably will be the best option; if the takeoff is to be performed from a long runway or high altitudes the higher flap setting will probably be a bad choice because of its high drag and consequently worse climb gradient.
The figure below illustrates a typical take off path for two flap settings:

OPERATIONS ENGINEERING COURSE
AUGUST 01, 2001 67 FOR TRAINING PURPOSES ONLY
5.16 INCREASED V2 OR IMPROVED CLIMB
Increased V2 performance data is available for some aircraft types.
Very much like flap setting variations, increased V2 works best when there are no runway length limitations and it is high and hot. So, putting everything together one can say that if the runway is short, the elevation is low and the temperature is mild, a higher flap setting and normal V2 are the best options; at the other extreme, if the runway is long and it is high and hot, a lower flap setting and increased V2 is the best combination. For situations in between these extremes, the best strategy is run simulations in a computer using the runway analysis program to figure out the best combination. It is important to mention that the ideal combination of flap and V2 may vary for the same runway for different temperatures and winds.
The interesting fact is the similarity between the figure that shows the effect of flap setting discussed earlier, and the figure below that shows the Increased V2 take off compared to a Normal V2 take off.
Rate of Climb
V2 Speed
V2 for Max R/C V2 for Max Gradient V2

OPERATIONS ENGINEERING COURSE
AUGUST 01, 2001 68 FOR TRAINING PURPOSES ONLY
The following table lists all V2 options that are certified for the ERJ-145 family:
V2 /VS-1g RATIOS FOR THE ERJ-145 FAMILY:
TAKEOFF FLAP SETTING
9 18 22
ERJ-145 FAA A, A1/1 1.20 & 1.25 N/A 1.15
ERJ-145 FAA A1 1.20 & 1.25 N/A 1.15
ERJ-145 FAA A1P 1.20 1.17 1.15
ERJ-135 FAA 1.20 1.17 N/A
ERJ-140 FAA 1.16, 1.20 & 1.25
1.16 & 1.22 N/A
ERJ-145 CTA A, A1/1 1.20 & 1.25 N/A 1.15
ERJ-145 CTA A1 1.20 & 1.25 1.17 1.15
ERJ-145 CTA A1P 1.20 1.17 1.15
ERJ-135 CTA 1.20 1.17 N/A
ERJ-140 CTA 1.16, 1.20 & 1.25
1.16 & 1.22 N/A
ERJ-145 JAA 1.25 1.17 N/A
ERJ-135 JAA 1.20 1.17 N/A

OPERATIONS ENGINEERING COURSE
AUGUST 01, 2001 69 FOR TRAINING PURPOSES ONLY
5.17 FIRST PRINCIPLES PERFORMANCE
First Principles is basically a software that uses raw aerodynamic and engine data to calculate virtually anything on a take off step by step in little increments along the take off path. Because it is not constrained to any of the simplifications or idealizations required to put the data in a graphical form, it is not penalized, so it produces more optimistic limit weights over the AFM. Typically, aircraft performance data is obtained in the following sequence:
1) Flight test data is analyzed in a process called Data Reduction, where basic parameters like drag, lift, friction coefficients, transition times, minimum speeds, etc, are obtained.
2) The parameters obtained in the Data Reduction, together with the certified engine thrust model (Engine Deck) are applied to the equations of movement in a process called Data Expansion. This Data Expansion is made for the entire range of altitudes, temperatures, winds, slopes, lengths, etc, and results in a huge amount of data.
3) The Data Expansion results are plot in graphical format for generation of the AFM charts, and correction factors are calculated for variables like wind, slope, weight, etc. As the resulting plots are scattered, it is necessary to take the most conservative points to generate the AFM charts. The First Principles software is a certified software that replaces steps 2 and 3 above. Availability of First principles software replaces the performance graphical presentation in the AFM (i.e., replacing the AFM graph conservatism). The figure below illustrates the differences between a software based on the AFM charts and a software based on the approved take off analysis software (first principles):

OPERATIONS ENGINEERING COURSE
AUGUST 01, 2001 70 FOR TRAINING PURPOSES ONLY
5.18 REDUCED AND DERATED TAKEOFF THRUST OPERATIONS
The engines have a rated thrust for take off. Using more than the rated thrust is not allowed as a normal procedure because engine life is greatly reduced. The opposite case is feasible, though. If weight is low and the proper associated speeds are calculated, then less than the rated take off thrust can be used. So what happens in practice? A flight is scheduled to take place. The crew gets the flight briefing from the operational dispatch, and goes to the airplane. After start and having the clearance, the runway analysis has to be checked with the correct and final weight of the aircraft. Let us suppose that the actual weight of the aircraft is 17000Kg and the weight that shows in the runway analysis is 20000Kg. This means that the rated take off thrust is more than the thrust required to takeoff. Using reduced thrust has the big advantage of saving the engines by lowering the turbine operating temperature. This saving is very significant in terms of time between overhauls and engine overhaul costs. 5.18.1 ASSUMED TEMPERATURE METHOD
If the takeoff weight is less than the maximum allowable takeoff weight, the assumed temperature method may be used to reduce the thrust. This method uses the maximum temperature that meets all the takeoff performance requirements at the expected takeoff weight for the planned takeoff runway. The maximum thrust reduction permitted is 25% from the thrust rating, as per FAA AC 25-13 and JAA AMJ 25-13. In addition, this method may not be used if the runway is contaminated. For wet runways it is permitted provided wet runway performance is used. The assumed temperature method (ATM) is always conservative. Takeoff using ATM reduced thrust will always result in equal or better airplane performance than would be the case if
Thrust
TOGW
LIMITING WEIGHT
ACTUAL WEIGHT
Max T.O Thrust
Reduced Thrust
Actual Assumed
Temperature

OPERATIONS ENGINEERING COURSE
AUGUST 01, 2001 71 FOR TRAINING PURPOSES ONLY
takeoff were executed at the higher (assumed) temperature, because of the temperature effect on airspeed (for a constant IAS, TAS is lower at cooler temperatures, resulting in a shorter takeoff distance). 5.18.2 DERATED THRUST METHOD
Derated takeoff thrust is a takeoff thrust rating that provides less thrust than the maximum (full) takeoff thrust. It is used to generate an additional complete set of performance charts, just like the maximum takeoff thrust charts. Operating with derated thrust is equivalent to having a less powerful engine.
The derated thrust method may be used under any circumstance, but only if the actual takeoff weight is low enough to permit the use of derated thrust. 5.18.3 ASSUMED TEMPERATURE versus DERATED THRUST
The figure on next page illustrates the "assumed temperature" method as opposed to the "derated thrust" method. On the "assumed temperature" method we enter the analysis with the actual weight of the aircraft and get the assumed temperature. Then we find a throttle setting that produces a thrust equal to the rated thrust at the assumed temperature. On the "derated thrust" method we check two analyses: the Full Thrust analysis (T/O-1 on our example) and the Derated Thrust analysis (ALT T/O-1 on our example). If the actual weight is lower than the corresponding weight in both analyses, then ALT T/O-1 can be used; if the actual weight is between T/O-1 and ALT T/O-1 then T/O-1 has to be used. If the actual weight is higher than the two weights, take off is unfeasible. What are the advantages of each method? The "assumed temperature" method has the advantage of allowing a fine-tuning of the reduction; it also allows the use of a single runway analysis regardless of the amount of reduction. On the other side, the "derated thrust" method is simpler because the pilot does not have to adjust the throttles. They are simply moved to the thrust set position (with the proper rate selected). It also has the advantage of producing more consistent statistical data about engine life because flight data can be grouped in two

OPERATIONS ENGINEERING COURSE
AUGUST 01, 2001 72 FOR TRAINING PURPOSES ONLY
types of takeoff only. The use of the "assumed temperature" method results in statistical data where in each takeoff the engine is strained differently.
On the ERJ-145, one also must keep in mind that in the event of an engine failure during take off with ALT T/O-1 the functioning engine will immediately accelerate to T/O-1 thus increasing the safety margin of the engine-out performance. The main advantage of the use of ALT T/O-1 is of course economical. There are significant savings in terms of engine wear. The magnitude of these savings vary depending on how often it is used and under which circumstances it is used. But we can mention as a reference figures provided by Rolls-Royce contained on Embraer's Extending Engine Life publication:
If 100% of all takeoffs on a certain engine are performed using ALT T/O-1 and 100% of all takeoffs on another engine are performed using T/O-1, the time between overhauls for the first engine shall be as much as 4 times larger. This is so because the turbine temperature at ALT T/O-1 is about 20°C cooler than the corresponding temperature for T/O-1. On the ERJ-145, it is important to note that the use of REF TO TEMP as a means of inserting an "assumed temperature" is not correct. Let us suppose that the actual temperature is 20°C and the pilot sets REF TO TEMP to 30°C for a T/O-1 departure. The resulting N1 is the N1 to be used when the actual temperature is 30°C to produce T/O-1 thrust. However this same N1 produces a different thrust at 20°C that is actually higher than the 20°C T/O-1 thrust. So the pilot would end up with a thrust "overboost" instead of a thrust reduction. It can be seen in the figure above that the T/O-1 N1 increases with the temperature, while the available thrust certainly drops with the temperature.
Derated Thrust T/O-1 ----------------------------------------------------- Temp(C)/N1(%) 0Kt 10Kt ----------------------------------------------------- 6 / 89.0 42875/124/125/135/R 43815/126/126/137/R 8 / 89.4 42754/124/124/135/R 43689/126/126/137/R 10 / 89.8 42635/124/124/135/R 43563/126/126/136/R 12 / 90.1 42512/124/124/135/R 43434/126/126/136/R 14 / 90.4 42391/124/124/135/R 43307/125/125/136/R 16 / 90.4 42391/124/124/135/R 43307/125/125/136/R -----------------------------------------------------
Choose which setting to use ALT T/O-1 ----------------------------------------------------- Temp(C)/N1(%) 0Kt 10Kt ----------------------------------------------------- 6 / 88.7 42269/123/123/134/R 43179/125/125/136/R 8 / 87.0 42148/123/123/134/R 43052/125/125/136/R 10 / 89.4 42027/123/123/134/R 42925/125/125/135/R 12 / 89.7 41912/123/123/134/R 42804/124/124/135/R 14 / 89.0 41792/122/123/134/R 42684/124/124/135/R 16 / 89.3 41667/122/122/133/R 42563/124/124/135/R

OPERATIONS ENGINEERING COURSE
AUGUST 01, 2001 73 FOR TRAINING PURPOSES ONLY
5.19 ALIGNMENT ALLOWANCE
Alignment allowance is the runway length distance that is lost when the aircraft maneuvers into the runway prior to takeoff. There are two alignment distances:
• ASDA Alignment Distance: is the distance from the aircraft nose landing gear to the end of the runway surface. This allowance must be subtracted from the accelerate-stop distance available.
• TORA/TODA Alignment Distance: is the distance from the aircraft main landing gear to the end of the runway surface. This allowance must be subtracted from the takeoff runway available and takeoff distance available.
This alignment distance depends on the airplane geometry and access possibility to the runway in use. Accountability is usually required for a 90º taxyway entry to the runway and 180º turnaround on the runway. The alignment allowances may be calculated by using the following formulas:
90º entry 180º entry
TORA/TODA Alignment Rm + X Rn + Y
ASDA Alignment Rm + X + Wb Rn + Y + Wb
Where: X = Safety distance of outer main wheel during turn to the edge of runway. Y = Safety distance of outer nose wheel during turn to the edge of runway. Rm = Radius of turn of outer main wheel. Rn = Radius of turn of outer nose wheel. Wb = Wheel base.

OPERATIONS ENGINEERING COURSE
AUGUST 01, 2001 74 FOR TRAINING PURPOSES ONLY
5.20 PAVEMENT STRENGTH LIMITATIONS There are a huge variety of runway pavement types available, the most common ones being asphalt, concrete, gravel and grass. Jet aircraft operations usually are restricted to asphalt and concrete runways, due to its higher strength and cleanness. Not all concrete and asphalt runways have the same characteristics, including variations in the capacity of the pavement supporting the aircraft weight (pavement strength). As a consequence, each airport authority reports the maximum weight an aircraft may operate on the particular runway without damaging it. There are various methods for reporting the pavement strength, the most common one being the PCN (Pavement Classification Number). In order to use it, the aircraft manufacturer must also publish the ACN (Aircraft Classification Number). The Pavement Classification Number (PCN) reported shall indicate that an airplane with ACN equal to or less than the reported PCN can operate on that pavement. Example: PCN 50 / F / A / X / T
1 2 3 4
1 - Type of pavement: R = Rigid (concrete) F = Flexible (asphalt) 2 - Pavement sub-grade strength category: A = High, B = Medium, C = Low, D = Ultra-low. 3 - Maximum tire pressure authorized for the pavement: W = High, no limit; X = Medium (up to 217 psi) Y = Low (up to 145 psi); Z = Very low (up to 73 psi) 4 - Pavement evaluation method: T = Technical evaluation; U = By experience of airplane actually using the pavement. OVERLOAD OPERATIONS Individual airport authorities are free to decide on their own criteria for permitting overload operations as long as pavements remain safe for use by airplane. However, the following guidance is provided: 1. A 10% difference in ACN over PCN for flexible pavement and 5% for rigid pavements is
generally accepted, provided that overload operations do not exceed 5% of the annual departures and are spread throughout the year.
2. Overload operations with a 10% to 25% difference in ACN over PCN justify regular inspections of pavement and curtailment of overload operations as distress becomes evident.
3. Overload operations with 25% to 50% difference in ACN over PCN may be undertaken under special conditions. They call for special analysis before and after the operation to assess any sign of pavement distress.
4. Overload operations with a 50% or higher difference in ACN over PCN should only be undertaken in an emergency.

OPERATIONS ENGINEERING COURSE
AUGUST 01, 2001 75 FOR TRAINING PURPOSES ONLY
6. ENROUTE CLIMB
The force relationships during climb:
The climb performance of an airplane is expressed by the two terms: • climb angle - climb gradient; • rate of climb.
dt
dv
g
V
W
DTVCR −
−=/
dt
dv
gW
DTgradientclinb
1_tan −
−==γ
where: T = thrust D = drag W = weight V = velocity (TAS) g = gravitational acceleration dv/dt = airplane acceleration γ = climb angle
THRUST - T
DRAG - D
LIFT - L
WEIGHT W
W cos γ
W sen γ
RATE OF CLIMB
R/C γ
TRUE AIRSPEED

OPERATIONS ENGINEERING COURSE
AUGUST 01, 2001 76 FOR TRAINING PURPOSES ONLY
CLIMB SPEED SELECTION Climb speeds are selected taking into account the following aspects: • best rate of climb - shortest time to reach cruise altitude; • highest climb angle (clearing obstacle, shortest distance to reach cruise altitude); • lowest fuel consumption; • lowest operating costs; • shortest total flight time. The graph below shows the relationship between rate of climb and the thrust drag curve. It may be observed that the speed for maximum climb gradient occurs when the aircraft has the maximum margin between thrust and drag. In addition, it may be observed that the maximum rate of climb will occur at a speed higher than the maximum climb gradient speed.
The speed at which climb gradient is maximized is called Vx, and the speed at which rate of climb is maximized is called Vy.

OPERATIONS ENGINEERING COURSE
AUGUST 01, 2001 77 FOR TRAINING PURPOSES ONLY
7. CRUISE, FLIGHT PLANNING AND DRIFTDOWN
The balance of forces in leveled unaccelerated flight:
For the condition of leveled unaccelerated flight:
LIFT = WEIGHT THRUST = DRAG
7.1 SPEED SELECTION 7.1.1 MAXIMUM CRUISE SPEED
If the forces mentioned above were not in balance, there would be a net force in one direction, and acceleration in that direction would result. The figure below shows that the aircraft stabilizes its speed when the drag is equal to the available thrust. When Maximum Cruise Thrust is used, the speed at which the aircraft stabilizes is called Maximum Cruise Speed (MCS).
In some situations the aircraft may reach the maximum operating speed (VMO or MMO) before reaching the thrust limited Maximum Cruise Speed.
WEIGHT - W
LIFT - L
THRUST - T DRAG - D
DRAG/δδ
THRUST/δδ
MCS SPEED
THRUST/δδ
DRAG/δδ

OPERATIONS ENGINEERING COURSE
AUGUST 01, 2001 78 FOR TRAINING PURPOSES ONLY
7.1.2 MAXIMUM RANGE SPEED
The primary parameter for measuring aircraft range is the SPECIFIC RANGE (SR) or FUEL MILEAGE. It is basically the number of nautical miles an aircraft can travel using a certain quantity of fuel, and can also be expressed as True Air Speed divided by the Fuel Flow:
FF
TAS
FUEL
NAMSR ==
Where: SR: specific range; NAM: air distance range FUEL: fuel burned TAS: true air speed FF: total fuel flow The MAXIMUM RANGE CRUISE (MRC) is the speed at which fuel mileage reaches its highest possible value. It is the most fuel efficient speed. 7.1.3 LONG RANGE CRUISE SPEED
LONG RANGE CRUISE (LRC) is the speed faster than MRC and which results in 99% of the highest specific range. Although not so fuel efficient as MRC, LRC is more commonly used because it is considerably faster than MRC (reduces flight time) and just 1% less fuel efficient. In addition, LRC provides more aircraft stability than MRC, as the MRC speed may be within or close to the 2nd regime (see item 2.1.3 - Low Speed Qualities). 7.1.4 ECONOMY CRUISE SPEED
The Economy Cruise Speed (ECON) is the speed at which operating costs are minimized.
1%
MRC LRC
SPECIFIC RANGE

OPERATIONS ENGINEERING COURSE
AUGUST 01, 2001 79 FOR TRAINING PURPOSES ONLY
Direct operating costs are affected by flight time related costs and fuel related costs. The fuel cost is the price of fuel used on a particular flight. The flight time related costs cover the following items:
• Flight crew and cabin crew wages (if they are a function of flight time); • Aircraft leasing costs; • Time related maintenance costs; • The cost of the late arrival of a flight.
The economy speed (ECON) is defined as the speed at which the sum of the time related costs and the fuel costs are minimized. The graph below shows the economic speed concept:
The Economy Cruise Speed (ECON) can be calculated as a function of the Cost Index. Cost Index is the relative importance of time cost compared to the fuel cost:
COSTFUEL
HOURFLIGHTCOSTRELATEDTIMEINDEXCOST
_
)_/($___ =
Many aircraft manufacturers publish ECON cruise speeds as a function of Cost Index. The operators use it by calculating their particular Cost Index based on the formula above, and then use the manufacturers published data to find the Mach number associated to their calculated Cost Index. By doing that, the airline is able to determine the Mach number at which their operating costs are minimized.

OPERATIONS ENGINEERING COURSE
AUGUST 01, 2001 80 FOR TRAINING PURPOSES ONLY
7.1.5 INFLUENCE OF GROSS WEIGHT ON SPEEDS
The figure below shows the MRC, LRC, ECON and MSC, and how it is influenced by the aircraft weight.
7.2 ALTITUDE SELECTION 7.2.1 MAXIMUM ALTITUDE
For a given speed, weight and thrust, there is a maximum altitude at which straight and level flight is possible. This “maximum altitude” is also called "Aircraft Ceiling". In order to provide some performance margin for the aircraft flying at the Maximum Altitude, sometimes it is defined as the maximum altitude for a given speed, weight and thrust at which the aircraft still has a residual rate of climb of, for example, 100 or 300 feet per minute. The maximum altitude at which an airplane can fly is limited by two factors:
• Engine thrust. • Capacity of the wing to generate enough buffet-free lift.
MSC
ECON

OPERATIONS ENGINEERING COURSE
AUGUST 01, 2001 81 FOR TRAINING PURPOSES ONLY
7.2.2 MANEUVER CAPABILITY OR BUFFET MARGIN
The maneuver capability (also called as Buffet Margin) represents the ability of the wing to generate enough lift for the weight of the airplane. The aircraft manufacturers usually publish graphs which show at which speed the aircraft will start experiencing high and low speed buffeting for a given weight and altitude. These graphs also show corrections for load factors greater than 1, which can be used to determine the buffeting speed in case of banked flight or in turbulence. The figure below shows a typical Maneuver Capability graph:
For a certain weight, load factor and altitude, the graph shows the minimum and maximum speeds the aircraft can fly without experiencing buffeting. If the minimum and maximum speeds coincide, it is said that the aircraft has reached the Coffin Corner. At this speed it is neither possible to accelerate or decelerate, otherwise buffeting would occur. In this case, the only option left for the pilot is to descend to a lower altitude.

OPERATIONS ENGINEERING COURSE
AUGUST 01, 2001 82 FOR TRAINING PURPOSES ONLY
The “g” margin may be expressed in terms of the level flight bank angle that corresponds to the given “g” loading. For example, an airplane flying at 39 degrees of bank while maintaining a level flight altitude will generate a loading of 1.3 g. The balance of forces:
gmL ×=× θcos ⇒ θcos
1=
× gm
L ⇒
θcos1
=n
Where: L = lift m = mass g = acceleration of gravity θ = bank angle n = load factor in g's
For a bank angle of 39 degrees:
gno
3.139cos
1cos
1===
θ
The load factor may also be written as a function of the stick shaker speed margin:
SV
gmC
Sha
shaL2
ker
ker
21 ρ
×=− (1 g level flight)
SV
LC shaL
2ker
21 ρ
=− (banked unaccelerated flight)
So, SV
L
SV
gmC
Sha
shaL22
ker
ker
21
21 ρρ
=×
=− ⇒ 2ker
2
ShaV
Vgm
L=
× ⇒
2
ker
=
ShaVV
n
From where we can say that the bank angle for reaching stick shaker for a given stick shaker speed margin is:
2
ker
=
ShaVV
n ⇒ 2
kercos1
=
ShaVV
θ ⇒
( )
=
2ker/
1arccosShaVV
θ
Normally, an extra 15 degrees margin is considered in order to compensate for turbulence and early firing of stick shaker due to high angle of attack increase rate.
θ
θ L
mg

OPERATIONS ENGINEERING COURSE
AUGUST 01, 2001 83 FOR TRAINING PURPOSES ONLY
7.2.3 OPTIMUM ALTITUDE
The optimum cruise altitude is the pressure altitude for a given weight and speed that gives the maximum specific range.
Many times it is not possible to fly at the optimum altitude because the available flight level depends on the direction of the flight or may not be cleared by the ATC. In addition, the aircraft may not have enough buffet margin to fly at that altitude.
The optimum altitude as defined above is based on the cruise specific range only, and does not consider the overall fuel consumption during an entire flight. For shorter range flights, it makes more sense defining the optimum cruise altitude as the altitude at which the entire flight fuel burn is minimized (i.e., minimizing Climb+Cruise+Descent fuel).
In must be observed that on short flights the leveled cruise segment may be very small, or non-existent at all (descent starting immediately after the climb to cruise altitude is completed). In this case, in order to allow leveled flight for in-flight meal service, a lower cruise altitude may be used, but total fuel burn is penalized. Embraer publishes on its ERJ 145 Airplane Operations Manual (AOM) a cruise altitude table based on minimum flight fuel consumption (A) and minimum flight fuel consumption with at least 40% of total flight time in leveled cruise conditions (B).
Optimum Altitude
Increasing Weight
Specific Range
Altitude

OPERATIONS ENGINEERING COURSE
AUGUST 01, 2001 84 FOR TRAINING PURPOSES ONLY
7.2.4 STEP CLIMB
During flight the weight of airplane changes (due to fuel burn), and consequently optimum altitude changes. In general, as the airplane weight decreases, the optimum altitude increases. For this reason, in long routes airlines use step climb procedures, so that the aircraft flies as long as possible close to the optimum altitude. Normally, the flight will be scheduled so that the first cruise altitude will be approximately 2000 ft above the optimum altitude. As the aircraft gets lighter the optimum altitude increases and gets closer to the aircraft cruising altitude. As the aircraft gets further lighter, it will start being below its optimum altitude, and will climb 4000 ft when the optimum altitude is 2000 ft above the aircraft cruising altitude. 7.2.5 WIND-ALTITUDE TRADE
The optimum altitude is normally calculated for zero wind, but wind is a factor that may justify operations considerably above or below the optimum altitude. For example, a favorable wind component may have an effect on ground speed which more than compensates for the loss in air range. If a stronger headwind is present at the optimum altitude than at a lower altitude, for example, it might be advantageous to fly at the lower altitude (and weaker headwind) to save fuel. This analysis of the wind in regard to the advantage of flying at a non-optimum altitude is called wind-altitude trade. 7.2.6 FLIGHT LEVELS
For air traffic control (ATC) purposes, airspace is divided into flight levels (FL), which are the pressure altitudes at which the aircraft are allowed to fly. The available flight levels may depend upon the direction of the flight, and are separated by 1000 ft steps at altitudes below 29000 ft, and 2000 ft steps at altitudes above 29000 ft. On Reduced Vertical Separation Minima (RVSM) airspaces, the flight level separation of 1000 ft is maintained in the entire altitude range.
Optimum Altitude
Cruising Altitude

OPERATIONS ENGINEERING COURSE
AUGUST 01, 2001 85 FOR TRAINING PURPOSES ONLY
Standard Instrument Flight Rules (IFR) altitudes (in countries where altitudes are measured in feet) are:
Westbound Magnetic Heading 180 - 359
Eastbound Magnetic Heading 000 - 179
2000` 3000` 4000` 5000` etc to etc to
16000` 17000` 18000` 19000` 20000` 21000` etc to etc to
28000` 29000` 31000 33000` 35000 37000` 39000 41000` 43000
2000 ft separation begins

OPERATIONS ENGINEERING COURSE
AUGUST 01, 2001 86 FOR TRAINING PURPOSES ONLY
7.3 FLIGHT PLANNING
7.3.1 FAA FUEL REQUIREMENTS - DOMESTIC
FAR 121.639 covers fuel requirements for air carriers in domestic operations. According to this rule an airplane should not be dispatched or takeoff unless it has enough fuel:
a) To fly from the origin airport to the destination airport. b) Thereafter, to fly and land at the alternate airport (if an alternate airport is necessary); and c) Thereafter, to fly 45 minutes at normal cruising fuel consumption.
The alternate airport is necessary if during the time period of 1 hour before the estimated time of arrival (ETA) and 1 hour after ETA the destination airport ceiling is 2000 ft or below, or visibility is less than 3 NM. 7.3.2 FAA FUEL REQUIREMENTS - INTERNATIONAL
FAR 121.645 covers fuel requirements for international operations. According to this rule an airplane should not be dispatched or takeoff unless it has enough fuel:
a) To fly from the origin airport and land at the destination airport. b) After that, to fly for a period of 10 percent of the total time required to fly from the airport of
departure to the airport to which it was dispatched. c) After that, to fly to and land at the most distant alternate airport specified in the flight plan,
and d) After that, to fly for 30 minutes at holding speed at 1500 feet above the alternate airport.

OPERATIONS ENGINEERING COURSE
AUGUST 01, 2001 87 FOR TRAINING PURPOSES ONLY
7.3.3 JAA FUEL REQUIREMENTS - JAR-OPS 1.255
JAA gives fuel requirements in JAR-OPS 1.255 according to the rule below:
a) To fly from the origin airport and land at the destination airport. b) Contingency fuel equivalent to 5% of the planned trip fuel (see AMC OPS 1.255 for
additional information); c) After that, to fly to and land at the most distant alternate airport specified in the flight plan,
and d) After that, to fly for 30 minutes at holding speed at 1500 feet above the alternate airport.
7.3.4 ICAO FUEL REQUIREMENTS
The International Civil Aviation Organization (ICAO) gives fuel requirements in Annex 6 to the Convention on International Civil Aviation, Part 1. According to this rule an airplane should not be dispatched or takeoff unless it has enough fuel for:
a) To fly to and land at the airport to which it is dispatched; and b) To fly to the alternate aerodrome specified in the flight plan; and then c) To fly for 30 minutes at holding speed at 450 m (1500 ft) above the alternate aerodrome,
and approach and land; and d) Have an additional amount of fuel sufficient to provide for the increased consumption on
the occurrence of any of the potential contingencies specified by the operator to the satisfaction of the state of the operator (typically 3 to 6% of the fuel for the trip).

OPERATIONS ENGINEERING COURSE
AUGUST 01, 2001 88 FOR TRAINING PURPOSES ONLY
7.3.5 RECLEARANCE
The reclearance is a procedure used to reduce the 10% (or 5%) contingency fuel, in order to increase payload availability or reduce the total fuel required for the flight.
The total fuel requirement for a flight with reclearance is sum of item a) below plus the larger between (a1+b1+c1+d1) and (a2+b2+c2+d2):
a) To fly from the origin airport to the reclearance point.
a1) To fly from the reclearance point and land at the reclearance airport. b1) After that, to fly for a period of 10 percent of the total time (or 5% of the fuel) required to fly
from the airport of origin to the reclearance airport. c1) After that, to fly to and land at the reclearance alternate airport, and d1) After that, to fly for 30 minutes at holding speed at 1500 feet above the reclearance
alternate airport.
a2) To fly from the reclearance point and land at the destination airport. b2) After that, to fly for a period of 10 percent of the total time (or 5% of the fuel) required to fly
from the reclearance point to the destination airport. c2) After that, to fly to and land at the alternate airport, and d2) After that, to fly for 30 minutes at holding speed at 1500 feet above the alternate airport.
The reclearance procedure is also called redispatch. Basically it is a procedure where the aircraft is originally dispatched using the normal rules to the reclearance airport, and at a certain point along the route (reclearance point) it is redispatched to the destination airport.
During the flight, as the aircraft reaches the reclearance point, the pilot must check the actual fuel quantity on board and compare it to the fuel required for (a2+b2+c2+d2). If not enough fuel is available, the flight cannot be redispatched to the destination airport, and the pilot is obliged to proceed to the reclearance airport.

OPERATIONS ENGINEERING COURSE
AUGUST 01, 2001 89 FOR TRAINING PURPOSES ONLY
7.3.6 FUEL ALLOWANCES
The following fuel allowances are typically considered in the fuel requirement calculations:
a) Taxi-out fuel at the origin airport. b) Takeoff fuel. c) Maneuvering fuel for approach at the destination airport. d) Go-around fuel over the destination airport. e) Maneuvering fuel for approach at the alternate airport. f) APU fuel if it is kept running at any part of the flight.
Note: The taxi-in fuel at the destination and alternate airports are normally not considered in the calculation of the minimum fuel quantity required for the flight. 7.4 FUEL TANKERING
Fuel tankering is a procedure adopted by airlines when the fuel price at the destination airport is excessively expensive. If it is cost effective, the airline will load additional fuel at the origin airport in order to minimize (or even avoid) refueling at the destination airport.
Fuel tankering causes the aircraft weight to increase, thus increasing fuel consumption. A rule of thumb for verifying if fuel tankering is economically interesting or not is to consider that any additional weight loaded on the aircraft will result in a fuel burn increase equivalent to 3% of the additional weight per flight hour.
Considering:
Q = additional fuel quantity loaded at the origin airport. t = flight time in hours. P = price of fuel at the origin airport.
The additional fuel burn (AFB) on the flight due to the extra weight carried will be:
AFB = Q x 0.03 x t
The remaining quantity of additional fuel (QR) when the aircraft arrives the destination airport will be:
QR = Q - AFB = Q - Q x 0.03 x t = Q x (1 - 0.03 x t)
The total amount of money (M) paid for the additional fuel was:
M = Q x P
So, the aircraft arrives at the destination airport with a quantity of additional fuel equal to QR, and the airline has paid M for this fuel. This results in an equivalent fuel price at destination (PR) of:
PR = M / QR = (Q x P) / (Q x (1 - 0.03 x t)) = P / (1 - 0.03 x t)
Finally, if the fuel price at destination is more expensive than PR, it is economically viable to transport fuel (tanker fuel) from the origin to destination airport. If the fuel price at destination is cheaper than PR, it is not economically interesting to tanker fuel.
Note: the 3% figure for additional fuel burn is just a typical average value for increased fuel burn per weight added to the aircraft per hour. Particular aircraft may have actual additional fuel burn above or below the 3% figure.
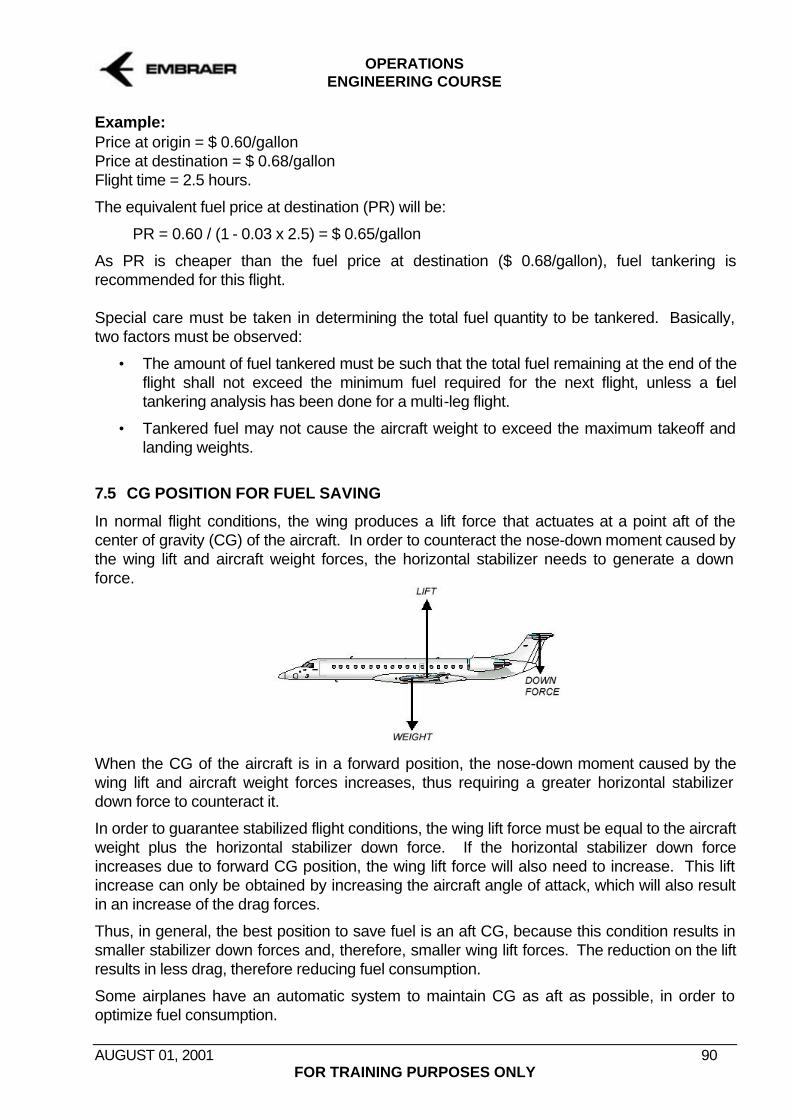
OPERATIONS ENGINEERING COURSE
AUGUST 01, 2001 90 FOR TRAINING PURPOSES ONLY
Example: Price at origin = $ 0.60/gallon Price at destination = $ 0.68/gallon Flight time = 2.5 hours.
The equivalent fuel price at destination (PR) will be:
PR = 0.60 / (1 - 0.03 x 2.5) = $ 0.65/gallon
As PR is cheaper than the fuel price at destination ($ 0.68/gallon), fuel tankering is recommended for this flight. Special care must be taken in determining the total fuel quantity to be tankered. Basically, two factors must be observed:
• The amount of fuel tankered must be such that the total fuel remaining at the end of the flight shall not exceed the minimum fuel required for the next flight, unless a fuel tankering analysis has been done for a multi-leg flight.
• Tankered fuel may not cause the aircraft weight to exceed the maximum takeoff and landing weights.
7.5 CG POSITION FOR FUEL SAVING
In normal flight conditions, the wing produces a lift force that actuates at a point aft of the center of gravity (CG) of the aircraft. In order to counteract the nose-down moment caused by the wing lift and aircraft weight forces, the horizontal stabilizer needs to generate a down force.
When the CG of the aircraft is in a forward position, the nose-down moment caused by the wing lift and aircraft weight forces increases, thus requiring a greater horizontal stabilizer down force to counteract it.
In order to guarantee stabilized flight conditions, the wing lift force must be equal to the aircraft weight plus the horizontal stabilizer down force. If the horizontal stabilizer down force increases due to forward CG position, the wing lift force will also need to increase. This lift increase can only be obtained by increasing the aircraft angle of attack, which will also result in an increase of the drag forces.
Thus, in general, the best position to save fuel is an aft CG, because this condition results in smaller stabilizer down forces and, therefore, smaller wing lift forces. The reduction on the lift results in less drag, therefore reducing fuel consumption.
Some airplanes have an automatic system to maintain CG as aft as possible, in order to optimize fuel consumption.

OPERATIONS ENGINEERING COURSE
AUGUST 01, 2001 91 FOR TRAINING PURPOSES ONLY
7.6 AIRPLANE LIMITING WEIGHTS VERIFICATION
When performing the fuel and payload calculations, the airplane structural and performance limiting weights must be observed. An easy way of guaranteeing that no limit is exceeded is by limiting the takeoff weight to the lower of the following:
a) Maximum Structural Weight, Performance limited takeoff weight or Pavement strength limited weight, whichever is lower;
b) Maximum Structural Landing Weight or Performance Limited Landing Weight, plus the Trip Fuel; or
c) Maximum Zero Fuel Weight plus the Takeoff Fuel.
Max Landing (*)
Max Perf. Takeoff
Max Struct. Takeoff
Pavement
MZFW
+ +
Trip T.O. Fuel Fuel
The lower between these weights
will be the Maximum Allowed Takeoff Weight
(*) = Max Landing is the lowest between the Max Structural Landing Weight, Performance Limited Landing Weight and Landing Pavement Strength Limited Weight.

OPERATIONS ENGINEERING COURSE
AUGUST 01, 2001 92 FOR TRAINING PURPOSES ONLY
7.7 DRIFTDOWN
For most normal cruise weights and altitudes, an airplane will not be able to maintain its cruise altitude following an engine failure, and will begin to descent (drift down). In order to remain as high as possible, the pilot will use maximum continuous thrust on the remaining engines and slow down to the optimum driftdown speed, which is the speed that results in the lower descent gradient. The airplane will then descend along what is called the optimum driftdown profile. The optimum driftdown profile will keep the airplane as high as possible during the descent. Regulations require that the actual airplane performance be calculated in the most conservative airplane configuration and then further decreased by a 1.1 percent climb gradient for two-engine airplanes, 1.4 percent for three-engine airplanes, and 1.6 percent for four-engine airplanes. This reduced gradient path is called the en-route net flight path and is used to ensure en-route obstacle clearance. During a driftdown, the available thrust increases as the aircraft descends. Eventually, at a certain altitude the available thrust will become equal to the airplane drag, and the airplane will level off. This altitude is called the gross level off altitude. The gross level off altitude, when corrected by the 1.1%, 1.4% or 1.6% gradient margins, is called the net level off altitude and will depend on the atmospheric temperature and the airplane weight. The aircraft actual climb gradient (gross gradient) at the net level off altitude will be 1.1%, 1.4% or 1.6%. The net gradient is the gross gradient subtracted by 1.1%, 1.4% or 1.6%. Obviously, the net gradient is zero at the net level off altitude, and the gross gradient is zero at the gross level off altitude. Regulations require that the airplane be able to clear all terrain by a given margin when an engine fails. Two means of compliance for en-route obstacle clearance are allowed:
• The net level-off altitude must clear all en-route obstacles by at least 1000 ft; or
• The net flight path must clear all en-route obstacles between the point where the engine is assumed to fail and an airport where a landing can be made by at least 2000 ft.

OPERATIONS ENGINEERING COURSE
AUGUST 01, 2001 93 FOR TRAINING PURPOSES ONLY
7.7.1 EN-ROUTE OBSTACLE ACCOUNTABILITY AREA All terrain and obstructions along the route within 9.3 Km (5 NM) of either side of the intended track must be considered when doing a en-route obstacle analysis. Alternatively, the published minimum flight altitudes (Minimum En-Route Altitude, MEA, or Minimum Off Route Altitude, MORA) may be used. MEA and MORA normally already provide the required 2000 ft obstacle clearance for driftdown, however, at and below 6000 ft altitude, MEA and MORA cannot be used directly as only 1000 ft is ensured. 7.7.2 USING THE DRIFTDOWN CURVE TO DEFINE OPERATIONAL PROCEDURES Prior to departure a detailed analysis of the route should be made using contour maps of the high terrain and plotting the highest points within the prescribed corridor's width along the route (or, alternatively, using MEA or MORA as described above). The next step is to determine if it is possible to maintain level flight with one engine inoperative 1000 ft above the highest point of the crossing. If this is not possible, or if the associated weight penalties are unacceptable, a driftdown procedure should be worked out, based on engine failure at the most critical point and clearing critical obstacles during the driftdown by at least 2000 ft. The minimum cruise altitude and the point of no return (PNR) are determined by the intersection of the two driftdown paths. If an engine failure occurs after the PNR, the airplane will drift down on course. If the failure occurs before PNR, the airplane will have to turn back. In either flight direction the net flight path must clear the obstacles by 2000 ft. Suppose that you are starting operation along a route that overflies the following terrain profile: The first step is to calculate the driftdown net path. There will be two paths: one considering the wind component for a driftdown along the initial component flight direction, and another considering the wind component for a turn back and driftdown in opposite flight direction.
NET DRIFTDOWN PATH
2000 FT BELOW NET DRIIFTDOWN PATH
FLIGHT DIRECTION

OPERATIONS ENGINEERING COURSE
AUGUST 01, 2001 94 FOR TRAINING PURPOSES ONLY
The idea is to combine the driftdown curve with the terrain profile. The point where the dashed line touches the terrain is the earliest point (A) along the route where the pilot can elect to proceed ahead. Continuing ahead anywhere before this point would result in the aircraft passing too close to the terrain or even flying into it. Now, the procedure is repeated but this time using the opposite direction driftdown curves, and starting with the curves at left of the terrain profile. Moving the curves to the right until the dashed curve touches the terrain profile. This represents the latest point (B) along the route where the pilot can elect to do a 180-degree turn and return: The altitude at which the solid lines cross each other is the minimum flight altitude, and the crossing point defines the point of no return (PNR). If an engine failure occurs before the PNR, the pilot must perform a 180 degrees turn and do the driftdown in a direction opposite to the original flight. If the engine fails after the PNR, the driftdown must be done along the original flight direction. Flight in altitudes lower than the minimum flight altitude is not permitted because the minimum terrain clearance would not be guaranteed.
B
2000 FT
A
PNR Minimum Altitude

OPERATIONS ENGINEERING COURSE
AUGUST 01, 2001 95 FOR TRAINING PURPOSES ONLY
7.7.3 DEPARTURE OR DESTINATION AIRPORT CLOSE TO THE MOUNTAINS If the departure airport is close to the mountains that require driftdown analysis, it is not necessary to climb to the minimum cruise altitude before starting the obstacle crossing. In this case, it is preferable to just verify if the all engines gross climb profile is always above the opposite flight direction driftdown path when crossing starts. A climbing pattern above the departure airport is necessary up to the point where the all engines gross climb profile crosses the net driftdown path. A similar analysis can be done if the destination airport is located close to the mountains. In this case, the top of descent (TOD) point must be delayed until it can be guaranteed that the all engines gross descent profile will be above the net driftdown path.
PNR Minimum Altitude
Departure Airport
All engines gross climb path without adequate obstacle clearance
PNR Minimum Altitude
Departure Airport
Climb pattern to allow all engines gross climb path to reach the driftdown curve before crossing the obstacles.

OPERATIONS ENGINEERING COURSE
AUGUST 01, 2001 96 FOR TRAINING PURPOSES ONLY
7.7.4 INTERMEDIATE ALTERNATE AIRPORT Sometimes the large quantity of obstacles along the route may result in unacceptable weight penalties, high minimum cruise altitudes or impossibility of PNR determination. In this case, the existence of an intermediary alternate airport allows the construction of a double driftdown path, minimizing the penalties. When an intermediate alternate airport is used, two PNR's and two minimum altitudes are defined, each one to be used in its associated route segment. 7.7.5 TEMPERATURE ADJUSTMENTS TO AIRCRAFT PRESSURE ALTITUDE The driftdown tables published by aircraft manufacturers typically show driftdown paths and level off information in terms of pressure altitude. As explained on item 2.3.2 Geometric (True) Altitude Variation with ISA, the pressure altitude may not correspond to the actual height of the aircraft.
When performing driftdown analysis, it is important to convert the obstacles heights to pressure altitude before comparing it to the net flight path. This is especially important on cold days, when the pressure altitude is higher than the actual height of the aircraft.
PNR Minimum Altitude
PNR 1 Minimum Altitude 2
Minimum Altitude 1 PNR 2
Alternate Airport

OPERATIONS ENGINEERING COURSE
AUGUST 01, 2001 97 FOR TRAINING PURPOSES ONLY
7.8 EMERGENCY DESCENT AND OXYGEN REQUIREMENTS
An operator shall not operate a pressurized airplane at pressure altitudes above 10000 ft unless supplemental oxygen equipment, capable of storing and dispensing the oxygen supplies required is provided. The amount of supplemental oxygen required shall be determined on the basis of cabin pressure altitude, flight duration and the assumption that a cabin pressurization failure will occur at the pressure altitude or point of flight that is most critical from the standpoint of oxygen need, and that, after the failure, the airplane will descend in accordance with emergency procedures specified in the Airplane Flight Manual to a safe altitude for the route to be flown that will allow continued safe flight and landing. (JAR-OPS 1.770).
DEPRESSURIZATION
EMERGENCY DESCENT
10000 FT
Enough O2 supply

OPERATIONS ENGINEERING COURSE
AUGUST 01, 2001 98 FOR TRAINING PURPOSES ONLY
7.9 ETOPS
Extended Range Operation with Two Engine Airplanes (ETOPS) is a special certification that the aircraft and aircraft operator must have to operate over a route that contains a point more distant than 60 minutes flying time (in still air at normal cruising speed with one engine inoperative) from an adequate aerodrome. In order to have the ETOPS certification, the aircraft must be designed with certain considerations and the operator must gain the operational approval. Some factors that must be considered are listed below:
• Airframe/engine designed for fail-safe criteria • Effect of operation with a single engine • Fuel management • Independent sources of AC power • Cargo fire protection system • Equipment cooling • Analysis of failure effects • In-Service experience • Manufacturer validation flight test • Propulsion system reliability record • Maintenance program reliability • Operational limitations and Flight Dispatch considerations Once ETOPS approved, the aircraft and operator gain approvals for either 75 min, 90 min, 120 min or 180 min from an adequate alternative aerodrome. ETOPS CIRCLES
Any point along a route must be located within the ETOPS approval time range circles (or 60 min for non-ETOPS approved aircraft):

OPERATIONS ENGINEERING COURSE
AUGUST 01, 2001 99 FOR TRAINING PURPOSES ONLY
In JAR OPS 1.245 it is defined that for aircraft without ETOPS certification, the 60 min range circles shall be calculated based in the following conditions: 1) International Standard Atmosphere (ISA); 2) Level Flight (i.e., no driftdown may be considered); 3) FL 170 (17000 ft) or at the maximum flight level to which the airplane, with one engine
inoperative, can climb, and maintain, using the gross rate of climb specified in the AFM, whichever is less.
4) Airspeed, not exceeding Vmo, that can be maintained with one engine inoperative. 7.10 EXTENDED OVERWATER OPERATIONS
Extended Overwater Operations is not the same thing as ETOPS. ETOPS is related to single engine flight to a diversion airport, while Extended Overwater Operations is related to flight away from land (any shore or island are considered land, and no airport availability is required).
Each certification authority defines Extended Overwater differently:
• FAR Part 1 defines Extended Overwater Operations when the aircraft is more than 50 NM distant from land.
• Brazilian RBHA Part 1 defines Extended Overwater Operations when the aircraft is more than 200 NM distant from land.
• JAR-OPS 1 defines Extended Overwater Operations when the aircraft is more than 400 NM distant from land.
The aircraft must be certified for Ditching in order to perform Extended Overwater Operations. In addition, life rafts are also required.
Depending on certification authority requirements, the availability of life vests may be required even if the aircraft will overfly water at a distance from land that does not characterize the flight as an Extended Overwater Operation.

OPERATIONS ENGINEERING COURSE
AUGUST 01, 2001 100 FOR TRAINING PURPOSES ONLY
8. APPROACH AND LANDING PERFORMANCE
8.1 CLIMB LIMITED LANDING WEIGHT
In case of a go-around in approach configuration or in landing configuration, certain minimum climb gradients are required by regulations. The maximum aircraft weight that complies with these gradient requirements are called the Approach Climb Limited Weight and Landing Climb Limited Weight. For performance calculations, the approach climb configuration and landing climb configurations are defined below:
a) Approach climb configuration • one engine inoperative • go-around thrust on remaining engines • approach flaps • landing gear up • speed equal to the approach climb speed (VAPPCLB or VGA)
b) Landing climb configuration • all engines operative • go-around thrust on all engines • landing flaps • landing gear down • speed equal to the landing climb speed (VLDGCLB, usually equal to VREF)
The minimum climb gradients and the aircraft configuration are given in the table below:
Configuration Minimum Gradients Gear Flap Thrust Max Number of engines Speed 2 3 4 Approach up Approach
position 1 engine inoperative T/O Thrust on remaining engines
1.5 Vs
2.1 %
(*)
2.4%
(*)
2.7%
Landing down Landing position
T/O thrust on all engines
1.3 Vs 3.2% 3.2% 3.2%
(*) - For JAA certified aircraft, as per JAR-AWO 243, the minimum gradient required for go-around (approach climb) during a CAT II approach is 2.5%.
LANDING CLIMB
APPROACH CLIMB

OPERATIONS ENGINEERING COURSE
AUGUST 01, 2001 101 FOR TRAINING PURPOSES ONLY
8.2 LANDING FIELD LENGTH
Landing distance is the total horizontal distance from the runway threshold until the point where the aircraft comes to a complete stop, considering that it crosses the runway threshold at a height of 50 ft and at the landing reference speed VREF. Maximum braking capability and ground spoilers are used for calculating the landing distance, but no thrust reverser credit is allowed.
FAR-121 and JAR-OPS-1 Landing Field Length regulations requires that the landing distance on a dry runway, based on the landing weight assuming normal fuel consumption, must not exceed 60% of the available landing distance.
There is another way of interpreting this requirement: given a certain dry landing distance (actual landing distance), the available runway length must be at least the actual landing distance multiplied by 1.67 (1/60% = 1.67).
The Landing Field Length Limited Weight is the maximum weight at which the aircraft is capable of landing in 60% of the available runway length.
FAR-121 and JAR-OPS-1 state that In case of wet runway, the minimum required length must be the dry runway required length increased by 15 percent. As the dry runway required length is the dry actual landing distance multiplied by 1.67, the wet runway required length is the dry actual landing distance multiplied by 1.92 (1.67 x 115% = 1.92).
VREF
50 ft V = 0
Actual Dry Distance
Dry Field Length = 1.67 x Actual Dry Distance
DRY RUNWAY
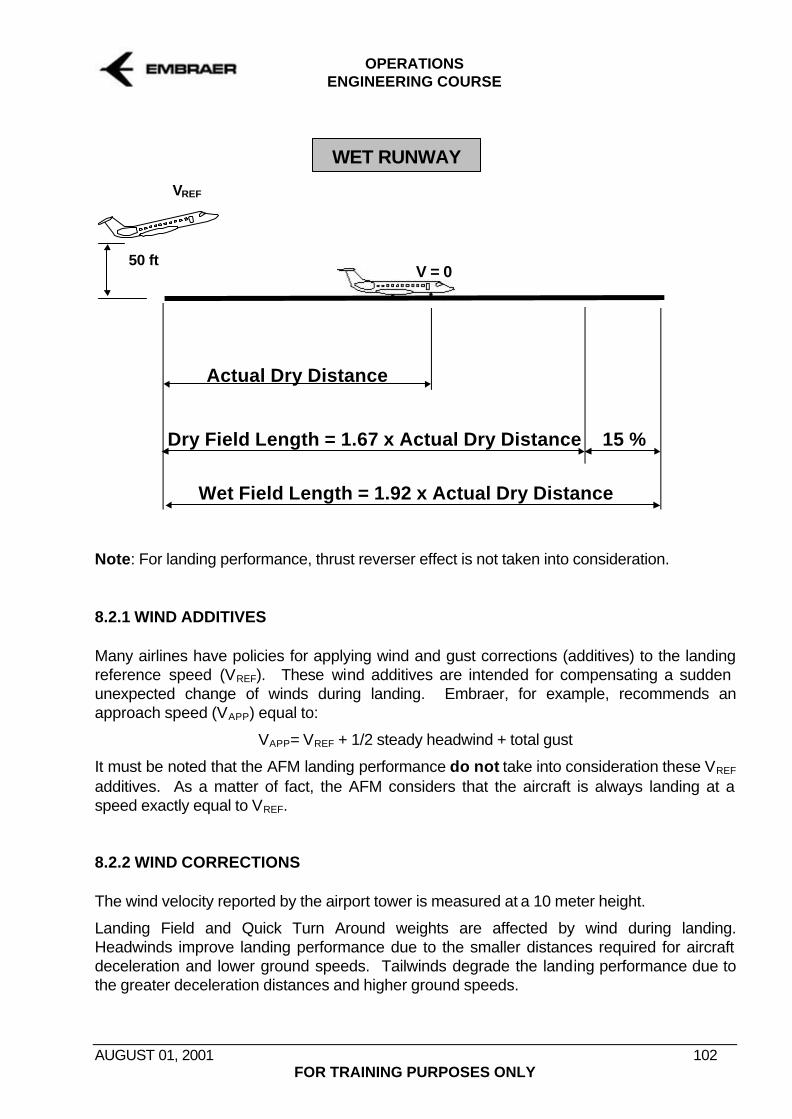
OPERATIONS ENGINEERING COURSE
AUGUST 01, 2001 102 FOR TRAINING PURPOSES ONLY
Note: For landing performance, thrust reverser effect is not taken into consideration. 8.2.1 WIND ADDITIVES Many airlines have policies for applying wind and gust corrections (additives) to the landing reference speed (VREF). These wind additives are intended for compensating a sudden unexpected change of winds during landing. Embraer, for example, recommends an approach speed (VAPP) equal to:
VAPP= VREF + 1/2 steady headwind + total gust
It must be noted that the AFM landing performance do not take into consideration these VREF additives. As a matter of fact, the AFM considers that the aircraft is always landing at a speed exactly equal to VREF. 8.2.2 WIND CORRECTIONS The wind velocity reported by the airport tower is measured at a 10 meter height.
Landing Field and Quick Turn Around weights are affected by wind during landing. Headwinds improve landing performance due to the smaller distances required for aircraft deceleration and lower ground speeds. Tailwinds degrade the landing performance due to the greater deceleration distances and higher ground speeds.
VREF
50 ft V = 0
Actual Dry Distance
Dry Field Length = 1.67 x Actual Dry Distance 15 %
Wet Field Length = 1.92 x Actual Dry Distance
WET RUNWAY

OPERATIONS ENGINEERING COURSE
AUGUST 01, 2001 103 FOR TRAINING PURPOSES ONLY
Performance regulations require that the aircraft manufacturer must consider the following factors when developing the AFM charts:
• AFM charts must be developed considering only 50% of the reported headwind and 150% of the reported tailwind. This is to guarantee appropriate performance margins in case the actual headwind is weaker than the reported one, or if the actual tailwind is stronger than the reported one.
• The wind reported by the airport tower (V10 = wind measured at 10 meter height) must be corrected for the aircraft actual height above ground by using the following formula: VH = V10 x (H/10)1/7 , where H = aircraft wing height above ground level.
The AFM charts already incorporate these wind adjustments, so that no additional corrections need to be made when using the AFM charts (actual tower reported wind, without corrections, must be used when calculating the takeoff performance from the AFM). 8.3 QUICK TURN AROUND WEIGHT
The Quick Turn Around Weight is not a landing limiting weight. It is just a reference weight to define if a brake cooling period is required before a subsequent takeoff or not.
During landing the brakes are used and consequently their temperature increases. The peak brake temperature usually doesn’t occur during the landing itself, but a few minutes after.
The Quick Turn Around Weight (QTAW) is a reference weight at which it is known that if the aircraft lands at a weight lighter than the QTAW the brakes will not become overheated and enough energy margin for a rejected takeoff subsequent to the landing is available. If the aircraft lands at a weight heavier than the QTAW, a cooling period is required and a subsequent takeoff is only allowed after the cooling period is expired and tire fuse plugs are checked not melted.
The Quick Turn Around Weight is calculated based on: • Maximum Manual Braking • Idle Thrust (no Reverse Thrust credit is taken) • Speed Brakes extended
Usually the QTAW is a conservative reference, because the conditions above are not typical of a normal landing, where normal braking is used and thrust reversers are deployed. For this reason, many manufacturers certify their aircraft with a Brake Temperature Monitoring System (BTMS). With BTMS the pilot can monitor the actual brake temperature, and a subsequent takeoff is allowed provided the brakes temperature are in the normal (green) range.
The ERJ-145 family does have BTMS installed.

OPERATIONS ENGINEERING COURSE
AUGUST 01, 2001 104 FOR TRAINING PURPOSES ONLY
9. WEIGHT AND BALANCE
9.1 STANDARD TERMS AND DEFINITIONS
EQUIPPED EMPTY WEIGHT (EEW) OR MANUFACTURER EMPTY WEIGHT (MEW)
It is the weight of structure, power plant, instruments, interior furnishings, systems, optional, portable, and emergency equipment and other items of equipment that are an integral part of the airplane configuration. It is essentially a dry weight, including only those fluids contained in closed systems such as oxygen, fire extinguisher agent, landing gear shock absorber fluid, etc...
BASIC EMPTY WEIGHT (BEW)
It is the MEW plus the weight of the following items: APU oil Engine oil Hydraulic fluid Unusable fuel
OPERATIONAL EMPTY WEIGHT (OEW) OR DRY OPERATING WEIGHT (DOW)
It is the BEW plus the weight of the operational items. Operational items are those necessary for airplane operation and not included in the BEW. The operational items are: Crew and crew baggage Navigation kit (manuals, charts, etc.) Catering (beverages and foods) and removable service equipment for galley (such as standard units, etc.) Lavatory rinse water Lavatory chemical fluid
ACTUAL ZERO FUEL WEIGHT (AZFW)
This is the OEW plus actual payload.
PAYLOAD OR TOTAL TRAFFIC LOAD
This is the weight of passengers, baggage and cargo.
MAXIMUM ALLOWABLE PAYLOAD
It is the maximum approved weight that can be loaded into the airplane. Maximum payload is the Maximum Zero Fuel Weight (MZFW) less Operational Empty Weight (OEW).
MAXIMUM DESIGN ZERO FUEL WEIGHT (MZFW)
This is the maximum authorized weight before usable fuel be loaded. The MZFW is related to airplane structural limitations.

OPERATIONS ENGINEERING COURSE
AUGUST 01, 2001 105 FOR TRAINING PURPOSES ONLY
MAXIMUM DESIGN RAMP WEIGHT (MRW)
This is the maximum authorized ramp weight.
MAXIMUM DESIGN TAKEOFF WEIGHT (MTOW)
This is the maximum authorized weight for takeoff.
MAXIMUM DESIGN LANDING WEIGHT (MLW)
This is the maximum authorized weight for landing.
MINIMUM OPERATING WEIGHT (MOW)
This is the minimum authorized weight to operate the airplane.
MEAN AERODYNAMIC CHORD (MAC)
This is the chord of an imaginary rectangular airfoil with the same area of the actual wing and which produces the same resulting force vectors of the actual wing. The aircraft forward and aft CG limits are referred to in terms of %MAC.
CENTER OF GRAVITY (CG)
This is the position where the mass of the aircraft is considered concentrated for balance purposes. It is normally referred to in terms of %MAC.

OPERATIONS ENGINEERING COURSE
AUGUST 01, 2001 106 FOR TRAINING PURPOSES ONLY
AIRPLANE DATUM
This is a plane perpendicular to the fuselage centerline from where all arm measurements are taken.
INDEX SYSTEM
This is a convention for presenting aircraft or body moments. It is the moment of the body converted to a different measuring system. 9.2 FORCES AND MOMENTS
LIFT OF THE WING
The lift of the wing is considered a single force for weight and balance purposes, which results from the integration of the entire pressure distribution over the wing.
Examining a single wing section, the lift of this section acts through the so-called Center of Pressure (CP), whose location is expressed as a percentage of the chord length as measured from the leading edge. Since a rectangular wing consists of identical wing sections, the location of the total wing lift is known.
A sweptback wing has sections that differ in size, and frequently in profile shape. However, a representative segment on each wing half exists, whose aerodynamic characteristics reflect the average of the entire wing half, thus localizing the center of pressure. The chord line of this

OPERATIONS ENGINEERING COURSE
AUGUST 01, 2001 107 FOR TRAINING PURPOSES ONLY
particular profile is the Mean Aerodynamic Chord (MAC). The position of the total lift force and of the center of gravity is given in percent MAC, from the MAC-leading edge.
LIFT OF THE STABILIZER
The “lift” of the stabilizer can be directed upward or downward depending on flight conditions (normally downwards). The force generated by the stabilizer controls the airplane about the pitch axis, as well as trim the aircraft for center of gravity CG and speeds variations. Additionally, the stabilizer is used to compensate for thrust forces of engines not acting through the CG.
CONDITIONS OF EQUILIBRIUM
Straight and level flight is only possible if the vertical forces are balanced, that is, if their sum is equal to zero. Furthermore, the moments generated by each force about any axis of rotation (here acting on CP) must be balanced too. In the next picture the forces are so located that balance is given.

OPERATIONS ENGINEERING COURSE
AUGUST 01, 2001 108 FOR TRAINING PURPOSES ONLY
Forces: 100 - 90-10 = 0 Moments (1 x 100) - (10 x 10) = 0
Generally, the moments are not related to the center of pressure (CP), but to a certain balance station whose units are (m x kg). This however results in large numbers that are then transformed to more workable figures through division and addition of constants. The resultant no longer has the units (m x kg), but is still a moment and is referred to Index.
EXAMPLE OF CG POSITION CALCULATION
∑Mo = TOW . XCG
10 x 2.000 + 24,5 x 60.000 + 25 x 3.000 + 1.800 x 40 = 66.800 x XCG
XCG = 24,5 m
%( )
MACXcg LEMAC
MAC=
− × 100
%( , )
MAC =− ×24 5 24 100
1 è % MAC = 50 %

OPERATIONS ENGINEERING COURSE
AUGUST 01, 2001 109 FOR TRAINING PURPOSES ONLY
9.3 CENTER OF GRAVITY LIMITS
FORWARD LIMIT OF THE CENTER OF GRAVITY
The vertical force (upwards and downwards) generated by the stabilizer is limited by the design of the stabilizer. At low airspeeds, common during takeoff and landing, the stabilizer force is lower. However, it is at this configuration that the aircraft requires high angles of attack which can only be established by a sufficient control moment.
Supposing in the next picture, that the maximum control force of the stabilizer is 20 tons, then the center of gravity for that given weight is located too far ahead. In this case the CG must be located less than 4 m ahead of the CP for the aircraft to remain controllable.
Thus, the maximum allowable forward CG position is dictated by the controllability of the aircraft. According this example, our stabilizer produces a maximum lift force of 20 tons and creates a control moment (with reference to the CP point) of
Ms(1) = 20m x 20 ton = 400 m x ton
For a CG position of 5 m in front of center of pressure (CP), the aircraft weight of 100 ton will create a moment (opposite to control moment) of
Mw (1)= 5 m x 100 ton = 500 m x ton
As we can see, stabilizer lift moment will not be able to compensate the weight moment for this forward CG of 5m.
In order to maintain the controllability of the aircraft we limit the forward CG limit to 4m from CP and obtain the following moment:
Ms(2) = 20 m x 20 ton = 400 m x ton ≥ Mw (2) = 4 m x 100 ton = 400 m x ton
This moment Mw (2) must be less or equal than Ms(2) to warranty the airplane controllability.
20 To

OPERATIONS ENGINEERING COURSE
AUGUST 01, 2001 110 FOR TRAINING PURPOSES ONLY
AFT LIMIT OF THE CENTER OF GRAVITY
Analogous to the forward CG limit, there is an aft CG limit which in most cases depends on the maximum possible upward directed lift force that the horizontal stabilizer can generate. Apart from this static aspect, there is also a dynamic criterion:
The aircraft should fly stabilized, i.e. after an external disturbance the aircraft should return to the former flight condition without any intervention from the pilot. If for example the aircraft is hit by a gust, the angle of attack is increased for a short time. The lift forces on the wings and the stabilizer change linearly with the angle of attack, but to different extents.
To grant longitudinal stability a clearly defined restoring moment ∆M is required. For this
example it is assumed to be ∆M > 30 m x ton.
Case 1
∆M(1) = 2 m x 5 ton = 10 m x ton and ∆M(2) = 22 m x 1 ton = 22 m x ton
∆M =∆M(1) +∆M(2) =32 m x ton
Case 2
∆M(1) = 1 m x 5 ton = 5 m x ton and ∆M(2) = 21 m x 1 ton = 21 m x ton
∆M =∆M(1) +∆M(2) =26 m x ton
From first picture can be seen that the restoring moment of 32 m x ton is sufficient to return the aircraft to equilibrium, whereas the restoring moment in second picture is not, since it is less than required 30 m x ton.
On the contrary; the angle of attack keeps increasing, aggravating the situation even more.
The further the CG moves backwards the less the restoring moment will be. If ∆M becomes zero there will be no tendency for the airplane to either return to equilibrium or diverge from it. The airplane is thus neutrally stable and is said to have reached its “neutral point”.
For a manual flight, commercial air transport aircraft must have positive stability to maintain a stability margin. The amount of margin required is a function of a number of variables and will generally differ from one airplane to another.
The maximum permissible aft limit is thereby defined by the controllability or the static inherent stability of the aircraft.

OPERATIONS ENGINEERING COURSE
AUGUST 01, 2001 111 FOR TRAINING PURPOSES ONLY
Naturally, changes in position and intensity of aerodynamic forces during variations in angle of attack will be taken into consideration for the calculation of the CG limit.
The CG limits on the Balance Chart are shown with certain safety margins (certified limit/operational limit) to cover inaccuracies and CG shifts resulting from inflight movement of passengers
CENTER OF GRAVITY ENVELOPE
The airplane center of gravity (CG) limits are defined by a CG envelope contained in the Airplane Flight Manual and in the Weight and Balance Manual. For all flight phases (takeoff, cruise and landing), the airplane CG must be within the allowable range defined in the CG envelope.
LIMITING FACTORS On an airline point of view, the ideal situation is to have a CG envelope as wide as possible. But, on the aircraft manufacturer point of view, any expansion in the CG envelope may be associated to structural reinforcements and degradation on performance and stability.

OPERATIONS ENGINEERING COURSE
AUGUST 01, 2001 112 FOR TRAINING PURPOSES ONLY
The main factors associated to each part of the CG envelope are: • Forward Limits: structural and force in controls and stability • Aft Limits: structural and stability 1) Flight stability and nose gear steering effectiveness (Takeoff Pitch Up) 2) Main landing gear, center fuselage and horizontal tail. 3) nose landing gear, forward and aft fuselage and wing; 4) nose gear loads, horizontal tail and aft fuselage, takeoff performance; 5) forward & aft fuselage, and wing; 6) aft fuselage, landing gear and wing; 7) fuselage, landing gear and wing BEST CG POSITION FOR PERFORMANCE In general, the best position to save fuel is an aft CG, because this condition results in smaller stabilizer down forces and, therefore, smaller wing lift forces. The reduction on the lift results in less drag, therefore reducing fuel consumption. Some airplanes have an automatic system to maintain CG as aft as possible, in order to optimize fuel consumption. Similarly to this fuel consumption analysis, an aft CG is also beneficial to takeoff performance. For this reason the certification flight tests must be performed in the most forward CG position, so that the AFM takeoff performance is conservative for any CG position located aft of the forward limit of the CG envelope. Some airplanes have a special AFM supplement with a restricted CG envelope, in order to improve the takeoff performance. 9.4 CENTER OF GRAVITY CURTAILMENTS
The aircraft weight and balance calculations are normally performed assuming that passengers are evenly distributed along the aircraft cabin and that the crew, passengers and movable items are fixed in a pre-determined position.
For all practical purposes, however, it is known that passengers may not be evenly seated, flight attendants move along the cabin, the landing gear retracts, etc. All these movements, not previously expected in the weight and balance calculations, may result in deviations from the assumed load distribution.
For these reasons, some aeronautical authorities (including the JAA states as required by Appendix 1 to JAR-OPS 1.605) require that airlines use an Operational CG envelope, which is the AFM certified CG envelope reduced by a CG margin to account for the possible deviations from the assumed load distribution. This process is known as Center of Gravity Curtailment.
There are 3 basic types of CG curtailments:

OPERATIONS ENGINEERING COURSE
AUGUST 01, 2001 113 FOR TRAINING PURPOSES ONLY
• Takeoff and landing allowances: These are the deviations that affect the CG position for takeoff and landing. Uneven distribution of passengers, flap and landing gear movement and cargo/baggage shift are considered takeoff and landing allowances.
• Flight allowances: These are the deviations that affect the CG position in flight. All takeoff and landing allowances plus flight attendant and catering service movement are considered in-flight allowances.
• Fuel allowances: If the airline does not wish to check the CG position at the landing weight, it is necessary to consider a fuel allowance due to CG shift caused by the reduction of fuel quantity during the flight. In addition, it may be necessary to consider an allowance due to variations in the fuel density.
The CG curtailment process is a critical procedure because the amount of CG margin (curtailment) depends on the possible deviations considered by the airline. If excessive deviations (allowances) are considered by the airline, a very thin Operational CG envelope may be obtained, resulting in huge difficulties to balance the aircraft during airline operations. In the other hand, if few deviations (allowances) are considered, a large Operational CG envelope is obtained, but safety may be jeopardized by CG deviations from the assumed load distribution.
NOTE: For Ferry or Training flights, in which passenger or flight attendant movement is not an issue, a constrained center of gravity envelope without some of the takeoff and flight allowances may be used so as not to limit these types of flight unnecessarily.
9.5 INDEX SYSTEM
When determining the aircraft center of gravity position it is necessary to make calculations adding and/or subtracting the moment caused by each individual item loaded in the aircraft.
Moment, per definition, is weight multiplied by the distance to a reference point. If the moment of the aircraft and of the items loaded on it are computed in reference to the aircraft datum, very long numeric expressions would result.
As the operational usage of long numeric expressions may result in safety problems (since personnel may get confused with the long numbers), airlines usually adopt an Index System for weight and balance purposes.
The Index Systems is just a convention for presenting aircraft or body moments on a different measuring system. When using the Index System, short numeric expressions result.
The Index System formula is presented below:
I = W x (Arm - A) + C B
where:
I = Index
W = Aircraft or body weight
Arm = Aircraft or body center of gravity

OPERATIONS ENGINEERING COURSE
AUGUST 01, 2001 114 FOR TRAINING PURPOSES ONLY
A = Reference arm. Selected arm around which all index values are calculated. On the balance chart CG envelope, the Reference Arm CG% line is the only vertical CG% line. (*)
B = Constant used as a denominator to convert moment values into index values. On the balance chart CG envelope, B controls the CG% lines splay (splay decreases with increasing B). (*)
C = Constant used as a plus value to avoid negative index figures. It is only used when computing the aircraft Operating Empty Weight Index (OEI), and is not used when computing individual bodies index influence. On the balance chart CG envelope, the Reference Arm CG% vertical line is at C index units. (*)
(*) - Values for A, B and C may be chosen at the operator discretion.
9.6 BASIC OPERATING WEIGHT AND BASIC OPERATING INDEX CALCULATION
In order to determine the Basic Operating Weight and Basic Index, the following information must be provided:
• Basic Empty Weight or Manufacturer Empty Weight plus weight values for APU oil, engine oil, hydraulic fluid and unusable fuel.
• Pilot and copilot, flight attendants, crew baggage, navigation kit and lavatory fluid weights. • Catering distributed in forward, mid and aft trolleys. For these calculations we use the following formulas used for Balance Chart design: CG (%MAC) = (ARM - LEMAC) x 100 / MAC,
Where: LEMAC=14.6 (Leading edge MAC distance) MAC=2.868 (Main Aerodynamic Chord)
I = W x ( ARM - A)/B + C
Where: A=15 (Reference arm around which all index values are calculated) B=200(Convert moment values into index) C=15 (Constant used to avoid negative index figures)

OPERATIONS ENGINEERING COURSE
AUGUST 01, 2001 115 FOR TRAINING PURPOSES ONLY
ITEM
WEIGHT (Kg) ARM (m) MOMENT (kg.m) CG (%) INDEX (I.U.)
BEW 12000 15.852 190224.1 43.7 66.1
Lavatory fluid 20 20.66 413.2
7 20.58 144.1 Pilot & Copilot 164 3.63 595.3 Flight attendant (fwd) 70 4.8 336.0 Flight attendant (aft) 70 19.88 1391.6 Crew baggage 15 22.6 339.0 Navigation kit 8 3.95 31.6 Sub-total 12354 15.66 193474.8 37.0 55.8 Catering fwd 50 5 250.0 Catering mid 60 5.55 333.0 Catering aft 60 6.8 408.0 Catering Aft Compartment 0 22.6 0.0 DOW 12524 15.53 194465.8 32.4 48.0
9.7 BALANCE CHART
Works with index and weights a) The schedule can be used by relatively untrained personnel ( low cost); b) An error in the alignment of the overlay can cause balance error. Training is important to
minimize this possibility c) All calculations are permanently recorded and can be checked; d) Visual indication of balance effect on airplane is given for each load item, planning cargo
distribution is simplified; e) Calculation and art work are required for revision if new weight or center of gravity limits
are certified. f) The printing of the grid and the overlay requires a relatively high degree of accuracy.

OPERATIONS ENGINEERING COURSE
AUGUST 01, 2001 116 FOR TRAINING PURPOSES ONLY
EMBRAER EXAMPLE:
Basic Operating Weight and Index (BOW/BOI):
EC EC -- GZI GZI Pantry Configuration:
Crew Configuration: Pantry A Pantry B Pantry C
2 cockpit / 0 attendant 12406 48 12506 43 12606 39
2 cockpit / 1 attendant 12476 44 12576 40 12676 35
2 cockpit / 2 attendant 12546 46 12646 42 12746 37
3 cockpit / 0 attendant 12491 43 12591 39 12691 34
3 cockpit / 1 attendant 12561 40 12661 35 12761 31
3 cockpit / 2 attendant 12631 42 12731 37 12831 32
Passenger Weights:
Adults: Children: Infants: Number: Weight
(Kg) Number: Weight
(Kg) Number: Weight
(Kg) 1 84 1 35 1 10 2 168 2 70 2 20 3 252 3 105 3 30 4 336 4 140 4 40 5 420 5 175 5 50 6 504 6 210 6 60 7 588 7 245 7 70 8 672 8 280 8 80 9 756 9 315 9 90 10 840 10 350 10 100 11 924 12 1008 13 1092 14 1176 15 1260 PAX A = rows 1 to 5 (13 seats, total) 16 1344 17 1428 PAX B = rows 6 to 10 (15 seats, total) 18 1512 19 1596 PAX C = rows 11 to 17 (21 seats, total) 20 1680 21 1764

OPERATIONS ENGINEERING COURSE
AUGUST 01, 2001 117 FOR TRAINING PURPOSES ONLY
0 10 20 30 40 50 60 70 80 90 100 110
BASIC INDEX
10000
12000
14000
16000
18000
20000
22000
24000
0 10 20 30 40 50 60 70 80 90 100 110
INDEX
WE
IGH
T (K
g)
a-a
10% 20% 25% 30% 35% 40%
45%
15%
MZFW
MTOW
Basic Weight
KG
ZFW
KG=
TOW
KG=
Fuel
KG+
Payload
KG+
PAX Arows 1 - 5
PAX
2 PAX
PAX Brows 6 - 10
PAX
2 PAX
PAX Crows 11 - 17
PAX
2 PAX
FUELMax 5187 Kg
I.U.
- 1 IU +KG
WRDBMax 57 Kg
KG
50 Kg
CGO 1100 KgMax 1200 Kg
a
KGa
FUEL INDEX STAB TRIM
KG IU CG% units
0 0 < 25 8
500 -1 30 7
1000 -2 35 6
1500 -2 40 5
2000 -2 43 4
2500 -2
3000 -2
3500 -1 Prepared by:
4000 -1
4500 0
5000 +1
5200 +2
ZFW Kg
CG %
TOW Kg
CG %
STAB TRIM Units

OPERATIONS ENGINEERING COURSE
AUGUST 01, 2001 118 FOR TRAINING PURPOSES ONLY
10. REFERENCES 1) Jet Airplane Performance, Lufthansa Consulting, 1988.
2) Performance Engineer Operations Course, volume 1 and 2, Boeing, 1997.
3) Performance Engineer General Course, volume 1 and 2, Boeing, 1999.
4) Apostila: Fundamentos da Engenharia Aeronáutica; Andrade, Donizeti.
5) Aerodinámica y Actuaciones del Avión, I. Carmona, Editorial Paraninfo, 1996.
6) ETPS Fixed Wing Flight Test Manual, Empire Test Pilot School.
7) FAR 25, FAR 121, FAA AC-25-7A, Draft FAA AC-120-OBS.
8) RBHA 121.
9) JAR 25, JAR-OPS-1.
Copyright © 2022 FDOKUMEN