Transmission congestion management considering voltage ...
12
Vol.:(0123456789) SN Applied Sciences (2021) 3:261 | https://doi.org/10.1007/s42452-020-04132-9 Research Article Transmission congestion management considering voltage stability margin Nilesh K. Patel 1 · Bhavik N. Suthar 2 · Jalpa Thakkar 3 Received: 26 September 2020 / Accepted: 30 December 2020 / Published online: 3 February 2021 © The Author(s) 2021 OPEN Abstract This paper presents a solution for the transmission congestion management considering voltage stability issues using optimal generation rescheduling. While practicing congestion management using optimization techniques, the control variables remain under their upper or lower limits but it may lead to the lowered level of voltage security after optimiza- tion. To counterbalance this adverse effect, a modified objective function has been used. The reactive power genera- tion rescheduling and reactive support from capacitors have been incorporated along with active power generation rescheduling to manage congestion as well as to improve the network voltage stability margin. The Random Inertia Weight Particle Swarm Optimization (RANDIW-PSO) algorithm has been employed in this paper to obtain optimized solutions. The proposed methodology is tested on the New-England test system for different realistic scenarios. The results confirm a noteworthy decline in congestion cost along with the improvement in network voltage stability margin. Moreover, system performance has been improved in terms of system power losses, increased reactive power reserve at generators and voltage profile. Keywords Electrical energy flow management · Sustainable grid operations · Voltage stability margin · Particle swarm optimization · Upgraded operations of deregulated electrical energy systems 1 Introduction The aim of electric industry deregulation is to focus towards enhanced system performance and reliable power at low cost. The deregulation has transferred generation investment and operational decisions into the competi- tive market. However, transmission system has been kept as a common resource in the regulated environment. This mixed scenario of competitive generation and regulated transmission has aggravated the issue of transmission con- gestion. Congestion is a state when system operates close to its transmission capacity constraint with reduced secu- rity margin. Since congestion intimidates system security, increases energy price and creates economically inefficient market operations, it is important to develop an optimal congestion management strategy for system operators. The initial studies that systematically investigated the impact of transmission congestion and its management in deregulated electricity market are summarized in Ref. [1, 2]. Congestion management measures can be broadly assorted under three groups, out of which the first one utilizing price signals as a tool to oversee congestion [3]. These price signals can be obtained from ex-ante market resolution or real time and sent to all transmission users which in turn helps to manage congestion. This approach is used by Norway, Sweden, and Finland electricity mar- kets. The idea behind the second group is based upon centralized optimal power flow programs-oriented control * Nilesh K. Patel, [email protected] | 1 Department of Electrical Engg, Swarrnim Institute of Technology, Gandhinagar, Gujarat 382420, India. 2 Department of Electrical Engg, Government Engineering College, Bhuj, Gujarat 370001, India. 3 Department of Electrical Engg, Shroff S. R. Rotary Institute of Chemical Technology, Ankleshwar, Gujarat 393135, India.
-
Upload
khangminh22 -
Category
Documents
-
view
0 -
download
0
Transcript of Transmission congestion management considering voltage ...

Vol.:(0123456789)
SN Applied Sciences (2021) 3:261 | https://doi.org/10.1007/s42452-020-04132-9
Research Article
Transmission congestion management considering voltage stability margin
Nilesh K. Patel1 · Bhavik N. Suthar2 · Jalpa Thakkar3
Received: 26 September 2020 / Accepted: 30 December 2020 / Published online: 3 February 2021 © The Author(s) 2021 OPEN
AbstractThis paper presents a solution for the transmission congestion management considering voltage stability issues using optimal generation rescheduling. While practicing congestion management using optimization techniques, the control variables remain under their upper or lower limits but it may lead to the lowered level of voltage security after optimiza-tion. To counterbalance this adverse effect, a modified objective function has been used. The reactive power genera-tion rescheduling and reactive support from capacitors have been incorporated along with active power generation rescheduling to manage congestion as well as to improve the network voltage stability margin. The Random Inertia Weight Particle Swarm Optimization (RANDIW-PSO) algorithm has been employed in this paper to obtain optimized solutions. The proposed methodology is tested on the New-England test system for different realistic scenarios. The results confirm a noteworthy decline in congestion cost along with the improvement in network voltage stability margin. Moreover, system performance has been improved in terms of system power losses, increased reactive power reserve at generators and voltage profile.
Keywords Electrical energy flow management · Sustainable grid operations · Voltage stability margin · Particle swarm optimization · Upgraded operations of deregulated electrical energy systems
1 Introduction
The aim of electric industry deregulation is to focus towards enhanced system performance and reliable power at low cost. The deregulation has transferred generation investment and operational decisions into the competi-tive market. However, transmission system has been kept as a common resource in the regulated environment. This mixed scenario of competitive generation and regulated transmission has aggravated the issue of transmission con-gestion. Congestion is a state when system operates close to its transmission capacity constraint with reduced secu-rity margin. Since congestion intimidates system security, increases energy price and creates economically inefficient
market operations, it is important to develop an optimal congestion management strategy for system operators.
The initial studies that systematically investigated the impact of transmission congestion and its management in deregulated electricity market are summarized in Ref. [1, 2]. Congestion management measures can be broadly assorted under three groups, out of which the first one utilizing price signals as a tool to oversee congestion [3]. These price signals can be obtained from ex-ante market resolution or real time and sent to all transmission users which in turn helps to manage congestion. This approach is used by Norway, Sweden, and Finland electricity mar-kets. The idea behind the second group is based upon centralized optimal power flow programs-oriented control
* Nilesh K. Patel, [email protected] | 1Department of Electrical Engg, Swarrnim Institute of Technology, Gandhinagar, Gujarat 382420, India. 2Department of Electrical Engg, Government Engineering College, Bhuj, Gujarat 370001, India. 3Department of Electrical Engg, Shroff S. R. Rotary Institute of Chemical Technology, Ankleshwar, Gujarat 393135, India.

Vol:.(1234567890)
Research Article SN Applied Sciences (2021) 3:261 | https://doi.org/10.1007/s42452-020-04132-9
actions taken up by the system operator to relieve con-gestion. The Pennsylvania–Jersey–Maryland (PJM) market is an example of this approach [3]. The third group looks to control congestion by allowing or prohibiting bilateral agreements between a producer and a consumer, based on the impact of the transaction on the transmission sys-tem [4]. In [5], a comprehensive survey has been provided on congestion mitigation considering all aspects such as its impact, issues, and challenges in deregulated environ-ment. Moreover, the distinctive optimization methods to reduce congestion are critically reviewed.
The literature survey reveals that the centralized or decentralized optimal power flow-based congestion management is widely accepted strategy by the system operators worldwide. The distributed DCOPF based con-gestion control strategy has been presented in [6] wherein the comparison with centralized OPF method have been reported. This method suffers from the problem that the decentralized setting cannot provide a transparent price signal in the market and it lower the producer revenues than those of the centralized one. Normally, optimal power flow (OPF) problem can be formulated with the objective function of maximizing social welfare along with account-ing congestion cost, while satisfying the operational and system constraints. In [7], a cluster-based congestion man-agement is proposed using combined active and reactive power generation rescheduling considering the sensitivity of congested line flows. A technique for optimal selection of generators based on sensitivity of the line flows with respect to the change in a generation has been demon-strated using particle swarm optimization for congestion management [8].
In [9], congestion management using market splitting approach has been presented along with two-level optimi-zation solution for an optimal bidding strategy of a power producer. The lower level optimization problem finds mar-ket clearing price (MCP) and upper level maximizes the profit of a producer. Smart grid viewpoint transmission congestion alleviation techniques are reviewed in [10]. It moreover deliberated the congestion management strate-gies utilized by the system operators of various countries.
In [11], a modified form of optimal power flow is pro-posed to minimize congestion cost for hybrid electricity market using Bender’s decomposition. The impact of the bilateral contract on congestion management has been verified with security constraints. Though it is claimed economically efficient single step solution methodology, it is difficult to differentiate between energy produc-tion cost and congestion cost. In [12], Voltage security constrained transmission congestion management has been proposed by considering security loading condi-tion. A firefly algorithm has been proposed in Ref. [13] to relieve congestion by considering contingencies and
sudden load variations. Due to promising optimization ability, particle swarm optimization is being widely used in recent years for solving nonlinear optimization prob-lems such as economic dispatch, optimal power flow and FACTS placement [14–16].
A voltage secured transmission congestion man-agement approach has been presented in [17]. Though authors claimed improvement in Voltage Stability Mar-gin (VSM) after congestion management but only active generation rescheduling may not be sufficient to improve VSM in some voltage instability events. In [18], authors described how efficiently the PSO could be used to control reactive power and voltage from the viewpoint of voltage stability. Recently, TVAC TVIW-PSO has been suggested to alleviate the transmission congestion [14]. However, this variant gives better solution after a higher number of itera-tions which in turn increases the computational time. A new Twin Extremity Chaotic Map Adaptive Particle Swarm Optimization (TECM-PSO) algorithm has been proposed to alleviate congestion by considering upstream real capac-ity flow tracing method to select the optimal number of rescheduling generators [19].
Due to less operational cost, renewable energy sources can contribute to minimizing congestion cost. Jeslin Drusila Nesamalar et al. [20] proposed generation resched-uling based energy management system for congested transmission network. Active power generation resched-uling is performed using non-renewable and renewable energy sources. This paper has confined it’s work for the specific objective of the simultaneous optimization of active and reactive power generations in thermal power plants.
In this paper, congestion management problem is studied for a pool-based hour-ahead market and bilateral electricity market model. The paper emphasizes on volt-age secure operating conditions after congestion manage-ment. Active and reactive power generation rescheduling has been used that comprehends re-dispatching of the generations which is regarded as an increment in the out-put of certain generators with a simultaneous decrement in others. For this, an additional marginal cost is paid to these generators by the system operator to manage con-gestion. Congestion cost has been found using uniform Market Clearing Price (MCP) with uplift charges. Section 2 presents the objective function of the proposed conges-tion management and its constraints along with the gen-erator sensitivity concept and VSM perspective direction for reactive power generation rescheduling. Section 3 presents the solution algorithm using RANDIW-PSO. In Sect. 4, numerical results of testing the proposed method on a well-known test system along-with different realistic congested scenario are discussed. Finally, conclusions are drawn in Sect. 5.

Vol.:(0123456789)
SN Applied Sciences (2021) 3:261 | https://doi.org/10.1007/s42452-020-04132-9 Research Article
2 Problem formulation of the proposed methodology
Centralized optimal power flow (OPF) is an efficient method for the solution of transmission congestion man-agement problem wherein the objective function is to minimize congestion cost which is basically a cost incurred due to adjustment of generations. The system operator pays this congestion cost to the participant generators to alter their generations from scheduled one so that conges-tion is relieved [21]. Consider a system with NG numbers of generator is participating in congestion management process. Then the congestion management problem is to
The objective function is minimized subject to the sat-isfaction of system constraints. The following are the con-straints which are taken into account in this work:
1. Power flow equations:
2. Active power generation limits:
3. Reactive power generation limits:
4. Voltage limits:
5. The transmission line constraints:
6. Compensator limits:
(1)Minimize
[∑
j∈NG
(BΔPGjΔP
Gj
)+
∑
j∈NG
(BΔQGj
ΔQGj
)+
∑
j∈NC
(BQcjQ
cj
)+ �VD
]
(2)
PGi − PDi − Vi
∑
i,j ∈NB
Vj(Gij cos �ij + Bij sin �ij) = 0
QGi − QDi − Vi
∑
i,j ∈NB
Vj(Gij sin �ij − Bij cos �ij) = 0
(3)PGj,min ≤ PGj ≤ PGj,max
PGj − PMCGj
= ΔPup
Gj− ΔPdown
Gj
(4)QGj,min ≤ QGj ≤ QGj,max
P2Gj+ Q2
Gj≤ (Smax
Gj)2
(5)Vminn
≤ Vn ≤ Vmaxn
(6)||Sm|| ≤ Smaxm
(7)(Sk + GSkn× ΔPn) ≤ Smax
k
(8)QCl,min ≤ QCl ≤ QCl,max j ∈ NG, n ∈ NB,m ∈ NL, l ∈ NC
In the above equations, NB, NL, and NC indicate the set of buses, lines and compensators. Equation (2) represents power balance equations of the system. Equations (3) and (4) represents an allowable range of active and reactive power generations declared by generators to the system operator for congestion management. In Eq. (3), PMC
Gj indi-
cates the market cleared generation of generator j. These are basically the scheduled generations determined by the market clearing procedure. Voltage limits for all buses are set by Eq. (5). The maximum rating of branches including lines and transformers is constrained by Eq. (6) in terms of apparent power (MVA). In Eq. (7), GS is the generator sen-sitivity which is described in detail in preceding section.
Equation (8) represents the operating limit of compensat-ing devices. In this paper, the violation of the constraints is restricted by using the penalty factor method. Four pen-alty factors for active power generation, reactive power generation, voltage at each load bus and line flow have been incorporated in the objective fitness function along with congestion cost. The value of these factors is decided using empirical analysis conducted during the simulation.
It is seen that Eq. (1) contains four terms. The first term is the congestion cost occurred due to active power gen-erations rescheduling. BΔP
Gj is the price bid submitted by
participating generator to up/down their generations to manage congestion. In a day-ahead electricity market, generators submit two separate offers: one for a non-con-strained transmission network and other for constrained one (congested situation). The first offer is used to estab-lish market clearing procedure while the second offer is used to assess congestion cost. Here, BΔP
Gj is the second
offer prices. As a part of congestion management proce-dure, if some generators have to decrease their genera-tions even though they still receive full payment for their declared capacity (scheduled generation) as per first offer price. ΔPGj is the total rescheduled active power generations.
The second term of Eq. (1) is the congestion cost due to reactive power generations rescheduling. BΔQ
Gj is also called
generator opportunity cost which can be calculated using Eq. (9) [7].
In a general sense, CPG is the active power generation cost given by a quadratic cost function Eq. (10).
(9)BΔQGj
= [CPG(SGj,max) − CPG(√
S2Gj,max − ΔQ2
Gj)] ∗ k

Vol:.(1234567890)
Research Article SN Applied Sciences (2021) 3:261 | https://doi.org/10.1007/s42452-020-04132-9
where aj , bj and cj are cost coefficients and SGj,max is the nominal apparent power of the generator j . As reactive generation changes, the active power generation limit of generator gets changed. As a result, generator benefit will be influenced. In order to compensate for this loss, profit rate k of active power generation is accounted which is usually taken between 5 and 10%.
The third term in the objective function is the production cost of reactive power compensation equipment (capaci-tors). The capacitor placement helps to accomplish two purposes (i) to increase voltage stability margin and (ii) to reduce the rescheduled generations which in turn reduces congestion cost. This static compensation cost includes the capital investment return, which is expressed through a depreciation rate depending on its lifetime. For instance, a static capacitor with an initial cost of $10,000/MVAR, lifetime of 20 years and normal utilization of 0.75, the investment cost can be computed as,
where Qcj is the reactive power supplied by capacitor at bus j.
The fourth term �vD in the objective function Eq. (1) pro-vides direction to the reactive power generation change. Wherein,�v is basically the penalty factor based on genera-tor voltage to change reactive power generations. In this work, the parameter �v is experimentally set between 180 to 250. However, this parameter can’t be too large since it increases network VSM but at the same time, it also increases congestion cost. It can not be too small otherwise, the effect on network VSM improvement is small. The direction for reactive generation rescheduling is described in detail in Sect. 2.2.
2.1 Selection of generators for participation in rescheduling
To manage congestion, system operator selects an optimum number of generators for rescheduling using generator sensitivity (GS) factor. The generator sensitivity approach is based on concept from [8], which can be characterized as
where k is the congested line connected between buses i and j. ΔPij is the change in line flow of the congested line. ΔPn is the unit change in the generation at bus n.
(10)CPG = [aj ⋅ P2Gj+ bj ⋅ PGj + cj]
(11)BQcj =$10000
20 × 365 × 24 × 0.75× Qcj($∕h −MVAR) = 0.0761 × Qcj($∕h −MVAR)
(12)GSkn=
ΔPij
ΔPn
Generators with largest positive and negative values of GS are selected for rescheduling to relieve congestion.
2.2 Direction for reactive power generation rescheduling: VSM perspective
In this study, the focus is on to retain or enhance volt-age stability margin during congestion management. The reactive power generation is rescheduled in such a way that it scales down the congestion cost alongside the improvement of VSM. The rescheduling of reactive power generation changes the reactive power flows of the lines.
This, thus, decreases the amount of active power gen-eration rescheduling. Consequently, it adds to the mini-mization of congestion cost. Additionally, the reactive power generation rescheduling can be directed with the goal that it improves the reactive reserve [22]. Reactive reserve available at the generators is noteworthy and
basic necessity to keep up the desired level of VSM. The reactive power reserve demonstrates the capability of the generators to maintain bus voltages during varying loading conditions. It is worth noting that for a given real power output, the reactive power generation is limited by both armature and field heating limits. Hence, the reactive power limit of the generators is accounted by considering generator’s capability curves. Furthermore, the apparent power generation of each generator has been maintained within limit by incorporating it as inequality constraint in the simulation [23]. Sufficient reactive reserve can be ensured by optimizing the reactive power generations. In this work, the VSM enhancement problem is formulated as the fitness function to maximize the reactive reserves based on the participation of generators. Numerically, the reactive reserve for jth generator is given by,
where QmaxGj
=[√
S2Gj,max
− P2Gj
] and GP is the generator
participation factor. QmaxG
values for generators are calcu-lated using generator capability curve [23].
Since objective function is minimization function, therefore reactive reserve maximization is incorporated into Eq. (1) by converting it to minimization using follow-ing formulation,
(13)
Reactive reserve =(QmaxGj
− QGj
)
∴J =∑
j∈NG
[GP
Gj∗(QmaxGj
− QGj
)]
Vol.:(0123456789)
SN Applied Sciences (2021) 3:261 | https://doi.org/10.1007/s42452-020-04132-9 Research Article
To figure out which generators have to be inspired to inject more reactive power into the system and to locate the placement of capacitors in order to improve the net-work VSM, the modal analysis on the system Jacobian matrix is being utilized [24, 25]. Generator participation for the current operating condition is determined as follow:
Corresponding to the minimum eigenvalue of the Jaco-bian matrix, �ji and �ji are related right and left eigenvector respectively. The bus participation factor that measures the participation of kth bus in the ith mode is given by,
3 Solution algorithm and its implementation for the formulated problem
3.1 Solution using RANDIW‑PSO
The PSO is a swarm-intelligence based evolutionary tech-nique with a chief advantage that it is less sensitive to the size and nonlinearity of the problem [15]. In this paper, RANDIW-PSO has been used to perform a cost-effective optimal power flow model discussed in Sect. 2. We have rigorously compared four variants of particle swarm opti-mization viz. Classical PSO (CPSO), Time Varying Inertia Weight (TVIW-PSO), Time Varying Acceleration Constant PSO (TVAC-TVIW PSO) and Random Inertia Weight PSO (RANDIW-PSO) for the issue of transmission congestion management on same system as available in Ref. [26]. It has been observed through simulations that PSO quickly finds a good local solution but it sometimes remains in a local optimum solution for a considerable number of itera-tions without an improvement. The global search ability can be enhanced quickly by using continuous random momentum. This can be achieved by introducing random inertia weight within the limit. Qualitative comparison has been made for the search behavior and convergence characteristic of these variants and analysis has been done. The test results show that RANDIW-PSO gives minimum rescheduled power and congestion cost within less no. of iterations. In addition to this, the solutions of RANDIW-PSO have the lowest standard deviation of 14.12 as compared to other PSO variants. The advantage of such type adap-tation in inertia weight helps to maintain the particle’s velocity from beginning to the end of the search process.
(14)D = 1∕(1 + J)
(15)GPgj =ΔQgj
(MaxΔQg)
(16)Pki = ξkiηki
Which in turn helps to find optimal solutions throughout the search process.
In RANDIW-PSO [27], inertia weight and velocity updates are given by,
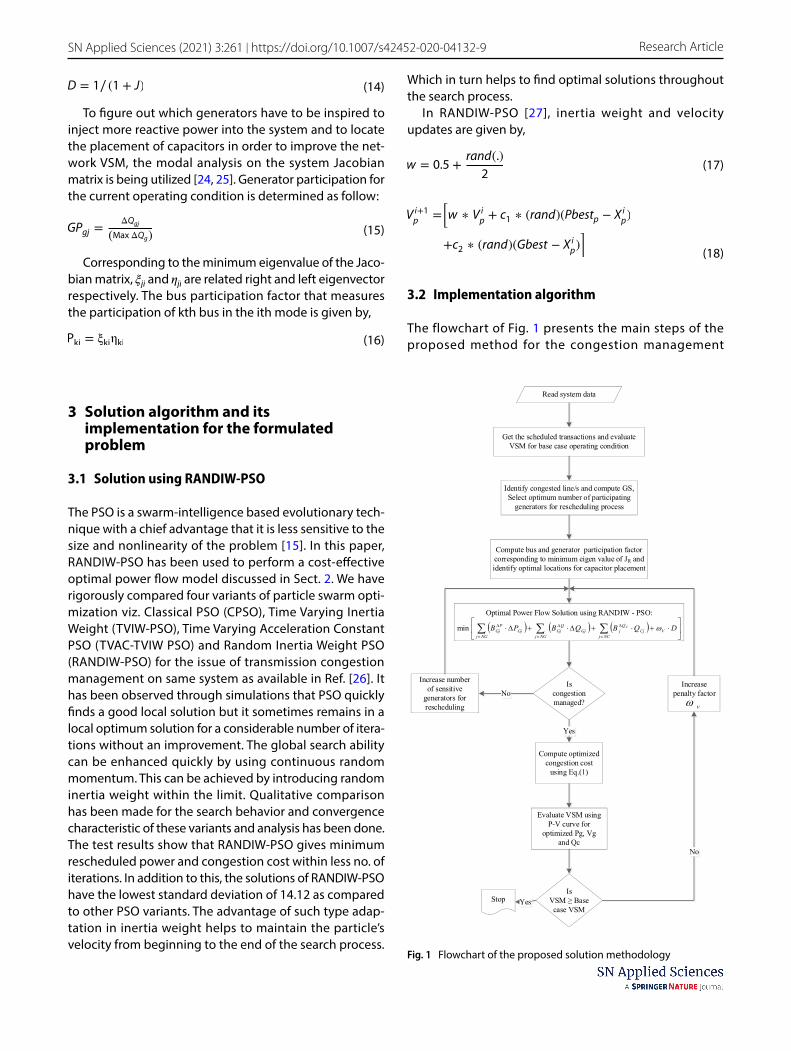
3.2 Implementation algorithm
The flowchart of Fig. 1 presents the main steps of the proposed method for the congestion management
(17)w = 0.5 +rand(.)
2
(18)
Vi+1p
=[w ∗ Vi
p+ c
1∗ (rand)(Pbestp − Xi
p)
+c2∗ (rand)(Gbest − Xi
p)]
Fig. 1 Flowchart of the proposed solution methodology

Vol:.(1234567890)
Research Article SN Applied Sciences (2021) 3:261 | https://doi.org/10.1007/s42452-020-04132-9
solution in view to maintain the VSM, and if there should arise an incidence of a need to improve it to meet the desired condition.
The implementation steps can be summarized as follows:
• At first, the system operator gets the scheduled pool transactions that include scheduled generations, bilat-eral and multilateral transactions as well as planned outages if any.
• Then it checks for network congestion condition, if not it approves all the transactions. If congestion found, identify the congested line and compute the corre-sponding GS factors.
• Generators having largest positive and negative values of GS are only chosen for rescheduling process.
• Computes bus participation factors corresponding to the minimum eigenvalue of reduced Jacobian for the current operating condition and identify the optimal locations for capacitor placement.
• Solve RANDIW-PSO based optimal power for simulta-neous rescheduling of an active and reactive power generations in the direction provided by the Eq. (1). Considering all the constraints Eqs. (2–8) gets satisfied.
• In case, these optimally selected generators are not able to relieve congestion then the number of selected generators is to be increased.
• Calculate the amount of rescheduled active and reac-tive powers and the corresponding congestion cost.
• Evaluate the network VSM using P–V curve methodol-ogy for optimized values of control variable Pg, Vg and Qc. If desired margin requirement is not accomplished, repeat the algorithm by increasing the value of penalty factor.
• Repeat the process till the VSM requirement or the maximum number of iterations is reached.
4 Results and discussion
The proposed methodology of congestion management considering voltage stability margin based on RANDIW-PSO has been illustrated on an IEEE 39-bus test system. IEEE 39-bus system is stressed system, chosen intentionally to verify the effectiveness of the proposed method. This system represents a 345-kV transmission network of New England region [8, 28]. The system consists of 10 genera-tors, 19 loads, 34 lines and 12 transformers. In the pool market model as a result of market clearing procedure, market cleared generations (scheduled generations) are available and listed in Appendix Table 7. Moreover, maxi-mum and minimum operating limits of the generators are likewise listed. With a specific end goal to look at the execution of the proposed methodology, three different cases representing different scenarios of the power system operation are analyzed.
4.1 Scenario#1: base case operating condition
This scenario represents base case operating conditions of the IEEE 39-bus test system. For this state, the system load is 6124.50 + j 2593.36 MVA and system real power losses are 59.3 MW. Generator bus number 31 is considered as slack bus for this system. The line connected between the buses 4 and 14 (L4–14) is loaded to 262.4 MVA having flow limit of 600 MVA. As a consequence of line L4–14 outage, the line L5–6 is congested. The congested line L5–6 flow is 628.6 MVA while line limit is 500 MVA.
It has been assumed that all 10 generators of the system are contributing in congestion management procedure. In order to manage congestion cost-effectively, out of all generators, optimal number of generators have been selected using GS factor [8]. GS values for congested line L5–6 are plotted in Fig. 2. In IEEE 39 bus system, most of the generators having negative values of GSF for a congested line 5–6 is due to the fact that flow of line 5–6 is reducing
Fig. 2 Plot of generator sensi-tivity for congested line/s
-0.6
-0.5
-0.4
-0.3
-0.2
-0.1
0
0.1
0.2
0.3
GS
valu
es
G30 G31 G32 G33 G34 G35 G36 G37 G38 G39
Scenario#2 Scenario#3
Line 5-6 Line 5-6Line 13-14 Line 13-14
Scenario#1
Line 5-6

Vol.:(0123456789)
SN Applied Sciences (2021) 3:261 | https://doi.org/10.1007/s42452-020-04132-9 Research Article
when there is an increase in generation of all generators system except slack bus. It is to be noted that the genera-tor sensitivity values thus obtained are with respect to the slack bus as the reference. Therefore, the sensitivity of the slack bus generator-31 to any congested line in the system is always zero. Generators with largest positive and nega-tive values of GS are selected for generation rescheduling. Figure 2 depicts that generator number 30, 37, 38 and 39 are having largest negative values so these generators are selected to increase their active power generations. While generator number 31 and 32 have smallest negative values of GS so these generators have been considered as genera-tors with relatively positive GS values. Subsequently, these generators will decrease their active power generations to manage congestion.
The generator and bus participation factors corre-sponding to the minimum eigenvalue of Jacobian matrix are tabulated in Table 8. Using bus participation factors, optimal locations of capacitor placement are found. The bus with large participation factor is a candidate bus where more compensation is required. At these locations, a capacitor of maximum value 100 MVAR with the lifespan of 20 years is considered. The amount of compensation provided by capacitors is incorporated as a control vari-able in optimal power flow. Therefore, during optimization, the optimized size of capacitors are being found in such a way that it increase voltage stability margin as well as reduces congestion cost.
Congestion has been managed by solving an RANDIW-PSO based OPF using proposed methodology, active and reactive power generation rescheduling along with reac-tive support from capacitors. In the OPF, control variables being considered are active power generations (PG), gen-erator voltages (VG) and shunt compensation (Qc). These variables are varied optimally such that it helps to reduce congestion cost as well as to improve VSM of the net-work. The term �vD in Eq. (1) provides direction to change
reactive power generations. For this scenario, the penalty term �v used is empirically set to value 180.
The parameters selected for the RANDIW-PSO are as follows: Populations size = 70, iterations = 100 and accel-eration constants c1, c2 = 2.05. Inertia weight is randomly selected between the value of 0.5–0.9 using Eq. (17). Opti-mized solutions of OPF using RANDIW-PSO are tabulated in Table 1. As PSO is a stochastic optimization method, it is noteworthy that, the program was run for 40 trials and mean of all the trials are being considered as final solu-tions. In Table 1, column 2, 3 and 4 shows maximum, mini-mum and mean values of rescheduled active power gen-eration by the individual generator respectively. Column 5 shows standard deviation (SD) in the optimized solutions. The standard deviation indicates the measure of how far rescheduled generations are clustered around the mean value. By the way of explanation, depreciated value of SD proclaims minor deviation from its optimal mean value for every trial of simulation, which shows the robustness of the algorithm. Results illustrates that total active power generations needed to be rescheduled to alleviate con-gestion is 491.17 MW. On account of variation in genera-tions, increment or decrement in flows of other lines might occur. After optimization, the line flows of critical lines are found within their limits as depicted in Table 2. The crite-ria behind the selection of critical lines is that these lines are having high amount of power flow. Moreover, during the simulation of all scenarios, these lines power flow are changing in expansive values.
Table 3 illustrates the comparison between the opti-mized results obtained using RANDIW-PSO and available
Table 1 Optimized generation rescheduling
(MW) Max Min Mean SD
ΔPG30 168.3 177.15 153.44 3.5ΔPG31 − 22.16 − 77.66 − 20.68 19.25ΔPG32 − 230.15 − 154.83 − 225.61 10.72ΔPG37 0 0 0 0ΔPG38 0 0 0 0ΔPG39 84.6 54.88 91.44 9.79ΔP Total 505.21 464.52 491.17 12.91Congestion man-
agement cost ($/h)
9005.73 8482.7 8662.11 316.07
Table 2 Change in some critical lines flow after optimization
Line connected between buses
Actual flow (MVA) Line limit (MVA)
Before After
L2–3 445.62 565.55 600L3–4 248.4 274.16 600L5–6 628.6 499.89 500L19–33 646.75 696.48 1200L22–35 708.19 773.39 1200L23–36 612.4 617.97 1100L25–37 549.70 580.77 1100L29–38 833.6 861.32 1100
Table 3 Comparison of results for scenario#1
Method Total rescheduled power (MW)
Ploss (MW) Vmin (p.u.)
TVIW-PSO [8] 554.20 57.31 0.945RANDIW-PSO 491.17 53.67 0.995

Vol:.(1234567890)
Research Article SN Applied Sciences (2021) 3:261 | https://doi.org/10.1007/s42452-020-04132-9
results in [8] using TVIW-PSO for a similar test system. It can be seen that using RANDIW-PSO, total rescheduled active power generations and system losses have been compara-tively reduced to 491.17 MW and 53.67 MW respectively. The reason for the optimized solution is that the RANDIW-PSO holds the particle momentum throughout the search process which brings about an exploration of more opti-mal solution among the available feasible solutions.
In view of participation factors from Table 8, the most critical buses are bus numbers 12 and 14. But the com-bined optimal reactive support of 70.22 MVAR is acquired by placing capacitors at bus-12 and bus-5. Bus-5 is chosen rather than bus-14 because buses 14 and 5 have almost nearby values of participation factor. Bus-5 contribute more to reduce congestion cost since it is the bus where the congested line is connected. The capacitor placed at bus 5 directly provides the reactive requirement of load without influencing congested line flow thus it reduces the amount of generation rescheduling required.
As illustrated in Table 4, along with active power gen-eration rescheduling, total of 192.33 MVAR reactive power generations has been rescheduled to manage congestion. Rescheduled active and reactive generations are depicted in Fig. 3. It demonstrates that the reactive power genera-tion has been decreased more at the generator having a larger value of participation factor. For instance, referring to bus 32, having a generator participation factor of 1.0, the reactive generation has been reduced by a measure of 40.64 MVAR. Higher reactive reserve at these buses brings about increased VSM of the system. Additionally, reduction in reactive generation at the slack bus which is one of the indications of network VSM enhancement.
In this paper, the voltage stability margin is determined using PV curve. The plot of PV curve has been obtained by the use of continuation power flow (CPF) [29]. Here, it is assumed that all loads are constant power type. In the PV curve computational algorithm, in order to increase each load by 1%, the loading factor K is specified with an increment of K = 0.01; at that point, this factor remains con-stant throughout the routine. It is worth noting that this
factor is the same for all cases simulated. Figure 4 shows the PV curves for before and after optimization operat-ing conditions of the IEEE 39-bus test system. It can be seen that after optimization using the proposed method, nose point loading in PV curve has been considerably increased. It demonstrates an increase in the distance of voltage collapse point from the current operating point, thus it reveals improvement in the network voltage stabil-ity margin to significant value.
The congested line flow after optimization has been reduced to 499.89 MVA. The total congestion manage-ment cost occurred is 8662.12 ($/h) which include active and reactive generation rescheduling cost 8395.48 $/h and 266.64 $/h respectively. This cost has to be paid by the system operator to the participating generators. It is ben-eficial to take note of that the network VSM after resched-uling has been enhanced from 947.56 to 1679.33 MW. Furthermore, the total active and reactive injections from generators have been reduced. This is due to the fact that the active and reactive power losses are decreased to 9.49% and 10.86% respectively from the base case value. It is to be noted that the load is kept unchanged during the optimization process.
It can be also seen from Fig. 5 that the shunt charging of the transmission system to be as 1000.2 MVAR before opti-mization which has been enhanced to a value of 1112 MVAR
Table 4 System performance parameters before and after congestion management
Scenario #1 Scenario #2 Scenario #3
Before After Before After Before After
Total active power losses (MW) 59.30 53.67 55.11 50.33 60.13 57.80Total active power rescheduled (MW) – 491.17 – 516.56 – 424.45Total reactive power rescheduled (MVAR) – 192.33 – 179.78 – 400.42Total Rescheduling cost ($/h) – 8662.12 – 9496.49 – 9363.91Line flow (L5–6) (MVA) 628.60 499.89 631.10 498.54 557.53 497.23Line flow (L13–14) (MVA) – – 376.30 299.76 403.89 299.94Smallest eigenvalue 1.0639 1.4773 0.9731 1.4702 0.9701 1.3219Network VSM (MW) 947.56 1679.33 652.65 1712 646.79 1190.75
-250
-150
-50
50
150
250
Res
ched
uled
Pow
er
(MW
/MV
AR
)
P30
P37
P38
P39
Q30
Q37
Q38
P31
P32
Q31
Q32
Q39
Fig. 3 Change in real and reactive power generations

Vol.:(0123456789)
SN Applied Sciences (2021) 3:261 | https://doi.org/10.1007/s42452-020-04132-9 Research Article
after optimization. It is a consequence of increased reactive power reserve at generators. Improvement in shunt charg-ing of lines implies that the performance of the transmission network contributes to a helpful mean to the worthy opera-tion of the system. As described in Table 4, after optimization there is an improvement in the minimum eigenvalue of the Jacobian matrix which focuses towards improvement in VSM.
The essential requirement of a modern power system operation is to maintain an economy with good system voltage profile. Figure 6 shows improvement in bus voltage profiles of buses after optimization using the
proposed method. This improvement is vital as by regu-lating the voltage profile, the maximum power transfer capabilities of the lines can be sustained and efficiency of the trans-mission system can be increased with rated oper-ational conditions. Control actions in view of proposed methodology give assurance of the good performance of the system under such operating conditions.
4.2 Scenario#2: peak load operation
In this state, the system is stressed by increasing load by 5% at every load bus proportionally. Note that line (L4–14) which was outaged in the previous scenario is presently in service. The base case operating conditions for this scenario are shown in Table 4. As a result of peak load operation, the lines L5–6 and L13–14 are observed congested with the flow of 631.10 and 376.30 MVA while the limits are 500 and 300 MVA respectively. Also, the system voltage stability margin has been reduced to 652.65 MW and the total transmission losses are increased to 55.11 MW. The GS for the congested lines has been plotted in Fig. 2. Like scenario#1, in this sce-nario, same generators need to increase or decrease their generations to manage congestion. Note that the penalty term is set to 230 in order to increase VSM after optimization.
The optimized results of OPF utilizing proposed method-ology for scenario#2 are shown in Table 4. Total active and reactive power generations should have been rescheduled are 516.56 MW and 179.78 MVAR respectively. Based on bus participation factors, the optimal reactive power support of 76.35 MVAR has been obtained by placing capacitors at buses 12 and 14. The congested line flows (L5–6 & L13–14) after optimization have been reduced to 498.54 and 299.76 MVA respectively. Additionally, total transmission losses are reduced to 50.33 MW. The total congestion management cost occurred is 9496.49 $/h which incorporate active and reactive generation rescheduling cost of 9273.93 and 248.35 $/h respectively.
Fig. 4 PV curves for all sce-narios
0.68
0.73
0.78
0.83
0.88
0.93
0.98
1.03
0.9 1 1.1 1.2 1.3 1.4 1.5
Vol
tage
(pu)
Loading Factor
Scenario#1 Scenario#2 Scenario#3
Before optimization After optimization
900
1000
1100
1200
Scenario#1 Scenario#2Scenario#3
1000.2 997.41 1010.26
11121092.3 1089.15
Shun
t gen
erat
ion
of li
ne
(MV
AR
)
Before optimization After optimization
Fig. 5 Impact on transmission lines shunt generation
0.9
0.95
1
1.05
1.1
5 10 15 20 25 30 35
Bus
vol
tage
in p
.u.
Before optimization After optimization
Fig. 6 Voltage profile before and after congestion management for scenario#1

Vol:.(1234567890)
Research Article SN Applied Sciences (2021) 3:261 | https://doi.org/10.1007/s42452-020-04132-9
The PV curve for the after optimization operating con-dition has been shown in Fig. 4. It can be seen that sub-sequent to rescheduling using proposed technique, nose point loading in PV curve has been extensively expanded. It shows an increase in the distance of voltage collapse point from the current operating point, subsequently enhancing the network VSM from 652.65 to 1712 MW. Fur-thermore, this improvement in VSM is supported by incre-ment in the minimum eigenvalue from 0.9731 to 1.4702. As illustrated in Fig. 5 for scenario#2, the increment in the line charging after optimization is also the point for con-sideration in order to proclaim proposed method as the better technique for congestion management.
4.3 Scenario#3: hybrid market model
The performance of the proposed methodology is assessed for a hybrid market scenario which comprises of pool market model with bilateral and multilateral contracts. The presence of bilateral and multilateral contracts would increment the complexity of the optimal power flow algorithm for conges-tion management. The bilateral and multilateral contract powers for this scenario are listed in Table 5. T1 represents the bilateral transaction of 100 MW power between seller bus 30 and customer at bus 3. According to power market principles, the price of bilateral contracts agreed between the seller and buyer is kept secret from others and not cleared by system operator [4]. The bilateral concept can be generalized to be a multilateral case where the seller may inject power at several nodes and the buyers draw load at several nodes. The multilateral transaction of 150 MW power between seller bus 32 and customer at bus 4 is represented as T2. Additional multilateral transaction of 50 MW power between seller at bus 32 and customer at bus 15 is represented as T3.
The base case operating conditions for scenario#3 are shown in Table 4. Owing to the presence of bilateral and multilateral contracts in the system, the transmission line L5–6 and line L13–14 are observed congested with the flow of 557.53 and 403.89 MVA respectively. The GS for congested lines have been presented in Fig. 2. In this scenario also, same generators need to increase or decrease their gen-erations to manage congestion. Note that penalty term is set to 190 in order to increase VSM after optimization.
The optimized results of OPF using the proposed meth-odology for scenario#3 are shown in Table 4. Total active and reactive power generations needed to alleviate conges-tion are 424.45 MW and 400.42 MVAR respectively. Based on bus participation factors, the optimal reactive support of 32.53 MVAR has been obtained by placing capacitors at bus-12 and bus-14. After optimization, the congested line flows (L5–6 & L13–14) have been reduced to 497.23 and 299.94 MVA respectively. The real power transmission losses have been reduced from 60.13 to 57.80 MW. The total congestion management cost occurred is 9363.91 $/h which incorpo-rate active and reactive generation rescheduling cost of 7547.82 and 1816.09 $/h respectively.
As seen from Table 4 for scenario#3, generation resched-uling using proposed method results in an increase in the network VSM from 646.79 to 1190.75 MW. This is due to the fact that the nose point loading in the PV curve after opti-mization has been increased as depicted in Fig. 4. Moreover, this improvement in VSM is supported by an increment in the minimum eigenvalue from 0.9701 to 1.3219. As repre-sented in Fig. 5 for scenario#3, the addition of the shunt generation of lines after optimization is likewise the point of thought with a specific end goal to broadcast proposed strategy as the better way for congestion management.
From the price of voltage stability margin perspective, the proposed method can be compared with the method reported in [17]. i.e. congestion management using only active power generation rescheduling. As depicted in Table 6, for scenario#1 the congestion cost occurred using only active power generation rescheduling and proposed method is 9200.11 and 8662.12 $/h respectively while volt-age stability margin obtained is 1184.90 and 1679.33 MW respectively. The reduction in congestion cost indicates that the system operator has to pay less amount as con-gestion management cost using the proposed method. Meanwhile, system security has been also improved to 1679.38 − 1184.90 = 494.43 MW of network VSM.
On the contrary, implementation of proposed method for scenario#2, seems to be somewhat expensive as a sur-plus congestion cost of 9496.49 − 9306.17 = 190.32 $/h has to be paid. The reason for this increment is due to maintain higher VSM after congestion management. In the base case operating condition for scenario#2, it has lowered VSM of 652.61 MW due to peak load operation. It is necessary for the system operator to improve and retain higher VSM in order to maintain the reliability of the system. The VSM after optimization using proposed method has been enhanced to 1712.00 − 652.65 = 1059.35 MW. This increment in VSM costs $/h 190.32. Thus, the price for MW security enhance-ment is 0.18 $/MWh which is less than the price reported in [4] that is 0.88 $/MWh. In the same way, for scenario#3 using the proposed method, the price of providing security per MW in a hybrid market structure is 422.73/216.98 = 1.94
Table 5 Bilateral and multilateral transaction details
Transactions Selling bus Buying bus Contracted power (MW)
T1 30 3 100T2 32 4 150T3 32 15 50

Vol.:(0123456789)
SN Applied Sciences (2021) 3:261 | https://doi.org/10.1007/s42452-020-04132-9 Research Article
$/MWh. The RANDIW-PSO shows rapid convergence in the earlier stages of the optimization process and can find a reasonably good solution within less number of iterations. The computational time of RANDIW-PSO based algorithm is in the range of 30 s for all scenarios.
From the results of testing the proposed method, it has been found that along with active power generation, reac-tive power generation rescheduling in the direction using proposed method contributes directly to the maximization of reactive reserve and hence it improves the voltage stabil-ity margin in the system. Higher is the amount of reactive power rescheduling, more is the VSM enhancement and vice versa. It is observed that the generators are subjected to a lower rescheduling of reactive generations in the presence of capacitors. The combined optimal support from genera-tors and capacitors contributes efficiently to both congestion management cost and system margin improvement.
5 Conclusions
This work aims to contemplate a cost-effective methodology to deal with the issue of transmission congestion manage-ment from the viewpoint of network voltage stability margin. This has been accomplished using a RANDIW-PSO algorithm. Compare to the other variants of PSO, the advantage of this algorithm is that it retains the particle momentum through-out the search process which results in an exploration of more optimal solutions. To validate the potency, proposed meth-odology has been implemented on IEEE 39 bus test system considering three realistic scenarios viz. (a) Base case operat-ing condition (b) Peak load operation and (c) Hybrid market model. Results reveal that a noteworthy decline has been observed in rescheduled power and consequently the con-gestion cost. Furthermore, increased reactive power reserve at generators is seen after optimization that outcomes in improved voltage stability margin of the system. Moreover, system performance has been enhanced regarding system losses and voltage profile. Additionally, the smaller value of standard deviation in OPF solutions proclaims a minor devia-tion from its optimal mean value which shows the robustness of the proposed algorithm. One of the chief advantages of the proposed algorithm being workable, that it may be use-ful to the system operator to manage congestion in a pool as well as in a hybrid electricity market.
Compliance with ethical standards
Conflict of interest The authors have no conflict of interest to declare that are relevant to the content of this article.
Open Access This article is licensed under a Creative Commons Attri-bution 4.0 International License, which permits use, sharing, adap-tation, distribution and reproduction in any medium or format, as long as you give appropriate credit to the original author(s) and the source, provide a link to the Creative Commons licence, and indicate if changes were made. The images or other third party material in this article are included in the article’s Creative Commons licence, unless indicated otherwise in a credit line to the material. If material is not included in the article’s Creative Commons licence and your intended use is not permitted by statutory regulation or exceeds the permitted use, you will need to obtain permission directly from the copyright holder. To view a copy of this licence, visit http://creat iveco mmons .org/licen ses/by/4.0/.
Appendix
See Tables 7 and 8.
Table 6 Congestion management using different methods
Using method reported in [17] Using proposed method
Congestion manage-ment cost ($/h)
VSM after optimiza-tion (MW)
Congestion manage-ment cost ($/h)
VSM after optimization (MW)
Scenario#1 9200.11 1184.90 8662.12 1679.33Scenario#2 9306.17 652.65 9496.49 1712.00Scenario#3 8941.18 973.77 9363.91 1190.75
Table 7 Generator data for the IEEE 39-bus test system
Gen No. PMCG
(MW) PmaxG
(MW)PminG
(MW) Bup
Gj($/
MW-h)BdownGj
($/MW-h)
30 250 1000 100 17 2031 545 1000 100 24 2032 650 1000 100 19 1737 540 1000 100 16 2038 830 1000 100 20 2439 1000 1200 100 17 21
Table 8 Generator and bus participation factors
Generator no. Participation factor
Bus no. Participa-tion factor
30 0.257 12 0.114631 0.7488 14 0.066632 1 13 0.060837 0.1686 4 0.05638 0.1457 11 0.055339 0.3756 5 0.0553

Vol:.(1234567890)
Research Article SN Applied Sciences (2021) 3:261 | https://doi.org/10.1007/s42452-020-04132-9
References
1. Ettore B, Correia P, Gross G, Amelin M (2003) Congestion-management schemes: a comparative analysis under a unified framework. IEEE Trans Power Syst 18(1):346–352
2. Christie RD, Wollenberg BF, Wangensteen I (2000) Transmis-sion management in the deregulated environment. Proc IEEE 88:170–195
3. Galiana FD, Ilic M (1998) A mathematical framework for the analysis and management of power transactions under open access. IEEE Trans Power Syst 13:681–687
4. Xiao Y, Wang P, Goel L (2009) Congestion management in hybrid power markets. Electr Power Syst Res 79:1416–1423
5. Narain A, Srivastava SK, Singh SN (2020) Congestion manage-ment approaches in restructured power system: key issues and challenges. Electr J 33(3):106–111
6. Yinliang X, Sun H, Liu H, Qing F (2018) Distributed solution to DC optimal power flow with congestion management. Electr Power Syst Res 95:73–82
7. Kumar A, Srivastava SC, Singh SN (2004) A zonal congestion management approach using real and reactive power resched-uling. IEEE Trans Power Sys 19(1):554–562
8. Sudipta D, Singh SP (2008) Optimal rescheduling of generators for congestion management based on particle swarm optimiza-tion. IEEE Trans Power Syst 23:1560–1569
9. Jain AK, Srivastava SC, Singh SN (2015) Bacteria foraging optimi-zation based bidding strategy under transmission congestion. IEEE Syst J 9(1):141–151
10. Gumpu S, Pamulaparthy B, Sharma A (2019) Review of conges-tion management methods from conventional to smart grid scenario. Int J Emerg Electr Power Syst 20(3):68–75
11. Hosseini SA, Amjady N, Shafie-khah M, Catalao JPS (2016) A new multi-objective solution approach to solve transmission con-gestion management problem of energy markets. Appl Energy 165:462–478
12. Conejo AJ, Milano F, Garcıa-Bertrand R (2006) Congestion management ensuring voltage stability. IEEE Trans Power Syst 21(1):357–364
13. Verma S, Mukherjee V (2016) Firefly algorithm for congestion management in deregulated environment. Eng Sci Technol 19:1254–1265
14. Boonyaritdachochai P, Boonchuay C, Ongsakul W (2010) Optimal congestion management in an electricity market using particle swarm optimization with time-varying acceleration coefficients. Comput Math Appl 60:1068–1077
15. Yamille DV, Venayagamoorthy GK, Harley RG (2008) Particle swarm optimization: basic concepts, variants, and applications in power systems. IEEE Trans Evolut Comput 12:171–195
16. AlRashidi MR, El-Hawary ME (2009) A survey of particle swarm optimization applications in electric power systems. IEEE Trans Evolut Comput 13:913–918
17. Masoud E, Shayanfar HA, Amjady N (2009) Congestion manage-ment considering voltage security of power systems. Energy Convers Manag 50:2562–2569
18. Yoshida H, Kawata K, Takayama S, Nakanishi Y (2000) A parti-cle swarm optimization for reactive power and voltage control considering voltage security assessment. IEEE Trans Power Syst 15(4):1232–1239
19. Batra I, Ghosh S (2018) A novel approach of congestion man-agement in deregulated power system using an advanced and intelligently trained twin extremity chaotic map adaptive parti-cle swarm optimization algorithm. Arab J Sci Eng 18(3):177–184
20. Drusila NJJ, Venkatesh P, Raja SC (2016) Energy management by generator rescheduling in congestive deregulated power system. Appl Energy 171:357–371
21. Masoud E, Ebadi F, Shayanfar HA, Jadid S (2013) Congestion management in hybrid power markets using modified Benders decomposition. Appl Energy 102:1004–1012
22. Arya LD, Singh P, Titare LS (2012) Anticipatory reactive power reserve maximization using differential evolution. Electr Power Energy Syst 35:66–73
23. Titare LS, Singh P, Arya LD, Choube SC (2014) Optimal reactive power rescheduling based on EPSDE algorithm to enhance static voltage stability. Electr Power Energy Syst 63:588–599
24. Affonso CM, da Silva LCP, Soares S (2004) MW and MVar manage-ment on supply and demand side for meeting voltage stability margin criteria. IEEE Trans Power Syst 19:1538–1545
25. Sawan S, Sengupta S, Chakrabarti A (2014) Electricity pricing: regulated, deregulated and smart grid systems. CRC Press, Boca Raton
26. Patel NK, Suthar BN (2016) A comparative study on particle swarm optimization for transmission congestion management. Energy Environ Carbon Credits 6:86–93
27. Asanga R, Halgamuge SK, Watson HC (2004) Self-organizing hierarchical particle swarm optimizer with time-varying accel-eration coefficients. IEEE Trans Evol Comput 8:240–255
28. Yesuratnam G, Thukaram D (2007) Congestion management in open access based on relative electrical distances using voltage stability criteria. Electr Power Syst Res 77:1608–1618
29. Venkataramana A, Christy C (1992) The continuation power flow: a tool for steady state voltage stability analysis. IEEE Trans Power Syst 7:416–423
Publisher’s Note Springer Nature remains neutral with regard to jurisdictional claims in published maps and institutional affiliations.