Performance of NiO–MgO solid solution-supported Pt catalysts in oxidative steam reforming of methane
Upload
independentCategory
view
8download
0
www.elsevier.com/locate/jnoncrysol
Journal of Non-Crystalline Solids 351 (2005) 1359–1365
Thermodynamic analysis of the SiO2–NiO–FeO system
R. Alejandro Cruz *, S. Antonio Romero, R. Marissa Vargas, L. Manuel Hallen
Department of Metallurgy and Materials, IPN-ESIQIE, UPALM Zacatenco, A. Postal 118-431, Mexico DF 07051, Mexico
Received 24 September 2004; received in revised form 28 February 2005
Available online 28 April 2005
Abstract
The evaluation of the thermodynamic properties and phase diagrams of the FeO–SiO2, NiO–SiO2 and SiO2–NiO–FeO systems is
presented in which a structural model is used for the liquid phase. This thermodynamic model is based on the assumption that each
metallic oxide produces the depolymerization reaction of silica network with a characteristic free energy change. A least squares
optimization program permits all available thermodynamic and phase diagram data to be optimized simultaneously for the binary
systems. In this manner, data for these binary systems have been analyzed and represented with a small number of parameters. The
binary structural model is extended to the ternary system assuming a random mixing of cations Fe2+ and Ni2+, since the FeO–SiO2
and NiO–SiO2 binary systems exhibit similar thermodynamic behavior, that is comparable free energies of mixing.
� 2005 Elsevier B.V. All rights reserved.
1. Introduction
The reduction of non-ferrous metal values from slags
is currently the subject of considerable research and
development effort in the extractive metallurgy industry.
The widespread introduction of new processes and the
trend to the production of higher-grade mattes in thecopper and nickel industries have led to increased metal
losses to the slag phase during smelting. In order to esti-
mate the loss of nickel to slags by dissolution during
smelting and converting processes it is necessary to
know the activity of nickel oxide as a function of com-
position in relevant (predominantly iron–silicate) slags.
In this context some researchers [1–3] have conducted
experimental studies of the solubility and activity ofnickel oxide in iron–silicates based slags.
Many models have been proposed to calculate the
thermodynamic properties of ordered solutions such as
liquid silicates [4]. Lin and Pelton [5] developed a struc-
tural model for binary silicate systems MO–SiO2
0022-3093/$ - see front matter � 2005 Elsevier B.V. All rights reserved.
doi:10.1016/j.jnoncrysol.2005.03.008
* Corresponding author. Tel.: +525557296000/54217; fax:
+525557296000/55270.
E-mail address: [email protected] (R. Alejandro Cruz).
(M = Ca, Mn, Mg, etc.) where one single formalism ap-
plies over the entire composition range and accounts for
two- and three-dimensional silicate network structure.
Recently, the model has been examined in more depth
and a general empirical expression for enthalpy has been
written and an empirical non-configurational excess en-
tropy has been added [6].This structural model was also extended to ternary
systems [7]. It is shown that, for systems SiO2–AO–
BO, random mixing of cations A2+ and B2+ occurs when
the oxides AO and BO behave in a similar way with sil-
icate. If the AO–SiO2 and BO–SiO2 binary systems exhi-
bit similar thermodynamic behavior, that is comparable
free energies of mixing, the properties of the ternary
SiO2–AO–BO can be extrapolated from those binarysystems in a straightforward fashion. This condition is
found in simple silicates such as SiO2–MnO–MgO,
SiO2–FeO–MnO and SiO2–FeO–MgO systems where
the activities and liquidus temperatures calculated solely
from data on the binary sub-systems are in good agree-
ment with measured ternary data. The aim of the
present work is to apply the structural model for the
FeO–SiO2 and NiO–SiO2 binary systems and the ex-tended model to calculate activities and phase diagram
1360 R. Alejandro Cruz et al. / Journal of Non-Crystalline Solids 351 (2005) 1359–1365
of the SiO2–NiO–FeO system solely from the assessed
parameters for the binary subsystems.
2. Structural model
2.1. Structural model for binary systems
A detailed development was given previously [6].
Only a brief summary will be presented here. For binary
silicate systems it is generally accepted that all Si atoms
are tetrahedrally bonded to four oxygen atoms The
model is based on the depolymerization reaction of
SiO2:
Si–O–SiþMO ¼ Si–OO–SiM2þ
ð1Þor, in shorthand notation
O0 þO2� ¼ 2O� ð2Þwhere O0 is a bridging oxygen bonded to two silicon
atoms, O2� is a free oxygen ion, and O� is an oxygen
single bonded to one silicon atom. It is assumed that
every silicon atom is bonded to four oxygen atoms.
Thus, mass balance considerations require that
NO0 ¼ 2XSiO2�NO�
2; ð3Þ
NO2� ¼ XMO �NO�
2; ð4Þ
where XMO and XSiO2are the mole fractions of the com-
ponents and NO0, NO� and NO2� are the number of mo-
les of the various oxygen species per mole of solution.
The first term of the configurational entropy is calcu-lated by assuming a tetrahedral quasi-lattice in which
the sites are occupied by O2� ions and Si atoms (each
associated with four oxygen atoms bonded to it); the
second term is obtained by distributing the oxygen
bridges (O0) over the neighboring Si–Si pairs
DSc ¼ �R XSiO2ln
XSiO2
XSiO2þNO2�
� ��
þNO2� lnNO2�
XSiO2þNO2�
� ���R NO0 ln
NO0
NSi–Si
� ��
þðNSi–Si �NO0Þ ln NSi–Si �NO0
NSi–Si
� ��: ð5Þ
NSi–Si is the number of moles of neighboring Si–Si pairs
per mole of solution. Since there are now O2� ions as
well as Si atoms on the quasi-lattice sites, NSi–Si is given
by
NSi–Si ¼ 2XSiO2
XSiO2
XSiO2þNO2�
� �; ð6Þ
where once again the co-ordination number of thequasi-lattice is assumed to be four. The structural model
assumes that Reaction (1) is associated with a Gibbs en-
ergy change containing an enthalpic (x) and entropic (g)term
DH ¼ NO�
2
� �x; ð7Þ
Snc ¼ NO�
2
� �g: ð8Þ
Finally, x and g are expanded as polynomials
x ¼ x0 þ x1XSiO2þ x2X
2SiO2
þ � � � ð9Þ
g ¼ g0 þ g1XSiO2þ g2X
2SiO2
þ � � � ð10ÞThe coefficients xi and gi are the parameters of the
model which are obtained by optimization of the data.Given a composition, XSiO2
, and values of the parame-
ters xi and gi, the actual value of NO� can be calculated
by minimizing the Gibbs energy at constant XSiO2, x and
g
DG ¼ DH� TðDSc þ SncÞ; ð11Þ
2oDGoNO�
� �XSiO2 ;x;g
¼ ðx� gTÞ �RT lnNO2�
XSiO2þNO2�
� ��
þ lnNO0
NSi–Si
� �� 1þ NSi–Si
XSiO2þNO2�
� �
� lnNSi–Si �NO0
NSi–Si
� ��¼ 0: ð12Þ
Substitution of Eqs. (3), (4) and (6) into (12) gives an
equation in terms of XMO (or XSiO2) and NO� , which
can be solved numerically at a fixed composition and
for given values of the parameters xi and gi to give
NO� . This value can then be substituted back into Eqs.
(3)–(5), (7) and (8) to give DS and DH.Since all integral and partial properties are expressed
in terms of the same parameters (xi and gi) all avail-
able data (phase diagrams, activities, enthalpies, etc.)
can be considered in one simultaneous least-squares
optimization. For the present model, a non-linear
least-squares optimization program was written. Copies
of this software may be obtained by contacting the
authors.
2.2. Structural model for ternary systems
Let us consider the general SiO2–AO–BO ternary sys-tem where A and B are divalent cations. Let us assume
also that these cations can mix randomly in a quasilat-
tice. The mass balance considerations (3) and (4)
requires now that
NO0 ¼ 2XSiO2�NO�
2; ð13Þ
NO2� ¼ ðXAO þXBOÞ �NO�
2: ð14Þ
R. Alejandro Cruz et al. / Journal of Non-Crystalline Solids 351 (2005) 1359–1365 1361
The total configurational entropy must contain two
terms, one for the anionic sublattice ðScaniÞ and one for
the cationic sublattice ðSccatÞ. The expression for the
Scani in the ternary model is similar to Eq. (5) which is
used in the binary systems. However, NO2� depends
now on XAO and XBO. The entropy for the cationic sub-lattice is obtained assuming random mixing of A and B
Sccat ¼ ð1�XSiO2
Þ
� �RXAO
XAO þXBO
lnXAO
XAO þXBO
� ���
þ XBO
XAO þXBO
lnXBO
XAO þXBO
� ���: ð15Þ
In the ternary solution, the depolymerization of SiO2 is
due to AO and BO. Each depolimerization reaction
is associated with a Gibbs energy change, namely(x � gT)AO–SiO2
and (x � gT)BO–SiO2.
There are empirical geometrical equations to estimate
the properties of ternary systems from the binary sub-
systems, such as that developed by Kohler [8] and that
of Topp [9], which are symmetrical and asymmetrical
with respect to the components, respectively. In this
work the asymmetrical approximation was used because
SiO2 is considered different from the metallic oxides.The interaction energy terms (x � gT) for each reaction
are known in the two binary systems from the binary
optimizations. It is then assumed that, in the ternary
solution, (x � gT)AO–SiO2and (x � gT)BO–SiO2
can be
linearly combined
ðx� gTÞtot ¼XAO
XAO þXBO
� �ðx� gTÞAO–SiO2
þ XBO
XAO þXBO
� �ðx� gT ÞBO–SiO2
: ð16Þ
The excess energy of the AO–BO binary system must be
multiplied by (1 � XSiO2) in order to consider its effect
Table 1
Thermodynamic properties relative to elements at 298.15 K
A B a
SiO2 (l) (298–1996 K) �896796 50.829 83.514
SiO2 (l) (>1996 K) �926636 9.917 85.772
SiO2 (Q) (848–1140 K) �908627 44.207 80.012
SiO2 (Tr) (390–1738 K) �907045 45.524 75.373
SiO2 (Cr) (535–1996 K) �906377 46.029 83.514
FeO(l) (298–1644 K) �234643 78.466 �18.024
FeO(l) (>1644 K) �247761 58.482 68.199
FeO(s) (298–1644 K) �265832 59.496 �18.024
NiO (s) (298–525 K) �239700 37.991 �52.622
NiO (s) (525–565 K) �235494 48.795 �33.724
NiO (s) (565–2228 K) �239687 37.070 45.622
NiO (l) (>2228 K) �178718 65.355 54.392
Fe2SiO4 (s) (298–2000 K) �1479955 150.930 248.900
Ni2SiO4 (s) (298–1818 K) �1403439 110.04 149.628
HðJ mol�1Þ ¼ AþR T
298:15 CpdT; SðJ mol�1 K�1Þ ¼ BþR T
298:15Cp
T
� �dT:
CpðJ mol�1 K�1Þ ¼ aþ bð10�3ÞTþ cð105ÞT�2 þ dT�1=2 þ eð108ÞT�3:
on the ternary system. Addition of the configurational
entropy and the excess properties gives the free energy
of mixing for the ternary liquid systems.
3. Binary systems
The thermodynamic properties of the pure oxides and
silicate compounds are given in Table 1. The sources of
these data have been previously discussed [10]. To calcu-
late binary and ternary phase diagrams is necessary to
define the free energy of each phase in the system. The
phase diagram is then calculated by treating the thermo-
dynamic expressions of all phases to determine whichcombination of phases leads to the lowest free energy
of the system.
3.1. NiO–SiO2
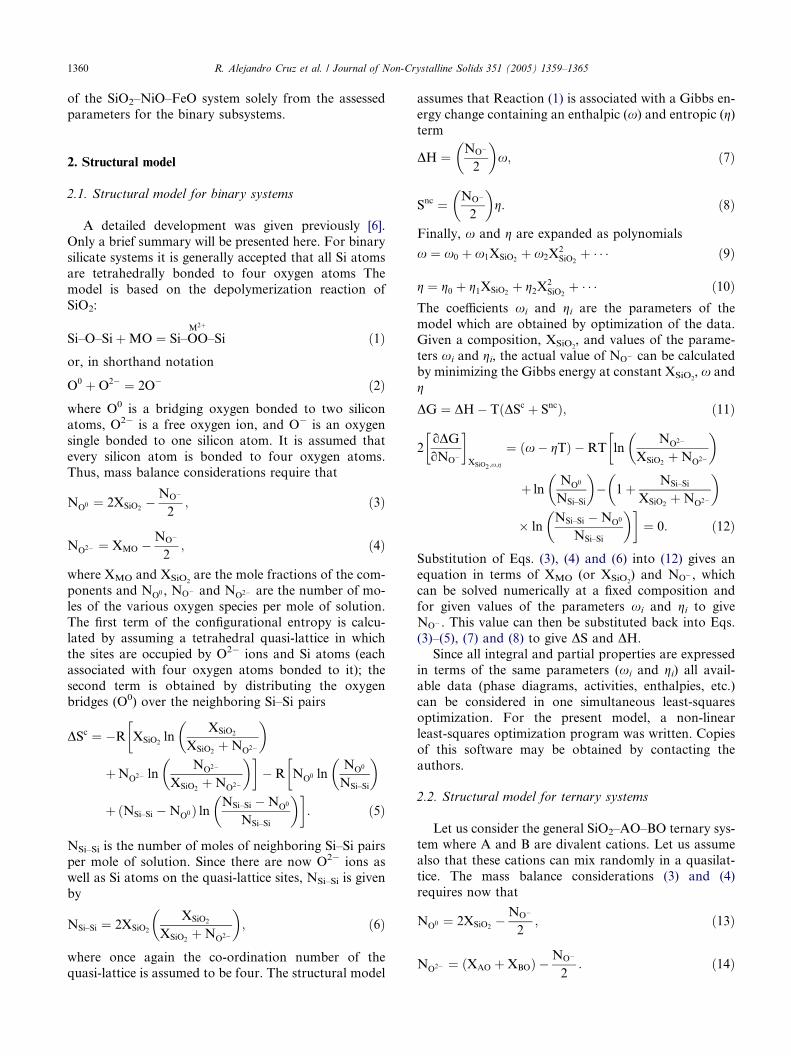
The phase diagram of the NiO–SiO2 system is shown
in Fig. 1. The experimental phase diagram is taken
mainly from Phillips [11] and Muan and Osborn [12].Gibbs energy of formation of the solid compound Ni2-
SiO4 is also given in Table 1. The consulate temperature
of the liquid–liquid miscibility gap has not been re-
ported. Compositions of the experimental diagram were
used as input to a least squares optimization program to
find the coefficients xi and gi which best reproduce all
the data. The resultant expressions are
x ¼ �93417þ 101537:5XSiO2þ 90582:5X2
SiO2ðJ mol�1Þ;
ð17Þ
g ¼ �55:01XSiO2þ 67:26X2
SiO2ðJ mol�1K�1Þ: ð18Þ
The NiO melting point at 1955 �C was taken from Barin[13]. The calculated eutectic was at 1655 �C with
b c d e
– �24.554 �374.693 2.801
– – – –
– �35.467 �240.276 4.917
– �59.581 – 9.583
– �24.553 �374.693 2.801
30.609 �25.333 1500.9 –
– – – –
30.609 �25.333 1500.9 –
213.15 29.776 – –
168.40 – – –
8.568 9.0063 – –
– – – –
– – �1923.9 �1.391
42.256 �16.899 – –
2000
1900
1800
1700
1600
140010 20 30 40 50 60 70 80 90 100
Mole %
Tem
pera
ture
(°C
)
Two Liquids
Cristobalite + Liquid
NiO + Cristobalite
Ni2SiO4+Cristobalite
NiO + Ni2SiO4
Liquid
1685 °C
1545 °C
NiO + Liquid
NiOSiO2
Ni 2
SiO
41500
Ni2SiO4+Tridimite
Fig. 1. Optimized NiO–SiO2 phase diagram for equilibrium with Fe.
Points from Phillips [11] and Muan and Osborn [12].
2000
1400
1900
1800
1700
1600
1500
1300
120020 40 60 80NiO FeO
liquid
(Ni, Fe)O+ liquid
(Ni, Fe) O
Weight %
Tem
pera
ture
(°C
)
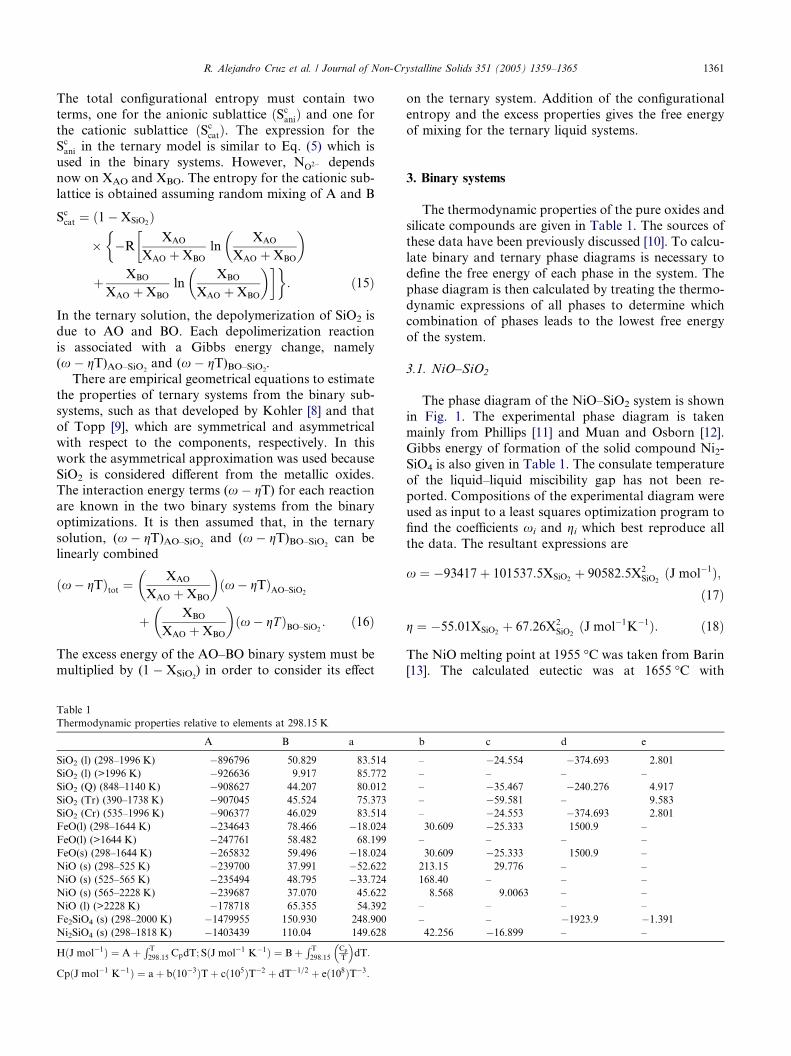
Fig. 3. Optimized NiO–FeO phase diagram. Points from Von War-
tenberg and Prophet [19].
1362 R. Alejandro Cruz et al. / Journal of Non-Crystalline Solids 351 (2005) 1359–1365
XSiO2= 0.44. The calculated monotectic reaction occurs
at 1685 �C with XSiO2= 0.984. The probable maximum
inaccuracy in the assessed diagram is: ±20� for
XSiO2< 0.50 and for the miscibility gap boundary was
±80 �C.
3.2. FeO–SiO2
The calculated phase diagram shown in Fig. 2 is for
the system in equilibrium with metallic Fe and with all
Fe3+ converted to �FeO�. The experimental phase dia-
gram is from Bowen and Schairer [14], Schuhmann
and Ensio [15] and Allen and Snow [16]. The liquid mis-
cibility gap data was taken from Greig [17]. The optimi-zation also included the activities of �FeO� reported by
Schuhmann and Ensio [15] and Distin et al. [18]. The
probable maximum inaccuracy in the assessed diagram
is: ±10 �C for XSiO2< 0.45 and ±2 mol% for the silica
liquidus. The optimized parameters for the liquid phase
are
Tem
pera
ture
(°C
)
Mole % SiO2 SiO2FeO
Fe2S
iO4
FeO + Fayalite Fayalite + Tridimite
Tridimite + Liquid
Cristobalite + Liquid
Two Liquids
Liquid
FeO + Liquid
˚
˚
˚
˚
˚
Fig. 2. Optimized FeO–SiO2 phase diagram. Experimental points: (d)
[17]; (s) [14]; (j) [15]; (h) [16].
x ¼ 6770� 122724XSiO2þ 183040X2
SiO2
þ 106539X4SiO2
ðJ mol�1Þ; ð19Þ
g ¼ �34:59XSiO2þ 87:366X3
SiO2ðJ mol�1 K�1Þ: ð20Þ
3.3. NiO–FeO
It was shown by Von Wartenberg and Prophet [19]that solid NiO and FeO are completely miscible at high
temperatures. The binary NiO–FeO phase diagram
shown in Fig. 3 can be calculated assuming ideal solid
and liquid solutions. The calculated phase diagram is
in very good agreement with the measurements.
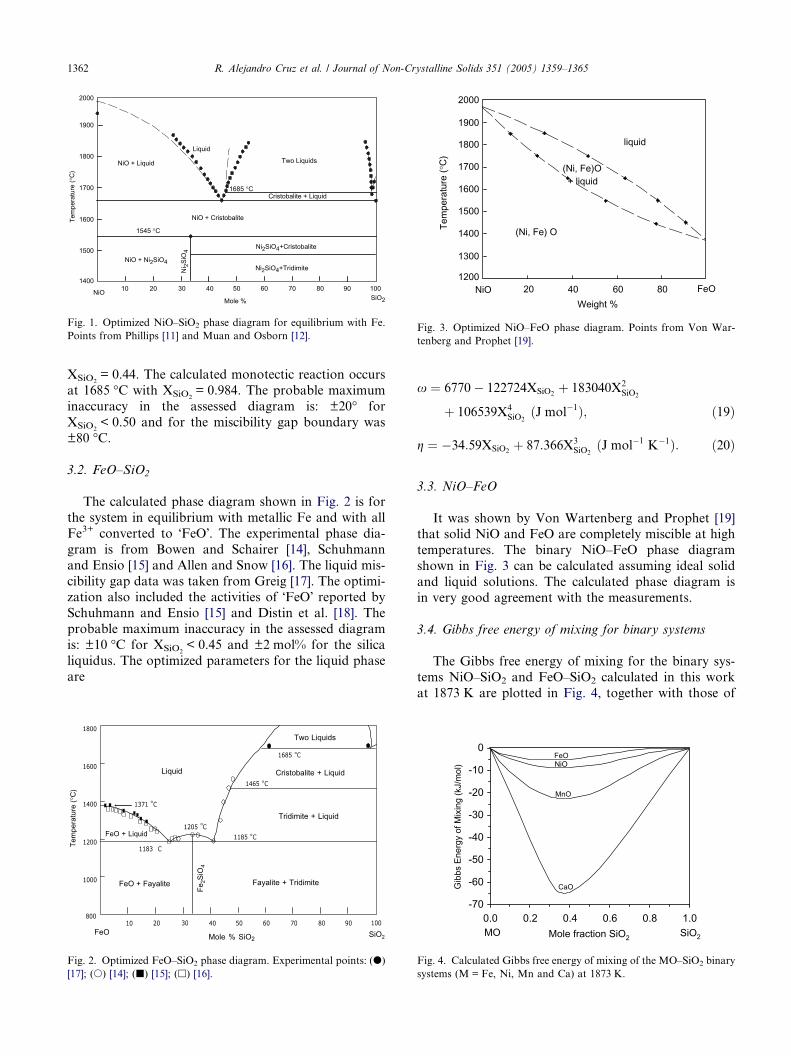
3.4. Gibbs free energy of mixing for binary systems
The Gibbs free energy of mixing for the binary sys-
tems NiO–SiO2 and FeO–SiO2 calculated in this work
at 1873 K are plotted in Fig. 4, together with those of
0.0 0.2 0.4 0.6 0.8 1.0-70
-60
-50
-40
-30
-20
-10
0FeONiO
MnO
CaOGib
bs E
nerg
y of
Mix
ing
(kJ/
mol
)
Mole fraction SiO2 SiO2 MO
Fig. 4. Calculated Gibbs free energy of mixing of the MO–SiO2 binary
systems (M = Fe, Ni, Mn and Ca) at 1873 K.
0 10 20 30 40 50 60 70 80 90 1000
20
30
40
50
60
70
80
90
1000
10
20
30
40
50
60
70
80
90
100
SiO2
NiOFeO
Two liquids
Cristobalite
Olivine
Oxide1300
14001500
16001700
1800
1900
Tridimite
(2NiO SiO2)(2FeO SiO2)
a
R. Alejandro Cruz et al. / Journal of Non-Crystalline Solids 351 (2005) 1359–1365 1363
the MnO–SiO2 and CaO–SiO2 systems reported else-
where [6]. This figure shows that the values of the
energy of NiO–SiO2 and FeO–SiO2 are very similar,
which means that the cations Ni2+ and Fe2+ should have
a similar thermodynamic behavior in the silicate net-
work. In addition, the binary phase diagram of theNiO–FeO system shows that the liquid solution is al-
most ideal. Thus, the structural model can be used
appropriately for estimating the thermodynamic proper-
ties and phase diagrams for the SiO2–NiO–FeO system
from the binary systems in a straightforward fashion.
Fig. 4 also shows that the energy of the CaO–SiO2 sys-
tems is much lower than the other systems. This means
that Ca2+ must play a role in the silicate network differ-ent from that of Ni2+, Mn2+ and Fe2+ in the silicate
network [7].
Weight %(a) Experimental [20]
20
30
40
50
60
70
80
90
1000
10
20
30
40
50
60
70
80
SiO2
Two liquids
Cristobalite
Olivine
Oxide1300
Tridimite
a
(2NiO SiO2)(2FeO SiO2)
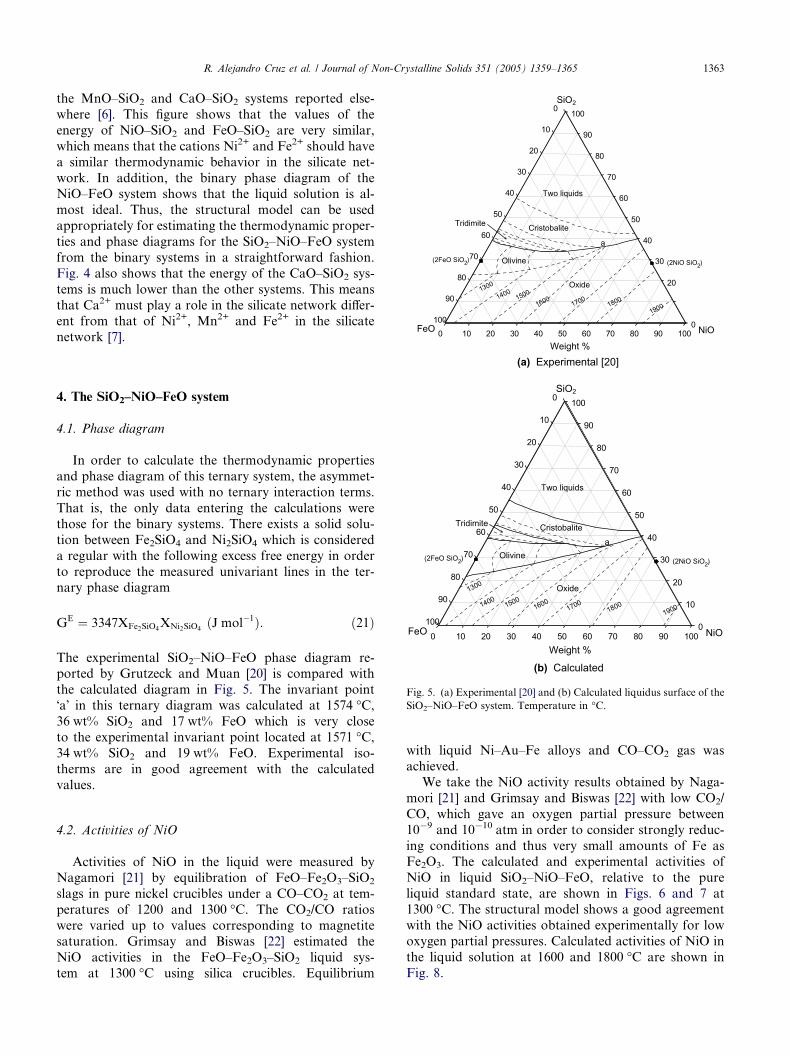
4. The SiO2–NiO–FeO system
4.1. Phase diagram
In order to calculate the thermodynamic properties
and phase diagram of this ternary system, the asymmet-
ric method was used with no ternary interaction terms.
That is, the only data entering the calculations were
those for the binary systems. There exists a solid solu-
tion between Fe2SiO4 and Ni2SiO4 which is considered
a regular with the following excess free energy in order
to reproduce the measured univariant lines in the ter-nary phase diagram
0
1090
100
14001500
16001700
18001900
GE ¼ 3347XFe2SiO4XNi2SiO4
ðJ mol�1Þ: ð21Þ
0 10 20 30 40 50 60 70 80 90 100 NiOFeOWeight %
(b) Calculated
Fig. 5. (a) Experimental [20] and (b) Calculated liquidus surface of the
SiO2–NiO–FeO system. Temperature in �C.
The experimental SiO2–NiO–FeO phase diagram re-ported by Grutzeck and Muan [20] is compared with
the calculated diagram in Fig. 5. The invariant point
�a� in this ternary diagram was calculated at 1574 �C,36 wt% SiO2 and 17 wt% FeO which is very close
to the experimental invariant point located at 1571 �C,34 wt% SiO2 and 19 wt% FeO. Experimental iso-
therms are in good agreement with the calculated
values.
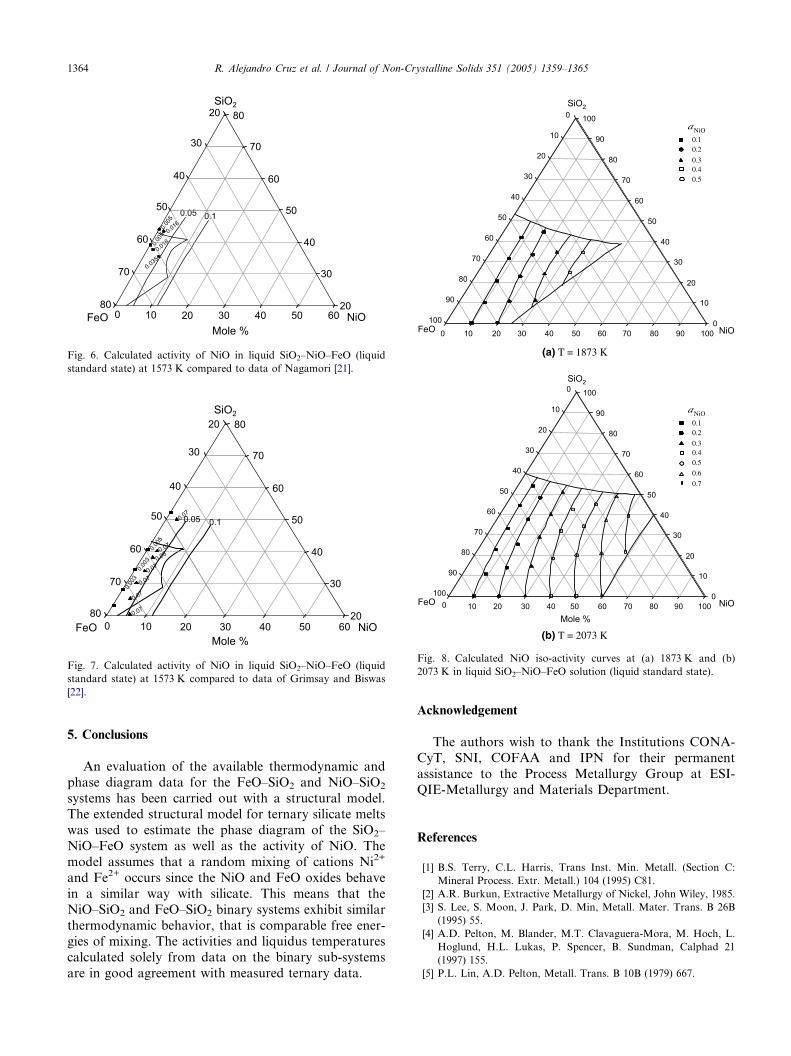
4.2. Activities of NiO
Activities of NiO in the liquid were measured byNagamori [21] by equilibration of FeO–Fe2O3–SiO2
slags in pure nickel crucibles under a CO–CO2 at tem-
peratures of 1200 and 1300 �C. The CO2/CO ratios
were varied up to values corresponding to magnetite
saturation. Grimsay and Biswas [22] estimated the
NiO activities in the FeO–Fe2O3–SiO2 liquid sys-
tem at 1300 �C using silica crucibles. Equilibrium
with liquid Ni–Au–Fe alloys and CO–CO2 gas was
achieved.
We take the NiO activity results obtained by Naga-
mori [21] and Grimsay and Biswas [22] with low CO2/
CO, which gave an oxygen partial pressure between
10�9 and 10�10 atm in order to consider strongly reduc-
ing conditions and thus very small amounts of Fe asFe2O3. The calculated and experimental activities of
NiO in liquid SiO2–NiO–FeO, relative to the pure
liquid standard state, are shown in Figs. 6 and 7 at
1300 �C. The structural model shows a good agreement
with the NiO activities obtained experimentally for low
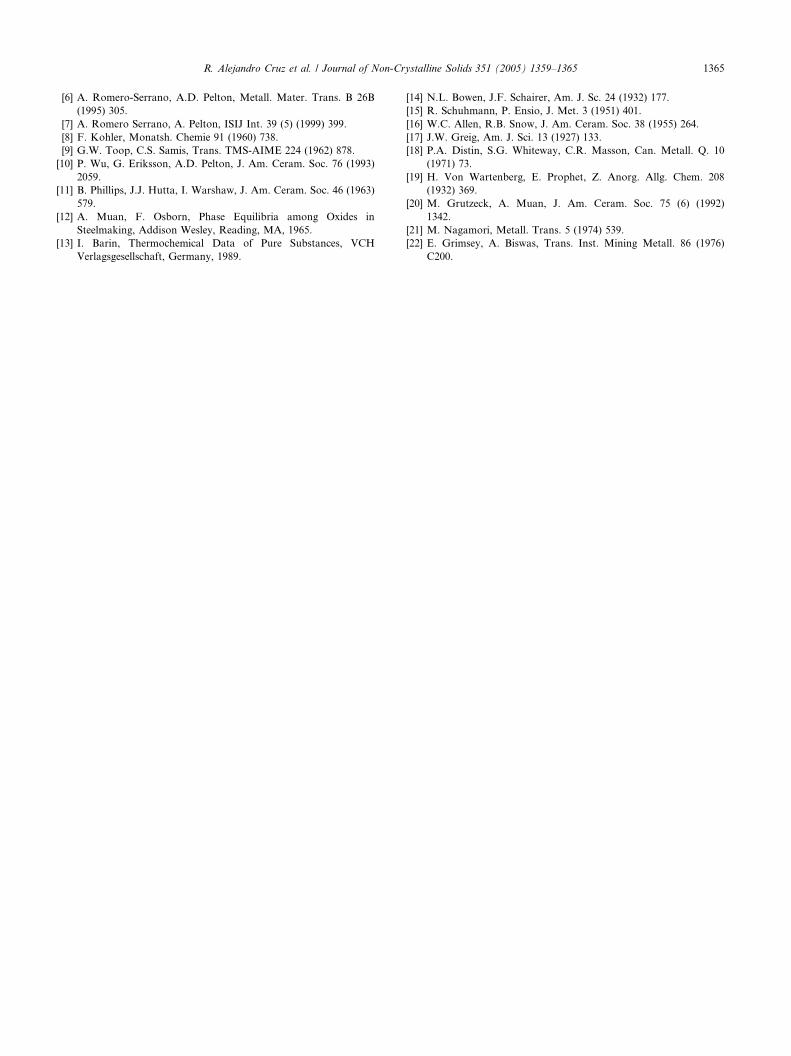
oxygen partial pressures. Calculated activities of NiO in
the liquid solution at 1600 and 1800 �C are shown in
Fig. 8.
0.05 0.1
0.005
0.005
0.016
0.016
0.035
20 30 40 50 6020
30
40
50
60
70
8020
30
40
50
60
70
800 10
SiO2
NiOFeOMole %
Fig. 6. Calculated activity of NiO in liquid SiO2–NiO–FeO (liquid
standard state) at 1573 K compared to data of Nagamori [21].
20 30 40 50 6020
30
40
50
60
70
8020
30
40
50
60
70
800 10
SiO2
NiOFeOMole %
0.05 0.1
0.005
0.003
0.003
0.07
0.07
0.08
0.07
0.07
0.07
0.07
Fig. 7. Calculated activity of NiO in liquid SiO2–NiO–FeO (liquid
standard state) at 1573 K compared to data of Grimsay and Biswas
[22].
0 10 20 30 40 50 60 70 80 90 1000
10
20
30
40
50
60
0.1NiO
0.2
0.30.40.570
80
90
1000
10
20
30
40
50
60
70
80
90
100
a
0.1NiO
0.2
0.30.40.5
0.6
0.7
a
(a) T = 1873 K
0 10 20 30 40 50 60 70 80 90 1000
10
20
30
40
50
60
70
80
90
1000
10
20
30
40
50
60
70
80
90
100
SiO2
SiO2
NiOFeO
NiOFeO
Mole %
(b) T = 2073 K
Fig. 8. Calculated NiO iso-activity curves at (a) 1873 K and (b)
2073 K in liquid SiO2–NiO–FeO solution (liquid standard state).
1364 R. Alejandro Cruz et al. / Journal of Non-Crystalline Solids 351 (2005) 1359–1365
5. Conclusions
An evaluation of the available thermodynamic and
phase diagram data for the FeO–SiO2 and NiO–SiO2
systems has been carried out with a structural model.The extended structural model for ternary silicate melts
was used to estimate the phase diagram of the SiO2–
NiO–FeO system as well as the activity of NiO. The
model assumes that a random mixing of cations Ni2+
and Fe2+ occurs since the NiO and FeO oxides behave
in a similar way with silicate. This means that the
NiO–SiO2 and FeO–SiO2 binary systems exhibit similar
thermodynamic behavior, that is comparable free ener-gies of mixing. The activities and liquidus temperatures
calculated solely from data on the binary sub-systems
are in good agreement with measured ternary data.
Acknowledgement
The authors wish to thank the Institutions CONA-
CyT, SNI, COFAA and IPN for their permanent
assistance to the Process Metallurgy Group at ESI-
QIE-Metallurgy and Materials Department.
References
[1] B.S. Terry, C.L. Harris, Trans Inst. Min. Metall. (Section C:
Mineral Process. Extr. Metall.) 104 (1995) C81.
[2] A.R. Burkun, Extractive Metallurgy of Nickel, John Wiley, 1985.
[3] S. Lee, S. Moon, J. Park, D. Min, Metall. Mater. Trans. B 26B
(1995) 55.
[4] A.D. Pelton, M. Blander, M.T. Clavaguera-Mora, M. Hoch, L.
Hoglund, H.L. Lukas, P. Spencer, B. Sundman, Calphad 21
(1997) 155.
[5] P.L. Lin, A.D. Pelton, Metall. Trans. B 10B (1979) 667.
R. Alejandro Cruz et al. / Journal of Non-Crystalline Solids 351 (2005) 1359–1365 1365
[6] A. Romero-Serrano, A.D. Pelton, Metall. Mater. Trans. B 26B
(1995) 305.
[7] A. Romero Serrano, A. Pelton, ISIJ Int. 39 (5) (1999) 399.
[8] F. Kohler, Monatsh. Chemie 91 (1960) 738.
[9] G.W. Toop, C.S. Samis, Trans. TMS-AIME 224 (1962) 878.
[10] P. Wu, G. Eriksson, A.D. Pelton, J. Am. Ceram. Soc. 76 (1993)
2059.
[11] B. Phillips, J.J. Hutta, I. Warshaw, J. Am. Ceram. Soc. 46 (1963)
579.
[12] A. Muan, F. Osborn, Phase Equilibria among Oxides in
Steelmaking, Addison Wesley, Reading, MA, 1965.
[13] I. Barin, Thermochemical Data of Pure Substances, VCH
Verlagsgesellschaft, Germany, 1989.
[14] N.L. Bowen, J.F. Schairer, Am. J. Sc. 24 (1932) 177.
[15] R. Schuhmann, P. Ensio, J. Met. 3 (1951) 401.
[16] W.C. Allen, R.B. Snow, J. Am. Ceram. Soc. 38 (1955) 264.
[17] J.W. Greig, Am. J. Sci. 13 (1927) 133.
[18] P.A. Distin, S.G. Whiteway, C.R. Masson, Can. Metall. Q. 10
(1971) 73.
[19] H. Von Wartenberg, E. Prophet, Z. Anorg. Allg. Chem. 208
(1932) 369.
[20] M. Grutzeck, A. Muan, J. Am. Ceram. Soc. 75 (6) (1992)
1342.
[21] M. Nagamori, Metall. Trans. 5 (1974) 539.
[22] E. Grimsey, A. Biswas, Trans. Inst. Mining Metall. 86 (1976)
C200.
Copyright © 2022 FDOKUMEN


![Diffusion of 18 elements implanted into thermally grown SiO[sub 2]](https://static.fdokumen.com/doc/165x107/6335afedcd4bf2402c0b3112/diffusion-of-18-elements-implanted-into-thermally-grown-siosub-2.jpg)