Synthesis, Characterization and Study of Electrical Properties of Polyaniline-NiO Nanocomposites
Upload
independentCategory
view
0download
0
www.elsevier.com/locate/apcata
Applied Catalysis A: General 292 (2005) 272–280
Performance of NiO–MgO solid solution-supported Pt catalysts in
oxidative steam reforming of methane
Mohammad Nurunnabi a, Baitao Li a, Kimio Kunimori a, Kimihito Suzuki b,Ken-ichiro Fujimoto b, Keiichi Tomishige a,*
a Institute of Materials Science, University of Tsukuba, 1-1-1, Tennodai, Tsukuba, Ibaraki 305-8573, Japanb Advanced Technology Research Laboratories, Nippon Steel Corporation, 20-1, Shintomi, Futtsu, Chiba 293-8511, Japan
Received 14 March 2005; received in revised form 6 June 2005; accepted 21 June 2005
Available online 16 August 2005
Abstract
The effect of Pt addition to NiO–MgO solid solution catalysts on the performance in oxidative steam reforming of methane was
investigated. In the oxidative reforming of methane, Pt/NiO–MgO gave much higher methane conversion than NiO–MgO and Pt/MgO,
especially under short contact time (low W/F : W = catalyst weight, F = total flow rate). Although the effect of Pt was not clear in temperature
program reduction profiles, the additive effect of Pt is remarkable in oxidative reforming of methane in term of catalyst activation. In the case
of Pt/NiO–MgO catalysts, even when the H2 reduction pretreatment was not done, the catalyst can be activated at a temperature higher than
773 K with a reactant gas including methane, steam, or oxygen. This behavior is related to the methane combustion activity. The order of the
activity was as follows: Pt/NiO–MgO � Pt/MgO > NiO–MgO. High combustion activity is related to methane activation ability, and this can
make the catalyst activation and reduction easier.
# 2005 Elsevier B.V. All rights reserved.
Keywords: Oxidative steam reforming of methane; Pt; Ni; Self-activation; NiO–MgO solid solution
1. Introduction
Steam reforming of natural gas, whose main component
is methane, on a nickel-based catalyst is one of the important
economic processes for the production of hydrogen and
synthesis gas [1]. The reaction can be described below:
CH4 þ H2O!CO þ 3H2; DH ¼ 206 kJ=mol (1)
Although the steam reforming of methane can give hydro-
gen-rich synthesis gas, the composition of the synthesis gas
can be altered by the water–gas shift reaction or reverse
water gas shift reaction, as shown below:
CO þ H2O!CO2 þ H2; DH ¼ �36 kJ=mol (2)
CO2 þ H2 !CO þ H2O; DH ¼ þ41 kJ=mol (3)
* Corresponding author. Tel.: +81 29 853 5030; fax: +81 29 853 5030.
E-mail address: [email protected] (K. Tomishige).
0926-860X/$ – see front matter # 2005 Elsevier B.V. All rights reserved.
doi:10.1016/j.apcata.2005.06.022
The produced hydrogen and synthesis gas can be utilized
for the synthesis of ammonia, methanol, hydrocarbons,
dimethyl ether, acetic acid, and for oxo-syntheses. As
described above (Eq. (1)), steam reforming of methane to
synthesis gas requires heat, since the reaction is highly
endothermic. Therefore, in the conventional steam reform-
ing system, severe external heating has been carried out.
However, the efficiency of the external heating with burners
is not so high. In order to enhance the efficiency, some
researchers have added oxygen to the reactant gas to utilize
the exothermic reactions such as methane combustion
(Eq. (4)) and partial oxidation of methane (Eq. (5)).
CH4 þ 2O2 !CO2 þ 2H2O; DH ¼ �803 kJ=mol (4)
CH4 þ 1=2O2 !CO þ 2H2; DH ¼ �36 kJ=mol (5)
This method corresponds to an internal heating system.
The most famous process of this method is ATR
(autothermal reforming of methane) developed by Haldor
M. Nurunnabi et al. / Applied Catalysis A: General 292 (2005) 272–280 273
Topsøe [2]. This reaction system consists of non-catalytic
partial oxidation + combustion and catalytic methane
reforming with H2O and CO2. In this system, the introduced
oxygen was consumed in the non-catalytic part, and does not
contact with the steam reforming catalyst for the inhibition
of the hot spot formation on the catalyst surface. There are a
lot of reports on catalyst development for the combinations
of catalytic combustion and reforming, which correspond to
oxidative steam reforming of methane [3–13]. When oxygen
is introduced to the steam reforming Ni catalyst with
methane and steam, only methane combustion proceeds near
the catalyst bed inlet, since the rate of methane combustion
can be much higher than the rate of methane reforming. This
makes the bed temperature higher and the hot spots can be
formed. This is a general problem in the combination of
catalytic combustion with reforming for the oxidative steam
reforming process. Recently, our group has reported that the
addition of Pt to Ni catalyst drastically flattens the catalyst
bed temperature gradient in oxidative reforming of methane
[4,14]. This effect can be explained by the inhibition of the
oxidation of Ni, even in the region of O2 presence, by alloy
formation of Pt and Ni.
On the other hand, it has been reported that NiO–MgO
solid solution catalysts exhibited high performance in steam
[15] and dry reforming of methane [16–20]. Especially, the
catalysts had high resistance to coke deposition, which is
one of the most serious problems in the reforming process.
Since NiO–MgO solid solution catalysts have low reduci-
bility [15], it is thought that they are not suitable to oxidative
steam reforming of methane. According to our previous
reports, when methane combustion and reforming can
proceed simultaneously in the same region of the catalyst
bed, the hot spot formation can be effectively inhibited [21].
For this purpose, maintenance of the metallic state of Ni is
thought to be very important.
In this research, we investigated the effect of Pt addition
to NiO–MgO solid solution catalysts in oxidative steam
reforming of methane. Especially, the additive effect of Pt is
to enhance the catalyst reducibility and to promote self-
activation of catalyst, which can be due to high combustion
activity caused by synergy between Pt and NiO–MgO solid
solution.
2. Experimental
2.1. Catalyst preparation
NiO–MgO solid solutions were prepared by the solid
reaction method from NiO (Wako Pure Chemical Industries
Ltd, Japan) and MgO (UBE Material Industries Ltd, Japan).
The mixture of NiO with MgO was calcined in air at 1423 K
for 12 h. The formation of NiO–MgO solid solution was
identified by X-ray diffraction (XRD), as described later.
The compositions of solid solution prepared in this study
were NixMg1�xO where x = 0.05, 0.10, 0.15 and 0.20. After
the calcination, the BET surface areas of NixMg1�xO were
determined to be 2.6–4.1 m2/g. As a reference, MgO was
calcined at the same temperature. The loading of Pt on
NixMg1�xO and MgO was performed by the impregnation
of NixMg1�xO and MgO with Pt(NO2)2(NH3)2 aqueous
solution. After removal of the solvent by heating, the
catalysts were dried overnight at 383 K and then calcined in
air at 773 K for 3 h. The loading amount of Pt was 0–
1.0 mass%. Before use, all of these catalysts were pressed
(500 kg/cm2) into disks and then crushed to 60–100 mesh
particles. These catalysts are denoted as 0.1% Pt/NixMg1�xO,
where the value before Pt represents the loading amount of Pt
as mass%, and ‘x’ means the Ni content as a molar ratio in
NiO–MgO solid solution.
2.2. Catalytic reaction
Oxidative steam reforming of methane was carried out in
a fixed-bed flow reaction system. A quartz tube (inner
diameter: 4.4 mm) was used as the reactor. A thin quartz
tube (inner diameter: 1.5 mm) was used as the thermo-
couple-well. The reaction temperature was monitored by
thermocouples located at the catalyst bed inlet and outlet.
This temperature was controlled on the basis of the inlet
thermocouple. Catalyst reduction was carried out by
hydrogen flow under atmospheric pressure at an appropriate
temperature. The pretreatment conditions are shown in each
result. The partial pressure ratio of reactants was usually
CH4/H2O/O2 = 2/1.5/1, where H2O was supplied by using
the microfeeder. The total pressure was 0.1 MPa; 0.03 g
catalyst was used for each experiment. The length of the
catalyst bed was about 4 mm. Contact time W/F (W = cat-
alyst weight/g and F = total flow rate of the introduced
gases/mol/h) was in the range of 0.13–1.2 g h/mol. The
effluent gas was analyzed with an FID gas chromatograph
(GC) (column packing: Gaskuropack 54) equipped with a
methanator for CH4, CO, CO2; a TCD-GC (column packing:
Molecular Sieve 13X) was used for H2 analysis. An ice bath
was set up between the reactor exit and the sampling port in
order to remove water from the effluent gas used for GC
analysis. Methane conversion and CO selectivity in
oxidative steam reforming of methane were calculated as
described below. The amount of deposited coke during the
reaction can be neglected in all the cases here.
Methane conversion ð%Þ ¼ ðCCO þ CCO2Þ
ðCCH4þ CCO þ CCO2
Þ � 100
CO selectivity ð%Þ ¼ CCO
ðCCO þ CCO2Þ � 100
C, concentration of each component in the effluent gas.
2.3. Catalyst characterization
The surface area of the catalysts was determined by the
BET method by using a Gemini (Micromeritics) instrument.
M. Nurunnabi et al. / Applied Catalysis A: General 292 (2005) 272–280274
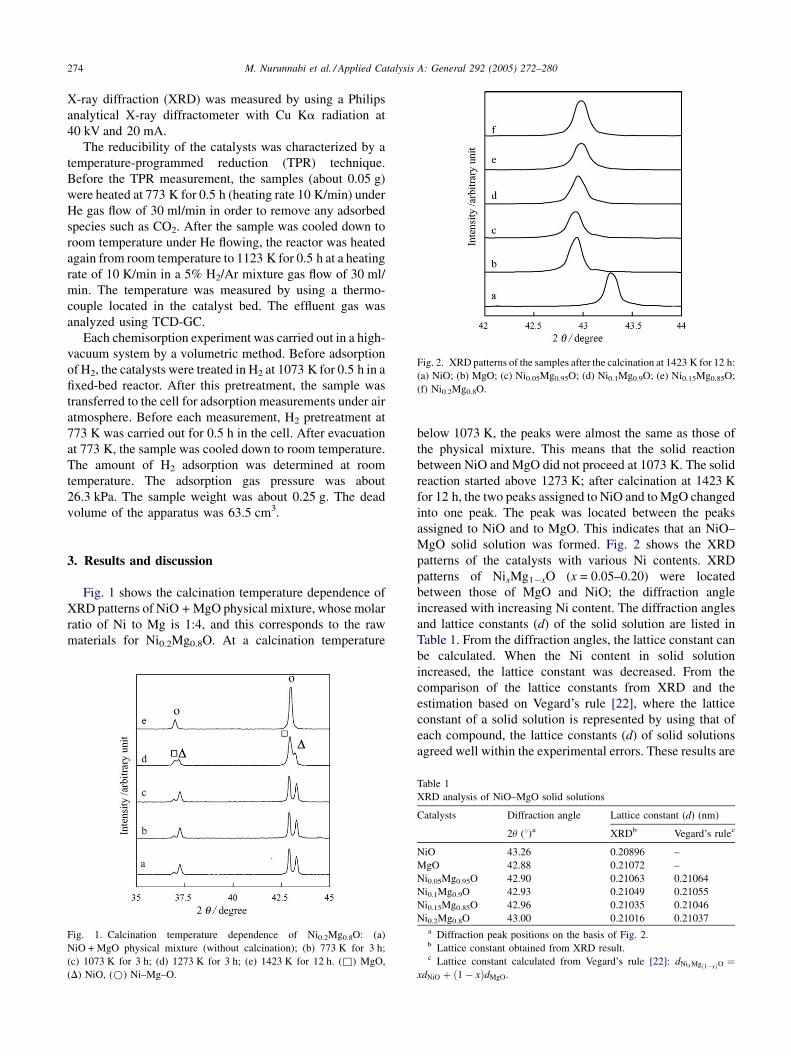
Fig. 2. XRD patterns of the samples after the calcination at 1423 K for 12 h:
(a) NiO; (b) MgO; (c) Ni0.05Mg0.95O; (d) Ni0.1Mg0.9O; (e) Ni0.15Mg0.85O;
(f) Ni0.2Mg0.8O.
X-ray diffraction (XRD) was measured by using a Philips
analytical X-ray diffractometer with Cu Ka radiation at
40 kV and 20 mA.
The reducibility of the catalysts was characterized by a
temperature-programmed reduction (TPR) technique.
Before the TPR measurement, the samples (about 0.05 g)
were heated at 773 K for 0.5 h (heating rate 10 K/min) under
He gas flow of 30 ml/min in order to remove any adsorbed
species such as CO2. After the sample was cooled down to
room temperature under He flowing, the reactor was heated
again from room temperature to 1123 K for 0.5 h at a heating
rate of 10 K/min in a 5% H2/Ar mixture gas flow of 30 ml/
min. The temperature was measured by using a thermo-
couple located in the catalyst bed. The effluent gas was
analyzed using TCD-GC.
Each chemisorption experiment was carried out in a high-
vacuum system by a volumetric method. Before adsorption
of H2, the catalysts were treated in H2 at 1073 K for 0.5 h in a
fixed-bed reactor. After this pretreatment, the sample was
transferred to the cell for adsorption measurements under air
atmosphere. Before each measurement, H2 pretreatment at
773 K was carried out for 0.5 h in the cell. After evacuation
at 773 K, the sample was cooled down to room temperature.
The amount of H2 adsorption was determined at room
temperature. The adsorption gas pressure was about
26.3 kPa. The sample weight was about 0.25 g. The dead
volume of the apparatus was 63.5 cm3.
3. Results and discussion
Fig. 1 shows the calcination temperature dependence of
XRD patterns of NiO + MgO physical mixture, whose molar
ratio of Ni to Mg is 1:4, and this corresponds to the raw
materials for Ni0.2Mg0.8O. At a calcination temperature
Fig. 1. Calcination temperature dependence of Ni0.2Mg0.8O: (a)
NiO + MgO physical mixture (without calcination); (b) 773 K for 3 h;
(c) 1073 K for 3 h; (d) 1273 K for 3 h; (e) 1423 K for 12 h. (&) MgO,
(D) NiO, (*) Ni–Mg–O.
below 1073 K, the peaks were almost the same as those of
the physical mixture. This means that the solid reaction
between NiO and MgO did not proceed at 1073 K. The solid
reaction started above 1273 K; after calcination at 1423 K
for 12 h, the two peaks assigned to NiO and to MgO changed
into one peak. The peak was located between the peaks
assigned to NiO and to MgO. This indicates that an NiO–
MgO solid solution was formed. Fig. 2 shows the XRD
patterns of the catalysts with various Ni contents. XRD
patterns of NixMg1�xO (x = 0.05–0.20) were located
between those of MgO and NiO; the diffraction angle
increased with increasing Ni content. The diffraction angles
and lattice constants (d) of the solid solution are listed in
Table 1. From the diffraction angles, the lattice constant can
be calculated. When the Ni content in solid solution
increased, the lattice constant was decreased. From the
comparison of the lattice constants from XRD and the
estimation based on Vegard’s rule [22], where the lattice
constant of a solid solution is represented by using that of
each compound, the lattice constants (d) of solid solutions
agreed well within the experimental errors. These results are
Table 1
XRD analysis of NiO–MgO solid solutions
Catalysts Diffraction angle Lattice constant (d) (nm)
2u (8)a XRDb Vegard’s rulec
NiO 43.26 0.20896 –
MgO 42.88 0.21072 –
Ni0.05Mg0.95O 42.90 0.21063 0.21064
Ni0.1Mg0.9O 42.93 0.21049 0.21055
Ni0.15Mg0.85O 42.96 0.21035 0.21046
Ni0.2Mg0.8O 43.00 0.21016 0.21037a Diffraction peak positions on the basis of Fig. 2.b Lattice constant obtained from XRD result.c Lattice constant calculated from Vegard’s rule [22]: dNixMgð1�xÞO ¼
xdNiO þ ð1 � xÞdMgO.
M. Nurunnabi et al. / Applied Catalysis A: General 292 (2005) 272–280 275
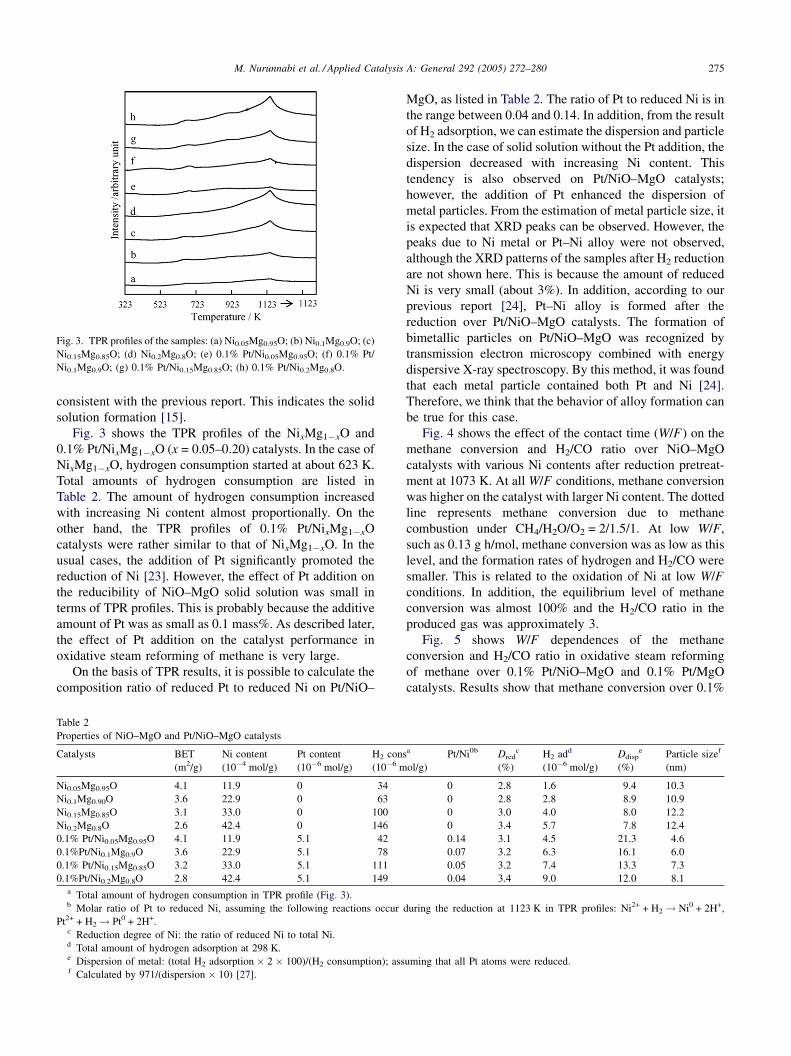
Fig. 3. TPR profiles of the samples: (a) Ni0.05Mg0.95O; (b) Ni0.1Mg0.9O; (c)
Ni0.15Mg0.85O; (d) Ni0.2Mg0.8O; (e) 0.1% Pt/Ni0.05Mg0.95O; (f) 0.1% Pt/
Ni0.1Mg0.9O; (g) 0.1% Pt/Ni0.15Mg0.85O; (h) 0.1% Pt/Ni0.2Mg0.8O.
consistent with the previous report. This indicates the solid
solution formation [15].
Fig. 3 shows the TPR profiles of the NixMg1�xO and
0.1% Pt/NixMg1�xO (x = 0.05–0.20) catalysts. In the case of
NixMg1�xO, hydrogen consumption started at about 623 K.
Total amounts of hydrogen consumption are listed in
Table 2. The amount of hydrogen consumption increased
with increasing Ni content almost proportionally. On the
other hand, the TPR profiles of 0.1% Pt/NixMg1�xO
catalysts were rather similar to that of NixMg1�xO. In the
usual cases, the addition of Pt significantly promoted the
reduction of Ni [23]. However, the effect of Pt addition on
the reducibility of NiO–MgO solid solution was small in
terms of TPR profiles. This is probably because the additive
amount of Pt was as small as 0.1 mass%. As described later,
the effect of Pt addition on the catalyst performance in
oxidative steam reforming of methane is very large.
On the basis of TPR results, it is possible to calculate the
composition ratio of reduced Pt to reduced Ni on Pt/NiO–
Table 2
Properties of NiO–MgO and Pt/NiO–MgO catalysts
Catalysts BET
(m2/g)
Ni content
(10�4 mol/g)
Pt content
(10�6 mol/g)
H2 cons
(10�6 m
Ni0.05Mg0.95O 4.1 11.9 0 34
Ni0.1Mg0.90O 3.6 22.9 0 63
Ni0.15Mg0.85O 3.1 33.0 0 100
Ni0.2Mg0.8O 2.6 42.4 0 146
0.1% Pt/Ni0.05Mg0.95O 4.1 11.9 5.1 42
0.1%Pt/Ni0.1Mg0.9O 3.6 22.9 5.1 78
0.1% Pt/Ni0.15Mg0.85O 3.2 33.0 5.1 111
0.1%Pt/Ni0.2Mg0.8O 2.8 42.4 5.1 149a Total amount of hydrogen consumption in TPR profile (Fig. 3).b Molar ratio of Pt to reduced Ni, assuming the following reactions occur
Pt2+ + H2 ! Pt0 + 2H+.c Reduction degree of Ni: the ratio of reduced Ni to total Ni.d Total amount of hydrogen adsorption at 298 K.e Dispersion of metal: (total H2 adsorption � 2 � 100)/(H2 consumption); assf Calculated by 971/(dispersion � 10) [27].
MgO, as listed in Table 2. The ratio of Pt to reduced Ni is in
the range between 0.04 and 0.14. In addition, from the result
of H2 adsorption, we can estimate the dispersion and particle
size. In the case of solid solution without the Pt addition, the
dispersion decreased with increasing Ni content. This
tendency is also observed on Pt/NiO–MgO catalysts;
however, the addition of Pt enhanced the dispersion of
metal particles. From the estimation of metal particle size, it
is expected that XRD peaks can be observed. However, the
peaks due to Ni metal or Pt–Ni alloy were not observed,
although the XRD patterns of the samples after H2 reduction
are not shown here. This is because the amount of reduced
Ni is very small (about 3%). In addition, according to our
previous report [24], Pt–Ni alloy is formed after the
reduction over Pt/NiO–MgO catalysts. The formation of
bimetallic particles on Pt/NiO–MgO was recognized by
transmission electron microscopy combined with energy
dispersive X-ray spectroscopy. By this method, it was found
that each metal particle contained both Pt and Ni [24].
Therefore, we think that the behavior of alloy formation can
be true for this case.
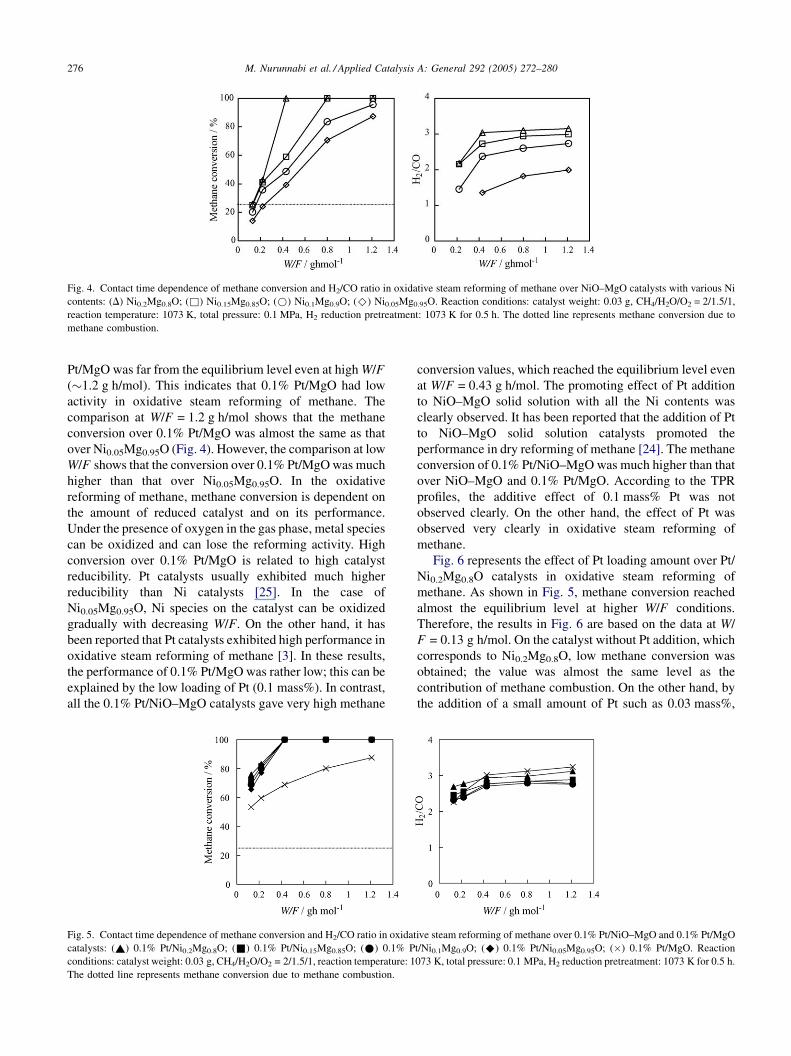
Fig. 4 shows the effect of the contact time (W/F) on the
methane conversion and H2/CO ratio over NiO–MgO
catalysts with various Ni contents after reduction pretreat-
ment at 1073 K. At all W/F conditions, methane conversion
was higher on the catalyst with larger Ni content. The dotted
line represents methane conversion due to methane
combustion under CH4/H2O/O2 = 2/1.5/1. At low W/F,
such as 0.13 g h/mol, methane conversion was as low as this
level, and the formation rates of hydrogen and H2/CO were
smaller. This is related to the oxidation of Ni at low W/F
conditions. In addition, the equilibrium level of methane
conversion was almost 100% and the H2/CO ratio in the
produced gas was approximately 3.
Fig. 5 shows W/F dependences of the methane
conversion and H2/CO ratio in oxidative steam reforming
of methane over 0.1% Pt/NiO–MgO and 0.1% Pt/MgO
catalysts. Results show that methane conversion over 0.1%
a
ol/g)
Pt/Ni0b Dredc
(%)
H2 add
(10�6 mol/g)
Ddispe
(%)
Particle sizef
(nm)
0 2.8 1.6 9.4 10.3
0 2.8 2.8 8.9 10.9
0 3.0 4.0 8.0 12.2
0 3.4 5.7 7.8 12.4
0.14 3.1 4.5 21.3 4.6
0.07 3.2 6.3 16.1 6.0
0.05 3.2 7.4 13.3 7.3
0.04 3.4 9.0 12.0 8.1
during the reduction at 1123 K in TPR profiles: Ni2+ + H2 ! Ni0 + 2H+,
uming that all Pt atoms were reduced.
M. Nurunnabi et al. / Applied Catalysis A: General 292 (2005) 272–280276
Fig. 4. Contact time dependence of methane conversion and H2/CO ratio in oxidative steam reforming of methane over NiO–MgO catalysts with various Ni
contents: (D) Ni0.2Mg0.8O; (&) Ni0.15Mg0.85O; (*) Ni0.1Mg0.9O; (^) Ni0.05Mg0.95O. Reaction conditions: catalyst weight: 0.03 g, CH4/H2O/O2 = 2/1.5/1,
reaction temperature: 1073 K, total pressure: 0.1 MPa, H2 reduction pretreatment: 1073 K for 0.5 h. The dotted line represents methane conversion due to
methane combustion.
Pt/MgO was far from the equilibrium level even at high W/F
(1.2 g h/mol). This indicates that 0.1% Pt/MgO had low
activity in oxidative steam reforming of methane. The
comparison at W/F = 1.2 g h/mol shows that the methane
conversion over 0.1% Pt/MgO was almost the same as that
over Ni0.05Mg0.95O (Fig. 4). However, the comparison at low
W/F shows that the conversion over 0.1% Pt/MgO was much
higher than that over Ni0.05Mg0.95O. In the oxidative
reforming of methane, methane conversion is dependent on
the amount of reduced catalyst and on its performance.
Under the presence of oxygen in the gas phase, metal species
can be oxidized and can lose the reforming activity. High
conversion over 0.1% Pt/MgO is related to high catalyst
reducibility. Pt catalysts usually exhibited much higher
reducibility than Ni catalysts [25]. In the case of
Ni0.05Mg0.95O, Ni species on the catalyst can be oxidized
gradually with decreasing W/F. On the other hand, it has
been reported that Pt catalysts exhibited high performance in
oxidative steam reforming of methane [3]. In these results,
the performance of 0.1% Pt/MgO was rather low; this can be
explained by the low loading of Pt (0.1 mass%). In contrast,
all the 0.1% Pt/NiO–MgO catalysts gave very high methane
Fig. 5. Contact time dependence of methane conversion and H2/CO ratio in oxidat
catalysts: (~) 0.1% Pt/Ni0.2Mg0.8O; (&) 0.1% Pt/Ni0.15Mg0.85O; (*) 0.1% P
conditions: catalyst weight: 0.03 g, CH4/H2O/O2 = 2/1.5/1, reaction temperature: 1
The dotted line represents methane conversion due to methane combustion.
conversion values, which reached the equilibrium level even
at W/F = 0.43 g h/mol. The promoting effect of Pt addition
to NiO–MgO solid solution with all the Ni contents was
clearly observed. It has been reported that the addition of Pt
to NiO–MgO solid solution catalysts promoted the
performance in dry reforming of methane [24]. The methane
conversion of 0.1% Pt/NiO–MgO was much higher than that
over NiO–MgO and 0.1% Pt/MgO. According to the TPR
profiles, the additive effect of 0.1 mass% Pt was not
observed clearly. On the other hand, the effect of Pt was
observed very clearly in oxidative steam reforming of
methane.
Fig. 6 represents the effect of Pt loading amount over Pt/
Ni0.2Mg0.8O catalysts in oxidative steam reforming of
methane. As shown in Fig. 5, methane conversion reached
almost the equilibrium level at higher W/F conditions.
Therefore, the results in Fig. 6 are based on the data at W/
F = 0.13 g h/mol. On the catalyst without Pt addition, which
corresponds to Ni0.2Mg0.8O, low methane conversion was
obtained; the value was almost the same level as the
contribution of methane combustion. On the other hand, by
the addition of a small amount of Pt such as 0.03 mass%,
ive steam reforming of methane over 0.1% Pt/NiO–MgO and 0.1% Pt/MgO
t/Ni0.1Mg0.9O; (^) 0.1% Pt/Ni0.05Mg0.95O; (�) 0.1% Pt/MgO. Reaction
073 K, total pressure: 0.1 MPa, H2 reduction pretreatment: 1073 K for 0.5 h.
M. Nurunnabi et al. / Applied Catalysis A: General 292 (2005) 272–280 277
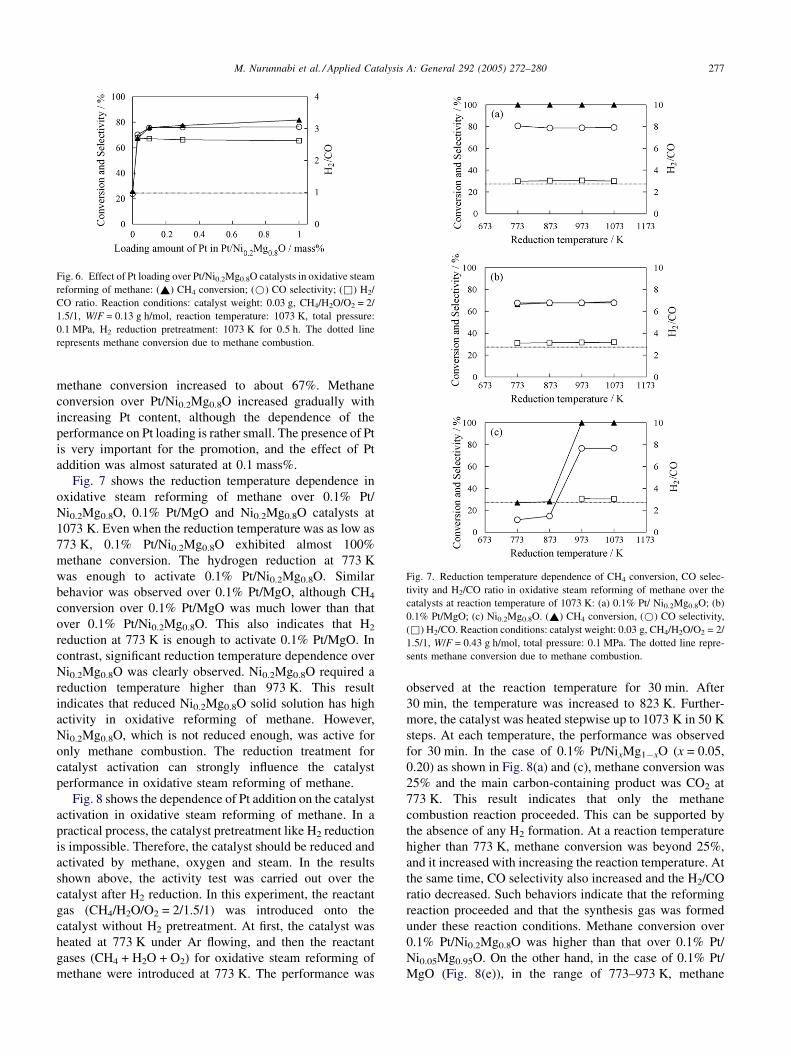
Fig. 7. Reduction temperature dependence of CH4 conversion, CO selec-
tivity and H2/CO ratio in oxidative steam reforming of methane over the
catalysts at reaction temperature of 1073 K: (a) 0.1% Pt/ Ni0.2Mg0.8O; (b)
0.1% Pt/MgO; (c) Ni0.2Mg0.8O. (~) CH4 conversion, (*) CO selectivity,
(&) H2/CO. Reaction conditions: catalyst weight: 0.03 g, CH4/H2O/O2 = 2/
1.5/1, W/F = 0.43 g h/mol, total pressure: 0.1 MPa. The dotted line repre-
sents methane conversion due to methane combustion.
Fig. 6. Effect of Pt loading over Pt/Ni0.2Mg0.8O catalysts in oxidative steam
reforming of methane: (~) CH4 conversion; (*) CO selectivity; (&) H2/
CO ratio. Reaction conditions: catalyst weight: 0.03 g, CH4/H2O/O2 = 2/
1.5/1, W/F = 0.13 g h/mol, reaction temperature: 1073 K, total pressure:
0.1 MPa, H2 reduction pretreatment: 1073 K for 0.5 h. The dotted line
represents methane conversion due to methane combustion.
methane conversion increased to about 67%. Methane
conversion over Pt/Ni0.2Mg0.8O increased gradually with
increasing Pt content, although the dependence of the
performance on Pt loading is rather small. The presence of Pt
is very important for the promotion, and the effect of Pt
addition was almost saturated at 0.1 mass%.
Fig. 7 shows the reduction temperature dependence in
oxidative steam reforming of methane over 0.1% Pt/
Ni0.2Mg0.8O, 0.1% Pt/MgO and Ni0.2Mg0.8O catalysts at
1073 K. Even when the reduction temperature was as low as
773 K, 0.1% Pt/Ni0.2Mg0.8O exhibited almost 100%
methane conversion. The hydrogen reduction at 773 K
was enough to activate 0.1% Pt/Ni0.2Mg0.8O. Similar
behavior was observed over 0.1% Pt/MgO, although CH4
conversion over 0.1% Pt/MgO was much lower than that
over 0.1% Pt/Ni0.2Mg0.8O. This also indicates that H2
reduction at 773 K is enough to activate 0.1% Pt/MgO. In
contrast, significant reduction temperature dependence over
Ni0.2Mg0.8O was clearly observed. Ni0.2Mg0.8O required a
reduction temperature higher than 973 K. This result
indicates that reduced Ni0.2Mg0.8O solid solution has high
activity in oxidative reforming of methane. However,
Ni0.2Mg0.8O, which is not reduced enough, was active for
only methane combustion. The reduction treatment for
catalyst activation can strongly influence the catalyst
performance in oxidative steam reforming of methane.
Fig. 8 shows the dependence of Pt addition on the catalyst
activation in oxidative steam reforming of methane. In a
practical process, the catalyst pretreatment like H2 reduction
is impossible. Therefore, the catalyst should be reduced and
activated by methane, oxygen and steam. In the results
shown above, the activity test was carried out over the
catalyst after H2 reduction. In this experiment, the reactant
gas (CH4/H2O/O2 = 2/1.5/1) was introduced onto the
catalyst without H2 pretreatment. At first, the catalyst was
heated at 773 K under Ar flowing, and then the reactant
gases (CH4 + H2O + O2) for oxidative steam reforming of
methane were introduced at 773 K. The performance was
observed at the reaction temperature for 30 min. After
30 min, the temperature was increased to 823 K. Further-
more, the catalyst was heated stepwise up to 1073 K in 50 K
steps. At each temperature, the performance was observed
for 30 min. In the case of 0.1% Pt/NixMg1�xO (x = 0.05,
0.20) as shown in Fig. 8(a) and (c), methane conversion was
25% and the main carbon-containing product was CO2 at
773 K. This result indicates that only the methane
combustion reaction proceeded. This can be supported by
the absence of any H2 formation. At a reaction temperature
higher than 773 K, methane conversion was beyond 25%,
and it increased with increasing the reaction temperature. At
the same time, CO selectivity also increased and the H2/CO
ratio decreased. Such behaviors indicate that the reforming
reaction proceeded and that the synthesis gas was formed
under these reaction conditions. Methane conversion over
0.1% Pt/Ni0.2Mg0.8O was higher than that over 0.1% Pt/
Ni0.05Mg0.95O. On the other hand, in the case of 0.1% Pt/
MgO (Fig. 8(e)), in the range of 773–973 K, methane
M. Nurunnabi et al. / Applied Catalysis A: General 292 (2005) 272–280278
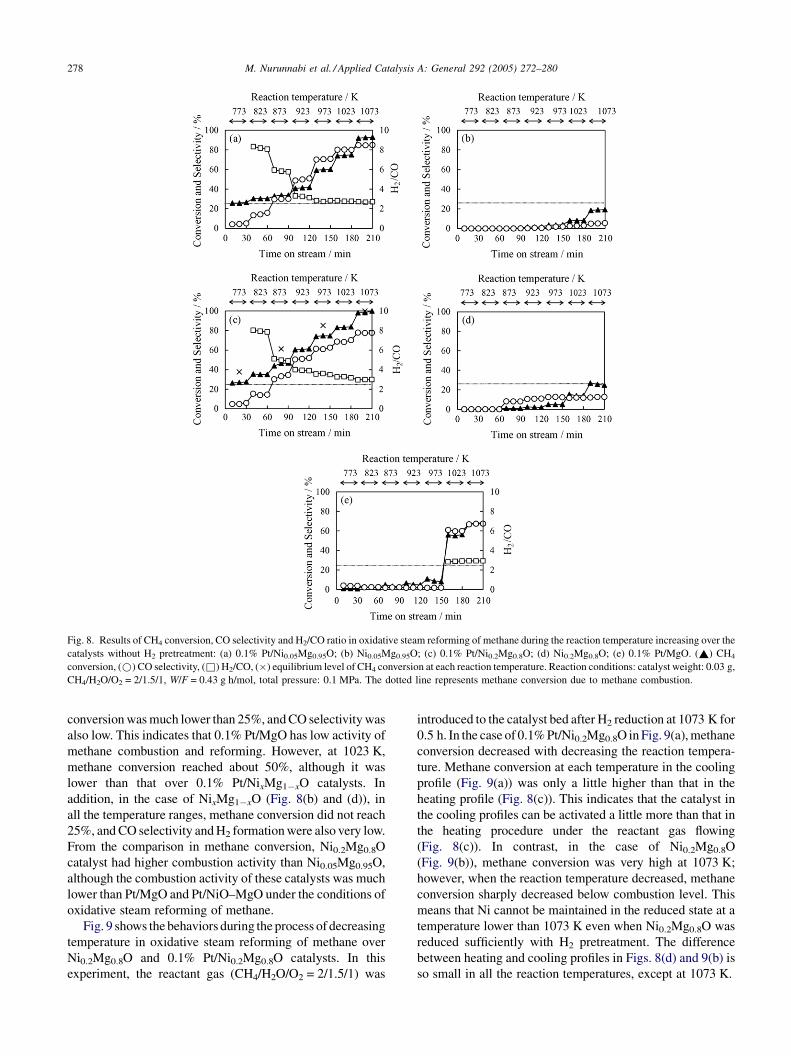
Fig. 8. Results of CH4 conversion, CO selectivity and H2/CO ratio in oxidative steam reforming of methane during the reaction temperature increasing over the
catalysts without H2 pretreatment: (a) 0.1% Pt/Ni0.05Mg0.95O; (b) Ni0.05Mg0.95O; (c) 0.1% Pt/Ni0.2Mg0.8O; (d) Ni0.2Mg0.8O; (e) 0.1% Pt/MgO. (~) CH4
conversion, (*) CO selectivity, (&) H2/CO, (�) equilibrium level of CH4 conversion at each reaction temperature. Reaction conditions: catalyst weight: 0.03 g,
CH4/H2O/O2 = 2/1.5/1, W/F = 0.43 g h/mol, total pressure: 0.1 MPa. The dotted line represents methane conversion due to methane combustion.
conversion was much lower than 25%, and CO selectivity was
also low. This indicates that 0.1% Pt/MgO has low activity of
methane combustion and reforming. However, at 1023 K,
methane conversion reached about 50%, although it was
lower than that over 0.1% Pt/NixMg1�xO catalysts. In
addition, in the case of NixMg1�xO (Fig. 8(b) and (d)), in
all the temperature ranges, methane conversion did not reach
25%, and CO selectivity and H2 formation were also very low.
From the comparison in methane conversion, Ni0.2Mg0.8O
catalyst had higher combustion activity than Ni0.05Mg0.95O,
although the combustion activity of these catalysts was much
lower than Pt/MgO and Pt/NiO–MgO under the conditions of
oxidative steam reforming of methane.
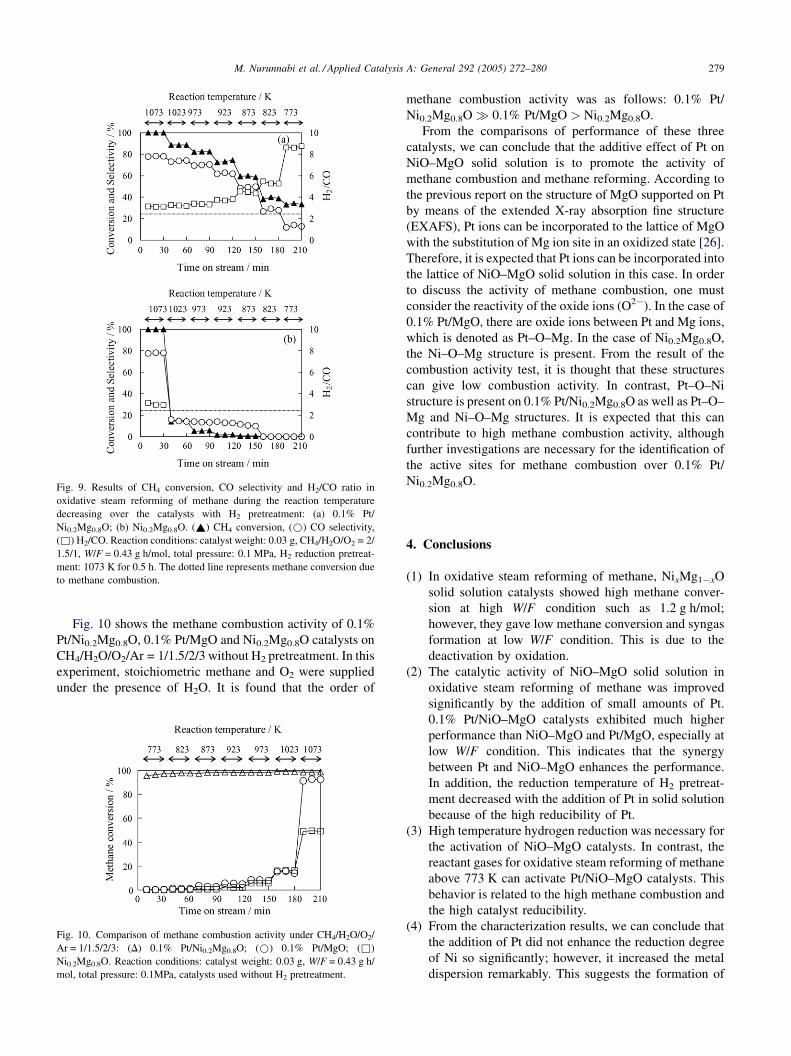
Fig. 9 shows the behaviors during the process of decreasing
temperature in oxidative steam reforming of methane over
Ni0.2Mg0.8O and 0.1% Pt/Ni0.2Mg0.8O catalysts. In this
experiment, the reactant gas (CH4/H2O/O2 = 2/1.5/1) was
introduced to the catalyst bed after H2 reduction at 1073 K for
0.5 h. In the case of 0.1% Pt/Ni0.2Mg0.8O in Fig. 9(a), methane
conversion decreased with decreasing the reaction tempera-
ture. Methane conversion at each temperature in the cooling
profile (Fig. 9(a)) was only a little higher than that in the
heating profile (Fig. 8(c)). This indicates that the catalyst in
the cooling profiles can be activated a little more than that in
the heating procedure under the reactant gas flowing
(Fig. 8(c)). In contrast, in the case of Ni0.2Mg0.8O
(Fig. 9(b)), methane conversion was very high at 1073 K;
however, when the reaction temperature decreased, methane
conversion sharply decreased below combustion level. This
means that Ni cannot be maintained in the reduced state at a
temperature lower than 1073 K even when Ni0.2Mg0.8O was
reduced sufficiently with H2 pretreatment. The difference
between heating and cooling profiles in Figs. 8(d) and 9(b) is
so small in all the reaction temperatures, except at 1073 K.
M. Nurunnabi et al. / Applied Catalysis A: General 292 (2005) 272–280 279
Fig. 9. Results of CH4 conversion, CO selectivity and H2/CO ratio in
oxidative steam reforming of methane during the reaction temperature
decreasing over the catalysts with H2 pretreatment: (a) 0.1% Pt/
Ni0.2Mg0.8O; (b) Ni0.2Mg0.8O. (~) CH4 conversion, (*) CO selectivity,
(&) H2/CO. Reaction conditions: catalyst weight: 0.03 g, CH4/H2O/O2 = 2/
1.5/1, W/F = 0.43 g h/mol, total pressure: 0.1 MPa, H2 reduction pretreat-
ment: 1073 K for 0.5 h. The dotted line represents methane conversion due
to methane combustion.
Fig. 10 shows the methane combustion activity of 0.1%
Pt/Ni0.2Mg0.8O, 0.1% Pt/MgO and Ni0.2Mg0.8O catalysts on
CH4/H2O/O2/Ar = 1/1.5/2/3 without H2 pretreatment. In this
experiment, stoichiometric methane and O2 were supplied
under the presence of H2O. It is found that the order of
Fig. 10. Comparison of methane combustion activity under CH4/H2O/O2/
Ar = 1/1.5/2/3: (D) 0.1% Pt/Ni0.2Mg0.8O; (*) 0.1% Pt/MgO; (&)
Ni0.2Mg0.8O. Reaction conditions: catalyst weight: 0.03 g, W/F = 0.43 g h/
mol, total pressure: 0.1MPa, catalysts used without H2 pretreatment.
methane combustion activity was as follows: 0.1% Pt/
Ni0.2Mg0.8O � 0.1% Pt/MgO > Ni0.2Mg0.8O.
From the comparisons of performance of these three
catalysts, we can conclude that the additive effect of Pt on
NiO–MgO solid solution is to promote the activity of
methane combustion and methane reforming. According to
the previous report on the structure of MgO supported on Pt
by means of the extended X-ray absorption fine structure
(EXAFS), Pt ions can be incorporated to the lattice of MgO
with the substitution of Mg ion site in an oxidized state [26].
Therefore, it is expected that Pt ions can be incorporated into
the lattice of NiO–MgO solid solution in this case. In order
to discuss the activity of methane combustion, one must
consider the reactivity of the oxide ions (O2�). In the case of
0.1% Pt/MgO, there are oxide ions between Pt and Mg ions,
which is denoted as Pt–O–Mg. In the case of Ni0.2Mg0.8O,
the Ni–O–Mg structure is present. From the result of the
combustion activity test, it is thought that these structures
can give low combustion activity. In contrast, Pt–O–Ni
structure is present on 0.1% Pt/Ni0.2Mg0.8O as well as Pt–O–
Mg and Ni–O–Mg structures. It is expected that this can
contribute to high methane combustion activity, although
further investigations are necessary for the identification of
the active sites for methane combustion over 0.1% Pt/
Ni0.2Mg0.8O.
4. Conclusions
(1) In oxidative steam reforming of methane, NixMg1�xO
solid solution catalysts showed high methane conver-
sion at high W/F condition such as 1.2 g h/mol;
however, they gave low methane conversion and syngas
formation at low W/F condition. This is due to the
deactivation by oxidation.
(2) T
he catalytic activity of NiO–MgO solid solution inoxidative steam reforming of methane was improved
significantly by the addition of small amounts of Pt.
0.1% Pt/NiO–MgO catalysts exhibited much higher
performance than NiO–MgO and Pt/MgO, especially at
low W/F condition. This indicates that the synergy
between Pt and NiO–MgO enhances the performance.
In addition, the reduction temperature of H2 pretreat-
ment decreased with the addition of Pt in solid solution
because of the high reducibility of Pt.
(3) H
igh temperature hydrogen reduction was necessary forthe activation of NiO–MgO catalysts. In contrast, the
reactant gases for oxidative steam reforming of methane
above 773 K can activate Pt/NiO–MgO catalysts. This
behavior is related to the high methane combustion and
the high catalyst reducibility.
(4) F
rom the characterization results, we can conclude thatthe addition of Pt did not enhance the reduction degree
of Ni so significantly; however, it increased the metal
dispersion remarkably. This suggests the formation of
M. Nurunnabi et al. / Applied Catalysis A: General 292 (2005) 272–280280
Pt–Ni alloy, which can contribute to the promoting
effect in oxidative steam reforming of methane.
References
[1] J.R. Rostrup-Nielsen, in: J.R. Anderson, M. Boudart (Eds.), Catalysis
Science and Technology, vol. 5, Springer-Verlag, New York, 1984, p.
1.
[2] J.R. Rostrup-Nielsen, Sekiyu Gakkaishi 40 (1997) 366.
[3] B. Li, K. Maruyama, M. Nurunnabi, K. Kunimori, K. Tomishige,
Appl. Catal. A: Gen. 275 (2004) 157.
[4] K. Tomishige, S. Kanazawa, S. Ito, K. Kunimori, Appl. Catal. A: Gen.
244 (2003) 71.
[5] K. Tomishige, Y. Matsuo, Y. Yoshinaga, Y. Sekine, M. Asadullah, K.
Fujimoto, Appl. Catal. A: Gen. 223 (2002) 225.
[6] K. Takehira, Catal. Surv. Jpn. 6 (2002) 19.
[7] S. Liu, G. Xiong, H. Dong, W. Yang, Appl. Catal. A: Gen. 202 (2000)
141.
[8] A.M. O’Connor, J.R.H. Ross, Catal. Today 46 (1998) 203.
[9] P.D.F. Vernon, M.L.H. Green, A.K. Cheetham, A.T. Ashcroft, Catal.
Today 13 (1992) 417.
[10] V.R. Choudhary, A.M. Rajput, B. Prabhakar, Catal. Lett. 32 (1995)
391.
[11] T. Inui, K. Saigo, Y. Fujii, K. Fujioka, Catal. Today 26 (1995) 295.
[12] V.R. Choudhary, A.M. Rajput, Ind. Eng. Chem. Res. 35 (1996)
3934.
[13] K. Tomishige, M. Nurunnabi, K. Maruyama, K. Kunimori, Fuel
Process. Technol. 85 (2004) 1103.
[14] K. Tomishige, S. Kanazawa, M. Sato, K. Ikushima, K. Kunimori,
Catal. Lett. 84 (2002) 69.
[15] O. Yamazaki, K. Tomishige, K. Fujimoto, Appl. Catal. A: Gen. 136
(1996) 49.
[16] K. Tomishige, Y.G. Chen, K. Fujimoto, J. Catal. 181 (1999) 91.
[17] Y.G. Chen, K. Tomishige, K. Yokoyama, K. Fujimoto, J. Catal. 184
(1999) 479.
[18] Y.H. Hu, E. Ruchenstein, Catal. Rev. Sci. Eng. 44 (2002) 423.
[19] K. Tomishige, Y. Himeno, Y. Matsuo, Y. Yoshinaga, K. Fujimoto, Ind.
Eng. Chem. Res. 39 (2000) 1891.
[20] K. Tomishige, Catal. Today 89 (2004) 405.
[21] K. Tomishige, S. Kanazawa, K. Suzuki, M. Asadullah, M. Sato, K.
Ikushima, K. Kunimori, Appl. Catal. A: Gen. 233 (2002) 35.
[22] L. Vegard, Z. Phys. 5 (1921) 17.
[23] J. Rynkowski, D. Rajski, I. Szyszka, J.R. Grzechowiak, Catal. Today
90 (2004) 159.
[24] Y.G. Chen, K. Tomishige, K. Yokoyama, K. Fujimoto, Appl. Catal. A:
Gen. 165 (1997) 335.
[25] T.B. Reed, Free Energy Formation of Binary Compounds, MIT Press,
Cambridge, MA, 1971, p. 67.
[26] K. Tomishige, Y. Nagasawa, U. Lee, Y. Iwasawa, Bull. Chem. Soc.
Jpn. 70 (1997) 1607.
[27] C.W. Bartholomew, R.B. Pannell, J.L. Butler, J. Catal. 65 (1980) 335.
Copyright © 2022 FDOKUMEN