Autothermal Reforming of Acetic Acid to Hydrogen and ...
21
catalysts Article Autothermal Reforming of Acetic Acid to Hydrogen and Syngas on Ni and Rh Catalysts Lifita N. Tande 1 , Erik Resendiz-Mora 1 , Valerie Dupont 1, * and Martyn V. Twigg 2 Citation: Tande, L.N.; Resendiz-Mora, E.; Dupont, V.; Twigg, M.V. Autothermal Reforming of Acetic Acid to Hydrogen and Syngas on Ni and Rh Catalysts. Catalysts 2021, 11, 1504. https://doi.org/10.3390/catal11121504 Academic Editors: Rei-Yu Chein and Wei-Hsin Chen Received: 28 October 2021 Accepted: 25 November 2021 Published: 10 December 2021 Publisher’s Note: MDPI stays neutral with regard to jurisdictional claims in published maps and institutional affil- iations. Copyright: © 2021 by the authors. Licensee MDPI, Basel, Switzerland. This article is an open access article distributed under the terms and conditions of the Creative Commons Attribution (CC BY) license (https:// creativecommons.org/licenses/by/ 4.0/). 1 School of Chemical and Process Engineering, University of Leeds, Leeds LS2 9JT, UK; [email protected] (L.N.T.); [email protected] (E.R.-M.) 2 Twigg Scientific and Technical Ltd., Cambridge CB25 9AU, UK; [email protected] * Correspondence: [email protected] Abstract: The autothermal reforming (ATR) of acetic acid (HAc) as a model bio-oil compound is examined via bench scale experiments and equilibrium modelling to produce hydrogen and syngas. This study compares the performance of nickel (Ni-Al, Ni-CaAl) vs. rhodium (Rh-Al) for particulate packed bed (PPB), and of Rh-Al in PPB vs. Rh with and without Ceria for honeycomb monolith (‘M’) catalysts (R-M and RC-M). All PPB and M catalysts used Al 2 O 3 as main support or washcoat, and when not pre-reduced, exhibited good performance with more than 90% of the HAc converted to C1- gases. The maximum H 2 yield (6.5 wt.% of feed HAc) was obtained with both the Rh-Al and Ni-CaAl catalysts used in PPB, compared to the equilibrium limit of 7.2 wt.%, although carbon deposition from Ni-CaAl at 13.9 mg g cat -1 h -1 was significantly larger than Rh-Al’s (5.5 mg g cat -1 h -1 ); close to maximum H 2 yields of 6.2 and 6.3 wt.% were obtained for R-M and RC-M respectively. The overall better performance of the Ni-CaAl catalyst over that of the Ni-Al was attributed to the added CaO reducing the acidity of the Al 2 O 3 support, which provided a superior resistance to persistent coke formation. Unlike Rh-Al, the R-M and RC-M exhibited low steam conversions to H 2 and CH 4 , evidencing little activity in water gas shift and methanation. However, the monolith catalysts showed no significant loss of activity, unlike Ni-Al. Both catalytic PPB (small reactor volumes) and monolith structures (ease of flow, strength, and stability) offer different advantages, thus Rh and Ni catalysts with new supports and structures combining these advantages for their suitability to the scale of local biomass resources could help the future sustainable use of biomasses and their bio-oils as storage friendly and energy dense sources of green hydrogen. Keywords: autothermal reforming; acetic acid; hydrogen; nickel; rhodium; monolith 1. Introduction Autothermal reforming (ATR) of biofuels presents the possibility of using more com- pact designs than steam reforming, thus incurring lower capital cost [1]. Mid-sized farms could process their own biofuels on-site before transporting the hydrogen produced to a centralised facility or sell directly to private consumers [2], or consume the bio-syngas as green fuel alternative to diesel in gensets at mini- and micro-grids. Amongst the different biofuels that can be used for hydrogen production, pyrolysis oils or bio-oils have attracted significant attention [3–5]. Due to their complex and varying chemical composition, any study involving the use of bio-oil depends to some degree on the pyrolysis method used to produce them and on the biomass feedstock. Unlike direct gasification whose only useful product is syngas and has a large single process heat requirement, converting first the raw biomass via fast pyrolysis has the advantage of producing an energy dense, volatile organic liquid more easily stored and transported, as well as being suitable for a range of catalytic post processing routes to value added products. By careful pyrolysis process controls, the pyrolysis-ATR reforming route should also avoid the heavy tars by-products that are so challenging in biomass gasifier operation, and reduce Catalysts 2021, 11, 1504. https://doi.org/10.3390/catal11121504 https://www.mdpi.com/journal/catalysts
-
Upload
khangminh22 -
Category
Documents
-
view
0 -
download
0
Transcript of Autothermal Reforming of Acetic Acid to Hydrogen and ...

catalysts
Article
Autothermal Reforming of Acetic Acid to Hydrogen and Syngason Ni and Rh Catalysts
Lifita N. Tande 1, Erik Resendiz-Mora 1, Valerie Dupont 1,* and Martyn V. Twigg 2
�����������������
Citation: Tande, L.N.;
Resendiz-Mora, E.; Dupont, V.;
Twigg, M.V. Autothermal Reforming
of Acetic Acid to Hydrogen and
Syngas on Ni and
Rh Catalysts. Catalysts 2021, 11, 1504.
https://doi.org/10.3390/catal11121504
Academic Editors: Rei-Yu Chein and
Wei-Hsin Chen
Received: 28 October 2021
Accepted: 25 November 2021
Published: 10 December 2021
Publisher’s Note: MDPI stays neutral
with regard to jurisdictional claims in
published maps and institutional affil-
iations.
Copyright: © 2021 by the authors.
Licensee MDPI, Basel, Switzerland.
This article is an open access article
distributed under the terms and
conditions of the Creative Commons
Attribution (CC BY) license (https://
creativecommons.org/licenses/by/
4.0/).
1 School of Chemical and Process Engineering, University of Leeds, Leeds LS2 9JT, UK;[email protected] (L.N.T.); [email protected] (E.R.-M.)
2 Twigg Scientific and Technical Ltd., Cambridge CB25 9AU, UK; [email protected]* Correspondence: [email protected]
Abstract: The autothermal reforming (ATR) of acetic acid (HAc) as a model bio-oil compound isexamined via bench scale experiments and equilibrium modelling to produce hydrogen and syngas.This study compares the performance of nickel (Ni-Al, Ni-CaAl) vs. rhodium (Rh-Al) for particulatepacked bed (PPB), and of Rh-Al in PPB vs. Rh with and without Ceria for honeycomb monolith (‘M’)catalysts (R-M and RC-M). All PPB and M catalysts used Al2O3 as main support or washcoat, andwhen not pre-reduced, exhibited good performance with more than 90% of the HAc converted to C1-gases. The maximum H2 yield (6.5 wt.% of feed HAc) was obtained with both the Rh-Al and Ni-CaAlcatalysts used in PPB, compared to the equilibrium limit of 7.2 wt.%, although carbon depositionfrom Ni-CaAl at 13.9 mg gcat
−1 h−1 was significantly larger than Rh-Al’s (5.5 mg gcat−1 h−1); close
to maximum H2 yields of 6.2 and 6.3 wt.% were obtained for R-M and RC-M respectively. Theoverall better performance of the Ni-CaAl catalyst over that of the Ni-Al was attributed to the addedCaO reducing the acidity of the Al2O3 support, which provided a superior resistance to persistentcoke formation. Unlike Rh-Al, the R-M and RC-M exhibited low steam conversions to H2 and CH4,evidencing little activity in water gas shift and methanation. However, the monolith catalysts showedno significant loss of activity, unlike Ni-Al. Both catalytic PPB (small reactor volumes) and monolithstructures (ease of flow, strength, and stability) offer different advantages, thus Rh and Ni catalystswith new supports and structures combining these advantages for their suitability to the scale of localbiomass resources could help the future sustainable use of biomasses and their bio-oils as storagefriendly and energy dense sources of green hydrogen.
Keywords: autothermal reforming; acetic acid; hydrogen; nickel; rhodium; monolith
1. Introduction
Autothermal reforming (ATR) of biofuels presents the possibility of using more com-pact designs than steam reforming, thus incurring lower capital cost [1]. Mid-sized farmscould process their own biofuels on-site before transporting the hydrogen produced to acentralised facility or sell directly to private consumers [2], or consume the bio-syngas asgreen fuel alternative to diesel in gensets at mini- and micro-grids.
Amongst the different biofuels that can be used for hydrogen production, pyrolysisoils or bio-oils have attracted significant attention [3–5]. Due to their complex and varyingchemical composition, any study involving the use of bio-oil depends to some degreeon the pyrolysis method used to produce them and on the biomass feedstock. Unlikedirect gasification whose only useful product is syngas and has a large single processheat requirement, converting first the raw biomass via fast pyrolysis has the advantage ofproducing an energy dense, volatile organic liquid more easily stored and transported, aswell as being suitable for a range of catalytic post processing routes to value added products.By careful pyrolysis process controls, the pyrolysis-ATR reforming route should also avoidthe heavy tars by-products that are so challenging in biomass gasifier operation, and reduce
Catalysts 2021, 11, 1504. https://doi.org/10.3390/catal11121504 https://www.mdpi.com/journal/catalysts
Catalysts 2021, 11, 1504 2 of 21
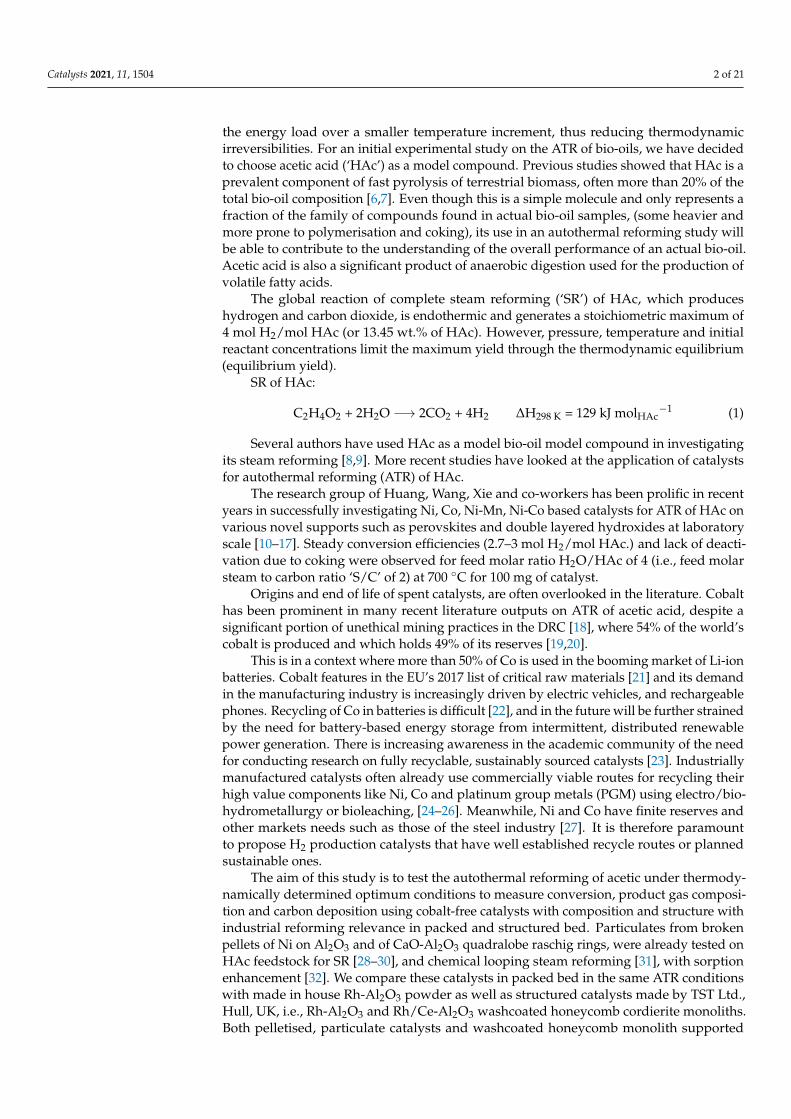
the energy load over a smaller temperature increment, thus reducing thermodynamicirreversibilities. For an initial experimental study on the ATR of bio-oils, we have decidedto choose acetic acid (‘HAc’) as a model compound. Previous studies showed that HAc is aprevalent component of fast pyrolysis of terrestrial biomass, often more than 20% of thetotal bio-oil composition [6,7]. Even though this is a simple molecule and only represents afraction of the family of compounds found in actual bio-oil samples, (some heavier andmore prone to polymerisation and coking), its use in an autothermal reforming study willbe able to contribute to the understanding of the overall performance of an actual bio-oil.Acetic acid is also a significant product of anaerobic digestion used for the production ofvolatile fatty acids.
The global reaction of complete steam reforming (‘SR’) of HAc, which produceshydrogen and carbon dioxide, is endothermic and generates a stoichiometric maximum of4 mol H2/mol HAc (or 13.45 wt.% of HAc). However, pressure, temperature and initialreactant concentrations limit the maximum yield through the thermodynamic equilibrium(equilibrium yield).
SR of HAc:
C2H4O2 + 2H2O −→ 2CO2 + 4H2 ∆H298 K = 129 kJ molHAc−1 (1)
Several authors have used HAc as a model bio-oil model compound in investigatingits steam reforming [8,9]. More recent studies have looked at the application of catalystsfor autothermal reforming (ATR) of HAc.
The research group of Huang, Wang, Xie and co-workers has been prolific in recentyears in successfully investigating Ni, Co, Ni-Mn, Ni-Co based catalysts for ATR of HAc onvarious novel supports such as perovskites and double layered hydroxides at laboratoryscale [10–17]. Steady conversion efficiencies (2.7–3 mol H2/mol HAc.) and lack of deacti-vation due to coking were observed for feed molar ratio H2O/HAc of 4 (i.e., feed molarsteam to carbon ratio ‘S/C’ of 2) at 700 ◦C for 100 mg of catalyst.
Origins and end of life of spent catalysts, are often overlooked in the literature. Cobalthas been prominent in many recent literature outputs on ATR of acetic acid, despite asignificant portion of unethical mining practices in the DRC [18], where 54% of the world’scobalt is produced and which holds 49% of its reserves [19,20].
This is in a context where more than 50% of Co is used in the booming market of Li-ionbatteries. Cobalt features in the EU’s 2017 list of critical raw materials [21] and its demandin the manufacturing industry is increasingly driven by electric vehicles, and rechargeablephones. Recycling of Co in batteries is difficult [22], and in the future will be further strainedby the need for battery-based energy storage from intermittent, distributed renewablepower generation. There is increasing awareness in the academic community of the needfor conducting research on fully recyclable, sustainably sourced catalysts [23]. Industriallymanufactured catalysts often already use commercially viable routes for recycling theirhigh value components like Ni, Co and platinum group metals (PGM) using electro/bio-hydrometallurgy or bioleaching, [24–26]. Meanwhile, Ni and Co have finite reserves andother markets needs such as those of the steel industry [27]. It is therefore paramountto propose H2 production catalysts that have well established recycle routes or plannedsustainable ones.
The aim of this study is to test the autothermal reforming of acetic under thermody-namically determined optimum conditions to measure conversion, product gas composi-tion and carbon deposition using cobalt-free catalysts with composition and structure withindustrial reforming relevance in packed and structured bed. Particulates from brokenpellets of Ni on Al2O3 and of CaO-Al2O3 quadralobe raschig rings, were already tested onHAc feedstock for SR [28–30], and chemical looping steam reforming [31], with sorptionenhancement [32]. We compare these catalysts in packed bed in the same ATR conditionswith made in house Rh-Al2O3 powder as well as structured catalysts made by TST Ltd.,Hull, UK, i.e., Rh-Al2O3 and Rh/Ce-Al2O3 washcoated honeycomb cordierite monoliths.Both pelletised, particulate catalysts and washcoated honeycomb monolith supported

Catalysts 2021, 11, 1504 3 of 21
catalysts are extensively produced and used in industry. Cost-effective recycling routeshave been practiced on such spent catalysts for many years, and more efficient methodscontinue to be investigated [33,34]. Monolith catalyst structures have many advantages [35]and have shown good performance in POX’s short contact time applications to biofuels [36],and power to gas applications [37]. The experiments in the present study were designed totest the activity of the catalysts and their suitability for autothermal hydrogen and syngasproduction by evaluating feed conversion, product distribution, H2 yield, sensitivity tosteam and feed flow, and resistance to coke formation.
2. Results and Discussion2.1. Equilibrium Modelling of ATR of HAc
To determine the reaction conditions needed for optimum hydrogen production,and assess process efficiencies of the experimental runs, equilibrium calculations wereperformed using the Aspen PlusTM software. An adiabatic Gibbs reactor (RGibbs) wasused with the amount of acetic acid, water and air flowing into the reactor adjusteddepending on the experiment of interest. The Peng-Robinson equation of state withBoston-Mathias modification (PR-BM) was selected as thermodynamic property methoddue to its applicability to high temperature gas-processing, chemical and petrochemicalprocesses [38,39]. Table 1 is an example of the flow values input to Aspen corresponding toa liquid acetic acid flow of 1.0 mL/h, S/C of 2 and equivalence ratio l of 1.
Table 1. Input values used for equilibrium analysis in Aspen flows used for all reactants.
Component Flow, mol/s Flow, mL/h (NTP)
Acetic acid, liq. 4.85 × 10⁻⁶ 1.000Water (S/C = 2), liq. 1.941 × 10⁻⁵ 1.261
O2 needed for COX *, STP 9.71 × 10⁻⁶ 840Air needed for COX *, STP 4.62 × 10⁻⁵ 3999.0
* COX is complete oxidation to CO2 and H2O, air is 79% N2/21%O2 (mol).
Figure 1 shows the equilibrium product gas distribution obtained for an HAc flowof 1 mL/h and feed steam to carbon molar ratio (S/C) of 2. The air flow was varied from0 (λ = 0) to a maximum value of 4.62 × 10⁻⁵ mol/s corresponding to λ = 1. Maximumequilibrium hydrogen production occurs at λ = 0.35 at 570 ◦C, with 100% conversion ofHAc and O2; this was used as the set point for experiments to determine the effect ofcatalyst on conversion, yield, selectivity and carbon formation. λ varies with S/C ratio(1 and 3).
Catalysts 2021, 11, x FOR PEER REVIEW 3 of 21
are extensively produced and used in industry. Cost-effective recycling routes have been practiced on such spent catalysts for many years, and more efficient methods continue to be investigated [33,34]. Monolith catalyst structures have many advantages [35] and have shown good performance in POX’s short contact time applications to biofuels [36], and power to gas applications [37]. The experiments in the present study were designed to test the activity of the catalysts and their suitability for autothermal hydrogen and syngas pro-duction by evaluating feed conversion, product distribution, H2 yield, sensitivity to steam and feed flow, and resistance to coke formation.
2. Results and Discussion 2.1. Equilibrium Modelling of ATR of HAc
To determine the reaction conditions needed for optimum hydrogen production, and assess process efficiencies of the experimental runs, equilibrium calculations were per-formed using the Aspen PlusTM software. An adiabatic Gibbs reactor (RGibbs) was used with the amount of acetic acid, water and air flowing into the reactor adjusted depending on the experiment of interest. The Peng-Robinson equation of state with Boston-Mathias modification (PR-BM) was selected as thermodynamic property method due to its ap-plicability to high temperature gas-processing, chemical and petrochemical processes [38,39].Table 1 is an example of the flow values input to Aspen corresponding to a liquid acetic acid flow of 1.0 mL/h, S/C of 2 and equivalence ratio l of 1.
Table 1. Input values used for equilibrium analysis in Aspen flows used for all reactants.
Component Flow, mol/s Flow, mL/h (NTP) Acetic acid, liq. 4.85 × 10⁻⁶ 1.000
Water (S/C = 2), liq. 1.941 × 10⁻⁵ 1.261 O2 needed for COX *,STP 9.71 × 10⁻⁶ 840 Air needed for COX *,STP 4.62 × 10⁻⁵ 3999.0
* COX is complete oxidation to CO2 and H2O, air is 79% N2/21%O2 (mol).
Figure 1 shows the equilibrium product gas distribution obtained for an HAc flow of 1 mL/h and feed steam to carbon molar ratio (S/C) of 2. The air flow was varied from 0 (λ = 0) to a maximum value of 4.62 × 10⁻⁵ mol/s corresponding to λ = 1. Maximum equilibrium hydrogen production occurs at λ = 0.35 at 570 °C, with 100% conversion of HAc and O2; this was used as the set point for experiments to determine the effect of catalyst on con-version, yield, selectivity and carbon formation. λ varies with S/C ratio (1 and 3).
Figure 1. Syngas equilibrium flow composition (mol s−1) and temperature (in °C) obtained at S/C = 2 while varying λ from 0 to 1 for ATR of HAc (feed rate 1 mL/h). HAc is fully converted, hence not shown.
Figure 1. Syngas equilibrium flow composition (mol s−1) and temperature (in ◦C) obtained atS/C = 2 while varying λ from 0 to 1 for ATR of HAc (feed rate 1 mL/h). HAc is fully converted,hence not shown.

Catalysts 2021, 11, 1504 4 of 21
2.2. Experiments with Ni- and Rh-Based Packed Bed Catalysts
Surface properties of the Ni- and Rh-based catalysts are listed in Table 2. The Ni-CaAlcatalyst has a slightly larger (moderate) surface area compared to the Ni-Al catalyst whosesurface area is very low due to its α-Al2O3 support. The higher surface area value for theNi-CaAl catalyst can be attributed to its CaO content which has an initial high surface areaof its own and could also be a result of the formation of mix phases during the supportsynthesis [40]. Upon reduction, the Ni-CaAl’s surface area is increased, unlike the Ni-Al,indicating the presence of CaO phase may have prevented sintering of the alumina.
Table 2. Morphological properties of Ni and Rh packed bed catalysts.
Catalyst BET (m2/g) BJH Surface Area (m2/g) Pore Size (nm) Pore Volume(cm3/g)
Ni-Al (fresh) 4.251 4.485 1.372 0.012Ni-Al (reduced) 3.756 4.125 1.255 0.011Ni-CaAl (fresh) 24.239 19.39 0.738 0.052
Ni-CaAl (reduced) 31.652 32.145 1.215 0.061Rh-Al (fresh) 228.8 245.4 6.001 0.4386
Rh-Al (reduced) 229.3 244.4 6.056 0.7930γ-Al2O3 303.9 322.6 6.175 1.051
The large specific surface area exhibited by the Rh-Al catalyst is due to its highγ-Al2O3 content. The 25 to 35% drop in surface area of the prepared catalysts comparedto the alumina support can be attributed mostly to attrition occurring during catalystpreparation. This might not have been the case if a different method such as incipientwetness was used. Specchia et al. [41] prepared a 1 wt.% Rh/Al2O3 catalyst by incipientwetness using 1 mm γ-Al2O3 spheres with surface area of 157 m2/g. Their preparedcatalyst showed minimal variation in properties with a surface area of 152 m2/g and porevolume of 0.45 cm3/g.
2.2.1. HAc Conversion on Ni and Rh Packed Bed Catalysts
The conversion of acetic acid, water and oxygen obtained using the Ni-Al, the Ni-CaAland Rh-Al catalysts in packed bed and a blank run performed with sand are compared toequilibrium in Figure 2.
Catalysts 2021, 11, x FOR PEER REVIEW 3 of 17
2.2. Experiments with Ni- and Rh-Based Packed Bed Catalysts Surface properties of the Ni- and Rh-based catalysts are listed in Table 2. The Ni-
CaAl catalyst has a slightly larger (moderate) surface area compared to the Ni-Al catalyst whose surface area is very low due to its α-Al2O3 support. The higher surface area value for the Ni-CaAl catalyst can be attributed to its CaO content which has an initial high surface area of its own and could also be a result of the formation of mix phases during the support synthesis [40]. Upon reduction, the Ni-CaAl’s surface area is increased, unlike the Ni-Al, indicating the presence of CaO phase may have prevented sintering of the alu-mina.
The large specific surface area exhibited by the Rh-Al catalyst is due to its high γ-Al2O3 content. The 25 to 35% drop in surface area of the prepared catalysts compared to the alumina support can be attributed mostly to attrition occurring during catalyst prep-aration. This might not have been the case if a different method such as incipient wetness was used. Specchia et al. [41] prepared a 1 wt.% Rh/Al2O3 catalyst by incipient wetness using 1 mm γ-Al2O3 spheres with surface area of 157 m2/g. Their prepared catalyst showed minimal variation in properties with a surface area of 152 m2/g and pore volume of 0.45 cm3/g.
Table 2. Morphological properties of Ni and Rh packed bed catalysts.
Catalyst BET (m2/g) BJH Surface Area (m2/g) Pore Size (nm) Pore Volume (cm3/g)
Ni-Al (fresh) 4.251 4.485 1.372 0.012 Ni-Al (reduced) 3.756 4.125 1.255 0.011 Ni-CaAl (fresh) 24.239 19.39 0.738 0.052
Ni-CaAl (reduced) 31.652 32.145 1.215 0.061 Rh-Al (fresh) 228.8 245.4 6.001 0.4386
Rh-Al (reduced) 229.3 244.4 6.056 0.7930 γ-Al2O3 303.9 322.6 6.175 1.051
2.2.1. HAc Conversion on Ni and Rh Packed Bed Catalysts The conversion of acetic acid, water and oxygen obtained using the Ni-Al, the Ni-
CaAl and Rh-Al catalysts in packed bed and a blank run performed with sand are com-pared to equilibrium in Figure 2.
Figure 2. Conversion in % of HAc (1 mL/h), water and oxygen using 1 g Ni-Al, 1 g Ni-CaAl, 0.2 g Rh-Al catalysts, 1 g sand (Blank experiment ‘Blk’), and equilibrium (Equ) at S/C 2, reactor exit gas temperature of 570 °C, λ = 0.353 and pressure of 1 bar.
-20
0
20
40
60
80
100
Ni-CaAl Ni-Al Rh-Al Blk Equ
Conv
ersio
n %
O2HAcH2O
Figure 2. Conversion in % of HAc (1 mL/h), water and oxygen using 1 g Ni-Al, 1 g Ni-CaAl, 0.2 gRh-Al catalysts, 1 g sand (Blank experiment ‘Blk’), and equilibrium (Equ) at S/C 2, reactor exit gastemperature of 570 ◦C, λ = 0.353 and pressure of 1 bar.
The figure contains average values obtained over two runs using 1.0 g of either Nicatalysts or sand, or 0.2 g of Rh catalyst with liquid HAc feed rate set at 1 mL/h, liquid

Catalysts 2021, 11, 1504 5 of 21
water flow at 1.257 mL/h (corresponding to a S/C of 2) and air flow set at 22 cm3/min STP(λ = 0.35). The product gas exits the catalyst bed at the pre-set ‘thermoneutral’ temperatureof 570 ◦C measured by the reactor bed thermocouple.
The oxygen conversion on the three catalysts reached 100% showing their suitabilityin promoting oxidation reactions despite the relatively low reaction temperature used(compared to conventional SR, which is usually carried out above 650 ◦C). The Ni-Alcatalyst however had a slightly lower HAc conversion of 91% compared to 93% obtained forthe Ni-CaAl catalyst, with the Rh-Al exhibiting the highest conversion (95.5%) despite themuch lower mass of catalyst and metal loading used. This incomplete acetic acid conversionis accompanied by low water conversion due to reduced SR or WGS catalytic activity. Theblank experiment (SiO2 sand) resulted in less than 5% of acetic acid decomposed to C1 gases(CO, CO2 and CH4) at 570 ◦C. The water conversion for the blank experiment was negativeindicating that water was possibly formed because of ketonization and combustion. It wasnot possible to detect acetone formation with the on-line micro-GC used for this study.However, total organic carbon analysis of condensates showed 78% liquid carbon recoveryfor the blank experiment. This indicates that more than 10% of the initial acetic acid isat least involved in either thermal decomposition or ketonization reactions. Basagiannisand Verykios [8] investigated the influence of temperature on the homogeneous reactionof acetic acid in the presence of steam. They reported the formation of acetone and CO2at temperatures greater than 500 ◦C with H2, CO and CH4 formed because of thermaldecomposition. The high acetic acid conversion obtained goes on to confirm selectivity ofNi-Al, Ni-CaAl and Rh-Al catalysts in promoting acetic acid ATR, with highest conversionobtained for Rh-Al. In terms of stability, the experiments involving Ni-Al catalyst werestopped after about 2 h due to carbon formation and resulting increased pressure dropin the reactor. Meanwhile, those performed with Ni-CaAl and Rh-Al catalysts lasted thefull number of hours originally selected for the experiments (4 h and 3 h respectively).It is noteworthy that the Rh-Al catalyst had the lowest water conversion over two runs(0.7%) of the three catalysts (2.8% and 2.2% for Ni-CaAl and Ni-Al respectively), comparedto the equilibrium value of 5.4%, indicating negligible activity in water gas shift in theRh-Al catalyst.
2.2.2. Product Distribution and H2 Yield, and Whether to Pre-Reduce or Not a Ni or RhCatalyst for ATR of HAc
The products distributions with time on stream obtained using Ni-Al, Ni-CaAl andRh-Al catalysts are shown in Supplementary data (Figure S1). The three catalysts weretested in reduced state and as-received (fresh). It is common practice when performingSR experiments to reduce Ni catalyst with H2 before their use. This is because it hasbeen established that the Ni metal (not the oxide) provides the active site for reformingreactions [42,43]. Rh/Al2O3 readily oxidises and reduces according to the nature of gasespresent (H2, CO, O2) at the temperatures used in the present study [44,45]. In its Rh0 state,it promotes mainly the NOx reduction [46] and CO oxidation [47] in three-way catalysts,which represents 80% of the Rh global demand [48]. The presence of oxygen in the reactorfeed could locally create a net oxidizing environment possibly leading to the oxidationof any previously reduced Ni or Rh on the catalyst surface. This raises the question ofwhether to reduce the catalyst before performing ATR experiments.
The only ATR product gases detected by the micro-GC were H2, CO, CH4 and CO2,thus confirming the high selectivity for equilibrium products of both catalysts by promotingreforming reactions (SR and POX) over thermal decomposition.
The average dry product gas composition and hydrogen yield obtained using Ni-Al,Ni-CaAl and Rh-Al in both fresh (F) and reduced (R) states are shown in Figure 3. Theaverage is taken over several stable results for each gas. Ni-CaAl catalyst appears to be amore active ATR catalyst with average H2 production reaching 94% and 90% of the expectedequilibrium value for the reduced (R) and fresh (F) catalyst respectively; compared to the86% obtained for the fresh and reduced Ni-Al catalyst. The almost similar results obtained

Catalysts 2021, 11, 1504 6 of 21
for the fresh and reduced forms of both catalysts confirms that the fresh catalyst is reducedby acetic acid, ‘auto-reduction’, at the start of the experiment to generate active Ni sites.
Catalysts 2021, 11, x FOR PEER REVIEW 6 of 21
more active ATR catalyst with average H2 production reaching 94% and 90% of the ex-pected equilibrium value for the reduced (R) and fresh (F) catalyst respectively; compared to the 86% obtained for the fresh and reduced Ni-Al catalyst. The almost similar results obtained for the fresh and reduced forms of both catalysts confirms that the fresh catalyst is reduced by acetic acid, ‘auto-reduction’, at the start of the experiment to generate active Ni sites.
Figure 3. Average nitrogen-free dry product gas composition obtained during ATR of acetic acid flowing at 1 mL/h using Ni-Al, Ni-CaAl and Rh-Al catalyst in fresh (F) and reduced (R) state. S/C = 2, λ = 0.353 (Air flow = 22 mL/min), 570 °C and 1 bar.
The ‘auto-reduction’ continues until an equilibrium Ni/NiO concentration is reached and steady production of synthesis gas is achieved. This equilibrium concentration of Ni and NiO is confirmed by the presence of both Ni and NiO peaks in the XRD patterns of a sample Ni-Al catalyst used in fresh, Ni-Al(F), and reduced, Ni-Al (R) states (see Figure S2a). The XRD results for Ni-CaAl catalyst are not included due to its large amor-phous phase content. For the Ni catalysts, the presence of oxygen in the feed does not cause significant oxidation of the reduced catalyst as no NiO is detected in the used Ni-Al(R) catalyst. This suggests that the oxygen in the feed is completely consumed by re-forming reactions and any NiO formed reacts almost immediately with H2 and CO to pro-duce Ni(S), H2O, and CO2.
The maximum H2 yield obtained for the results shown in Figure 4 was 6.8 wt.% for the Ni-CaAl catalyst, which is well short of SR of HAc stoichiometric maximum, but close to that of HAc decomposition to H2 and CO. Reference [49] reported a H2 yield of 13.1 wt.% for the steam reforming of acetic acid using a co-precipitated Ni/Al/Ca catalyst in a fluidized bed reactor operated at 650 °C and a S/C molar ratio of 5.58.
Figure 3. Average nitrogen-free dry product gas composition obtained during ATR of acetic acidflowing at 1 mL/h using Ni-Al, Ni-CaAl and Rh-Al catalyst in fresh (F) and reduced (R) state.S/C = 2, λ = 0.353 (Air flow = 22 mL/min), 570 ◦C and 1 bar.
The ‘auto-reduction’ continues until an equilibrium Ni/NiO concentration is reachedand steady production of synthesis gas is achieved. This equilibrium concentration of Niand NiO is confirmed by the presence of both Ni and NiO peaks in the XRD patterns of asample Ni-Al catalyst used in fresh, Ni-Al(F), and reduced, Ni-Al (R) states (see Figure S2a).The XRD results for Ni-CaAl catalyst are not included due to its large amorphous phasecontent. For the Ni catalysts, the presence of oxygen in the feed does not cause significantoxidation of the reduced catalyst as no NiO is detected in the used Ni-Al(R) catalyst.This suggests that the oxygen in the feed is completely consumed by reforming reactionsand any NiO formed reacts almost immediately with H2 and CO to produce Ni(S), H2O,and CO2.
The maximum H2 yield obtained for the results shown in Figure 4 was 6.8 wt.%for the Ni-CaAl catalyst, which is well short of SR of HAc stoichiometric maximum, butclose to that of HAc decomposition to H2 and CO. Reference [49] reported a H2 yield of13.1 wt.% for the steam reforming of acetic acid using a co-precipitated Ni/Al/Ca catalystin a fluidized bed reactor operated at 650 ◦C and a S/C molar ratio of 5.58.
The slightly better performance of the Ni-CaAl catalyst was expected, as the additionof CaO to the Al2O3 support hinders the formation of the spinel compound, NiAl2O4,which is known to impair the reducibility of NiO; while at the same time improving thesame property by forming CaAl2O4 [50,51]. Another reason for the better performance ofNi-CaAl catalyst over that of Ni-Al’s was its superior resistance to coke formation; with only13.9 and 11.6 mg/(g(cat).h) coke deposit detected compared to 25.7 and 54.0 mg/(g(cat).h)deposited for the Ni-Al catalyst in used fresh and reduced states respectively. It is note-worthy that the fresh, fully oxidised, as received Ni-Al catalyst experienced far less cokingcompared to the reduced form. This suggests that the ‘less’ active fresh (oxidised) versionsof both Ni catalysts had a better resistance to coke formation than the more active (reduced)catalyst, and this can be attributed to the presence of less active NiO sites on the surface ofthe used fresh catalyst.
XRD spectra of the Rh-Al are shown in Figure S2b, where the small, well dispersed Rhloading on the support (shown in Figure S2c) makes the Rh and oxidised Rh peaks (RhO2,Rh2O3) undistinguishable from the overwhelming presence of the γ-Al2O3 peaks. TheRh-Al catalyst exhibited the least coke deposits (5.5 mg/(g(cat).h) fresh, 2.5 mg/(g(cat).h)reduced) despite using the lower mass of catalyst (0.2 g vs. 1 g) for same HAc feed flow.Closure of the carbon balance varied slightly for this set of experiments, within a 5.9%

Catalysts 2021, 11, 1504 7 of 21
average discrepancy, with 2% minimum (Fresh Ni-Al) and 8% maximum (Fresh Rh-Al).Based on these observations, all further reforming experiments were performed using onlyunreduced ‘fresh’ catalysts.
Catalysts 2021, 11, x FOR PEER REVIEW 7 of 22
Figure 4. Average molar production rates (a) H2, (b) CO, (c) CO2 and (d) CH4 for the packed bed Ni and Rh catalysts compared to equilibrium. HAc flow, 1 mL/h with corresponding λ and temperature values of (0.340, 610 °C), (0.353, 570 °C) and (0.374, 545 °C) for S/C of 1, 2 and 3 respectively.
The slightly better performance of the Ni-CaAl catalyst was expected, as the addition of CaO to the Al2O3 support hinders the formation of the spinel compound, NiAl2O4, which is known to impair the reducibility of NiO; while at the same time improving the same property by forming CaAl2O4 [50,51]. Another reason for the better performance of Ni-CaAl catalyst over that of Ni-Al’s was its superior resistance to coke formation; with only 13.9 and 11.6 mg/(g(cat).h) coke deposit detected compared to 25.7 and 54.0 mg/(g(cat).h) deposited for the Ni-Al catalyst in used fresh and reduced states respec-tively. It is noteworthy that the fresh, fully oxidised, as received Ni-Al catalyst experi-enced far less coking compared to the reduced form. This suggests that the ‘less’ active fresh (oxidised) versions of both Ni catalysts had a better resistance to coke formation than the more active (reduced) catalyst, and this can be attributed to the presence of less active NiO sites on the surface of the used fresh catalyst.
XRD spectra of the Rh-Al are shown in Figure S2b, where the small, well dispersed Rh loading on the support (shown in Figure S2c) makes the Rh and oxidised Rh peaks (RhO2, Rh2O3) undistinguishable from the overwhelming presence of the γ-Al2O3 peaks. The Rh-Al catalyst exhibited the least coke deposits (5.5 mg/(g(cat).h) fresh, 2.5 mg/(g(cat).h) reduced) despite using the lower mass of catalyst (0.2 g vs. 1 g) for same HAc feed flow. Closure of the carbon balance varied slightly for this set of experiments, within a 5.9% average discrepancy, with 2% minimum (Fresh Ni-Al) and 8% maximum (Fresh Rh-Al). Based on these observations, all further reforming experiments were per-formed using only unreduced ‘fresh’ catalysts.
2.2.3. Oxidation Test (POX) The eventual success of an ideal ATR depends on the ability of the catalyst to promote
the exothermic oxidation reaction(s) needed to support the endothermic steam reforming
Figure 4. Average molar production rates (a) H2, (b) CO, (c) CO2 and (d) CH4 for the packed bed Niand Rh catalysts compared to equilibrium. HAc flow, 1 mL/h with corresponding λ and temperaturevalues of (0.340, 610 ◦C), (0.353, 570 ◦C) and (0.374, 545 ◦C) for S/C of 1, 2 and 3 respectively.
2.2.3. Oxidation Test (POX)
The eventual success of an ideal ATR depends on the ability of the catalyst to promotethe exothermic oxidation reaction(s) needed to support the endothermic steam reform-ing reaction. This ability was tested for the fresh Ni-Al, Ni-CaAl and Rh-Al catalysts byperforming POX-only experiments (no steam) while maintaining the same reactor tem-perature, acetic acid flow and air flow as discussed above. The dry N2-free molar flowproduct gas composition obtained with time on stream for the three catalysts after 3 his shown in Figure S3. A similar trend in product gas composition is seen for the threecatalysts. Table 3 provides a summary of the POX experiments. The Ni-Al catalyst had apoor acetic acid conversion to reforming gases of just 78% compared to 91% obtained forthe Ni-CaAl catalyst.
Table 3. HAc conversion, Products distribution, H2/CO and carbon deposition (CD) of the POX of HAcon fresh packed bed Ni and Rh catalysts. Acetic acid flow 1 mL/h, λ = 0.353 (Air flow = 22 mL/min),hot product gas at 570 ◦C. CD from ATR at S/C 2 shown for comparison.
Catalyst Conv, %HAc
Product Distribution, mol% CD, mg/(g(cat).h)ATRH2 CO CH4 CO2 H2/CO POX
Ni-Al 83.6 36.1 14.4 6.6 43.0 2.5 50.1 25.7Ni-CaAl 91.1 34.7 16.7 8.5 40.0 2.1 34.9 13.9
Rh-Al 88.5 32.0 15.9 8.8 43.3 2.0 28.3 5.5Equilibrium 86.3 38.0 18.5 4.2 39.3 2.1 0.0 0.0
The low HAc conversion for the Ni-Al resulted in significant coking measured at50.1 mg/g(cat).h compared to 34.9 for Ni-CaAl and 28.3 for Rh/Al, respectively. However,
Catalysts 2021, 11, 1504 8 of 21
the Ni-Al catalyst had a better H2 selectivity with higher H2/CO ratio of 2.50. This impliesthat the Ni-Al catalyst is more active in promoting the WGS reaction.
This catalyst is also more selective for the complete oxidation reaction as confirmed bythe slightly higher concentration in CO2. Meanwhile the Ni-CaAl catalyst is more active inpromoting SR reaction and so performs better under ATR condition resulting in its higherhydrogen yield. All the catalysts perform better in ATR compared to POX as evidencedby the reduced coking for the former (see Table 2). The presence of steam during ATRhelps to create a stronger oxidizing/reforming environment, which proves beneficial forthe three catalysts.
2.2.4. Feed Molar Steam to Carbon Ratio (S/C)
The influence of varying S/C on the ATR of acetic acid using fresh Ni-Al, Ni-CaAl andRh-Al catalysts was investigated and the production rates of H2, CO, CO2 and CH4 shownin Figure 4a–d including equilibrium values. Based on equilibrium, it is expected that asS/C increases from the stoichiometric value of 1 to excess of steam (2 and 3), the amount ofH2 and CO2 produced should increase towards the equilibrium limit while the amount ofCO reduces, as Le Chatelier’s principle alters the balance of water gas shift towards moreproduct. The trends obtained for H2, CO and CO2 were as expected between S/C of 1 and2 for the three catalysts. Between S/C of 2 and 3, which represent between doubling andtripling of stoichiometric steam, results indicate non equilibrium effects (H2 and CO2 ofNi-Al plateauing), insensitivity of water gas shift activity beyond S/C of 2 (Rh-Al), andactivity of methanation of CO and C in the Ni-CaAl and Rh-Al catalysts respectively assupported by the following section.
Increasing the S/C ratio from 1 to 3 apparently had no significant effect on thecrystalline phases present on the used catalyst Ni-Al (Figure S4). Ni is the principalNi-containing phase detected with only a minute NiO peak detected for the experimentcarried out at S/C = 2. This confirms the earlier conclusion that most of the NiO in thefresh catalyst is reduced to Ni during ATR.
However, it should be expected that if for some reason higher air flows (higher λ) areused, then the concentration of surface NiO phase in the used catalyst might increase asseen in the work published by Medrano et al. [49].
2.2.5. Space Velocity Effect on Carbon Products
The effect of varying the space velocity on the performance of the ATR of HAc processand in particular carbon products using fresh Ni and Rh catalysts in packed bed wasinvestigated. The space velocity (expressed as WHSV as well as GHSV) was investigatedby varying HAc flow while keeping all other parameters constant at 1 g (Ni) and 0.2 g (Rh)of catalyst, S/C = 2, λ = 0.353, 570 ◦C and 1 bar. WHSV was defined as the total mass offeed flowing into the reactor at 20 ◦C divided by the mass of catalyst used (Equation (7)).The GHSV was calculated by dividing the total volumetric flow rate of all feed entering thereactor by the volume of catalyst (Equation (8)). Volumetric flows for HAc, water and airwere determined by substituting the known molar flow rates into the ideal gas equationat NTP (20 ◦C and 1 atm). Figure S5 in Supplementary Data shows the influence of spacevelocity on H2 purity, H2 yield and conversion of acetic acid, water and oxygen. There arelittle differences between the three catalysts. The Ni-CaAl catalyst performed better than theNi-Al for all space velocities examined with a hydrogen yield average of 6.6 wt.% comparedto 5.7 wt.% for the latter. Both Ni catalysts have a similar and almost constant value forH2 purity, with Ni-CaAl having a higher acetic acid and water conversion. The lowerwater conversion for the Ni-Al catalyst is an indication of its affinity to promote acetic acidoxidation leading to lower H2 yield and slightly higher CO2. Counter-intuitively, HAc andwater conversions were largest for the Ni-CaAl and Rh-Al catalyst at their highest GHSV(>14,000 h−1), achieving a H2 yield 97% and 91% of the equilibrium values, respectively.
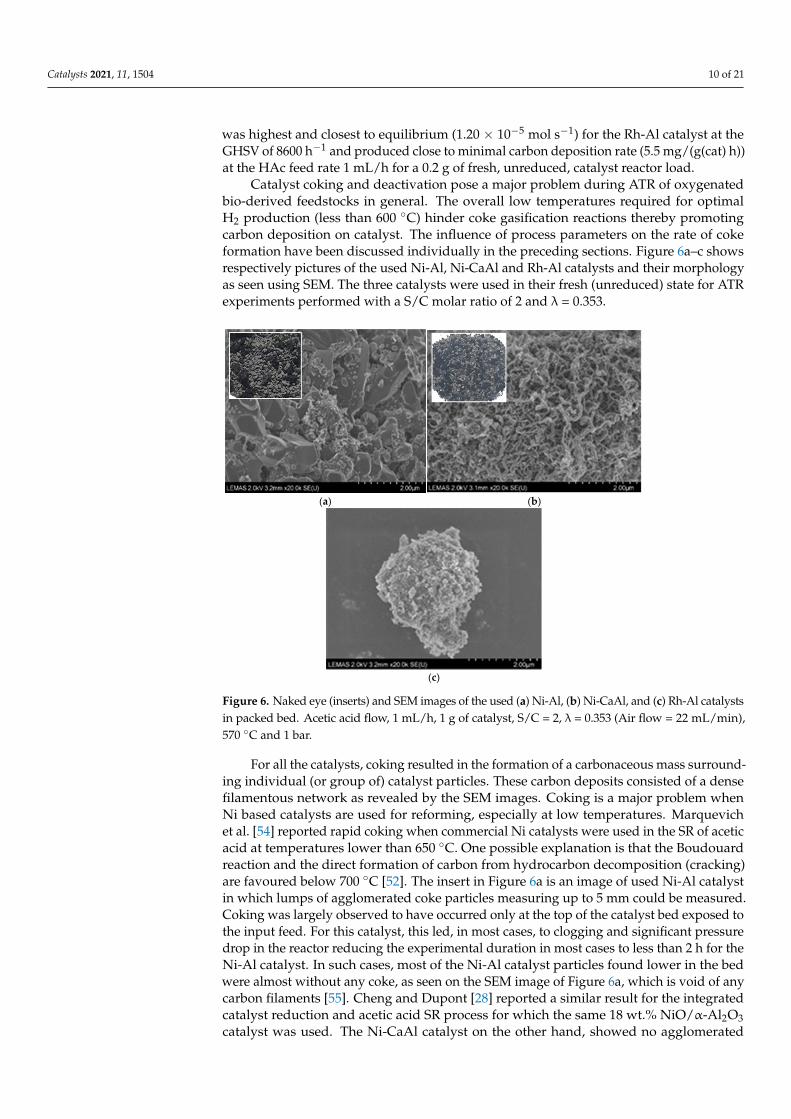
Figure 5 shows the increase in catalyst coking, expressed in mg/g(cat).h, as the spacevelocity is increased, along with the selectivity to C1 gas products for the three catalysts.

Catalysts 2021, 11, 1504 9 of 21
The latter exhibited very similar trends, with the Rh-Al catalyst displaying higher selectivityto CO, increasing with space velocity, eventually slightly exceeding the equilibrium value,due to possible kinetic limitations of water gas shift as there was a concurrent increase inHAc conversion. Methanation appeared also increasingly kinetically limited, as selectivityto methane decreased with space velocity for both Ni-CaAl and Rh-Al. No clear trend withGHSV was observed in the carbon in the condensates from the TOC analysis (not shown)which remained typically well below 1% of the carbon in the feed, with only outlier RhAl14,400 GHSV at 4%, also corresponding to the highest solid Carbon yield of the Rh-Al runs.The coking rate increased in tandem with HAc feed rate for both Ni catalysts. Of the twoNi catalysts, the Ni-CaAl showed better resistance to coke formation with only about athird of that obtained using the Ni-Al catalyst for the same space velocity.
Catalysts 2021, 11, x FOR PEER REVIEW 6 of 17
gas composition obtained with time on stream for the three catalysts after 3 h is shown in Figure S3. A similar trend in product gas composition is seen for the three catalysts. Table 3 provides a summary of the POX experiments. The Ni-Al catalyst had a poor acetic acid conversion to reforming gases of just 78% compared to 91% obtained for the Ni-CaAl cat-alyst.
by varying HAc flow while keeping all other parameters constant at 1 g (Ni) and 0.2 g (Rh) of catalyst, S/C = 2, λ = 0.353, 570 °C and 1 bar. WHSV was defined as the total mass of feed flowing into the reactor at 20 °C divided by the mass of catalyst used (Equation (7)). The GHSV was calculated by dividing the total volumetric flow rate of all feed enter-ing the reactor by the volume of catalyst (Equation (8)). Volumetric flows for HAc, water and air were determined by substituting the known molar flow rates into the ideal gas equation at NTP (20 °C and 1 atm). Figure S5 in Supplementary Data shows the influence of space velocity on H2 purity, H2 yield and conversion of acetic acid, water and oxygen. There are little differences between the three catalysts. The Ni-CaAl catalyst performed better than the Ni-Al for all space velocities examined with a hydrogen yield average of 6.6 wt.% compared to 5.7 wt.% for the latter. Both Ni catalysts have a similar and almost constant value for H2 purity, with Ni-CaAl having a higher acetic acid and water conver-sion. The lower water conversion for the Ni-Al catalyst is an indication of its affinity to promote acetic acid oxidation leading to lower H2 yield and slightly higher CO2. Counter-intuitively, HAc and water conversions were largest for the Ni-CaAl and Rh-Al catalyst at their highest GHSV (>14,000 h−1), achieving a H2 yield 97% and 91% of the equilibrium values, respectively.
Figure 5. Effect of increasing WHSV (and GHSV), on CO, CO2 and CH4 selectivity or dry gas com-position (%) and carbon formation (mg g(cat)−1h−1). All flows at S/C = 2 and λ = 0.353 correspond-ing to a reactor exit temperature of 570 °C. (a) Ni-Al (b) Ni-CaAl (c) Rh-Al.
High flows caused rapid formation of coke on the Ni-Al catalyst and the experiment had to be stopped after 30 min due to pressure increase in the reactor. Gutierrez et al. [52] reported a similar problem when Ni/Al2O3 catalyst was used for the ATR of ethanol. Both Ni-Al and Ni-CaAl catalysts however showed a steady decrease in the fraction of fuel
0.0
10.0
20.0
30.0
40.0
50.0
60.0
0102030405060708090
100
1.0 (1400) 2.0 (2600) 4.0 (4800) 8.0 (8600) EquilibriumCa
rbon
, mg/
g(ca
t).h
Sele
ctiv
ity, %
WHSV (GHSV), h-1
CO CO2 CH4 Carbon(a)
0.0
5.0
10.0
15.0
20.0
25.0
0
10
20
30
40
50
60
70
80
90
2.0 (2200) 4.0 (4800) 8.0 (8100) 16.0 (18800) Equilibrium
Carb
on, m
g/g(
cat).
h
Sele
ctiv
ity, %
WHSV (GHSV), h-1
CO CO2 CH4 Carbon(b)
0.0
2.0
4.0
6.0
8.0
10.0
12.0
14.0
0
10
20
30
40
50
60
70
80
90
10.0 (2900) 19.90 (8600) 39.8 (14400) 78.8 (27600) Equilibrium
Carb
on, m
g/g(
cat).
h
Sele
ctiv
ity, %
WHSV (GHSV), h-1
CO CO2 CH4 Carbon(c)
Figure 5. Effect of increasing WHSV (and GHSV), on CO, CO2 and CH4 selectivity or dry gascomposition (%) and carbon formation (mg g(cat)−1h−1). All flows at S/C = 2 and λ = 0.353corresponding to a reactor exit temperature of 570 ◦C. (a) Ni-Al (b) Ni-CaAl (c) Rh-Al.
High flows caused rapid formation of coke on the Ni-Al catalyst and the experimenthad to be stopped after 30 min due to pressure increase in the reactor. Gutierrez et al. [52]reported a similar problem when Ni/Al2O3 catalyst was used for the ATR of ethanol. BothNi-Al and Ni-CaAl catalysts however showed a steady decrease in the fraction of fuelcarbon deposit formed with increase in space velocity implying the possible existence ofmaximum or saturation value.
This could also imply that the Ni-CaAl catalyst performs better at higher feed flowwithin the range studied, as seen earlier. This can be due to the localised formation ofhotspots in the catalyst bed which promote coke gasification. Formation of hotpots canhowever have a negative effect on the catalyst stability as it might lead to sintering andcatalyst deactivation. Liguras et al. [53] obtained similar results for their work on theautothermal reforming (which they referred to as ‘catalytic partial oxidation’) of ethanolusing Ni/La2O3 supported over cordierite monoliths as catalyst. By comparison to the Nicatalysts, the Rh-Al catalyst exhibited much lower carbon deposition, with the expectedminimum found for the lowest WHSV (GHSV) values, roughly 1
4 of that found for Ni-CaAlat similar GHSV (ca. 8000 h−1). The syngas yield (H2 + CO + CH4) of 1.19 × 10⁻⁵ mol s−1
Catalysts 2021, 11, 1504 10 of 21
was highest and closest to equilibrium (1.20 × 10⁻⁵ mol s−1) for the Rh-Al catalyst at theGHSV of 8600 h−1 and produced close to minimal carbon deposition rate (5.5 mg/(g(cat) h))at the HAc feed rate 1 mL/h for a 0.2 g of fresh, unreduced, catalyst reactor load.
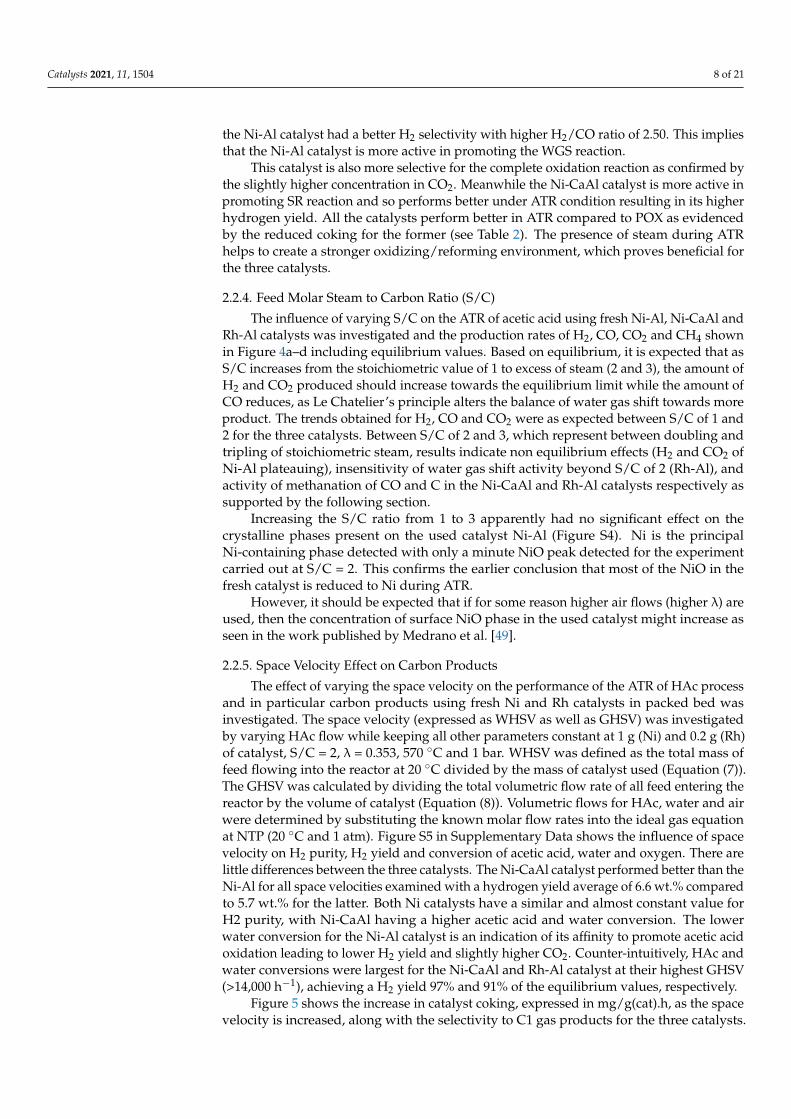
Catalyst coking and deactivation pose a major problem during ATR of oxygenatedbio-derived feedstocks in general. The overall low temperatures required for optimalH2 production (less than 600 ◦C) hinder coke gasification reactions thereby promotingcarbon deposition on catalyst. The influence of process parameters on the rate of cokeformation have been discussed individually in the preceding sections. Figure 6a–c showsrespectively pictures of the used Ni-Al, Ni-CaAl and Rh-Al catalysts and their morphologyas seen using SEM. The three catalysts were used in their fresh (unreduced) state for ATRexperiments performed with a S/C molar ratio of 2 and λ = 0.353.
Catalysts 2021, 11, x FOR PEER REVIEW 10 of 21
This could also imply that the Ni-CaAl catalyst performs better at higher feed flow within the range studied, as seen earlier. This can be due to the localised formation of hotspots in the catalyst bed which promote coke gasification. Formation of hotpots can however have a negative effect on the catalyst stability as it might lead to sintering and catalyst deactivation. Liguras et al. [53] obtained similar results for their work on the au-tothermal reforming (which they referred to as ‘catalytic partial oxidation’) of ethanol us-ing Ni/La2O3 supported over cordierite monoliths as catalyst. By comparison to the Ni catalysts, the Rh-Al catalyst exhibited much lower carbon deposition, with the expected minimum found for the lowest WHSV (GHSV) values, roughly ¼ of that found for Ni-CaAl at similar GHSV (ca. 8000 h−1). The syngas yield (H2 + CO + CH4) of 1.19 × 10⁻⁵ mol s−1 was highest and closest to equilibrium (1.20 × 10⁻⁵ mol s−1) for the Rh-Al catalyst at the GHSV of 8600 h−1 and produced close to minimal carbon deposition rate (5.5 mg/(g(cat) h)) at the HAc feed rate 1 mL/h for a 0.2 g of fresh, unreduced, catalyst reactor load.
Catalyst coking and deactivation pose a major problem during ATR of oxygenated bio-derived feedstocks in general. The overall low temperatures required for optimal H2 production (less than 600 °C) hinder coke gasification reactions thereby promoting carbon deposition on catalyst. The influence of process parameters on the rate of coke formation have been discussed individually in the preceding sections. Figure 6a–c shows respec-tively pictures of the used Ni-Al, Ni-CaAl and Rh-Al catalysts and their morphology as seen using SEM. The three catalysts were used in their fresh (unreduced) state for ATR experiments performed with a S/C molar ratio of 2 and λ = 0.353.
(a) (b)
(c)
Figure 6. Naked eye (inserts) and SEM images of the used (a) Ni-Al, (b) Ni-CaAl, and (c) Rh-Al catalysts in packed bed. Acetic acid flow, 1 mL/h, 1 g of catalyst, S/C = 2, λ = 0.353 (Air flow = 22 mL/min), 570 °C and 1 bar.
For all the catalysts, coking resulted in the formation of a carbonaceous mass sur-rounding individual (or group of) catalyst particles. These carbon deposits consisted of a
Figure 6. Naked eye (inserts) and SEM images of the used (a) Ni-Al, (b) Ni-CaAl, and (c) Rh-Al catalystsin packed bed. Acetic acid flow, 1 mL/h, 1 g of catalyst, S/C = 2, λ = 0.353 (Air flow = 22 mL/min),570 ◦C and 1 bar.
For all the catalysts, coking resulted in the formation of a carbonaceous mass surround-ing individual (or group of) catalyst particles. These carbon deposits consisted of a densefilamentous network as revealed by the SEM images. Coking is a major problem whenNi based catalysts are used for reforming, especially at low temperatures. Marquevichet al. [54] reported rapid coking when commercial Ni catalysts were used in the SR of aceticacid at temperatures lower than 650 ◦C. One possible explanation is that the Boudouardreaction and the direct formation of carbon from hydrocarbon decomposition (cracking)are favoured below 700 ◦C [52]. The insert in Figure 6a is an image of used Ni-Al catalystin which lumps of agglomerated coke particles measuring up to 5 mm could be measured.Coking was largely observed to have occurred only at the top of the catalyst bed exposed tothe input feed. For this catalyst, this led, in most cases, to clogging and significant pressuredrop in the reactor reducing the experimental duration in most cases to less than 2 h for theNi-Al catalyst. In such cases, most of the Ni-Al catalyst particles found lower in the bedwere almost without any coke, as seen on the SEM image of Figure 6a, which is void of anycarbon filaments [55]. Cheng and Dupont [28] reported a similar result for the integratedcatalyst reduction and acetic acid SR process for which the same 18 wt.% NiO/α-Al2O3catalyst was used. The Ni-CaAl catalyst on the other hand, showed no agglomerated

Catalysts 2021, 11, 1504 11 of 21
coking but an abundance of evenly distributed filamentous carbon deposits (multi wallcarbon nanotubes) in the catalyst bed (Figure 6b). The carbon deposits formed in mostcases were about the same size as the individual catalyst particles. The Rh-Al catalyst hadno agglomerated coking and a much lower level of filamentous carbon (Figure 6c). No bedclogging was witnessed when using the Ni-CaAl or Rh-Al catalysts for all experimentsperformed up to three hours.
2.3. Experiments with Rh-Based Monoliths2.3.1. HAc Conversion on Rh Monoliths
For experiments with the Rh monoliths, an acetic acid flow of 2 mL/h was selected,and all other flows determined based on the desired S/C molar ratio and λ. Three differentATR conditions were examined, and the flow settings are listed on Table 4.
Table 4. Flows for ATR using R-M and RC-M monoliths (HAc 2 mL/h).
ATR Condition Water, mL/h Air, mL/min S/C λ Temperature, ◦C
1 1.257 42.3 1 0.341 6132 2.514 43.3 2 0.353 5703 3.771 46.4 3 0.375 546
The conversion of acetic acid, water and oxygen and monolith temperature using bothR-M and RC-M monoliths for the three conditions listed in Table 4 are shown in Figure 7.Acetic acid conversion varied only slightly from 91 to 92% as the S/C ratio was increasedfrom 1 to 3 for the R-M monolith. The marginal increase in acetic acid conversion can beattributed to the slight increase in air flow as the ATR condition is varied from S/C of 1to 3. The RC-M monolith showed improved acetic acid conversion as the ATR conditionand corresponding S/C was varied from 1 to 3. This suggests that the ceria doped catalystis sensitive to the amount of steam present in the reacting mixture. The ability of thiscatalyst to facilitate acetic acid conversion reactions is enhanced by the presence of wateras a consequence of increased promotion of water consuming reactions (SR and WGS) andfuel decomposition.
Catalysts 2021, 11, x FOR PEER REVIEW 8 of 17
Rh-Al catalyst had no agglomerated coking and a much lower level of filamentous carbon (Figure 6c). No bed clogging was witnessed when using the Ni-CaAl or Rh-Al catalysts for all experiments performed up to three hours.
Figure 7. Temperature (in °C, right ordinate) and conversions of HAc, O2, and H2O (exp. and equil., left ordinate) using R-M and RC-M monoliths for ATR with water flow set at S/C molar ratio of 1, 2, 3 and pressure of 1 bar. S/C is given in parentheses below the catalyst name.
500
520
540
560
580
600
620
-20
0
20
40
60
80
100
R-M(1)
R-M(2)
R-M(3)
RC-M(1)
RC-M(2)
RC-M(3)
T (°
C)
Conv
ersio
n, %
O2 HAc H2O(Exp) H2O(Equil) T (C)
Figure 7. Temperature (in ◦C, right ordinate) and conversions of HAc, O2, and H2O (exp. and equil.,left ordinate) using R-M and RC-M monoliths for ATR with water flow set at S/C molar ratio of 1, 2,3 and pressure of 1 bar. S/C is given in parentheses below the catalyst name.
This was confirmed by the slightly better water conversion obtained for the RC-M monolith compared to R-M. The oxygen conversion on both catalysts reached 100%confirming the ability of Rh based catalyst to promote oxidation reactions [55].
Catalysts 2021, 11, 1504 12 of 21
2.3.2. Product Distribution and H2 Yield
The product distribution obtained using the R-M and RC-M monoliths are shown inFigure S6. Both monoliths show a similar product distribution over time with the R-Mmonolith displaying more stable results than RC-M. An initial induction time was requiredto stabilise active sites on the catalyst before the detection of syngas by the micro-GC. Thisinduction time was less than 5 min for the R-M monolith indicating that Rh2O3 was theactive form of the metal during ATR. This result is in agreement with that obtained byKaila et al. who showed that Rh2O3 was the active form of Rh in Zirconia supported RhPtbimetallic catalyst used for the ATR of simulated gasoline [55]. For both monoliths, H2 wasthe first gas component to spike followed almost immediately by a simultaneous increasein CO2 and CO concentration. This suggests that very little gaseous phase homogeneousdecomposition occurs, rather, acetic acid, O2 and H2O all adsorb on active sites on thecatalyst surface with the ensuing surface reactions leading ultimately to the desorptionof H2, CO2, CO and CH4. Only small concentrations of H2 and CO2 were detected at thebeginning of the experiment with the RC-M monolith (Figure S6b) with CO only appearingafter the spike in H2 production. The delayed detection of CO2 suggests that the acetic aciddecarboxylation is inhibited by adsorbed oxygen.
The selectivity to H2 and C1 product gases obtained during acetic acid ATR at S/Cof 2 is shown in Table 5, along with HAc and water conversions, syngas production rateand products ratios for the R-M and RC-M catalysts. Corresponding results for the packedbed catalysts experiments at 2 mL/h HAc feed, and same S/C and λ conditions are shownfor comparison of outputs between catalysts structures. Of the two structured catalysts,the RC-M monolith yielded HAc and H2O conversions and products distribution closestto equilibrium. The RC-M monolith also had a slightly higher hydrogen yield, and thiscan be attributed to a better water conversion reflected in its higher H2/CO and CO2/COratios. This monolith is slightly more active in promoting the WGS and methanationreactions. For both monoliths, the H2 yield is short of the equilibrium value due to a HAcconversion in the 93–94% range compared to the 100% equilibrium value. Methanationactivity can be attributed to the lower Rh loading of the powder catalyst compared to themonoliths as also found in [56,57]. The syngas production (represented by the sum ofmolar rates of H2, CO and CH4) shows that the Rh catalysts have very close outputs, of theorder of 89% of the equilibrium, regardless of the structure, and despite the monoliths’slower HAc conversions. The better acetic acid conversion obtained using the powder Rhcatalyst (100%) however resulted in the highest hydrogen yield out of the three Rh catalysts.Comparing the monoliths’s outputs with the Ni packed bed catalysts, it can be seen that theNi/CaAl and the RC-M offer very close HAc conversions with slightly different outcomes.The higher H2O conversion of the Ni/CaAl (2% vs. 0.5%) provides a small advantage onH2 yield (6.6 vs. 6.3 wt.%) despite a higher selectivity to CH4 (4.2 vs. 2.4%) over the RC-M’scounterparts. The results obtained using the Ni catalyst showed quite different selectivityto the Rh monoliths suggesting the involvement of different reaction mechanisms. The Nibased catalysts had lower CO and higher CH4 selectivity, indicating higher activities inboth WGS and methanation.
It is worthy of note that despite the different nature and loading of active elements,support chemical composition, and physical structure of the catalysts, the range of outputsobtained in the experiments at S/C of 2, λ of 0.353 and HAc feed rate of 2 mL/h wereremarkably similar and very promising. The results suggest that ultimately, rather thanbeing based on superior catalytic activity, the selection of a suitable catalyst for ATR of HAc,will likely depend on cost versus longevity, mechanical integrity, ease of regeneration andrecycling, sustainability of the materials and manufacture, scale of the process. For instance,the honeycomb monolith structure might offer advantages of durability (strength), lowerhealth impacts (less fines) and lower operating costs (lower pressure drops) but would notbe best suited for large throughput plants due to their much larger volume compared topacked beds. Research into more performant catalysts structures in the above selectioncriteria categories would be worthwhile.

Catalysts 2021, 11, 1504 13 of 21
Table 5. Products selectivity and hydrogen yield obtained for ATR of acetic acid flowing at 2 mL/h,S/C = 2, λ = 0.353 (Air flow = 43.3 mL/min), hot product gas at 570 ◦C and 1 bar.
Conversion % Selectivity % Syngas mol/sH2 + CO + CH4
H2 Yieldwt.%
Products Ratio
HAc H2O H2 CO CO2 CH4 H2/CO CO2/CO
Equil 100.0 5.4 98.2 14.6 83.4 2.0 2.40 × 10⁻⁵ 7.2 7.3 5.7R-M 92.6 −0.4 98.8 16.3 82.5 1.2 2.13 × 10⁻⁵ 6.2 6.1 5.1
RC-M 93.7 0.5 97.5 14.2 83.4 2.4 2.12 × 10⁻⁵ 6.3 6.7 5.9Rh/Al 100.0 3.4 95.2 16.7 78.8 4.5 2.14 × 10⁻⁵ 6.5 5.3 4.7Ni/Al 90.5 2.2 96.3 9.1 87.2 3.7 2.01 × 10⁻⁵ 6.0 10.7 9.6Ni/CaAl 94.0 2.0 95.9 11.9 84.0 4.2 2.16 × 10⁻⁵ 6.6 8.1 7.1
2.3.3. Effect of the Feed Steam to Carbon Ratio
The influence of S/C molar ratio on the ATR of acetic acid using R-M and RC-Mhoneycomb monoliths was investigated and the results shown in Figure 8. At a given S/C,no significant differences of H2 yield were obtained between the two catalysts formulations.As S/C increases from 1 to 3, the increase in CO2 and corresponding decrease in COproduction indicates an increase in WGS activity as with the case with all other catalystspresented so far in this work. Increasing the S/C molar ratio up to 3 did not have a‘quenching’ effect mainly because the reacting system was supported by external heating.
Catalysts 2021, 11, x FOR PEER REVIEW 9 of 17
Figure 8. Product distribution and H2 yield obtained during ATR of HAc flowing at 2 mL/h, S/C shown in brackets = 1,2,3, and equivalence ratio λ = 0.353 (Air flow = 43.3 mL/min), hot product gas at 570 °C and 1 bar.
2.3.4. Effect of the Space Velocity The influence of doubling the GHSV on feed HAc and water conversions and selec-
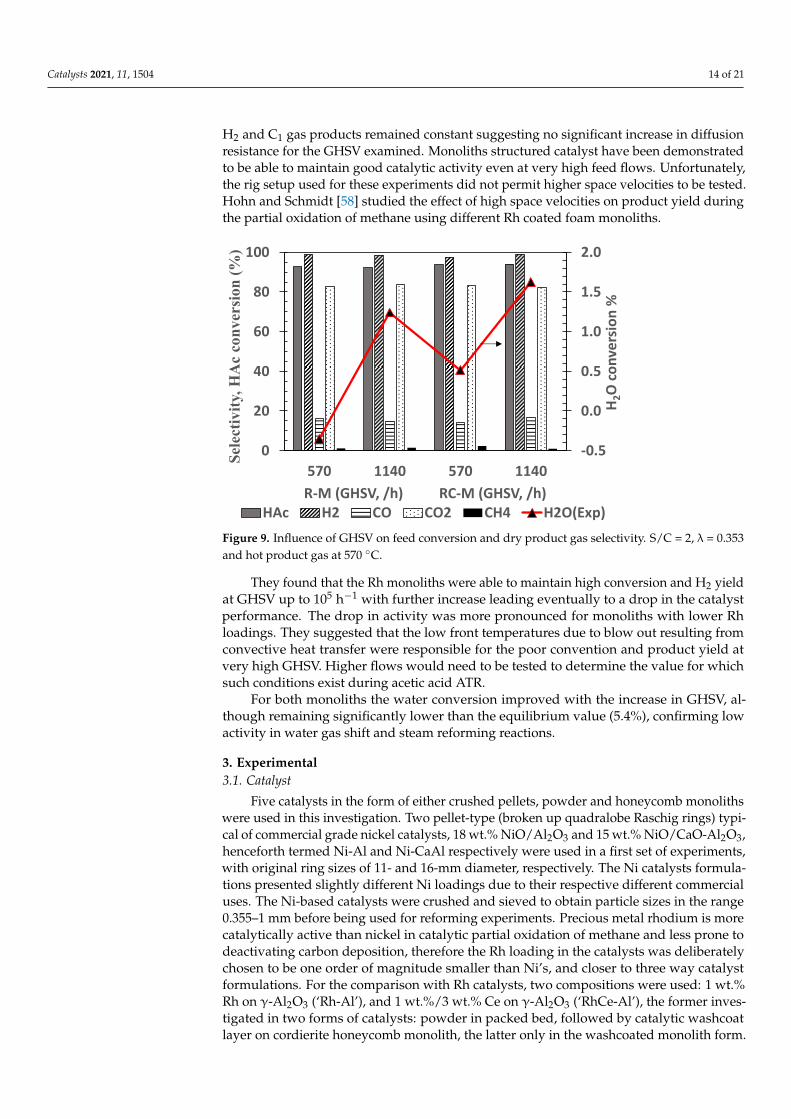
tivity to gas products was investigated and the results for the R-M and RC-M monoliths are shown in Figure 9. There was no substantial change in the acetic acid conversion and dry gas composition as the GHSV was increased from 5.7 ×10² to 1.14 ×10³ h−1. Selectivity to H2 and C1 gas products remained constant suggesting no significant increase in diffu-sion resistance for the GHSV examined. Monoliths structured catalyst have been demon-strated to be able to maintain good catalytic activity even at very high feed flows. Unfor-tunately, the rig setup used for these experiments did not permit higher space velocities to be tested. Hohn and Schmidt [58] studied the effect of high space velocities on product yield during the partial oxidation of methane using different Rh coated foam monoliths.
0.00.10.20.30.40.50.60.70.80.91.01.11.2
0.0
10.0
20.0
30.0
40.0
50.0
60.0
R-M (1) R-M (2) R-M (3) RC-M (1) RC-M (2) RC-M (3)H 2
yiel
d, m
ol/m
ol C
Prod
uct d
istrib
utio
n, %
H2 CO CO2 CH4 H2 yield (Exp) H2 yield (Equil)
Figure 8. Product distribution and H2 yield obtained during ATR of HAc flowing at 2 mL/h, S/Cshown in brackets = 1,2,3, and equivalence ratio λ = 0.353 (Air flow = 43.3 mL/min), hot product gasat 570 ◦C and 1 bar.
This might not be the case in an actual ATR process, making it necessary to operateat the lower S/C ratio of 1 and 2. Rennard et al. [36] reported a decrease in WGS activityand hydrogen production during ATR of glycerol using Rh-Ce foam as the S/C ratio wasincreased above 1. From the balanced SR reaction, it is evident that only 2 moles of waterare required per mole of acetic acid (S/C = 1) for a stoichiometric reaction with maximumH2 yield. For both monoliths, a choice of S/C = 2 might prove to be a good compromiseleading to good process outputs and energy savings.
2.3.4. Effect of the Space Velocity
The influence of doubling the GHSV on feed HAc and water conversions and selectiv-ity to gas products was investigated and the results for the R-M and RC-M monoliths areshown in Figure 9. There was no substantial change in the acetic acid conversion and drygas composition as the GHSV was increased from 5.7 × 10² to 1.14 × 10³ h−1. Selectivity to
Catalysts 2021, 11, 1504 14 of 21
H2 and C1 gas products remained constant suggesting no significant increase in diffusionresistance for the GHSV examined. Monoliths structured catalyst have been demonstratedto be able to maintain good catalytic activity even at very high feed flows. Unfortunately,the rig setup used for these experiments did not permit higher space velocities to be tested.Hohn and Schmidt [58] studied the effect of high space velocities on product yield duringthe partial oxidation of methane using different Rh coated foam monoliths.
Catalysts 2021, 11, x FOR PEER REVIEW 10 of 17
Figure 9. Influence of GHSV on feed conversion and dry product gas selectivity. S/C = 2, λ = 0.353 and hot product gas at 570 °C.
They found that the Rh monoliths were able to maintain high conversion and H2 yield at GHSV up to 105 h−1 with further increase leading eventually to a drop in the catalyst performance. The drop in activity was more pronounced for monoliths with lower Rh loadings. They suggested that the low front temperatures due to blow out resulting from convective heat transfer were responsible for the poor convention and product yield at very high GHSV. Higher flows would need to be tested to determine the value for which such conditions exist during acetic acid ATR.
For both monoliths the water conversion improved with the increase in GHSV, alt-hough remaining significantly lower than the equilibrium value (5.4%), confirming low activity in water gas shift and steam reforming reactions.
3. Experimental 3.1. Catalyst
Five catalysts in the form of either crushed pellets, powder and honeycomb mono-liths were used in this investigation. Two pellet-type (broken up quadralobe Raschig rings) typical of commercial grade nickel catalysts, 18 wt.% NiO/Al2O3 and 15 wt.% NiO/CaO-Al2O3, henceforth termed Ni-Al and Ni-CaAl respectively were used in a first set of experiments, with original ring sizes of 11- and 16-mm diameter, respectively. The Ni catalysts formulations presented slightly different Ni loadings due to their respective different commercial uses. The Ni-based catalysts were crushed and sieved to obtain par-ticle sizes in the range 0.355–1 mm before being used for reforming experiments. Precious metal rhodium is more catalytically active than nickel in catalytic partial oxidation of me-thane and less prone to deactivating carbon deposition, therefore the Rh loading in the catalysts was deliberately chosen to be one order of magnitude smaller than Ni’s, and closer to three way catalyst formulations. For the comparison with Rh catalysts, two com-positions were used: 1 wt.% Rh on γ-Al2O3 (‘Rh-Al’), and 1 wt.%/3 wt.% Ce on γ-Al2O3 (‘RhCe-Al’), the former investigated in two forms of catalysts: powder in packed bed, fol-lowed by catalytic washcoat layer on cordierite honeycomb monolith, the latter only in the washcoated monolith form. The synthesis method for the Rh powder catalyst is de-scribed in [59]. For the structured monolith catalysts, two single blocks 19 mm outer di-ameter (o.d.) cordierite monolith washcoated with Rh-Al (hereafter termed R-M) and with
-0.5
0.0
0.5
1.0
1.5
2.0
0
20
40
60
80
100
570 1140 570 1140
H 2O
conv
ersio
n %
Sele
ctiv
ity, H
Ac
conv
ersio
n (%
)
R-M (GHSV, /h) RC-M (GHSV, /h)HAc H2 CO CO2 CH4 H2O(Exp)
Figure 9. Influence of GHSV on feed conversion and dry product gas selectivity. S/C = 2, λ = 0.353and hot product gas at 570 ◦C.
They found that the Rh monoliths were able to maintain high conversion and H2 yieldat GHSV up to 105 h−1 with further increase leading eventually to a drop in the catalystperformance. The drop in activity was more pronounced for monoliths with lower Rhloadings. They suggested that the low front temperatures due to blow out resulting fromconvective heat transfer were responsible for the poor convention and product yield atvery high GHSV. Higher flows would need to be tested to determine the value for whichsuch conditions exist during acetic acid ATR.
For both monoliths the water conversion improved with the increase in GHSV, al-though remaining significantly lower than the equilibrium value (5.4%), confirming lowactivity in water gas shift and steam reforming reactions.
3. Experimental3.1. Catalyst
Five catalysts in the form of either crushed pellets, powder and honeycomb monolithswere used in this investigation. Two pellet-type (broken up quadralobe Raschig rings) typi-cal of commercial grade nickel catalysts, 18 wt.% NiO/Al2O3 and 15 wt.% NiO/CaO-Al2O3,henceforth termed Ni-Al and Ni-CaAl respectively were used in a first set of experiments,with original ring sizes of 11- and 16-mm diameter, respectively. The Ni catalysts formula-tions presented slightly different Ni loadings due to their respective different commercialuses. The Ni-based catalysts were crushed and sieved to obtain particle sizes in the range0.355–1 mm before being used for reforming experiments. Precious metal rhodium is morecatalytically active than nickel in catalytic partial oxidation of methane and less prone todeactivating carbon deposition, therefore the Rh loading in the catalysts was deliberatelychosen to be one order of magnitude smaller than Ni’s, and closer to three way catalystformulations. For the comparison with Rh catalysts, two compositions were used: 1 wt.%Rh on γ-Al2O3 (‘Rh-Al’), and 1 wt.%/3 wt.% Ce on γ-Al2O3 (‘RhCe-Al’), the former inves-tigated in two forms of catalysts: powder in packed bed, followed by catalytic washcoatlayer on cordierite honeycomb monolith, the latter only in the washcoated monolith form.

Catalysts 2021, 11, 1504 15 of 21
The synthesis method for the Rh powder catalyst is described in [59]. For the structuredmonolith catalysts, two single blocks 19 mm outer diameter (o.d.) cordierite monolithwashcoated with Rh-Al (hereafter termed R-M) and with RhCe-Al (henceforth termedRC-M), provided by Twigg Scientific & Technical Ltd. (Cambridge, UK), were used in thesecond set of experiments. The monoliths presented a density of 400 cpsi (cells per squareinch), i.e., 62 cells/cm2 equivalent to 1.21 mm sides. The monoliths length was 42 mm witha 15 mm diameter, offering ca. 110 square channels to the flow. Typical wall and washcoatthicknesses are in the range 70–100 µm. The mass of Rh in both monoliths was estimatedto be 4.3 mg, roughly twice that of the 2 mg used in the powder Rh catalyst.
3.2. Catalyst Characterisation
A Quantachrome Nova 2200e nitrogen gas adsorption/desorption isotherm was usedto determine the surface area, the pore volume, and the pore size distribution of fresh andused catalysts. A Brucker D8 Advance diffractometer was used for the XRD analysis of thecrystalline phase of prepared and used Nickel catalysts. The morphology of prepared andused Ni catalysts were examined using a Hitachi SU8230 high performance cold field emis-sion scanning electron microscopy (CFE-SEM). The amount of carbon deposited on used Niand Rh catalysts was determined using a Thermo Scientific Flash 2000 Elemental Analyzer.
3.3. Reactor Setup
The schematic of the fixed bed reactor (experimental rig) used for ATR experiments(packed Ni catalyst pellets or Rh catalyst particles) is shown in Figure 10. The rig consistsof a down flow 316 stainless steel tube reactor with 10 mm internal diameter placed insidean electric tube furnace (Elite Thermal Systems TSV10/20/85) to provide external heating.
Catalysts 2021, 11, x FOR PEER REVIEW 11 of 17
RhCe-Al (henceforth termed RC-M), provided by Twigg Scientific & Technical Ltd. (Cam-bridge, UK), were used in the second set of experiments. The monoliths presented a den-sity of 400 cpsi (cells per square inch), i.e., 62 cells/cm2 equivalent to 1.21 mm sides. The monoliths length was 42 mm with a 15 mm diameter, offering ca. 110 square channels to the flow. Typical wall and washcoat thicknesses are in the range 70–100 μm. The mass of Rh in both monoliths was estimated to be 4.3 mg, roughly twice that of the 2 mg used in the powder Rh catalyst.
3.2. Catalyst Characterisation A Quantachrome Nova 2200e nitrogen gas adsorption/desorption isotherm was used
to determine the surface area, the pore volume, and the pore size distribution of fresh and used catalysts. A Brucker D8 Advance diffractometer was used for the XRD analysis of the crystalline phase of prepared and used Nickel catalysts. The morphology of prepared and used Ni catalysts were examined using a Hitachi SU8230 high performance cold field emission scanning electron microscopy (CFE-SEM). The amount of carbon deposited on used Ni and Rh catalysts was determined using a Thermo Scientific Flash 2000 Elemental Analyzer.
3.3. Reactor Setup The schematic of the fixed bed reactor (experimental rig) used for ATR experiments
(packed Ni catalyst pellets or Rh catalyst particles) is shown in Figure 10. The rig consists of a down flow 316 stainless steel tube reactor with 10 mm internal diameter placed inside an electric tube furnace (Elite Thermal Systems TSV10/20/85) to provide external heating.
For the experimental runs with the monoliths, a 22 mm o.d. stainless-steel reactor was fitted in place, substituting the reactor described in the previous paragraph. The in-ternal diameter of the reactor was increased from 18- to 19-mm to fit the monolith diame-ter by drilling over one end of the reactor tube, and was enclosed inside a furnace TSV12/38/120 supplied by Elite Thermal Systems Ltd. No other modifications were per-formed on the existing rig except using appropriate tube fittings where necessary to con-nect the new reactor.
Figure 10. Schematic diagram of experimental rig.
3.4. Gas Analysis
Figure 10. Schematic diagram of experimental rig.
For the experimental runs with the monoliths, a 22 mm o.d. stainless-steel reactorwas fitted in place, substituting the reactor described in the previous paragraph. Theinternal diameter of the reactor was increased from 18- to 19-mm to fit the monolithdiameter by drilling over one end of the reactor tube, and was enclosed inside a furnaceTSV12/38/120 supplied by Elite Thermal Systems Ltd. No other modifications wereperformed on the existing rig except using appropriate tube fittings where necessary toconnect the new reactor.
Catalysts 2021, 11, 1504 16 of 21
3.4. Gas Analysis
Dry product gas leaving the rig by way of the moisture removal was analysed usinga micro gas chromatograph (Micro GC) supplied by Varian Instruments, UK (modelCP 4900). The moisture is removed using a condenser operating on a 30 vol.% ethyleneglycol/water mixture flowing counter clockwise from a chiller (Fisher Scientific 3016S)set at −2 ◦C, followed by a silica gel moisture trap. The micro-GC is equipped with twothermal conductivity detectors (TCD) and two columns which are a Molecular Sieve 5Aplot column, for the analysis of H2, O2, N2, CH4, and CO; and a Pora Plot Q column for thedetection of CO2, CH4, C2H6, C2H4, C3H8 and C3H6. Both columns were tuned on argonas carrier gas.
The molar flow in mol/s of the dry gases produced during the ATR experiments andmeasured by the on-line micro-GC were determined by nitrogen elemental balance. Theacetic acid conversion to C1, C2 and C3 gases was determined by carbon balance, andwater conversion was determined by hydrogen balance. However C2 and C3 gases werenever detected by the GC analysis and do not appear in the carbon balance. The totalhydrogen produced as both gaseous H2 and bonded hydrogen contained in organic gases(C1 to C3) is attributed to the acetic acid and water feeds. The value of water conversionso calculated was compared and found to be on par with that obtained by closing thebalance on elemental O as proposed by [36]. The total organic carbon (TOC) content of thecondensate recovered after each experiment was determined by differential method usinga Hach Large IL 550 TOC/TIC analyser. This was used to complete the carbon balance andtypically accounted for less than 1% of the carbon feed.
Hydrogen yield (YH2) was expressed either as a mass fraction of the input fuel (wt.%),a mole fraction of input fuel (mol H2/mol HAc), or molar fraction per input carbon(mol/mol C) according to Equations (2)–(4).
YH2(wt.%) =
.nH2(out) × 2.016
.nHAc (in) ×MHAc
× 100 (2)
YH2(mol) =
.nH2(out).nHAc (in)
(3)
YH2(mol C) =
.nH2(out)
n× .nHAc (in)
(4)
where.ni represents the molar flow rate of a species i, e.g.,
.nHAc (in) is the molar flow rate
of acetic acid into the reactor and MHAc is the molar mass of acetic acid in g mol−1.H2 selectivity in the absence of C2 and C3 species in the product gases is given by:
SH2 =
.nH2(out)
.nH2(out) +
.nCH4(out)
× 100 (5)
Determination of selectivity of the C1 gases CO, CO2 and CH4 is illustrated for COusing the following equation:
SCO =yCO
yCO + yCO2 + yCH4
× 100 (6)
where yi is the mol fractions of relevant species i.The hourly space velocity was calculated both as weight hourly space velocity
(WHSV, h−1) and gas hourly space velocity (GHSV, h−1) using the following equations:
WHSV =Total mass f low o f all f eed (kg/h)
Mass o f catalyst (kg)(7)

Catalysts 2021, 11, 1504 17 of 21
GHSV =Total volumetric f low o f all f eed
(m3/h
)volume o f catalyst (m3)
(8)
The volumetric flow rates used in calculating the GHSV was determined for all feed(acetic acid, water, and air) at normal conditions of 20 ◦C and 1 atm.
Over all the experiments performed on the packed bed catalysts, the average car-bon balance closure was within 5.1%, which included carbon on catalyst (TGA runs), incondensates (total organic carbon content) and in gas products (GC).
3.5. Experimental Procedure3.5.1. Ni- and Rh-Based Catalysts Packed Bed Experiments
About 1.0 g of crushed pellets (Ni) or 0.2 g powder (Rh) catalyst was loaded into thetubular reactor and held in place between two 4 µm fibre diameter quartz wool plugs(m.p. 1050 ◦C) obtained from Fisher Scientific UK Ltd., weighing 0.09 g each. Blankexperiments were performed using sand (SiO2) obtained from Sigma-Aldrich, Germany,with a 50–70 mesh size. Depending on the experiment, the catalyst was either used in a fresh(oxidised) or pre-reduced state using hydrogen as the reducing agent. When performingpre-reduction of the catalysts, the reactor bed was heated to 650 ◦C under continuous N2flow after which the N2 was turned off and a 5 vol% H2 (in N2) gas mixture was turnedon with its flow set at 200 cm3/min. Catalyst pre-reduction was monitored by on-linemicro GC and was deemed complete when the recorded H2 reading increased to 5% upfrom an initial value of about 3% at the start of the process. Once the catalyst reductionwas complete, the H2 gas mixture was switched off and the system was flushed underhigh flow of N2 until no H2 was detected by the micro-GC. With no more H2 detected,and the water and fuel vaporisers heated to 50 and 120 ◦C respectively, the N2 flow wasturned off and the ATR experiment was started first by switching on the water syringepump, followed by the air mass flow controller and finally the acetic acid syringe pump.For most experiments the acetic acid flow was set to 1.000 mL/h on the syringe pump andeach experiment was performed for at least 2 h. The HAc flow was only changed whenthe effect of flow rate (hourly space velocity) was investigated. The acetic acid flow ratewas used to set the steam and air flow rate based on the desired S/C and air equivalenceratio (λ) respectively. λ was determined as a molar ratio given by:
λ =Actual air− f uel molar ratio
Stoichiometric (COX) air− f uel molar ratio(9)
The stoichiometric oxygen is calculated using the complete oxidation reaction (‘COX’)i.e., full combustion of HAc to CO2 and H2O products.
3.5.2. Rh-Based Honeycomb Monoliths Experiments
The experimental procedure used to investigate the Rh monolithic reactor was similarto that with the Ni and Rh packed beds. The monolith was lowered into the stainless-steel reactor and held in the middle by the protruding wall marking the end of the initialtube drilling carried out to increase the tube’s internal diameter (from 18 to 19 mm). Athermocouple was fitted at the bottom to measure the bulk gas temperature in the reactor.This temperature reading corresponded to that of the hot product gases flowing out of themonolith and was used to control the electric furnace. As with the packed bed experiments,the set-up was leak tested at several points under a N2 flow of 200 cm3/min using aportable flowmeter. The furnace was heated to the desired reaction temperature while thefuel and water vaporisers were heated to 50 and 120 ◦C, respectively. All this was doneunder continuous flow of N2 and the syringe pumps and flow meters turned on once theset temperatures were achieved as no catalyst reduction was required.

Catalysts 2021, 11, 1504 18 of 21
4. Conclusions
The autothermal reforming (ATR) of acetic acid (HAc) as a model bio-oil compoundwas examined in this study using unstructured (packed bed particles) and structured(honeycomb monolith) Ni and Rh catalysts. Ni was chosen despite the growing literatureon Co for ATR of HAc due to its better sustainability credentials. Despite its high cost,Rh was chosen due to successful previous studies of partial oxidation of oxygenates withshort contact time and because of established routes of recycling of spent catalysts. TheNickel catalysts performed better in the absence of pre-reduction treatment, with the Rhcatalysts showing little difference with regards to pre-reduction, thus the experiments wererun directly on the ‘fresh’ catalysts. Partial oxidation runs (in absence of steam) resulted inmuch higher carbon deposition rates than the ATR runs, revealing the benefits of steamfeed. Increasing feed molar steam to carbon ratio (S/C) from 1 to 2 yielded significantlyhigher increases in conversion than from 2 to 3, thus S/C of 2 was deemed the most costeffective. In same conditions of HAc, air and steam feed, the fresh RC-M, and Ni-CaAland Rh-Al catalysts, in order from less-to-more performant, exhibited the highest HAcconversions (≥94%), and hydrogen yields exceeding 88% of the equilibrium value, theshortfall attributed due to methanation activity. The syngas production of these threecatalysts was over 89% of the equilibrium value. Discrepancies in main gas productsamong the Ni and Rh packed bed and monolith catalysts revealed a higher activity ofsteam consuming reactions (steam reforming, water gas shift) in the Ni catalysts, closestto the predicted equilibrium. In contrast, the Rh catalysts exhibited much less carbondeposition rates than the Ni catalysts, and in turn the Ni-CaAl much less than the Ni-Al,the latter forcing an early end of run due to coking induced blockage. The nature of thedeposited carbon was also different between Ni-Al (lumpy, dense), from the Ni-CaAl andRh-Al (filamentous, non-flow obstructing). The ATR of HAc is a first step into successfullyconducting ATR of bio-oils and a biomass reliant route to green syngas and hydrogen,where biomasses and bio-oils offer ease of storage of energy dense material at scale, and analternative to other forms of intermittent-reliant green hydrogen routes. It is felt that furtherresearch into catalysts structures suitable and compatible with local scales of sustainablebiomass sources would be worthwhile.
Supplementary Materials: The following are available online at https://www.mdpi.com/article/10.3390/catal11121504/s1, Figure S1: Dry N2-free product gas flow composition with time on streamobtained during ATR of acetic acid flowing at 1 mL/h, S/C = 2, λ = 0.353 (Air flow = 22 mL/min), hotproduct gas at 570 ◦C and 1 bar. (a) Fresh Ni-Al. (b) Reduced Ni-Al. (c) Fresh Ni-CaAl. (d) ReducedNi-CaAl, (e) Fresh Rh-Al, (f) Reduced Rh-Al, Figure S2: XRD patterns of (a) unused fresh Ni-Al, usedNi-Al (used Ni-Al (F)) and used reduced Ni-Al (used Ni-Al (R)). Unlabelled peaks belong to theα-Al2O3 support, Ni-CaAl XRD are not shown due to large amorphous content (b) Rh-Al fresh (F)in orange and reduced Rh-Al (F) catalyst in red compared to the rhodium-free γ-Al2O3 support inyellow. (c) Elemental mapping of Rh-Al showing good dispersion of Rh, Figure S3: Dry N2-free molarflow product gas profiles with time on stream obtained for POX of acetic acid flowing at 1 mL/h,λ = 0.353 (Air flow = 22 mL/min), 570 ◦C and 1 bar. (a) Fresh Ni-Al (b) Fresh Ni-CaAl, (c) FreshRh-Al, Figure S4: XRD patterns of Ni-Al catalyst for experiments performed using fresh catalyst atS/C 1, 2 and 3 and 1 bar. Acetic acid flow, 1 mL/h, with corresponding λ and temperature valuesof (0.340, 610 ◦C), (0.353, 570 ◦C) and (0.374, 545 ◦C). All unlabelled peaks belong to the α-Al2O3support, Figure S5: H2 purity, H2 yield, and conversion of acetic acid, water, and oxygen with WHSV(GHSV) for the (a) Ni-Al, (b) Ni-CaAl and (c) Rh-Al catalysts in packed bed. All flows at S/C = 2and λ = 0.353 corresponding to a reactor exit temperature of 570 ◦C, Figure S6: Dry N2-free productgas with time on stream obtained during ATR of acetic acid flowing at 2 mL/h, S/C = 2, λ = 0.353(Air flow = 43.3 mL/min), hot product gas at 570 ◦C and 1 bar. (a) R-M (b) RC-M.

Catalysts 2021, 11, 1504 19 of 21
Author Contributions: Conceptualisation, L.N.T. and V.D.; methodology, L.N.T.; software, L.N.T.;formal analysis, L.N.T.; investigation, L.N.T.; writing—original draft preparation, L.N.T. and E.R.-M.;writing—review and editing, M.V.T. methodology, editing, E.R.-M. and V.D.; supervision, V.D.;funding acquisition, V.D. All authors have read and agreed to the published version of the manuscript.
Funding: This research was funded by Engineering and Physical Sciences Research Council (EPSRC),grant number EP/R030243/1 and Consejo Nacional de Ciencia y Tecnología (CONACYT, PhDscholarship of E.R.-M.).
Institutional Review Board Statement: Not applicable.
Informed Consent Statement: Not applicable.
Data Availability Statement: Associated data is available at https://doi.org/10.5518/1075, accessedon 30 November 2021.
Acknowledgments: Our thanks to Sergio Ramírez Solís, for training support of catalyst synthesisand XRD methodology, whose PhD was also funded by CONACYT.
Conflicts of Interest: The authors declare no conflict of interest.
References1. Kang, I.; Bae, J. Autothermal reforming study of diesel for fuel cell application. J. Power Sources 2006, 159, 1283–1290. [CrossRef]2. Czernik, S.; French, R. Distributed production of hydrogen by auto-thermal reforming of fast pyrolysis bio-oil. Int. J. Hydrogen
Energy 2014, 39, 744–750. [CrossRef]3. Bridgwater, A.V.; Meier, D.; Radlein, D. An overview of fast pyrolysis of biomass. Org. Geochem. 1999, 30, 1479–1493. [CrossRef]4. Xiu, S.; Shahbazi, A. Bio-oil production and upgrading research: A review. Renew. Sustain. Energy Rev. 2012, 16, 4406–4414.
[CrossRef]5. Hu, X.; Gholizadeh, M. Biomass pyrolysis: A review of the process development and challenges from initial researches up to the
commercialisation stage. J. Energy Chem. 2019, 39, 109–143. [CrossRef]6. Pimenidou, P.; Dupont, V. Characterisation of palm empty fruit bunch (PEFB) and pinewood bio-oils and kinetics of their thermal
degradation. Bioresour. Technol. 2012, 109, 198–205. [CrossRef]7. Zin, R.M.; Lea-Langton, A.; Dupont, V.; Twigg, M.V. High hydrogen yield and purity from palm empty fruit bunch and pine
pyrolysis oils. Int. J. Hydrogen Energy 2012, 37, 10627–10638. [CrossRef]8. Basagiannis, A.C.; Verykios, X.E. Reforming reactions of acetic acid on nickel catalysts over a wide temperature range. Appl. Catal.
A Gen. 2006, 308, 182–193. [CrossRef]9. Trane, R.; Dahl, S.; Skjøth-Rasmussen, M.S.; Jensen, A.D. Catalytic steam reforming of bio-oil. Int. J. Hydrogen Energy 2012, 37,
6447–6472. [CrossRef]10. Wang, Q.; Xie, W.; Jia, X.Y.; Chen, B.Q.; An, S.; Xie, X.Y.; Huang, L.H. Ca-Al layered double hydroxides-derived Ni-based catalysts
for hydrogen production via auto-thermal reforming of acetic acid. Int. J. Hydrogen Energy 2019, 44, 20007–20016. [CrossRef]11. Wang, Q.; Zhou, Q.; An, S.; Yang, H.; Huang, L.H. Effect of Fe on CoxAl3FeyOm +/-delta Catalysts for Hydrogen Production by
Auto-thermal Reforming of Acetic Acid. J. Inorg. Mater. 2019, 34, 811–816. [CrossRef]12. Hu, X.M.; Chen, H.; Jia, X.Y.; Wang, Q.; Huang, L.H. Y-Mn-O Supported Ni-Based Catalyst for Hydrogen Production via
Auto-thermal Reforming of Acetic Acid. Chin. J. Inorg. Chem. 2021, 37, 555–560.13. Hu, X.M.; Yang, J.L.; Sun, W.J.; Wang, N.; An, S.; Wang, Q.; Zhang, Y.; Xie, X.Y.; Huang, L.H. Y-Zr-O solid solution supported
Ni-based catalysts for hydrogen production via auto-thermal reforming of acetic acid. Appl. Catal. B-Environ. 2020, 278, 119264.[CrossRef]
14. Song, Y.X.; Chen, B.Q.; Hu, X.M.; Wang, Q.; Xie, X.Y.; Dai, H.; Huang, L.H. Highly Efficient Al-Doped Ni-Mn-O Catalystsfor Auto-Thermal Reforming of Acetic Acid: Role of MnAl2O4 for Stability of Ni Species. Energy Fuels 2020, 34, 14647–14655.[CrossRef]
15. An, S.; Zhang, Y.; Hu, X.M.; Xie, X.Y.; Wang, Q.; Chen, H.; Huang, L.H. Durable Mn(II)Cr(III)O-x composites-supported Ni-basedcatalysts with wide dynamic range for hydrogen production via auto-thermal reforming of acetic acid. Fuel 2020, 278, 118227.[CrossRef]
16. Li, H.G.; Jia, X.Y.; Wang, N.; Chen, B.Q.; Xie, X.Y.; Wang, Q.; Huang, L.H. Auto-thermal reforming of acetic acid over hydrotalcites-derived co-based catalyst: A stable and anti-coking Co/Sr-Alx-O catalyst. Appl. Catal. B-Environ. 2020, 267, 118370. [CrossRef]
17. Zhou, Q.; Zhong, X.Y.; Xie, X.Y.; Jia, X.Y.; Chen, B.Q.; Wang, N.; Huang, L.H. Auto-thermal reforming of acetic acid for hydrogenproduction by ordered mesoporous Ni-xSm-Al-O catalysts: Effect of samarium promotion. Renew. Energy 2020, 145, 2316–2326.[CrossRef]
18. Banza Lubaba Nkulu, C.; Casas, L.; Haufroid, V.; de Putter, T.; Saenen, N.D.; Kayembe-Kitenge, T.; Obadia, P.M.; Mukoma,D.K.W.; Ilunga, J.-M.L.; Nawrot, T.S.; et al. Sustainability of artisanal mining of cobalt in DR Congo. Nat. Sustain. 2018, 1, 495–504.[CrossRef] [PubMed]

Catalysts 2021, 11, 1504 20 of 21
19. Shedd, K.B. Cobalt, U.S. Geological Survey Minerals Yearbook—2016; U.S. Geological Survey, Department of the Interior: Reston, VA,USA, 2016.
20. Tkaczyk, A.H.; Bartl, A.; Amato, A.; Lapkovskis, V.; Petranikova, M. Sustainability evaluation of essential critical raw materials:Cobalt, niobium, tungsten and rare earth elements. J. Phys. D Appl. Phys. 2018, 51, 203001. [CrossRef]
21. European Comission. Communication from the Commission to the European Parliament, the Council, the European Economic and SocialCommittee and the Committee of the regions on the 2017 List of Critical Raw Matrials for the EU; COM(2017) 490 final 2017; EuropeanComission: Brussel, Belgium, 2017.
22. Zeng, X.; Li, J. On the sustainability of cobalt utilization in China. Resour. Conserv. Recycl. 2015, 104, 12–18. [CrossRef]23. Miceli, M.; Frontera, P.; Macario, A.; Malara, A. Recovery/Reuse of Heterogeneous Supported Spent Catalysts. Catalysts 2021,
11, 591. [CrossRef]24. Saguru, C.; Ndlovu, S.; Moropeng, D. A review of recent studies into hydrometallurgical methods for recovering PGMs from
used catalytic converters. Hydrometallurgy 2018, 182, 44–56. [CrossRef]25. Jia, L.-P.; Huang, J.-J.; Ma, Z.-L.; Liu, X.-H.; Chen, X.-Y.; Li, J.-T.; He, L.-H.; Zhao, Z.-W. Research and development trends of
hydrometallurgy: An overview based on Hydrometallurgy literature from 1975 to 2019. Trans. Nonferrous Met. Soc. China 2020,30, 3147–3160. [CrossRef]
26. Viera, M.; Pogliani, C.; Donati, E. Recovery Of Zinc, Nickel, Cobalt And Other Metals By Bioleaching. In Microbial Processing ofMetal Sulfides; Donati, E., Sand, W., Eds.; Springer: Dordrecht, The Netherlands, 2007.
27. Sverdrup, H.U.; Olafsdottir, A.H. Assessing the Long-Term Global Sustainability of the Production and Supply for Stainless Steel.BioPhys. Econ. Resour. Qual. 2019, 4, 1–29. [CrossRef]
28. Cheng, F.; Dupont, V. Nickel catalyst auto-reduction during steam reforming of bio-oil model compound acetic acid. Int. J.Hydrogen Energy 2013, 38, 15160–15172. [CrossRef]
29. Cheng, F.; Dupont, V. Steam Reforming of Bio-Compounds with Auto-Reduced Nickel Catalyst. Catalysts 2017, 7, 114. [CrossRef]30. Cheng, F.; Dupont, V.; Twigg, M.V. Direct reduction of nickel catalyst with model bio-compounds. Appl. Catal. B Environ. 2017,
200, 121–132. [CrossRef]31. Omoniyi, O.A.; Dupont, V. Chemical looping steam reforming of acetic acid in a packed bed reactor. Appl. Catal. B Environ. 2018,
226, 258–268. [CrossRef]32. Omoniyi, O.A.; Dupont, V. Optimised cycling stability of sorption enhanced chemical looping steam reforming of acetic acid in a
packed bed reactor. Appl. Catal. B Environ. 2019, 242, 397–409. [CrossRef]33. Zhao, Z.; Qiu, Z.; Yang, J.; Ma, B.; Li, Z.; Lu, S.; Xu, Y.; Cao, L.; Zhang, W. Recovery of Rare Earth Element Cerium from Spent
Automotive Exhaust Catalysts Using a Novel Method. Waste Biomass Valorization 2019, 11, 4967–4976. [CrossRef]34. Prasetyo, E.; Anderson, C. Platinum Group Elements Recovery from Used Catalytic Converters by Acidic Fusion and Leaching.
Metals 2020, 10, 485. [CrossRef]35. Cybulski, A.; Moulijn, J.A. Structured Catalysts and Reactors, 2nd ed.; Chemical Industries; CRC press, Taylor & Francis Group:
Boca Raton, FL, USA, 2006.36. Rennard, D.C.; Kruger, J.S.; Schmidt, L.D. Autothermal catalytic partial oxidation of glycerol to syngas and to non-equilibrium
products. ChemSusChem 2009, 2, 89–98. [CrossRef]37. Biegger, P.; Kirchbacher, F.; Medved, A.; Miltner, M.; Lehner, M.; Harasek, M. Development of Honeycomb Methanation Catalyst
and Its Application in Power to Gas Systems. Energies 2018, 11, 1679. [CrossRef]38. Doherty, W.; Reynolds, A.; Kennedy, D. Aspen Plus Simulation of Biomass Gasification in a Steam Blown Dual Fluidised Bed. In
Materials and Processes for Energy: Communicating Current Research and Technological Developments; Mendez-Vilas, A., Ed.; FormatexResearch Centre: Montreal, Canada, 2013; ISBN 978-84-939843-7-3.
39. Halvorsen, B.M.; Adhikari, U.; Eikeland, M.S. Gasification of Biomass for Production of Syngas for Biofuel. In Proceedings of the56th Conference on Simulation and Modelling, Linköping, Sweden, 7–9 October 2015.
40. Vagia, E.; Lemonidou, A. Thermodynamic analysis of hydrogen production via autothermal steam reforming of selectedcomponents of aqueous bio-oil fraction. Int. J. Hydrogen Energy 2008, 33, 2489–2500. [CrossRef]
41. Specchia, S.; Vella, L.D.; de Rogatis, L.; Montini, T.; Specchia, V.; Fornasiero, P. Rh-based catalysts for syngas production viaSCT-CPO reactors. Catal. Today 2010, 155, 101–107. [CrossRef]
42. Bengaard, H.S.; Nørskov, J.K.; Sehested, J.; Clausen, B.S.; Nielsen, L.P.; Molenbroek, A.M.; Rostrup-Nielsen, J.R. Steam Reformingand Graphite Formation on Ni Catalysts. J. Catal. 2002, 209, 365–384. [CrossRef]
43. Rostrup-Nielsen, J.R. Activity of Nickel Catalysts for Steam Reforming of Hydrocarbons. J. Catal. 1973, 31, 173–199. [CrossRef]44. Vis, J.C.; Buk, H.F.J.V.; Huizinga, T.; van Grondelle, J.; Prins, R. Reduction and oxidation of Rh/Al2O3 and Rh/TiO2 catalysts as
studied by temperature-programmed reduction and oxidation. J. Mol. Catal. 1984, 25, 367–378. [CrossRef]45. Oh, S.; Carpenter, J.E. The oxidation state and catalytic activity of supported rhodium. J. Catal. 1983, 80, 472–478. [CrossRef]46. Zheng, Q.; Farrauto, R.; Deeba, M.; Valsamakis, I. Part I: A Comparative Thermal Aging Study on the Regenerability of Rh/Al2O3
and Rh/CexOy-ZrO2 as Model Catalysts for Automotive Three Way Catalysts. Catalysts 2015, 5, 1770–1796. [CrossRef]47. Gustafson, J.; Balmes, O.; Zhang, C.; Shipilin, M.; Schaefer, A.; Hagman, B.; Merte, L.R.; Martin, N.M.; Carlsson, P.-A.; Jankowski,
M.; et al. The Role of Oxides in Catalytic CO Oxidation over Rhodium and Palladium. ACS Catal. 2018, 8, 4438–4445. [CrossRef]48. Rood, S.; Eslava, S.; Manigrasso, A.; Bannister, C. Recent advances in gasoline three-way catalyst formulation: A review. Proc.
Inst. Mech. Eng. Part D J. Automob. Eng. 2019, 234, 936–949. [CrossRef]

Catalysts 2021, 11, 1504 21 of 21
49. Medrano, J.; Oliva, M.; Ruiz, J.; Garcia, L.; Arauzo, J. Catalytic steam reforming of acetic acid in a fluidized bed reactor withoxygen addition. Int. J. Hydrogen Energy 2008, 33, 4387–4396. [CrossRef]
50. Cabello, A.; Gayán, P.; García-Labiano, F.; de Diego, L.F.; Abad, A.; Izquierdo, M.T.; Adánez, J. Relevance of the catalytic activityon the performance of a NiO/CaAl2O4 oxygen carrier in a CLC process. Appl. Catal. B Environ. 2014, 147, 980–987. [CrossRef]
51. Lu, Y.; Xue, J.Z.; Yu, C.C.; Liu, Y.; Shen, S.K. Mechanistic investigations on the partial oxidation of methane to synthesis gas over anickel-on-alumina catalyst. Appl. Catal. Gen. 1998, 174, 121–128. [CrossRef]
52. Gutierrez, A.; Karinen, R.; Airaksinen, S.; Kaila, R.; Krause, A.O.I. Autothermal reforming of ethanol on noble metal catalysts. Int.J. Hydrogen Energy 2011, 36, 8967–8977. [CrossRef]
53. Liguras, D.K.; Goundani, K.; Verykios, X.E. Production of hydrogen for fuel cells by catalytic partial oxidation of ethanol overstructured Ni catalysts. J. Power Sources 2004, 130, 30–37. [CrossRef]
54. Marquevich, M.; Czernik, S.; Chornet, E.; Montane, D. Hydrogen from biomass: Steam reforming of model compounds offast-pyrolysis oil. Energy Fuels 1999, 13, 1160–1166. [CrossRef]
55. Kaila, R.K.; Gutiérrez, A.; Slioor, R.; Kemell, M.; Leskelä, M.; Krause, A.O.I. Zirconia-supported bimetallic RhPt catalysts:Characterization and testing in autothermal reforming of simulated gasoline. Appl. Catal. B Environ. 2008, 84, 223–232. [CrossRef]
56. Cavallaro, S. Ethanol Steam Reforming on Rh/Al2O3Catalysts. Energy Fuels 2000, 14, 1195–1199. [CrossRef]57. Aupretre, F.; Descorme, C.; Duprez, D. Hydrogen production for fuel cells from the catalytic ethanol steam reforming. Top. Catal.
2004, 30–31, 487–491. [CrossRef]58. Hohn, K.L.; Schmidt, L.D. Partial oxidation of methane to syngas at high space velocities over Rh-coated spheres. Appl. Catal.
Gen. 2001, 211, 53–68. [CrossRef]59. Tande, L.N.; Resendiz-Mora, E.; Dupont, V. Bioh2, Heat and Power from Palm Empty Fruit Bunch via Pyrolysis-Autothermal
Reforming: Plant Simulation, Experiments, and CO2 Mitigation. Energies 2021, 14, 4767. [CrossRef]