Removal of Hydrogen Sulfide using bio filters Under the guidance of
Upload
khangminh22Category
view
1download
0
Hydrogen Sulfide
Method Number ID-141
Matrix Air
OSHA Permissible Exposure Limits Hydrogen Sulfide (Final Rule Limits): 10 ppm (TWA)
15 ppm (STEL)
Hydrogen Sulfide (Transitional Limits): 20 ppm (Ceiling)
50 ppm (Peak 10 min exposure)
Collection Procedure A calibrated personal sampling pump is used to draw air through a filter impregnated with silver nitrate which converts the hydrogen sulfide to silver sulfide.
Recommended Air Volume 2 to 6 L
Recommended Sampling Rate Peak, Ceiling or STEL samples:
TWA samples
0.2 L /min
0.1 L/min
Analytical Procedure The sample is analyzed as sulfide by differential pulse polarography.
Detection Limits Qualitative:
Quantitative:
0.4 ppm ( 2L air volume)
0.9 ppm (2L air volume)
Precision and Accuracy Validation Level: 10.1 to 39.2 ppm
CVT 0.038
Bias -0.031
Overall error ±10.7%
Method Classification Validated Method
Chemist Ted Wilczek
Date (Date Revised) 1983 (December 1989)
Withdrawn Provided for Historical Reference only
Note: OSHA no longer uses or supports this method (2021)
WITHDRAWN

Commercial manufacturers and products mentioned in this method are for
descriptive use only and do not constitute endorsements by USDOL-OSHA. Similar products from other sources can be substituted.
Branch of Inorganic Methods Development OSHA Technical Center,
Sandy, UT- 84070
Withdrawn Provided for Historical Reference only
Note: OSHA no longer uses or supports this method (2021)
WITHDRAWN

3 of 30
1. IntroductionThis method describes the collection of airborne hydrogen sulfide (H2S) in the workplace on a silvernitrate (AgNO3)-impregnated filter and analysis by differential pulse polarography (DPP).
1.1. HistoryPreviously, H2S was collected in a midget impinger containing an alkaline suspension of cadmium hydroxide. The sulfide was precipitated as cadmium sulfide (CdS) and subsequently analyzed by the methylene blue calorimetric procedure (8-1.). Due to the photosensitivity of CdS, it was necessary to protect the impinger sample from light at all times. Also, the impinger base and stem could contain CdS deposits after sample collection. This required the entire impinger sample be sent to the lab for analysis. Problems associated with impinger sampling were additional incentives to develop a more acceptable sampling method.
1.2. Principle Hydrogen sulfide is collected on a Whatman 4 filter paper (Whatman Labsales, Hillsboro, OR) which has been impregnated with AgNO3. The H2S reacts with the AgNO3 to form silver sulfide, a greyish-black precipitate (8.2., 8.3.). The silver sulfide is dissolved in an alkaline cyanide solution and analyzed for sulfide by DPP using a dropping mercury electrode (DME).
1.3. Advantages and Disadvantages
1.3.1. The sampling device is small, portable, and involves no liquids. Humidity does not significantly affect the sampling efficiency of the device.
1.3.2. The sulfide formed is stable and non-volatile. Desorption and preparation of samples for analysis involve simple procedures.
1.3.3. Collected samples are analyzed by means of a quick analytical method.
1.3.4. This method has adequate sensitivity for measuring workplace atmospheric concentrations of H2S for Short-Term Exposure Limit (STEL), Ceiling, or Time Weighted Average (TWA) measurements.
1.3.5. The analysis is specific for sulfide in the presence of other organic or inorganic sulfur compounds.
1.3.6. One disadvantage of the method is the amount of H2S collected is limited by the capacity of the AgNO3-impregnated filter.
1.3.7. Another disadvantage is the necessity of protecting the impregnated filters from light at all times. The AgNO3-impregnated filters darken upon exposure to light.
1.3.8. Alkaline cyanide solutions are used in the sample preparation and analytical procedure. Safety precautions must be followed during their use and disposal.
1.3.9. The alkaline cyanide solutions may contain some background sulfide, which must be subtracted from the amount of sulfide found in each sample. The precision of the method is affected by the reproducibility of the background sulfide.
Withdrawn Provided for Historical Reference only
Note: OSHA no longer uses or supports this method (2021)
WITHDRAWN
4 of 30
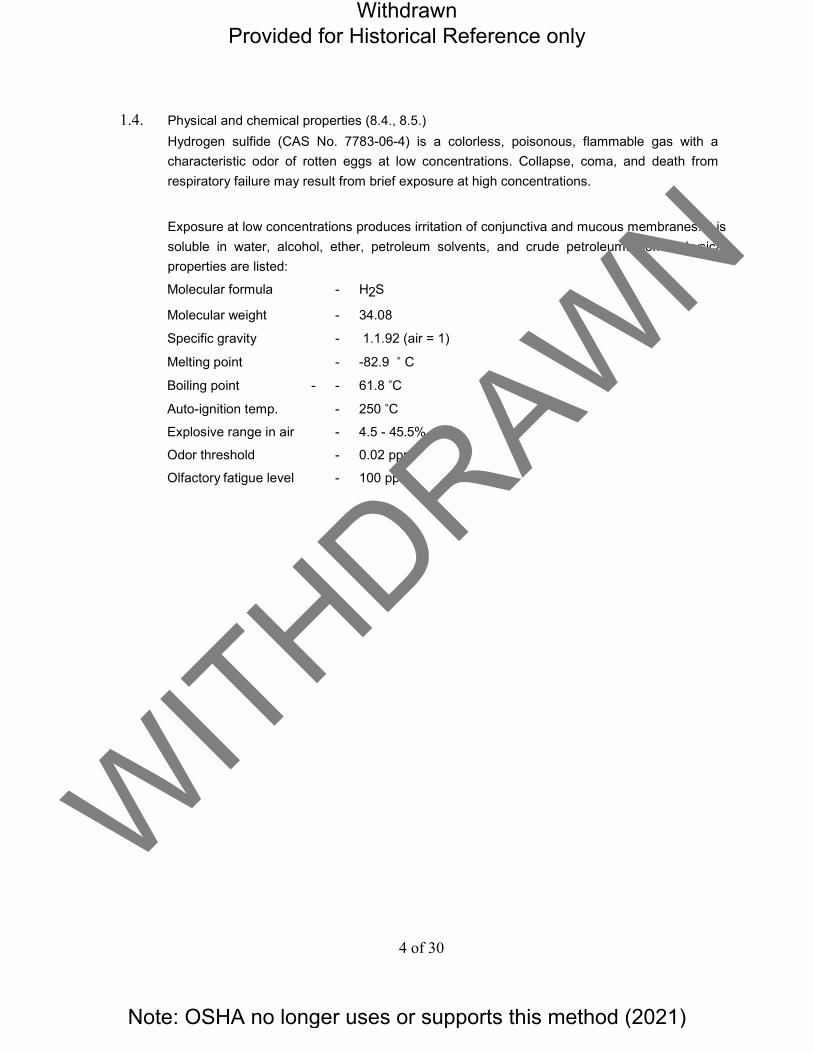
1.4. Physical and chemical properties (8.4., 8.5.) Hydrogen sulfide (CAS No. 7783-06-4) is a colorless, poisonous, flammable gas with a characteristic odor of rotten eggs at low concentrations. Collapse, coma, and death from respiratory failure may result from brief exposure at high concentrations.
Exposure at low concentrations produces irritation of conjunctiva and mucous membranes. It is soluble in water, alcohol, ether, petroleum solvents, and crude petroleum. Some physical properties are listed:
Molecular formula - H2S
Molecular weight - 34.08
Specific gravity - 1.1.92 (air = 1)
Melting point - -82.9 ˚ C
Boiling point - - 61.8 ˚C
Auto-ignition temp. - 250 ˚C
Explosive range in air - 4.5 - 45.5%
Odor threshold - 0.02 ppm
Olfactory fatigue level - 100 ppm
Withdrawn Provided for Historical Reference only
Note: OSHA no longer uses or supports this method (2021)
WITHDRAWN

5 of 30
1.5. Occupations with Potential Exposure to Hydrogen Sulfide (8.4.)
Animal fat and oil processors Lead Removers Animal manure removers Lithographers Artificial flavor makers Lithopone Asphalt storage workers Livestock farmers Barium carbonate makers Manhole and trench workers Blast furnace workers Metallurgists Brewery workers Miners Bromide-brine workers Natural gas production and Cable splicers processing workers Caisson workers Painters using polisulfide Carbon disulfide makers caulking compounds Cellophane makers Papermakers Chemical laboratory workers, Petroleum production and Teachers, students refinery workers
Cistern cleaners Phosphate purifiers Citrus root fumigators Photoengravers Coal gasification workers Pipeline maintenance workers Coke oven workers Pyrite burners Copper-ore sulfidizers Rayon makers Depilatory makers Refrigerant makers Dyemakers Rubber/plastics processors Excavators Septic tank cleaners Felt makers Sewage treatment plant workers Fermentation process workers Sewer workers Fertilizer makers Sheepdippers Fishing and fish-processing workers Silk makers Fur dressers Slaughterhouse workers Geothermal-power drilling Smelting workers and production workers Soapmakers Gluemakers Sugar beet and cane processors Gold-ore workers Sulfur spa workers Heavy-metal precipitators Sulfur products processors Heavy-water manufacturers Synthetic-fiber workers Hydrochloric acid purifiers Tank gagers Hydrogen sulfide production Tannery workers and sales workers Textiles printers
Landfill workers Thiophene workers Lead ore sulfidizers Well diggers and cleaners Wool pullers
2. Range and Detection Limit (8.6.)
2.1. The analytical working range is from 0.05 to 4 µg/mL as sulfide.
2.2. The qualitative and quantitative detection limits of the analytical method for a 50 mL sampleextraction volume are 1.0 and 2.5 µg H2S, respectively. These values correspond to 0.4 ppm and 0.90 ppm H2S when using a 2 L air volume.
Withdrawn Provided for Historical Reference only
Note: OSHA no longer uses or supports this method (2021)
WITHDRAWN
6 of 30
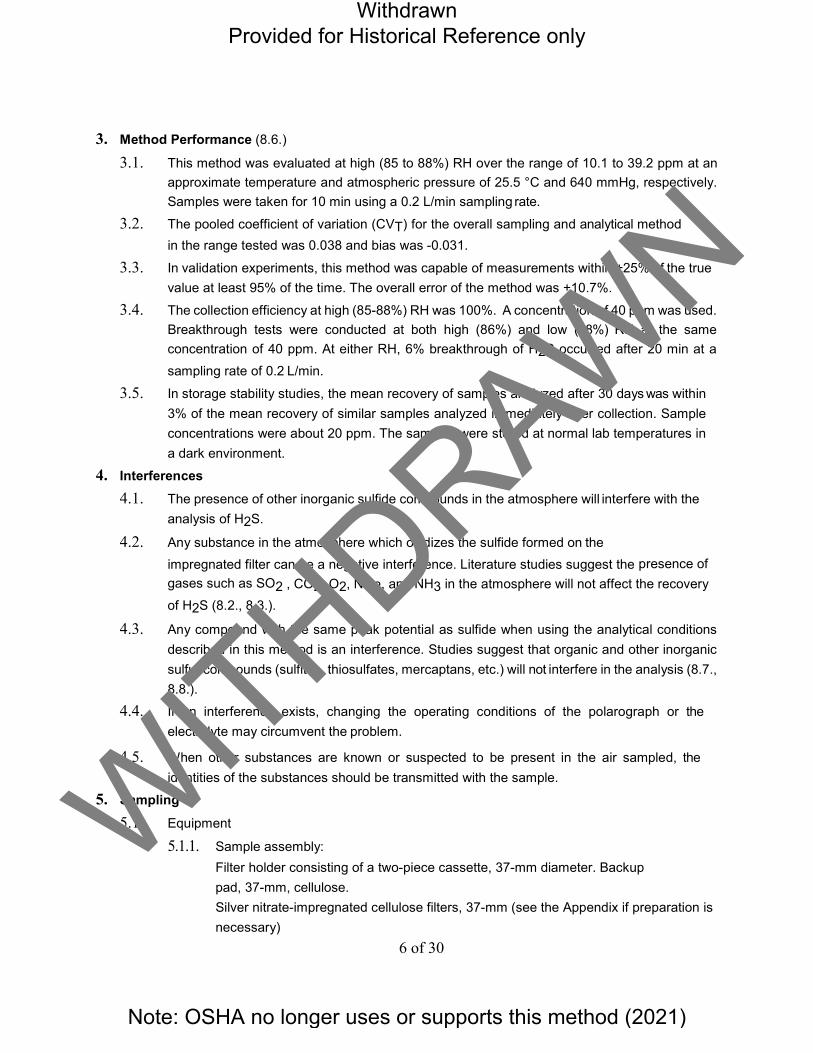
3. Method Performance (8.6.)
3.1. This method was evaluated at high (85 to 88%) RH over the range of 10.1 to 39.2 ppm at an approximate temperature and atmospheric pressure of 25.5 °C and 640 mmHg, respectively. Samples were taken for 10 min using a 0.2 L/min sampling rate.
3.2. The pooled coefficient of variation (CVT) for the overall sampling and analytical method in the range tested was 0.038 and bias was -0.031.
3.3. In validation experiments, this method was capable of measurements within ±25% of the true value at least 95% of the time. The overall error of the method was +10.7%.
3.4. The collection efficiency at high (85-88%) RH was 100%. A concentration of 40 ppm was used. Breakthrough tests were conducted at both high (86%) and low (18%) RH at the same concentration of 40 ppm. At either RH, 6% breakthrough of H2S occurred after 20 min at a sampling rate of 0.2 L/min.
3.5. In storage stability studies, the mean recovery of samples analyzed after 30 days was within 3% of the mean recovery of similar samples analyzed immediately after collection. Sample concentrations were about 20 ppm. The samples were stored at normal lab temperatures in a dark environment.
4. Interferences4.1. The presence of other inorganic sulfide compounds in the atmosphere will interfere with the
analysis of H2S.
4.2. Any substance in the atmosphere which oxidizes the sulfide formed on theimpregnated filter can be a negative interference. Literature studies suggest the presence of gases such as SO2 , CO2, O2, NO2, and NH3 in the atmosphere will not affect the recovery of H2S (8.2., 8.3.).
4.3. Any compound with the same peak potential as sulfide when using the analytical conditions described in this method is an interference. Studies suggest that organic and other inorganic sulfur compounds (sulfites, thiosulfates, mercaptans, etc.) will not interfere in the analysis (8.7., 8.8.).
4.4. If an interference exists, changing the operating conditions of the polarograph or the electrolyte may circumvent the problem.
4.5. When other substances are known or suspected to be present in the air sampled, the identities of the substances should be transmitted with the sample.
5. Sampling5.1. Equipment
5.1.1. Sample assembly: Filter holder consisting of a two-piece cassette, 37-mm diameter. Backup pad, 37-mm, cellulose. Silver nitrate-impregnated cellulose filters, 37-mm (see the Appendix if preparation is necessary)
Withdrawn Provided for Historical Reference only
Note: OSHA no longer uses or supports this method (2021)
WITHDRAWN

7 of 30
5.1.2. Gel bands (Omega Specialty Instrument Co., Chelmsford, MA) for sealing cassettes.
5.1.3. Sampling pumps capable of sampling at 0.1 to 0.2 liters per minute (L/min).
5.1.4. Assorted flexible tubing.
5.1.5. Stopwatch and bubble tube or meter for pump calibration.
5.2. Sampling Procedure (Note: The impregnated filters should be handled with nonmetallic forceps. Also, the AgNO3-impregnated filters are light-sensitive and can turn black upon prolonged exposure to light.)
5.2.1. Place an impregnated filter and a cellulose backup pad into a 37 mm polystyrene two-piece cassette filter holder. Seal the cassette with a shrinkable gel band. Place plastic end caps on the cassette. Shield the cassette from light by completely wrapping it with black tape or aluminum foil. Store the cassette in a dark environment until use.
5.2.2. Calibrate each personal sampling pump with a prepared cassette in-line at the flow rate listed below:
Type of Sample Flow Rate Sampling Time
Ceiling, STEL or Peak 0.2 L/min 15 min
TWA 0.1 L/min 60 min
5.2.3. Attach prepared cassettes to calibrated sampling pumps (the backup pad should face the pump) and place in appropriate positions on the employee or workplace area.
Begin sampling; due to potential breakthrough, do not exceed the recommended sampling times listed above.
5.2.4. Place plastic end caps on each cassette after sampling.
5.2.5. If possible, refrigerate the collected samples during storage periods prior to analysis. Samples do not need to be refrigerated during handling or shipping.
5.3. Shipment Submit at least one blank sample with each set of air samples. Blank filter samples should be handled in the same manner as other samples, except no air is drawn through the blank. Attach an OSHA-21 seal around each cassette in such a way as to secure the end caps. Send the samples to the laboratory with the OSHA 91A paperwork requesting hydrogen sulfide analysis.
6. Analysis6.1. Safety Precautions
6.1.1. Safety glasses, lab coat, and gloves must be worn at all times.
Withdrawn Provided for Historical Reference only
Note: OSHA no longer uses or supports this method (2021)
WITHDRAWN
8 of 30
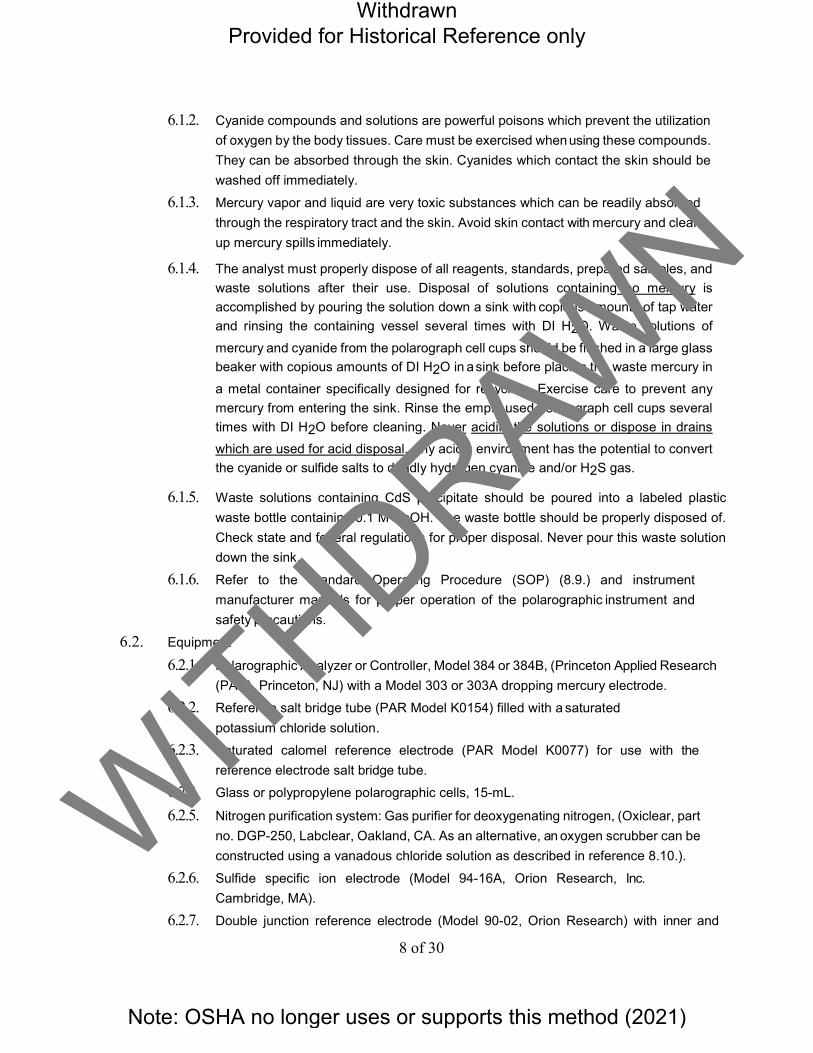
6.1.2. Cyanide compounds and solutions are powerful poisons which prevent the utilization of oxygen by the body tissues. Care must be exercised when using these compounds. They can be absorbed through the skin. Cyanides which contact the skin should be washed off immediately.
6.1.3. Mercury vapor and liquid are very toxic substances which can be readily absorbed through the respiratory tract and the skin. Avoid skin contact with mercury and clean up mercury spills immediately.
6.1.4. The analyst must properly dispose of all reagents, standards, prepared samples, and waste solutions after their use. Disposal of solutions containing no mercury is accomplished by pouring the solution down a sink with copious amounts of tap water and rinsing the containing vessel several times with DI H2O. Waste solutions of mercury and cyanide from the polarograph cell cups should be flushed in a large glass beaker with copious amounts of DI H2O in a sink before placing the waste mercury in a metal container specifically designed for recycling. Exercise care to prevent any mercury from entering the sink. Rinse the empty used polarograph cell cups several times with DI H2O before cleaning. Never acidify the solutions or dispose in drains which are used for acid disposal. Any acidic environment has the potential to convert the cyanide or sulfide salts to deadly hydrogen cyanide and/or H2S gas.
6.1.5. Waste solutions containing CdS precipitate should be poured into a labeled plastic waste bottle containing 0.1 M NaOH. The waste bottle should be properly disposed of. Check state and federal regulations for proper disposal. Never pour this waste solution down the sink.
6.1.6. Refer to the Standard Operating Procedure (SOP) (8.9.) and instrument manufacturer manuals for proper operation of the polarographic instrument and safety precautions.
6.2. Equipment
6.2.1. Polarographic Analyzer or Controller, Model 384 or 384B, (Princeton Applied Research (PAR), Princeton, NJ) with a Model 303 or 303A dropping mercury electrode.
6.2.2. Reference salt bridge tube (PAR Model K0154) filled with a saturated potassium chloride solution.
6.2.3. Saturated calomel reference electrode (PAR Model K0077) for use with the reference electrode salt bridge tube.
6.2.4. Glass or polypropylene polarographic cells, 15-mL.
6.2.5. Nitrogen purification system: Gas purifier for deoxygenating nitrogen, (Oxiclear, part no. DGP-250, Labclear, Oakland, CA. As an alternative, an oxygen scrubber can be constructed using a vanadous chloride solution as described in reference 8.10.).
6.2.6. Sulfide specific ion electrode (Model 94-16A, Orion Research, Inc. Cambridge, MA).
6.2.7. Double junction reference electrode (Model 90-02, Orion Research) with inner and
Withdrawn Provided for Historical Reference only
Note: OSHA no longer uses or supports this method (2021)
WITHDRAWN

9 of 30
outer filling solutions (Cat. Nos. 90-00-02 and 90-00-03, respectively). 6.2.8. Millivolt meter.
6.2.9. Magnetic stirrer and Teflon stirring bars. 6.2.10. Burette, glass, 10-mL.
6.2.11. Beakers, polypropylene, 100-mL, with tight fitting covers.
6.2.12. Bottle, narrow mouth, amber, linear polyethylene, opaque, 125- or 250-mL, with screw cap - used for storage of light-sensitive material.
6.2.13. Bottles, wide mouth, polypropylene, with screwcaps.
6.2.14. Nonmetallic forceps.
6.2.15. Glass rod.
6.2.16. Polystyrene disposable beakers.
6.2.17. Automatic pipette, adjustable, 20- to 5000-µL range (Gilson Pipetman, Rainin Instruments Inc.).
6.2.18. Volumetric pipettes, volumetric flasks, beakers and other laboratory glassware.
6.2.19. Tissue paper.
6.2.20. Analytical balance (0.01 mg).
6.3. Reagents: All chemicals should be reagent grade or better.
6.3.1. Deionized water (DI H2O): Deionized, filtered, deoxygenated water is needed for preparation of all solutions, which will be used in the analysis. It is recommended to purge the DI H2O with purified nitrogen before use.
6.3.2. Sodium hydroxide (NaOH).
6.3.3. Sodium hydroxide, 0.1 M solution. Dissolve 4.0 g of N in approximately 400 mL of DI H2O and then dilute the solution to 1 L. Store the solution in a wide-mouth polypropylene bottle.
6.3.4. Sodium cyanide (NaCN), containing s 0.001% sulfide as an impurity.
6.3.5. Alkaline 0.5 M NaCN solution. Dissolve 2.0 g of NaOH and then 12.25 g of NaCN in approximately 300 mL of DI H2O and then dilute the solution to 500 mL. Immediately and carefully transfer the solution to a wide-mouth, polypropylene bottle.
6.3.6. Alkaline 0.25 M NaCN solution. Dilute 250 mL of the 0.5 M NaCN solution to 500 mL with 0.1 M NaOH solution. Immediately and carefully transfer the solution to a wide-mouth polypropylene bottle.
6.3.7. Nitric acid (HNO3), concentrated.
6.3.8. Nitric acid, 6 M: Carefully dilute 384 mL of concentrated HNO3 to 1 L using DI H2O.
6.3.9. Nitric acid, 1 M: Dilute 6.4 mL of concentrated HNO3 to 100 mL with DI H2O.
6.3.10. Sodium sulfide nonahydrate (Na2S.9H2O), crystalline.
Withdrawn Provided for Historical Reference only
Note: OSHA no longer uses or supports this method (2021)
WITHDRAWN

10 of 30
6.3.11. Sodium sulfide (Na2S) stock solution (equivalent to 1,000 µg/mL H2S):
1. Weigh 0.7050 g of Na2S.9H2O crystals in a 50 mL disposable polystyrene beaker(Note: Before weighing, remove any surface impurities by rinsing the crystals withDI H2O in an exhaust hood. Quickly blot the crystals dry with tissue paper. Handlethe crystals with nonmetallic forceps.).
2. Dissolve the weighed Na2S.9H2O crystals in a disposable beaker containing about30 mL of 0.1 M NaOH.
3. Quantitatively transfer the solution to a 100 mL volumetric flask. Rinse thebeaker several times with 0.1 M NaOH and transfer to the volumetric flask. Dilutethe flask to the mark with 0.1 M NaOH.
4. Wrap the flask with aluminum foil to protect it from light. Refrigerate and keep theflask in a dark environment prior to and immediately after each use.
5. Prepare this solution weekly.
6.3.12. Cadmium sulfate (CdSO4) anhydrous.
6.3.13. Cadmium sulfate (CdSO4), 0.1500 M standard solution (used in the
standardization of the Na2S stock solution).
1. Heat approximately 3.5 g of anhydrous CdSO4 at 110 °C for 24 h in a drying oven.Cool the dried CdSO4 in a desiccator for approximately 30 min.
2. Quickly weigh 3.127 g of the dried CdSO4 in a 50 mL disposable polystyrenebeaker and then dissolve in approximately 25 mL of DI H2O.
3. Quantitatively transfer this solution to a 100 mL volumetric flask. Rinsethe beaker several times with DI H2O and transfer the rinses to the volumetricflask. Dilute to volume with DI H2O.
6.3.14. Saturated potassium chloride solution for filling the salt bridge.
6.4. Standard Preparation 6.4.1. To standardize the Na2S stock solution a titration is performed with a standard 0.1500
M CdSO4 solution. A sulfide ISE is used as the indicator. An orange-colored
precipitate (CdS) is formed from the reaction of Cd2+ with S2-(8.11.).
1. Connect the sulfide ion specific and double junction reference electrodes to themillivolt meter. Place the electrodes in a 0.1 M NaOH solution to reducestabilization time.
2. Allow the Na2S stock solution to come to ambient temperature and then pipette25 mL of this solution into a 50 mL disposable beaker containing a Teflon stirringbar. Use magnetic stirring throughout the titration.
3. Place the electrodes in the beaker and record the initial mV reading. Place a pieceof insulating material such as cardboard or Styrofoam between the magneticstirrer and the beaker to minimize the heating of the standard solution by thestirrer.
4. Record the electrode potential as a function of titrant volume added. Initially addthe 0.1500 m CdSO4 standard titration solution from a 10 mL burette in 0.5 to 1.0mL increments to the beaker. When the potential change per increment begins to
Withdrawn Provided for Historical Reference only
Note: OSHA no longer uses or supports this method (2021)
WITHDRAWN
11 of 30
2
increase, add 0.05 mL to 0.2 ml of the titrant to the beaker. Add about 1 mL of the titrant beyond the endpoint.
5. The end point is the point of greatest slope on the titration curve. This can bedetermined by plotting the electrode potential versus titrant volume or tabulatingthe change in potential per mL increment of titrant added.
6. Calculate the µg/mL equivalent of H2S in the Na2S stock solution:
H2S (µg/mL) = A x B x 32.064 x 1,000 x 1.0629 C
Where: A = molarity of the standard CdSO4 solution. B = mL of standard CdSO4 solution required to titrate the
Na2S stock solution. 32.064 = milligrams per milliequivalent sulfide.
1,000 = micrograms per milligram 1.0629 = gravimetric factor (H S/S2-)
C = 25.0 mL = mL of the Na2S solution used.
6.4.2. Prepare standards equivalent to 100 and 10 µg/mL H2S by making appropriate serialdilutions of the Na2S stock solution with the 0.1 M NaOH solution. Protect these standards from light and prepare daily.
6.5. Sample Preparation
Wash all glassware and plastic ware, excluding the polarograph cell cups, in detergent, rinse in dilute (1 M) nitric acid, rinse thoroughly with DI H2O, and then air dry prior to use. Wash the cell cups in 6 M HNO3 and rinse with DI H2O before use.
6.5.1. Open the filter cassette. Carefully remove the sample filter with nonmetallic forceps and place it in a 100 mL polypropylene beaker.
6.5.2. Immediately pipette 25 mL of the alkaline 0.5 M NaCN solution into the beaker and then tightly cover it with a polypropylene lid.
6.5.3. Place the covered beaker in a dark environment at ambient room temperature for approximately 6 h. Occasionally swirl the sample solution with a gentle motion. The silver sulfide on the filter will dissolve in the cyanide solution during this time.
6.5.4. Store the covered sample beaker overnight in a refrigerator.
6.5.5. Remove the beaker from the refrigerator and place in a dark environment for approximately 45 min to allow the sample solution to equilibrate to room temperature.
6.5.6. Pipette 25 mL of the 0.1 M NaOH solution into the sample beaker and then stir the sample solution with a clean glass rod. Cover each sample solution with a plastic lid until analysis. The solutions should be analyzed sometime during the same work day.
Withdrawn Provided for Historical Reference only
Note: OSHA no longer uses or supports this method (2021)
WITHDRAWN

12 of 30
6.6. Analytical Procedure
6.6.1. Protect and electrically isolate the silver reference electrode wire on the DME by installing a clean, empty reference electrode glass sleeve with a Vycor tip.
6.6.2. Install the filled salt bridge tube on the electrode support block. Insert the saturated calomel reference electrode (SCE) into the salt bridge tube and then connect the SCE cable to the reference electrode input.
6.6.3. Refer to reference 8.9. for operating the polarograph.
6.6.4. Turn on the nitrogen to a pressure of about 2 psi.
6.6.5. Initially set the following values (Note: Some of the settings mentioned below are instrument specific. Refer to specific operating and service manuals for other types of polarograph): Analytical Technique - DPP Initial Potential - -0.610 vFinal Potential - -0.770 v Peak Location - yesPeak Potential - -0.690 V Purge Time - 60 sDrop Time - 1 sScan Increment - 2 mV ScanRate - 2mV/sPulse Height - 0.050 VTangent Fit - No Derivative
- No Blank Subtraction - YesOverride Position - 10 11 12 13 14 15 16 17Status Y N Y Y N Y Y NDrop Size - Large
6.6.6. The differential pulse polarogram of sulfide using a DME yields a peak at approximately -0.690 V. The peak potential depends on reference electrode response and the DME operating parameters.
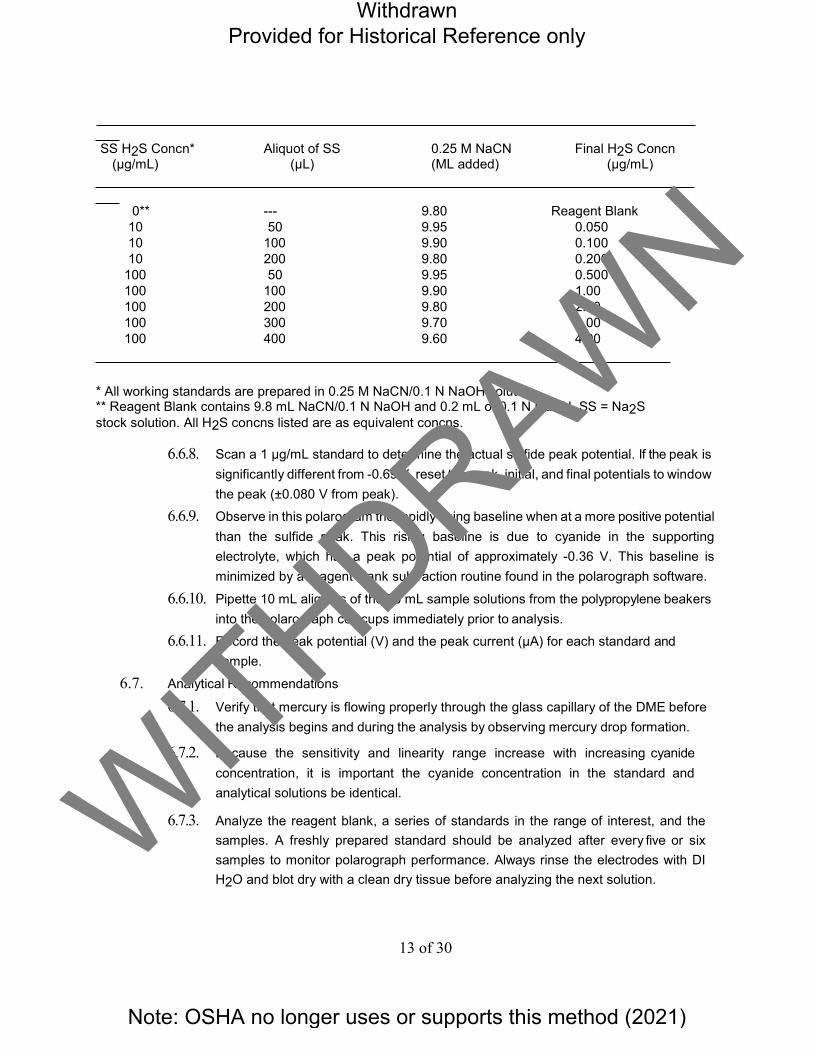
6.6.7. Prepare standards in the range of 0.05 to 4.0 µg/mL immediately before analysis by diluting µL aliquots of the Na2S working standards to 10 ml in the polarograph cell cups with the alkaline 0.25 M NaCN solution. A suggested method of preparation of the standard solutions in the cell cups is given:
Withdrawn Provided for Historical Reference only
Note: OSHA no longer uses or supports this method (2021)
WITHDRAWN
13 of 30
SS H2S Concn* Aliquot of SS 0.25 M NaCN Final H2S Concn (µg/mL) (µL) (ML added) (µg/mL)
0** --- 9.80 Reagent Blank 10 50 9.95 0.050 10 100 9.90 0.100 10 200 9.80 0.200
100 50 9.95 0.500 100 100 9.90 1.00 100 200 9.80 2.00 100 300 9.70 3.00 100 400 9.60 4.00
* All working standards are prepared in 0.25 M NaCN/0.1 N NaOH solution.** Reagent Blank contains 9.8 mL NaCN/0.1 N NaOH and 0.2 mL of 0.1 N NaOH. SS = Na2Sstock solution. All H2S concns listed are as equivalent concns.
6.6.8. Scan a 1 µg/mL standard to determine the actual sulfide peak potential. If the peak is significantly different from -0.69 V, reset the peak, initial, and final potentials to window the peak (±0.080 V from peak).
6.6.9. Observe in this polarogram the rapidly rising baseline when at a more positive potential than the sulfide peak. This rising baseline is due to cyanide in the supporting electrolyte, which has a peak potential of approximately -0.36 V. This baseline is minimized by a reagent blank subtraction routine found in the polarograph software.
6.6.10. Pipette 10 mL aliquots of the 50 mL sample solutions from the polypropylene beakers into the polarograph cell cups immediately prior to analysis.
6.6.11. Record the peak potential (V) and the peak current (µA) for each standard and sample.
6.7. Analytical Recommendations
6.7.1. Verify that mercury is flowing properly through the glass capillary of the DME before the analysis begins and during the analysis by observing mercury drop formation.
6.7.2. Because the sensitivity and linearity range increase with increasing cyanide concentration, it is important the cyanide concentration in the standard and analytical solutions be identical.
6.7.3. Analyze the reagent blank, a series of standards in the range of interest, and the samples. A freshly prepared standard should be analyzed after every five or six samples to monitor polarograph performance. Always rinse the electrodes with DI H2O and blot dry with a clean dry tissue before analyzing the next solution.
Withdrawn Provided for Historical Reference only
Note: OSHA no longer uses or supports this method (2021)
WITHDRAWN

14 of 30
7. Calculations7.1. Determine the µg/mL H2S content of each sample and blank using a concentration-
response linear regression curve (µA vs. µg/mL).
7.2. Calculate the total micrograms contained in each sample:µg H2S = [(Sample Vol, mL) x µg/mL H2S]
7.3. Each air sample is blank corrected (µg sample - µg blank) and the concentration is then calculated to determine H2S exposure using the following equation:
ppm H2S = MV x µg H2Sb Molecular Weight x (Air Volume, L)
WM
hVer
(eM::
olar Volume) = 24.45 (25 °C and 760 mmHg)
µg H2Sb = Blank corrected sample result
Molecular Weight (H2S) = 34.080
This equation reduces to:
ppm H2S = 0.717 x µg Sample (Air Volume, L)
7.4. Reporting Results Results are reported to the industrial hygienist as ppm H2S.
8. References8.1. National Institute for Occupational Safety and Health: NIOSH Manual of Analytical
Methods. 2nd ed., Vol. 2 (DHEW/NIOSH Pub. No. 77-157-B). Cincinnati, OH: National Institute for Occupational Safety and Health, 1977. pp. S4- 1-S4-10.
8.2. Natusch, D.F.S., H.B. Klonis, H.D. Axelrod, R.D. Teck and J.P. Lodge, Jr.: Sensitive Method for Measurement of Atmospheric Hydrogen Sulfide. Anal. Chem. 44: 2067-2070 (1972).
8.3. Natusch, D.F.S., J.R. Sewell and R.L. Tanner: Determination of Hydrogen Sulfide in Air -- An Assessment of Impregnated Paper Tape Methods. Anal. Chem. 46: 410- 415 (1974).
8.4. National Institute for Occupational Safety and Health: Criteria for a Recommended Standard-- Occupational Exposure to Hydrogen Sulfide (DHEW/NIOSH Pub. No. 77-158). Cincinnati, OH:National Institute for Occupational Safety and Health, 1977.
8.5. Fassett, D.W. and D.D. Irish, ed.: Patty's Industrial Hygiene and Toxicology. 2nd rev. ed., Vol. 2. New York: John Wiley and Sons, 1963.
8.6. Occupational Safety and Health Administration Technical Center: Hydrogen Sulfide Backup Data Report (ID-141). Salt Lake City, UT. Revised 1989.
8.7. Renard, J.J., G. Kubes and H.I. Bolker: Polarographic Determination of Sulfur Compounds in Pulping Liquors. Anal. Chem. 47: 1347-1352 (1975).
Withdrawn Provided for Historical Reference only
Note: OSHA no longer uses or supports this method (2021)
WITHDRAWN

15 of 30
8.8. Noel, D.L.: Sulfur Compounds in Kraft Pulping Liquor. Tappi 61: 73-76 (1978).
8.9. Occupational Safety and Health Administration Technical Center: Standard Operating Procedure for Polarography. Salt Lake City, UT. In progress (unpublished).
8.10. Princeton Applied Research: Application note 108, Why Dearation... and How. Princeton, NJ: Princeton Applied Research, 1974.
8.11. Ehman, D.L.: Determination of Parts-per-Billion Levels of Hydrogen Sulfide in Air by Potentiometric Titration with a Sulfide Ion-Selective Electrode as an Indicator. Anal. Chem. 48: 918-920 (1976).
Appendix
Preparation of H2S Sampling Devices - Impregnated Filters
Preparation of filter impregnation solution, 2% AgNO3
Reagents (All reagents should be reagent grade or better): Glycerin. Ethanol, absolute. Silver nitrate (AgNO3).
1. Dissolve 2 g AgNO3, in approximately 60 mL DI H2O contained in a glass beaker. Immediately transferthis solution to a 100-mL volumetric flask.
2. Pipette 1 mL of 1 N HNO3, 5 mL of glycerin, and 20 mL of ethanol into the 100-mL volumetric flask.Dilute the solution to volume with DI H2O.
3. Immediately transfer the AgNO3 solution to an amber polyethylene bottle. Store the bottle in a darkenvironment. The AgNO3 solution has at least a 6 month shelf-life.
Preparation of Impregnated Filters
Whatman No. 4 (Special Order, Whatman Labsales, Hillsboro, OR) cellulose filters (37-mm diameter) are impregnated with the AgNO3 solution described above. This filter is prepared as follows:
Withdrawn Provided for Historical Reference only
Note: OSHA no longer uses or supports this method (2021)
WITHDRAWN

16 of 30
1. Place the cellulose filter over one of the holes of a polypropylene test tube rack or scintillation vial supportrack. The rack should have hole diameters of 30-mm.
2. Using subdued light, pipette 250 µL of the AgNO3 impregnation solution on the filter.
3. Carefully transfer the filters and support to a dark environment and allow to dry at ambient temperaturefor approximately 120 min.
4. Handle the filters in subdued light.5. Store the filters together in a dark environment at normal lab temperatures in tightly covered
polystyrene petri dishes. Filters can be stored for at least 3 months.
Withdrawn Provided for Historical Reference only
Note: OSHA no longer uses or supports this method (2021)
WITHDRAWN

Hydrogen Sulfide
OSHA Method ID-141 Backup Revised December 1989
Introduction
The procedure for collection and analysis of air samples for hydrogen sulfide (H2S) is described in OSHA Method No. ID-141 (12.1). Briefly, H2S is collected on Whatman No. 4 filter paper (Special Order, Whatman Labsales, Hillsboro, OR) which has been impregnated with silver nitrate (AgNO3). The H2S reacts with AgNO3 to form silver sulfide, a greyish-black precipitate (12.2, 12.3). The silver sulfide is dissolved in an alkaline cyanide solution and then analyzed by differential pulse polarography (DPP) for sulfide.
1. Experimental Procedure
This method has been evaluated using a sampling rate of 0.2 L/min and a total air volume of 2 L.The OSHA Ceiling Permissible Exposure Limit (PEL) was 20 ppm when this evaluation wasperformed; therefore, concentrations of approximately 10, 20, and 40 ppm H2S were used for theevaluation. The evaluation followed the NIOSH protocol (12.4) for method evaluation with someexceptions and consisted of the following experiments:
1. An analysis of a total of 18 spiked samples (6 samples at each of three test levels) preparedby spiking known amounts of sodium sulfide.
2. An analysis of a total of 18 samples (6 samples at each of the three test levels) collectedfrom dynamically generated test atmospheres using a 2-L total air volume.
3. A determination of the collection efficiency and breakthrough of the AgNO3-impregnatedfilters at about 40 ppm.
4. A test of the storage stability of 18 collected samples.
5. A determination of the detection limit of the method.
6. A comparison of sampling and analytical methods.
7. An assessment of the precision and accuracy of the method.
8. An assessment of the method using an independent laboratory.
9. Conclusions - including a discussion of recent PEL changes for H2S.
Note: During this evaluation, all AgNO3-impregnated filter samples were taken using a sample collection flow rate of approximately 0.2 L/min. All generated samples were taken at an atmospheric pressure of approximately 640 mmHg and a temperature of 25.5 °C with the exception of the independent laboratory test (Section 10). These samples were taken at atmospheric conditions of approximately 761 mmHg and 21 °C.
2. Analysis
Samples were spiked and analyzed to determine analytical performance of the method and to assess desorption efficiency.
17 of 30
Withdrawn Provided for Historical Reference only
Note: OSHA no longer uses or supports this method (2021)
WITHDRAWN

18 of 30
Procedure: Samples were prepared by adding known amounts of a standardized sodium sulfide (Na2S) stock solution to AgNO3-impregnated Whatman 4 filters. Approximately 25, 50, and 100 µg (as H2S) were spiked. Details are discussed below.
2.1 A Na2S stock solution was prepared by dissolving and diluting 35.855 g of Na2S·9H2O to 500 mL with deoxygenated 0.1 M NaOH. The stock was standardized using the procedure listed in the method (12.1). This stock solution was equivalent to 10,175 µg/mL H2S. The solution was protected from light and stored in a refrigerator.
2.2 Silver nitrate-impregnated Whatman 4 filters were prepared as mentioned in reference 12.1.
2.3 The three sets of spiked samples were prepared by injecting known volumes of the standardized Na2S stock solution on the AgNO3-impregnated filters. The spiked filters were air dried in a dark environment for approximately 24 h prior to resorption. Each set contained six samples and a sample blank.
2.4 Sample solutions were prepared and analyzed for sulfide by DPP as described in reference 12.1 with one slight modification: Analytical standards were prepared by serial dilution of the standardized Na2S stock solution (10,175 µg/mL H2S) prepared in Section 2.1. Each sample was analyzed twice.
Results: The results of the spiked filter samples are given in Table 1. The desorption efficiency (DE) for each sample set analyzed was 0.923, 0.892 and 0.882, respectively. The DE at each level is significantly different from 1.0. The slightly low DE appeared to be due to difficulties in spiking the filters with the Na2S stock solution and not to problems in the desorption of analyte. Potential problems when spiking these solutions were noted:
1. Sodium sulfide is an unstable compound (12.5). Exposure of sodium sulfide crystals to airproduces H2S.
2. Aqueous solutions of Na2S are slowly converted to sodium thiosulfate (Na2S2O3) from standingin contact with air.
3. Sampling and Analysis
Procedure: To determine the ability of the method to sample and analyze for H2S, knownconcentrations of generated samples were prepared. Test atmospheres of H2S gas in this and allfollowing sections were dynamically generated by diluting H2S gas from a cylinder with purified humidair in a Teflon mixing tee. The cylinder concentration had been certified as 220 ± 5 ppm H2S innitrogen (Airco, Murray Hill, NJ). To verify the concentration of the cylinder, samples were taken andanalyzed using the NIOSH sampling and analytical method no. S4 (12.6) with some modifications.The procedure followed is listed below.
3.1 Three samples of H2S gas from the cylinder were collected in midget impingers containing 10 mLof a cadmium hydroxide/STRactan absorbing solution at approximately 0.1 L/min for 5 min. A backup impinger containing this solution was connected in series to each sample to assure no loss of analyte from breakthrough.
3.2 The samples were analyzed for sulfide content by the methylene blue calorimetric procedure (12.6). Standards were prepared from the Na2S stock solution prepared in Section 2.
3.3 No H2S was detected in the backup impinger of each sample (detection limit = 1.6 ppm H2S).
3.4 The average H2S concentration of the gas cylinder was 208 ± 14 ppm (95% confidence level). This experimental concentration did not significantly differ from the manufacturers' stated
Withdrawn Provided for Historical Reference only
Note: OSHA no longer uses or supports this method (2021)
WITHDRAWN

19 of 30
concentration of 220 ± 5 ppm. The stated value was used when calculating all theoretical (taken) results.
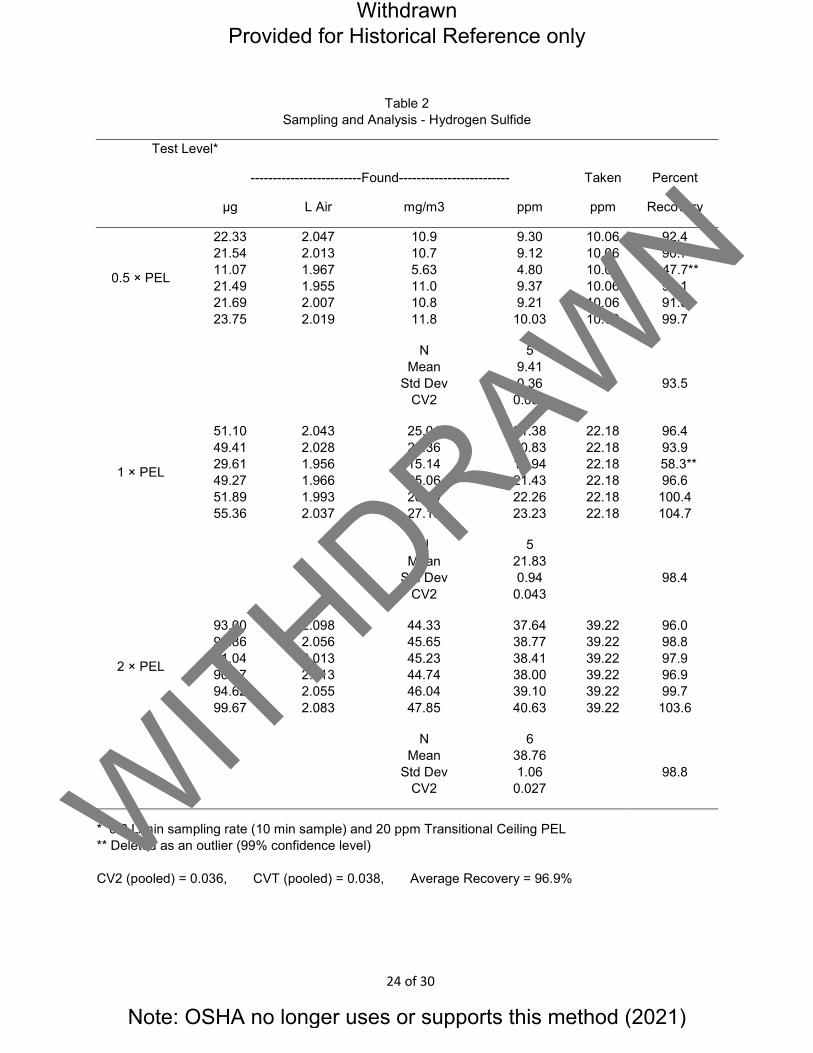
Test atmospheres were then generated using this gas and the generation system described in the Appendix. Six samples were simultaneously collected from the manifold for approximately 10 min. This was performed for each of the three test levels. The samples were collected on the AgNO3-impregnated filters with model C-210 portable sampling pumps (Mine Safety Appliances, Pittsburgh, PA) at high (85 to 88%) RH and 25.5 °C.
Results: The three sets of samples were analyzed twice by DPP using procedures described in the method (12.1). The results of the sampling and analysis experiment are shown in Table 2. A correction for DE was not performed on the results. The theoretical (taken) concentration of the generated gas was determined from the measured flow rates of the diluting air and the certified H2S gas from the cylinder at each test level. Two results were deleted as outliers since they failed to pass the outlier test at the 99% confidence level.
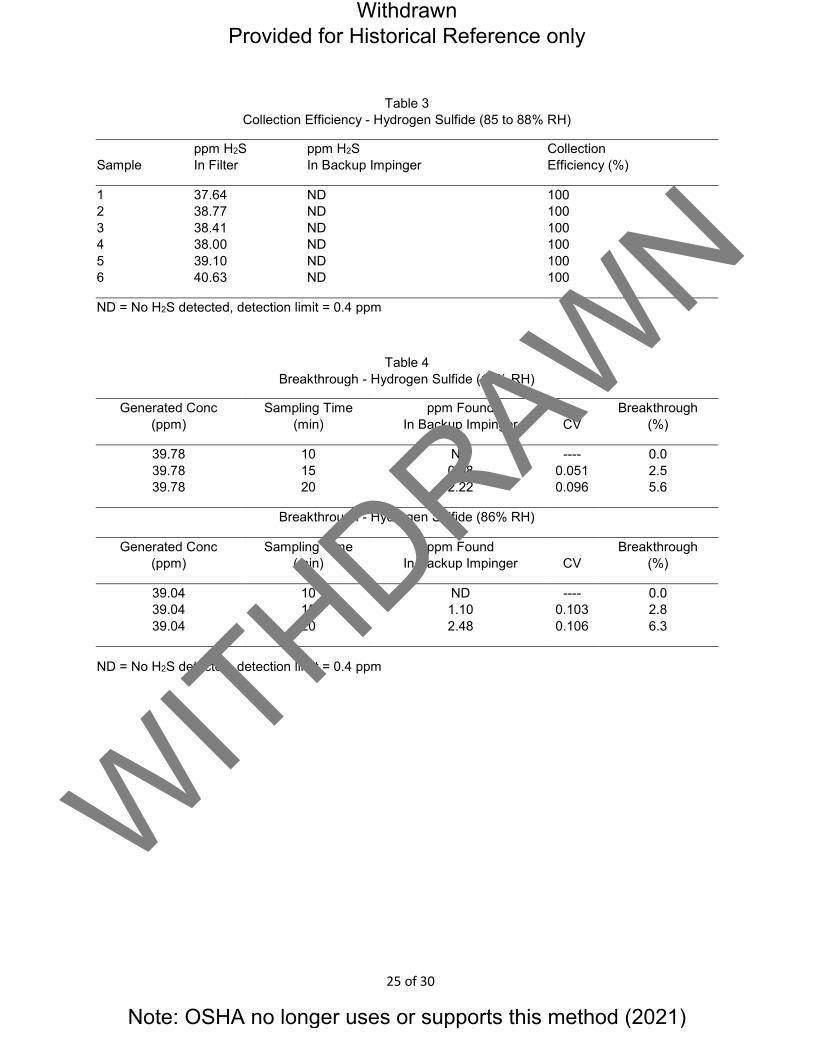
4. Collection Efficiency (CE)
Procedure: Six samples were simultaneously collected on AgNO3-impregnated filters which wereconnected in series to backup midget impingers containing 10 ml of a cadmium hydroxide/STRactanabsorbing solution. Samples were collected at high (85-88%) RH and 25.4 °C. The samples werecollected at a concentration of approximately 40 ppm for 10 min [Note: These were the same sampleswhich were generated and analyzed in the sampling and analysis experiment (Section 3) at about40 ppm]. The amounts of H2S collected in the filters and backup impingers were then measured.
Results: The CE of each filter sample was calculated by dividing the amount of H2S collected on thefilter by the total amount of H2S collected in the filter and backup impinger. The results are given inTable 3. The CE was 100%.
5. Breakthrough
Procedure: Two samples were simultaneously collected at approximately 40 ppm H2S for 10, 15,and 20 minutes. The generation system test atmospheres were produced at a low (18%) and then ahigh (86%) RH (25 °C) to determine any humidity effect on breakthrough. Each sample was collectedon a AgNO3-impregnated filter connected in series to a backup midget impinger containing 10 ml ofcadmium hydroxide/STRactan absorbing solution. The midget impinger samples were analyzed forsulfide content using NIOSH method no. S4 (12.6) for H2S with some modifications. Breakthrough ofH2S into the impinger solutions at a concentration greater than 5% of the amount generated wasconsidered significant.
Results: Breakthrough was determined for each sampling period by dividing the average amount ofH2S collected in the backup impingers by the known generated H2S concentration. The results arepresented in Table 4. Breakthrough of 6% occurred at both humidities and for a sampling period of20 min. Breakthrough was below 5% for shorter sampling periods.
6. Storage Stability
A study was conducted to assess the stability of H2S air samples collected on the AgNO3-impregnated filters.
Procedure: Three sets (6 samples and a blank sample in each set) of H2S samples were generatedusing AgNO3-impregnated filters as the collection media. The generation system was set at high (85-88%) RH and 25.5 °C. The samples were collected at approximately 20 ppm for 10 min. The sampleswere then stored in a dark environment at normal laboratory temperatures. A set of samples wasanalyzed after sample storage of 5, 14, and 30 days.
Withdrawn Provided for Historical Reference only
Note: OSHA no longer uses or supports this method (2021)
WITHDRAWN

20 of 30
Results: The results of the storage stability study are shown in Table 5 [Note: The six samples listed for the 0 day storage test are the same samples taken at 20 ppm for the sampling and analysis (Section 3) experiment]. The results indicate samples are stable for a period of at least 30 days when stored under normal lab temperatures and in a dark environment.
7. Detection Limit
Procedure: Standard solutions in 0.1 N NaOH were prepared by serial dilutions of a stock standardsolution of Na2S. The procedure used is identical to the preparation of working standards in themethod (12.1), with the exception that the concentrations used for this experiment were from 10.2 to203.5 ng/mL. Six standards at each concentration and six reagent blanks were prepared andanalyzed.
Results:
7.1 Qualitative Detection Limit
The analytical procedure requires the use of a blank subtraction software routine for each sample or standard. This routine sets any constant background signal to zero. Therefore, parametric or non-parametric tests which require measurable analytical signals from reagent blank samples could not be used to determine the qualitative detection limit (12.7). The qualitative limit was estimated from results in Table 6 to be 0.020 µg/mL or 1.0 µg of H2S in a 50 ml sample extraction volume. This corresponds to 0.4 ppm H2S (2-L air volume). The coefficient of variation (CV) of replicate determinations of standards at this level was 0.128. Concentrations of H2S below 0.020 µg/mL were not consistently resolved when analyzed.
7.2 Quantitative Detection Limit
The quantitative detection limit is 0.050 µg/mL or 2.5 µg of H2S in a 50 ml sample extraction volume. This corresponds to 0.9 ppm H2S (2-L air volume). As shown in Table 6, the CV of replicate determinations of standards at this concentration is less than 0.10.
8. Method Comparison
A side-by-side method comparison was performed as an independent measurement of the generatedconcentrations. The NIOSH sampling and analytical method no. S4 (12.6) was used with somemodifications. The samples for the NIOSH method were taken simultaneously with impregnated filtersamples during the sampling and analysis experiment (Section 3).
Procedure: Six samples (NIOSH method) of the test atmosphere were simultaneously collected fromthe sampling manifold for approximately 10 min at a flow rate of 0.2 L/min at each of the three testlevels. Each set of six samples was concurrently collected with the filter samples at that testconcentration. The procedures used for the NIOSH method are listed below.
8.1 Samples were collected in midget impingers containing 10 ml of a cadmium hydroxide/STRactanabsorbing solution with MSA Model C-210 portable sampling pumps.
8.2 The samples were analyzed for their sulfide content by the methylene blue colorimetric procedure with standards prepared from the standardized Na2S stock solution.
Results: The average H2S concentration (95% confidence level) determined in each set of impinger samples is:
Withdrawn Provided for Historical Reference only
Note: OSHA no longer uses or supports this method (2021)
WITHDRAWN
21 of 30
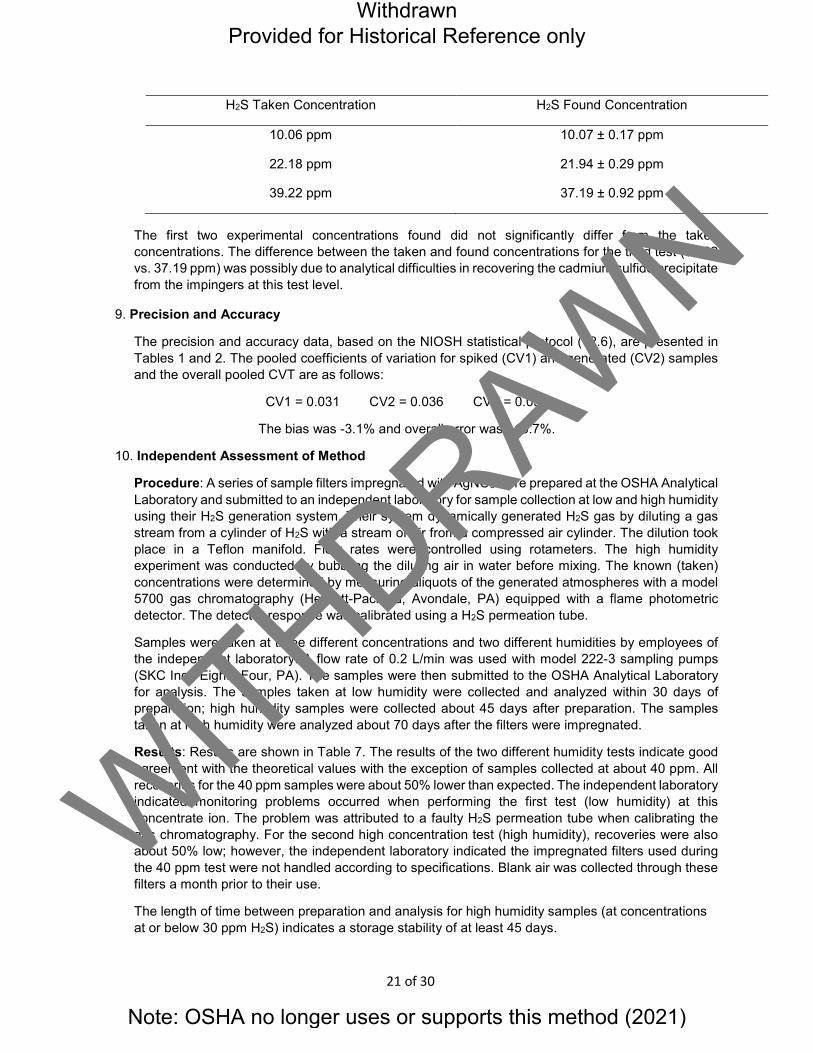
H2S Taken Concentration H2S Found Concentration
10.06 ppm 10.07 ± 0.17 ppm
22.18 ppm 21.94 ± 0.29 ppm
39.22 ppm 37.19 ± 0.92 ppm
The first two experimental concentrations found did not significantly differ from the taken concentrations. The difference between the taken and found concentrations for the third test (39.22 vs. 37.19 ppm) was possibly due to analytical difficulties in recovering the cadmium sulfide precipitate from the impingers at this test level.
9. Precision and Accuracy
The precision and accuracy data, based on the NIOSH statistical protocol (12.6), are presented inTables 1 and 2. The pooled coefficients of variation for spiked (CV1) and generated (CV2) samplesand the overall pooled CVT are as follows:
CV1 = 0.031 CV2 = 0.036 CVT = 0.038
The bias was -3.1% and overall error was ±10.7%.
10. Independent Assessment of Method
Procedure: A series of sample filters impregnated with AgNO3 were prepared at the OSHA AnalyticalLaboratory and submitted to an independent laboratory for sample collection at low and high humidityusing their H2S generation system. Their system dynamically generated H2S gas by diluting a gasstream from a cylinder of H2S with a stream of air from a compressed air cylinder. The dilution tookplace in a Teflon manifold. Flow rates were controlled using rotameters. The high humidityexperiment was conducted by bubbling the diluting air in water before mixing. The known (taken)concentrations were determined by measuring aliquots of the generated atmospheres with a model5700 gas chromatography (Hewlett-Packard, Avondale, PA) equipped with a flame photometricdetector. The detector response was calibrated using a H2S permeation tube.
Samples were taken at three different concentrations and two different humidities by employees ofthe independent laboratory. A flow rate of 0.2 L/min was used with model 222-3 sampling pumps(SKC Inc., Eighty Four, PA). The samples were then submitted to the OSHA Analytical Laboratoryfor analysis. The samples taken at low humidity were collected and analyzed within 30 days ofpreparation; high humidity samples were collected about 45 days after preparation. The samplestaken at high humidity were analyzed about 70 days after the filters were impregnated.
Results: Results are shown in Table 7. The results of the two different humidity tests indicate goodagreement with the theoretical values with the exception of samples collected at about 40 ppm. Allrecoveries for the 40 ppm samples were about 50% lower than expected. The independent laboratory indicated monitoring problems occurred when performing the first test (low humidity) at thisconcentrate ion. The problem was attributed to a faulty H2S permeation tube when calibrating thegas chromatography. For the second high concentration test (high humidity), recoveries were alsoabout 50% low; however, the independent laboratory indicated the impregnated filters used duringthe 40 ppm test were not handled according to specifications. Blank air was collected through thesefilters a month prior to their use.
The length of time between preparation and analysis for high humidity samples (at concentrationsat or below 30 ppm H2S) indicates a storage stability of at least 45 days.
Withdrawn Provided for Historical Reference only
Note: OSHA no longer uses or supports this method (2021)
WITHDRAWN

22 of 30
11. Conclusions
This sampling and analytical method has been shown to be precise and accurate for determiningCeiling exposures of 10 to 40 ppm when using 0.2 L/min flow rates for 10 to 15 min. To determinecompliance with the Final Rule STEL of 15 ppm H2S, the same sampling and analytical conditionscan be used.
Storage stability did not pose a significant problem under the conditions tested. Breakthrough wasevident after 20 min of sampling at 40 ppm which places a limitation on sampling. Due to the potentialfor breakthrough, it is recommended to sample for TWA exposures at a lower flow rate of 0.1 L/min.Eight 1-h samples are recommended for TWA assessments of H2S. Samples taken near the TWAPEL of 10 ppm (0.1 L/min for 1 h) will have the same total amount collected as the samples collectedat 20 ppm (0.2 L/min for 15 min). Therefore, at the lower flow rate the method should not exhibit anysignificant sample collection problems when determining TWA exposures.
12. References
12.1 Occupational Safety and Health Administration Technical Center: Hydrogen Sulfide inWorkplace Atmospheres by T. Wilczek (USDOL/OSHA-SLTC Method No. ID-141). Salt Lake City, UT. Revised 1989.
12.2 Natusch, D.F.S., H.B. Klonis, H.D. Axelrod, R.D. Teck, and J.P. Lodge, Jr.: Sensitive Method for Measurement of Atmospheric Hydrogen Sulfide. Anal. Chem. 44: 2067-2070 (1972).
12.3 Natusch, D. F. S., J.R. Sewell, and R.L. Tanner: Determination of Hydrogen Sulfide in Air -- An Assessment of Impregnated Paper Tape Methods. Anal. Chem. 46: 410-415 (1974).
12.4 National Institute for Occupational Safety and Health: Documentation of the NIOSH Validation Tests by D. Taylor, R. Kupel and J. Bryant (DHEW/NIOSH Pub. No. 77-185). Cincinnati, OH: National Institute for Occupational Safety and Health, 1977.
12.5 Windholz, H., ed.: The Merck Index. 9th ed. Rahway, NJ: Merck & Co., Inc., 1976.
12.6 National Institute for Occupational Safety and Health: NIOSH Manual of Analytical Methods. 2nd ed., Vol. 2 (DHEW/NIOSH Pub. No. 77-157-B). Cincinnati, OH: National Institute for Occupational Safety and Health, 1977. pp. S4-1-S4-100.
12.7 Occupational Safety and Health Administration Analytical Laboratory: OSHA Analytical Methods Manual (USDOL/OSHA-SLCAL Method No. ID-102 (Backup Report)). Cincinnati, OH: American Conference of Governmental Industrial Hygienists (Pub. No. ISBN: 0-936712-66-X), 1985.
Withdrawn Provided for Historical Reference only
Note: OSHA no longer uses or supports this method (2021)
WITHDRAWN

23 of 30
Table 1 Analysis - Hydrogen Sulfide
---------0.5 × PEL*--------- ---------1 × PEL*--------- ---------2 × PEL*---------
µg Taken
µg Found DE
µg Taken
µg Found DE
µg Taken
µg Found DE
25.44 25.44 25.44 25.44 25.44 25.44
22.77 23.28 22.82 22.92 24.27 24.89
0.895 0.915 0.897 0.901 0.954 0.978
50.88 50.88 50.88 50.88 50.88 50.88
43.37 44.89 46.71 46.26 45.59 45.58
0.852 0.882 0.918 0.909 0.896 0.896
101.8 101.8 101.8 101.8 101.8 101.8
85.57 88.53 89.96 91.92 92.74 90.06
0.841 0.870 0.884 0.903 0.911 0.885
N Mean
Std Dev CV1
6 0.923 0.035 0.038
6 0.892 0.023 0.026
6 0.882 0.030 0.028
* When using a 0.2 L/min sampling rate for 10 min and comparing results to the Transitional Ceiling PELof 20 ppm.
CV1 (pooled) = 0.031
Withdrawn Provided for Historical Reference only
Note: OSHA no longer uses or supports this method (2021)
WITHDRAWN
24 of 30
Table 2 Sampling and Analysis - Hydrogen Sulfide
Test Level*
-------------------------Found------------------------- Taken Percent
µg L Air mg/m3 ppm ppm Recovery
0.5 × PEL
22.33 21.54 11.07 21.49 21.69 23.75
2.047 2.013 1.967 1.955 2.007 2.019
10.9 10.7 5.63 11.0 10.8 11.8
9.30 9.12 4.80 9.37 9.21
10.03
10.06 10.06 10.06 10.06 10.06 10.06
92.4 90.7
47.7** 93.1 91.6 99.7
N Mean
Std Dev CV2
5 9.41 0.36
0.038 93.5
1 × PEL
51.10 49.41 29.61 49.27 51.89 55.36
2.043 2.028 1.956 1.966 1.993 2.037
25.01 24.36 15.14 25.06 26.04 27.18
21.38 20.83 12.94 21.43 22.26 23.23
22.18 22.18 22.18 22.18 22.18 22.18
96.4 93.9
58.3** 96.6 100.4 104.7
N Mean
Std Dev CV2
5 21.83 0.94
0.043 98.4
2 × PEL
93.00 93.86 91.04 90.07 94.62 99.67
2.098 2.056 2.013 2.013 2.055 2.083
44.33 45.65 45.23 44.74 46.04 47.85
37.64 38.77 38.41 38.00 39.10 40.63
39.22 39.22 39.22 39.22 39.22 39.22
96.0 98.8 97.9 96.9 99.7 103.6
N Mean
Std Dev CV2
6 38.76 1.06
0.027 98.8
* 0.2 L/min sampling rate (10 min sample) and 20 ppm Transitional Ceiling PEL** Deleted as an outlier (99% confidence level)
CV2 (pooled) = 0.036, CVT (pooled) = 0.038, Average Recovery = 96.9%
Withdrawn Provided for Historical Reference only
Note: OSHA no longer uses or supports this method (2021)
WITHDRAWN
25 of 30
Table 3 Collection Efficiency - Hydrogen Sulfide (85 to 88% RH)
Sample ppm H2S In Filter
ppm H2S In Backup Impinger
Collection Efficiency (%)
1 2 3 4 5 6
37.64 38.77 38.41 38.00 39.10 40.63
ND ND ND ND ND ND
100 100 100 100 100 100
ND = No H2S detected, detection limit = 0.4 ppm
Table 4 Breakthrough - Hydrogen Sulfide (18% RH)
Generated Conc (ppm)
Sampling Time (min)
ppm Found In Backup Impinger CV
Breakthrough (%)
39.78 39.78 39.78
10 15 20
ND 0.98 2.22
---- 0.051 0.096
0.0 2.5 5.6
Breakthrough - Hydrogen Sulfide (86% RH)
Generated Conc (ppm)
Sampling Time (min)
ppm Found In Backup Impinger CV
Breakthrough (%)
39.04 39.04 39.04
10 15 20
ND 1.10 2.48
---- 0.103 0.106
0.0 2.8 6.3
ND = No H2S detected, detection limit = 0.4 ppm
Withdrawn Provided for Historical Reference only
Note: OSHA no longer uses or supports this method (2021)
WITHDRAWN

26 of 30
Table 5 Storage Stability Test - Hydrogen Sulfide
Storage Day ------------------------Found------------------------ Taken Percent
µg L Air mg/m3 ppm ppm Recovery
0
51.10 49.41 29.61 49.27 51.89 55.36
2.043 2.028 1.956 1.966 1.993 2.037
25.01 24.36 15.14* 25.06 26.04 27.18
21.38 20.83 12.94* 21.43 22.26 23.23
22.18 22.18 22.18 22.18 22.18 22.18
96.4 93.9 58.3* 96.6 100.4 104.7
N Mean
Std Dev CV
5 21.83 0.94
0.043 98.4
5
44.00 49.63 45.92 47.76 47.51 46.88
1.960 2.114 1.987 2.073 2.070 2.041
22.45 23.48 23.11 23.04 22.95 22.97
19.32 20.20 19.88 19.83 19.75 19.76
20.28 20.28 20.28 20.28 20.28 20.28
95.3 99.6 98.0 97.8 97.4 97.4
N Mean
Std Dev CV
6 19.79 0.28
0.014 98.4
14
45.46 48.65 45.56 47.55 49.17 48.92
1.947 2.099 1.971 2.073 2.051 2.026
23.35 23.18 23.12 22.94 23.97 24.15
19.98 19.83 19.78 19.63 20.51 20.66
20.30 20.30 20.30 20.30 20.30 20.30
98.4 97.7 97.4 96.7 101.0 101.8
N Mean
Std Dev CV
6 20.07 0.42
0.021 98.8
30
49.24 52.14 49.29 49.82 50.70 50.78
2.028 2.177 2.042 2.144 2.134 2.104
24.28 23.95 24.14 23.24 23.76 24.14
20.89 20.60 20.76 19.99 20.44 20.76
20.28 20.28 20.28 20.28 20.28 20.28
103.0 101.6 102.4 98.6 100.8 102.4
N Mean
Std Dev CV
6 20.57 0.32
0.016 101.4
* Deleted as an outlier.
Withdrawn Provided for Historical Reference only
Note: OSHA no longer uses or supports this method (2021)
WITHDRAWN

27 of 30
Table 6 Quantitative Detection Limit - Hydrogen Sulfide
----------------------------Amount of Hydrogen Sulfide---------------------------
-----10.2 ng/mL----- -----20.4 ng/mL----- -----50.9 ng/mL-----
Sample No.
ng/mL found
response (µA)
ng/mL found
response (µA)
ng/mL found
response (µA)
1 2 3 4 5
8.5 7.3 -
9.5 -
0.0198 0.0159
ND 0.0228
ND
19.5 24.2 22.2 20.3 17.9
0.0527 0.0669 0.0607 0.0553 0.0481
51.8 51.2 54.1 51.9 53.3
0.1473 0.1455 0.1538 0.1475 0.1515
ND = None detected
N Mean
Std Dev CV
5 - - -
5 - - -
5 20.8 2.4
0.117
5 0.0567 0.0073 0.128
5 52.5 1.2
0.023
5 0.1491 0.0034 0.023
---------------------Amount of Hydrogen Sulfide--------------------
-----101.8 ng/mL----- -----203.5 ng/mL-----
Sample No.
ng/mL found
response (µA)
ng/mL found
response (µA)
1 2 3 4 5
100.6 100.4 102.2 98.9 100.5
0.2814 0.2810 0.2857 0.2769 0.2812
206.0 207.4 212.4 198.8 194.3
0.5370 0.5400 0.5510 0.5210 0.5110
N Mean
Std Dev CV
5 100.5 1.7
0.012
5 0.2812 0.0031 0.011
5 203.9 7.2
0.035
5 0.5320 0.0159 0.030
Withdrawn Provided for Historical Reference only
Note: OSHA no longer uses or supports this method (2021)
WITHDRAWN

28 of 30
Table 7 Independent Laboratory Assessment of Method at Low Humidity
Hydrogen Sulfide
----------------Found--------------- Taken Percent Sample # µg L Air mg/m3 ppm ppm Recovery
5 6 7 8 9 10
16.36 36.72 34.12 31.86 33.72 31.81
2 2 2 2 2 2
8.18* 18.36 17.06 15.93 16.86 15.90
5.78* 12.98 12.06 11.26 11.92 11.24
10 10 10 10 10 10
57.9 129.8 120.6 112.6 119.2 112.4
N Mean
Std Dev CV
5 11.89 0.71 0.060
118.9 7.1
11 12 13 14 15 16
59.15 58.23 58.23 55.87 56.71 55.18
2 2 2 2 2 2
29.58 29.12 29.12 27.94 28.36 27.59
20.91 20.58 20.58 19.75 20.05 19.50
20 20 20 20 20 20
104.6 102.9 102.9 98.8
100.2 97.5
N Mean
Std Dev CV
6 20.23 0.55 0.027
101.1 2.7
Results for six samples taken at 40 ppm H2S and under the same conditions gave recoveries about 50% lower than theoretical; however, generation system problems were discovered and the lower recovery was attributed to a faulty H2S permeation tube used to calibrate the GC. The GC was used to monitor and determine the known concentration of the generation.
*Deleted as an outlier.
Withdrawn Provided for Historical Reference only
Note: OSHA no longer uses or supports this method (2021)
WITHDRAWN

29 of 30
These samples were taken at atmospheric conditions of 761 mmHg and 21 °C.
----------------Found--------------- Taken Percent Sample # µg L Air mg/m3 ppm ppm Recovery
1 2 3 4 5 6
32.2 29.4 37.5 35.7 38.5 36.3
2 2 2 2 2 2
16.1 14.7 18.8 17.8 19.2 18.2
11.4 10.4 13.3 12.6 13.6 12.9
12 12 12 12 12 12
95.0 86.7
110.8 105.0 113.3 107.5
N Mean
Std Dev CV
6 12.4 1.2
0.098
103.3 10.1
7 8 9 10 11 12
91.5 93.1 85.5 88.6 97.0 86.3
2 2 2 2 2 2
45.8 46.6 42.8 44.3 48.5 43.2
32.4 32.9 30.2 31.3 34.3 30.5
30 30 30 30 30 30
108.0 109.7 100.7 104.3 114.3 101.7
N Mean
Std Dev CV
3 31.9 1.6
0.048
106.3 5.2
Results for three samples taken at about 38 ppm H2S and under the same conditions gave recoveries about 50% lower than theoretical; however, the sampling media had been incorrectly handled prior to sample collection and the lower recovery was attributed to improper handling.
These samples were taken at atmospheric conditions of 761 mmHg and 21 °C.
Appendix
Generation System for Producing Dynamic Test Atmospheres of Hydrogen Sulfide
A generation system was designed such that the H2S gas and diluent air were connected to a mixing tee which was then connected to a sampling manifold. The diluent air was conditioned to the RH and temperature required for the particular experiment. Details of the system are listed below.
A. Description of equipment used to monitor and control gases.
1. The flow rate, temperature, and RH of the diluent air were controlled with a model HCS-201 MassFlow, Temperature, and Humidity Control System (Miller-Nelson Research Inc., Monterey, CA).The humidity and temperature of the air were measured with a model 400D % RelativeHumidity/Temperature Monitor (General Eastern, Watertown, MA).
2. The flow rate of the H2S gas was controlled with mass flow controllers (Tylan Corp., Carson, CA).
Withdrawn Provided for Historical Reference only
Note: OSHA no longer uses or supports this method (2021)
WITHDRAWN

30 of 30
3. The flow rate of the H2S gas and the air were measured just prior to and just after sampling. Theflow rate of the H2S gas was measured with a model 823-1 Electronic Bubble Flowmeter (MastDevelopment Co., Davenport, IA). The flow rate of the humid air was measured with a dry testgas meter
B. Description of sampling manifold and connective tubing:
1. A 12-port sampling manifold was constructed from Teflon tubing and fittings. There were sixsampling ports located on opposite sides of the sampling manifold.
2. The sampling manifold was directly connected to a Teflon mixing tee by means of Teflon tubingand Teflon L fittings.
3. The sampling devices were attached to the manifold with Teflon tubing and to the samplingpumps with Tygon tubing.
4. All other connective tubing and fittings were made of stainless steel or Teflon to avoid anycontamination problems.
Withdrawn Provided for Historical Reference only
Note: OSHA no longer uses or supports this method (2021)
WITHDRAWN
Copyright © 2022 FDOKUMEN