Fundamentals of Hydrogen Sulfide Removal from Gaseous ...
250
UNIVERSITY OF CALIFORNIA Los Angeles Fundamentals of Hydrogen Sulfide Removal from Gaseous Streams via Reactive Sorption with Copper Oxide A dissertation submitted in partial satisfaction of the requirements for the degree Doctor of Philosophy in Chemical Engineering by Sara Azzam 2020
-
Upload
khangminh22 -
Category
Documents
-
view
2 -
download
0
Transcript of Fundamentals of Hydrogen Sulfide Removal from Gaseous ...

UNIVERSITY OF CALIFORNIA
Los Angeles
Fundamentals of Hydrogen Sulfide Removal from Gaseous Streams via Reactive
Sorption with Copper Oxide
A dissertation submitted in partial satisfaction of the requirements for the degree Doctor
of Philosophy in Chemical Engineering
by
Sara Azzam
2020


ii
ABSTRACT OF THE DISSERTATION
Fundamentals of Hydrogen Sulfide Removal from Gaseous Streams via Reactive Sorption with
Copper Oxide
by
Sara Azzam
Doctor of Philosophy in Chemical Engineering
University of California, Los Angeles, 2020
Professor Dante Simonetti, Chair
Hydrocarbon streams derived from natural gas and petroleum processing contain high
concentrations of hydrogen sulfide (H2S) which is corrosive to process equipment, detrimental to
product quality, and harmful to human health and the environment. Reaction of trace
concentrations (<100 ppm) of sulfur compounds in natural gas streams with copper oxide (CuO)
to form environmentally benign copper sulfides is an effective method to purify these streams.
Such reactive sorption processes are advantageous because they are thermodynamically more
favorable than physisorption, leading to higher purity streams and higher solid phase contaminant
capacities. However, the primary drawbacks to reactive sorption systems are incomplete
conversion of the copper oxide phase and slow kinetics, which detrimentally impact their industrial
use by necessitating continuous process shutdowns to reload the reactors or/and over-sized beds.
Moreover, most current predictive models lack the detail to fully capture the important reaction-
diffusion phenomena associated with reactive sorption at the molecular level. Thus, the

iii
extrapolation of these models across a broad range of conditions is difficult. Motivated by these
considerations, the overall goal of this project is to combine advanced characterization experiments
at the atomic level with intrinsic reaction kinetic data at the reactor level to create microkinetic
descriptions that relate reaction mechanisms of sulfur-containing molecules to the chemical and
structural changes of CuO-based materials. This multi-scale research approach (atoms, crystals,
pellets, reactor) exhibits a significant departure from traditional approaches that focus on either
iterative materials screening or simplified reactor modeling.
This project has unraveled the following fundamental insights about the CuO-H2S
reactions: i) CuO-based materials with decreasing extents of crystallinity contain high
concentration of oxygen vacancies which results in higher extent of conversion due to the slower
rates of molecule dissociation and increased diffusivities of sulfur atoms, oxygen atoms, and/or
reactant molecules within the solid phases. ii) The Cu2-xSx products change over the course of the
reaction due to changes in the electronic and coordination environments of the interfacial disulfide
groups, with products resembling covellite (CuS) as the conversion increases. iii) The introduction
of foreign atoms to CuO lattice (Zn and La atoms) enhances CuO sulfidation conversions by
disrupting the CuO lattice and forming vacancies for the diffusion of sulfur and oxygen atoms, and
by donating electron density to Cu2+ centers and consequently weakening the Cu-O bonds and
making them more susceptible to rapture and reaction with sulfur moieties. Finally, the project
highlights the utility of using fixed bed tests and simple linear driving force models to describe the
surface reaction/diffusion phenomena contingent on operating at conditions where bulk and pore
diffusion resistances are minimal. These insights, among others, are critical for the rational design
of high capacity reactive sorbents and for the optimal operation of the desulfurization processes at
conditions that approach their thermodynamic limits.

iv
The dissertation of Sara Azzam is approval by:
Panagiotis D. Christofides
Vasilios Manousiouthakis
Louis Bouchard
Dante A. Simonetti, Committee Chair
University of California, Los Angeles
2020

v
This dissertation is dedicated to my parents who taught
me kindness, patience, and perseverance and
to my late grandmother, who survived six wars but
never lost faith in love, life, and humanity.

vi
TABLE OF CONTENTS
Chapter 1 | Overview .................................................................................................................... 1
Chapter 2 | Background ............................................................................................................... 4
2.1 Reaction Engineering Descriptions ...................................................................................... 6
2.1.1 Pellet scale models ....................................................................................................... 7
2.1.2 Reactor models ............................................................................................................. 9
2.2 Materials development approach ........................................................................................ 11
2.3 Advanced characterization for mechanism and active site identification ........................... 15
2.4 DFT and quantum chemistry utility in describing reactive sorption processes .................. 20
2.4.1 DFT computational studies for the sulfidation of ZnO-based sorbents ..................... 21
2.4.2 DFT computational studies for the sulfidation of CuO-based sorbents ..................... 25
2.4.3 DFT computational studies for sulfidation of less common metal oxide sorbents .... 31
Chapter 3 | Linear Driving Force Approximations as Predictive Models for Reactive
Sorption ........................................................................................................................................ 34
3.1 Introduction ......................................................................................................................... 34
3.2 Experimental Methods ........................................................................................................ 35
3.2.1 Materials and characterization ................................................................................... 35
3.2.2 Fixed-bed experiments ............................................................................................... 36
3.2.3 Cooper and Bohart-Adams models development ....................................................... 37
3.3 Results and Discussion ....................................................................................................... 41
3.3.1 Identification of reaction products and effects of sulfidation on sorbent morphology
............................................................................................................................................. 41
3.3.2 Effects of reactor contact time and sorbent agglomerate size on capacity and rate ... 47
3.3.3 Effects of temperature, concentration, and pressure .................................................. 51
3.4 Study Conclusions .............................................................................................................. 56
Chapter 4 | Effects of Morphology and Surface Properties of Copper Oxide on the Removal
of Hydrogen Sulfide from Gaseous Streams ............................................................................ 58
4.1 Introduction ......................................................................................................................... 58
4.2 Experimental Methods ........................................................................................................ 60
4.2.1 Materials and synthesis methods ................................................................................ 60
4.2.2 Characterization ......................................................................................................... 64
4.2.3 Fixed-bed experiments ............................................................................................... 65
4.2.4 Computational study .................................................................................................. 66

vii
4.3 Results and Discussion ....................................................................................................... 67
4.3.1 Physio-chemical properties of CuO materials ............................................................ 67
4.3.2 Effect of crystallite size on H2S removal ................................................................... 76
4.3.3 Influence of carbon-based residues on H2S removal.................................................. 87
4.4 Conclusions ......................................................................................................................... 88
Chapter 5 | Fundamentals of the Remediation of Sulfur from Gaseous Streams using
Copper Oxide .............................................................................................................................. 90
5.1 Introduction ......................................................................................................................... 90
5.2 Experimental Methods ........................................................................................................ 91
5.2.1 Materials and synthesis methods ................................................................................ 91
5.2.2 Fixed-bed experiments ............................................................................................... 92
5.2.3 Non-synchrotron characterization techniques ............................................................ 92
5.2.4 Synchrotron-based X-ray characterization ................................................................. 93
5.2.5 XAFS data processing and analysis ........................................................................... 97
5.2.6 Random pore model development .............................................................................. 98
5.3 Results and Discussion ..................................................................................................... 100
5.3.1 Non-synchrotron characterization ............................................................................ 100
5.3.2 Fixed bed sorption experiments ............................................................................... 102
5.3.3 Sulfidation kinetics from bulk XAS measurements ................................................. 103
5.3.4 Sulfidation kinetics of individual particles via TXM ............................................... 106
5.4 Conclusion ........................................................................................................................ 110
Chapter 6 | Insights into Copper Sulfide Formation from Cu and S K-edge XAS and DFT
Studies ........................................................................................................................................ 111
6.1 Introduction ....................................................................................................................... 111
6.2 Experimental Methods ...................................................................................................... 114
6.2.1 Materials and synthesis methods .............................................................................. 114
6.2.2 Non-synchrotron characterization techniques .......................................................... 116
6.2.3 Fixed bed sulfidation tests ........................................................................................ 116
6.2.4 XAS acquisition and analysis ................................................................................... 117
6.2.5 DFT computational study ......................................................................................... 121
6.3 Results and Discussion ..................................................................................................... 121
6.3.1 Structural characterization of fresh CuO sorbents ................................................... 121
6.3.2 Determination of sorption capacities and kinetics from various techniques ............ 125
6.3.3 Speciation of sulfidation products ............................................................................ 129
viii
6.3.4 Impact of CuS structure on reaction mechanism...................................................... 137
6.4 Conclusion ........................................................................................................................ 143
Chapter 7 | Lanthanum Induced Weakening of Lattice Copper-Oxygen Bonds Improves
Hydrogen Sulfide Capacities of Copper Oxide Adsorbents .................................................. 145
7.1 Introduction ....................................................................................................................... 145
7.2 Experimental Methods ...................................................................................................... 147
7.2.1 Materials ................................................................................................................... 147
7.2.2 Fixed bed sulfidation tests ........................................................................................ 148
7.2.3 Non-synchrotron characterization techniques .......................................................... 149
7.2.4 Synchrotron-based characterization ......................................................................... 150
7.3 Results and Discussion ..................................................................................................... 151
7.3.1 Effects of nominal La content and synthesis method on sorbents removal capacity 151
7.3.2 Physio-Chemical properties of La-CuO sorbents identified via non-synchrotron-
based techniques ................................................................................................................ 154
7.3.3 Multi-edge XAS study of changes in chemical environment .................................. 159
7.3.4 Bulk kinetics using in-situ XAS and fixed bed experiments ................................... 166
7.4 Conclusion ........................................................................................................................ 170
Chapter 8 | Conclusions ............................................................................................................ 172
Supplementary Information for Chapter 2 ..................................................... 179
Supplementary Information for Chapter 3 ..................................................... 186
Supplementary Information for Chapter 4 ..................................................... 187
Supplementary Information for Chapter 5 ..................................................... 189
Supplementary Information for Chapter 6 ..................................................... 192
Supplementary Information for Chapter 7 ..................................................... 202
Bibliography .............................................................................................................................. 206

ix
LIST OF FIGURES
Figure 2-1: Possible reaction stoichiometries for sulfur compounds with different metal oxides. 5
Figure 2-2: Model representations of an individual pellet undergoing sulfidation for A. Grain
model and B. Random pore model adapted from Ramachandran et al.27 and Bhatia et al.19
compared to C. In situ mapping of CuO particles undergoing sulfidation figure from Hoffman et
al..28 ................................................................................................................................................. 9
Figure 2-3: Decrease in sulfur removal efficiency due to formation of a ZnS outer layer that
impedes access to inner ZnO. ....................................................................................................... 16
Figure 2-4: Model structure of four metal oxide surfaces commonly studied. They are ZnO(0001),
CuO(111), CeO2 (111), and MgO(001), in order of most to least discussed in this review. ........ 21
Figure 2-5: Illustration for the reaction mechanism of H2S molecules on CuO surfaces referenced
in the computational studies in literature.134–136 ............................................................................ 26
Figure 3-1: Demonstration of the three levels of the process of H2S removal in a bed of a CuO-
based sorbent: Packed bed, pellet and grain levels. ...................................................................... 34
Figure 3-2: Schematic of fixed-bed reactive sorption testing apparatus ....................................... 37
Figure 3-3: SEM image of the CuO-based sorbent (75-125-micron pellets; 120-200-mesh) at 100x
and a particle size distribution analysis of the sorbent generated by ImageJ software. ................ 42
Figure 3-4: SEM images of fresh CuO-based sorbent (75-125-micron pellets; 120-200-mesh) at
10000 x magnification in A and C and 15,000 x magnification in B and D. A-B scans are of fresh
materials while C-D set are taken after sulfidation with 110 cm3(STP) min-1 of 930 ppm-vol
H2S/N2 stream at temperature of 294 K and 1.0 atm pressure. Arrows point to cracks in the particles
that form after sulfidation. ............................................................................................................ 43
Figure 3-5: Energy Dispersive Spectroscopy (EDS) elemental maps (oxygen, aluminium, copper,
and zinc) for a 120-micron pellet of the CuO-based sorbent based on an SEM scan at 1000 x
magnification (top panel). ............................................................................................................. 45
Figure 3-6: Diffraction patterns of fresh CuO-based sorbent and spent samples at 294, 323, 338,
353, 368, 383 K after sulfidation with 110 cm3(STP) min-1 of 970-1016 ppm-vol H2S/N2 at ambient
temperature (294 K) and pressure (1.0 atm). The triangles correspond to characteristic CuO peaks
and the diamonds correspond to characteristic sulfur peaks. ........................................................ 46
Figure 3-7: Tracer experiment to verify short delay time for the sulfidation tests. 150 mg of inert
alumina (Al2O3) bed and a feed of 1000 ppm-vol H2S/N2 were used at a flowrate of 100 sccm. 47
Figure 3-8: Effect of varying contact time on maximum saturation capacity, qs, for fixed beds of
CuO-based sorbent at 1000 ppm-vol H2S/N2, 294 K and 1.0 atm. Different color codes are assigned
to different pellet sizes. ................................................................................................................. 48

x
Figure 3-9: Breakthrough curves of normalized effluent H2S concentration (right) collected for
fixed beds of the CuO-based sorbent at 1000 ppm-vol H2S/N2, 294 K and 1.0 atm. Solid black
lines represent fitted linear driving force models (Cooper model for 120, 180, 212, 500 µm and
Bohart-Adams model for 800 and 1000 µm). Inset schematics show representations of the
propagation of reaction front through the volume of the pellet for large pellet size (not to scale)
....................................................................................................................................................... 49
Figure 3-10: Contributions of pore diffusion resistance, 1/kp, bulk diffusion resistance, 1/kb, and
solid diffusion/surface reaction resistance, 1/krxn to the overall rate resistance, 1/kK, at various
agglomerate sizes (125-1000 µm). The resistances were deconvoluted from Cooper’s regressed
rate parameter for runs at 1000 ppm-vol H2S/N2, 294 K and 1.0 atm. ......................................... 51
Figure 3-11: A) represents the effect of varying temperature on the maximum saturation capacity
at given conditions. B) represents an Arrhenius plot of the rate parameter regressed from Cooper’s
model fit for runs at 294, 323, 343, 363, 393, and 423 K. The runs were collected for 212 µm
agglomerates at 970-1016 ppm-vol H2S/N2 and a pressure of 1.0 atm. ....................................... 52
Figure 3-12: Breakthrough curves of normalized effluent H2S concentration (right) collected for
fixed beds of the CuO-based sorbent at 1000 ppm-vol H2S/N2 and 1.0 atm for temperatures of 294,
323, 353 K. Solid black lines represent fitted linear driving force models (Cooper model for 294
and 323 K and Bohart-Adams model for 353 K). Inset schematics show a representation of the
propagation of reaction front at two temperatures ........................................................................ 53
Figure 3-13: Breakthrough curves of normalized outlet hydrogen sulfide concentrations collected
for fixed beds of the CuO-based sorbent at A) 1000, 1380 and 2200 ppm-vol H2S/N2 (125 µm) and
B) 1.0 atm, 1.4, 1.6 and 2.0 atm (500 µm) both at a temperature of 294 K . ................................ 56
Figure 4-1: X-ray diffraction patterns of CuO sorbents. (a) Nanoparticles via sol-gel, co-
precipitation, and hydrothermal treatment (NP and NPC) and (b) nanobelts via co-precipitation.
....................................................................................................................................................... 68
Figure 4-2: X-ray diffraction patterns of CuO nanofibers synthesized via electrospinning (NF)
before and after thermal treatment. ............................................................................................... 69
Figure 4-3: SEM images at 20,000 times magnification of a select group of CuO sorbents with
different morphological features prepared via various synthesis techniques (e.g., sol-gel,
precipitation , hydrothermal treatment with the aid of a polymer, hydrolysis, and electrospinning).
....................................................................................................................................................... 71
Figure 4-4: Weight loss profiles as a function of temperature from thermogravimetric analysis
(TGA) of (a) pure PVP (M.W.=1,300,000), (b) NF-4 prior to thermal treatment (PVP-Cu(NO3)2),
and (c) pure PEO (M.W.=300,000) nanofibers. ........................................................................... 73
Figure 4-5: XPS spectrum of CuO nanomaterials (NP-7, NPC-2, and NF-4) prepared via
precipitation (no polymer), hydrothermal treatment in the presence of PVP (M.W.=1,3000,000),
and electrospinning, using PVP (M.W.=1,300,000) as a template, respectively. (a) Wide spectra
of the copper oxide sorbents, (b) high-resolution spectra of C 1s, with peak fittings corresponding
to C-C and C-Cu. .......................................................................................................................... 75
xi
Figure 4-6: Effect of carbon residue on carrying capacities of CuO nanofibers and nanoparticles
via hydrothermal treatment. X-ray photoelectron spectroscopy (XPS) was used to determine
carbon residue on the samples. ..................................................................................................... 76
Figure 4-7: Effect of (a) surface area, (b) pore volume and (c) domain size on the carrying capacity.
Brunauer-Emmett-Teller analysis was used to determine surface area, pore volume and domain
size. ............................................................................................................................................... 77
Figure 4-8: Effect of crystallite size of CuO sorbents prepared via various synthesis techniques as
described in Table C-1 and Table C-2 on H2S removal capacity at 1000 ppm-vol H2S/N2, 294 K
and 1 atm. ...................................................................................................................................... 78
Figure 4-9: a) TEM image for two 65-75 nm particles of NP-1 sorbent after sulfidation at 1000
ppm-vol H2S/N2, 294 K and 1 atm. b) Cu K and c) S K elemental maps for the NP-1 sulfidated
particles based on EDS spectra. d) Cross-sectional atomic composition of Cu, S and O K spectra
across the length of the particle, indicated by a red line in the TEM scan. .................................. 79
Figure 4-10: a) TEM image for 545-620 nm particles of NP-1 sorbent after sulfidation at 1000
ppm-vol H2S/N2, 294 K and 1 atm. b) Cu K and c) S K elemental maps for the NP-1 sulfidated
particles based on EDS spectra. d) Cross-sectional atomic composition of Cu, S and O K spectra
across the length of the particle, indicated by a red line in the TEM scan. .................................. 81
Figure 4-11: a) TEM image for a 55-70 nm particle of FP-3 after sulfidation at 1000 ppm-vol
H2S/N2, 294 K and 1 atm. b) Cu K and c) S K elemental maps for the NP-1 sulfidated particles
based on EDS spectra. d) Cross-sectional atomic composition of Cu, S and O K spectra across the
length of the particle, indicated by a red line in the TEM scan. ................................................... 82
Figure 4-12: Model of a CuO {111} surface used in this study, showing the different types of
surface atoms depending on their condition: O3c/O4c and Cu3c/Cu4c atoms. ................................. 85
Figure 5-1: a) Schematic of experimental setup for sulfidation of CuO samples at the XAS and
TXM beam lines. b) XAS cell schematic used for the room temperature sulfidation of CuO. c)
TXM cell schematic featuring 0.5 mm quartz capillary used for the room temperature sulfidation
of CuO. .......................................................................................................................................... 94
Figure 5-2: SEM images of HiFuel W230, CuO-1, A) -270 mesh (>53 m) particles before
sulfidation, B) +200-100 mesh (75-125 m particles) before sulfidation, and B) +200-100 mesh
(75-125 m particles) after reaction with 110 cm3(STP) min-1 of 930 ppm H2S/N2 at ambient
temperature (294 K) and pressure (1.1 atm). .............................................................................. 101
Figure 5-3: SEM images of copper (II) oxide nanoparticles prepared by precipitation from copper
(II) nitrate trihydrate precursor, CuO-2, A) before sulfidation and B) after reaction with 84
cm3(STP) min-1 of 1000 ppm H2S/N2 at ambient temperature (294 K) and pressure (1.1 atm). 101
Figure 5-4: Normalized concentration-time profiles for CuO-1 (red circles) and CuO-2 (blue
triangles). Normalized time is calculated by multiplying the time on stream with the mass flowrate
of H2S and dividing by the mass of adsorbent. Solid lines are predictions from the linear driving
force model derived by Cooper.12 ............................................................................................... 103

xii
Figure 5-5: Conversion of CuO to CuS as a function of time determined by the LCF of bulk XAS
experiments, CuO-1 (red circles) and CuO-2 (blue squares); and LCF of the TXM spectro-
microscopy images of individual particles of ~10 µm (particle A in Figure 5-6; black triangles)
and ~20 µm (particle B in Figure 5-6; green diamonds) of CuO-1. Black lines are model fits to the
bulk XAS data. ............................................................................................................................ 106
Figure 5-6: A) In-situ Chemical maps of CuO particles during sulfidation reaction. 3B)
Development of the reaction front (defined by the voxels with a chemical composition of 50%
CuO and 50% CuS) ..................................................................................................................... 108
Figure 5-7: A) Conversion (lines are data; symbols are model predictions) of CuO to CuS at various
radial distances and at various times on stream. B) RPM rate constants (k) and effective
diffusivities (De) as a function of radial distance. The value of zero is the particle surface and the
value of 1 is the particle center. .................................................................................................. 109
Figure 6-1: A) Presents covellite251 molecular structure and a summary of symmetry, oxidation
states, and coordination for the different Cu and S centers. B) Illustrates covellite crystal packing.
Both structures are produced using Mercury 3.8 structural visualization application.254 ........... 113
Figure 6-2: Experimental setup for sulfidation of CuO-based samples at beamline 4-3 at the
Stanford Synchrotron Radiation Lightsource (SSRL) ................................................................ 118
Figure 6-3: Stick-plot representation of the radial distribution of atoms around Cu1+ and Cu2+ in
CuS (covellite) and averaged Cu center in the simplified CuS model used in EXAFS fitting of Cu
K-edge spectra. ........................................................................................................................... 120
Figure 6-4: X-ray diffraction patterns of CuO sorbents. Blue diamonds indicate characteristic CuO
peaks. .......................................................................................................................................... 122
Figure 6-5: SEM images of fresh CuO sorbents at 10,000 X magnification. ............................. 123
Figure 6-6: Normalized Cu K-edge XANES spectra for CuO sorbents of different average
crystallite sizes: CuO-1 (2.8 nm), CuO-2 (7nm), CuO-3 (11 nm), CuO-4 (23 nm) and CuO-5 (40
nm). ............................................................................................................................................. 124
Figure 6-7: Breakthrough curves of normalized effluent H2S concentration collected for fixed beds
of the CuO-based sorbent at 1000 ppm-vol H2S/N and 1.0 atm for temperatures of 323 K, 353 K,
and 383 K. Solid black lines represent fitted linear driving force models (Cooper model182 for 294
and 323 K and Bohart-Adams184 model for 353 K). ................................................................... 126
Figure 6-8: Conversion of CuO to CuS as a function of time as determined by the LCF of bulk
XAS experiments at Cu K-edge and S K-edge. The experiments were conducted at 323, 353, and
383 K for CuO-1 sample under a flow of 1000 ppm H2S/He at 1 atm. ...................................... 128
Figure 6-9: Crystal structures, compositions, oxidation states of Cu and S, and X-ray diffraction
patterns for low-chalcocite, high-chalcocite, Djurleite,261 Anilite,262 Geerite,263 Roxbyite,264 and
Covellite.251 Red spheres represent Cu while yellow spheres represent S. The structures are
produced using Mercury 3.8 structural visualization application.254 .......................................... 130

xiii
Figure 6-10: X-ray diffraction patterns of spent CuO sorbents. The sulfidation tests are run at 298
K and 1 atm with 1000 ppm-vol H2S/N2. Red rectangles identify characteristic covellite peaks.
..................................................................................................................................................... 131
Figure 6-11: Diffraction patterns of fresh CuO-1 sorbent and spent samples for runs at 323, 353,
and 383 K (using 1000 ppm-vol H2S/N2 and 90 cm3(STP) min-1). The XRD of spent samples are
collected at 298 K and 1 atm after sulfidation at elevated temperatures. Blue diamonds correspond
to characteristic CuO peaks and red triangles correspond to characteristic CuS peaks. ............. 131
Figure 6-12: Normalized S K-edge XANES spectra for samples CuO-2 and CuO-3 after reaction
at 298 K and CuO-1 after reaction at 323, 353, and 383 K (1000 ppm-vol H2S/He, 298 K and 1
atm). The scans were collected under flowing He. Experimental conversion of each sample is
indicated in the figure legend. ..................................................................................................... 132
Figure 6-13: Normalized S K-edge XANES spectra for CuO-1 spent at 323 K and 383 K, and two
copper sulfide references (CuS and Cu2S). The spectra are offset for clarity. The inset shows the
second derivative spectra of the spent samples highlighting the absence of peak b (S22- 1s → Cu2+
3d9) in the sulfided sample at 323 K. .......................................................................................... 134
Figure 6-14: Normalized in-situ S K-edge XANES spectra for sample CuO-1 during sulfidation at
353 K, 1000 ppm-vol H2S/He and 1 atm. ................................................................................... 135
Figure 6-15: Selected normalized bulk in situ S K-edge XAS spectra of CuO-1 sulfidation with
1000 ppm H2S/He at a) 323 K and b) 383 K. The spectra highlight the change in the formed CuS
species as conversion increased. ................................................................................................. 137
Figure 6-16: Part of the reaction pathway on a bare CuO (𝟏11) surface where multiple H2S
molecules participate in reaction, showing disulfide bond formation lowering the reaction free
energy, rendering disulfide bond formation as an improvement on reaction favorability.......... 139
Figure 6-17: of the reaction pathway on a partially sulfided CuO (𝟏11) surface where one H2S
molecules participate in reaction, showing presence of disulfide bond formation making equivalent
elementary step exothermic instead of endothermic (from step B to C). ................................... 140
Figure 6-18: A) Normalized Cu K-edge XANES spectra for fresh CuO-1 sample, spent CuO-1
samples at 323, 353, and 383 K (1000 ppm-vol H2S/He), and two copper sulfide references (CuS
and Cu2S). B) First derivative spectra of A) highlighting the pre-edge feature associated with Cu2+
1s → 3d9 transition. Spectra offset for clarity. ............................................................................ 142
Figure 7-1: X-ray diffraction patterns of a commercial CuO sorbent (CuO-1), and two lanthanum-
doped sorbents prepared via sol-gel (CuO-La-1) and ammonia co-precipitation (CuO-La-2), before
and after reaction with 1000 ppm H2S/N2 at 323 K and 1 atm. CuS and La2O3 diffraction patterns
are included as references. Blue markers indicate characteristic CuO peaks, green markers indicate
characteristic CuS peaks, and red markers indicate La2O3 peaks. .............................................. 155
Figure 7-2: STEM images of CuO-La-1 (a-b) and CuO-La-2 (d-e). The detector intensity profiles
for CuO-La-1 (c) and CuO-La-2 (f) are generated along the identified yellow lines in the STEM

xiv
images. The smooth and additive intensity of CuO-La-2 indicates even distribution of the La
species, in comparison with the blotchy appearance of Cu-O-La-1. .......................................... 157
Figure 7-3: EDS spectra for selected 100 nm areas from STEM images of CuO-La-1 (a-c) and
CuO-La-2 (d-f). ........................................................................................................................... 158
Figure 7-4: Normalized Cu K-edge XANES spectra for commercial CuO-based sample, CuO-1,
and CuO samples with La additives, CuO-La-1 and CuO-La-2. ................................................ 160
Figure 7-5: Normalized Cu K-edge XANES spectra for spent CuO-1, CuO-La-1 and CuO-La-2
sorbents at 323, 1 atm, and 1000 ppm-vol H2S/He. .................................................................... 162
Figure 7-6: Normalized S K-edge XANES spectra for CuO-1, CuO-La-1, CuO-La-2 spent at 323
K, 1 atm, and 1000 ppm-vol H2S/He and a covellite reference (CuS). The inset shows the second
derivative spectra of the CuO-1 and CuO-La-2 spent samples highlighting the presence of peak b
(S22- 1s → Cu2+ 3d9) in the spent CuO-La-2 which indicates higher conversion and CuS-like
products. ...................................................................................................................................... 164
Figure 7-7: Normalized L3-edge XANES spectra for CuO-La-1, CuO-La-2 both fresh and spent at
323 K, 1 atm, and 1000 ppm-vol H2S/He and a lanthanum oxide reference (La2O3). ............... 165
Figure 7-8: Breakthrough curves of normalized effluent H2S concentration collected for fixed beds
of the CuO-based sorbents at 1000 ppm-vol H2S/N, 323 K and 1.0 atm. Solid black lines represent
linear driving force model fit (Cooper model). Time is normalized by multiplying the time on
stream with the mass flowrate of H2S and dividing by mass of sorbent..................................... 166
Figure 7-9: Bulk S K-edge XAS spectra of a) CuO-La-1 and b) CuO-La-2 as it was exposed to
flowing 1000 ppm H2S in helium at 323 K and 1 atm. XAS scans were taken every 9 minutes and
the edge step increased consistently with time. .......................................................................... 168
Figure 7-10: Conversion profiles of CuO in CuO-1 (green), CuO-La-1 (blue), and CuO-La-2 (red)
to CuS as determined by in-situ S K-edge XAS experiments at 1000 ppm-vol H2S/N, 323 K and
1.0 atm. Black dots represent RPM fits for the data. .................................................................. 170

xv
LIST OF TABLES
Table 3-1: Summary of pore volume and BET surface area of N2 adsorption at 77 K for fresh and
sulfided CuO-based sorbent at 1000 ppm-vol H2S/N2, ambient temperature (294 K) and ambient
pressure (1.0 atm).......................................................................................................................... 44
Table 5-1: Pore volumes and BET surface areas of fresh and sulfided CuO-based sorbents. .... 102
Table 6-1: Physiochemical properties of the CuO sorbents. [a]Based on XRD peak at 2θ=38.8°. [b]First shell oxygen coordination number based on EXAFS fits of Cu K-edge (See Supporting
Information). [c]BET method. [d]BJH method. [e]Fixed bed experiments at 298 K with 90 cm3(STP)
min-1 of 1000 vol-ppm H2S/N2 at 1 atm total pressure. .............................................................. 122
Table 6-2: Summary of conversion and kinetic and diffusivity parameters deduced from RPM
model for in-situ S K-edge and Cu K-edge tests and, Cooper model for fixed bed tests. Conversion
data were obtained through linear combination fitting for the XANES region using CuO and CuS
references for Cu K-edge tests and using the edge step of fully converted 383 K test as a reference
for S K-edge runs. All runs are carried at ambient pressure and a feed concentration of 1000 ppm-
vol H2S. ....................................................................................................................................... 127
Table 7-1: Summary of sulfidation tests results for fixed beds of CuO-based samples at 1000 ppm-
vol H2S/N, 323 K and 1.0 atm. ................................................................................................... 152
Table 7-2: Physiochemical properties of the La-doped CuO sorbents relative to the commercial
CuO-based sorbent. [a] Based on XRD. [b] Based on BET. [c] Based on BJH method. ............... 156
Table 7-3: Summary of rate parameters deduced from Cooper model fit, removal capacity, and
conversion of CuO for fixed bed sorption tests at 1000 ppm-vol H2S/N, 323 K and 1.0 atm. ... 167
Table 7-4: Random pore model parameters from fits of the conversion profiles of S K-edge in situ
sulfidation runs at 1000 ppm-vol H2S/N2, 323 K and 1.0 atm. ................................................... 169

xvi
ACKNOWLEDGEMENTS
I would like to express my gratitude to my advisor, Professor Dante A. Simonetti, for his
guidance and support throughout my doctoral work. Professor Simonetti is a great mentor who has
continually believed in me and trained me to be the researcher I am today. I was fortunate to be
the first student to join his research group and learn from him, firsthand, how to build a catalysis
research lab from scratch and how to not (accidentally) set it on fire. In the same respect, I would
like to thank Professor Panagiotis D. Christofides, Professor Vasilios Manousiouthakis, and
Professor Louis Bouchard for graciously accepting to serve on my doctoral committee.
I would like to thank Dr. Tirso Lopez-Ausens for being an excellent colleague and
collaborator in many parts of this project. Tirso inspired me to be more focused, organized and
detail-oriented in my approach. I would like to also thank my collaborator from New Mexico
University, Griffin Canning, for being generous with his time and knowledge. Griffin helped me
tackle some of the most challenging and exciting research questions in my work. I would like to
thank my collaborators and advisors at the Stanford Synchrotron Radiation Lightsource (SSRL):
Dr. Alexey Boubnov, Dr. Adam Hoffman, and Dr. Simon Bare for their support and supervision
throughout countless sleepless nights at the beamline and beyond. Working closely with Dr. Bare’s
group has been a significant and unparalleled contributor to my doctoral training. Additionally, I
would like to thank and acknowledge the following individuals who collaborated with me on this
project: Professor Philippe Sautet, Dr. Sergey Prikhodko, Dr. Yijin Liu, Kai Zhang, Faisal
Alshafei, Luke Minardi, Richa Ghosh, Brian Ko, Zubin Mishra, Nicole Chiang, and Brook
Wander.
I would like to thank Mr. William A. Herrera for empowering me and giving me the
opportunity to facilitate the High School Summer Research Program (HSSRP), for three

xvii
consecutive years, as it has been one of the most meaningful and rewarding experiences I have had
at UCLA. I would like to also thank my labmates and peers for their direct and indirect
contributions to my research work and journey at UCLA.
I would like to gratefully acknowledge the funding from the Department of Chemical and
Biomolecular Engineering and the Office of Equity, Diversity, and Inclusion at UCLA and to the
donors of The American Chemical Society Petroleum Research Fund. I would like to also
acknowledge the use of the SSRL, SLAC National Accelerator Laboratory, supported by the U.S.
Department of Energy (DOE).
I would like to thank my previous mentors during my undergraduate education who have
continued to be influential beyond my time at the American University of Sharjah (AUS). I would
like to especially thank Professor Oussama M. El-Kadri, an exceptional mentor and role model
who was the reason behind me pursuing a double major in chemistry. This decision prepared me
for the research work I did during my doctoral work. I would like to also thank Professor Lucia
Pappalardo, Professor Ghaleb Al Husaini, and Professor Yousef Salamin for their invaluable
guidance and mentorship.
Finally, and most importantly, I am forever grateful for the special people in my life who
supported me emotionally throughout this journey: My parents (Salwa and Abdulmajid), my
siblings (Belal and Hajar), my partner (Ayman Al-Abdallah), and my friends (Reem Karmouta,
Nour Jabaieh, Tina Al-Attar, Hafsa Shurbaji, Anas Al-Anqar, Hawra Salami, Randa Asaad, and
my late dear friend Jason Donovan).
Chapter 2 is a version of: Azzam, S.; Simonetti, D. A.; Alshafei, F.; Lopez-Ausens, T.;
Minardi, L. Reactive Sorption of Sulfur on Metal Oxides: Applications, Reactor Engineering
Descriptions, and Opportunities to Develop Molecular Understanding. In preparation, 2020.

xviii
Chapter 3 is a version of: Azzam, S.; Simonetti, D. A. Linear Driving Force
Approximations as Predictive Models for Reactive Sorption. Energy Technol. 2019, 1900718.
Chapter 4 is a version of: Azzam, S. A.; Alshafei, F. H.; López-Ausens, T.; Ghosh, R.;
Biswas, A. N.; Sautet, P.; Prikhodko, S.; Simonetti, D. A. Effects of Morphology and Surface
Properties of Copper Oxide on the Removal of Hydrogen Sulfide from Gaseous Streams. Ind. Eng.
Chem. Res. 2019, 58 (40), 18836–18847.
Chapter 5 is a version of: Hoffman, A. S.; Azzam, S.; Zhang, K.; Xu, Y.; Liu, Y.; Bare, S.
R.; Simonetti, D. A. Direct Observation of the Kinetics of Gas–Solid Reactions Using in Situ
Kinetic and Spectroscopic Techniques. React. Chem. Eng. 2018, 3 (5), 668–675.
Chapter 6 is a version of: Azzam, S.; Boubnov, A.; Hoffman, A.; López-Ausen, T.; Chiang,
N.; Canning, G.; Sautet, P.; Bare, S.; Simonetti, D. A. Insights into Copper Sulfide Formation from
Cu and S K-edge XAS and DFT studies. Inorg. Chem., submitted, 2020.
Chapter 7 is a version of: Azzam, S.; boubnov, A.; Hoffman, A. S.; Cannin, G.; Alshafei,
F. H.; Ko, B.; Ghosh, R.; Datye, A.; Bare, S. R.; Simonetti, D. A. Lanthanum Induced Weakening
of Lattice Copper-Oxygen Bonds Improves Hydrogen Sulfide Capacities of Copper Oxide
Adsorbents. In preparation, 2020.

xix
VITA
2010–2014 Bachelor of Science, Chemical Engineering
Department of Chemical Engineering
American University of Sharjah
2011–2014 Bachelor of Science, Chemistry
Department of Biology, Chemistry and Environmental Sciences
American University of Sharjah
2015 Graduation Distinction
2015–2020 Graduate Student Researcher
Department of Chemical and Biomolecular Engineering
University of California, Los Angeles
2017–2020 Teaching Assistant
Department of Chemical and Biomolecular Engineering
University of California, Los Angeles
PUBLICATIONS
1. Saeed, H.; Husseini, G.; Yousef, S.; Saif, J.; Al-Asheh, S.; Fara, A.; Azzam, S.; Khawaga,
R.; Aidan, A. Microbial Desalination Cell Technology: A Review and a Case Study.
Desalination 2015, 359.
2. Hoffman, A. S.; Azzam, S.; Zhang, K.; Xu, Y.; Liu, Y.; Bare, S. R.; Simonetti, D. A. Direct
Observation of the Kinetics of Gas–Solid Reactions Using in Situ Kinetic and
Spectroscopic Techniques. React. Chem. Eng. 2018, 3 (5), 668–675.
3. Azzam, S. A.; Alshafei, F. H.; López-Ausens, T.; Ghosh, R.; Biswas, A. N.; Sautet, P.;
Prikhodko, S.; Simonetti, D. A. Effects of Morphology and Surface Properties of Copper
Oxide on the Removal of Hydrogen Sulfide from Gaseous Streams. Ind. Eng. Chem. Res.
2019, 58 (40), 18836–18847.
4. Azzam, S.; Simonetti, D. A. Linear Driving Force Approximations as Predictive Models
for Reactive Sorption. Energy Technol. 2019, 1900718.

xx
5. Azzam, S.; Boubnov, A.; Hoffman, A.; López-Ausen, T.; Chiang, N.; Canning, G.; Sautet,
P.; Bare, S.; Simonetti, D. A. Insights into Copper Sulfide Formation from Cu and S K-
edge XAS and DFT studies. Inorg. Chem., submitted, 2020.

1
Chapter 1 | Overview
This dissertation compiles the author’s work on unravelling the fundamentals of the
reaction between CuO and trace amounts of H2S through reactive sorption. Chapter 2 of this
dissertation covers a literature review of reaction engineering descriptions, materials development
approaches, advanced mechanisms characterization, and an in-depth review of density functional
theory (DFT) studies that are relevant to the project.
The dissertation work is then organized in an order of descending length scales. At the
macro-scale, Chapter 3, assesses the utilization of linear driving force approximations as predictive
models for H2S removal in fixed beds of commercial CuO-based sorbent at different flow
conditions, temperatures, total pressures, and inlet hydrogen sulfide concentrations. This study
demonstrates that, in the absence of bulk and pore diffusion resistances, linear driving force
approximations that are zero order in bulk gas phase concentration but first order in solid phase
capacity effectively model contaminant breakthrough curves. The model-deduced sorption rate
parameters reflect, predominantly, the reaction and diffusion at reactive interfaces, rather than bulk
or pore diffusion.
Zooming in on the micro-scale, Chapter 4 explores the structure-function relationships
governing the CuO-H2S reaction. The effect of different physiochemical properties (microscopic
shape, porosity, crystallinity, and purity) on H2S removal capacity of CuO sorbents is probed using
fixed bed experiments at ambient conditions. The study shows that, despite ostensible differences
between the various properties of the tested sorbents, a strong linear relationship was recognized
between the sorbents’ sulfur removal capacity and crystallite size, independent of changes in the
materials’ microscopic shape and porosity. In addition, the effect of residual carbon on CuO

2
surfaces is also probed in this study for the first time, showing that amorphous carbon inherently
imparted by the use of a polymer (PVP or PEO) or a surfactant (P123) in the synthesis procedure
inhibits reaction and deleteriously impacts the H2S uptake capacity. First principles atomistic
simulations were performed to explain which surface oxygen anions are most reactive and
supportive to the observations.
Chapter 5 probes the spatial-temporal chemical and structural changes of copper during the
sulfidation reaction using advanced synchrotron-based characterization techniques such as X-ray
absorption spectroscopy (XAS), and transmission X-ray microscopy (TXM). This study
demonstrates that H2S removal reaction kinetics show similar trends in fixed bed reactors as in 10-
20 µm sized particles. However, reaction fronts proceed through the entire diameter of particles
heterogeneously, indicating the presence of pore diffusion resistance even at very small length
scales. In addition, the study shows that CuO sorbents of similar characteristics exhibit different
sulfidation conversion and reaction rate constants. These differences in reaction kinetics and
conversion indicate the critical impact of possible atomic scale differences and the formation of
different copper sulfide products.
On the atomic scale, Chapter 6, combines ex-situ and in-situ XAS at the S and Cu K-edges
and other characterization techniques to speciate the CuS products formed at different
temperatures and from CuO sorbents with different crystallite sizes. This work identifies,
unprecedentedly, the initial formation of a distorted CuS layer at the surface of CuO crystals with
disulfide groups that have longer Cu-S bonds and higher delocalization of the positive charge of
the Cu center into (S-1)2. First principles atomistic simulations confirmed the thermodynamic
favorability of the formation of surface (S-1)2 on both CuO (111) and (1̅11) surfaces, providing
further support for the experimental observations.

3
Chapter 7 branches out to explore the effects of lanthanum (La) additives on the capacity
and kinetics of CuO sorbents for the removal of H2S. La was selected because of its relatively large
cationic radius (RLa/RCu = 1.5) compared to the more commonly studied additives such as Zinc,
Nickel and Cobalt (Rx/RCu = 1.0). The results of the study show that two La-CuO sorbents with
nominal La/Cu ratio of 1:2 achieved 64% and 85% conversion respectively, compared to 59%
conversion achieved by the best performing CuO sample. Advanced multi-edge XAS tests were
performed to identify the structural and chemical changes introduced by La that led to the increase
in capacity. X-ray absorption near edge structure (XANES) analysis at Cu K-edge suggested more
electron-rich Cu species in La-CuO samples, while X-ray absorption fine structure (EXAFS)
modelling showed longer second, third and fourth shell single scattering paths. Together, these
changes suggest that La weakened Cu-O bonds thereby lowering their barrier for rupture via
reaction with H2S-derived species.
Finally, Chapter 8 summarizes the findings of the dissertation and suggests avenues for the
expansion of this work.

4
Chapter 2 | Background
Reactive sorption involves employing a selective and high-capacity solid substrate that
possess preferential affinity towards a targeted molecule and reacting that solid with the general
purpose of removing a gaseous contaminant. One industrially and environmentally relevant
application is the removal of sulfur-containing contaminants from hydrocarbon streams derived
from natural gas processing1–4 and petroleum refining.5,6 This purification application is essential
to meet product specifications5 and emissions regulations3,5,6 and to protect equipment and
catalysts.1,2 Many regenerable adsorbents can remove these contaminants7 through adsorptive
separation where trace amounts (1-1000 ppm-mol) of sulfur compounds (e.g., mercaptans, H2S,
CS2, COS)3,5 and elemental mercury (1-2000 µg/Nm3 ~ 0.1-200 ppb-mol)4 are picked up from
these streams. However, reactive sorption using metal oxide has proven to be superior due to (i)
the favorable thermodynamics compared to physisorption resulting in higher purity effluent
streams5 and (ii) the permanent sequestration of contaminants in an environmentally benign
form.1,8 Figure 2-1 shows how COS and H2S molecules react with metal oxides via different
reaction stoichiometries to form stable metal sulfides.8–10 Each of these reactions is governed by
different kinetics.11,12 Therefore, fundamental knowledge of these reaction paths and their
respective kinetics is critical to the efficient use of reactive sorbents in hydrocarbon purification
processes.

5
Figure 2-1: Possible reaction stoichiometries for sulfur compounds with different metal oxides.
Several catalyst companies (e.g., UOP, Johnson-Matthey, Axxens, Clariant) sell these
materials at very large scale, highlighting the importance of these reactive sorption processes.
Nevertheless, despite the maturity of these technologies and the abundance of their applications,
these materials still suffer from incomplete conversion of the active phase and high sensitivity to
process upsets. This variation in performance between materials is illustrated in the materials
development section of this review.
Even though many decades of research have been conducted on these systems, most of the
previous work has focused on two areas: reactor engineering models and materials development.
In this review, we aim to focus on the work that has been conducted to combine advanced
characterization techniques with microkinetic and computational models to probe the
fundamentals of these reactions at the molecular level. It is this molecular level of understanding
that will be required to advance previous research beyond combinatorial studies of materials and
macro-scale reactor engineering models. Indeed, this fundamental knowledge could lead to a

6
rational framework for designing new materials and to higher-fidelity predictive models for fluid-
gas reaction processes that will help overcome reactive adsorption process limitations.
2.1 Reaction Engineering Descriptions
Solid-gas reactions in an industrial setting occur in packed bed reactors where the desired
effluent gas is free from sulfur containing compounds. As the solid material becomes saturated the
concentration of the sulfur compound increases along the length of the reactor as a function of
time until it is measured in the effluent. It is critical to be able to quantify capacity of the solid
materials and to predict the breakthrough time.
Two types of experiments are typically run to characterize the solid reactant or sorbent,
the first is static thermogravimetric experiments and the second is packed bed breakthrough
experiments. The change in mass as a function of time can give insights to the reaction kinetic
limited regime and diffusion limited regime. These static experiments can be described with solid
models to quantify the kinetic rate constant and diffusivity constant while accounting for structural
variations and changes within a material.13
Packed bed experiments are modeled with a gas phase transport model, the term for the
consumption of the sulfur compound is described by either the aforementioned pellet-scale
reaction model14,15 or the linear driving force model.16 The pellet-scale model was referred to
above and will be discussed in detail below, the linear driving force model is a mass transfer model
where the driving force is the difference between the equilibrium and the average adsorbate
concentration. In the following sections we will discuss the solid reactant model, the reactor scale
model, and finally the coupling of models with experiments and model limitations.

7
2.1.1 Pellet scale models
The backbone of complex grain reaction models is the sharp interface model where there
is a fast surface reaction step and a slower diffusion-controlled reaction step as the reaction
progresses to the center of a grain. Some research has used the sharp grain model to describe a
very low surface area zinc titante, ~2m2 g-1, react with H2S. The sharp grain model used by, Huang
et al., accurately captured the zinc titanate conversion as a function of time and observed the
expected temperature dependence of the parameter estimate of diffusivity.17 The sharp interface
model can be made more complex by including temperature gradients due to heat of reaction and
structural changes due to the solid reaction.
Grain or distributed pore models are more realistic models for many processes where an
individual pellet is composed of many grains having a tortuous pore structure. Each individual
grain or surface element is treated the same as the sharp interface model where the surface reaction
is fast and there is an unreacted core of solid reactant beneath the surface. Pore structure is included
in these models, so the sharp interface includes surfaces inside of the pellet that the gas must diffuse
to. Precise knowledge of the internal pore structure is typically poorly understood, so models have
used different methods to describe them. There are various pore models from single pore,18 random
pore,19,20 and distributed pore models.21 Further, both pore and grain models are easily made more
complex by allowing for the pore structure change as a function of conversion of the solid material
due to changes in the molar volume of the solid21 or accounting for changes in temperature due to
heat of reaction.13 Due to the more realistic nature of the grain and pore models, they are typically
used to describe desulfurization for static experiments.

8
Assumptions typically made for solid reaction modeling for simplicity include assuming
the reaction order,22 gas-solid mass transfer resistance is negligible,23 gas concentration at each
grain is uniform,23 and/or no pore creation or clogging19.
Bhatia and Perlmutter applied the random pore model they developed19,20 to the reaction
of SO2 with limestone (CaO).24 Equation 1 and Equation 2 are both dimensionless and they
describe the conversion of mass with surface reaction and diffusion.
1
𝜂2
𝜕
𝜕𝜂(𝐷𝑒
∗𝜂2 𝜕𝐶∗
𝜕𝜂) = 𝜙2 𝑑𝑋
𝑑𝜏 (1)
𝑑𝑋
𝑑𝜏=
𝐶∗(1−𝑋)√1−𝜓𝑙𝑛(1−𝑋)
1+𝛽𝑍
𝜓[√1−𝜓𝑙𝑛(1−𝑋)−1]
(2)
A variety of additional equations and material data24 are necessary to describe the solid
surface such as surface area, pore length, pore structure, modified Thiele modulus, etc. Bhatia and
Perlmutter used data from Hartman and Coughlin23 and Borgwardt25 to model with the random
pore model, which resulted in accurate fits to both data sets and resulted in parameter estimates
for reaction rate constants and diffusivity from the model fit. Additionally, the parameter estimates
for the reaction rate constant and product layer diffusivities fit the expected relationship as a
function of temperature.
Experimentally, material information must be characterized with N2 physisorption either
to describe the average grain radius for the grain model or to determine the internal pore structure
for the distributed pore model. Equations developed by Sohn and Szekely26 can be used to estimate
the average particle radius for various grain geometries. Equations developed by Bhatia and
Perlmutter19 can be used to estimate structural parameters for the distributed pore model. Most of
the other information necessary to use the grain model or random pore model is available based
on experimental conditions (i.e. temperature) or a literature review (i.e. change in molar volume).

9
Figure 2-2: Model representations of an individual pellet undergoing sulfidation for A. Grain model and
B. Random pore model adapted from Ramachandran et al.27 and Bhatia et al.19 compared to C. In situ
mapping of CuO particles undergoing sulfidation figure from Hoffman et al..28
2.1.2 Reactor models
One of the most common models for packed bed reactors where a contaminant is adsorbed
or there is reactive sorption is a 1-D Plug Flow Reactor (PFR) model. Bohart29, Cooper30and
Yoshida31 each developed dimensionless forms of the 1-D PFR model for chlorine contaminant
removal, ion exchange columns, and generic adsorption with square breakthrough curves,
respectively. Each of these models used a linear driving force to describe contaminant
consumption but used different expressions for concentration as a function of time. There are two
parameters in these models the maximum capacity of the sorbent material and the sorption rate
parameter. The maximum capacity (concentration) of the contaminant on the solid is determined
by thermodynamics (adsorption isotherms) or stoichiometry (reactive sorption). Maximum
capacity is determined by calculating the total amount adsorbed when the material is fully saturated
by a mass balance. The adsorption rate parameter is then related to adsorption resistance to the

10
bulk diffusion, diffusion in solid pores, and reaction and diffusion on the surface. The method of
using a 1-D PFR with LDF was recently applied to H2S breakthrough experiments with a CuO
bed.16
The 1-D PFR model can be made more complex by adding an axial dispersion term32 or
using a pellet/grain model if there is a bulk solid reaction. The governing equations of a recent
model developed by Parandin and Rashidi, recently studied zinc oxide reacting with H2S and
developed a model that combined a 1-D PFR with axial dispersion model with the grain model.15
𝐷𝑑𝛿2𝐶𝑏
𝛿𝑍𝑟2 − 𝑈𝑠
𝛿𝐶𝑏
𝛿𝑍𝑟− 𝑘𝑚𝑎𝑠(𝐶𝑏 − 𝐶𝑝) = 𝜀𝑝
𝛿𝐶𝑏
𝛿𝑡 (3)
Equation 3 is the mass balance over the bed, where Cb and Cp is the bulk and pellet
concentration, respectively. Dd is the axial dispersion coefficient, Us is the superficial velocity, km
is the convective mass transfer coefficient, as is the solid surface area per unit volume, and εP is
the bed porosity. The independent parameters are: Zr the distance from the start of the bed and t is
the time.
Equation 3 is the fundamental equation for each of the 1-D PFR models, with boundary
conditions defined as:
𝐷𝑑𝛿𝐶𝑏
𝛿𝑍𝑟= 𝑈𝑠(𝐶𝑏 − 𝐶𝑖𝑛), 𝑍𝑟 = 0 (4)
𝛿𝐶𝑏
𝛿𝑍𝑟= 0, 𝑍𝑟 = 𝐿𝑏 (5)
where Cin is the concentration of the inlet gas and Lb is the length of the bed. The pellet mass
balance was based on earlier work by Hartman and Coughlin,23 defined as follows:

11
1
𝑟
𝛿
𝛿𝑟(𝑟𝐷𝑒
𝛿𝐶𝑝
𝛿𝑟) −
3𝑘𝑟(1− 𝑝)
𝑟𝑔(
𝑟𝑐
𝑟𝑔)
2
𝐶𝑝 = 𝜀𝑝𝛿𝐶𝑏
𝛿𝑡 (6)
where rc and rg are the radial position of the unreacted core and the radius of the particles in the
pellet. kr and De are the reaction rate and effective diffusion coefficient of the gas through the
pellet.
Work by Knox et al.32 combined the experimental study of water and CO2 breakthrough
curves in a packed bed reactor (Zeolite 5A) with a model of 1-D axially dispersed PFR with LDF
mass transfer coefficient. This work found that experimental systems must satisfy the plug flow
condition to have accurate adsorbate/adsorbent mass transfer information. The only way to verify
that this condition is satisfied is by comparing the breakthrough curves with in situ data along that
axis center.
2.2 Materials development approach
A variety of adsorbents such as, metal oxides (supported and unsupported),10,12,33–52
zeolites (aluminosilicates and all-silica),53–62 metal-organic frameworks (MOFs),63–70 carbons,71–
76 and composite materials69,77–81 have been used and reported on in the literature for H2S capture
from gas mixtures containing CH4, CO, CO2, N2, H2, and/or H2O. This large body of literature,
however, is beyond the scope of this review, and so in this section, we focus on unsupported metal
oxide sorbents with emphasis on oxide materials that operate at low to moderate temperatures (25-
500 oC). Also, to avoid overlap with34 a recent review which presents on new materials
development for various H2S adsorbents (e.g., ionic liquids, metal oxides, metals, metal-organic
frameworks, aluminosilicates, etc.), this section was kept intentionally short, albeit here we try to
expand on this subject as well as highlight the need for fundamental understanding for rationale

12
materials design. Readers interested in metal oxides for high temperature (> 600 oC) H2S removal
33–35 or zeolites34,82 may refer to the cited reviews.
In 1976, Westmoreland and Harrison12 conducted a pioneering thermodynamics study,
screening the high-temperature (400-1200 oC) desulfurization potential of 28 solids comprising
primarily of metal oxides. The authors used a computational free energy minimization method to
estimate equilibrium sulfur removal and determine solid compound stability. Eleven candidate
solids based upon the metals Fe, Zn, Mo, Mn, V, Ca, Sr, Ba, Co, Cu, and W showed
thermodynamic feasibility for high-temperature desulfurization of low-Btu gas (i.e., at least 95%
desulfurization and solid stability). Much of the research conducted to date on these metal oxides
and others are presumed to remove H2S according to the general reaction (MxOy (s) + yH2S (g) ↔
MxSy + yH2O (g), where M denotes a suitable metal). Of the metals proposed by Westmoreland and
Harrison, Zn, Mg, Cu, Fe, and rare earth sorbents are among the most promising and most
extensively investigated. Table A-1 and A-2 show selected results of pure and doped-metal oxides
at various experimental conditions. Table A-1 comprises primarily of zinc- and copper oxide-
based sorbents, which are the most promising oxides for low- to moderate- temperature H2S
removal,10,33,34 whereas Table A-2 comprises of other metal oxides that have been less
investigated. The majority of the metals in Table A-2 are drawn from a screening study performed
at room temperature on simple oxides (Ag, Co, Ni, Ca, Mn, and Sn).10
Zinc-based sorbents have been extensively used in the desulfurization of natural gas
feedstock typically in the 300 – 400 oC range. Early work on ZnO dealt with trying to understand
the effects of product layer diffusion, pore diffusion, and gas-film diffusion on the sulfidation
kinetics.83 Gibson and Harrison,83 for instance, attributed the low utilization of ZnO at temperature
below 600 oC to grain diffusion resistance and formation of a dense sulfide layer. Skrzypski et al.84

13
later performed a study on the sulfidation of pure and metal-doped ZnO nanostructure sorbents,
focusing in their study on the performance of ZnO sorbents at temperatures between 200 and 350
oC. The authors reported that the adsorption of H2S by ZnO is stoichiometric at 350 oC but falls
off rapidly as the temperature is reduced due to slower reaction kinetics. Although ZnO has a high
theoretical and experimental H2S sorption capacity at ~350 oC when compared to other oxides,
ZnO, at elevated temperatures, can be reduced in syngas atmosphere. Therefore, a significant part
of research on ZnO as well as on other promising oxides, has gravitated towards doping the desired
metal oxide with other inert or active metallic species. In most screening studies, the choice of
dopant is rather arbitrary and is based on trial and error, but the goal behind doping is to improve
the sorbent’s properties in one or more of these areas: sorption capacity and selectivity, sorption
kinetics, stability, structural regenerability upon repeated sulfidation-regeneration cycling,
chemical (e.g., crystallite size) and mechanical properties (e.g., low attribution).33–35
Skrzypski et al.84 demonstrated that the reactivity of nanostructured ZnO-based sorbents at
low temperatures can be further enhanced by doping. Specifically, it was shown that the addition
of Fe, Mn, Ni, Co, and/or Cu oxides to ZnO allows an increase in the H2S breakthrough capacity
of the sorbent at room or moderate temperatures.33,84–89 The authors found a 6-fold increase in
capacity at 200 oC by doping 6 mol% Cu. XPS of the Cu-Zn-O sample showed a Cu 2p3/2 peak at
933.5 eV, characteristic of Cu2+ surrounded by oxygen. After partial sulfidation, this peak shifted
to lower energy, indicating the appearance of Cu+. Using in-situ synchrotron XRD and TEM to
analyze the sulfidation mechanism, the authors suggested an inward growth mechanism where S2-
anions diffuse from the external surface to the internal oxide-sulfide interface and exchange with
O2- anions. This change in mechanism was attributed to the presence of sulfur vacancies in the
zinc sulfide layer due to the replacement of Zn2+ by Cu+.90

14
In spite of the promising properties of some metal-doped oxide nanoparticles, like the one
described in the previous paragraph and shown in Table A-1 and A-2, detailed kinetic studies of
the sulfidation of those sorbent systems are rarely available in the literature, and as such, the origin
of the improvement observed in reactivity is unclear. Often, the justification of improved metal
dispersion in the doped solids is invoked to explain a better surface reactivity; however, it’s not
clear how that translates to an increase in the bulk metal oxide reactivity.
Baird et al.91 reported on the hydrogen sulfide sorption capacity of series of cobalt-zinc
oxides at room temperature. The authors reported a 91% conversion for Co3O4, however, Xue et
al.10 reported only a 1% conversion for a similar sorbent. These studies, as well as a few others in
Table A-1 and A-2, suggest at the possible effect of synthesis recipe on particle and crystallite size,
morphology, as well as surface area, which in turn may affect the H2S breakthrough capacity. In
fact, there are several reports exploring desulfurization using different ZnO morphologies.92–95 Our
group recently reported on the chemical reaction of CuO nanoparticles with hydrogen sulfide to
form copper sulfide by investigating the effects of microscopic shape, crystallinity and purity.37
Specifically, we synthesized materials, which had different morphologies (flowerlike, nanobelt-
like, petal-like, spherical, and fiber-like) and physiochemical-chemical properties (crystallite size,
surface area, and pore volume), and tested them in fixed-bed experiments at room temperature and
1 atm. Despite ostensible differences between the various properties of the tested sorbents, a strong
linear relationship was recognized between the sorbents’ sulfur removal capacity and crystallite
size, independent of changes in the materials’ microscopic shape and porosity. What’s ambiguous
is why the effect of surface area, for instance, is absent in one study such as in our work but present
in another such as, in the work of Baird et al.,96 where transition metals co-precipitated with ZnO
produced mixed oxides of higher surface areas, which performed differently. Moreover, Jiang et

15
al.97 studied Cu-Zn and Cu-Zn-Al mixed metal oxides prepared via co-precipitation and multi-
precipitation. Better aluminum dispersion resulted in smaller crystallite sizes and higher specific
surface areas in the samples that contained higher levels of Al. H2S breakthrough capacities also
improved as a result of reducing the thickness of the sulfide shell by effectively reducing the
diffusion path length.
Certainly, quantification of improvements in performance due to physiochemical
properties such as, surface area, crystallite size, and pore volume under similar reaction conditions
at different temperatures for various dopants would be tremendously useful. While it is hard to
draw head-to-head comparisons from the independent studies shown in Table A-1 and A-2 due to
differences in feed compositions, reactor type and volume, definitions of breakthrough
concentration, and gas velocities, the data in those tables aim to highlight (i) the different knobs
that can be turned that may influence H2S capacity, particularly at low to moderate temperatures,
and (ii) promising sorbent materials that require further investigation and characterization.
2.3 Advanced characterization for mechanism and active site identification
In the chemical industry, metal oxide-based materials have been used in the past years for
purification of feedstocks at temperatures ranging between 350 and 500°C.98 However, in some
other applications, requiring sulfur removal, moderate temperatures must be used (200-300°C).9
At these moderate conditions, the reactivity of the sorbents (such as ZnO and CuO) is insufficient.
To rationally design and assess metal oxide-based sorbents, the reactive sorption process must be
understood clearly.
ZnO is a commonly used sulfur sorbent in the industry, despite the mechanism of the entire
process not being fully comprehended. It is accepted that the drop in reactivity of this metal oxide

16
at moderate and low temperatures is the result of a ZnS layer being formed over the oxide, which
passivates the rest of the oxide material and keeps it from reacting further with H2S due to the
diffusional barrier of the sulfide layer. Even though the first stage of the process (the surface
reaction) is quick, the second step (bulk reaction) is much slower.99 In principle, smaller
nanoparticles exposing more atoms on the surface should be preferred so that a greater fraction of
the material reacts in the first stage, and indeed some improvement has been observed.100 However,
even in small nanoparticles, a relatively large fraction of the oxide remains unreacted, as seen in
Figure 2-3, resulting in a much lower conversion than the theoretical stoichiometric capacity.
Figure 2-3: Decrease in sulfur removal efficiency due to formation of a ZnS outer layer that impedes access
to inner ZnO.
In order to increase the removal capacity of oxide-based materials, one must achieve a
complete sulfidation of the bulk material, which means that diffusion through the bulk of the
sulfide layer (e.g. ZnS), must be accelerated. This can be done if the process is properly understood

17
so that rational procedures can be developed to increase the efficiency of the process. To this regard,
Bezverkhyy et al.,90 used advanced characterization in order to shed light on the process of ZnO
sulfidation at moderate temperatures. They studied the sulfidation of pure and Cu-doped ZnO
nanoparticles at 250-350°C by H2S, using electron microscopy (TEM) and in-situ X-ray powder
diffraction (XRD) to characterize, in detail, the microstructure of the ZnS phase formed after
partial and complete sulfidation. The TEM images before and after sulfidation showed ZnO
particles with a compact shell of ZnS over them, which was physically separated from the oxide
core by voids at the ZnO/ZnS interface. Interestingly, sulfidation at 350°C revealed void formation
also, but in this case such voids were of a much lower regularity in shape and size. The formation
of voids was attributed to a consequence of the Kirkendall effect,101 while the differences in them
as a function of the temperature was attributed to lower stability of the voids at higher temperatures.
The authors also performed in situ XRD on pure and Cu-doped ZnO. They found the
absence of a noticeable variation in the crystallite size, attributed to a small width of the reaction
front. Also, when comparing the process on these two materials they found that: 1) nearly a pure
sphalerite phase (ZnS) was formed in both of them and 2) the width of the Bragg peaks of ZnS
decreased sharply with time, indicating that the formed ZnS crystallites grew in size. Specifically,
Cu-doped ZnS showed a rapid growth of these ZnS crystallites, showing that the mobility of atoms
in both materials is quite different. The in situ XRD spectra thus revealed that in Cu-doped
materials the mobility of sulfide anions is much higher than in pure ZnO, which led to a faster
growth of ZnS crystallites. Such acceleration of crystallite growth rate was attributed to the
presence of anionic vacancies formed through Cu1+ charge compensation.102,103 The authors
concluded that the presence of anionic vacancies, probably located at the grain boundaries enabled

18
a strong acceleration of sulfur diffusion, making the inward growth of ZnS more rapid than the
outward one observed for pure ZnO.
Another example of the importance of characterization in shedding light on the
identification of active sites and the mechanism at molecular level is the work by Samokhvalov et
al.9 They studied Cu-doped ZnO particles supported on SiO2 for reactive adsorption of H2S at
room temperature using X-ray diffraction (XRD), Brunauer-Emmett-Teller (BET) surface area
analysis, electron spin resonance (ESR), ultraviolet–visible (UV–vis) and diffuse reflectance
spectroscopy (DRS), and computational modelling using density functional theory (DFT). Their
findings showed that the structural characteristics of ZnO/SiO2 sorbents did not significantly
change when Cu was added as a promoter and yet, sulfur uptake increased significantly.
XRD data showed that at ZnO percentages above 21%, the sorbent exhibits large crystals
whose desulfurization behavior corresponded to a ‘plateau’ in sulfur uptake capacity. XRD data
also showed the presence of supported ZnO in a nano-dispersed form with a crystalline size less
than ~40Å. No additional lines due to copper compounds were found, indicating a high degree of
dispersion of Cu in the sorbent. To further characterize the Cu promoter, they used ESR, a highly
sensitive technique which allows the detection and speciation of various localizations and chemical
states of the same minor component (Cu) in composite materials. Using this technique, they found
that no Cu0 species existed, and Cu was in the materials as Cu2+. More information about the
atomic-level structure of these Cu2+ promoter sites was found using UV-vis DRS. This technique
showed that Cu2+ cations were in an octahedral coordination environment. It also showed a charge
transfer occurred between O 2p orbitals and Cu 3d orbitals. Finally, all these data were combined
with a computational DFT study of a model surface of the sorbent, which showed a distorted
tetrahedral geometry of Cu2+ surface sites, which was consistent with the findings by ESR and

19
UV-Vis DRS, indicating the presence of surface Cu2+ sites featuring a octahedral symmetry with
tetragonal distortions, rather than pure tetrahedral sites. This multidisciplinary study concluded
that Cu2+ acted as promoter by providing surface active sites which showed a higher affinity for
H2S compared to Zn2+ sites. Dhage et al. concluded that on a ZnO surface with some Zn2+ sites
substituted with Cu2+, there can be a displacement of H2O with H2S at the Cu2+ surface sites which
explains the promoter effect of Cu2+ sites.
In another work, Samokhvalov et al. performed a multi-characterization study to shed light
on the active sites of sulfur sorbent.8 They studied Ag/TiO2 sorbents for removal of
desulfurization-refractive polycyclic aromatic sulfur heterocycles (PASHs) from liquid
hydrocarbon fuels, with the objective of identifying active sites for the process. They found that in
this kind of sorbents with this specific synthesis procedure, XPS measurements showed that Ag
was present mainly as an Ag oxide, with minor concentrations existing as Ag2+ (around 0.1% of
total Ag). Furthermore, ESR indicated that the majority of Ag is present in the diamagnetic form
Ag+1. These findings were confirmed by XRD and UV-Vis spectroscopy, which found no optical
adsorption in the relevant spectral UV-Vis range and no XRD patterns of metallic Ag. Further
thermodynamic considerations according to the Ag-O2-N2 phase diagram supported these findings.
They also measured surface areas by O2 chemisorption at 170°C and N2 adsorption. The Ag
specific area they found was 7-14 m2/g, and 114-58 m2/g for the total surface area. The data
indicated that Ag oxide was highly dispersed on the TiO2 support, with the average crystallite size
being 24-69Å depending on the Ag content. Finally, with all these findings, the authors suggested
that based on the oxidation state of the active Ag component of the Ag/Titania sorbent, the
adsorption of thiophene and the PASHs at room temperature could proceed via the non-reactive

20
strong adsorption, without scission of the C–S bond, as what happens with sorbents containing
Ni2+,104 and contrary to those with transition and noble metals in metallic state.40
2.4 DFT and quantum chemistry utility in describing reactive sorption processes
As already shown in this work, reactive sorption involves contacting a fluid with a solid
phase to remove a specific molecule from the fluid via chemical reaction. H2S reacts with metal
oxides to produce a metal sulfide and water. COS and CS2 can react with a metal oxide to produce
a metal sulfide and CO2 or undergo hydrolysis to H2S in the presence of H2O with subsequent
scavenging of the H2S by the metal oxide. Reactive sorption of mercaptans is more complex
because these molecules can undergo catalytic reactions to form larger oligomers, desulfurization
reactions to form alkenes and H2S, oxidation reactions to form disulfides, water, and a reduced
metal oxide, or chemical reaction to form copper thiolates or copper sulfides. For this reason, most
of the scientific literature regarding computational studies on reactive sorption of sulfur
contaminants has been restricted to the simple molecule of H2S, with few exceptions such as SO2
or thiophene. Such literature, for the most part, have focused on studying the interaction between
metal oxide surfaces with the concomitant molecular or dissociative adsorptions. Many of them
have studied subsequent steps of dissociative adsorption of H2S resulting in adsorbed S and OH
groups on the surface, while other works have gone further exploring surface reactions of these
fragment eventually yielding water or H2.
Most of the studies use Density Functional Theory (DFT)105,106 as the computational
method of choice, thanks to its accuracy at a reasonable computational cost. It is an ab initio
quantum chemical technique nowadays considered as the standard method for calculating energies,
determining reaction pathways and modelling geometries of reactive surface sites.107 This section
of the review focuses on the computation work done on metal oxides only, Figure 2-4 and Table

21
A-3, leaving out the studies involving more complex species such as molecular clusters of metal
oxide ions.108
Figure 2-4: Model structure of four metal oxide surfaces commonly studied. They are ZnO(0001),
CuO(111), CeO2 (111), and MgO(001), in order of most to least discussed in this review.
2.4.1 DFT computational studies for the sulfidation of ZnO-based sorbents
As previously stated, ZnO is one of the most widely used materials for removal of sulfur
compounds from gaseous streams. Its major advantages are the high sulfur adsorption capacity
and the favorable thermodynamics of the sulfurization reaction.109 Recent interest has focused on
low-temperature sulfur adsorbents based in ZnO and operate in the range of 25-100°C,110 since
temporal deactivation of high-temperature desulfurization sorbents occurs partly due to the
destruction of their 3D structure. Similar to the wealth of experimental work carried out on ZnO
sorbents, most of the computational studies focus on ZnO-based sorbents too.
Early computational studies on ZnO sorbents date back to the late 90s, such as the one
carried out by Casarin et al..111 They conducted a DFT study focused on the chemisorption of H2S
on ZnO (0001) and (10-10) crystallographic surfaces. Using the so-called Local-density
Approximation (LDA)112 coupled with a molecular-cluster approach, they simulated ZnO surfaces
using a Zn22O22 cluster for the (0001) and a Zn18O18 one for the (10-10) surface, onto which they

22
adsorbed H2S. They observed that molecular adsorption is favored over dissociative adsorption
yielding SH and OH adspecies for the (0001) surface (133 vs 28 kJ/mol). However, they observed
the opposite case for the (10-10) which favors the dissociative adsorption (152 vs 248 kJ/mol for
molecular vs dissociative adsorption).
Rodriguez et al. also performed DFT studies on (0001) ZnO surfaces.113 Using the
Generalized Gradient Approach (GGA)114 and periodically repeating slabs to model continuous
ZnO surfaces,115 they investigated the adsorption and decomposition of H2S molecules. They
found that strong bonding occurred between H2S and S-containing dissociated species and the
reactive surface. The bonding energies of the adsorbates followed the sequence: H2S (-84 kJ/mol)
< HS (-152 kJ/mol) < S (-256 kJ/mol). They also tested the influence of surface coverage and
found it proportional to the adsorption energies (-256 kJ/mol at 0.25 monolayer vs. -236 kJ/mol at
0.50 monolayer). Additionally, they observed how the smaller degree of ionicity of ZnO compared
to other metal oxides such as MgO leads to larger electron densities around Zn atoms which
enhances their reactivity towards S-containing molecules.
It should be noted that while some studies focused on the polar Zn-terminated (0001)
surface111,113,116, since it is one of the simplest ZnO surfaces, the (1010) surface is important as
well because of its thermodynamic stability and, even more importantly, because it was found
experimentally to dominate ZnO nanoparticles and powders.117 To this regard, Wang et al.118
studied the (10-10) surface. They modelled not just the dissociative adsorption of H2S and
formation of adspecies, but also further steps involving a proton hopping processes which could
yield either molecular H2 or water. Their calculations were carried out using GGA-DFT with the
PW91119 exchange-correlation function and a double-numeric quality basis set with polarization
functions (DNP), being the basis set comparable to that of Gaussian 6-31G**. In a similar way to

23
the aforementioned work of Rodriguez et al.113, they found a preferential dissociative adsorption
of H2S. As for adsorbed species, they found that both SH and S adspecies have a tendency towards
bridge-like coordination with two Zn atoms, whereas hydrogen atoms prefer one-fold coordinated
adsorption on O-top sites. Regarding the reaction pathway yielding a water molecule (coming from
the proton hop on one hydroxyl to another), it was found both kinetically and thermodynamically
more favorable than the one yielding hydrogen (Eactivation= 319 (H2O) vs. 421 (H2) kJ/mol, Ereaction
= 166 (H2O) vs. 220 (H2) kJ/mol).
Goclon et al. also studied the (10-10) ZnO surface at the DFT level using the Perdew-
Burke-Ernzerhof (PBE)120 exchange-correlation functional together with a planewave basis set and
Vanderbilt ultrasoft pseudopotentials.121 In this work they also the so-called Hubbard-U method
for a more accurate description of Zn 3d electronic states.122,123 Again, they found a preference for
H2S towards dissociative adsorption. They found essentially no activation barrier for the first S-H
bond cleavage (yielding SH and OH groups on the surface), whereas they observed an activation
energy of 48 kJ/mol for the second one (yielding adsorbed S and two OH groups). They also found
preference of bridge-mode adsorption for surface species. However, upon increased surface
coverage, SH groups shifted to single-coordinated environments due to stronger repulsion between
neighboring molecules.
Another ZnO-related study was carried by Dhage et al. .109 In a multidisciplinary work
involving characterization techniques and DFT studies, they investigated the H2S adsorption
mechanism of Cu-promoted ZnO nanoparticles supported on SiO2. They employed the hybrid DFT
method B3LYP124,125 together with the LANL1MB basis set for geometry optimization and the 6-
31G(d) for refined energies. They used quantum mechanical slab models consisting of Zn37O37
CuZn37O37 to simulate ZnO/SiO2 desulfurization sorbents and investigated the dissociative

24
adsorption of H2S and S-H bond cleavages on the surface to yield an adsorbed S atom and two
hydroxyl groups. In the CuZn37O37 model they tested the Cu atom as the active site for adsorption
of a H2S molecule and then compared it with adsorption on a Zn center on the Zn37O37 to account
for the effect of Cu. They found that the activation barrier for the first S-H bond cleavage (H2S →
SH + H) is similar on both pure and Cu-promoted ZnO models. However, the barrier for the second
S-H bond cleavage was found to be notably lower (140 kJ/mol difference) for Cu-promoted ZnO.
The easier reduction of Cu2+→ Cu+ compared to Zn2+→ Zn+ facilitates the migration. They
concluded that when a copper atom replaces a zinc atom on the ZnO surface, the reaction is driven
to complete dehydrogenation of H2S by the high stability of the Cu-S bond.
Finally, in the case of ZnO, it is worth mentioning the computational work by Wang et al.,
in which he studied the regeneration process of ZnS back to ZnO.118 This is paramount because a
good desulfurizer must exhibit not only high affinity towards sulfur but also must be able to be
converted back from the sulfide to the oxide form for subsequent sequestration cycles.129
Following the regeneration reaction with molecular oxygen: ZnS + 3/2 O2 → ZnO + SO2, Wang’s
group studied via DFT GGA level and the PW91 exchange-correlation functional the reaction of
S adatoms on the surface with O2, producing SO2. They found that the process had two elementary
steps (adsorption of S and O2, and bonds rearrangements to form adsorbed SO2 on the surface) and
that the activation energy for the rate limiting step was just 36.79 kJ/mol, meaning that sulfide
ZnO surfaces could be regenerated relatively easily. They tested as well reduced (10-10) surfaces
and found they were regenerable as well, with an activation energy of 29.43 kJ/mol.

25
2.4.2 DFT computational studies for the sulfidation of CuO-based sorbents
CuO sorbents, which are the focus of this dissertation work, are known for their high
efficiency in sulfur removal.130,131 Thermodynamics suggest that lower equilibrium levels of H2S
can be achieved with CuO compared to Fe2O3 and CaO at temperatures below 800°C.132 Indeed,
experimental results by Jiang et al.133 on mixed Cu-Zn and Cu-Zn-Al materials showed that Cu-
rich sorbents are more suitable than Zn-rich ones, mainly because of the faster sulfidation rate of
CuO compared to ZnO.
Computational studies on sulfur removal using CuO have focused on the (111) surface as
it is the most stable one, i.e. lower surface free energy,134 and because it is found experimentally.37
To this regard, recent studies such as those Sun et al.135 and Zhang et al.136 investigated the
dissociative adsorption of H2S on this surface. For the former, they investigated the sequential
abstraction of hydrogen atoms from H2S until the transformation to elemental sulfur bonded to
surface copper atoms, similar to the computational work on other metal oxides. Sun et al. used the
GGA approach within DFT with the PW91 exchange-correlation functional together with double
numerical basis with polarization functions (DNP) and effective core potentials for the inner
electrons of Cu.137 Since DFT computations do not take formal van der Waals dispersion forces
into account, they used a DFT-D correction to account for them. A 3x2 supercell slab was used to
model the CuO (111) surface. There, they found that upon dissociative adsorption of H2S the most
stable configurations for SH and S adspecies is a bridge mode with two 4-fold coordinated Cu
atoms (labelled as Cusub), with H atoms from H2S adsorbing preferentially on surface O atoms with
a 3-fold coordination. In addition, they observed that the activation energies for the
dehydrogenation process of H2S exhibited 2.42 and 23.10 kJ/mol for the first (H2S → SH) and
second (SH → S) dehydrogenation steps respectively, which indicates that the dissociative
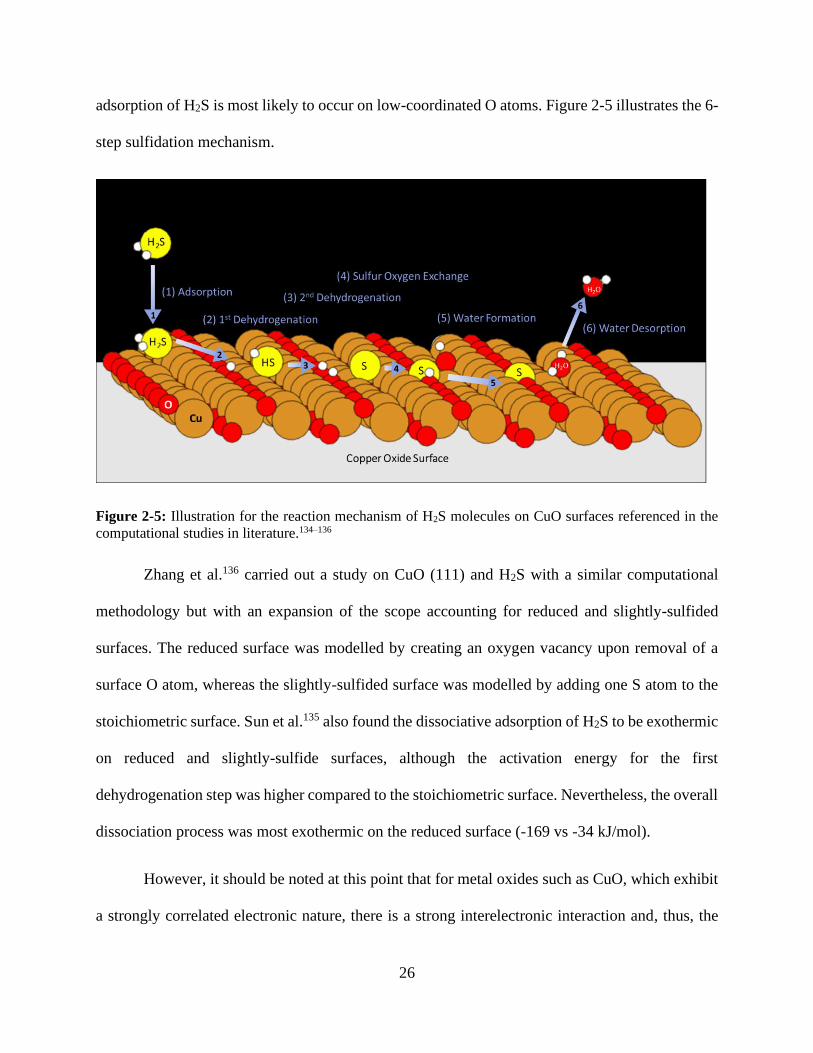
26
adsorption of H2S is most likely to occur on low-coordinated O atoms. Figure 2-5 illustrates the 6-
step sulfidation mechanism.
Figure 2-5: Illustration for the reaction mechanism of H2S molecules on CuO surfaces referenced in the
computational studies in literature.134–136
Zhang et al.136 carried out a study on CuO (111) and H2S with a similar computational
methodology but with an expansion of the scope accounting for reduced and slightly-sulfided
surfaces. The reduced surface was modelled by creating an oxygen vacancy upon removal of a
surface O atom, whereas the slightly-sulfided surface was modelled by adding one S atom to the
stoichiometric surface. Sun et al.135 also found the dissociative adsorption of H2S to be exothermic
on reduced and slightly-sulfide surfaces, although the activation energy for the first
dehydrogenation step was higher compared to the stoichiometric surface. Nevertheless, the overall
dissociation process was most exothermic on the reduced surface (-169 vs -34 kJ/mol).
However, it should be noted at this point that for metal oxides such as CuO, which exhibit
a strongly correlated electronic nature, there is a strong interelectronic interaction and, thus, the

27
dynamics of electrons are greatly influenced by the rest of the electrons. In these systems, the
exchange-correlation functional approximations of standard DFT fall short of properly capturing
quantum exchange and correlation effects, giving rise to difficulties in accounting for electron
localization.138 One solution is the so-called Hubbard U approach, in which an additional
parameter, namely the Hubbard U, is introduced for electrons to properly describe the on-site
Coulomb interaction .139 The on-site Coulomb correction potential U is introduced as an energy
penalty on the delocalization of electrons, thus restricting the amount of delocalization done by
standard DFT methods. Its easy implementation coupled with marginal additional computational
cost makes it a good choice compared to other higher level functionals and a good choice for
studying surface reactivity of highly correlated metal oxides. This approach has been used for
adsorption studies on CuO (111).140–142 It should be noted that the aforementioned studies on CuO
did not take into account this fact and therefore did not include any correction of this type. In
addition, these studies only reached the dehydrogenation processes of a single molecule of H2S
leading to adsorbed S and OH groups, which does not give any insight about the process on further
stages beyond the initial step. These facts led our group to perform a new computational study on
this matter.
In a study performed by the authors of this work, we investigated the complete reaction
between H2S and CuO to form H2O and CuS. After two dehydrogenation steps of the H2S molecule
to give rise to adsorbed S and two OH groups, there is a proton hop between the latter groups,
which gives rise to an adsorbed water molecule. The vacancy left by the water molecule is healed
by the S atom. Therefore, the process results in an exchange of one O atom from the CuO lattice
by a S atom, together with removing H2S and forming water. In order to account for later stages

28
of the reaction, we studied also the process in a highly-sulfided surface with most of the O surface
atoms already exchanged by S atoms.
We used GGA+U approach of DFT with the PBE exchange-correlation functional and a
planewave basis set, modelling the CuO (111) surface with a 2x1 supercell slab. It should be noted
that we carried out the same study on the (-111) surface, which is the second most stable CuO
surface and we found similar results as in the (111). We found the whole process of forming CuS
(CuO1-xSx more specifically) and H2O from CuO and H2S to be thermodynamically favorable
(ΔGT=298K = -106 kJ/mol). The elementary steps that comprise it can be organized into two different
groups: Proton hopping processes in which one proton gets transferred from one group to another,
and migration of heavier groups. As for the second type of elementary steps, migrations of heavier
atoms, we found that migration of hydroxyl species from the lattice position is energetically costly
in most cases. Indeed, we found that it was one of the most energetically demanding steps of all
the mechanism, together with the initial molecular adsorption of H2S that is inhibited by the
entropy loss. On the other hand, the healing of an oxygen vacancy by a sulfur atom was found to
be favorable.
In agreement with the other studies on the (111) surface, we found a greater reactivity on
lower coordinated O atoms: ΔGT=298K = -106 kJ/mol on O atoms with coordination number (CN)
3, whereas ΔGT=298K = -52 kJ/mol for O atom with CN=4. This is in agreement with experimental
data that shows how smaller CuO particles have a greater sulfur removal capacity: As the particle
size decreases, the population of low-coordinated O atoms increases due to an increase in defects,
dislocations and edges, which in turn increase the reactivity of the particle.
In addition to improved surface reactivity, low-coordinated O atoms may facilitate the
diffusion of O atoms through the bulk of the metal oxide by enhancing the creation of oxygen

29
vacancies. This is important from the mechanistic point of view because solid diffusion of atoms
plays a fundamental role in the overall process of reactive sorption in metal oxide materials. A
previous work by Elliott et al. studied the formation of oxygen vacancies on (111) CuO surfaces
via vacuum annealing and H2 reduction.140 They observed that formation of oxygen vacancies is
more favorable for O3c than for O4c atoms (265 vs. 314 kJ/mol): A vacancy formed via
displacement of lattice O by formation of a OH group is thermodynamically favorable for O3c
atoms but unfavorable for O4c ones. All of this, points towards the fact that oxygen vacancies may
be formed to a greater extent when the population of low-coordinated O atoms increases (smaller
particle size) which may also enhance solid diffusion across the bulk of the material needed to
complete the reactive sorption process at later stages.
Finally, two more findings worth noting were related to the later stages of the reaction,
namely the process on highly-sulfided CuO surfaces. Reaction with O4c atoms in a bare CuO
surface results in ΔGT=298K = -52 kJ/mol, whereas ΔGT=298K = -101 kJ/mol is observed for partially-
sulfided surfaces in which the outer O3c atoms have been replaced by S atoms. The reactivity of
the O4c atoms increases because S atoms disrupt the Cu-O bonding states inducing lattice strain.
Additionally, it was also found that sulfur exhibits a tendency towards forming covalent bonds
with itself. Results on the (111) surface showed a thermodynamically favorable process for the
formation of S2 dimers from sulfur adatoms present on the surface, with a calculated Gibbs free
energy of reaction of ΔGT=298K=-47 kJ/mol. This kind of dimers are present in the CuS phase
experimentally formed, namely Covellite, providing a hint for the mechanism to complete
sulfidation of CuO.
Another copper which has found its use in reactive sorption processes is Cu2O. Wang et al.
performed computational studies on the (111) surface of Cu2O (the most stable Cu2O surface)144

30
analogue to the studies described above for CuO.145 Wang et al. made use of DFT with the Becke-
Lee-Yang-Parr (BLYP) exchange-correlation functional,146 double-numerical basis with
polarization functions for valence electrons, and basis effective core potentials for inner electrons.
A 2x2 supercell slab was used as Cu2O model. They probed both the molecular and dissociative
adsorption of H2S and found that dissociative adsorption occurred predominantly on reduced
surfaces with oxygen vacancies present. Similar to the studies on CuO, the dissociative pathway
for Cu2O was found to be exothermic on both the stoichiometric and reduced surfaces (E=-95
kJ/mol and -148 kJ/mol respectively), again with lower-coordinated O atoms being the most
reactive ones. From the kinetic point of view, dehydrogenations show activation barriers at around
50 kJ/mol, which are in agreement with experimental findings that showed sulfur present on Cu2O
(111) surfaces via variable-energy photoelectron spectroscopy.147
Stenlid et al. used a different approach to study the interaction between sulfur and Cu2O.148
In this computational study they investigated early stages of the sulfidation of Cu2O (111) and
(100) surfaces by sequentially exchanging O atoms of Cu2O by S atoms. Through this approach,
they were able to test the thermodynamic stability of the overall process as reaction cycles went
on in which H2S was consumed and water formed (together with the process Cu2O →Cu2O1-xSx).
Using GGA+U DFT level of theory and D3 for dispersion corrections, they found that the
replacement of O atoms with S atoms is thermodynamically favorable for all stoichiometries
(Cu2O1-xSx) up to pure Cu2S for both (111) and (100) surfaces (ΔGT=298K=-683 and – 852 kJ/mol
respectively). They also observed that it is more thermodynamically favorable to completely
sulfide the first layer rather than the next sublayer partially, indicating that the sulfidation process
of the sorbent may proceed on a layer-per-layer fashion.

31
2.4.3 DFT computational studies for sulfidation of less common metal oxide sorbents
Ceria (CeO2), a well-known metal oxide in catalysis and other technical application has
been subject to several computational studies as well. For example, both Chen et al.149 and Yildiz
et al.150 used GGA+U and the PW91 functional to study the dissociative adsorption of H2S on the
(111) surface of CeO2, testing different pathways from H2S dissociating leading to H2O, H2 and
SO2 as products. However, the latter group, whose results were closer to experimental findings,
found that none of such pathways were energetically favorable, with activation barriers greater
than 182 kJ/mol and reaction energies of around 96 kJ/mol. Only when the surface was previously
reduced containing oxygen vacancies the pathways were energetically favorable.
Mixed oxides of Ceria-Lanthanide were studied as well by DFT (GGA+U). Janik et al.151
investigated dissociative adsorption of H2S over Ce16O32, La2Ce14O31 and Tb2Ce14O31 model slabs,
and found that the dissociation for the first S-H bond (H2S → SH) was the rate limiting step with
barriers greater than 211 kJ/mol on all three cases. However, the apparent activation energy for
dissociative H2S adsorption was much larger in pure Ceria compared to mixed La and Tb oxides,
suggesting that the larger sulfur uptake capacity experimentally observed for Ceria-Lanthana is
due to faster surface kinetics.
Finally, other sulfur-containing molecules rather H2S were computationally studied on
Ceria-based materials. For instance, the reduction of SO2 to S by CeO2 (111) and (110) surfaces
was studied using GGA+U by Hermansonn et al. .152 They observed that, under reducing
conditions, sulfide species were the most stable species on the (111) surface whereas sulfate
species were predominant on the (110) surface. However, under oxidizing conditions sulfates
dominated both of them. They also found that the reduction process followed a Mars-van Krevelen
mechanism, for which the activation barrier was relatively low (less than 100 kJ/mol). Similarly,

32
the same group found that when adsorbing sulfur rather than SO2, it was likely to be found within
the lattice replacing when present in the (111) surface, but on the lattice as SO22- when interacting
with the (110) surface.
MgO can be also found as the matter of several computational studies regarding adsorption
of sulfur-containing compounds. For example, Bagheri et al. used DFT (B3LYP) to study the
adsorption and dissociation of H2S over MgO nanotubes.153 They found a barrierless process for
the non-dissociative molecular adsorption, whereas the dissociative adsorption consisting of H2S
→ SH showed an activation barrier of 16 kJ/mol respectively and an adsorption energy of -104
kJ/mol, with these low values found on low-coordinated Mg centers.
Since MgO surfaces were not found to be as active for sulfur uptake as other metal oxides,
like ZnO, some authors like Rodriguez et al. explored other altered MgO-based materials such as
Ni-doped MgO and mixed CrxMg1-xO.113,154 For the former, when Mg centers are replaced by Ni,
new electronic states are created above the occupied O 2p + Mg 3s band. In these systems there is
a large electron density around Ni centers, which provides strong bonding for S and SH species
adsorbed on the surface. Indeed, the H2S adsorption energy increase from 36 kJ/mol in pure MgO
to 68 kJ/mol. Similarly, an enhanced sulfur removal activity is found for mixed CrxMg1-xO. In this
case Cr atoms have a lower oxidation state than the atoms in Cr2O3 and exhibit occupied 3d levels
that are less stable than the valence bands of MgO. Both properties favor strong interactions with
the orbitals of S-containing molecules.
The current studies in the literature have mainly dealt with H2S interaction on selected
metal oxides, most of which strongly bind to H2S and normally dissociate it into elemental sulfur

33
and OH groups, going beyond simple molecular adsorption. Strong adsorption energies of several
kJ/mol are often obtained via computational modelling. Several theoretical studies point out how
modification in the type of mixed oxides or doping may induce even more affinity towards sulfur
contaminants. Sulfur species in the form of SH or S atoms are found to form strong metal-sulfur
bonds with metal surface centers whereas protons from H2S are transferred to surface O atoms
resulting in hydroxylated surfaces. However, reactive sorption is a complex phenomenon which
goes beyond dissociative adsorption of sulfur-containing molecules, especially in the later stages
of the reaction. Understanding both the transformation of the bulk of a metal oxide into a metal
sulfide and other phenomena such as solid diffusion across the oxide and sulfide phases are equally
important to fully explain the reactive sorption at the atomic level.143

34
Chapter 3 | Linear Driving Force Approximations as Predictive Models for
Reactive Sorption
3.1 Introduction
To optimize the use of CuO-based materials in an industrial setting, modeling the reactor
in which the reactive sorption process takes place becomes an important task. In this process, the
contact between contaminant molecules and solid phase can be studied at three scales: the bed
scale, the pellet scale and the grain scale as demonstrated in Figure 3-1.171 The contaminated gas
flows through a packed bed of granular medium whose properties change in space and time upon
the progression of the process. The contaminant travels from the bulk of the flowing gas to the
pellet surface and diffuses through layers of product phase and pores of fresh materials to reach
the crystallite surfaces available for reaction.172 At the surface of the grain, H2S gas reacts
heterogeneously with solid CuO forming Copper (II) sulfide (CuS) and water.
Figure 3-1: Demonstration of the three levels of the process of H2S removal in a bed of a CuO-based
sorbent: Packed bed, pellet and grain levels.

35
The complexity of this multi-scale process and its dependency on the sorbent and
contaminant’s properties led to the development of various models such as the single pore
model,173 random pore model,174 volume reaction model,175,176 nucleation model,177,178 grain
model,179,180 and incremental model.1,12 In this work, we apply mathematically simple linear
driving force models to describe the system in terms of the sorbent removal capacity (qs, g H2S/
100 g sorbent) and the sorption rate parameter. These models provide quantitative approximation
for adsorptive systems when the equilibrium constant is sufficiently large181 as is the case for
reactive sorption of hydrogen sulfide using CuO (>1020).
The concentration-time profiles of H2S contaminant in the reactor effluent were analyzed
using two linear driving force models: a solid film-based model derived initially by Cooper182 and
a quasi-chemical model derived by Bohart and Adams.183 A range of process conditions (sorbent
pellet size, contact time, temperature, pressure and contaminant concentration) were varied to
probe their effects on the parameters if the models as well as to determine apparent rates of
reaction/diffusion occurring at the molecular scale.
3.2 Experimental Methods
3.2.1 Materials and characterization
A CuO-ZnO-based sorbent was purchased from Alfa Aesar (HiFUEL W230; 63.5 wt. %
CuO, 25 wt. % ZnO and 10 wt. % Al2O3; lot number: L04Y006). The sorbent is received as 5.5
mm x 3.65 mm cylindrical pellets which were crushed and sieved to obtain agglomerates with
various size distributions within a range of 75-1000 microns.
Scanning electron microscopy (SEM) images were collected on a Nova Nano 230. An ETD
detector and 10 kV accelerating voltage settings were used for all the scans with magnifications

36
ranging from 100x to 15000x. The system was used simultaneously to obtain energy dispersive X-
ray spectra (EDS) of the material before and after sulfidation to provide qualitative and quantitative
evidence of elemental composition for the surface layers. X-ray diffraction patterns in the range
of 0°-100° 2θ° (at the rate of 20°min-1) were obtained on JEOL JDX-3530 and Philips X-Pert
diffractometers with Cu Kα radiation. The Brunauer-Emmett-Teller (BET) method was used to
evaluate surface area and total pore volume of fresh and spent samples from N2 physisorption
isotherms collected on a Micrometrics ASAP 2020 Plus unit. Prior to N2 adsorption, the sample
was degased at 120 °C for 12 hours under controlled pressure of 10 microns of mercury
3.2.2 Fixed-bed experiments
Reactive sorption of H2S was studied in an apparatus with plug-flow hydrodynamics shown
schematically in Figure 3-2. Flow rates of gaseous H2S and N2 were introduced via mass flow
controllers (MKS GE50A and GM50A). Feeds to the reactors consisted of H2S in N2 (900-2200
ppm-vol) and were produced by diluting a 1.01% H2S (Praxair UHP) in N2 mixture with UHP N2.
Sorbent samples (150-500 mg) were fixed between plugs of quartz wool in 0.25-inch, outer
diameter, tubular stainless-steel reactors. All gas transfer lines, and the interior of the reactor were
treated with an inert coating (SilcoNert 2000) to mitigate H2S adsorption onto tubing walls. A
resistively heated jacket with a PID temperature controller (TEMPCO EPC-100) were used to
regulate reactor temperature (21-200 °C). Downstream back pressure regulator is used to control
and adjust total pressure (1-2 atm). Compositions of feed and effluents were determined using
online gas chromatography (Agilent 7890B) with a sulfur chemiluminescence detector (SCD;
Agilent 755) and continuous gas phase FTIR spectroscopy (MKS Multigas).

37
Figure 3-2: Schematic of fixed-bed reactive sorption testing apparatus
3.2.3 Cooper and Bohart-Adams models development
Reactive sorption of hydrogen sulfide from a gaseous stream can be described by the mass
balance across a differential element of the bed as follows:184
𝒗 (𝜹𝑪
𝜹𝒁)
𝒕+ (
𝜹𝑪
𝜹𝒕)
𝒛+
𝟏 − 𝜺
𝜺∙ (
𝜹𝒒
𝜹𝒕)
𝒛= 𝟎 (𝟕)
where 𝑣 is the axial interstitial velocity of fluid, 𝑧 is the axial distance coordinate in the
direction of the flow, 𝐶 is the concentration of the contaminant in the bulk fluid, 𝑡 is time, 𝜀 is bed
void fraction (obtained from Ergun equation) and 𝑞 is the average concentration of contaminant in
the solid phase.

38
This equation is derived based on several assumptions about the system. The first
assumption is that the dispersive terms are negligible which is justified by the system’s large axial
aspect ratio, 𝐿 𝑑𝑝⁄ > 50,185 where L is the bed depth and dp is the pellet diameter. Since axial
dispersion can be neglected, it’s reasonable to assume a plug flow and a constant velocity in the
axial direction. Moreover, the velocity and concentration are assumed to be invariant in the radial
direction because of the plug flow assumption. The high 𝐷 𝑑𝑝⁄ ratio, where D is reactor diameter,
guarantees minimal channeling effects and constant interstitial velocity (>20 in this study).186
Finally, the system is assumed to be isothermal as it’s well isolated and the temperature is
controlled along the length of the bed. To solve Equation 7 for the contaminant concentration,
Bohart-Adams model proposes a quasi-chemical law that describes the overall sorption rate (𝛿𝑞
𝛿𝑡)
as follows:184
𝜹𝒒
𝜹𝒕= 𝒌𝒂𝑪(𝒒𝒔 − 𝒒) (𝟖)
where 𝑘𝑎 is the sorption rate constant and 𝑞𝑠 is the maximum saturation capacity achieved at
equilibrium. The main assumption for this model is that the capacity of the sorbent is fixed at qs
and is independent of the concentration of contaminant in the gas phase (rectangular isotherm).187
The resulting concentration profile becomes:
𝑪
𝑪𝟎=
𝒆𝝉
𝒆𝝉 + 𝒆ƺ − 𝟏 (𝟗)
where 𝜏 = 𝑘𝑎𝐶0[𝑡 − 𝐿𝑣⁄ ], ƺ = (𝑘𝑎𝑞𝑠𝐿 𝑣⁄ )((1 − 𝜀) 𝜀⁄ ), and 𝐶0 is the contaminant concentration
in the inlet stream. Cooper applied a different linear driving force equation where the overall
sorption rate is described as follows:182

39
𝜹𝒒
𝜹𝒕= 𝒌(𝒒𝒔 − 𝒒) (𝟏𝟎)
where k is the adsorption rate parameter. The analytical solution of the coupled PDE-ODE system
(Equations 7 and 10) is a piece-wise equation:
𝑪
𝑪𝟎= 𝟏 − ƺ𝒆−𝝉, ƺ≤1 (11)
𝑪
𝑪𝟎= 𝟏 − 𝒆 ƺ-τ-1, 𝟏 ≤ ƺ≤1+τ (12)
𝑪
𝑪𝟎= 𝟎, ƺ≥1+τ (13)
where 𝜏 = 𝑘[𝑡 − 𝐿𝑣⁄ ] and ƺ = (𝑘𝑞𝑠𝐿 𝐶0𝑣⁄ )((1 − 𝜀) 𝜀⁄ ). These models relate the properties of the
material and the experimental conditions to the concentration-time profile (breakthrough curve) of
the contaminant in the effluent of the reactor. The two parameters (the sorption rate parameter (k)
and the maximum saturation capacity (𝑞𝑠)) are regressed from breakthrough curve data using
Excel’s GRG nonlinear least squares solver. Alternatively, the saturation capacity can be
determined by integrating the breakthrough curve after the effluent concentration reaches the inlet
concentration. In these instances, the linear driving force models reduce to single parameter models
(the sorption rate parameter).
The rate parameter (k) consists of contributions to the overall sorption rate from (i)
diffusion in the bulk fluid, (ii) diffusion in the pores of the solid, and (iii) diffusion through product
phase/ reaction occurring at the surface of the reactive phase according to Equation 14:7
𝟏
𝒌𝑲=
𝒅𝒑
𝟑𝒌𝒇+
𝒅𝒑𝟐
𝟏𝟓𝜺𝒑𝑫𝒑+
𝟏
𝒌𝒓𝒙𝒏 (𝟏𝟒)
= 𝑹𝒃 + 𝑹𝒑 + 𝑹𝒓𝒙𝒏 (𝟏𝟓)

40
where dp is the radius of the pellets of the solid phase (derived from particle size distribution
measurements), Dp is the effective diffusivity of the contaminant within the pores of the pellet, kf
is the fluid film mass transfer coefficient, and Ɛp is the porosity of the solid pellets obtained from
N2 physisorption. The distribution parameter (K) is the ratio of the contaminant in the solid phase
to that in the fluid phase at equilibrium (qs/C0). The lumped rate parameter (krxn) contains
contributions from both the rate of reaction at the grain surfaces and diffusion of molecules through
solid reactant/product phases.
The value of kf can be determined using the equation for the Sherwood number as
follows:
𝒌𝒇 =𝑫𝑴𝑺𝒉
𝟐𝒅𝒑, 𝑺𝒉 = 𝟐 + 𝟏. 𝟏𝑺𝒄
𝟏𝟑𝑹𝒆𝟎.𝟔 (𝟏𝟔)
where Sc is the Schmidt number, Re is the Reynolds number2,188 and DM is the molecular
diffusivity of the contaminant molecule in the bulk gas phase which is calculated as follows:189
𝑫𝑴 =𝟎. 𝟎𝟎𝟐𝟔𝟔𝑻
𝟑𝟐
𝑷𝑴𝑨𝑩
𝟏𝟐 𝝈𝑨𝑩
𝟐 𝛀𝑫
(𝟏𝟕)
where T is the absolute temperature (K), MAB is the average molar mass (g/mol), P is the pressure
(atm), 𝜎𝐴𝐵 is the average collision diameter (Å) and ΩD is a temperature-dependent collision
integral.
The contribution from pore diffusion can be determined by calculating the value for Dp
from the sum of diffusion in the macro- and mesopores of the solid according to:
𝑫𝒑 =𝑫𝒕
𝝉 ,
𝟏
𝑫𝒕=
𝟏
𝑫𝑴+
𝟏
𝑫𝑲 (𝟏𝟖)

41
Finally, the Knudsen diffusivity is given by:
𝑫𝑲 = 𝟗𝟕𝟎𝟎𝒓(𝑻
𝑴𝑨𝑩)
𝟏𝟐 (𝟏𝟗)
where r is the pore radius and 𝜏 is the tortuosity (assumed to be 3 for spherical pellets).190
3.3 Results and Discussion
3.3.1 Identification of reaction products and effects of sulfidation on sorbent morphology
During reaction with H2S, bulk conversion of CuO occurs in which crystalline CuO forms
smaller crystallites of CuS leading to pore structure changes within the solid.28 SEM and EDS
analyses and N2 physisorption were conducted on the sorbent materials before and after reaction
with H2S to identify solid phase reaction products and to probe the effects of reaction on solid
morphology.
The SEM micrograph in Figure 3-3 shows fresh CuO sorbent agglomerates between 75-
125 microns at 100x magnification. Individual agglomerates consist of various shapes from
crushing and sieving of the initially cylindrical pellets to achieve the desired size range. The
particle distribution analysis (Figure 3-3) shows that the mean agglomerate size is 78.4 µm with a
mode of 74.0 µm. The mean agglomerate size was used as the agglomerate diameter when
calculating uptake resistances from pore and bulk diffusion according to Equation 14. Moreover,
the pellet size distribution analysis suggests that the average difference between particles’
minimum and maximum diameters is 8 microns (10.5% of the average pellet size), thus, spherical-
shaped particles are assumed for these calculations.

42
Figure 3-3: SEM image of the CuO-based sorbent (75-125-micron pellets; 120-200-mesh) at 100x and a
particle size distribution analysis of the sorbent generated by ImageJ software.
Figure 3-4 shows SEM micrographs at 10,000x and 15,000x magnification before and after
reaction with 110 cm3(STP) min-1 of 930 ppm H2S/N2 at ambient temperature (294 K) and pressure
(1.1 atm). The initial material in Figure 3-4A and 1B exhibited a textured surface with macro-
voids which diminished after sulfidation (Figure 3-4C and 1D). This apparent decrease in the
volume of voids is also reflected in changes in surface area (via the BET method; Table 3-1) which
decreased from 67.3 to 17.6 m2·g-1 after sulfidation at room temperature.

43
Figure 3-4: SEM images of fresh CuO-based sorbent (75-125-micron pellets; 120-200-mesh) at 10000 x
magnification in A and C and 15,000 x magnification in B and D. A-B scans are of fresh materials while
C-D set are taken after sulfidation with 110 cm3(STP) min-1 of 930 ppm-vol H2S/N2 stream at temperature
of 294 K and 1.0 atm pressure. Arrows point to cracks in the particles that form after sulfidation.
Figure 3-4 also shows an appearance of cracks on the agglomerates’ surface after reaction
(arrows in Figure 3-4C and 1D). These fractures may be the result of the volume expansion
accompanying the conversion of CuO (Crystal density of 6.32 g⋅cm-3) to CuS (4.76 g⋅cm-3) which
is the predominant product identified by XRD and EDS as discussed below. Despite these changes
in volume and texture, the SEM images of the sulfided agglomerates indicate that they retained
their initial sizes/shapes without a complete fracturing of 75-125 micron agglomerates into a
distribution of smaller particles. The retention of the initial overall shape may be the result of ZnO
and Al2O3 phases that are unreactive at these conditions and thus serve as a binder for the CuO.28

44
Finally, the surface area of adsorption and total pore volumes obtained from BET
measurements for fresh sample and selected spent samples are summarized in Table 3-1. The
measurements show a 3.8-fold decrease in surface area and a 2.7-fold decrease in pore volume
upon sulfidation of the sorbent at room temperature with 1000 ppm-vol H2S/N2. This drastic
decrease of porosity resulted in an increase in diffusion resistance which explains the incomplete
sulfidation of sorbent at room temperature and pressure. The table also shows a slight but
consistent increase in pore volume with temperature increase, from to 0.051 cm3g-1 at 294 K to
0.083 cm3·g-1 at 383 K. It also shows an increase in surface area from 17.6 to 29.8 m2·g-1 as
temperature increased from 294 K to 383 K. This increase in porosity with temperature aligns
with the observed enhancement in conversion.
Table 3-1: Summary of pore volume and BET surface area of N2 adsorption at 77 K for fresh and sulfided
CuO-based sorbent at 1000 ppm-vol H2S/N2, ambient temperature (294 K) and ambient pressure (1.0 atm).
To probe the chemical changes of the agglomerates after sulfidation, EDS scans of the
fresh and sulfided particles were collected. Figure 3-5 shows the elemental maps of copper, zinc,
aluminum and oxygen for a fresh 120-micron agglomerate up to 2-micron penetration depth. The
quantitative results from the EDS scan demonstrate higher surface sulfur weight percentage (16.3
wt.%) than the bulk removal capacity obtained from mass balance across the reactor (12.5 wt.%)
suggesting that surface layers (up to 2 microns) sulfide more readily than deeper layers because of
diffusion resistance to molecules and atoms through solid sulfide product layers.
Sorbent Pore volume
[cm³·g-1
]
Surface area
[m2·g
-1]
Fresh sorbent 0.139 67.3
Spent at 294 K 0.051 17.6
Spent at 323 K 0.066 20.8
Spent at 383 K 0.083 29.8

45
Figure 3-5: Energy Dispersive Spectroscopy (EDS) elemental maps (oxygen, aluminium, copper, and zinc)
for a 120-micron pellet of the CuO-based sorbent based on an SEM scan at 1000 x magnification (top
panel).
Figure 3-6 shows the X-ray diffraction patterns for the fresh and sulfided sorbents at
various temperatures (294-383 K) which resulted in increasing extents of conversion (46 to 100%
at 294 K and 383 K, respectively). The peaks at 2 = 35.8° and 38.9° in the fresh sorbent pattern

46
correspond to (111) and (111) planes of CuO, respectively. The diffraction patterns of the sulfided
samples at different temperatures show broadening and decreasing intensity of the CuO
characteristic peaks with the increase in temperature.
Figure 3-6: Diffraction patterns of fresh CuO-based sorbent and spent samples at 294, 323, 338, 353, 368,
383 K after sulfidation with 110 cm3(STP) min-1 of 970-1016 ppm-vol H2S/N2 at ambient temperature (294
K) and pressure (1.0 atm). The triangles correspond to characteristic CuO peaks and the diamonds
correspond to characteristic sulfur peaks.
The CuO crystallite size (estimated by Debye–Scherrer formula using 2 = 35.8 ° )
decreased from 3.1 nm for fresh sample to 1.8 nm for the sample sulfided at 294 K. CuO diffraction
peaks are absent for samples sulfide at temperatures higher than 323 K. The diffraction patterns
also show rising of peaks at 2 = 29.1°, 32.1°, 48. 3° and 59.5° which correspond to (102), (103),
(110) and (116) planes of hexagonal CuS phase, respectively. The emergence of CuS peaks and
disappearance of CuO peaks confirm the reaction of CuO to CuS. Furthermore, the change in CuO
crystallite size with increasing extents of sulfidation suggests that the reaction disrupts the

47
crystallite structure of CuO leading to less crystalline (or possible amorphous) CuO, consistent
with the textural changes identified via SEM and N2 physisorption.
3.3.2 Effects of reactor contact time and sorbent agglomerate size on capacity and rate
In this study, the effect of varying contact time, tc, defined as the ratio of bed volume to
volumetric flow rate, was investigated for a range of pellet sizes to explore possible dependency
of models’ parameters (k and qs) on flow conditions. A tracer experiment was run using a fixed
bed of inert alumina to assure that the delay time is of negligible effect. The delay time, Figure
3-7, was 1.2 minutes compared to ≥ 5 hours breakthrough time for all runs.
Figure 3-7: Tracer experiment to verify short delay time for the sulfidation tests. 150 mg of inert alumina
(Al2O3) bed and a feed of 1000 ppm-vol H2S/N2 were used at a flowrate of 100 sccm.
Sulfidation experiments were carried for fixed-beds of the CuO-based sorbent with pellet
sizes ranging from 125 µm to 1000 µm at ambient temperature (294 K) and pressure (1.0 atm) and
inlet concentration of 1000 ppm-vol H2S/N2. Figure 3-8 shows that varying contact time within
0.31-1.40 s range had no effect on the saturation capacity for a given pellet size. It shows, though,

48
that increasing pellet size from 125 to 1000 µm decreased the average saturation capacity from
12.8 wt. % to 9.5 wt. % (g H2S/ 100 g sorbent) which will be further discussed.
Figure 3-8: Effect of varying contact time on maximum saturation capacity, qs, for fixed beds of CuO-
based sorbent at 1000 ppm-vol H2S/N2, 294 K and 1.0 atm. Different color codes are assigned to different
pellet sizes.
Figure 3-9 presents selected breakthrough curves where contaminant concentration is
normalized for inlet feed concentration and the time on stream is normalized for weight of sorbent
and flowrate. The breakthrough curves show a positive shift in breakthrough time with pellet size
decrease which correlates to an increase in saturation capacity. It also shows that the shape of the
breakthrough curve changed from sickle shape for smaller pellet size (characteristic of Cooper
model) to sigmoidal shape (characteristic of Bohart-Adams model) for larger pellet size. Cooper
model provided better fit for the breakthrough curves of 125-212 µm runs compared to Bohart-
Adams model which tend to underestimate the initial breakthrough rate and over estimate it at later
periods. Bohart-Adams model provided better fit for the shape of the larger pellet sizes’
breakthrough curves, 800 and 1000 µm, and for the initial part of the medium pellet sizes, 600 and

49
500 µm, breakthrough curves. Nevertheless, both models provided comparable predictions of the
maximum saturation capacity with slightly higher accuracy of Bohart-Adams’ estimates as pellet
size increases. Summary of all runs’ conditions along with regressed parameters and estimated
errors are listed in Table B-1.
Figure 3-9: Breakthrough curves of normalized effluent H2S concentration (right) collected for fixed beds
of the CuO-based sorbent at 1000 ppm-vol H2S/N2, 294 K and 1.0 atm. Solid black lines represent fitted
linear driving force models (Cooper model for 120, 180, 212, 500 µm and Bohart-Adams model for 800
and 1000 µm). Inset schematics show representations of the propagation of reaction front through the
volume of the pellet for large pellet size (not to scale)
To explain both changes in saturation capacity and model fit with pellet size, the sulfidation
process at the pellet and grain scales must be deconvoluted. The sorbent pellet (hundreds of
microns) is a porous agglomerate comprised of packed nonporous grains. For larger pellets (≥ 500
µm), the outer surface of the pellet reacts instantaneously with sulfur contaminant but the
propagation of the reaction front through the pellet is limited by the high pore-diffusion resistance,
Rp, which is proportional to the square of pellet’s diameter (Equation 14). The propagation of

50
reaction follows a nucleation process where the rate increases as nuclei connect (region A, Figure
3-9). Afterwards, significant CuS product layer accumulates which results in (i) restriction of
access to unreacted core of grains due to the high solid-diffusion resistance and (ii) decrease in the
porosity of the pellet due to the difference in molar volume between products and reactants (factor
of 1.6 for CuS/CuO) which causes pore collapsing/clogging. The first effect explains incomplete
conversion of individual grains while the other explains incomplete conversion through pellet
volume. The combined effects of CuS formation results in switching from nucleation/pore-
diffusion-controlled regime (region A, Figure 3-9) to solid-diffusion-controlled regime (Region C,
Figure 3-9) which manifests as an inflection in the breakthrough curves (800 and 1000 µm).190
This inflection is better captured by Bohart-Adams model under these conditions.
On the other hand, for smaller pellet sizes (≤ 212 µm) where pore-diffusion resistance is
negligible, no concentration gradient is established across the pellet and access to fresh grain
surfaces throughout the volume of the pellet is instantaneous. At the surfaces of the grains, CuS
layers are formed and the process is slowed down by solid-diffusion resistance immediately. This
explains why Cooper model, which is derived under the assumption of solid-diffusion control,182
provides better fit for smaller pellet sizes. The change in porosity is less important for smaller
pellet sizes as the reaction propagates through the volume of the pellet before the effect of pore
clogging can impede access to the pellet core. This explains the enhanced saturation capacity with
pellet size decrease.
Explaining the effect of pellet size on rate parameter requires quantification of the
contributing resistances using theoretical correlations (Equations 14-19). Figure 3-10 demonstrates
how the estimated contributing rate parameters varied with pellet size change. For all pellet sizes,
bulk diffusion resistance had a negligible contribution to the rate parameter as discussed earlier.

51
At small pellet sizes (125-212 µm) both pore and bulk diffusion resistances were negligible and,
thus, the rate parameter was dominated by the rate of reaction at CuO/CuS interface and diffusion
through solid products, krxn. In the intermediate range of pellet sizes (500-600 µm) the
contributions of solid diffusion and pore diffusion resistances were comparable with an increase
in pore diffusion contribution as pellet size increased. For significantly larger pellets (≥ 800 µm),
regressed rate parameter equated to the estimated pore-diffusion rate (Equation 14). This can be
extrapolated to larger pellet sizes given that flow conditions and axial and radial aspect ratios
remain large enough for channeling effects and axial dispersion to be negligible.
Figure 3-10: Contributions of pore diffusion resistance, 1/kp, bulk diffusion resistance, 1/kb, and solid
diffusion/surface reaction resistance, 1/krxn to the overall rate resistance, 1/kK, at various agglomerate sizes
(125-1000 µm). The resistances were deconvoluted from Cooper’s regressed rate parameter for runs at
1000 ppm-vol H2S/N2, 294 K and 1.0 atm.
3.3.3 Effects of temperature, concentration, and pressure
To assess the utility of using linear driving force models as a predictive tool when operating
under temperatures higher than room temperature, runs were conducted using 212 µm pellets for
a range of temperatures (294-423 K). Plots of temperature effect on the regressed rate parameter,
kK, and saturation capacity, qs, are presented in Figure 3-11. Figure 3-11A shows that the value of

52
maximum capacity increased consistently from 12.5 wt. % at 294 K to 39.2 wt. % at 423 K. The
stoichiometric conversion of the CuO phase was achieved at 26.7 wt. % (highlighted by the dotted
red line). The saturation capacities that are beyond stoichiometric conversion were a result of
reaction of ZnO phase at higher temperatures. Table B-1 summarizes the values of saturation
capacity estimated by Cooper and Bohart-Adams models and shows that Bohart-Adams model
provided, overall, better fits for the saturation capacity.
Figure 3-11: A) represents the effect of varying temperature on the maximum saturation capacity at given
conditions. B) represents an Arrhenius plot of the rate parameter regressed from Cooper’s model fit for runs
at 294, 323, 343, 363, 393, and 423 K. The runs were collected for 212 µm agglomerates at 970-1016 ppm-
vol H2S/N2 and a pressure of 1.0 atm.
In addition to the better estimations of capacity by Bohart-Adams, the model captured the
behavior of the breakthrough curves at higher temperatures as demonstrated in Figure 3-12. To
explain this change in breakthrough behavior, we must revisit the sulfidation process for small
pellets which was discussed earlier. The immediate access to internal grains due to low pore
diffusion resistance makes surface reaction on grains throughout the pellet volume fast enough for
it not to contribute to the overall resistance. At room temperature, after initial CuS layers are
formed, the propagation of reaction through grains is slowed down and the process is dominated by
the rate of diffusion through solid product phase.

53
For higher temperatures, the enhanced diffusivity through solid phase (and porosity as
demonstrated in BET measurements) allows for the formation of product nuclei throughout the
volume of the grain. The initial increase in the rate of sulfidation is a result of formation and
connection of these nuclei (region A).190 As product layers accumulate, the diffusion resistance
increases until the rate of diffusion to fresh grain core is slower than the rate of nuclei formation and
connection. At this critical point, the rate shifts from domination by nucleation/connection through
grain volume to diffusion through thick product layer. This shift point explains the inflection in the
breakthrough curve which resembles the shape of Bohart-Adams model. Although the shape of
breakthrough is better captured by Bohart-Adams model, both models deviated from mass-balance-
estimated capacity with temperature increase as demonstrated in Table B-1.
Figure 3-12: Breakthrough curves of normalized effluent H2S concentration (right) collected for fixed beds
of the CuO-based sorbent at 1000 ppm-vol H2S/N2 and 1.0 atm for temperatures of 294, 323, 353 K. Solid
black lines represent fitted linear driving force models (Cooper model for 294 and 323 K and Bohart-Adams
model for 353 K). Inset schematics show a representation of the propagation of reaction front at two
temperatures

54
Figure 3-11 B shows an Arrhenius plot of the log of the regressed rate parameter, kK, as a
function of the reciprocal of temperature. Since pellets of small size were used in these runs, 212
µm, krxn and kK were expected to be close in value (Table B-1). Based on earlier discussion, for
125-212 µm pellet size range, the dominant resistance is the resistance to diffusion through the
solid product phase rather than the surface reaction, pore diffusion or bulk diffusion. Although the
increase in temperature enhances diffusivity, the increase in conversion with temperature results
in a thicker products layer which poses higher diffusion resistance. These two factors counter one
another and have different contributions to the rate of solid diffusion which can’t be easily
deconvoluted. This explains why the dependency deviates slightly from the predicted Arrhenius
law for diffusivity dependence on temperature. Nevertheless, since these processes go hand in
hand in chemisorption, the regressed rate parameters can be used to describe the combined effects
for a given reactive system given that the pellet size is small enough.
Furthermore, to investigate the effect of varying inlet concentration of hydrogen sulfide on
Cooper model’s regressed parameters, experiments were conducted at inlet contaminant
concentration levels of 980, 1380 and 2200 ppm-vol. The experiments were run at room
temperature and pressure using 125 µm pellets of the CuO-based sorbent. Figure 3-13 shows the
breakthrough curves collected for the runs along with the Cooper model fits. Varying
concentration, for small pellet size, didn’t affect the behavior of the breakthrough curve which
followed Cooper model for the three concentration levels. The regressed rate parameter, kK,
increased slightly from 5.0 s-1 at 980 ppm to 7.7 s-1 at 1380 ppm-vol then dropped down to 6.4 s-1
at 2200 ppm-vol. This suggests that changing concentration of feed has no effect on rate parameter
which aligns with that the rate of diffusion through solid products, rate determining at this pellet
size, has no contributions from elementary reaction steps. Moreover, the removal capacity stayed

55
constant at around 12.5 wt. % and both Cooper and Bohart-Adams estimates were within 10.4 %
of the mass balance estimate, qs.
Finally, to investigate the effect of varying the total pressure of the reactor on regressed
parameters, experiments were conducted at total pressure of 1.0, 1.4, 1.6 and 2.0 atm. The
experiments were run at room temperature and an inlet concentration of 1000 ppm-vol using 500
µm pellets of the sorbent. This pellet size was picked to allow for studying the effect of pressure
on the two contributions of rate parameter that are relevant at this pellet size: pore diffusion and
solid diffusion through products. Figure 3-13B shows that the breakthrough curves followed the
Bohart-Adams breakthrough fit for all pressure levels which is expected for this pellet size. Table
B-1 shows that no trend was observed in the effect of increasing pressure on rate parameter. The
rate parameter consists, at this pellet size, of two contributions: rate of pore diffusion and rate of
diffusion through products. For pore diffusion, the molecular diffusivity, DM, which contributes to
effective diffusivity, Dp, is inversely proportional to pressure (Equation 17). Nevertheless, this
contribution constitutes only 2-5% of Dp at these tested conditions which explains the lack of
dependency. On the other hand, diffusion through product layer is only dependent on the thickness
of the product layer and temperature as previously discussed. The tabulated values in Table B-1
also show that no change in sulfidation capacity was observed as pressure increased and both
models provided estimates of removal capacity within 11.0% of mass balance estimates.

56
Figure 3-13: Breakthrough curves of normalized outlet hydrogen sulfide concentrations collected for fixed
beds of the CuO-based sorbent at A) 1000, 1380 and 2200 ppm-vol H2S/N2 (125 µm) and B) 1.0 atm, 1.4,
1.6 and 2.0 atm (500 µm) both at a temperature of 294 K .
3.4 Study Conclusions
In this study, linear driving force models were used to fit breakthrough profiles of H2S
contaminant obtained from fixed beds of CuO-based sorbent for a wide range of conditions. The
experiments resulted in deep desulfurization of the feed stream from 1000-2200 ppm to 0-50 ppm.

57
For runs at room temperature, an average of 42 % of the maximum saturation capacity was
achieved (12.5 wt. %) with negligible effects of changing inlet concentration, total pressure or
contact time. Cooper model provided good fit for the breakthrough behavior for runs where pore
and bulk diffusion resistances weren’t dominant (125-212 µm pellet size) at room temperature,
while Bohart-Adams captured the shape of the breakthrough curves for the larger pellets’ runs (≤
800 µm) and higher temperatures. Both models provided predictions for removal capacity within
11% of the mass balance estimated capacity at room temperature.
The reproducibility of the models’ predictions was demonstrated by varying contact time
(changing flowrate and/or bed depth) which proved to have no significant effect on the models’
regressed parameters. Cooper’s regressed rate parameter was used to predict the reaction/diffusion
through products rate parameter, krxn, (5.8 s-1) at room temperature and pressure for small pellets
where the estimated pore and bulk diffusion resistances are negligible. At larger pellet sizes (800-
1000 µm), the estimated pore diffusion resistance dominated which makes implementing Bohart-
and-Adam model in an industrial setting a feasible option since the pellets’ sizes are an order of
magnitude larger than the tested pellet sizes. Cooper model predicted, reasonably, the changes in
krxn with temperature (298-423 K) which followed an Arrhenius equation. Finally, variations in
total (1.0-2.0 atm) and partial pressure (1000-2200 ppm-vol) of H2S contaminant had no significant
effect on the apparent rate parameter which is expected since the surface reaction is highly
irreversibly and, thus, krxn provides insight into the dominating CuO/CuS interface diffusion
resistance rather than the surface reaction kinetics. The ability of the model to elucidate the
diffusivity at the CuO/CuS interface, within the established limits of the model, can be used to
compare sorbents’ microkinetic performance of similar chemical composition but varying
structure and morphology.

58
Chapter 4 | Effects of Morphology and Surface Properties of Copper Oxide on
the Removal of Hydrogen Sulfide from Gaseous Streams
4.1 Introduction
Because of the chemical affinity of H2S for metallic cations, chemical reaction with a solid
metal oxide is a frequently used technique to purify natural gas from trace levels of sulfide
constituents that often remain even after amine scrubbing. Such reactive sorption processes are
advantageous because they are thermodynamically more favorable than physisorption leading to
higher purity streams and higher solid phase contaminant capacities. Zn, Fe, Ca, Mn, and V metal
oxides have been studied rather extensively in the literature as adsorbents for H2S removal at
elevated temperatures (>573 K).191–198 Despite possessing favorable thermodynamics (ΔGT=298 =
126 kJ mol-1, -76 kJ mol-1, -74 kJ mol-1 and -136 kJ mol-1 for CuO, ZnO, Fe2O3, and NiO,
respectively)17 these oxides when reacted with H2S at room temperature suffer from low removal
capacities due to (1) slow ion migrations to and from the lattice structure, (2) sintering,199 (3)
mechanical disintegration,199 (4) diffusional resistance,200,201 and/or (4) limitations in the number
of adsorption sites.
Of the previously reported oxides that can remove H2S at low temperatures, CuO has
garnered interest because of the favored sulfidation thermodynamics of Cu2+ and Cu+1 at room
temperature. The high equilibrium constant of CuO sulfidation (Ks = 6.8 × 10²⁰ at 298 K)202
enables CuO to reduce H2S from several thousand ppm down to sub-ppm levels. Realizing this
advantage, current research efforts have focused on (1) synthesizing small CuO nanoparticles and
supporting them on mesoporous materials (e.g., activated carbon, SiO2, Al2O3, clay, and modified
zeolites),199,203–205 or (2) combining other metal oxides (e.g., Zn, Fe, Al, V, and Mo-based) with

59
CuO,200,206,207 to create materials with improved thermodynamic stability and/or kinetics.
However, because most of the literature deals with such supported or mixed oxide materials as
well as high-temperature H2S removal processes to avoid kinetic limitations imposed by ambient
conditions, little work has been done on unsupported, pure CuO at these milder ambient conditions.
Knowledge about several parameters such as the influence of synthesis procedures and crystallite
size at low temperatures on reactivity is therefore critical to the use of reactive sorbents in
purification processes.
In this work, pure CuO sorbents with varying properties (crystallite sizes, surfaces areas,
pore volumes, and purities) and morphologies were synthesized via sol-gel, co-precipitation,
hydrothermal treatment, hydrolysis, and electrospinning, and reacted with 1000 ppm-vol H2S/N2
in a fixed bed reactor at room temperature and pressure. The sulfur removal capacity, qs (g H2S/100
g sorbent), was estimated by a sulfur mass balance across the reactor. The overall rate parameter,
k, was evaluated by analysis of the collected breakthrough curves using Cooper182,208 linear driving
force model. Sol-gel, co-precipitation, hydrothermal treatment in the presence of a polymer, and
hydrolysis were used to fabricate CuO nanoparticles with appropriate properties (i.e., small
crystallite sizes) for this reaction as the literature indicates that high surface areas, porous
structures, and nano-sized particles with small cluster sizes are advantageous for metal oxide
desulfurization.209 Electrospinning, which is a simple, easy-to-use electrostatic fabrication
technique, was used to generate one-dimensional Cu-containing nanofibers with varying fiber
diameters, which were later thermally treated to remove the polymer matrix and form CuO
nanofibers. Different polymers (PVP, PEO and P123) and treatment temperatures (353-823 K)
were used to probe the effect of purity (i.e., residual carbon remaining on the surface of the sorbent)
on CuO activity.

60
4.2 Experimental Methods
4.2.1 Materials and synthesis methods
4.2.1.1 Sol-gel synthesis of CuO nanoparticles
Polyvinylpyrrolidone (PVP) (M.W. 1,300,000, Sigma-Aldrich), PVP (M.W. 40,000,
Sigma Aldrich), polyethylene oxide (PEO) (M.W. 300,000, Alfa Aesar), copper (II) nitrate
trihydrate (Sigma Aldrich, 99%), copper (II) acetate monohydrate (Sigma Aldrich, 99%),
poly(ethylene glycol)-block-poly(propylene glycol)-block-poly(ethylene glycol) (P123; Sigma
Aldrich, Mn ~ 5,800), methyl alcohol anhydrous (Sigma-Aldrich, 99.8%), sodium hydroxide
(BDH, 97%), glacial acetic acid (VWR, ACS grade) and ethyl alcohol (Sigma-Aldrich, 100%)
were purchased and used without subsequent purification.
4.2.1.2 Sol-gel synthesis of CuO nanoparticles
CuO nanoparticles were prepared using an acid-catalyzed sol-gel process.210 1.0 cm3 of
glacial acetic acid was added to 300 cm3 of 0.02 M copper (II) nitrate or copper (II) acetate solution
under vigorous stirring and heating. At boiling point, 0.8 g of sodium hydroxide was added to the
solution with continuous stirring. The solution was then allowed to cool to room temperature while
a black precipitate continued to form and settle in the bottom of the beaker. The precipitate was
then vacuum filtered or centrifuged for 10 minutes (JA-14 rotor) at 293 K and 6000 RPM. The
supernatant was then poured off and the precipitate was washed with deionized water and ethanol.
The washed precipitate was dried in a furnace for 8 h at 313 K and then samples were either
collected or thermally treated a second time at higher temperatures to achieve particles of various
crystallite sizes. Thermal treatment was performed by heating samples at a ramping rate of 1 K h-
1 and holding the furnace temperature at 623 K, 823 K or 1023 K for 4 h. The samples prepared

61
via this technique are denoted as NP-X, where X is the sample number (NP-1 to NP-6). Table
shows the specific synthesis conditions for making the sorbents prepared in this work.
4.2.1.3 Co-precipitation of CuO nanoparticles
CuO nanoparticles were prepared by a drop-wise addition of aqueous 0.1 M sodium
hydroxide solution to aqueous 0.1 M copper (II) nitrate trihydrate solution under continuous
mixing. The obtained material, copper (II) hydroxide, was then vacuum filtered with distilled water
and ethanol, dried in air at 353 K for 14 h, and then thermally treated in air at 773 K for 4 h at a
ramping rate of 1 K h-1. The sample prepared via this technique is denoted as NP-7.
4.2.1.4 Co-precipitation of CuO nanobelts
CuO particles with belt-like shapes were prepared by dropwise adding 5 M sodium
hydroxide solution to aqueous 0.6 M copper (II) nitrate trihydrate solution under continuous
mixing. The solution was then aged for 3 days and precipitates were then vacuum filtered and
washed using ethanol and deionized water. The washed precipitates were dried overnight at 333
K and then thermally treated in air at 623 K for 4 hours. This material is denoted as NB-1.
4.2.1.5 Hydrolysis and precipitation of CuO flowerlike nanostructures
CuO flowerlike nanostructures were synthesized using a facile route by hydrolyzing a
copper acetate solution.211 In a typical synthesis, 100 cm3 of 0.02 M copper acetate solution was
dissolved in deionized water in a beaker, and heated from room temperature to 373 K for 45
minutes. After hydrolysis and crystallization, the black precipitate formed in the solution was
centrifuged and washed with DI water and ethanol and dried overnight in air at 353 K. The
nanostructures prepared via this technique are denoted as FP-1.

62
4.2.1.6 Co-precipitation of CuO nanoflake-based flowerlike hierarchical nanostructures
Nanoflake-based flowerlike CuO nanostructures were synthesized via thermally
decomposing a [Cu(NH)3)4]+ solution, without the aid of any surfactants.212 In a typical synthesis,
0.5 or 2.0 g of copper nitrate was dissolved in 50 or 30 cm3 of deionized water in a sealed bottle.
Ammonia (~ 1-3 cm3) is then added dropwise until a change of color is observed (darker blue).
The bottle is then sealed tightly and heated to 353 K for 8 h or 376 K for 24 h, while stirring. After
that, the black precipitate that formed in the bottle was washed with distilled water and ethanol to
remove impurities and then centrifuged. The centrifuged solid was dried in a drying oven (353 K)
overnight. The solids collected from this synthesis technique are denoted as FP-2 (353 K) and FP-
3 (376 K).
4.2.1.7 Hydrothermal synthesis of CuO nanoparticles
A porous CuO sample was synthesized according to the method of surfactant-assisted
hydrothermal interaction using CuO powder as starting material.213,214 The polymer-containing
solution was prepared by dissolving either 0.65 g of P123 or 0.65 g, 0.52 g, 0.26 g or 0.13 g of
PVP (M.W.=1,300,000) in 15 cm3 of water while stirring for 2 h. After that, 0.65 g of CuO (NP-
7) was added to the beaker and the solution was left to stir at 800 rpm for 48 hours. The solution
was then ultrasonically treated for 1 h and transferred to a glass tube reactor (cylindrical pressure
vessel) for hydrothermal treatment at 383 K for 24 h. The black solid substance was centrifuged
and washed with DI water and ethanol for the removal of the majority of the P123 surfactant or
PVP polymer. The solid was then dried overnight in a drying oven at 353 K. The as-obtained
material was subsequently thermally treated in air from room temperature to 823 K for 4 h at
ramping rate of 2 K min-1 for the generation of CuO. These materials are denoted as NPC-1 (P123),
NPC-2 (0.65 g PVP), NPC-3 (0.52 g PVP), NPC-4 (0.26 g PVP) and NPC-5 (0.13 g PVP).

63
4.2.1.8 Electrospinning of PVP-Cu(NO3)2/PEO-Cu(NO3)2 and CuO nanofibers
Polymer solutions were prepared by dissolving PVP M.W.=1,300,000 (1.30-1.75 g), PVP
M.W.=40,000 (10.5 g) or PEO M.W.=300,000 (2.7 g) in solvent (methanol or ethanol; 22-25 cm3).
The polymer solution was then vortexed (Fisher Scientific Digital Vortex Mixer) at 3000 rpm for
1 h until the polymer was completely dissolved. The solution was left to settle for 10 minutes,
transferred to a beaker, and stirred for 0.5 h. The metal containing solution was prepared by
dissolving copper (II) nitrate (0.15-4.0 g) in 5-10 cm3 of DI water and stirring the solution for 0.5
h. The copper containing solution was then added dropwise to the polymer containing solution.
The solution was stirred for 0.25 h, and then vortexed for 0.5 h at 3000 rpm.
The electrospinning solution was placed in a 10 mL syringe (BD 10 mL syringe with Luer
LokTM tip) with a hypodermic needle (MonojectTM Standard 30G x ¾”). The distance between the
tip of the needle and a stainless-steel collecting plate, which was covered with aluminum foil, was
6-22 inches. A Gamma High Voltage Research ES75 power supply was used to apply 20-35 kV
on the polymer jet while the polymer solution was extruded through the needle at a rate controlled
by a syringe pump (1.0-5.0 cm3 h-1; Kent Scientific Genie Plus). Dry air was circulated inside a 3
m3 chamber at 6 cm3 min-1 to control the relative humidity at 19.5 ± 2%. All electrospinning was
carried out at ambient conditions, temperature (294 ± 3 K) and pressure (101 kPa). The collected
fibers were thermally treated in air at 773-898 K for 2-10 h at a ramping rate of 0.4-2.0 K min-1 to
remove the majority of PVP/PEO and form CuO. The CuO nanofibers are denoted as NF-X (NF-
1 to NF-6) in Table C-1.

64
4.2.2 Characterization
The synthesized CuO sorbents prepared via sol-gel, co-precipitation, hydrothermal
treatment, hydrolysis, and electrospinning, as described in Section 3.2.2 were characterized using
a variety of techniques. Powder X-ray diffraction patterns were obtained on an X-ray
diffractometer (JEOL JDX-3530 and Philips X-Pert) using Cu Kα radiation of 1.5410 Å to identify
the CuO phases. The average crystallite sizes were found using Scherrer’s formula. Nitrogen
adsorption-desorption isotherms were measured at 77 K with a Micrometrics ASAP 2020 Plus
system. Before measurements, the samples were degassed at 1 × 10⁻³ Torr and 573 K. The
Brunauer-Emmett-Teller (BET) surface areas were calculated from the isotherms by using the
BET equation. The pore size distribution was derived from the adsorption branches of the
isotherms using the Barrett-Joyner-Halenda (BJH) model.
Scanning electron microscopy (NOVA 230 Nano SEM) was used to determine the
morphology of the sorbents. The mean diameter and size distribution (standard deviation) of the
electrospun nanofibers were calculated from the SEM micrographs using ImageJ software (n =
250; where, n is the number of fibers that were measured and averaged). Microstructure of the
particles was imaged using scanning transmission electron microscope (STEM) Titan (Thermo
Fisher Scientific) operating at 300 kV and equipped with the X-MaxN 100TLE (Oxford) detector
for energy dispersive spectroscopy (EDS) analysis. Windowless EDS detector was used with high
counts rate to optimize the detection of light elements. Samples were prepared by direct deposition
of the dry powder onto the carbon film supported TEM grids. EDS spectral maps of individual
particles were acquired with the pixel size 2.5 nm in continues mode. Maps were stopped after
satisfying elemental images were attained with full map acquisition time varied between 10-20
min. Line scan profile results of individual particles were generated from acquired spectral images.

65
Thermogravimetric analysis was conducted in a Perkin Elmer TGA. Alumina crucibles
were used to hold the samples. Gas flowrates were set to 200 standard cm3 min-1 to minimize
external diffusion from the bulk gas to the sample interface. Heating/reaction occurred in air
(Matheson UHP Argon, 99.999% purity) at a ramping rate of 10 K min-1. XPS was conducted with
PHI 3057 spectrometer using Mg Kα X-rays source at 1286.6 eV. All binding energy values
presented in this paper were charge corrected to C 1s at 284.8 eV. For the interpretation of the
spectra, the literature positions were applied.215
4.2.3 Fixed-bed experiments
Reactive adsorption of H2S was studied in an apparatus with plug-flow hydrodynamics
shown schematically in Figure 3-2. Copper (II) oxide samples (120-200 mg) were sieved to 75-
155 µm agglomerate diameter and packed between plugs of quartz wool in a 0.25-inch outer
diameter tubular, stainless steel reactor. Flow rates of gaseous H2S and N2 (65 sccm) were
introduced to the packed reactor via mass flow controllers (MKS GE50A and GM50A). Feeds to
the reactors consisted of 1000 ppmv H2S in N2 and were produced by diluting a 1.0% H2S (Praxair
UHP) in N2 mixture with UHP N2. All the sulfidation tests were carried at ambient temperature
and pressure. The compositions of feed and effluents were monitored using online gas
chromatography (Agilent 7890B) with a sulfur chemiluminescence detector (SCD; Agilent 755)
and continuous gas phase FTIR spectroscopy (MKS Multigas). All gas transfer lines and the
interior of the reactor were treated with an inert coating (SilcoNert 2000) to mitigate H2S
adsorption onto tubing walls.

66
4.2.4 Computational study
Section 4.3.2 of this work features a computational study using Density Functional Theory
(DFT) for the reaction mechanism of the dissociative adsorption of H2S molecules on CuO {111}
surfaces. This surface was picked because it is the most stable surface134 found experimentally.
The dissociative adsorption of H2S on a CuO surface involves several elementary steps,
i.e., the molecular adsorption of H2S on the surface, with subsequent dissociative steps,
rearrangement of adsorbed species and formation of water, which overall corresponds to the
stoichiometric reaction:
𝑪𝒖𝑶 + 𝑯𝟐𝑺 → 𝑪𝒖𝑶𝟏−𝒙𝑺𝒙 + 𝑯𝟐𝑶 (𝟐𝟎)
The net balance of the process is the exchange of one oxygen atom of the CuO surface by
one sulfur atom provided by H2S. The reaction mechanism was studied by determining the relevant
stationary points for all the elementary steps, along with the potential energy surface (PES), using
DFT together with a planewave basis set as implemented in the VASP code.216–219 Exchange and
correlation effects were treated within the generalized gradient approximation (GGA), using the
Perdew–Burke–Ernzerhof (PBE) functional along with projector augmented-wave
pseudopotentials.120 Potential van der Waals interactions were considered by using the dDsC
correction as implemented in VASP.220 The planewave basis set cutoff was set to 450 eV. A
Monkhorst-Pack scheme was used for sampling the Brillouin zone.
Due to the failure of conventional DFT functionals to properly account for the strong
correlation effects among the partially filled Cu 3d states in CuO.221 The Hubbard parameter, U,
was introduced for the Cu 3d electrons to describe the on-site Coulomb interaction (GGA+U).
Specifically, the values of U=7 eV and J=0 eV were adopted from the literature.222 Upon

67
optimization of a bulk CuO unit cell to agree with experimental lattice parameters and the proper
anti-ferromagnetic character, a CuO {111} model surface featuring a 2x1 CuO {111} supercell
was built using the slab approach. The dimensions of the supercell were 11.6 Å x 6.1 Å, with a
slab thickness of 7 Å and a vacuum region in the Z axis of 19 Å to avoid spurious electrostatic
interactions between supercell instances. The model used can be seen in Figure 4-12.
4.3 Results and Discussion
4.3.1 Physio-chemical properties of CuO materials
XRD was used to identify the crystalline phases and average crystal sizes of the nineteen
CuO sorbents prepared in this work, using the synthesis techniques described in Section 3.2.1. As
shown in Figure 4-1 and Figure 4-2, all the XRD patterns collected show diffraction peaks which
are characteristic of the planes of a single-phase monoclinic CuO. The average crystal domain size
of the CuO sorbents calculated using Scherrer’s formula based on the 38.8o peak were in the range
of 5 to 74 nm, with the majority of the sorbents having crystallite sizes less than 25 nm (Table C-
1 and Table C-2). The XRD results show that, in general, sorbents that did not undergo thermal
treatment in air at elevated temperatures (T > 773 K) as part of their preparation technique had
significantly smaller crystallite sizes (< 20 nm). This effect is important to highlight because it was
observed in this work that crystallite size influences the H2S removal capacity of pure CuO
sorbents, irrespective of other properties (such as, surface area, pore size, and pore volume)
generated by the synthesis technique (discussed in detail in Section 4.2.1). Furthermore, the d-
spacing obtained from the XRD data for all sorbents was in the range of 2.29-2.30 Å for the (200)
plane, which is consistent with the literature223, and indicative of phase pure monoclinic CuO.

68
Figure 4-1: X-ray diffraction patterns of CuO sorbents. (a) Nanoparticles via sol-gel, co-precipitation, and
hydrothermal treatment (NP and NPC) and (b) nanobelts via co-precipitation.

69
Figure 4-2: X-ray diffraction patterns of CuO nanofibers synthesized via electrospinning (NF) before and
after thermal treatment.
Figure 4-2 also shows the XRD patterns of the as-synthesized NF-1 (PEO-Cu(NO3)2) and
NF-4 (PVP-Cu(NO3)2) prior to any thermal treatment. Well defined diffraction peaks are absent
from the XRD pattern of the pre-thermally treated NF-4 fibers, which indicates that these materials
consist of amorphous PVP phases and copper species that are too small to diffract X-rays.
Moreover, the XRD patterns of NF-1 (prior to thermal treatment) contains several small peaks
consistent with PEO as well as copper nitrate peaks reported previously in the literature.224,225
These results indicate that thermal treatment in air is required for the formation of CuO from the
copper-species that exist in PEO or PVP nanofibers after electrospinning.
N2-physiosorption was performed on one sample from each of the morphologically distinct
groups (NP-4, NP-7, NB-1, FP-2, NPC-2 and NF-6) to determine the effect of synthesis method

70
on surface area and porosity. Table C-2 presents the structural parameters calculated from nitrogen
adsorption. Analysis of structural parameters along with the degree of micro- and meso-porosity
reveals differences in surface area and porosity among the sorbents. Specifically, sorbents that
were prepared via precipitation (NP-7 = 58.8 m2 g-1 and FP-3 = 59.1 m2 g-1) possessed larger BET
surface areas than those prepared from sol-gel (NP-1 = 14.5 m2 g-1), hydrothermal treatment (NPC-
2 = 17.4 m2 g-1), and electrospinning (NF-6 = 2.79 m2 g-1). CuO nanobelts appear to be an exception
to this observation with a surface of area 6.18 m2 g-1 which can be attributed to the long aging step
(72 hours) in the synthesis procedure which can lead to micropore and mesopore closure.
Additionally, NP-7 (precipitation) had pore volumes of 0.181 cm3g-1 which is more than double
that of FP-3 (0.079 cm3g-1) despite their comparable surface area. These differences in total pore
volume are the result of different pore size distributions. NP-7 consists of a larger concentration
of pores in the 15 to 150 nm pore size range compared to FP-3, which has higher pore volume
within the lower pore size range > 15 nm. In general, changes in pore volumes followed the same
trend as for the surface area (i.e., samples with smaller pore volumes also exhibited lower surface
area). The significantly lower surface area and low meso-porosity of the electrospun materials
result from the formation of single CuO fibers with large intra-fiber interstices as determined by
SEM (Figure 4-3(h)).
SEM was used to investigate the effect of preparation technique on the morphology of the
synthesized materials. Figure 4-3 shows the SEM images (20,000 times magnification) of the
representative CuO materials synthesized in this work—Nanoparticle samples: NP-1, NP-5, NP-
7; Nanoparticles synthesized with polymer: NPC-1; Nanobelts: NB-1; Flower-shaped particles:
FP-2, FP-3; and Nanofibers: NF-4. These SEM images reveal that various CuO morphologies and
dimensionalities can be obtained by simply varying the preparation technique. Figure 4-3(a-b)

71
shows that nanostructures prepared via sol-gel (NP-1, NP-5) were found to have irregular particle
shapes with varying domain sizes depending on the copper precursor (average domain size of 4.5
± 1.47 µm for copper (II) acetate in Figure 1(a) and 1.3 ± 0.4 µm for copper (II) nitrate NP-5).
Figure 4-3: SEM images at 20,000 times magnification of a select group of CuO sorbents with different
morphological features prepared via various synthesis techniques (e.g., sol-gel, precipitation , hydrothermal
treatment with the aid of a polymer, hydrolysis, and electrospinning).

72
Unlike sol-gel, which yielded materials that were irregular in shape, precipitation,
hydrothermal treatment and electrospinning, yielded materials with regular, defined shapes and
structures. For instance, by hydrothermally treating NP-7 (Figure 4-3(c)) in the presence of
P123 (NPC-1), closely aggregated and distinctly spherical CuO particles were formed, with
sizes ranging from 5 to 9 µm as seen in Figure 4-3(d). Properly aging a precipitated CuO sample
(NP-7) lead to nanobelt-like materials as shown in Figure 4-3(e). The effect of reaction time
and metal concentration on precipitation of flowerlike particles (FP-2 and FP-3) can also be
observed in Figure 4-3(f-g). As the reaction time and copper precursor concentration were
increased, flowerlike structures formed (Figure 4-3(g)), with an average size of 2.7 ± 0.9 µm.
At low concentrations and temperatures, however, instead of forming these micron-sized
flowerlike structures, petal-like structures are formed (0.5-2 µm) (Figure 4-3(f)).226 Lastly,
Figure 4-3(h) shows how electrospinning can result in the fabrication of a highly porous, fibrous
structure, with significant macro-porosity (NF-4). The fibers formed via electrospinning (NF-
4) after undergoing thermal treatment had an average diameter size of 629 ± 194 nm (measured
using ImageJ, n=250). The SEM images, indeed, confirm that different synthesis techniques
yield nanomaterials with markedly different morphological features while also shedding light
on the growth mechanism of CuO nanostructures as a function of synthesis condition.
TGA experiments were conducted on pure PEO (M.W.=300,000), pure PVP
(M.W.=1,300,000), and NF-4 (prior to thermal treatment; PVP-Cu(NO3)2) to quantify the
extent of polymer removal during thermal treatment (i.e., quantity of residual carbon left after
treatment) and provide evidence of the conversion of copper nitrate to CuO. Figure 4-4 shows
the TGA curves of pure PEO, pure PVP, and NF-4. All three samples were decomposed under
air at a heating rate of 10 K min-1. The nanofibers synthesized using pure PEO (M.W.=300,000)

73
decomposed under air in a single step, with a total weight loss of approximately 99%. The TGA
results prove that at the 823 K, the majority of the PEO polymer is removed. The nanofibers
synthesized using pure PVP (M.W.=1,300,000), on the other hand, decomposed under air in
two steps, with a total weight loss of approximately 93.7% at 773 K, 94.2% at 823 K, and 94.7%
at 897 K, which is a slightly lower weight loss percentage than PEO (Figure 4-4).
Figure 4-4: Weight loss profiles as a function of temperature from thermogravimetric analysis (TGA)
of (a) pure PVP (M.W.=1,300,000), (b) NF-4 prior to thermal treatment (PVP-Cu(NO3)2), and (c) pure
PEO (M.W.=300,000) nanofibers.
In the case of PVP, the first step weight loss of 16% occurred between ambient
temperature and 622 K and was attributed to the evaporation of volatile solvents. The second
step weight loss of 78% from 623 K to 773 K was attributed to the thermal degradation of the
PVP chains. It is clear from the TGA curve that the majority of the PVP matrix (much like in
the case PEO) is removed at temperatures higher than 773 K and only a small amount of carbon
residue is left, albeit this amount of carbon residue is slightly higher in the case of PVP (due to
the presence of more carbon atoms in the PVP monomer than in PEO). The work of Borodko

74
et al. further supports the presence of residual carbon after the thermal treatment of PVP at
elevated temperatures.227 Using spectroscopic techniques, the authors studied the degradation
of PVP and showed that in an oxygen atmosphere, the PVP forms a polyamide-polyene-like
material at temperatures above 523 K. At temperature above 573 K, these materials transform
into amorphous carbon. Lastly, NF-4, an electrospun nanofiber sample consisting of PVP
(M.W.=1,300,000) and Cu(NO3)2, decomposed under air in two steps, with a total weight loss
of approximately 84% (Figure 4-4). These total weight losses in air are consistent with the
complete conversion of copper nitrate to CuO. Thus, the first step weight loss can be attributed
to the evaporation of volatile solvents, and the second can be attributed to the decomposition of
the PVP chains and the conversion of copper nitrate to CuO. Figure 4-4 also reveals that the
decomposition of NF-4 (475 K) occurs at a much lower temperature than pure PVP (640 K)
indicating the effect of copper nitrate, which weakens the bonds within the PVP chains, and of
the nitrate anions, which act as an oxidant to combust the polymer. These TGA results are in
agreement with the results from the other characterization techniques described in this section,
as they provide quantitative evidence of the removal of the majority of the polymer (PEO or
PVP), decomposition of the copper nitrate, and formation of CuO during the thermal treatment
of electrospun nanofibers (e.g., NF-4) in air while also hinting at the presence of small amounts
of amorphous carbon remaining in the sorbent after thermal treatment of the as-synthesized
fibers.
To further probe the presence of carbon and quantify its amount on the surface of the
oxide sorbents, X-ray photoelectron spectroscopy (XPS) experiments were performed. Figure
4-5 shows the overall XPS spectra as well as the spectra of the C 1s core level for a select group
of sorbents (NP-7, NPC-2, and NF-4).

75
Figure 4-5: XPS spectrum of CuO nanomaterials (NP-7, NPC-2, and NF-4) prepared via precipitation
(no polymer), hydrothermal treatment in the presence of PVP (M.W.=1,3000,000), and electrospinning,
using PVP (M.W.=1,300,000) as a template, respectively. (a) Wide spectra of the copper oxide sorbents,
(b) high-resolution spectra of C 1s, with peak fittings corresponding to C-C and C-Cu.
As mentioned in Section 4.2.1 and Table C-1, NP-7 was a CuO sorbent that was
prepared via precipitation , NPC-2 was a CuO sorbent that was prepared by hydrothermally
treating NP-7 in the presence of PVP (M.W.=1,300,000), and NF-4 was a CuO nanofibrous
sample that was synthesized using electrospinning from a copper nitrate precursor in the
presence of PVP. In the case of both NPC-2 and NF-4, the weight ratio of PVP to Cu added
during synthesis was 1:1 whereas no polymer was added in the case of NP-7. The XPS results
reveal the presence of CuO nanocrystals, as shown by the Cu 2p3/2 peaks in Figure 4-5, for all
three sorbents. The binding energy of the Cu 2p3/2 peaks was found to be 933.6 eV, which is
in agreement with the literature.228,229 Additionally, the intensities of the Cu 2p shake-up peaks
obtained from the CuO sorbents is close to the ratio characteristics of reference CuO.215 Figure
4-5(b) shows the C 1s spectra for three selected CuO sorbents. In Figure 4-5(b), the C 1s peak
has the highest intensity, demonstrating the presence of carbon. The main carbon peak at 284.8
eV corresponds to the C-C bonding (all three sorbents contain this C-C bond) while the shoulder

76
at 283.3 eV corresponds to the C-Cu bonding energy, which is mainly due to the carbon residue
remaining on the surface of the sorbent after thermal treatment. Fitting results of the C 1s high-
resolution XPS spectra were used to quantify the amount of C-Cu present in each sorbent. The
fittings reveal that NPC-2 and NF-4 contained 22% and 19% C-Cu, respectively, whereas NP-
7 contained less than 2% C-Cu. XPS results for other samples, summarized in Figure 4-6, show
a variation in surface C-Cu percentage ranging from 19% to 50%. The XPS results discussed
in this section signify the impact of synthesis (i.e., the utilization of a polymer or a surfactant)
on the amount of residual carbon (C-Cu) present in the sorbent which is important for the
evaluation of sulfur removal performance.
Figure 4-6: Effect of carbon residue on carrying capacities of CuO nanofibers and nanoparticles via
hydrothermal treatment. X-ray photoelectron spectroscopy (XPS) was used to determine carbon residue
on the samples.
4.3.2 Effect of crystallite size on H2S removal
To probe the effect of morphology and crystallite size on H2S removal performance, the
capacities of the sorbents synthesized in this work for H2S removal were measured during fixed
bed experiments. The capacities are defined as g H2S per 100 g of sorbent (wt%) where

77
complete sulfidation of CuO corresponds to 42 wt%. Capacities were determined by
introducing a feed with a nominal concentration of 1000 ppm-vol H2S in N2 and monitoring the
H2S concentration in the reactor effluent (as described in Section 4.2.3). Experiments were
terminated after the concentration of the effluent was equal to the inlet concentration, and H2S
capacities were calculated from the mass differential between the inlet and outlet of the reactor
over the course of the experiment.
The capacities were plotted as a function of surface area, total pore volume and
microscopic domain size, Figure 4-7(a-c), but no apparent correlation was observed between
capacity and any of these parameters. In contrast, Figure 4-8 shows that H2S capacity is
inversely proportional to crystallite size (from a range of 5-26 nm) regardless of synthesis
procedure and thus, regardless of morphology, surface area, and pore structure. Samples with
crystallites >26 nm exhibited similarly low capacities (0.4-0.5 wt%) across a broad range of
sizes (26-75 nm). These results indicate CuO crystallite size is the critical parameter that
influences H2S removal performance and that a critical crystallite size exists at ~26 nm.
Figure 4-7: Effect of (a) surface area, (b) pore volume and (c) domain size on the carrying capacity.
Brunauer-Emmett-Teller analysis was used to determine surface area, pore volume and domain size.
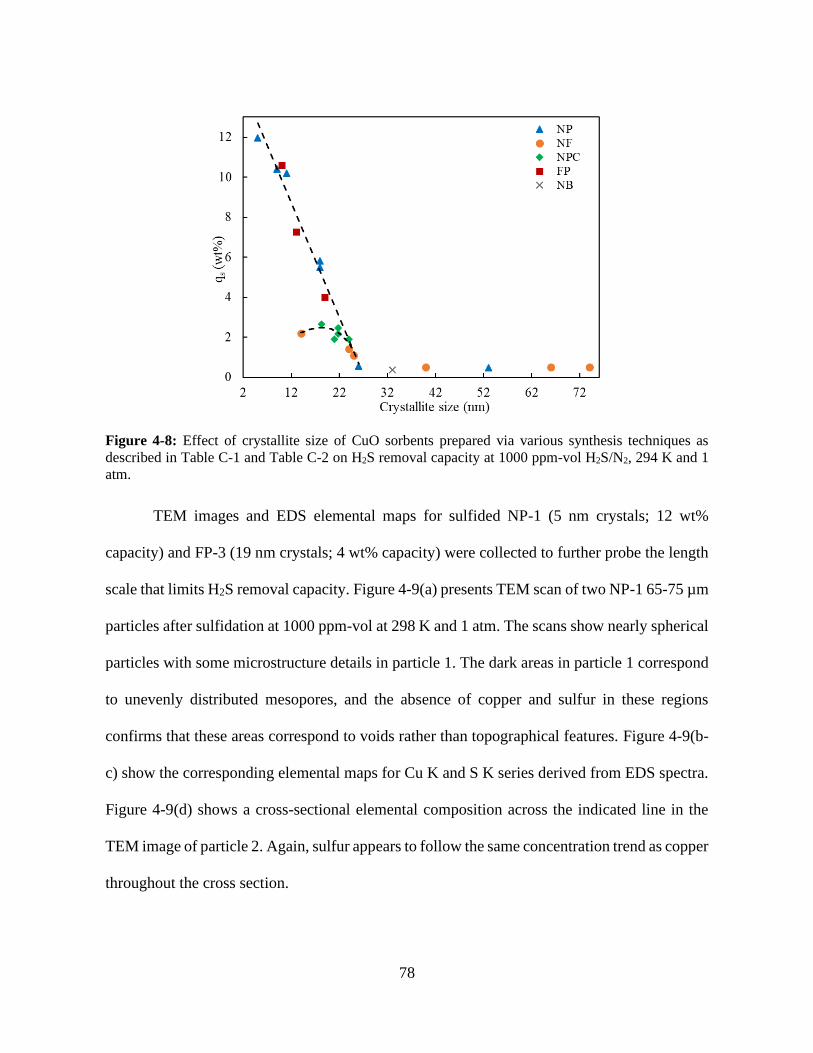
78
Figure 4-8: Effect of crystallite size of CuO sorbents prepared via various synthesis techniques as
described in Table C-1 and Table C-2 on H2S removal capacity at 1000 ppm-vol H2S/N2, 294 K and 1
atm.
TEM images and EDS elemental maps for sulfided NP-1 (5 nm crystals; 12 wt%
capacity) and FP-3 (19 nm crystals; 4 wt% capacity) were collected to further probe the length
scale that limits H2S removal capacity. Figure 4-9(a) presents TEM scan of two NP-1 65-75 µm
particles after sulfidation at 1000 ppm-vol at 298 K and 1 atm. The scans show nearly spherical
particles with some microstructure details in particle 1. The dark areas in particle 1 correspond
to unevenly distributed mesopores, and the absence of copper and sulfur in these regions
confirms that these areas correspond to voids rather than topographical features. Figure 4-9(b-
c) show the corresponding elemental maps for Cu K and S K series derived from EDS spectra.
Figure 4-9(d) shows a cross-sectional elemental composition across the indicated line in the
TEM image of particle 2. Again, sulfur appears to follow the same concentration trend as copper
throughout the cross section.

79
Figure 4-9: a) TEM image for two 65-75 nm particles of NP-1 sorbent after sulfidation at 1000 ppm-
vol H2S/N2, 294 K and 1 atm. b) Cu K and c) S K elemental maps for the NP-1 sulfidated particles based
on EDS spectra. d) Cross-sectional atomic composition of Cu, S and O K spectra across the length of
the particle, indicated by a red line in the TEM scan.
For larger particles of NP-1 (Figure 4-10), the elemental maps and TEM images reveal
slight heterogeneity. The TEM image in Figure 4-10(a) features 545-620 nm particles, and the
Cu K and S K elemental map (Figure 4-10(b-c)) and EDS analysis across the center of the
particle (Figure 4-10(d)) shows that the portion of the particle on the right side of the image is
NP-1 Cu K series
S K series
50 nm 50 nm
(a) (b)
(c)
(d)
1
2

80
less dense than that on the left side. This density difference may be caused by uneven packing
of crystallites within regions of this larger particle, which in turn, leads to the slightly uneven
distribution of the elements throughout the volume of the particle as highlighted in Figure 4-10.
Despite these intra-particle heterogeneities, intra-particle regions with similar density exhibited
constant Cu and S chemical profiles.
Furthermore, Cu K and S K series EDS elemental maps for 55-70 nm particles of
sulfided FP-3 (Figure 4-11) also exhibit uniform distributions of Cu and S within the same intra-
particle regions, despite the lower ratio of S to Cu in this particle (compared to NP-1). The
overlapping and homogeneous spatial distributions of copper and sulfur in these particles
suggests a homogenous propagation of reaction front throughout particles (>50 nm diameter)
that could consist of on the order of 102-6 individual CuO crystallites (of 5-19 nm diameter).
These results confirm the most significant influence of H2S removal in these studies is at the
crystallite level (rather than meso-porosity, macro-porosity and/or microscopic morphology),
and thus sulfur gradients (implied by the lower than stoichiometric capacities in Figure 4-8)
must exist at the CuO crystallite level.

81
Figure 4-10: a) TEM image for 545-620 nm particles of NP-1 sorbent after sulfidation at 1000 ppm-vol
H2S/N2, 294 K and 1 atm. b) Cu K and c) S K elemental maps for the NP-1 sulfidated particles based on
EDS spectra. d) Cross-sectional atomic composition of Cu, S and O K spectra across the length of the
particle, indicated by a red line in the TEM scan.
Cu K series
S K series
500 nm 500 nm
NP-1
(d)
(b) (a)
(c)

82
Figure 4-11: a) TEM image for a 55-70 nm particle of FP-3 after sulfidation at 1000 ppm-vol H2S/N2,
294 K and 1 atm. b) Cu K and c) S K elemental maps for the NP-1 sulfidated particles based on EDS
spectra. d) Cross-sectional atomic composition of Cu, S and O K spectra across the length of the particle,
indicated by a red line in the TEM scan.
The apparently much stronger influence of crystallite size on sorption capacity
(compared to morphology, surface area, and pore structure) may be the result of enhanced
constraints for the solid diffusion of atoms across the crystallite as size increases. Previous
FP-3 Cu K series
S K series
50 nm 50 nm
(b) (a)
(c)
(d)

83
studies of the sulfidation of ZnO143 proposed a reaction mechanism consisting of the following
general steps:
(1) The dissociative adsorption of H2S on the particle surface
(2) Nucleation of ZnS on the ZnO surface
(3) Outward diffusion steps of Zn and O vacancies and of O atoms
(4) Vacancy annihilation and water desorption
We propose a similar mechanism for CuO sulfidation in which oxygen and/or copper
atoms from the bulk CuO crystal phase diffuse to the reaction interface (step 3 above) after
reaction of H2S molecules with the surface oxygen atoms (step 2 above). The increased
crystallite size may hinder this diffusion phenomenon, which is necessary for CuO to fully
transform into copper sulfide (CuS), in two ways: (i) via the formation of thicker CuS layers
which lead to a decrease in effective diffusivity values and (ii) via the formation/presence of
surface features that are less reactive toward H2S and its dissociation products.
Sick et al.230 reported the formation of dense onion-like sulfide layers during CuO
sulfidation which dramatically increase solid diffusion resistance by lower values of effective
solid phase diffusivities. Increasing crystallite size would require the formation of a thicker
outer sulfide layer to achieve the same conversion as a smaller sized crystallite. Indeed, the
thickness of this sulfide layer increases with increasing initial CuO crystallite size between 5-
20 nm (and up to 4.0 wt% H2S capacity). These thicker sulfide layers (compared to smaller
crystallites) may inhibit the diffusional processes needed for the reaction to proceed to
completion.

84
If sulfide layer thickness was the only phenomenon impeding complete conversion at
the crystallite scale, then calculated thickness should be the same for all samples, and the
capacity should have a relationship to initial radius that is approximately R-1 (see SI). Since the
data in Figure 4-8 follow a linear trend with R, an additional phenomenon must also impede
conversion. As mentioned above, changing crystallite size could also impact the surface
features of the reaction interface (e.g., CuO facets) which could change the reaction rates of
H2S molecules and surface species with O and Cu atoms. To probe this molecular explanation
for the effect of crystallite size on surface reactivity, our group performed a computational study
using Density Functional Theory (DFT) for the reaction between H2S and CuO surfaces,
specifically for the dissociative adsorption of H2S molecules on a CuO {111} surface. This
crystallographic surface is the most stable and common facet of CuO and is the predominant
peak in the XRD patterns of the materials tested in this work (see Figure 4-1). CuO {111}
surfaces feature two types of surface O atoms: 3-fold (O3c) and 4-fold (O4c) coordinated. Figure
4-12 shows the structure of a CuO {111} surface with these types of atoms.

85
Figure 4-12: Model of a CuO {111} surface used in this study, showing the different types of surface
atoms depending on their condition: O3c/O4c and Cu3c/Cu4c atoms.
These computations revealed that low-coordinated O atoms such as O3c atoms are
present to a greater extent for smaller crystallite sizes and that these O3c atoms are more reactive
toward adsorbed H2S: They result in ΔGT=298K = -106 kJ/mol for the stoichiometric reaction
𝐶𝑢𝑂 + 𝑥 𝐻2𝑆 → 𝐶𝑢𝑂1−𝑥𝑆𝑥 + 𝑥 𝐻2𝑂 versus ΔGT=298K = -52 kJ/mol for O4c atoms. Thus, the
higher capacity of CuO materials consisting of smaller crystallites may result from a higher
concentration of more reactive O atoms.
In addition to improved reactivity, low coordinated atoms may facilitate diffusion of O
atoms via more facile vacancy formation (step 2 above). Previous work by Nolan et al.140 used
DFT to study the formation of oxygen vacancies on CuO {111} surfaces via vacuum annealing
and H2 reduction. This study observed that formation of vacancies via vacuum annealing from
O3c atoms is more favorable than in O4c atoms (Evac=2.77 eV for O3c vs. Evac=3.27 eV for O4c,
computed with the hybrid HSE06 functional). The DFT studies in this work also revealed that

86
forming O vacancies by formation of water via H2 adsorption is favorable (ΔEads,T=0K= -0.82
eV) for O3c atoms but is unfavorable for O4c atoms (ΔEads,T=0K= 0.02 eV). This is in agreement
with what we found in our computational study, in which the formation of O vacancies via
displacement of oxygen atoms by formation of hydroxyl groups proceeds at ΔG < 0 for O3c
atoms whereas it does at ΔG > 0 for O4c atoms. Thus, O vacancies may be formed to a much
greater extent when the population of low-coordinated O atoms increases (i.e., when crystallite
size decreases) which would in turn enhance diffusional processes needed for complete
sulfidation. Furthermore, DFT studies showed that upon reaction of the O3c atoms (i.e.,
replacement with S atoms), the reactivity of the O4c atoms increases because S atoms disrupt
the Cu-O bonding states inducing lattice strain: Reaction with O4c atoms in a bare CuO surface
results in ΔGT=298K = -52 kJ/mol, whereas they show ΔGT=298K = -101 kJ/mol in a partially-
sulfided surface in which the outer O3c atoms have been replaced by S atoms. This result implies
that as the active O3c atoms in small crystallites react (i.e., leave the lattice), the overall
reactivity of the particle is maintained because less reactive O4c atoms become activated for
vacancy formation and H2S reaction. Taken together, these DFT results support a molecular
interpretation for the increasing capacity of CuO with decreasing crystallite size that extends
beyond a simple diffusion length explanation. Specifically, reaction of low coordinated oxygen
(which are predominant on small CuO crystallites) rapidly react with adsorbed H2S to produce
a partially-sulfided surface while also increasing the reactivity of more highly coordinated
oxygen atoms. Thus, rates of elementary reaction and molecular diffusion steps (steps 2 and 3
above) occur more rapidly and to a greater extent on smaller CuO crystallites.

87
4.3.3 Influence of carbon-based residues on H2S removal
Figure 4-8 also shows a group of samples that deviate from the linear trend of increasing
capacity with decreasing crystallite size in the range from 14-24 nm. Namely, decreasing the
size of NPC and NF samples, both which involved the use of polymer/surfactant in synthesis,
didn’t result in an enhancement in the removal capacity compared to other samples in the same
crystallite range. The deviation appears to be more pronounced for a nanofiber sample, NF-1,
which had a crystallite size of 14 nm which fell well below the trend line, as the removal
capacity of this material was merely 2.2 ± 0.1 wt% (compared to 7 wt% for other samples with
similar crystallite sizes). As explained in Section 2.2, the synthesis of electrospun nanofibers
requires the use of a polymer (PVP or PEO), which upon thermal treatment leaves carbon-based
residues on the surface of the material, as discussed in Section 3.1. Thus, this residual carbon,
which is undetectable by TGA but apparent on the surface from XPS, influences the reaction in
such a manner as to decrease capacity when the crystallite size is less than 20 nm. To further
probe the effect of residual C, NF-2 and NF-3 samples were prepared using PVP of different
molecular weight, M.W.=1,300,000 and 40,000, respectively. XPS results in Figure 4-6 show
that the variation in molecular weight didn’t affect the amount of residual carbon retained on
the surface with 32% C-Cu ratio in NF-2 and 34.9% in NF-3 and it impacted the capacity in the
same way.
To further investigate the source of poor removal capacity of carbon contaminated
samples, NPC-1, NPC-3, NPC-4 and NPC-5 samples were prepared using PVP
(M.W.=1,300,000) and a varying polymer to salt ratio (50%, 40%, 20% and 10%). It appears,
as shown in Figure 4-8, that the performance of the sorbent fluctuated between 1.9 and 2.4 wt%
regardless of the polymer to salt ratio, and the change in crystallite size in 24-14 nm crystallite

88
size range. Figure 4-8 also confirms the same conclusion by showing that the presence of any
carbon residue (quantified by XPS results as C-Cu atom%) between (19% and 50%) dampened
the performance of the sorbent significantly, in the same way. A plausible explanation for why
the presence of any carbon-based residues affects the sorption capacity is due to them blocking
the active sites of the reaction, namely the surface oxygen atoms acting as Brønsted basic
centers that react with the hydrogen atoms of H2S molecules and/or the surface copper atoms
acting as Lewis acid centers that bond to sulfur atoms. Since the sulfidation process is diffusion-
limited (with most of the reaction taking place on grain surfaces) as demonstrated in previous
sections, the blocking of any surface-active sites will adversely affect the extent of reaction.
The significance of this observation stems from its relevance to the recent interest in
applications of nanofibers in catalytic and chemisorptive processes. Most of the synthesis
procedures for nanofibers in literature necessitate the use of polymers in the electrospinning
process. Our work shows that the thermal treatment at temperatures as high as 898 K, couldn’t
get rid of all carbon residue. Increasing the temperature of calcination beyond this point, causes
crystal growth which will compromise the performance as well.
4.4 Conclusions
Several CuO-based nanomaterials were prepared and tested for their performance as
low-temperature desulfurizing sorbents by performing fixed-bed sulfidation experiments at
ambient temperature and pressure. These materials were prepared via various synthesis
techniques, including sol-gel, precipitation, hydrothermal treatment in the presence of a
polymer (PVP or PEO) or surfactant (P123), hydrolysis, and electrospinning. A linear driving
force model was used to analyze the collected breakthrough curves, to evaluate the removal

89
capacity, qs, and overall rate parameter, k, for the nineteen sorbents synthesized in this work
and glean information about the properties that affect the sorption capacity of unsupported
CuO-based sorbents.
Despite differences between the various properties of the tested CuO sorbents as well
as their morphologies, a strong linear relationship was recognized between the sorbents’ sulfur
removal capacity and crystallite size, particularly when the crystallite size of CuO was below
26 nm. It was also observed that CuO materials with crystallite sizes larger than 26 nm had
negligible sulfur uptake capacities (~0.5 wt%). The effect of residual carbon was also
investigated, and it was found that carbon residues resulting from the use of a polymer (PVP or
PEO) or a surfactant (P123) in the synthesis procedure remained on the surface of the sorbent
after thermal treatment and detrimentally effected its H2S uptake capacity. The results in this
paper demonstrate the strong influence of crystallite size of unsupported CuO sorbents and their
purity on H2S removal capacity at ambient conditions, irrespective of morphology and other
physiochemical properties, such as surface area, pore size, and pore volume. An atomic scale
explanation of the strong influence of crystallite size is proposed from model DFT calculations,
explaining how elementary reaction and molecular diffusion steps occur more rapidly and to a
greater extent on smaller CuO crystallites.

90
Chapter 5 | Fundamentals of the Remediation of Sulfur from Gaseous
Streams using Copper Oxide
5.1 Introduction
The primary drawbacks with current reactive sorption materials are incomplete
conversion and mass-transfer limited rates.8,231–233 These limitations can result from either
morphology (e.g., decreasing porosity) and/or chemical structure changes (i.e., changes at the
product-reactant interface) that occur during reaction.27,174
Indeed, the technologies that remove sulfur contaminants from natural gas need to be
very well understood so that existing and future gas conversion technologies can be deployed
successfully. Developing fundamental insight for these gas-solid reactions requires
characterization at the molecular/atomistic level while also collecting reaction kinetic data to
use in microkinetic models that enable reaction model parameters to be related to chemical and
structural changes.234 These fundamental models have parameters with distinct physical
meanings and can be used across a wide range of conditions and materials. Only a few recent
studies have used both advanced characterization and intrinsic kinetic studies to develop such
molecular descriptions of gas-solid reaction systems,8,231,235,236 and very few previous studies
have attempted to probe, in real time, the spatial and chemical conversion of solid phases during
reaction with gaseous species.8,231
Herein, we report results from the use of synchrotron-based X-ray techniques to
elucidate quantitatively how the fundamental kinetics relates to the evolution of chemical
heterogeneity of two different copper oxide sorbent materials during reaction with hydrogen
sulfide to form copper sulfide. X-ray absorption spectroscopy (XAS) tracked changes in the

91
average chemical environment of Cu atoms during sulfidation, and allowed determination of
CuO conversion with time, providing direct determination of the bulk sulfidation kinetics.
These data were complemented using transmission X-ray microscopy (TXM) within individual
micrometer sized CuO particles to quantify chemical and structural changes on a length scale
of tens of nm. Our primary discoveries show that H2S removal reaction kinetics exhibit similar
trends in fixed bed reactors and in individual µm-sized particles. However, reaction fronts
proceed through the diameter of the these particles heterogeneously. Furthermore, we
quantitatively identify, for the first time, H2S concentration gradients within particles as small
as 10 µm, which indicate pore diffusion even at very small length scales. We also show that
copper oxide sorbent samples with similar physical characteristics exhibit ~3 times different
sulfidation conversion with reaction rate constants that differ by a factor of 1.5. We conclude
that differences at the crystallite level must be taken into account with differences in pore
structure and/or grain size of CuO even at tens of µm length scales to completely describe the
observed differences in sulfidation reactivity. Furthermore, we suggest that the formation of
different copper sulfide products also influence the capacity and rate differences between
similar copper oxide materials. These results represent an advancement toward the fundamental
molecular understanding of gas-solid reactions by simultaneously collecting kinetic data and
characterizing the real-time chemical and structural changes of the solid phase.
5.2 Experimental Methods
5.2.1 Materials and synthesis methods
Copper (II) oxide particles were prepared by a dropwise addition of aqueous 0.1 M
sodium hydroxide solution (BDH, 97% minimum assay) to aqueous 0.1 M copper (II) nitrate

92
trihydrate (Sigma Aldrich, 99.0%) solution under continuous mixing. The copper (II) hydroxide
precipitate was then vacuum filtered and dried in air at 353 K for 14 hours. The precipitate was
treated in air at 823 K (0.7 K min-1) for 4 h. This sample is denoted as CuO-2. A commercially
produced copper-based material (HiFUEL W230; lot number L04Y006; 63.5 wt% CuO, 25
wt% ZnO, and 10 wt% Al2O3) was purchased from Alfa Aesar. This sample is denoted as CuO-
1.
5.2.2 Fixed-bed experiments
Reactive adsorption of H2S was studied in an apparatus with plug-flow hydrodynamics.
Flow rates of gaseous H2S and N2 were introduced via mass flow controllers (MKS GE50A and
GM50A). Feed to the reactors consisted of H2S in N2 (900-1000 ppm-vol) and was produced
by diluting a 1.0% H2S (Praxair UHP) in N2 mixture with UHP N2. Powder adsorbent samples
(155-260 mg) were sieved (+200-100 US mesh; 75-125 µm agglomerate diameter) and fixed
between plugs of quartz wool in a 0.25-inch outer diameter tubular, stainless steel reactor. All
gas transfer lines and the interior of the reactor were treated with an inert coating (SilcoNert
2000) to mitigate H2S adsorption onto tubing walls. Compositions of feed and effluents were
determined using online gas chromatography (Agilent 7890B) with a sulfur chemiluminescence
detector (SCD; Agilent 755) and continuous gas phase FTIR spectroscopy (MKS Multigas).
5.2.3 Non-synchrotron characterization techniques
Scanning Electron Microscopy (SEM) images of the CuO materials were taken before
and after sulfidation using a Nova Nano 230 in the Materials Science and Engineering
Department at UCLA. X-ray diffractograms were collected using a Panalytical X’pert Pro
Powder X-Ray diffractometer in the UCLA Molecular Instrumentation Center. N2

93
physisorption isotherms were collected at 77 K on a Micromeritics ASAP 2020 Plus. Prior to
adsorption, the samples were treated at 423 K (10 K min-1) under flowing N2 for 8 h. Surface
areas were calculated using the Brunauer–Emmett–Teller (BET) method, and pore volumes
were calculated using the Barrett-Joyner-Halenda (BJH) method.
5.2.4 Synchrotron-based X-ray characterization
XAS and TXM measurements (shown schematically in Figure 1, collected at beamlines
2-2 and 6-2237 at the Stanford Synchrotron Radiation Lightsource) were performed in order to
establish a comprehensive understanding of the reaction kinetics. Bulk XAS data provide
spectra with good signal to noise and are sensitive to subtle chemical changes in the chemical
state of the copper atoms. However, bulk measurements miss the reaction front propagation
within individual particles. Two and three dimensional X-ray spectro-microscopy, with spatial
resolution down to 30 nm has the ability to map chemical variations across µm-sized 238–240 and
can identify reaction fronts as they proceed through particles. In this work, we designed,
constructed, and implemented two different gas phase reaction cells (Figure 5-1) that are
compatible with the experimental criteria of TXM and XAS, respectively.

94
Figure 5-1: a) Schematic of experimental setup for sulfidation of CuO samples at the XAS and TXM
beam lines. b) XAS cell schematic used for the room temperature sulfidation of CuO. c) TXM cell
schematic featuring 0.5 mm quartz capillary used for the room temperature sulfidation of CuO.
Transmission X-ray images were collected using the full-field TXM at beam line 6-2 of
the Stanford Synchrontron Radiation Lightsource, SSRL. The X-rays from a 56 pole 0.9 Tesla
wiggler pass through several mirrors and are then focused to a spot size of a few hundred
micrometers, which acts as the virtual source for the microscope. The monochromator installed
at beam line 6-2 is a liquid nitrogen cooled double-Si(111) crystal system. The monochromator
selects a narrow band pass from the incident X-ray, providing quasi-monochromatic
illumination over a 2.1– 17.0 keV range for the optics downstream. A mirror pitch feedback
system is installed to monitor the micrometer-level beam movements and adjust the toroidal
mirror for stabilizing the beam. The TXM, designed to work over an energy range of ~5–14
keV, utilizes a capillary condenser to focus the beam to a spot with size down to a few tens of
m. A Fresnel zone plate with 200-μm diameter and 30-nm outermost zone width is employed
to achieve a magnification of around 50 (depending on the energy configuration of the incident
X-rays), which is further increased by a factor of 10 using the optical objective lens downstream

95
of the scintillator crystal. A 2048 by 2048 pixel CCD optically coupled with the scintillator
crystal is used to collect the projection images. The nominal spatial resolution of this system is
~30 nm confirmed by a Siemens calibration standard and modulation transfer function.
In our experiments, the energy scan was coupled with the full-field imaging.
Transmission images were recorded at over 100 energy points. Over the near edge region, we
chose energy step of 1 eV to achieve the necessary energy resolution. The energy step outside
of the near edge region is set to be 10 eV for covering a relatively large energy window, which
is necessary for normalization or the spectra. The reduction of the spectro-microsocpic data is
performed using an in-house developed software package known as TXM-Wizard.237
For in-situ, TXM measurements, copper oxide samples were ground into a fine powder.
Less than 1 mg of the sample was loaded into a 0.1 mm OD quartz capillary with a 0.01 mm
wall thickness that had been previously heat treated into a U shape. X-ray imaging was
conducted around the Cu K-edge (~8979 eV), which is sufficient to penetrate through the
capillary cell and sample. Both ends of the capillary were cut off to create a U shaped tube. The
U shaped capillary was glued into a sample holder using 5 minute epoxy. The gas delivery
system at beamline 6-2C of SSRL allows easy switch of different gas environments.
Cu K-edge, 8979 eV, XAS spectra were collected in transmission mode on the bending
magnet beamline 2-2 at SSRL. The incident beam energy was selected using a water-cooled Si
(220) phi = 0 monochromator with a beam size of 1 mm vertically x 3 mm horizontally. The
ion chambers were filled with nitrogen gas. X-ray absorption near edge spectra, XANES, scans
were collected every 7 minutes. Extended X-ray absorption fine structure, EXAFS, scans were
collected every 15 minutes. A copper foil was scanned simultaneously for energy calibration.

96
For in-situ XAS experiments, copper oxide samples were ground into a fine powder.
Approximately 12 mg of CuO-1 was diluted with 48 mg of boron nitride (Sigma Aldrich) to
achieve between 2-3 absorption lengths given the geometry of the experimental cell. In a similar
manner, 10 mg of CuO-2 was diluted 100 mg of -alumina and 100 mg boron nitride to give a
similar absorption length. The addition of the -alumina in the copper oxide nanoparticle
sample was to prevent the sample bed from packing under gas flow. The samples were packed
into a 10 cm long 6 mm OD glassy carbon tube (HTW Hochtemperatur-Werkstoffe GmbH) and
stabilized with glass wool to prevent sample movement under gas flow. The glassy carbon tube
was mounted into a flow through cell that acts as a plug flow reactor. The cell was purged with
flowing helium prior to data collection.
Gases used during the in-situ XAS and TXM sulfidation experiments were helium
(99.95%, Airgas) and 1000 ppm H2S in helium (Airgas).The gas flow rates and pressures for
the XANES and TXM measurements were 10 mL(STP)/min and 1 atm, and 2 mL(STP)/min
and 1 atm, respectively. Samples were exposed to flowing helium while spectra, EXAFS and
energy resolved TXM images, were collected to determine the initial state of the copper in each
sample. Maintaining the same flowrates as above, the helium was replaced with the 1000 ppm
H2S/He blend while XANES scans or energy resolved TXM images were collected. The copper
oxide samples were exposed to sulfidation conditions for approximately 10 hours during the in-
situ XAS and TXM measurements. The samples were purged with flowing helium at the end
of the sulfidation process.

97
5.2.5 XAFS data processing and analysis
The Demeter package241 was used to process and analyze the XAS data. Athena was
used to calibrate, align, and normalize all XAS spectra, to average XAS scans, and to extract
the (k) data used in the EXAFS modeling. Artemis was used for the EXAFS modeling. The
X-ray energy of each XAS spectrum was calibrated to the first inflection point of the Cu K-
edge of the Cu foil, 8979.0 eV, collected simultaneously. The pre-edge was approximated as a
second-order polynomial, and the background was approximated with a cubic-spline. Data were
normalized by subtracting a pre-edge and normalizing to an edge-jump of 1.
Athena was used for the linear combination fitting of the XANES spectra characterizing
the sulfidation of the copper oxide. XANES spectra were fit using normalized spectra over a
range from -30 eV to 50 eV above the edge energy. The contributions of all standards were
forced such that the weight of each contribution was restricted to a value between 0 and 1.
XANES spectra of CuO and CuS were used as standards in the linear combination fitting.
FEFF 6 was used to determine the scattering paths in the EXAFS analysis based upon
CIF files (from the Inorganic Crystal Structure Database (ICSD)242) of bulk copper compounds
(fcc-Cu metal (ICSD 53247), and CuO (ICSD 16025)). The amplitude reduction factor, S02,
was determined to be 0.81 by modeling of bulk Cu. Due to the complexity and large number of
scattering paths in CuO, the models were simplified using the following assumptions: (i) only
single-scattering paths; (ii) coordination numbers, N, scale linearly by a factor α; (iii) “like”
scattering paths have the same σ2 values.
The TXM data reduction was conducted using an in-house developed software package
known as TXM-Wizard.237 We first used the difference between the images acquired above and

98
below the Cu absorption edge to generate an “edge jump map”, which is then used to reject
pixels with insufficient absorption signal. After that, the spectra over every individual pixel are
normalized separately using a well-established method.243 We performed linear combination
fitting of all the pixel XANES using the standard spectra of CuO and CuS. Two dimensional
chemical maps are generated based on the fitting results. The chemical maps in Figure 5-6 are
color coded to the local chemical compositions based on the similarities of the local Cu XANES
spectra that associate with each of the pixels at ~35×35 nm2 to the standard spectra of the known
end chemical compositions. The sample slightly drifted during the measurement. As a result,
we did not capture the entire particle throughout the experiment. However, the common area in
the chemical maps covers a significant portion of the larger particle (Particle B) in Figure 5-6
and the entire particle (Particle A) in Figure 5-6 (except for the map of the initial state, which
is known to be pure CuO (purely red)) and is, therefore, sufficient for further quantification in
this work.
5.2.6 Random pore model development
The Random Pore Model (RPM) was used to analyze the conversion versus time data
collected from the in-situ XAS studies.174 Briefly, the model assumes that the pores are
cylindrical and are not created nor destroyed, an expression encompassing both the kinetically
controlled and the diffusion-controlled regimes can be written as follows:
𝒅𝑿
𝒅𝒕=
𝒌𝑹𝑷𝑴𝑺𝟎𝑪𝒃(𝟏 − 𝑿)√𝟏 − 𝜳𝒍𝒏 (𝟏 − 𝑿)
(𝟏 − 𝜺𝟎)[𝟏 + 𝜷𝒁/𝜳(√𝟏 − 𝜳𝒍𝒏 (𝟏 − 𝑿) − 𝟏] (21)
The Z term is the ratio of the molar volume of the product to the molar volume of the
reactants (0.63 for CuS and CuO). The β term represents a modified Biot number that

99
encompasses the rate constant and the effective product layer diffusivity of the system at hand.
For a stoichiometrically balanced equation, such as the sulfidation of CuO, this Biot number
can be expressed as
𝜷 =𝟐𝒌𝑹𝑷𝑴(𝟏 − 𝜺𝟎)
𝑽𝑪𝒖𝑶𝑫𝑹𝑷𝑴𝑺𝟎 (22)
The parameter Ψ is a function of three structural parameters that can be calculated from
a pore size distribution of the material189 obtained by mercury porosimetry. These parameters
are the initial surface area of reaction (S0), the initial total length of pore structure (L0), and the
initial porosity (ε0). Ψ can be calculated as follows:
𝜳 =𝟒𝝅𝑳𝟎(𝟏 − 𝜺𝟎)
𝑺𝟎𝟐
(23)
In the kinetic region, the modified Biot number tends to 0, and in the diffusion region,
the modified Biot number tends to infinity. Applying this to Equation 21, and then integrating
and simplifying the resulting equation allows for the creation of two distinct functions relating
conversion and time:
𝟏
𝜳[√𝟏 − 𝜳𝐥 𝐧(𝟏 − 𝑿) − 𝟏] =
𝒌𝑹𝑷𝑴𝑺𝟎(𝑪𝒃 − 𝑪𝒆)𝒕
𝟐(𝟏 − 𝜺𝟎) (24)
𝟏
𝜳[√𝟏 − 𝜳𝐥 𝐧(𝟏 − 𝑿) − 𝟏] =
𝑺𝟎
𝟏 − 𝜺𝟎
√𝑫𝑹𝑷𝑴𝑴𝑪𝒖𝑶𝑪𝒃𝒕
𝟐𝝆𝑪𝒖𝑶𝒁 (25)
The left-hand sides of Equations 24-25 represent a modified conversion which is a
simple algebraic relation to the parameters kRPM and DRPM. In the kinetically controlled region,
the modified conversion is linearly proportional to time, while in the diffusion limited case,
modified conversion has a square root of time dependence. Equations 24 and 25 were used to

100
regress the experimental data and determine the kinetic rate constants and diffusivities of the
copper oxide samples.
5.3 Results and Discussion
5.3.1 Non-synchrotron characterization
Both CuO samples were characterized to identify their initial chemical composition,
crystalline phases, and pore structure. XRD patterns for the two samples show only
characteristic peaks for hexagonal CuO. Analysis of the peak at 2θ=37°, CuO (1 1 1), indicates
that the CuO exists as crystallites of 28.3 nm and 2.8 nm in CuO-2 and CuO-1, respectively.
No characteristic ZnO peaks were observed for CuO-1, suggesting that the zinc oxide is either
amorphous or has crystallites below the detection limit of XRD. SEM images (Figure 5-2 and
Figure 5-3) reveal particles that are 1-5 μm in diameter consisting of agglomerates of smaller
(<1 μm) particles (CuO-2) and 5-15 μm sized particles, also consisting of agglomerates of
smaller (~1 μm) particles (CuO-1). The best-fit model of the Cu K-edge EXAFS data
characterizing both CuO-1 and CuO-2 contained only scattering paths matching hexagonal CuO
(see Table D-1). However, the coordination numbers for all paths are lower than those of bulk
CuO, and for CuO-1 are smaller than CuO-2, consistent with the XRD that the CuO-1 contains
smaller CuO crystallites than CuO-2. We note that there were no detectable scattering paths
from Cu-Zn or Cu-Al contributions in CuO-1. However, while the Cu K-edge XANES
spectrum of CuO-2 contains spectral features that match those of monoclinic CuO, the XANES
of CuO-1 appear to be slightly modified. This may be a result of the small crystallite size244 or
from an interaction of the CuO with the ZnO or Al2O3 as observed in other mixed oxide

101
samples.245,246 Analysis of the pore structures of these materials from N2 physisorption data
reveal similar pore volumes and surface areas for the two samples (Table 5-1). In summary,
these characterization data indicate that the two samples studied herein are chemically and
structurally similar, with the only measurable difference being the CuO crystallite and particle
size.
Figure 5-2: SEM images of HiFuel W230, CuO-1, A) -270 mesh (>53 m) particles before sulfidation,
B) +200-100 mesh (75-125 m particles) before sulfidation, and B) +200-100 mesh (75-125 m
particles) after reaction with 110 cm3(STP) min-1 of 930 ppm H2S/N2 at ambient temperature (294 K)
and pressure (1.1 atm).
Figure 5-3: SEM images of copper (II) oxide nanoparticles prepared by precipitation from copper (II)
nitrate trihydrate precursor, CuO-2, A) before sulfidation and B) after reaction with 84 cm3(STP) min-1
of 1000 ppm H2S/N2 at ambient temperature (294 K) and pressure (1.1 atm).

102
Table 5-1: Pore volumes and BET surface areas of fresh and sulfided CuO-based sorbents.
Adsorbent Fresh pore
volume (cm³/g)
Fresh surface
area (m2/g)
Spent pore
volume (cm³/g)
Spent surface
area (m2/g)
HiFuel W230
(CuO-1) 0.139 67.3 0.051 17.6
CuO
(CuO-2) 0.181 58.8 0.112 87.1
5.3.2 Fixed bed sorption experiments
The sulfidation kinetics of the two samples (at ambient temperature and pressure) were
measured in fixed bed sorption experiments to determine the saturation capacities and sorption
rate parameters from the breakthrough curves (Figure 5-4). In these breakthrough curves, the
time on stream is normalized against the weight-hourly space velocity (mass flowrate of H2S
divided mass of adsorbent). This normalization procedure accounts for any small variation in
inlet H2S flowrate and adsorbent bed size and allows for the direct comparison of breakthrough
curves.
The breakthrough data for CuO-1 (red in Figure 5-4) and CuO-2 (blue in Figure 5-4)
both exhibit a sickle shape which are best modeled by the linear driving force model derived
by Cooper182,247,248 (black lines in Figure 5-4). CuO-1 exhibited a higher H2S capacity (12 wt%;
44% conversion) compared to CuO-2 (6.0 wt%; 14% conversion). Reaction rate parameters (k)
were determined from linear least square regression of the data using the Cooper model. The
values for the bulk and pore diffusion terms were calculated from known engineering
correlations (Refer to Section 2.2.3). The calculated values for the bulk diffusion (22,000 s-1
and 7400 s-1 for CuO-1 and CuO-2, respectively) and pore diffusion (260 s-1 and 90 s-1 for CuO-
1 and CuO-2, respectively) terms are more than an order of magnitude larger than the
experimental reaction parameters (5.2 s-1 and 6.1 s-1 for CuO-1 and CuO-2, respectively) for
each sample. Thus, bulk and pore diffusion resistances have negligible impact on the measured

103
rate of H2S removal under the conditions of these experiments, and the experimentally
determined reaction rate parameter represents the rate of chemical reaction and diffusion
phenomena at the interface of CuO-CuS. The rate parameter for CuO-2 was a factor of 10 larger
than for CuO-1 (4.3x10⁻⁴ s-1 vs. 4.0x10⁻⁵ s-1). These results suggest that the lower conversion of
the CuO-2 sample (compared to CuO-1) results from rapid CuS formation that covers surfaces
and fills particle pores, eventually impeding transport of H2S to CuO surfaces.
Figure 5-4: Normalized concentration-time profiles for CuO-1 (red circles) and CuO-2 (blue triangles).
Normalized time is calculated by multiplying the time on stream with the mass flowrate of H2S and
dividing by the mass of adsorbent. Solid lines are predictions from the linear driving force model derived
by Cooper.12
5.3.3 Sulfidation kinetics from bulk XAS measurements
Direct determination of the bulk sulfidation kinetics of CuO-1 and CuO-2 were
determined using in-situ XAS. The Cu K-edge spectra show changes concomitant with a change
from CuO-like features to those of CuS. Linear combination fitting (LCF) of the spectra was
used to determine the extent of CuO conversion as a function of reaction time (Figure 5-5).

104
Conversion rapidly increases with time for both samples during the first 10-30 minutes, but the
rate slows thereafter. After ~10 h time on stream, the reaction appears to stop (conversion
approaches a constant value with increasing time). The initial region lasted 3 times longer for
CuO-1 (30 min) then CuO-2 (10 min), and the total conversion to CuS was ~3-fold higher for
CuO-1 than CuO-2 (38% vs 13%), similar to the results of the fixed bed experiments. The LCF
XAFS data were analyzed using the random pore model174 (RPM); a reaction rate controlled
regime that evolves into a diffusion controlled regime as conversion increases, and values for
reaction rate constants and effective diffusivities were regressed. The rate constant for CuO-2
(8.3 x 10⁻³ cm4 mol-1 s-1) was higher than that for CuO-1 (5.6 x 10⁻³ cm4 mol-1 s-1), indicating
that rapid reaction rates lead to CuS products that fill pores/cover surfaces and ultimately to the
early onset of slower, diffusion controlled reactions. The effective diffusivity in the diffusion-
controlled regime was higher for CuO-2 than CuO-1 (2.0 x 10⁻¹² vs 1.1 x 10⁻¹² cm2 s-1)
suggesting that restriction of H2S to CuO surfaces is more severe in CuO-1 than CuO-2 during
their respective diffusion controlled reaction regimes because of higher product content within
CuO-1 than CuO-2. While the access to reactive surfaces is apparently more facile in CuO-2
(than CuO-1) during the diffusion-controlled regime, the much earlier onset of this regime
mitigates this apparent advantage. Indeed, these data reveal that slower reaction rates are
beneficial to extending reaction-controlled sorption rates to achieve maximum conversions.
Previous studies on H2S reactions with ZnO and ZnO doped with Cu or Ni8,231–233
attributed improvements in reaction rate and conversion to dopants (e.g., Cu) that can facilitate
the oxidation of the sulfur in an adsorbed HS- species from S2- to S- because they are more easily
reduced than Zn. This oxidation of S leads to a lower energy barrier for H-S dissociation with
the final reaction steps being re-reduction of S- to S2- (with oxidation of Cu+ to Cu2+) and

105
formation of ZnS.8,231 However, both samples in this study are comprised of crystalline CuO,
and there is no evidence for significant interaction between the Zn and Cu at the atomic scale
(as evidenced by EXAFS) for CuO-1. Furthermore, both samples have similar pore volume and
surface area (Table 5-1). Therefore, the differences in reaction rate constant and final
conversion in our studies are unexpected and must result from differences in the initial copper
oxide surface (e.g., preferentially exposed planes and/or defects) or from differences in the
evolution of the reactant-product interface (e.g., different products formed). On predominantly
Zn-based materials, the final redox step (S- to S2-) is likely to occur for all H2S molecules
converted because ZnS is the only product that can form with Zn2+. In contrast, a variety of
copper sulfide products can form (CuxSy with 1≤x/y≤2) because of the multiple oxidation states
of Cu and S (S2- and (S-)2). Thus, we hypothesize that the differences in the intrinsic reaction
rate constants measured in this work suggests that the single reaction assumption (i.e., formation
of only CuS) for both materials is insufficient, and therefore, additional studies are necessary
to characterize sulfide products and construct a more detailed atomistic-level mechanism that
includes the formation of all relevant copper sulfide products.

106
Figure 5-5: Conversion of CuO to CuS as a function of time determined by the LCF of bulk XAS
experiments, CuO-1 (red circles) and CuO-2 (blue squares); and LCF of the TXM spectro-microscopy
images of individual particles of ~10 µm (particle A in Figure 5-6; black triangles) and ~20 µm (particle
B in Figure 5-6; green diamonds) of CuO-1. Black lines are model fits to the bulk XAS data.
5.3.4 Sulfidation kinetics of individual particles via TXM
As mentioned previously, both porosity and chemical structure influence the average
rate of reaction in particles of metal oxides.27,174,232,233 Thus, heterogeneity at the particle or sub-
particle scale can critically affect the performance of the solid phase, and it is of fundamental
interest and practical importance to visualize the evolution of this chemical heterogeneity at
fine length scales. Thus, we performed 2-dimensional XANES mapping on particles of the CuO
samples (using TXM). Figure 5-6 shows chemical maps, determined by LCF, of a ~10 μm and
a ~20 μm particle of CuO-1 during the course of exposure to 1000 ppm H2S for 8 hours. Direct
observation of the chemical maps in Figure 5-6 suggests that the evolution of the chemical
heterogeneity follows a complex pathway, highlighting the importance of studying the particles
using a chemical sensitive probe with good spatial resolution.

107
For quantification of the XANES imaging data, we first average the chemical signatures
of the entire particle A and the common areas in particle B, respectively. The amounts of
remaining CuO in both particles change over time and, follow the same trend as the data from
the bulk XAS measurement (Figure 5-5). The matching trends of both the bulk XAS and
averaged TXM XANES results not only confirms the reliability of our measurements but also
suggests that the critical length scale of the chemical heterogeneity is at the mesoscale (sub-
single particle) level. For a better visualization of the dynamic evolution of the chemical
distribution at sub-particle level, we segment out the reaction front based on the local chemical
composition of particle A. The pixels associated with local CuO/CuS ratio at 1:1 (indicating
50% conversion of CuO to CuS) are labeled in white in Figure 5-6, and are defined as the
reaction front. The sulfidation front clearly initiates within the outer portions of the particle (at
distances that are >90% of the radius) and propagates towards the center of the particle after
being exposed to the H2S stream for ~5-6 hours. The morphology of the reaction front also
changes from isolated pockets into a complex interconnected network upon progression of the
reaction. At the beginning of the reaction, the nucleation events dominate the system leading to
relatively fast conversion of CuO to CuS. After the first few hours, the propagation of reaction
front in the solid phase becomes the dominating event and the system becomes diffusion
limited, slowing down the overall conversion efficiency.

108
Figure 5-6: A) In-situ Chemical maps of CuO particles during sulfidation reaction. 3B) Development
of the reaction front (defined by the voxels with a chemical composition of 50% CuO and 50% CuS)
Analysis of the entire volume of both particles reveals similar kinetics as those measured
in a reactor (containing multiple particles), indicating that analysis of reaction of mg amounts
of powders can produce kinetic expressions suitable for reactor scale design and operation.
However, the different dynamic conversion profiles measured at different radial positions
within individual particle indicates that H2S concentration gradients (and thus, pore diffusion)
exist even at very small length scales and cannot be detected by analyzing the kinetics in fixed
beds of particles. The conversion versus time data at various radial positions within Particle A
were analyzed using the RPM to quantitatively determine any kinetic differences with radial
position. The RPM predicted the conversion versus time data with good agreement to the
experiment data (Figure 5-7A). However, the rate parameters exhibited a sharp decrease at

109
positions less than 90% of the radius (Figure 5-7B). Furthermore, the diffusivity exhibited a
linearly increasing trend with radial distance into the particle (Figure 5-7B). These conversion
profiles measured from TXM suggest that H2S concentrations are higher within the outer
regions of the particle, leading to higher initial reaction rates, faster buildup of product layers,
and more rapid pore structure change. Conversely, lower concentrations within the particle
interior would lead to slower reaction that allows diffusion to occur more rapidly as product
layers form more slowly. This explanation is supported by the increasing values of the effective
diffusivity with increasing proximity to the particle interior. Furthermore, the abrupt decrease
in reaction rate constant (followed by a more gradual decrease of rate constant) indicates that
this value is dependent upon H2S concentration. Thus, this reaction rate constant is an apparent
rate constant and not an intrinsic rate constant as has been suggested by previous work.27,174
This conclusion further supports the need for identification of fundamental mechanism for the
reaction between CuO and H2S that can describe this reaction across a wide range of conditions.
Figure 5-7: A) Conversion (lines are data; symbols are model predictions) of CuO to CuS at various
radial distances and at various times on stream. B) RPM rate constants (k) and effective diffusivities
(De) as a function of radial distance. The value of zero is the particle surface and the value of 1 is the
particle center.

110
5.4 Conclusion
The observations from the in-situ XAS and TXM are consistent with the conventional
kinetic studies that evaluate the role of the porosity and chemical structure in affecting the bulk
performance of CuO for H2S removal. These phenomena were quantitatively probed via TXM
of individual particles to show average kinetics within single particles mirror the reaction
kinetics measured from fixed bed of sorbents. Similarly, analysis of data from XAS of a
gradientless reactor reveals the same kinetic differences between the two CuO samples as
analysis of breakthrough curves in a fixed bed experiment with sharp axial concentration
gradients. However, the growth of reaction fronts proceed heterogeneously within solid phase
particles and pore diffusion persists even for particles less than 10 µm in size. This combined
characterization-kinetic analysis ultimately revealed that chemically and structurally similar
CuO can exhibit different kinetics upon reaction with H2S and that explaining these differences
must include more detailed reaction stoichiometry and analysis of specific surface properties of
the reactant and product phase.
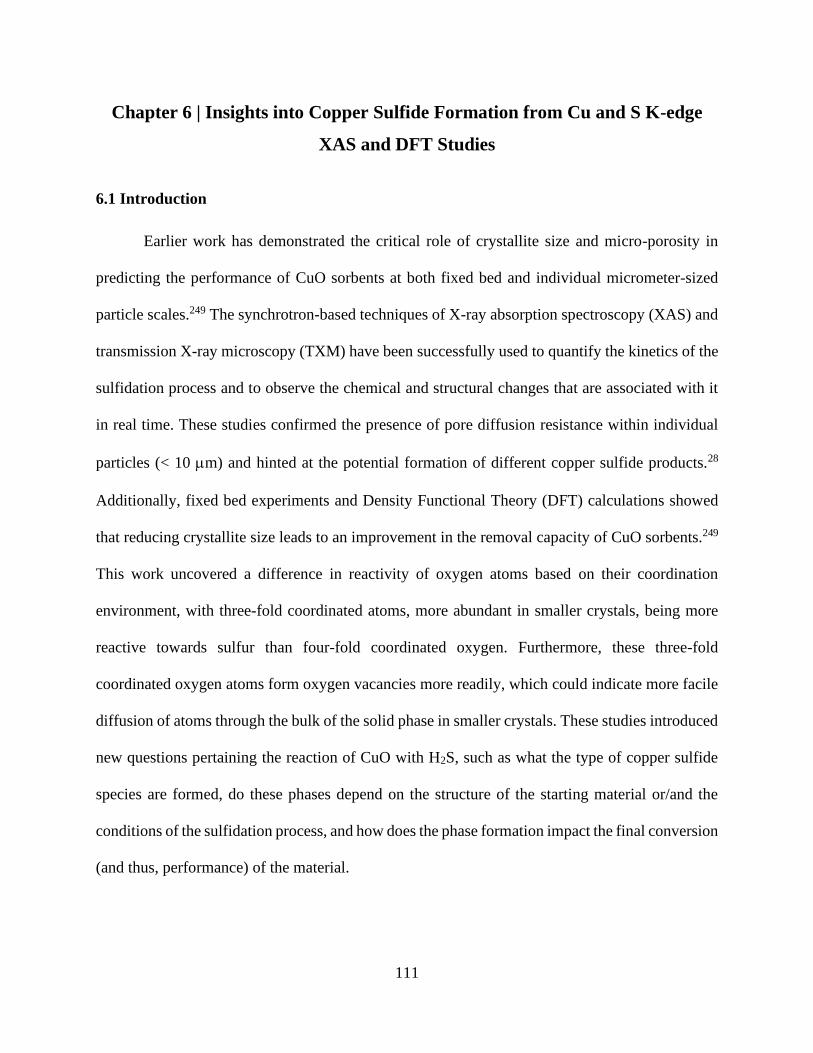
111
Chapter 6 | Insights into Copper Sulfide Formation from Cu and S K-edge
XAS and DFT Studies
6.1 Introduction
Earlier work has demonstrated the critical role of crystallite size and micro-porosity in
predicting the performance of CuO sorbents at both fixed bed and individual micrometer-sized
particle scales.249 The synchrotron-based techniques of X-ray absorption spectroscopy (XAS) and
transmission X-ray microscopy (TXM) have been successfully used to quantify the kinetics of the
sulfidation process and to observe the chemical and structural changes that are associated with it
in real time. These studies confirmed the presence of pore diffusion resistance within individual
particles (< 10 m) and hinted at the potential formation of different copper sulfide products.28
Additionally, fixed bed experiments and Density Functional Theory (DFT) calculations showed
that reducing crystallite size leads to an improvement in the removal capacity of CuO sorbents.249
This work uncovered a difference in reactivity of oxygen atoms based on their coordination
environment, with three-fold coordinated atoms, more abundant in smaller crystals, being more
reactive towards sulfur than four-fold coordinated oxygen. Furthermore, these three-fold
coordinated oxygen atoms form oxygen vacancies more readily, which could indicate more facile
diffusion of atoms through the bulk of the solid phase in smaller crystals. These studies introduced
new questions pertaining the reaction of CuO with H2S, such as what the type of copper sulfide
species are formed, do these phases depend on the structure of the starting material or/and the
conditions of the sulfidation process, and how does the phase formation impact the final conversion
(and thus, performance) of the material.

112
The conventional stoichiometry used for the CuO sulfidation reaction assumes the
formation of covellite (CuS), however, new emerging evidence has challenged this long-held
belief of the formation of a single product species/phase.28 Indeed, copper sulfide systems are
highly complex, featuring a range of species with Cu2-xS stoichiometries (0 ≤ x ≤ 1), diverse crystal
phases, and varying bonding arrangements and electronic structures (see Figure 6-9).250–252 The
crystallographic characterization of these intermediate Cu2-xS species (between Cu2S and CuS) is
difficult due to the ill-defined positions of the copper atoms within the close-packed sublattice of
S atoms. Despite their simple chemical formulae, the two end members (i.e., x = 0 or 1) of the Cu2-
xS family, Cu2S (chalcocite) and CuS (covellite), also have complex crystalline structures.
Covellite features a hexagonal crystalline structure, with two thirds of the Cu atoms in tetrahedral
coordination and the other third has a trigonal planar symmetry; the oxidation states of Cu in these
centers are +1 and +2, respectively. On the other hand, one-third of S atoms are monosulfides (S2-
) in trigonal bi-pyramidal coordination, and two thirds are in disulfide (S1--S-1) arrangement. These
atoms are arranged in alternating S2 and CuS3-CuS3 layers as shown in Figure 6-1. Chalcocite
(Cu2S) is known for its instability and its inclination to degrade to copper deficient species at
ambient conditions. The oxidation state of Cu in the 96-atom monoclinic unit of chalcocite is
mostly +1 with evidence of mobile Cu (0) centers.253 Successful elucidation of copper sulfide
species that form (and evolve) during reactions between CuO and H2S will fill a gap in the efforts
towards fundamental understanding of this reaction, and the evident complexity of copper sulfides
calls for the use of advanced characterization techniques that can probe the oxidation states, local
geometry, bond lengths and coordination numbers of both Cu and S in order to achieve accurate
speciation.

113
Figure 6-1: A) Presents covellite251 molecular structure and a summary of symmetry, oxidation states, and
coordination for the different Cu and S centers. B) Illustrates covellite crystal packing. Both structures are
produced using Mercury 3.8 structural visualization application.254
XAS is a powerful technique that can provide valuable information in this regard, by both
ex-situ analysis of fresh and spent samples and in-situ study of the evolved species throughout the
course of the reaction.255,256 The extended X-ray absorption fine structure (EXAFS) can be used to
determine local structural information about the target atom, and the near-edge spectrum (XANES)
can provide information about the oxidation state of an atom and its coordination symmetry.255,256
Nevertheless, probing a heterogenous mixture of species, such as a partially sulfided CuO sample,
is a challenging task because of the numerous local environments of Cu within one phase (CuS)
and across the two phases (CuO and CuS). In this work, we probe the reaction of CuO with dilute
H2S gas streams (1000 ppm-vol in N2) using in-situ and ex-situ XAS at both the S K- and Cu K-
edges. We verify that in-situ XAS experiments accurately represent this reaction by comparison
with the capacities and kinetics from fixed bed absorption studies at the same conditions. These

114
experimental techniques (and the resulting data) are also used to probe the influence of CuO
crystallite sizes (across a range of 2 – 40 nm) and reaction temperature (298-383 K) on Cu2-xS
formation. The results of our work suggest the formation of a distorted CuS layer at the surface of
the CuO crystals, with disulfide groups of longer Cu-S bonds and higher delocalization of the
positive charge of Cu center into (S-1)2 at the initial stages of the reaction. Our findings also suggest
the dominance of these species at lower temperatures (298-323 K) compared to higher
temperatures (353-383 K) and where the CuS products more closely resemble pure covellite. DFT
calculations for the sulfidation of CuO (111) and (1̅11) surfaces also support our hypothesis of the
formation and dominance of disulfides at the initial stages of CuO sulfidation.
6.2 Experimental Methods
6.2.1 Materials and synthesis methods
A commercial CuO-based sorbent (HiFUEL W230; denoted as CuO-1) was purchased
from Alfa Aesar and tested without subsequent treatment. This sorbent is composed of 63.5 wt%
CuO, 25 wt% ZnO, and 10 wt% Al2O3. For the synthesis of all other CuO sorbents, copper (II)
nitrate trihydrate (Sigma Aldrich, 99%), copper (II) acetate monohydrate (Sigma Aldrich, 99%),
sodium hydroxide (BDH, 97%) and glacial acetic acid (VWR, ACS grade) were used in the
preparation.
CuO nanoparticles (denoted as CuO-2 and CuO-3) were prepared using an acid-catalyzed
sol-gel process.210 For CuO-2, 1.0 cm3 of glacial acetic acid was added to 300 cm3 of 0.02 M
copper (II) acetate solution under vigorous stirring and heating. Upon boiling, 0.8 g of sodium
hydroxide was added to the solution under continuous stirring. The solution was then allowed to
cool to room temperature while a black solid continuously precipitated out of solution. The solid

115
precipitate was recovered via centrifugation of the solution for 10 minutes (JA-14 rotor) at 293 K
and 6000 RPM followed by decanting the supernatant liquid. The precipitate was then washed
with deionized water and ethanol. The washed precipitate was dried in a furnace for 8 h at 313 K.
Sample CuO-3 was prepared by additional thermal treatment of sample CuO-2 in air at 623 K for
4 hours to achieve larger crystallite size (as evidenced by X-ray diffraction patterns). Additional
CuO nanoparticles (denoted as CuO-4) were prepared by a drop-wise addition of aqueous 0.1 M
sodium hydroxide solution to aqueous 0.1 M copper (II) nitrate trihydrate solution under
continuous mixing. The obtained material, copper (II) hydroxide, was then vacuum filtered and
washed with distilled water and ethanol, dried in air at 353 K for 14 h, and then thermally treated
in air at 773 K for 4 h at a ramping rate of 1 K h-1.
CuO nanofibers (denoted as CuO-5) were synthesized through electrospinning. Polymer
solutions were prepared by dissolving 1.30 g of PVP M.W. 1,300,000 in ethanol solvent (23 cm3).
The polymer solution was then vortexed (Fisher Scientific Digital Vortex Mixer) at 3000 rpm for
1 h until the polymer was completely dissolved. The solution was left to settle for 10 minutes,
transferred to a beaker, and stirred for 0.5 h. The metal containing solution was prepared by
dissolving copper (II) nitrate (1.3 g) in 10 cm3 of DI water and stirring the solution for 0.5 h. The
copper containing solution was then added dropwise to the polymer containing solution. The
solution was stirred for 0.25 h, and then vortexed for 0.5 h at 3000 rpm. The electrospinning
solution was placed in a 10 mL syringe (BD 10 mL syringe with Luer LokTM tip) with a
hypodermic needle (MonojectTM Standard 30G x ¾”). The distance between the tip of the needle
and a stainless-steel collecting plate, which was covered with aluminum foil, was 22 inches. A
Gamma High Voltage Research ES75 power supply was used to apply 30 kV on the polymer jet
while the polymer solution was extruded through the needle at a rate controlled by a syringe pump

116
(1.0 cm3 h-1; Kent Scientific Genie Plus). Dry air was circulated inside a 3 m3 chamber at 6 cm3
min-1 to control the relative humidity at 19.5 ± 2%. The collected fibers were thermally treated in
air at 823 K for 4 h at a ramping rate of 2.0 K min-1 to remove the majority of PVP and form CuO.
6.2.2 Non-synchrotron characterization techniques
All CuO sorbents were characterized using a variety oftechniques. Powder X-ray
diffraction patterns were obtained on an X-ray diffractometer (JEOL JDX-3530 and Philips X-
Pert) using Cu Kα radiation of 1.5410 Å wavelength and used to identify the crystalline copper-
containing phases. The average crystallite size of each sample was determined using Scherrer’s
formula. Nitrogen adsorption-desorption isotherms were measured at 77 K with a Micrometrics
ASAP 2020 Plus system. Before measurements, the samples were degassed at 1 × 10⁻³ Torr and
573 K. The Brunauer-Emmett-Teller (BET) surface areas were calculated from the isotherms. The
pore size distribution was derived from the adsorption branches of the isotherms using the Barrett-
Joyner-Halenda (BJH) model. Scanning electron microscopy (NOVA 230 Nano SEM) was used
to visualize the morphology of the materials. The diameters of the agglomerate sizes of the sorbents
were measured from the SEM images using ImageJ software.
6.2.3 Fixed bed sulfidation tests
Fixed-bed sorption breakthrough experiments were carried out in the apparatus outlined in
Figure 3-2. A tubular stainless-steel reactor with 0.25-inch outer diameter was packed with 100-
180 mg of sorbents with average agglomerate sizes of 75 µm (i.e., particles sieved through +200-
100 mesh screens). The packed beds were 1.5 cm in height and were fixed between two plugs of
quartz wool. The temperature of the reactor (298-383 K) was regulated using a resistively heated
jacket with a PID temperature controller (TEMPCO EPC-100). Reactant feed streams consisted of

117
1000 ppm-vol H2S in N2 and were produced by diluting 1.0% H2S/N2 (Praxair) in UHP N2. The
total inlet flowrate of 90 cm3(STP) min-1 was controlled using MKS GE50A and GM50A flow
controllers. Online gas chromatography (Agilent 7890B) with a sulfur chemiluminescence
detector (SCD; Agilent 755) was used to measure the concentration of H2S in inlet and outlet
streams. The interior of the reactor and all the gas transfer lines were treated by an inert coating
(SilcoNert 2000) to mitigate adsorption of sulfur onto the walls of the apparatus tubing.
6.2.4 XAS acquisition and analysis
S K- and Cu K-edge X-ray absorption spectra were recorded at Stanford Synchrotron
Radiation Lightsource (SSRL, California, USA) at wiggler beamline 4-3 using a Si (111) double-
crystal monochromator. The storage ring was operated at 3 GeV with a ring current of 494-500
mA in top-up mode. The beam cross-section was 1 mm x 3 mm. X-ray absorption near-edge
structure (XANES) spectra were recorded at the S K-edge (2472.0 eV) in fluorescence mode using
a 7-element silicon-drift detector (Canberra). Energy calibration was achieved using sodium
thiosulfate (Na2S2O3.5H2O) where the first peak of the spectrum was fixed at 2472.0 eV. Full
extended X-ray absorption fine structure (EXAFS) spectra were recorded at the Cu K-edge (8979.0
eV) in transmission mode. A Cu foil, situated between two ionization chambers after the sample,
was scanned simultaneously for energy calibration purposes.
The XAS samples comprised a wafer (36 mg of CuO-based sample mixed with 14 mg of
boron nitride (BN) (Sigma Aldrich)) for the S K-edge, and 2.4 mg of sample diluted with 47.6 mg
BN for the Cu K-edge. The wafer was placed at 45° to the incident beam on a heated stage inside
a 100 cm3 cell, as described previously and as shown in Figure 6-2.257

118
For in-situ XAS sulfidation experiments, 1000 ppm H2S in Helium (Airgas) and Helium
(99.95%, Airgas) gases were used. XAS scans were initially taken under Helium flow, then the
temperature was ramped up to the desired set point (298, 323, 353, or 383 K) at a rate of 5 K min-
1 and under a 20 cm3(STP) min-1 flow of Helium. Once temperature stabilized, XAS scans were
taken again to obtain initial spectra at the reaction temperature. After collection of initial spectra,
a stream of 1000 ppm H2S/He was introduced into the reaction cell, and XAS scans were collected
continuously (every 6.25 minutes for Cu K-edge and every 5-11 minutes at S K-edge) until
saturation was reached. The cell was then purged with Helium at 20 cm3(STP) min-1 and allowed
to cool to room temperature before XAS scans of spent samples were obtained. For the S K-edge,
additional XAS scans were obtained for an inert BN sample under H2S gas flow, in order to allow
subtraction of the gas phase H2S signal contribution from the overall in-situ XANES scans.
Figure 6-2: Experimental setup for sulfidation of CuO-based samples at beamline 4-3 at the Stanford
Synchrotron Radiation Lightsource (SSRL)

119
XAS data were analysed using ATHENA and ARTEMIS from the Demeter package
software.241 The Cu K-edge EXAFS data was extracted from 3.0-11.3 Å-1 in k-space, and the
Fourier transformed data was analyzed in the range of 1.0-2.4 Å for partially sulfided materials
and 1.0-3.4 Å for fresh and reference materials. Experimental data were fitted with theoretical
back-scattering paths calculated using FEFF6, based upon CIF files from the Inorganic Crystal
Structure Database (ICSD).242 The fits were performed based on k1, k2, and k3 weighting. The
amplitude reduction factor, S02, was determined by fitting a reference copper foil, from each
beamline visit, with tabulated coordination numbers of bulk copper (fcc-Cu metal: ICSD
53247).242 This S02 value was 0.86, 0.91, and 0.96 for the three beamline visits at which the data
were collected.
Intensity and phase of scattering paths of the oxide materials were calculated using FEFF6
based on crystallographic data from the tenorite CuO structure (ICSD 16025).242 To simplify the
models, only single scattering paths were included and the coordination numbers, N, were scaled
by a factor α. The term, α, was introduced in order to account for the size effect on the EXAFS
scattering path intensity. This term is a scaling factor for all the scattering paths associated with a
spectrum that is consistent across samples of a given crystallite size.
The intensity and phase of the scattering paths in the sulfided material were also calculated
using FEFF6 based on a modified CuS covellite CIF file (ICSD 32105).242 This modified structure
averages the two Cu centers (tetrahedral Cu1+, and trigonal planar Cu2+) sites in covellite. Figure
6-3 presents a stick plot of the averaged coordination numbers and distances for Cu in the modified
structure. For a reliable quantification of each of the phases, the fitting model of partially sulfided
materials was simplified to take into account only the most significant scattering paths. Because
the focus of the EXAFS investigation of these materials was the determination of the types of

120
sulfur species formed, only the first Cu-O and Cu-S shells were fit. In these fits, we assumed that
the unreacted CuO material was not significantly modified by the sulfidation reaction. This
allowed us to fix the Cu-O path length and associated mean squared displacement term (σ2) at the
values obtained for the starting material, while scaling the coordination number down from the
initial value by multiplying with the molar fraction of unreacted material, XCuO. The XCuO term is
defined as 1- XCuS where XCuS is the conversion determined by linear combination fitting of the
XANES region of sulfided samples. Thus, the CuO component of the final material has fixed
EXAFS parameters while the EXAFS parameters of the CuS portion were allowed to vary. These
parameters were Cu-S coordination number, N, scattering path length, R, and its associated mean
squared displacement term, σ2. In all of the fits, ΔE0 was allowed to vary.
Figure 6-3: Stick-plot representation of the radial distribution of atoms around Cu1+ and Cu2+ in CuS
(covellite) and averaged Cu center in the simplified CuS model used in EXAFS fitting of Cu K-edge spectra.

121
6.2.5 DFT computational study
First principles atomic simulations were conducted using density function theory (software
package VASP) with plane wave basis set, PAW pseudopotentials, and GGA XC functional PBE.
A Hubbard U correction of +7 eV was used to account for the strongly correlated d-electrons. This
value is found to most accurately reproduce experimental values for properties such as lattice
parameters.141 A 2x1 slab was used to model the CuO (111) and (1̅11) surfaces. The local minima
on the potential energy hypersurface were found using the conjugate gradient method. The
optimized structure of a proposed elementary step is used to calculate the change in free energy
using energy differences between connecting elementary steps under realistic conditions of room
temperature (298 K) and ambient pressure (1 atm).
6.3 Results and Discussion
6.3.1 Structural characterization of fresh CuO sorbents
Table 6-1 summarizes the key physical characteristics of the five samples, CuO-1 – CuO-
5. The diffraction patterns for all samples, Figure 6-4, show characteristic peaks of single-phase
monoclinic CuO. (XRD patterns of sulfided CuO are shown in Figure 6-10 and will be discussed
in subsequent sections.) The crystallite sizes of the CuO sorbents were determined using Scherrer’s
formula based on 2θ=38.8°, CuO (111), and are summarized in Table 6-1. The crystallite sizes
range from 2.8 nm for CuO-1 to 40 nm for the lab-synthesized nanofibrous sample (CuO-5). The
estimated d-spacing for the (200) plane for all samples (2.29-2.30 Å) match literature223 and
confirm the formation of pure monoclinic CuO. The results of N2-physiosorption experiments are
summarized in Table 6-1, and they reveal comparable surface areas (44.5 to 67.3 m2 g-1) and pore
volumes (0.079 to 0.181 cm3g-1) for all the samples except CuO-5. The notably low surface area

122
and void volume for the nanofiber sample is due to the electrospinning process which produces
samples that consist of fibrous networks (nanofibers with diameters between 160-600 nm) with
low meso-porosity, as shown in the SEM images in Figure 6-5. On the other hand, SEM images
of the lab-synthesized CuO nanoparticles and CuO-1 sample reveal highly textured micrometer-
sized particles consisting of finer agglomerates (<100 nm).
Table 6-1: Physiochemical properties of the CuO sorbents. [a]Based on XRD peak at 2θ=38.8°. [b]First shell
oxygen coordination number based on EXAFS fits of Cu K-edge (See Supporting Information). [c]BET
method. [d]BJH method. [e]Fixed bed experiments at 298 K with 90 cm3(STP) min-1 of 1000 vol-ppm H2S/N2
at 1 atm total pressure.
Sample
ID Morphology
Crystallite
size (nm)[a] N (Cu-O)[b] Surface area
(m2g-1)[c]
Void volume
(cm3g-1)[d]
Conversion
(%)[e]
CuO-1 Nanoparticles 2.8 3.0 ± 1.0 67.3 0.139 44
CuO-2 Nanoparticles 7.0 2.5 ± 1.1 59.1 0.079 28
CuO-3 Nanoparticles 11 3.2 ± 0.4 44.5 0.102 24
CuO-4 Nanoparticles 23 4.0 ± 0.6 58.8 0.181 14
CuO-5 Nanofibers 40 5.4 ± 0.5 7.23 0.006 3
Figure 6-4: X-ray diffraction patterns of CuO sorbents. Blue diamonds indicate characteristic CuO peaks.

123
Figure 6-5: SEM images of fresh CuO sorbents at 10,000 X magnification.
Figure 6-6 shows the Cu K-edge XANES spectra for the five CuO sorbents. The spectral
features for all samples agree qualitatively with a recent XAFS exploration of copper oxide
materials.258 The small pre-edge feature at 8979 eV results from a Cu 1s → 3d9 dipole forbidden
transition that is completely absent in compounds with the Cu+ oxidation state due to its fully
occupied d shell. This suggests a 2+ oxidation state of Cu in these samples, which is consistent
with the electronic structure of Cu in CuO. Moreover, the best-fit model of the Cu K-edge EXAFS
data for all the samples, contain only scattering paths matching monoclinic CuO (see Table E-1)
for a summary of best fit parameters the fresh materials. The spectra and fits are displayed in
Figures E1- E-5.

124
Figure 6-6: Normalized Cu K-edge XANES spectra for CuO sorbents of different average crystallite
sizes: CuO-1 (2.8 nm), CuO-2 (7nm), CuO-3 (11 nm), CuO-4 (23 nm) and CuO-5 (40 nm).
The change in the height of white line in the XANES is consistent with literature, where,
in the absence of any chemical change to the material, the height of the white line correlates
positively with crystallite size of transition metal oxide systems such as CuO.259 This amplitude
change is also accompanied by a change in the magnitude of the oscillations found in the post edge
region of the spectra, i.e. the EXAFS signal. As a result of this change in magnitude, the
coordination numbers of each of the constituent scattering paths derived from fitting the EXAFS
signal also change. Table 6-1 summarizes the coordination numbers of the first shell Cu-O single
scattering path as determined by the best-fit model for Cu K-edge EXAFS of the samples. The
model-estimated coordination number decreased as crystallite size decreased, with the lowest
estimate of 2.5 ± 1.1 in CuO-2 (7 nm) as compared to 5.4 ± 0.5 in CuO-5 (40 nm). Estimating the

125
coordination numbers in fresh samples proved to be essential for fitting the partially sulfided
materials. The Cu-S paths were fit to characterize the formed sulfides, while the Cu-O path lengths
were fixed to their fresh materials’ counterparts, with the necessary conversion adjustment (See
section 6.2.4).
6.3.2 Determination of sorption capacities and kinetics from various techniques
Fixed bed sorption and in-situ XAS experiments at Cu and S K-edges were performed to
study the sulfidation kinetics of the sample that exhibited the highest conversion, CuO-1, at
different temperatures (323 K, 353 K, and 383 K). The effect of crystallite size has been explored
in earlier work showing that a decrease in size leads to an increase in the removal capacity and a
decrease in the sorption rate parameter.249 It was demonstrated that the lower sorption rates in
smaller crystals leads to extended kinetic regimes allowing for higher conversion.28 These previous
studies also demonstrated that the average kinetics and capacities determined from a small number
of particles using synchrotron-based techniques (i.e., 1 mm x 3 mm beam window for in-situ bulk
XAS and 10-20 m diameter particles for transmission X-ray microscopy28) are similar to those
deduced from the breakthrough curves of a 0.3 mL fixed beds. In this work, we focused on the
effect of temperature on kinetics and conversion to further study the relationship between
determining capacities and kinetics using various techniques (i.e., fixed beds and in-situ XAS at
the Cu and S K-edges).
The fixed bed sorption experiments yielded H2S concentration breakthrough curves (as
shown in Figure 6-7) from which the sorption capacities and linear driving force rate parameters
can be estimated. A linear driving force model that is zero order in H2S concentration (Equation
4) describes the breakthrough curves at 323 K,182 however, at 353 and 383 K, a model that is first

126
order in H2S concentration (Equation 2) describes the curves.184 The values of rate parameter and
conversion of CuO are summarized in Table 6-2. The results show a consistent increase in
conversion with an increase in temperature, with complete conversion achieved at 383 K.
Moreover, the sorption rate parameter increased following an Arrhenius law relationship with an
apparent activation energy of 23.5 kJ mol-1. In our previous study,260 we demonstrated that bulk
mass transfer and macropore diffusion are negligible for pellet sizes of ~75 µm and flowrates of
90 cm3(STP) min-1. Under these conditions, reaction rate parameters account for reaction-diffusion
phenomena in particles with less than ~10 m diameters (as identified by Transmission X-ray
Microscopy).260 Thus, temperature effects on both reaction and diffusion are likely reflected in this
measured activation energy, however, determining the rate of growth of the product layers is
required to quantify the relative contributions of diffusion and reaction to the sorption rate, a task
that is beyond the scope of the experiments presented herein. Nonetheless, the rate parameters and
activation energy can be useful for semi-quantitative comparison with in-situ XAS results.
Figure 6-7: Breakthrough curves of normalized effluent H2S concentration collected for fixed beds of the
CuO-based sorbent at 1000 ppm-vol H2S/N and 1.0 atm for temperatures of 323 K, 353 K, and 383 K. Solid
0
0.2
0.4
0.6
0.8
1
0 10 20 30 40 50 60 70
C/C
0
g H2S/100 g CuO
323 K
353 K
383 K

127
black lines represent fitted linear driving force models (Cooper model182 for 294 and 323 K and Bohart-
Adams184 model for 353 K).
Table 6-2: Summary of conversion and kinetic and diffusivity parameters deduced from RPM model for
in-situ S K-edge and Cu K-edge tests and, Cooper model for fixed bed tests. Conversion data were obtained
through linear combination fitting for the XANES region using CuO and CuS references for Cu K-edge
tests and using the edge step of fully converted 383 K test as a reference for S K-edge runs. All runs are
carried at ambient pressure and a feed concentration of 1000 ppm-vol H2S.
T (K) XAS Cu K-edge XAS S K-edge Fixed bed
(%) k x 103
(cm4 mol-1 s-1) D x 1012
(cm2 s-1) (%)
k x 103
(cm4 mol-1 s-1) D x 1012
(cm2 s-1) (%) k (s-1)
323 45 1.3 ± 0.2 4.9 ± 0.7 45 6.0 ± 1.4 4.9 ± 0.3 54 17 ± 2.3
353 89 4.6 ± 1.5 23 ± 4.1 78 41 ± 6.0 29 ± 3.8 88 35 ± 3.9
383 100 45 ± 9.2 50 ± 9.7 100 93 ± 17 31 ± 3.5 100 68 ± 5.9
Ea (kJ mol-1) 60.6 40.2 47.3 32.0 23.5
These in-situ XAS experiments were performed for the same sample (CuO-1) and
conditions (1000 ppm-vol H2S/He at 323, 353 and 383 K) as the fixed bed experiments. At the Cu
K-edge, linear combination fitting (LCF) was used to determine the CuO/CuS ratio at every scan-
time point, where the spectra of CuS and fresh CuO-1 were used as fitting references. At S K-edge,
the edge steps of the spectra were correlated to the extent of conversion, where the saturation edge
step for 383 K (complete conversion) was used as a scaling factor. The contribution of H2S gas
was subtracted from spectra for accurate CuS quantification. Figure 6-8 presents the conversion
curves for these runs, which were analyzed using the random pore model (RPM).174 Similar to the
fixed bed experiments, conversion increased with temperature, and complete conversion was
achieved at 383 K. Conversion estimates based on Cu and S K-edge XAS data were similar to
conversions measured from fixed beds after similar time of exposure to H2S on stream (Table 6-2).
The rate parameters and effective diffusivities determined from Cu and S K-edge
experiments are summarized in Table 6-2. The 95% confidence intervals for the rate parameters
are larger (>20% of the parameter value) than those for the diffusivities (less than 10% of the

128
parameter value), which results from shorter kinetic regimes (i.e., few data points) compared to
diffusion-controlled regimes. Comparisons of the effective diffusivity values are within the same
order of magnitude for both edges, and the activation energies determined from the two
experiments conducted at the two edges are within 25% agreement (and less than a factor of 2
larger than the activation energy determined from the fixed bed studies). Thus, we conclude
(similar to our previous work) that the kinetic information derived from our in-situ XAS
experiments is representative of the kinetics derived from analysis of fixed bed breakthrough
curves and is suitable for interpretation of the phenomena that occurs during reaction H2S sorption.
Figure 6-8: Conversion of CuO to CuS as a function of time as determined by the LCF of bulk XAS
experiments at Cu K-edge and S K-edge. The experiments were conducted at 323, 353, and 383 K for CuO-
1 sample under a flow of 1000 ppm H2S/He at 1 atm.

129
6.3.3 Speciation of sulfidation products
The conversion of CuO to CuS is incomplete for all of the sorbents at 1000 ppm-vol H2S
and 298 K (see Table 6-1). The conversion ranges from a high of 44% for CuO-1 to a low of 3%
for CuO-5. This makes the speciation of the sulfidation products somewhat challenging as there is
a mixture of species present. However, using a combination of S K-edge XANES, Cu K-edge
XANES and EXAFS, and XRD on these spent samples, it is possible to identify the sulfide copper
species that are formed. These experiments focused on exploring the effect of crystallite size of
the CuO starting material and the effect of temperature on the formed copper sulfide species.
Figure 6-10 presents the XRD patterns of the five CuO sorbents after reaction in fixed bed
experiments at 1000 ppm-vol H2S 298 K, and 1 atm. For all samples, a peak at 2θ = 48° is observed
in the pattern of the spent samples, which corresponds to the (110) plane of hexagonal copper (II)
sulfide (ICSD 16025). Nevertheless, the low conversion (3-28% as summarized in Table 6-1)
along with the overlap of XRD patterns of most sulfides (Figure 6-9) suggests that XRD alone is
insufficient in determining the speciation of the formed sulfides. Furthermore, Figure 6-11 shows
the XRD patterns of spent CuO-1 samples following sulfidation at 323 K, 353 K and 383 K. The
patterns show significant broadening of the monoclinic CuO peaks and a consistent increase in the
intensity of the 2θ = 48° peak with temperature increase. This is consistent with the increase in
conversion with temperature observed in the fixed bed experiments (54-100% for 323-383 K). We
note that the conversion of CuO-1 at 383 K is 100% (see Table 6-2 and discussion in Section 3.2).
While the XRD results for both sets of samples suggest the formation of CuS (covellite), they are
insufficient to conclusively identify the specifications of the CuS phase and whether any
distortions are present.

130
Figure 6-9: Crystal structures, compositions, oxidation states of Cu and S, and X-ray diffraction patterns for low-chalcocite, high-chalcocite,
Djurleite,261 Anilite,262 Geerite,263 Roxbyite,264 and Covellite.251 Red spheres represent Cu while yellow spheres represent S. The structures are
produced using Mercury 3.8 structural visualization application.254

131
Figure 6-10: X-ray diffraction patterns of spent CuO sorbents. The sulfidation tests are run at 298 K
and 1 atm with 1000 ppm-vol H2S/N2. Red rectangles identify characteristic covellite peaks.
Figure 6-11: Diffraction patterns of fresh CuO-1 sorbent and spent samples for runs at 323, 353, and
383 K (using 1000 ppm-vol H2S/N2 and 90 cm3(STP) min-1). The XRD of spent samples are collected
at 298 K and 1 atm after sulfidation at elevated temperatures. Blue diamonds correspond to characteristic
CuO peaks and red triangles correspond to characteristic CuS peaks.

132
Since different Cu2-xS structures have different electronic and coordination
environments of the S and Cu atoms, XANES provides insight into the type of species that is
formed. Figure 6-12 shows the S K-edge XANES of the spent CuO-1 sample at 323 K, 353 K
and 383 K, and CuO-2 and CuO-3 spent at 298 K. Three main observations can be made from
this figure: (1) The white line amplitude (peak a) decreases with a decrease in crystallite size,
(2) the white line is shifted to lower energy for spent samples at elevated temperatures (353 K
and 383 K), and (3) a small pre-edge peak (peak b) is present only at elevated temperatures
(353 K and 383 K). The first observation aligns with the discussion of the relationship between
crystallite size and white line intensity in the fresh Cu K-edge XANES. The two other
observations provide an evidence for the formation of different Cu2-xS species at elevated
temperature.
Figure 6-12: Normalized S K-edge XANES spectra for samples CuO-2 and CuO-3 after reaction at 298
K and CuO-1 after reaction at 323, 353, and 383 K (1000 ppm-vol H2S/He, 298 K and 1 atm). The scans

133
were collected under flowing He. Experimental conversion of each sample is indicated in the figure
legend.
In the S K-edge XANES of the reference covellite (CuS, Figure 6-13), there are two
characteristic pre-edge features, denoted as (b) and (c). These features have previously been
assigned to a S2- 1s → Cu2+ 3d9 transition (2469.9 eV) and a S22- 1s → Cu2+ 3d9 transition
(2470.7 eV).253 It is apparent from the spectra shown in Figure 6-13 that in the spent CuO-1
samples at 383 K, both pre-edge peaks are present, but the second peak (b) is absent in the
spectra collected on the spent sample at 323 K. (The conversion of CuO-1 at 383 K is 100%,
Table 6-2). This difference is further highlighted by the second derivative plots of these spectra
(inset of Figure 6-13). The white line (peak a) is assigned to a S22- 1s → 3p transition,253
confirming the presence of S22- in all spent samples. Thus, rather than indicating the absence of
disulfide ions, the absence of peak (b) in spent samples at low temperatures (298 and 353 K)
indicates that the geometry of the S22- in these samples differs from that of S2
2- in bulk covellite
(CuS). The pre-edge feature (peak b) is dipole forbidden and quadrupole allowed, and thus, it
is present as a weak transition. When this feature is additionally forbidden by symmetry or spin
inversion selection rules, it will be so weak that it will no longer be distinguishable from the
background. Thus, the transition S22- 1s → Cu2+ 3d9 must also be forbidden by symmetry
selection rules for the CuO-1 samples after reaction at 298 and 353 K.

134
Figure 6-13: Normalized S K-edge XANES spectra for CuO-1 spent at 323 K and 383 K, and two
copper sulfide references (CuS and Cu2S). The spectra are offset for clarity. The inset shows the second
derivative spectra of the spent samples highlighting the absence of peak b (S22- 1s → Cu2+ 3d9) in the
sulfided sample at 323 K.
To further explore whether the blue shift (shift to higher energy) of white line is
characteristic only of spent samples at lower temperatures, in-situ S K-edge XANES spectra of
CuO-1 sulfidation at elevated temperatures (353 K and 383 K) are inspected. Interestingly, the
CuS species formed in the beginning of the sulfidation process at elevated temperatures matches
those in spent samples at low temperatures (See Figure 6-14 for 353 K and Figure 6-15 for 383
K).253 Figure 6-14 shows the move towards a dampened white line at lower energy, and the
emergence of peak b as the reaction progresses at 353 K. Similar behavior is observed at 383
K (Figure 6-15) where the early spectrum, at low conversion, does not show the presence of
peak b. This suggests that the formation of this distorted CuS is independent of temperature and

135
its presence is primarily dependent on the total conversion of CuO to CuS. Thus, because the
sulfidation begins at interfaces (both the solid-gas interface and crystallite interfaces in the
bulk), we suggest that it is at these interfaces that a geometrically distorted CuS structure is
formed. As conversion proceeds, the intensity of peak b at 2470.7 eV (associated with the
spectral features of bulk covellite) also increases, indicating the formation of bulk CuS away
from the reaction interfaces.
Figure 6-14: Normalized in-situ S K-edge XANES spectra for sample CuO-1 during sulfidation at 353
K, 1000 ppm-vol H2S/He and 1 atm.
Concurrent with the growth of peak b, is the red shift (lower energy) of the white line
observed at the latter stages of the sulfidation process at elevated temperatures. This peak is
associated with a S22- 1s → 3p transition253 and it results from the hole character in the S2
2- 3p
orbitals due to the delocalization of these orbitals onto the electron deficient metal center. The

136
more electron-deficient metal centers are, the easier it will mix with the 3p orbitals of S22-. Thus,
small shifts in the energy of this peak can indicate the oxidation state of the metal center itself.253
In other words, the environment of S22- in spent samples at low temperatures is more
electropositive than that of S22- in bulk covellite. This further supports our theory of distorted
CuS structure at the interface of CuO. The higher energy contribution of this peak, in the
interfacial region, is because of the Cu2+ centers that are bonded to both O2- and S22- ligands.
These centers are more electron deficient than Cu+/Cu2+ centers in bulk covellite which are only
bound to S2- and S22-. It is these same S2-Cu-O centers which are responsible for the strained
geometry that causes the disappearance of the 2470.7 eV peak.

137
Figure 6-15: Selected normalized bulk in situ S K-edge XAS spectra of CuO-1 sulfidation with 1000
ppm H2S/He at a) 323 K and b) 383 K. The spectra highlight the change in the formed CuS species as
conversion increased.
6.3.4 Impact of CuS structure on reaction mechanism
Computational simulations using Density Functional Theory (DFT) on CuO surfaces
show that sulfur exhibits a tendency towards forming covalent bonds with itself. DFT studies
carried out by our group on CuO (111) and ( 1̅ 11) surfaces, which are the most stable

138
thermodynamic surface (surface free energies of 0.75 and 0.89 J/m2 respectively)141 and are
experimentally found in CuO materials,249 show that, upon dissociative adsorption of H2S
molecules on CuO surfaces, sulfur atoms progressively replace oxygen atoms. As the reaction
progresses and more H2S is adsorbed (thus releasing H2O), the sulfur coverage on the oxide
surface increases, at which point close sulfur atoms start interacting among them via covalent
bonding, which results in sulfur dimers appearing on the surface. Pathways on the CuO (1̅11)
surface show that elementary step structures that feature disulfide bond formation are more
favorable than equivalent counterparts without these bonds. This is exemplified in two
pathways, the first on a bare CuO (1̅11) surface where multiple H2S molecules participate in
the reaction and the second on a partially sulfide CuO (1̅11) surface where only one H2S
molecule is involved.
In the first case, disulfide bond formation stabilizes the structure of a step that requires
migration of the hydroxyl. This is an energetically costly process since the hydroxyl is displaced
from its equilibrium position on the lattice. However, with favorable sulfur-sulfur interaction,
what will require a +43 kJ/mol increase in energy is reduced by 44% to only +24 kJ/mol. A
snapshot of this improvement is shown in Figure 6-16, with the elementary step progression
plotted against the reaction free energy. Only the part of the reaction involving hydroxyl
migration is shown, with the case featuring disulfide formation in blue, and the case that does
not in black. The blue curve lies below the black, highlighting disulfide bond formation as a
favorable interaction that lowers the free energy of the system.

139
Figure 6-16: Part of the reaction pathway on a bare CuO (�̅�11) surface where multiple H2S molecules
participate in reaction, showing disulfide bond formation lowering the reaction free energy, rendering
disulfide bond formation as an improvement on reaction favorability.
In the second case on the partially sulfide CuO (1̅11) surface that simulates the surface
in later stages of the reaction, disulfide bond formation lowers the energy of the structure for
the elementary step involving the formation of a second hydroxyl and the subsequent hydroxyl
migration step. The stabilizing effect is less pronounced for the second hydroxyl formation step,
only by 2 kJ/mol, since it is already a greatly exothermic step. However, for the typically
endothermic hydroxyl migration step, the presence of disulfide bonds makes the otherwise
endothermic step exothermic, as seen in Figure 6-17, where the curve in blue (with disulfide
formation) slopes downwards from steps B to C instead of upwards as shown in black (without
disulfide formation). This corresponds to a change from +5 kJ/mol from steps to -4 kJ/mol from
steps B to C. Observation of disulfide bond formation in energy minimization calculations for

140
proposed elementary steps of reaction suggests that disulfide bond formation is favorable during
the reactive sorption of H2S on CuO. These results further support our claim of the dominant
presence of the disulfide ions on the surface of CuO crystallites which contributes significantly
to the XANES signal at lower conversions.
Figure 6-17: of the reaction pathway on a partially sulfided CuO (�̅�11) surface where one H2S molecules
participate in reaction, showing presence of disulfide bond formation making equivalent elementary step
exothermic instead of endothermic (from step B to C).
Finally, XANES spectra taken at the Cu K-edge of the spent samples (Figure 6-18A)
show that as temperature of sulfidation increases from 323 K to 383 K, the features of the CuO
starting material, most notably the intense white line at 8998 eV, fade while the features of the
covellite form of CuS grow in. Using tenorite (CuO) and covellite (CuS) standards as the basis
set, linear combination analysis was performed to determine the degree of sulfidation in these
materials. The results are shown in Table 6-2, showing a clear increase in total conversion of
CuO to CuS as a function of temperature, with 100% conversion at 383 K. In all spectra, there

141
is a peak around 8978-8979 eV (highlighted by first derivative plot in Figure 6-18B). This peak
is only present in compounds containing Cu2+ and is absent in the Cu2S standard (yellow trace),
as it results from a Cu2+ 1s → 3d9 transition.253 Because this peak is forbidden by dipole
selection rules, it is much weaker in systems with centrosymmetric ligands (as is the case of
CuO) due to decreased p/d orbital hybridization. However, the presence of this peak in spent
samples agrees with previous studies of CuS in the covellite structure.10 Further evidence that
Cu2+ is present in spent samples can be readily seen when comparing the first derivative of the
XANES region (Figure 6-18B) for these materials. The sample sulfided at 323 K shows a weak
pre-edge feature at 8979 eV, both because the material only contains 40% CuS, and because
much of the CuS that forms is in a strained geometry. However, the strong single peak at 8980
eV from the Cu2S standard is completely absent in the 323 K spent sample, indicating the lack
of the formation of a Cu+-S-2 species in this reaction.
142
Figure 6-18: A) Normalized Cu K-edge XANES spectra for fresh CuO-1 sample, spent CuO-1 samples
at 323, 353, and 383 K (1000 ppm-vol H2S/He), and two copper sulfide references (CuS and Cu2S). B)
First derivative spectra of A) highlighting the pre-edge feature associated with Cu2+ 1s → 3d9 transition.
Spectra offset for clarity.

143
Furthermore, the structure of the spent CuO species were analyzed by fitting of the
EXAFS region of the Cu K-edge (Table E-2). By fixing the Cu-O contributions to the spectra
and fitting the Cu-S scattering paths, it can be seen that covellite is a good fit for the spent
material at higher conversions (353 and 383 K). At lower conversion, the Cu-S bond distance
is appreciably longer (2.30 ± 0.02 Å at 323 K versus 2.26 ± 0.01 Å in covellite reference and
sample spent at 383 K). In complement to the results at the S K-edge, this indicates that while
the Cu is in a similar oxidation state to that in covellite at lower conversions, a strained geometry
is generated by the initial sulfidation of the material. Finally, the coordination numbers of the
Cu-S paths, derived from EXAFS models in the spent samples, were consistent with the change
in conversion as temperature increased: 1.5 ± 0.5, 3.3 ± 0.1 and 3.4 ± 0.4 at 323 K, 353 K, and
383 K, respectively. These compare with 3.67 coordination in the averaged CuS model.
6.4 Conclusion
In conclusion, this study sheds light on the sulfidation mechanism of CuO sorbents
during the uptake of H2S. In particular, data are presented highlighting a unique structure at the
interfacial CuO-CuS area which, consequently, unravels mechanistic details of the sulfidation
process. S K-edge XANES showed evidence of S22-, characteristic of CuS, for all spent samples,
with a geometrically strained and more electropositive S22- form at lower conversions (Spent
samples at 298 K and 323 K and early in-situ sulfidation spectra of 353 K and 383 K). These
differences are because the initially formed disulfide groups are bonded to Cu2+ which are
bonded to O2- in bulk CuO, as compared to S22- in bulk covellite which are connected to
Cu+/Cu2+ that are bound to S2- and S22. The DFT simulations of CuO sulfidation paths (non-
sulfided and partially sulfided (111) and (1̅11) surfaces), suggest that the formation of disulfide
ion is, indeed, thermodynamically favorable in the initial sulfidation stages which aligns with

144
our findings from S K-edge XANES. Finally, the Cu K-edge EXAFS fits of the sulfided
samples show longer Cu-S scattering paths at lower conversions which, again, supports the
strained interfacial geometry theory.

145
Chapter 7 | Lanthanum Induced Weakening of Lattice Copper-Oxygen
Bonds Improves Hydrogen Sulfide Capacities of Copper Oxide Adsorbents
7.1 Introduction
The sorbents studied for reactive sorption of hydrogen sulfide (H2S) consist mostly of
the oxides, hydroxides, and carbonates of iron, zinc, and copper at 473-1073K.265–267 Elevated
process temperatures are used to mitigate the kinetic limitations encountered at low temperature
which result in low utilization factors.266,268 Among all studied sorbents, copper oxides (CuO
and Cu2O) are considered the most favorable sorbents for sulfur removal.269 A comprehensive
thermodynamic study of the copper-sulfur-oxygen system270 show high equilibrium constants
(e.g. Ks = 6.3 x 10¹⁷ for CuO sulfidation at 900K) which result in a decrease in H2S
concentration from several thousand ppm to the sub-ppm level. Nevertheless, CuO has low
resistance to reduction to metallic copper (Cu) at high temperatures, which agglomerates and
leads to structural degradation and poor kinetics.133 Thus, CuO is often mixed with other metals
or supported on inert matrices. The mixing of metals stabilizes Cu2+ and Cu1+ against reduction
to Cu, which results in new compounds of superior sulfur removal capacities.129 An example of
this is the mixing and supporting of CuO and ZnO on SBA-15 zeolites using wetness
impregnation which achieves an 87% oxide conversion at 423K.271
However, unlike high-temperature desulfurization studies there is limited work done on
the removal of H2S by metal oxides at low temperature.272–274 Xue et al. investigated a series of
pure metal oxides and mixed metal oxides (CuO, ZnO, NiO, CaO, SnO, Mn3O4, Zn-Mn-O, Zn-
Co.O, Zn-Al-O, and Zn-Ti-Zr, which were prepared from various hydrous oxides and
hydroxycarbonates precursors) and found that several of these oxides had high H2S removal

146
capacity (10.0-28.0 g H2S g-1 sorbent) at room temperature.274 This suggests that the mixing
and doping of oxides is promising not only at elevated temperatures where it mitigates reduction
to elemental metals, but also at low temperatures.
A fundamental understanding of the CuO-H2S reactions, and the structural and chemical
changes incurred by introducing foreign atoms is necessary for optimal deployment of these
technologies. To probe these processes at the molecular scale, advanced characterization
techniques must be utilized in addition to bulk kinetic studies which, together, allow for relating
structural and chemical parameters to sorbents performance. In our previous work, the effects
of crystallite size and micro-porosity on the performance of chemically similar CuO sorbents
was thoroughly investigated. CuO demonstrated an increase in removal capacity with crystallite
size decrease with a maximum conversion of 44% for 2.8 nm crystallite size at room
temperature.28,249 The spatial and temporal evolution of reaction front within few millimeters-
sized CuO sorbent was probed through simultaneous X-ray absorption spectroscopy (XAS) and
transmission X-ray microscopy (TXM) which suggested the presence of pore diffusion
resistance at the micro scale.28
In this work, we study the effects of lanthanum (La) additives on CuO sorbents’
structural properties and sulfur removal performance through a combination of fixed bed kinetic
studies and advanced synchrotron-based characterization techniques. La was selected because
of its relatively large cationic radius (RLa/RCu = 1.5) compared to the more commonly studied
additives such as Zinc, Nickel and Cobalt (Rx/RCu = 1.0). This difference in cationic radii is
expected to introduce disruptions to the CuO lattice,275,276 which would cause the formation of
more vacancies that facilitate the diffusion of oxygen and sulfur atoms through solid phases.277
To explore the structural and chemical changes upon lanthanum addition, we collected XAS

147
for fresh and spent reference commercial CuO-based sorbent and two lab-synthesized La-CuO
sorbents (2:1 Cu to La ratio) prepared by different synthesis methods (sol-gel and co-
precipitation with ammonium). XAS scans were collected at S K-, Cu K-, and La L3-edges to
provide complimentary evidence of the chemical and structural differences between the
samples. In-situ XANES at S K-edge for the three samples at 1000 ppm H2S/He, 1 atm, and
323K, provided kinetic information that are consistent with fixed-bed reactor results.
Additionally, X-ray diffraction (XRD), N2-physiosorption measurements (BET), scanning
electron microscopy (SEM), transmission electron microscopy (TEM), and energy-dispersive
X-ray spectroscopy (EDS) were used to form a comprehensive chemical and structural analysis
of the samples.
7.2 Experimental Methods
7.2.1 Materials
The first La-CuO sample, denoted as CuO-La-1, was prepared using an acid-catalyzed
sol-gel process.210 1.0 cm3 of glacial acetic acid (VWR, ACS grade) was added to 300 cm3 of
0.133 M copper (II) nitrate (Sigma Aldrich, 99%) and 0.067 M lanthanum (III) nitrate
hexahydrate (Sigma Aldrich, 99%) under vigorous stirring and heating. At boiling point, 0.8 g
of sodium hydroxide was added to the solution with continuous stirring, creating a precipitate.
The supernatant was then poured off and the precipitate was washed with deionized water and
ethanol (Sigma-Aldrich, 100%). The washed precipitate was then dried in air for 24 hours at
333 K.
The second La-CuO, CuO-La-2, sample was synthesized via an aqueous ammonia co-
precipitation method.278 1 cm3 of ammonium hydroxide (Fisher Scientific, ACS Plus) was

148
added dropwise to 300 cm3 of aqueous 0.133 M copper (II) nitrate and 0.067 M lanthanum (III)
nitrate hexahydrate solution until a precipitate formed. The precipitate was then allowed to
settle, and the effluent was decanted. The sample was then washed and centrifuged twice, dried
in a drying oven (353 K) overnight, and thermally treated at 873 K for 2 hours, afterwards.
Finally, a commercially produced CuO-based material (HiFUEL W230; lot number
L04Y006; 63.5 wt% CuO, 25 wt% ZnO, and 10 wt% Al2O3) was purchased from Alfa Aesar.
This sample is denoted as CuO-1 and was used as a reference for comparison with other
lanthanum containing samples. Section 1.1 in the SI provides synthesis details for other pure
CuO and La-doped samples.
7.2.2 Fixed bed sulfidation tests
The fixed-bed sorption breakthrough experiments analyzed in this study were carried
out in the apparatus outlined in Figure 3-2. A tubular stainless-steel reactor with 0.25-inch outer
diameter was packed with 100-180 mg of sorbents of 75-125 µm agglomerate size. The packed
beds were 1.4-1.9 cm in height and were fixed between two plugs of quartz wool. The
temperature of the reactor was set to 323 K and was regulated using a resistively heated jacket
with a PID temperature controller (TEMPCO EPC-100). The inlet of the reactor consisted of
1000 ppm-vol H2S in N2 and was produced by diluting 1.0% H2S/N2 (Praxair) in UHP N2. The
total inlet flowrate of 90 sccm was controlled using MKS GE50A and GM50A flow controllers.
An online gas chromatography (Agilent 7890B) with a sulfur chemiluminescence detector
(SCD; Agilent 755) was used to measure the concentration of sulfur in inlet and outlet streams.
The interior of the reactor and all the gas transfer lines were treated by an inert coating
(SilcoNert 2000) which ensures that sulfur wouldn’t adsorb onto the walls.

149
7.2.3 Non-synchrotron characterization techniques
The synthesized La-CuO sorbents and the commercial CuO sorbent, as described in the
previous section, were characterized using a variety of techniques. Powder X-ray diffraction
patterns were obtained on an X-ray diffractometer (JEOL JDX-3530 and Philips X-Pert) using
Cu Kα radiation of 1.5410 Å to identify the CuO and La2O3 phases. The average crystallite
sizes were found using Scherrer’s formula. Nitrogen adsorption-desorption isotherms were
measured at 77 K with a Micrometrics ASAP 2020 Plus system. Before measurements, the
samples were degassed at 1 × 10⁻³ Torr and 573 K. The Brunauer-Emmett-Teller (BET) surface
areas were calculated from the isotherms by using the BET equation. The pore size distribution
was derived from the adsorption branches of the isotherms using the Barrett-Joyner-Halenda
(BJH) model.
Scanning electron microscopy (NOVA 230 Nano SEM) was used to determine the
morphology of the sorbents. The diameter of the sorbents was calculated from the SEM images
using ImageJ software. Two transmission electron microscopy (TEM) systems were used to
obtain scans for the samples that were dispersed on holey carbon grids. The first is a FEI Tecnai
G(2) F30 S-Twin operated at 300kV; and the second is a JEOL 2010F 200kV equipped with an
Oxford AZTEC 80 mm2 SDD energy dispersive spectroscopy (EDS) detector with an ultrathin
window. Basic STEM imaging was performed on the Tecnai F30, while selected area EDS was
performed on the JEOL 2010F. In this technique, the microscope was operated in TEM mode,
and the beam was condensed at higher spot sizes in order to limit the field of excitation to key
areas of interest. This technique was used in place of STEM-EDS mapping due to the beam
sensitivity of copper oxide materials. For this study, areas of interest were smaller clusters of
crystallites – typically on the order of 50-100 nm. Because some samples showed variability

150
even at this size regime, more high-resolution EDS mapping was considered unnecessary. EDS
spectra were collected at 8-10 spots in order to obtain an average value for each sample.
7.2.4 Synchrotron-based characterization
X-ray absorption spectra were recorded at Stanford Synchrotron Radiation Lightsource
(SSRL, California, USA) at wiggler beamline 4-3 using a Si(111) double-crystal
monochromator. The storage ring was operated at 3 GeV with a ring current of 494-500 mA in
fill-in mode. The beam cross-section was 1 mm x 3 mm. X-ray absorption near-edge structure
(XANES) spectra were recorded at the S K-edge (2472 eV) and La L3-edge (5483 eV) in
fluorescence mode using a 7-element silicon-drift detector (Canberra) and full extended X-ray
absorption fine structure (EXAFS) at the Cu K-edge (8979 eV) in transmission mode. Obtaining
XANES at multiple edges allows for unravelling the differences in the average chemical
environments of each of the three elements, and subsequently, understanding the differences in
sulfur removal performance between the sorbents. Collecting the EXAFS at the Cu K-edge
allows for quantifying the structural and coordination changes which were incurred by
introducing lanthanum to CuO sorbents. Finally, in-situ XAS experiments at S K-edge were
used to deduce bulk kinetic and diffusion parameters to complement the fixed-bed experiments.
The sample was a wafer consisting of 36 mg of CuO-based sample mixed with 14 mg
of boron nitride (BN) (Sigma Aldrich) for the S K-edge, and 2.4 mg of sample diluted with 47.6
mg BN for the Cu K-edge and La L3-edge. The wafer was placed at 45° to the incident beam
on a heated stage inside a 100 cm3 cell, as described previously and as shown in Figure 6-2.257
For in-situ XAS sulfidation experiments at S K-edge, 1000 ppm H2S in helium (Airgas)
and helium (99.95%, Airgas) gases were used. Initially, the temperature of the cell is ramped

151
up to 50 ᵒC at a ramp rate of 5 K·min-1 under a 20 sccm flow of helium. Once temperature
stabilized, helium flow was stopped and 1000 ppm H2S/He was introduced at 20 sccm and XAS
scans were collected every 9 minutes. The samples were exposed to 1000 ppm H2S/He flow for
4-6 hours until saturation was achieved. The cell was then purged by helium at 20 sccm and
allowed to cool to room temperature before XAS scans of spent samples were obtained.
XAS data were analysed using ATHENA and ARTEMIS from the Demeter package of
software.241 The EXAFS data was extracted from 3.0-13.0 Å-1 in k-space, and the Fourier
transformed data were analysed in the range of 1.0-3.2 Å. Intensity and phase of scattering paths
were calculated using FEFF6 based on crystallographic data from the Tenorite CuO structure
(ICSD 16025).242 EXAFS fitting was performed based on k, k2, and k3 weighting. S02 was
determined to be 0.73 for these samples based on fitting a reference copper foil with tabulated
coordination numbers (fcc-Cu metal: ICSD 53247).242
7.3 Results and Discussion
7.3.1 Effects of nominal La content and synthesis method on sorbents removal capacity
This work started by exploring the effects of the synthesis method and the amount of La
salt precursor on the La-CuO sorbents’ sulfidation performance. Pure CuO and La-CuO
sorbents were synthesized and tested for H2S removal using fixed bed experiments at 323 K, 1
atm and an inlet H2S concentration of approximately 1000 ppm-vol. The removal capacities,
qs, are defined as g H2S per 100 g of CuO phase in the sorbent, where 42 wt.% corresponds to
the stoichiometric conversion of CuO to CuS. Sulfidation tests for pure lanthanum oxide
(La2O3) at the same conditions were performed and yielded no pickup (<0.5 wt.%). Thus, CuO
was considered to be the only reactive phase in this work. Table 7-1 summarizes the synthesis

152
conditions, nominal La/Cu salts ratio in the synthesis precursors, crystallite size, removal
capacities, and conversion of CuO phase for all the tested samples.
Table 7-1: Summary of sulfidation tests results for fixed beds of CuO-based samples at 1000 ppm-vol
H2S/N, 323 K and 1.0 atm.
The results in Table 7-1 show that introducing La to the synthesis of CuO sorbents
resulted in an enhancement in the sorbent removal capacity at for most samples. Two of the
samples, CuO-La-1 and CuO-La-2 with 33% La content, achieved removal capacities of 26.9
wt.% and 35.8 wt.%, respectively. These results represent a 31% and 63% improvement in
removal capacity compared to pure CuO samples of comparable crystallite sizes (CuO-2 and
CuO-3 in Table 7-1). Comparing samples of similar crystallite size is important as previous
work have demonstrated that crystallite size is the most influential factor in determining
sorbents performance.275 Table 7-1 also shows that the La-CuO samples with La content of 1%
and 10% in the precursor salt didn’t achieve an improvement in sulfur removal performance.
Sample
ID La/Cu Salt
Ratio Synthesis
Method
Synthesis/
Processing
Conditions
Thermal
Treatment Crystallite
Size (nm)
qs
(wt%)
%
Conversion
CuO-1 Commercial - - - 2.8 24.9 ±
0.3 59.2
CuO-2 100% Cu
Sol-gel Synthesized at 373K
for 45 minutes
Dried at 333K for 24 hours 3.3 21.9 ± 0.2 52.2
CuO-3 100% Cu Dried at 333K for 24 hours
then treated at 473K for 8
hours
8.0 20.4 ± 0.3 48.7
CuO-La-3 1:99
Sol-gel Synthesized at 373K
for 45 minutes Dried at 333K for 24 hours
6.8 7.3 ± 0.1 17.4
CuO-La-4 1:9 8.0 13.0 ± 0.1 30.9
CuO-La-1 1:2 10.5 26.9 ± 0.4 63.9
CuO-La-2 1:2 Aq. ammonia Centrifuging Treated at 873K for 2
hours 4.3 35.8 ± 1.0 85.2
CuO-La-5 1:2 Co-
precipitation
Synthesized at 373K
for 45 minutes Dried at 333K for 24 hours 2.1 25.0 ± 0.5 59.5

153
This might be the result of the precipitation of La as a separate La2O3 phase instead of mixing
with the CuO phase for smaller amounts of La salt in synthesis precursor.279
The results in Table 7-1 also show that the sample prepared via precipitation with
aqueous ammonia, CuO-La-2, achieved the highest removal capacity compared to the other two
samples, CuO-La-1 and CuO-La-5, which are prepared via sol-gel and co-precipitation
methods, respectively, with the same amount of La in the salt precursor (33%). Namely, CuO-
La-2, with crystallite size of 4.3 nm achieved a removal capacity that is 43% higher than CuO-
La-5 (2.1 nm) and 33% higher than CuO-La-1 (10.5 nm). In our previous work for pure samples,
the synthesis method didn’t affect the performance of the sorbents as long as they had similar
crystallite size. The influence of the synthesis method in case of mixed samples is, then, a result
of the level of inclusion of La within CuO lattice instead of precipitating as a separate phase.
The addition of ammonia to the precipitation method controls the pH of the solution allowing
slower precipitation of both phases, CuO and La2O3, and thus a higher chance of mixing Cu-
La-O.278 Different characterization methods in the following sections support this claim.
To further explore the effects of introducing La to CuO sorbents, the two best
performing La-CuO samples, CuO-La-1 and CuO-La-2, were thoroughly characterized to
identify the chemical and structural drivers for this improvement. Data from our previous
characterization-kinetics studies on a CuO-based commercial sorbent (CuO-1)28,208 are used to
compare against the results for the La-CuO sorbents and to demonstrate the effects of La
addition on the molecular features of CuO.

154
7.3.2 Physio-Chemical properties of La-CuO sorbents identified via non-synchrotron-based
techniques
XRD was used to identify the crystalline phases and average CuO crystal sizes of CuO-
1, CuO-LaO-1, and La-Cu-2. The XRD patterns (Figure 7-1) of the fresh adsorbents show
diffraction peaks that are characteristic of the planes of a single-phase monoclinic CuO.280 The
average crystal sizes of the sorbents using Scherrer’s formula based on the 2=39° peak were
10.5 nm for CuO-La-1, 4.3 nm for CuO-La-2, and 2.8 for CuO-1. These crystallites fall within
the size range for measurable H2S capacity (<24 nm) as identified in our previous work.275
Peaks at 2=29° and 42° in the pattern for CuO-La-1 identify La2O3 and indicate that some of
the La precipitated as a separate La2O3 phase during the sol-gel synthesis. These peaks were
absent from the CuO-La-2 sample pattern, however, indicating that any La2O3 crystallites (if
present) are too small to diffract X-rays. Moreover, Figure 7-1 shows the XRD patterns of the
spent samples where peaks corresponding to both CuO and CuS were identified. The spent
patterns are more difficult to interpret since CuS and La2O3 have overlapping peaks. A
reduction in the intensity and size of the CuO peaks (and thus, crystallinity) was observed for
all spent samples due to the conversion of CuO to CuS which is associated with a volume
expansion (60%) that causes a disintegration of the crystals.

155
Figure 7-1: X-ray diffraction patterns of a commercial CuO sorbent (CuO-1), and two lanthanum-doped
sorbents prepared via sol-gel (CuO-La-1) and ammonia co-precipitation (CuO-La-2), before and after
reaction with 1000 ppm H2S/N2 at 323 K and 1 atm. CuS and La2O3 diffraction patterns are included as
references. Blue markers indicate characteristic CuO peaks, green markers indicate characteristic CuS
peaks, and red markers indicate La2O3 peaks.
N2-physisorption measurements were performed for the samples (CuO-1, CuO-La-1,
and CuO-La-2). Table 7-2 summarizes the structural parameters calculated from the
experiments. Both La-CuO sorbents had surface areas that were lower than the commercial
sorbent (23.44 m2 g-1 for CuO-La-1 and 10.84 m2 g-1 for CuO-La-2 compared to 63 m2 g-1 for
CuO-1). On the other hand, CuO-1 and CuO-La-1 exhibited comparable porosities (0.14 and
0.17 cm3g-1 respectively) while CuO-La-2 had a considerably lower porosity of 0.019 cm3g-1.
Thus, BET results confirm that surface area and porosity were not the determining factor for
the sorbents’ performance, as the sample with poorest porosity, CuO-La-2, achieved the highest
removal capacity and conversion (85%). This is consistent with our findings in a previous study

156
that concludes that favored textural properties (i.e., small agglomerates in SEM, and larger
surface areas and pore volumes) do not necessarily equate to improved performance when a
metal additive is present.281
Table 7-2: Physiochemical properties of the La-doped CuO sorbents relative to the commercial CuO-
based sorbent. [a] Based on XRD. [b] Based on BET. [c] Based on BJH method.
Sample ID Synthesis
Method
La molar %
(Bulk)
La wt. %
(TEM-EDS)
Crystallite
Size (nm)[a]
SBET
(m2g-1)[b]
Vpore
(cm3g-1)[c]
CuO-1 Commercial 0 - 2.8 63.00 0.14
CuO-La-1 Sol-gel 33 1.0 ± 1.4 10.5 23.44 0.17
CuO-La-2 Co-precipitation 33 3.3 ± 0.3 4.3 10.84 0.019
STEM and TEM images of the sol-gel, CuO-La-1, and ammonia co-precipitation, CuO-
La-2, samples are shown in Figure 7-2. In Figure 7-2d, the CuO-La-2 particles of 20-50 nm size
show uniform intensity across the width of each particle. An intensity line profile (Figure 7-2f)
along the yellow line in Figure 7-2d shows the plateau of intensity across a single particle in
the CuO-La-2 sample. Because STEM contrast is based primarily on atomic number, this
implies that samples made by the ammonia co-precipitation method show uniformity of La and
Cu distribution. In contrast, the La and Cu distribution in CuO-La-1 is less uniform as evidenced
by the uneven intensity of the sample at the same 10 nm length scale as the crystallite size
(Figure 7-2a). This rapidly varying intensity can be seen in the intensity line profile (Figure
7-2c) and gives the sample a textured appearance in STEM images. Additionally, the selected
area EDS results (Figure 7-3) show that in any given 100 nm area, La is 3.3 ± 0.3 wt. % for
CuO-La-2 sample, while CuO-La-1 averages at 1.0 ± 1.4 wt. %. The relatively low variation in
the EDS results of the CuO-La-2 sample is consistent with the even intensity of each particle

157
throughout the sample in the STEM images. On the other hand, the high variation in the CuO-
La-1 sample implies phase segregation which is consistent with XRD results.
Figure 7-2: STEM images of CuO-La-1 (a-b) and CuO-La-2 (d-e). The detector intensity profiles for
CuO-La-1 (c) and CuO-La-2 (f) are generated along the identified yellow lines in the STEM images.
The smooth and additive intensity of CuO-La-2 indicates even distribution of the La species, in
comparison with the blotchy appearance of Cu-O-La-1.

158
Figure 7-3: EDS spectra for selected 100 nm areas from STEM images of CuO-La-1 (a-c) and CuO-
La-2 (d-f).
In summary, non-synchrotron-based characterization showed that CuO-La-2, compared
to CuO-La-1, features smaller crystals and a more uniform distribution of La throughout the
CuO phase. It also showed that this synthesis method resulted in more incorporation of La in
the CuO phase, based on EDS, and smaller La2O3 crystals, based on XRD. These results suggest
that the improvement in sulfur uptake by CuO-La-2, compared to CuO-La-1, is due to an
increased Cu-O-La interfacial area which leads to a larger volume of disrupted CuO lattice that
in turn facilitates the swapping of oxygen for sulfur ligands during the sulfidation reaction.

159
7.3.3 Multi-edge XAS study of changes in chemical environment
In order to investigate the structural and chemical changes induced by La addition to
CuO sorbents, XAS experiments were performed at each of the Cu K, S K and La L3-edges.
For S and La-edges, XANES spectra were measured, while full EXAFS was measured for Cu
K-edge. Figure 7-4 shows the Cu K-edge XANES region of the fresh samples: CuO-1, CuO-
La-1, and CuO-La-2 which are qualitatively consistent with CuO XANES in previous
studies.208 The pre-edge feature at 8979 eV in all three samples arises from a Cu 1s2 to 3d9
dipole forbidden transition. This feature is indicative of Cu2+ species as there are no empty 3d
orbitals in the Cu+ species. The presence of Cu2+ species indicates, conclusively, that the spectra
is indeed dominated by CuO. Nevertheless, the La-CuO samples display a 1.5 eV blue shift,
and depression of white line peak, at 8997 eV, as compared to the CuO-1 spectra. This indicates
that the copper in the La-CuO samples is more electron rich than that of the CuO-128 which is
a result of oxygen pulling electron density away from La, with electronegativity of 1.1, towards
Cu, with electronegativity of 1.9. This higher electron density on the Cu2+ atoms weakens the
Cu-O bonds and results in easier replacement of O2- by S2-.

160
Figure 7-4: Normalized Cu K-edge XANES spectra for commercial CuO-based sample, CuO-1, and
CuO samples with La additives, CuO-La-1 and CuO-La-2.
To further quantify the structural differences between La-CuO samples and the
reference CuO-1 sample, the EXAFS regions of the Cu K-edge spectra of the fresh samples
were modelled. The EXAFS best-fit model for all samples, Table F-1 and Figure F1-F3,
included scattering paths matching hexagonal CuO structure, tenorite, in agreement with the
XRD results. While the first shell Cu-O scattering path lengths for CuO-La-1 and CuO-La-2
match very well with those of CuO-1, the second shell Cu-O and third and fourth shell Cu-Cu
scattering paths appear to be elongated by approximately 0.2 Å for La-doped samples. This can
be explained by a distortion of the packing structure caused by the inclusion of lanthanum into
the CuO lattice. The increase in 2nd and further coordination shell path lengths indicates a larger
unit cell which should allow for easier sulfur diffusion through the lattice, thus making the La
samples capable of removing more H2S.

161
Finally, the coordination numbers of all samples appear to be lower than that of bulk
CuO which consistent with the small crystallite sizes for all samples (<11 nm). Nevertheless,
the La-doped samples appear to have lower coordination numbers than CuO-1, despite being
of slightly higher crystallite size. This can be partially explained by the presence of Cu-La
scattering paths that are unaccounted for in the fitting model.
XANES spectra were also measured at the Cu K-edge for spent samples at 1000 ppm-
vol H2S, 323 K, and 1 atm (Figure 7-5). For both La-CuO samples, linear combination analysis
using tenorite (CuO) and covellite (CuS) standards as the basis set shows that approximately
50% of the oxygen had been replaced by sulfur during these in-situ experiments. For the CuO-
La-1, this is the upper limit of sulfur uptake determined from fixed bed experiments. Again,
these spectra show a blue-shifted and attenuated white line peak relative to that of spent CuO-
1 sample, which is indicative of a more electron-rich Cu species. The absence of a strong peak
at 8980 eV (characteristic of Cu2S) in the spent samples, indicates that Cu+-S-2 species are not
formed in this reaction.282

162
Figure 7-5: Normalized Cu K-edge XANES spectra for spent CuO-1, CuO-La-1 and CuO-La-2 sorbents
at 323, 1 atm, and 1000 ppm-vol H2S/He.
At the S K-edge, XANES spectra were collected for spent CuO-1, CuO-La-1, and CuO-
La-2 under He flow, after an in-situ sulfidation at 1000 ppm-vol H2S/He, 323 K, and 1 atm
(Figure 7-6). Previous work on the XANES region of the sulfur K-edge has highlighted its
ability to report on the oxidation state of sulfur in the sample, following the general trend that
the more oxidized the sulfur species is, the higher in energy its white line peak will appear (peak
a in Figure 7-6).283,284 This indicates that, in comparison to CuO-1, the La-CuO samples possess
sulfur species which are more electron rich.
Another important spectral feature that speciates the type of copper sulfide present are
the pre-edge peaks at 2469.9 eV (c) and 2470.7 eV (b) in Figure 7-6. These features correspond
to S2- 1s → Cu2+ 3d9 and S22- 1s → Cu2+ 3d9 transitions, respectively.253 Figure 7-6 shows that
the S K-edge spectra of both spent La-CuO samples and CuS reference contain both pre-edge
features, while peak (b) is absent in the spent CuO-1 spectra. This difference is more apparent

163
in the second derivative plots of CuO-1 and CuO-La-2 spectra (inset of Figure 7-6). In a study
that speciates the results of sulfidation of CuO at different temperatures (see chapter 5), the
absence of peak b was associated with the formation of distorted CuS species at the interface
of CuO/CuS which dominates the spectra at low conversions of CuO to CuS. Samples that
achieve higher conversion exhibit higher intensity of peak b at 2470.7 eV in their K-edge
XANES spectra which is consistent with the spectral features of bulk covellite. These
observations are consistent with the extent of conversion of these samples CuO-1 (59%) CuO-
La-1 (64%) and CuO-La-2 (85%). Finally, the presence of a peak at 2482-2483 eV in all
samples (except CuO-La-2) indicates the presence of SO42-, likely in the form of copper
sulfate.283 This is the result of some oxidation of the samples in air prior to running these scans
and not a fundamental difference in reaction mechanism. The presence of the same peak in the
CuS covellite reference confirms this assumption.

164
Figure 7-6: Normalized S K-edge XANES spectra for CuO-1, CuO-La-1, CuO-La-2 spent at 323 K, 1
atm, and 1000 ppm-vol H2S/He and a covellite reference (CuS). The inset shows the second derivative
spectra of the CuO-1 and CuO-La-2 spent samples highlighting the presence of peak b (S22- 1s → Cu2+
3d9) in the spent CuO-La-2 which indicates higher conversion and CuS-like products.
The similarity between CuO-La-1 and CuO-La-2 XANES at the Cu and S K-edges
shows that the difference in performance between the two samples is not due to a difference in
the form of sulfur products, but rather results from higher dispersion of La in CuO-La-2. On
the other hand, the difference between the XANES of both La-CuO samples and CuO-1
indicates that the true source of the improvement of sulfur uptake upon lanthanum addition is
electronic in nature.
Finally, XANES spectra taken at the La L3-edge show that, in comparison to CuO-La-
1 and La2O3 reference, CuO-La-2 sample shows a broadened white line feature (see Figure 7-7).

165
This broadening is characteristic of a decrease in La-O coordination.285 This observation can be
interpreted to be a result of the uniform dispersion of La in the CuO phase for CuO-La-2 sample,
as La in this environment has a lower La-O coordination number than that of La2O3. This is
consistent with the EDS results suggesting higher percentage of La in this sample and lower
variations of La concentration from spot to spot. Nevertheless, after reaction, both La-CuO
samples exhibit overlapping La L3-edge spectra suggesting similar La environment in the spent
samples. With the high conversion of Cu-La-2 sample (85%) the La-O coordination number
increases since La doesn’t react to form lanthanum sulfide but rather precipitates as La2O3 while
the bulk of CuO converts to CuS.
Figure 7-7: Normalized L3-edge XANES spectra for CuO-La-1, CuO-La-2 both fresh and spent at 323
K, 1 atm, and 1000 ppm-vol H2S/He and a lanthanum oxide reference (La2O3).

166
7.3.4 Bulk kinetics using in-situ XAS and fixed bed experiments
Fixed bed sorption experiments were run for all samples to determine removal capacity,
qs, at 1000 ppm-vol H2S/N2, 323 K, and 1 atm. The breakthrough curves of effluent H2S
concentration were then fit using Cooper linear driving force model (Equation 4)182,208 to
determine the sulfidation kinetics. Figure 7-8 shows the breakthrough curves for CuO-1, CuO-
La-1, and CuO-La-2 experiments, normalized for inlet H2S concentration, along with the model
fits (black solid lines). Table 7-3 summarizes the model regressed rate parameter, k, the removal
capacity, qs, and the percentage of conversion for the CuO phase. The experiments were run
under flow conditions that eliminate bulk and pore diffusion resistance contributions and, thus,
k reflects the rate of uptake at the reaction surface.208
Figure 7-8: Breakthrough curves of normalized effluent H2S concentration collected for fixed beds of
the CuO-based sorbents at 1000 ppm-vol H2S/N, 323 K and 1.0 atm. Solid black lines represent linear
driving force model fit (Cooper model). Time is normalized by multiplying the time on stream with the
mass flowrate of H2S and dividing by mass of sorbent.
0
0.2
0.4
0.6
0.8
1
0 20 40 60 80 100
C/C
0
g H2S/100 g CuO
CuO-1
CuO-La-1
CuO-La-2

167
Table 7-3: Summary of rate parameters deduced from Cooper model fit, removal capacity, and
conversion of CuO for fixed bed sorption tests at 1000 ppm-vol H2S/N, 323 K and 1.0 atm.
Sample k (s-1
) qs (wt.%) Conversion (%)
CuO-1 18 ±1.6 24.9 59.2
CuO-La-1 22 ±1.3 26.9 64.0
CuO-La-2 7.4 ±0.80 35.8 85.2
As reported in earlier section, fixed bed results show that La-doped samples achieved a
conversion of 64 % and 85% for CuO-La-1 and CuO-La-2. Opposite to the trend in conversion,
the rate parameter (k) values for CuO-1 (18 s-1) and CuO-La-1 (22 s-1) were more than double
that of CuO-La-2 (7.4 s-1). This indicates that lower rate parameters allow for more time for
diffusion of H2S to CuO surfaces resulting in higher conversion. On the other hand, fast
accumulation of CuS layers results in a sooner inhibition for diffusion through products, and
thus, lower conversion.260
In-situ XAS at S K-edge were also run to determine bulk sulfidation kinetics of CuO-1
and La-CuO sorbents. The S K-edge spectra show changes from H2S like features, in the first
few scans, to CuS like features as the reaction progresses (Figure 7-9). The edge steps for the
scans were used to deduce the amount of sulfur in the sample at each point in time, where the
maximum conversion from fixed bed experiments was assumed to correspond to the edge step
for the spent sample from in-situ XAS experiments. The contribution of gaseous H2S spectra,
determined from the difference between spent sample spectra under H2S and under He flow,
was subtracted from all spectra prior to analysis.

168
Figure 7-9: Bulk S K-edge XAS spectra of a) CuO-La-1 and b) CuO-La-2 as it was exposed to flowing
1000 ppm H2S in helium at 323 K and 1 atm. XAS scans were taken every 9 minutes and the edge step
increased consistently with time.
(a)
(b)

169
The conversion profiles for the three samples, as determined from sulfur content, are
shown in Figure 7-10, while Table 7-4 summarizes the rate constants and effective diffusivities
derived from random pore model (RPM) fits of the data (Equations 15-19).174,176 The rate
constant for CuO-1 (6.3 x 10⁻³ cm4 mol-1 s-1) was double that of CuO-La-1 (2.6 x 10⁻³ cm4 mol-
1 s-1) and an order of magnitude larger than CuO-La-2 rate constant (7.1 x 10⁻⁴ cm4 mol-1 s-1).
This trend can be observed in the the initial region of the conversion profiles, Figure 7-10, with
the most rapid change in conversion for CuO-1, followed by CuO-La-1 and, then, CuO-La-2.
This initial rapid change in conversion results in a shorter reaction-controlled regime, 20
minutes for CuO-1, compared to 55 minutes for CuO-La-1 and 125 minutes for CuO-La-2,
followed by a slower diffusion controlled regime. These results are consistent with the fixed
bed sorption results, and they confirm that higher rates result in early accumulation of CuS
products in pores and surfaces which leads to restriction of further H2S diffusion to reactive
surface as demonstrated in earlier studies.260 On the other hand, an opposite trend was observed
for the effective diffusivity in the diffusion-controlled regime with the highest diffusivity value
for CuO-La-2 (1.7 x 10⁻¹¹ cm2 s-1). This suggests that, despite higher conversion which leads
to higher product content, CuO-La-2 demonstrated the most facile access to reactive surfaces
in its diffusion-controlled regime.
Table 7-4: Random pore model parameters from fits of the conversion profiles of S K-edge in situ
sulfidation runs at 1000 ppm-vol H2S/N2, 323 K and 1.0 atm.
Sample k x 103 (cm
4 mol
-1 s
-1) D x 10
12 (cm
2 s
-1)
CuO-1 6.0 ±1.6 2.3 ±1.1
CuO-La-1 2.6 ±0.19 5.4 ±1.7
CuO-La-2 0.71 ±0.08 17 ±2.8

170
Figure 7-10: Conversion profiles of CuO in CuO-1 (green), CuO-La-1 (blue), and CuO-La-2 (red) to
CuS as determined by in-situ S K-edge XAS experiments at 1000 ppm-vol H2S/N, 323 K and 1.0 atm.
Black dots represent RPM fits for the data.
7.4 Conclusion
In conclusion, a combination of conventional and synchrotron-based characterization
methods allowed us to study the chemical and structural changes induced by the introduction
of lanthanum to CuO sorbents, and the correlation between these changes and the enhanced
performance of the sorbents. Lanthanum-doped sorbents, of similar bulk lanthanum content,
prepared via different synthesis methods: sol-gel and co-precipitation with ammonium, yielded
materials of different physiochemical properties and sulfur removal performance. Both samples
achieved improved sulfur removal capacities despite having larger crystallite sizes and smaller
surface area. This improved removal capacity was associated with slower rate parameters (both
in fixed bed reactor, and gradient-less XAS wafer) compared to CuO-based reference sorbent.
The slower rates allowed for expanding the reaction-controlled regime which resulted in
0
0.2
0.4
0.6
0.8
1
0 100 200 300 400
Co
nve
rsio
n
time on stream (min)
CuO-1
CuO-La-1
CuO-La-2

171
improved conversion. Cu K-edge EXAFS fits for the samples revealed that the introduction of
lanthanum weakened the second shell Cu-O, evident by the elongation of this scattering path
along with third and fourth shell Cu-Cu single scatterings. Cu K-edge XANES also revealed a
more electron-rich environment for Cu in La-doped samples which makes the Cu-O bond more
suspectable to breaking and, thus, more reactive towards sulfur. The La L3-edge results revealed
lower coordination of La-O in the co-precipitation sample, CuO-La-2, compared to the sol-gel
sample, CuO-La-1, and bulk La2O3 reference, which is consistent with the higher content of La
in CuO phase that was determined by STEM-EDS. In addition to higher La inclusion, uniform
dispersion of La within CuO phase and smaller crystals allowed for higher Cu-La interaction
and, thus, better performance improvement. These results show that lanthanum doping
improves the sulfidation performance by both altering the average chemical environment of Cu
making it more reactive towards S, and by disrupting the CuO lattice resulting in more
vacancies and defects which enhance the diffusion of H2S to reactive surfaces.

172
Chapter 8 | Conclusions
This dissertation work was motivated by the importance of developing a fundamental
understanding of CuO-H2S reactive sorption systems, in order to rationally design improved
sorbents and optimize desulfurization process conditions.
The third chapter of this dissertation demonstrated the utility of simple linear driving
force models in describing the reactive sorption process if the conditions are controlled so that
bulk and pore diffusion resistances are negligible. Namely, the work from this section allowed
for probing the effects of process conditions on these model-deduced rate values and
establishing their relationship to rate constants from elementary mechanistic steps. The
credibility of this relationship is further confirmed by comparing it to advanced synchrotron in
situ tests which showed similar trends in both the pore model-deduced values from experiments
on few micrometers-sized particles and linear driving force-deduced values from experiments
for fixed beds of multiple grams of material. These findings are demonstrated thoroughly in
Chapter 5 of this dissertation. Also, the effects of temperature on the rate parameters and
capacity was tested against synchrotron in situ tests in Chapter 6 of this work. This work can
be further expanded by testing a wider range of experimental conditions than what this
dissertation covered. The practical impact of this work is that the results of these tests can guide
the optimization of industrial desulfurization processes’ conditions so that they achieve the
highest possible conversion and rate values. Furthermore, the effect of trace amounts of
common co-contaminants mixtures of sulfur compounds, H2O, and O2 (that are often present
in natural gas streams) would be invaluable to solidify the practicality of these results.

173
Also, to further improve on this work, thermogravimetric techniques can be used to
study the reactions of sulfur compounds with CuO. These thermogravimetric experiments are
better suited to measure intrinsic reaction rates between gas phase contaminant molecules and
solid phase sorbents because they are conducted under constant concentration conditions. In
these thermogravimetric studies, time derivative of the fractional conversion can be expressed
as the product of a time-independent reactivity function, which depends only on temperature
and contaminant concentration, and a time-dependent geometric function. The geometric
function depends on both the shape and size of the region where the rate-determining step (e.g.,
interfacial reaction, diffusion/growth at the product/reactant interface, or growth via diffusion)
occurs and on the temperature and concentration of the contaminants. A series of experiments
in which the temperature or concentration is suddenly changed at different extents of conversion
can be used to establish the general form of the two functions, and microkinetic models can be
proposed to derive specific equations for the two functions. These studies can provide a more
detailed description of the process that separates the rate of reaction from diffusion through
solid phases which fixed bed tests fail to achieve.
Aside from the effects of experimental conditions, the work in this dissertation shed
light on the physicochemical properties that affect the H2S performance of these materials. This
aim is achieved in chapter 4 of this work. Several CuO-based nanomaterials were prepared and
tested for their performance as low-temperature desulfurizing sorbents by performing fixed-bed
sulfidation experiments at ambient temperature and pressure. These materials were prepared
via various synthesis techniques, including sol-gel, precipitation, hydrothermal treatment in the
presence of a polymer (PVP or PEO) or surfactant (P123), hydrolysis, and electrospinning.
Despite differences between the various properties of the tested CuO sorbents as well as their

174
morphologies, a strong linear relationship was recognized between the sorbents’ sulfur removal
capacity and crystallite size, particularly when the crystallite size of CuO was below 26 nm.
This data supports the hypothesis that decreasing CuO crystallite size leads to higher
conversions possibly because of an increase in oxygen vacancies. A possible molecular reason
for this is that decreasing crystallite size exposes more reactive surface facets in CuO that can
facilitate H-S bond cleavage that is required to produce S atoms that can react with CuO
moieties. Open facets can also facilitate the migration of S from surface to subsurface layers.
An atomic scale explanation of the strong influence of crystallite size was also confirmed
through model DFT computations, explaining how elementary reaction and molecular diffusion
steps occur more rapidly and to a greater extent on smaller CuO crystallites. These
computations provided further explanation to this effect which is that higher concentrations of
3-fold coordinated oxygen atoms are present in smaller crystals compared to 4-fold coordinated
oxygen atoms in larger ones. These oxygen atoms are considerably more reactive towards sulfur
moieties. The effect of residual carbon was also investigated, and it was found that carbon
residues resulting from the use of a polymer (PVP or PEO) or a surfactant (P123) in the
synthesis procedure remained on the surface of the sorbent after thermal treatment and
detrimentally affected its H2S uptake capacity. The practical impact of this work is that the
industrial efforts should be focused on developing materials that have small crystallite sizes
using synthesis methods that are carbon-free.
Subsequently, the mechanism of reaction propagation through CuO particles was
explored in chapter 5 through XAS and TXM studies at Cu K-edge. Part of the study explored
the effect of crystallite size on the reaction rates and capacities deduced from in situ XAS
studies which showed consistent trends with the results obtained in chapter 4, as stated

175
previously. Specifically, the CuO-based sorbent with smaller (nearly amorphous) crystals
achieved a considerably higher capacity than that of CuO materials with larger crystals.
Interestingly, the study showed also that the rates of reaction followed an opposite trend than
that of removal capacity which can be explained by the fact that higher initial reaction rates in
lower performing materials caused fast coverage of reactive surfaces which inhibited further
penetration of H2S through product phase to react with fresh material. This explanation is also
consistent with the fact that higher diffusivities were observed for higher performing materials
which allowed for deeper penetration of reactive species. The high performing material was
then subjected to in-situ operando TXM study that allowed for quantitative spatial-temporal
monitoring of the structural and chemical changes within few micron-sized particles. The
results of this study showed that the average kinetics within single particles mirror the reaction
kinetics measured from fixed bed of sorbents. However, the operando TXM study detected that
the growth of reaction fronts proceeds heterogeneously within the solid phase particles which
suggests that pore diffusion persists even for particles less than 10 µm in size.
Moving on from the structural and chemical changes that are based on the Cu
environment, chapter 6, provides a more detailed study of the sulfur environment which is
necessary to speciate the formed Cu2-xSx species. This was achieved by performing in situ XAS
studies at both S K-edge and Cu K-edge. The complimentary results from both edges captured
the changes in the formed CuS phase in real time and at different temperatures and extents of
conversion. Unprecedently, the results from this study identified a unique structure at the
interfacial CuO-CuS area which, consequently, unraveled mechanistic details of the sulfidation
process. S K-edge XANES showed evidence of S22-, characteristic of CuS, for all spent samples,
with a geometrically strained and more electropositive S22- form at lower conversions (Spent

176
samples at 298 K and 323 K and early in situ sulfidation spectra of 353 K and 383 K). These
differences are explained by the fact that the initially formed disulfide groups are bonded to
Cu2+ which are bonded to O2- in bulk CuO, as compared to S22- in bulk CuS which are connected
to Cu+/Cu2+ that are bound to S2- and S22. Furthermore, DFT simulations of CuO sulfidation
paths (non-sulfided and partially sulfided (111) and (1̅11) surfaces), suggest that the formation
of disulfide ion is, indeed, thermodynamically favorable in the initial sulfidation stages. Finally,
the Cu K-edge EXAFS fits of the sulfided samples show longer Cu-S scattering paths at lower
conversions which, again, supports the strained interfacial geometry theory. The results of this
study challenge the common belief that CuO-H2S reactions result in one form of CuS. Indeed,
this study shows, for the first time, the geometrical and electronic changes in the formed sulfide
species as the reaction progresses.
Finally, the last chapter of this dissertation, branched out from pure CuO sorbents to
explore the effects of introducing foreign atoms to CuO on the sulfur removal capacity. This
section continued to employ a combination of conventional and synchrotron-based
characterization methods which allowed for a study the of the chemical and structural changes
induced by the introduction of lanthanum to CuO sorbents, and the correlation between these
changes and the enhanced performance of the sorbents. Lanthanum-doped sorbents, of similar
bulk lanthanum content, prepared via different synthesis methods: sol-gel and co-precipitation
with ammonium, yielded materials of different physiochemical properties and sulfur removal
performance. Both samples achieved improved sulfur removal capacities (85% and 61%
conversion of La-doped CuO samples compared to 56% in the best performing CuO samples).
This improved removal capacity was associated with slower rate parameters (both in fixed bed
reactor, and gradient-less XAS wafer) compared to CuO-based reference sorbent. The slower

177
rates allowed for expanding the reaction-controlled regime which resulted in improved
conversion which aligns with the results in chapter 5. Cu K-edge EXAFS fits for the samples
revealed that the introduction of lanthanum weakened the second shell Cu-O, evident by the
elongation of this scattering path along with an elongation of the third and fourth shell Cu-Cu
single scattering paths. Cu K-edge XANES also revealed a more electron-rich environment for
Cu in La-doped samples which makes the Cu-O bond more suspectable to breaking and, thus,
more reactive towards sulfur. The La L3-edge XANES results revealed lower coordination of
La-O in the samples compared to bulk La2O3. This result suggests that La was indeed included
within the CuO rather than present in a separate La2O3 phase. The results of this study show
that lanthanum doping improves the sulfidation performance by both altering the average
chemical environment of Cu making it more reactive towards S, and by disrupting the CuO
lattice resulting in more vacancies and defects which enhances the diffusion of H2S to reactive
surfaces. This study can be expanded by performing DFT simulations for La-doped CuO
samples to confirm the suggested reasoning of the cause of improved sulfur removal capacity.
Moreover, other metal dopants of varying cationic sizes can be explored in future studies to
confirm the hypothesis that metals of higher cationic size ratio cause more disruption of the
CuO lattice.
For future work, the regeneration of spent CuO-based sorbents would be important for
the commercialization of these sorbents. CuO in these reactive sorption processes is used for
the removal of trace amounts of hydrogen sulfide and, thus, the reloading of beds is infrequent.
Nevertheless, the regeneration of the spent beds after extended periods of use ensures the
sustainable use of resources and minimizes the amount of waste that has to be landfilled. The
oxidative regeneration methods (reaction with SO2, O2 and H2O) that are commonly employed

178
for the regeneration of other metal oxides are extremely exothermic which risks sintering the
sorbents and ruining their ability to absorb sulfur in the following cycles. Thus, careful control
of temperature is important if this route is explored. Moreover, a common undesired side
reaction for these oxidative processes is the formation of copper sulfate which is inert towards
further desulfurization. Thus, studies focused on determining the ideal conditions that minimize
both sorbents sintering and sulfate by-product formation are very important.

179
Supplementary Information for Chapter 2
Table A-1: Select results of sulfidation of pure and doped-copper and zinc oxide at various experimental conditions
Metal Oxide Composition Feed Temperature
(oC) Reactor Type Synthesis Technique
Sulfur Removal Capacity
(g of S/g of sorbent)
CuO-based (Me/Cu)
CuO36 0.00 1% H2S in Helium 300 Fixed-bed Complexation agent 0.23
CuO10 0.00 10 ppm H2S in N2 25 Tedlar Bag® Co-precipitation 0.283
CuO37 0.00 1000 ppmv in N2 21 Fixed bed sol-gel 0.075
CuO37 0.00 1000 ppmv in N2 21 Fixed bed co-precipitation and
hydrolysis 0.011
CuO37 0.00 1000 ppmv in N2 21 Fixed bed co-precipitation 0.003
Cu-Mo-O36 1.00 1% H2S and 10% H2 in He 300 Fixed-bed Complexation agent 0.079
Cu-V-O36 1.00 1% H2S and 10% H2 in He 300 Fixed-bed Complexation agent 0.059 moles of SO2 formed
/moles of H2S removed
Cu-Al-O (CuAl2O4)48 96.00 20% hydrogen, 25% H2O, 1% H2S, and 54% N2 700 Packed
bed/TGA Complexation agent
Wn=(m-m0)/(m0-mf),
normalized weight; 1.26
Cu-Al-O (CuO-Al2O3)48 2.02 15-20% hydrogen, 7-25% H2O, 0.2-1% H2S, and
N2 700
Packed
bed/TGA Complexation agent
Wn=(m-m0)/(m0-mf),
normalized weight; 1.27
Cu-Fe-O (CuFe2O4)129 1.00 0.26% H2S, 20% H2, 6.85% H2O, and 73% N2 538 Fixed-bed Complexation agent Reported as normalized
breakthrough time only
Cu-Fe-Al-O (CuFe2O4,
FeAl2O4, CuO)129 2.00 0.26% H2S, 20% H2, 6.85% H2O, and 73% N2 650 Fixed-bed Complexation agent
Reported as normalized
breakthrough time only
Cu-Cr-O286 1.22 2 vol% H2S, 10 vol% H2, 20 wt% CO, 10 wt%
CO2, 10 wt% H2O, and 48 wt% N2 650 packed bed Mixing, pelletizing
Reported as normalized
breakthrough time only
ZnO-based (Me/Zn)
ZnO38 0.00 100 ppm H2S balanced in He 250 Fixed-bed Glycerine method 0.012
ZnO38 0.00 100 ppm H2S balanced in He 250 Fixed-bed Combustion method 0.017
ZnO38 0.00 100 ppm H2S balanced in He 250 Fixed-bed Aldrich (commercial) 0.0125
ZnO84 0.00 0.2 vol% H2S in H2/N2 (1:1) 200 TGA co-precipitation 0.0393
ZnO10 0.00 10 ppm H2S in N2 25 Tedlar Bag® co-precipitation 0.032
Zn-Ca-O100 0.72 8 ppmv H2S, 34.4% H2, 20% H2O, and balance
being N2 300 Fixed bed
Engelhard
(commercial) 1.69

180
Metal Oxide Composition Feed Temperature
(oC) Reactor Type Synthesis Technique
Sulfur Removal Capacity
(g of S/g of sorbent)
Zn-Ca-O100 0.72 8 ppmv H2S, 34.4% H2, 20% H2O, and balance
being N2 350 Fixed bed
Engelhard
(commercial) 0.85
Zn-Ca-O100 0.72 8 ppmv H2S, 34.4% H2, 20% H2O, and balance
being N2 375 Fixed bed
Engelhard
(commercial) 0.6
Zn-Ca-O100 0.72 8 ppmv H2S, 34.4% H2, 20% H2O, and balance
being N2 400 Fixed bed
Engelhard
(commercial) 0.28
Zn-Fe-O (ZnFe2O4)129 2.00 1% H2S, 15% H2, 25% H2O, and 59% N2 600 Fixed bed Complexation agent Reported as normalized
breakthrough time only
Zn-Bi-O287 0.33 2000 ppm in N2 25 Stainless steel
cell Solvothermal 0.079
Zn-Fe-O10 0.33 10 ppm H2S in N2 25 Tedlar Bag® co-precipitation 0.066
Zn-Ni-O10 0.33 10 ppm H2S in N2 25 Tedlar Bag® co-precipitation 0.069
Zn-Co-O10 0.33 10 ppm H2S in N2 25 Tedlar Bag® co-precipitation 0.134
Zn-Mn-O10 0.33 10 ppm H2S in N2 25 Tedlar Bag® co-precipitation 0.152
Zn-Fe-Zr-O10 0.39 10 ppm H2S in N2 25 Tedlar Bag® co-precipitation 0.075
Zn-Ti-Zr-O10 0.47 10 ppm H2S in N2 25 Tedlar Bag® co-precipitation 0.145
Zn-Cu-Zr-O10 0.41 10 ppm H2S in N2 25 Tedlar Bag® co-precipitation 0.135
Zn-Co-Al-O10 1.00 10 ppm H2S in N2 25 Tedlar Bag® co-precipitation 0.107
Zn-Al-O10 0.33 10 ppm H2S in N2 25 Tedlar Bag® co-precipitation 0.146
Zn-Ti-O288 0.50 1.5% H2S, 11.7% H2, 9.6% CO, 5.2% CO2, N2
balanced 650 Fixed bed Physical mixing 0.18
Zn-Ti-Co-O288 1.53 1.5% H2S, 11.7% H2, 9.6% CO, 5.2% CO2, N2
balanced 650 Fixed bed Physical mixing 0.22
Zn-Ti-O288 0.50 1.5% H2S, 11.7% H2, 9.6% CO, 5.2% CO2, N2
balanced 480 Fixed bed Physical mixing 0.05
Zn-Ti-Co-O288 1.53 1.5% H2S, 11.7% H2, 9.6% CO, 5.2% CO2, N2
balanced 480 Fixed bed Physical mixing 0.05
Zn-Cu-O84 0.03 0.2 vol% H2S in H2/N2 (1:1) 200 TGA co-precipitation 0.47 mol of S/mol of ZnO
Zn-Cu-O84 0.03 0.2 vol% H2S in H2/N2 (1:1) 200 TGA co-precipitation 0.61 mol of S/mol of ZnO
Zn-Al-Fe-O289 1.86 1.5 vol% H2S, 11.7 vol% H2, 9.6 vol% CO, 5.2
vol % CO2, and N2 balance 480 Fixed bed
Co-precipitation and
physical mixing 0.18
Zn-Al-Co-O289 1.86 1.5 vol% H2S, 11.7 vol% H2, 9.6 vol% CO, 5.2
vol % CO2, and N2 balance 480 Fixed bed
Co-precipitation and
physical mixing 0.175

181
Metal Oxide Composition Feed Temperature
(oC) Reactor Type Synthesis Technique
Sulfur Removal Capacity
(g of S/g of sorbent)
Zn-Al-Ni-O289 1.86 1.5 vol% H2S, 11.7 vol% H2, 9.6 vol% CO, 5.2
vol % CO2, and N2 balance 480 Fixed bed
Co-precipitation and
physical mixing 0.2
Zn-Al-Ce-O289 1.80 1.5 vol% H2S, 11.7 vol% H2, 9.6 vol% CO, 5.2
vol % CO2, and N2 balance 480 Fixed bed
Co-precipitation and
physical mixing 0.16
Table A-2: Possible reaction stoichiometries for sulfur compounds with different metal oxides
Metal Oxide Composition Feed Temperature
(oC) Reactor Type Synthesis Technique
Sulfur Removal Capacity
(g of S/g of sorbent)
Al2O3-based (Me/Al)
Al-Zn-O (Ɣ-Al2O3)49 0.09 1% H2S in N2 600 Fluidized bed Dry impregnation Reported as normalized
breakthrough time only
Al-Zn-O (α-Al2O3)49 0.09 1% H2S in N2 600 Fluidized bed Dry impregnation Reported as normalized
breakthrough time only
Al-Ca-O (α-Al2O3)49 0.12 1% H2S in N2 600 Fluidized bed Dry impregnation Reported as normalized
breakthrough time only
MgO-based (Me/Mg)
Mg-Zn-O49 0.03 1% H2S in N2 600 Fluidized bed Dry impregnation Reported as normalized
breakthrough time only
Mg-Cu-O49 0.03 1% H2S in N2 600 Fluidized bed Dry impregnation Reported as normalized
breakthrough time only
Mg-Ca-O49 0.05 1% H2S in N2 600 Fluidized bed Dry impregnation Reported as normalized
breakthrough time only
Mg-Mn-O49 0.03 1% H2S in N2 600 Fluidized bed Dry impregnation Reported as normalized
breakthrough time only
Mg-Zn-Cu-O49 0.05 1% H2S in N2 600 Fluidized bed Dry impregnation Reported as normalized
breakthrough time only
La2O3-based (Me/La)

182
Metal Oxide Composition Feed Temperature
(oC) Reactor Type Synthesis Technique
Sulfur Removal Capacity
(g of S/g of sorbent)
La2O351 0.00 250 ppm H2S, 70% H2, 5% H2O, and He 800 Packed bed
Urea coprecipitation/
gelation method 0.06
La-Pr-O51 0.43 250 ppm H2S, 70% H2, 5% H2O, and He 800 Packed bed Urea coprecipitation/
gelation method 0.056
La-Ce-O42 0.43 0.1% H2S, 50% H2, 10% H2O, He balance 650 packed bed Urea co-precipitation/
gelation 0.032
SnO-based (Me/Sn)
SnO10 0.00 10 ppm H2S in N2 25 Tedlar Bag® Co-precipitation 0.002
NiO-based (Me/Ni)
NiO10 0.00 10 ppm H2S in N2 25 Tedlar Bag® Co-precipitation 0.002
Co3O4-based (Me/Co)
Co3O410 0.00 10 ppm H2S in N2 25 Tedlar Bag® Co-precipitation 0.006
Co-Si-O (3DOM
structure)290 1.01 500 mg/m3 H2S, at 100 mL/min 30 Fixed bed
Colloidal crystal
template method 0.075
Co-Si-O290 1.01 500 mg/m3 H2S, at 100 mL/min 30 Fixed bed Colloidal crystal
template method 0.012
Co-Si-O290 1.01 500 mg/m3 H2S, at 100 mL/min 30 Fixed bed Colloidal crystal
template method 0.028
Co-Si-O (3DOM
structure)290 1.01 500 mg/m3 H2S, at 100 mL/min 30 Fixed bed
Colloidal crystal
template method 0.189
CaO-based (Me/Ca)
CaO 0.00 10 ppm H2S in N2 25 Tedlar Bag® co-precipitation 0.011
Mn3O4-based (Me/Mn)
Mn3O410 0.00 10 ppm H2S in N2 25 Tedlar Bag® co-precipitation 0.016
Ag2O-based (Me/Ag)
AgO10 0.00 10 ppm H2S in N2 25 Tedlar Bag® co-precipitation 0.031
CeO2-based (Me/Ce)
CeO242 0.00 0.1% H2S, 50% H2, 10% H2O, He balance 650 Packed bed
Urea co-precipitation /
gelation 0.006
Ce-Cu-O42 0.11 0.1% H2S, 50% H2, 10% H2O, He balance 650 Packed bed Urea co-precipitation /
gelation 0.0041
Ce-La-O42 0.43 0.1% H2S, 50% H2, 10% H2O, He balance 650 Packed bed Urea co-precipitation /
gelation 0.0072

183
Metal Oxide Composition Feed Temperature
(oC) Reactor Type Synthesis Technique
Sulfur Removal Capacity
(g of S/g of sorbent)
Fe2O3-based (Me/Fe)
Fe-Al-O291 3.10 1% H2S (10,000 ppmv), 10% H2, and N2 850 Fixed bed Co-precipitation 0.2073
Fe-Al-Mn-O291 3.56 1% H2S (10,000 ppmv), 10% H2, and N2 850 Fixed bed Co-precipitation 0.1
Fe-Al-Mn-O291 4.13 1% H2S (10,000 ppmv), 10% H2, and N2 850 Fixed bed Co-precipitation 0.17
Fe-Al-Mn-O291 4.87 1% H2S (10,000 ppmv), 10% H2, and N2 850 Fixed bed Co-precipitation 0.2014
Fe-Al-Mn-O291 7.23 1% H2S (10,000 ppmv), 10% H2, and N2 850 Fixed bed Co-precipitation 0.2072
Table A-3: List of theoretical studies that investigate the adsorption of H2S or other molecules on various metal oxides. The list is grouped by type
of metal oxide studied, ordered as they appear in section 2.4, and specified with details on computational methods used. Subscripts in alphabetical
order point out studies that do not involve H2S and indicate what molecules were studied instead. a: S2 adsorption on zincite (101̅0) surface b: O2,
NO2, H2O, C2H5OH, and CH3CHO adsorption on various CuO surfaces and nanowires c: H2 adsorption on CuO(111) surface d: CO2 adsorption
on CuO (111), (111), and (011) e: H2O adsorption on the CuO (111) surface f: H2O adsorption on the CuO (111) surface g: SO2 adsorption on
CeO2(111) and (110) h: SO2 and SO3 adsorption on MgO(001) i: S adsorption on MgO(001) j: Hg0, HgCl, HgCl2, HgO, and SO2 adsoprtion on
CaO(100) k: CO2 and SO2 sorption on the Li, Na, K, Rb, or Cs doped CaO(100)surface l: C4H4S adsorption on TixCe(1-x)O2 mixed surface.
References Authors Metal Oxide Method
ZnO & Related Materials
dhage2012 Dhage et al. CuxZnO(1-x) DFT – B3LYP, LANL1MB with effective core potentials and 6-31G(d) basis set with
Stuttgart effective core potential (SDD)
casarin1996
casarin1995 Casarin et al. ZnO (101̅0) and (0001) LCAO-LDF molecular-cluster approach
rodriguez2000 Maiti & Rodriguez ZnO (0001) DFT – GGA, nonlocal ultrasoft pseudopotentials, Becke-88 for exchange37 and Perdew-91
for correlation
wang2013 Wang et al. ZnO (101̅0) DFT – GGA, PW91 functional, double-numeric quality basis set with polarization functions
(DNP)
kazemi2017 Rad & Kazemi ZnO nanocage DFT – B3LYP, 6-311G (d,p) basis set
DFT – 𝜔b97XD, 6-311G (d,p) basis set
tong2018 Zheng et al.a ZnO (101̅0) DFT – GGA, norm-conserving and ultrasoft Vanderbilt pseudopotentials
hao2011 Sholl et al. Zn2TiO4(010) DFT – GGA, PW91 exchange-correlation functional, PAW potentials
CuO & Related Materials

184
References Authors Metal Oxide Method
hu2010 Hu et al.b CuO(111), (1̅11), (110), (011),
(101), (010), and (100) DFT – GGA+U, PAW potentials
sun2015 Sun et al. CuO(111) DFT-D – GGA, PW91 functional, double numerical basis set with polarization functions
(DNP)
zhang2017 Zhang et al. CuO(111) DFT-D – GGA, PW91 functional, DFT Semi-core Pseudopots (DSPP), double numerical
basis set with polarization functions (DNP)
maimaiti2014 Elliott et al.c CuO(111) DFT – GGA+U, PBE & HSE06 functional, PAW potentials
mishra2015 de Leeuw et al.d CuO(111), (1̅11), and (011) DFT – GGA+U, PBE functional, PAW potentials
yu2017 Feng et al.e CuO(111) DFT – GGA+U, PBE functional, PAW potentials
fronzi2017 Nolan & Fronzif CuO(111) DFT – GGA+U, PBE functional, PAW potentials
stenlid2017 Stenlid et al.
Cu2O(111) and (100) DFT-D3 – GGA+U, PBE functional, periodic slab models
CeO2
chen2007 Chen et al. CeO2(111) DFT – GGA+U, PW91 functional, PAW potentials
yildiz2012 Yildiz & Marrocchelli CeO2(111) DFT – GGA+U, PW91 functional, PAW potentials
mayernick2011 Janik et al. CeO2(111), CeO2(111) doped
with La or Tb DFT – GGA+U, PW91 functional, PAW potentials
kullgren2014 Hermansonn et al.g CeO2 (111) and (110) DFT – GGA+U, PBE functional, PAW potentials
MgO & Related Materials
bagheri2013 Bagheri & Moradi MgO nanotube DFT – B3LYP, 6-31G basis set
rodriguez2000 Maiti et al. MgO(100) and NiMgO(100)
DFT – GGA, norm-conserving and ultrasoft Vanderbilt pseudopotentials
rodriguez2000b Rodriguez et al. MgO(100) and CrxMg(1-
x)O(100) DFT – GGA, nonlocal ultrasoft pseudopotentials
schneider2001 Schneider et al.h MgO(001) DFT – GGA, PW91 functional, norm-conserving pseudopotentials, periodic supercell
xu2003 Zhang et al.i MgO(001) DFT – B3LYP, 6-311+G basis set
CaO
wilcox2008 Wilcox & Sasmazj CaO(100) DFT – GGA, PW91 functional, ultrasoft Vanderbilt pseudopotentials
wang2017 Wang et al.k CaO(100) doped with Li, Na,
K, Rb, or Cs DFT – GGA, PBE functional, ultrasoft Vanderbilt pseudopotentials
Al2O3 & Cr2O3
ionescu2002 Allouche et al. γ-Al2O3 (100) and (110D) DFT– GGA, PW91 functional, Kleinman-Bylander Pseudopotentials

185
References Authors Metal Oxide Method
arrouvel2004 Raybaud et al. γ-Al2O3 (110) DFT– GGA, PW91 functional, PAW potentials
rodriguez1998 Rodriguez et al. -Al2O3 (0001) and -Cr2O3
(0001)
ab initio SCF methods with cluster models, nonempirical effective core potentials (ECP’s),
double-ζ quality basis set augmented with polarization functions
nigussa2016 Nigussa et al. Cr2O3 (0001) DFT-D2 – GGA+U, PW91 functional, PAW potentials
rodriguez2000b Rodriguez et al. Cr2O3 (0001) DFT – GGA, nonlocal ultrasoft pseudopotentials
TiO2
abbasi2017 Abbasi & Sardroodi TiO2 nanoparticles (non-
doped and N-doped) DFT-D2 – GGA, PBE functional, numerical pseudo-atomic orbitals (PAOs)
janik2012 Janik et al.l TiO2 (Ce-doped) DFT – GGA+U, PW91 functional, PAW potentials
Fe2O3
song2013 Song et al. -Fe2O3 (0001) DFT – GGA+U, PBE functional, ultrasoft Vanderbilt pseudopotentials
lin2016 Lin et al. -Fe2O3 (0001) DFT – GGA+U, PBE functional, ultrasoft Vanderbilt pseudopotentials
NiO
wang2012 Wang et al. NiO (100) DFT – GGA+U, PBE functional, PAW potentials

186
Supplementary Information for Chapter 3
Table B-1: Results summary for sulfidation of samples of CuO-based sorbent at various pellet size, contact time, temperature, pressure and feed
concentration.
Run
No.
dp
(µm)
T
(K)
P
(atm)
C0
(ppm)
tc
(s)
L
(cm)
Q
(sccm)
qs
(wt.%)
qB&A
(wt.%)
Error (wt.%)
qcooper
(wt.%)
Error ±
(wt.%)
k·105
(s-1)
Error·105
(s-1)
kK
(s-1)
1/kK·102 (s)
1/krxn·102
(s)
1/kp ·102
(s)
1/kb·102
(s)
1 125 294 1.0 960 0.31 3.2 113 12.2 12.6 1.3 13.7 0.5 5.0 0.2 6.4 15.6 15.3 0.3 0.0
2 125 294 1.0 1000 0.35 7.1 227 12.0 12.0 1.8 12.9 0.7 6.6 0.3 6.9 14.6 14.3 0.3 0.0
3 125 294 1.0 1380 0.58 7.1 135 12.4 13.5 1.3 13.8 1.3 9.4 0.0 7.7 12.9 12.7 0.3 0.0
4 125 294 1.0 2200 0.62 6.4 113 12.5 13.8 1.7 14.0 0.2 11.0 0.1 6.4 15.6 14.5 1.1 0.0
6 125 294 1.0 980 0.71 7.1 110 12.4 13.0 1.5 13.7 0.4 6.6 0.2 5.0 19.9 19.6 0.3 0.0
7 180 294 1.0 990 0.35 3.7 114 12.3 12.5 1.3 13.6 0.5 5.0 0.2 5.5 18.3 17.7 0.6 0.0
8 180 294 1.0 1000 0.66 6.8 113 13.2 14.2 1.5 14.7 0.5 7.7 0.3 9.5 10.5 10.0 0.6 0.0
9 212 423 1.1 1000 0.09 1.3 101 39.2 48.3 4.2 51.3 2.0 13.9 0.5 44.0 2.3 1.6 0.6 0.0
10 212 323 1.0 970 0.22 1.9 87 16.9 16.9 3.2 18.3 1.0 12.0 0.7 15.2 6.6 5.8 0.7 0.0
12 212 383 1.0 1016 0.05 1.0 172 31.9 34.7 5.6 38.4 2.3 15.2 0.9 46.5 2.1 1.5 0.7 0.0
13 212 338 1.0 1016 0.06 1.1 172 23.3 28.1 4.8 30.0 2.7 10.0 0.9 18.0 5.6 4.8 0.7 0.0
14 212 368 1.0 1016 0.11 1.0 78 29.1 31.1 4.5 32.9 1.8 16.1 0.9 39.8 2.5 1.8 0.7 0.0
15 212 363 1.1 980 0.15 1.3 72 30.3 36.7 3.0 38.5 1.9 13.4 0.7 27.8 3.6 2.9 0.7 0.0
17 212 294 1.0 1000 0.70 7.0 110 12.5 13.2 0.9 13.6 0.2 10.6 0.2 11.5 8.7 7.9 0.8 0.0
18 500 294 1.0 1000 0.39 3.8 110 11.2 11.5 1.0 12.1 0.5 11.8 0.5 11.4 8.7 4.5 4.2 0.0
19 500 294 1.0 980 0.72 6.5 100 10.8 10.7 2.1 11.7 0.7 9.0 0.6 9.8 10.2 6.0 4.2 0.0
20 500 294 1.0 960 0.75 4.0 58 10.1 9.6 0.8 9.7 0.3 10.6 0.3 9.7 10.3 6.1 4.2 0.0
21 500 294 1.4 960 0.94 6.5 107 11.2 12.4 0.7 12.7 0.3 10.7 0.3 8.7 11.5 7.1 4.3 0.0
22 500 294 2.0 950 1.22 6.7 120 11.8 12.8 0.3 13.1 0.9 12.0 0.8 7.3 13.7 9.2 4.4 0.1
24 500 294 1.6 920 2.16 4.2 180 11.2 12.2 0.2 12.4 0.9 13.7 1.0 5.1 19.7 15.3 4.3 0.1
25 600 294 1.0 1090 0.76 2.1 164 10.3 11.2 0.4 11.4 0.9 12.4 1.0 13.0 7.7 1.5 6.1 0.1
26 800 294 1.0 1050 0.43 1.3 174 10.1 12.3 0.4 12.8 0.8 11.0 0.7 11.4 8.8 -0.9 9.6 0.1
27 800 294 1.0 1050 0.76 2.2 174 9.5 11.6 0.3 11.9 0.7 11.2 0.7 10.1 9.9 0.2 9.6 0.1
28 800 294 1.0 1050 1.06 3.1 174 9.7 11.8 0.3 12.0 0.6 11.2 0.6 10.5 9.5 -0.1 9.6 0.1
29 1000 294 1.0 980 1.40 4.3 180 9.7 12.2 0.8 12.5 0.9 17.8 1.3 6.5 15.3 0.6 14.6 0.1

187
Supplementary Information for Chapter 4
Table C-1: Physiochemical properties and synthesis procedures of CuO sorbents prepared via sol-gel, precipitation and hydrolysis. [a] Based on
XRD. [b] Based on BET. [c] Based on BJH method.
Sample
ID
Synthesis
Method Precursors
Synthesis/Processing
Conditions Thermal Treatment
Crystallite
Size (nm)[a]
SBET
(m2g-1)[b]
Vpore
(cm3g-1)[c]
NP-1
Sol-gel Cu(Ac)2·3(H2O),
NaOH, CH3COOH
Vacuum filtration Dried at 313 K for 8 h 5 14.5 0.040
NP-2 Vacuum filtration Dried at 313 K for 8 h,
then treated at 623 K for 4 h 18 - -
NP-3 Vacuum filtration Dried at 313 K for 8 h,
then treated at 823 K for 4 h 26 - -
NP-4 Vacuum filtration Dried at 313 K for 8 h,
then treated at 1023 K for 4 h 53 - -
NP-5 Centrifuging Dried at 313 K for 8 h 9 - -
NP-6 Centrifuging Dried at 313 K for 8 h 11 - -
NP-7 Precipitation Cu(NO3)2·3(H2O),
NaOH Vacuum filtration
Dried at 353 K for 14 h,
then treated at 773 K for 4 h 18 58.8 0.181
NB-1 Precipitation Cu(NO3)2·3(H2O),
NaOH
Aged for 72 h, vacuum
filtration
Dried at 333 K for 12 h,
then treated at 623 for 4 h 33 6.18 0.02
FP-1 Hydrolysis Cu(Ac)2·3(H2O) Synthesized at 373 for 45
minutes Dried at 353 K for 12 h 10 - -
FP-2 Precipitation Cu(NO3)2·3(H2O), Synthesized at 353 for 8 h Dried at 353 K for 12 h 13 - -
FP-3 Precipitation Cu(NO3)2·3(H2O) Synthesized at 376 for 24 h dried at 353 K for 12 h 19 59.1 0.079

188
Table C-2: Physiochemical properties and synthesis procedures of CuO sorbents prepared via hydrothermal treatment, and electrospinning. [a]
Based on XRD. [b] Based on BET. [c] Based on BJH method. *weight ratio of polymer used to salt precursor.
Sample
ID
Synthesis
Method
Precursors
(Polymer: Salt)*
Synthesis / Processing
Conditions Thermal Treatment
Crystallite
Size (nm)[a]
SBET
(m2g-1)[b]
Vpore
(cm3g-1)[c]
NPC-1
Hydrothermal
CuO (NP-7), P123 (1:1)
Hydrothermal at 383 K
for 24 h
Dried at 353 K for 12 h,
then treated at 823 K for 4 h
Dried at 353 K
21 - -
NPC-2 CuO (NP-7), PVP (MW=1,300,000) (1:1) 24 17.4 0.05
NPC-3 CuO (NP-7), PVP (MW=1,300,000) (1:9) 18 - -
NPC-4 CuO (NP-7), PVP (MW=1,300,000) (2:7) 22 - -
NPC-5 CuO (NP-7), PVP (MW=1,300,000) (2:3) 22 - -
NF-1
Electrospinning
PEO (MW=300,000), EtOH,
Cu(NO3)2·3(H2O) (2.7:1)
14 inches, 30 kV, 1.0
cm3/h
Treated at 823 K for 4 h at a
ramping rate of 1 K/min 14 - -
NF-2 PVP (1,300,000), EtOH,
Cu(NO3)2·3(H2O) (10:1)
15 inches, 35 kV, 5.0
cm3/h
Treated at 898 K for 10 h at
a ramping rate of 0.4 K/min 24 - -
NF-3 PVP (40,000), EtOH,
Cu(NO3)2·3(H2O) (2.5:1)
18 inches, 30 kV, 1.0
cm3/h
Treated at 823 K for 4 h at a
ramping rate of 1 K/min 25 - -
NF-4 PVP (1,300,000), EtOH,
Cu(NO3)2·3(H2O) (1:1)
6 inches, 20 kV, 1.0
cm3/h
Treated at 773 K for 2 h at a
ramping rate of 2 K/min 40 - -
NF-5 PVP (1,300,000), MeOH,
Cu(NO3)2·3(H2O) (1:1)
18 inches, 30 kV, 1.0
cm3/h
Treated at 823 K for 4 h at a
ramping rate of 2 K/min 74 - -
NF-6 PVP (1,300,000), EtOH,
Cu(NO3)2·3(H2O) (1:1)
22 inches, 30 kV, 1.0
cm3/h
Treated at 823 K for 4 h at a
ramping rate of 2 K/min 66 2.79 0.002

189
Supplementary Information for Chapter 5
Table D-1: Summary of the EXAFS fit parameters[a] characterizing the initial CuO samples. The
EXAFS data was collected at room temperature in flowing helium.
Sample Absorber-Backscatter
Scattering Path N
103 x σ2
(Å2)
R
(Å)
ΔE0
(eV)
k-range
(Å-1)
R-range
(Å)
CuO-1
Cu-O 2.7 ± 0.3 1.8 ± 1.7 1.96 ± 0.01
1.7 ± 1.7 3.0-11.0 1.1-3.2
Cu-O 1.3 ± 0.2 1.8 ± 1.7 2.82 ± 0.08
Cu-Cu 2.7 ± 0.3 6.7 ± 6.2 2.96 ± 0.03
Cu-Cu 2.7 ± 0.3 6.7 ± 6.2 3.16 ± 0.05
Cu-Cu 1.3 ± 0.2 6.7 ± 6.2 3.38 ± 0.08
CuO-2
Cu-O 3.4 ± 4.3 2.2 ± 14.6 1.96 ± 0.10
7.1 ± 13.0 3.0-11.0 0.9-3.2
Cu-O 1.7 ± 2.2 2.3 ± 14.6 2.78 ± 0.57
Cu-Cu 3.4 ± 4.3 4.2 ± 17.8 2.90 ± 0.21
Cu-Cu 3.4 ± 4.3 4.2 ± 17.8 3.08 ± 0.23
Cu-Cu 1.7 ± 2.2 4.2 ± 17.8 3.17 ± 0.28
[a] Notation: S02, amplitude reduction factor, N, coordination number, σ2, disorder term (Debye-
Waller factor), R, distance between absorber and backscatter, ΔE0, energy correction term.

190
Figure D-1: EXAFS data and best-fit model characterizing the initial state of the commercial
CuO sample, CuO-1. Spectra were collected at room temperature in flowing helium. Top: k2-
weighted magnitude and imaginary part of the Fourier transform of the data (black line) and fit
(red line). Bottom: k2-weighted EXAFS function of the data (black line) and fit (red line). The
green line in both plots represents the window used to determine the number if independent
parameters.

191
Figure D-2: EXAFS data and best-fit model characterizing the initial state of the CuO
nanoparticle sample, CuO-2. Spectra were collected at room temperature in flowing helium.
Top: k2-weighted magnitude and imaginary part of the Fourier transform of the data (black line)
and fit (red line). Bottom: k2-weighted EXAFS function of the data (black line) and fit (red
line). The green line in both plots represents the window used to determine the number if
independent parameters.

192
Supplementary Information for Chapter 6
Table E-1: Summary of the Cu K-edge EXAFS fits demonstrating the effect of crystallite size on
EXAFS fitting parameters for different CuO sorbents. The EXAFS data were collected at room
temperature in flowing helium.
Sample Absorber-Backscatter
Scattering Path N
103 x σ2
(Å2)
R
(Å)
ΔE0
(eV)
k-range
(Å-1)
R-range
(Å)
CuO-2
(7 nm)
Cu-O 2.5 ± 1.0 1.8 ± 5.4 1.95 ± 0.04
0.3 ± 6.1 3.0-11.3 1.0-3.2
Cu-O 1.2 ± 0.5 1.8 ± 5.4 2.75 ± 0.08
Cu-Cu 2.5 ± 1.0 4.6 ± 8.0 2.95 ± 0.05
Cu-Cu 2.5 ± 1.0 4.6 ± 8.0 3.14 ± 0.07
Cu-Cu 1.2 ± 0.5 4.6 ± 8.0 3.36 ± 0.09
CuO-3
(11 nm)
Cu-O 3.2 ± 0.4 3.0 ± 1.7 1.95 ± 0.01
-1.2 ± 1.9 3.0-11.3 1.0-3.2
Cu-O 1.6 ± 0.2 3.0 ± 1.7 2.75 ± 0.08
Cu-Cu 3.2 ± 0.4 4.4 ± 3.0 2.90 ± 0.03
Cu-Cu 3.2 ± 0.4 4.4 ± 3.0 3.06 ± 0.03
Cu-Cu 1.6 ± 0.2 4.4 ± 3.0 3.18 ± 0.04
CuO-4
(23 nm)
Cu-O 4.0 ± 0.6 3.6 ± 1.7 1.95 ± 0.01
-0.4 ± 1.5 3.0-11.3 1.0-3.2
Cu-O 2.0 ± 0.3 3.6 ± 1.7 2.72 ± 0.06
Cu-Cu 4.0 ± 0.6 4.3 ± 1.8 2.89 ± 0.02
Cu-Cu 4.0 ± 0.6 4.3 ± 1.8 3.04 ± 0.02
Cu-Cu 2.0 ± 0.3 4.3 ± 1.8 3.16 ± 0.03
CuO-5
(40 nm)
Cu-O 5.4 ± 0.5 3.6 ± 1.4 1.95 ± 0.01
-0.5 ± 1.4 3.0-11.3 1.0-3.2
Cu-O 2.7 ± 0.2 3.6 ± 1.4 2.70 ± 0.05
Cu-Cu 5.4 ± 0.5 4.0 ± 1.4 2.89 ± 0.02
Cu-Cu 5.4 ± 0.5 4.0 ± 1.4 3.04 ± 0.02
Cu-Cu 2.7 ± 0.2 4.0 ± 1.4 3.15 ± 0.02
Bulk CuO
Cu-O 4 3.0 ± 1.0 1.95 ± 0.01
7.9 ± 1.0 3-11.3 1.0-3.2
Cu-O 2 3.0 ± 1.0 2.77 ± 0.05
Cu-Cu 4 5.0 ± 2.0 2.91 ± 0.01
Cu-Cu 4 5.0 ± 2.0 3.10 ± 0.01
Cu-Cu 2 3.0 ± 1.0 3.16 ± 0.01

193
Table E-2: Summary of the Cu K-edge EXAFS fits characterizing the effect of temperature on CuO
sulfidation products. The EXAFS data were collected for spent samples at room temperature in flowing
helium, after sulfidation with 1000 ppm-vol H2S/He. [a]Represents the coordination number of Cu-S
without size and conversion effects.
Sample Scattering
Path N
103 x σ2
(Å2)
R
(Å)
ΔE0
(eV)
Cu-S[a]
CN
k-range
(Å-1)
R-range
(Å)
Fresh
CuO-1
Cu-O 3.0 ± 0.4 3.0 ± 2.1 1.95 ± 0.02
6.7 ± 1.9 0 3.0-11.3 1.0-3.22
Cu-O 1.5 ± 0.2 3.0 ± 2.1 2.75 ± 0.08
Cu-Cu 3.0 ± 0.4 5.3 ± 3.5 2.95 ± 0.05
Cu-Cu 3.0 ± 0.4 5.3 ± 3.5 3.14 ± 0.07
Cu-Cu 1.5 ± 0.2 5.3 ± 3.5 3.36 ± 0.09
Spent at
323 K
Cu-O 2.3 3.0 1.95 8.0 ± 0.8 3.4 ± 1.2 3.0-11.3 1.0-2.4
Cu-S 1.5 ± 0.5 9.0 ± 5.6 2.30 ± 0.02
Spent at
353 K
Cu-O 0.3 3.0 1.95 5.0 ± 0.8 3.8 ± 0.3 3.0-11.3 1.0-2.4
Cu-S 3.3 ± 0.1 10.3 ± 1.2 2.27 ± 0.01
Spent at
383 K
Cu-S 3.4 ± 0.4 9.4 ± 1.6 2.26 ± 0.01 4.3 ± 1.1 3.7 3.0-11.3 1.0-3.3
Cu-Cu 3.7 ± 0.4 20.5 ± 5.4 3.34 ± 0.04
CuS
reference
Cu-S 2.4 ± 0.3 8.2 ± 1.6 2.26 ± 0.01 4.4 ± 1.2 3.7 3.0-11.3 1.0-3.4
Cu-Cu 2.6 ± 0.3 20.1 ± 6.1 3.34 ± 0.04

194
Figure E-1: EXAFS data and best-fit model characterizing the lab-synthesized CuO-2 sorbent (7 nm
crystallite size). Spectra were collected at room temperature in flowing helium. Top: magnitude and
imaginary part of the Fourier transform of the data (red lines) and fit (black line). Bottom: k2-weighted
EXAFS function of the data (green line) and fit (black line). The yellow line in both plots represents the
window used to determine the number if independent parameters.

195
Figure E-2: EXAFS data and best-fit model characterizing the lab-synthesized CuO-3 sorbent (11 nm
crystallite size). Spectra were collected at room temperature in flowing helium. Top: magnitude and
imaginary part of the Fourier transform of the data (red lines) and fit (black line). Bottom: k2-weighted
EXAFS function of the data (green line) and fit (black line). The yellow line in both plots represents the
window used to determine the number if independent parameters.

196
Figure E-3. EXAFS data and best-fit model characterizing the lab-synthesized CuO-4 sorbent (23 nm
crystallite size). Spectra were collected at room temperature in flowing helium. Top: magnitude and
imaginary part of the Fourier transform of the data (red lines) and fit (black line). Bottom: k2-weighted
EXAFS function of the data (green line) and fit (black line). The yellow line in both plots represents the
window used to determine the number if independent parameters.

197
Figure E-4: EXAFS data and best-fit model characterizing the lab-synthesized CuO-5 sorbent (40 nm
crystallite size). Spectra were collected at room temperature in flowing helium. Top: magnitude and
imaginary part of the Fourier transform of the data (red lines) and fit (black line). Bottom: k2-weighted
EXAFS function of the data (green line) and fit (black line). The yellow line in both plots represents the
window used to determine the number if independent parameters.

198
Figure E-5: EXAFS data and best-fit model characterizing spent CuO sample, CuO-1 at 323 K with
1000 ppm-vol H2S/He. Spectra were collected at room temperature in flowing helium. Top: magnitude
and imaginary part of the Fourier transform of the data (red line) and fit (black line). Bottom: k2-
weighted EXAFS function of the data (green line) and fit (black line). The yellow line in both plots
represents the window used to determine the number if independent parameters.

199
Figure E-6: EXAFS data and best-fit model characterizing spent CuO sample, CuO-1 at 353 K with
1000 ppm-vol H2S/He. Spectra were collected at room temperature in flowing helium. Top: magnitude
and imaginary part of the Fourier transform of the data (red line) and fit (black line). Bottom: k2-
weighted EXAFS function of the data (green line) and fit (black line). The yellow line in both plots
represents the window used to determine the number if independent parameters.

200
Figure E-7: EXAFS data and best-fit model characterizing spent CuO sample, CuO-1 at 383 K with
1000 ppm-vol H2S/He. Spectra were collected at room temperature in flowing helium. Top: magnitude
and imaginary part of the Fourier transform of the data (red line) and fit (black line). Bottom: k2-
weighted EXAFS function of the data (green line) and fit (black line). The yellow line in both plots
represents the window used to determine the number if independent parameters.

201
Figure E-8: EXAFS data and best-fit model characterizing CuS reference sample at room temperature
in flowing helium. Top: magnitude and imaginary part of the Fourier transform of the data (red line)
and fit (black line). Bottom: k2-weighted EXAFS function of the data (green line) and fit (black line).
The yellow line in both plots represents the window used to determine the number if independent
parameters.

202
Supplementary Information for Chapter 7
Table F-1: Summary of the EXAFS fit parameters[a] characterizing the fresh CuO-La samples. The
EXAFS data were collected at room temperature in flowing helium.
[a] Notation: S02, amplitude reduction factor, CN, coordination number, σ2, disorder term
(Debye-Waller factor), R, distance between absorber and backscatter, ΔE0, energy correction
term.
Sample Absorber-Backscatter
Scattering Path CN
103 x σ
2
(Å2)
R
(Å)
ΔE0
(eV)
k-range
(Å-1
)
R-range
(Å)
CuO-La-1
Cu-O 3.3 ± 0.3 2.7 ± 1.7 1.95 ± 0.01
7.65 ± 1.0 3.0-12.0 1.0-3.2 Cu-O 1.7 ± 0.2 2.7 ± 1.7 2.79 ± 0.08
Cu-Cu 3.3 ± 0.3 6.6 ± 6.2 2.94 ± 0.03
Cu-Cu 3.3 ± 0.3 6.6 ± 6.2 3.12 ± 0.05
CuO-La-2
Cu-O 3.5 ± 0.1 3.2 ± 0.6 1.95 ± 0.01
7.80 ±
0.47 2.8-13.3 1.0-3.2
Cu-O 1.7 ± 0.1 3.2 ± 0.6 2.77 ± 0.02
Cu-Cu 3.5 ± 0.1 5.0 ± 0.6 2.92 ± 0.01
Cu-Cu 3.5 ± 0.1 5.0 ± 0.6 3.11 ± 0.01
CuO-1
Cu-O 3.6 ± 0.5 4.8 ± 2.1 1.93 ± 0.01
7.35 ±
1.36 3.0-11.0 1.0-3.2
Cu-O 1.8 ± 0.2 4.8 ± 2.1 2.56 ± 0.04
Cu-Cu 3.6 ± 0.5 11.9 ± 6.1 2.85 ± 0.04
Cu-Cu 3.6 ± 0.5 11.9 ± 6.1 2.95 ± 0.05

203
Figure F-1: EXAFS data and best-fit model characterizing the initial state of commercial CuO sample,
CuO-1. Spectra were collected at room temperature in flowing helium. Top: magnitude and imaginary
part of the Fourier transform of the data (green line) and fit (black line). Bottom: k2-weighted EXAFS
function of the data (green line) and fit (black line). The yellow line in both plots represents the window
used to determine the number if independent parameters.

204
Figure F-2: EXAFS data and best-fit model characterizing the initial state of the sol-gel lanthanum-
doped CuO sample, CuO-La-1. Spectra were collected at room temperature in flowing helium. Top:
magnitude and imaginary part of the Fourier transform of the data (red line) and fit (black line). Bottom:
k2-weighted EXAFS function of the data (blue line) and fit (black line). The yellow line in both plots
represents the window used to determine the number if independent parameters.

205
Figure F-3: EXAFS data and best-fit model characterizing the initial state of the ammonium co-
precipitation lanthanum-doped CuO sample, CuO-La-2. Spectra were collected at room temperature in
flowing helium. Top: magnitude and imaginary part of the Fourier transform of the data (red line) and
fit (black line). Bottom: k2-weighted EXAFS function of the data (red line) and fit (black line). The
yellow line in both plots represents the window used to determine the number if independent parameters.

206
Bibliography
(1) Eckersley, N. Advanced Mercury Removal Technologies. Energy Process. Can. 2013,
45 (6), 16–19.
(2) Hayes, M.; Åkerlindh, K. Combating the Threat of Mercury. PTQ gas 2012, 55–55.
(3) Kidnay, A. J.; Parrish, W. Fundamentals of Natural Gas Processing; CRC Press: Boca
Raton, 2006.
(4) Wilhelm, S. M.; National Risk Management Research Laboratory (U.S.). Mercury in
Petroleum and Natural Gas--Estimation of Emissions from Production, Processing, and
Combustion; U.S. Environmental Protection Agency, National Risk Management
Research Laboratory: Research Triangle Park, NC, 2001.
(5) Song, C.; Ma, X. New Design Approaches to Ultra-Clean Diesel Fuels by Deep
Desulfurization and Deep Dearomatization. APCATB Appl. Catal. B Environ. 2003, 41
(1), 207–238.
(6) Wilhelm SM. Estimate of Mercury Emissions to the Atmosphere from Petroleum.
Environ. Sci. Technol. 2001, 35 (24), 4704–4710.
(7) Ruthven, D. M. Principles of Adsorption and Adsorption Processes; Wiley: New York,
1984.
(8) Samokhvalov, A.; Tatarchuk, B. Review of Experimental Characterization of Active
Sites and Determination of Molecular Mechanisms of Adsorption, Desorption and
Regeneration of the Deep and Ultradeep Desulfurization Sorbents for Liquid Fuels.
Catal. Rev. 2010, 52 (3), 381–410.
(9) Samokhvalov A; Tatarchuk BJ. Characterization of Active Sites, Determination of
Mechanisms of H2S, COS and CS2 Sorption and Regeneration of ZnO Low-Temperature
Sorbents: Past, Current and Perspectives. Phys. Chem. Chem. Phys. PCCP 2011, 13 (8),
3197–3209.
(10) Xue, M.; Chitrakar, R.; Sakane, K.; Ooi, K. Screening of Adsorbents for Removal of H2S
at Room Temperature. Green Chem. 2003, 5 (5), 529–534.
https://doi.org/10.1039/B303167P.
(11) Westmoreland, P. R.; Gibson, J. B.; Harrison, D. P. Comparative Kinetics of High-
Temperature Reaction between Hydrogen Sulfide and Selected Metal Oxides. Environ.
Sci. Technol. 1977, 11 (5), 488–491. https://doi.org/10.1021/es60128a007.
(12) Westmoreland, P. R.; Harrison, D. P. Evaluation of Candidate Solids for High-
Temperature Desulfurization of Low-Btu Gases. Environ. Sci. Technol. 1976, 10 (7),
659–661. https://doi.org/10.1021/es60118a010.
(13) Ramachandran, P. A.; Doraiswamy, L. K. Modeling of Noncatalytic Gas‐solid
Reactions. AIChE J. 1982, 28 (6), 881–900. https://doi.org/10.1002/aic.690280602.

207
(14) Gibson, J. B.; Harrison, D. P. The Reaction between Hydrogen Sulfide and Spherical
Pellets of Zinc Oxide. Ind. Eng. Chem. Process Des. Dev. 1980, 19 (2), 231–237.
https://doi.org/10.1021/i260074a005.
(15) Parandin, M. S.; Rashidi, H. Deep Desulfurization of Natural Gas by a Commercial ZnO
Adsorbent: A Mathematical Study for Fixed-Bed Reactors. J. Nat. Gas Sci. Eng. 2018,
59 (January), 116–123. https://doi.org/10.1016/j.jngse.2018.08.030.
(16) Azzam, S.; Simonetti, D. A. Linear Driving Force Approximations as Predictive Models
for Reactive Sorption. Energy Technol. 2019, 1900718, 1–9.
https://doi.org/10.1002/ente.201900718.
(17) Huang, J.; Zhao, J.; Wei, X.; Wang, Y.; Bu, X. Kinetic Studies on the Sulfidation and
Regeneration of Zinc Titanate Desulfurization Sorbent. Powder Technol. 2008, 180 (1–
2), 196–202. https://doi.org/10.1016/j.powtec.2007.07.033.
(18) Ramachandran, P. A.; Smith, J. M. A Single‐pore Model for Gas‐solid Noncatalytic
Reactions. AIChE J. 1977, 23 (3), 353–361. https://doi.org/10.1002/aic.690230320.
(19) Bhatia, S. K.; D., PerlmutterD. A Rondom Pore Model for Fluid-Solid Reactions: I.
Isothermal , Kinetic Control. AIChE J. 1980, 26 (3), 379–386.
(20) Bhatia, S. K.; D., Perlmutter D. A Random Pore Model for Fluid-Solid Reactions: II.
Diffusion and Transport Effects. AIChE J. 1981, 27 (2), 247–254.
(21) Sotirchos, S. V.; Zarkanitis, S. A Distributed Pore Size and Length Model for Porous
Media Reacting with Diminishing Porosity. Chem. Eng. Sci. 1993, 48 (8), 1487–1502.
https://doi.org/10.1016/0009-2509(93)80054-T.
(22) Monazam, E. R.; Shadle, L. J.; Berry, D. A. Modeling and Analysis of S-Sorption with
ZnO in a Transport Reactor. Chem. Eng. Sci. 2008, 63 (10), 2614–2623.
https://doi.org/10.1016/j.ces.2008.01.035.
(23) Hartman, M.; Coughlin, R. W. Reaction of Sulfur Dioxide with Limestone and the Grain
Model. AIChE J. 1976, 22 (3), 490–498. https://doi.org/10.1002/aic.690220312.
(24) Bhatia, S. K.; Perlmutter, D. D. The Effect of Pore Structure on Fluid-Solid Reactions:
Application to the Lime Reaction. AIChE J. 1981, 27 (2), 226–234.
https://doi.org/10.1002/aic.690270209.
(25) Borgwardt, R. H. Kinetics of the Reaction of SO2 with Calcined Limestone. Environ. Sci.
Technol. 1970, 4 (1), 59–63. https://doi.org/10.1021/es60036a001.
(26) Sohn, H. Y.; Szekely, J. A Structural Model for Gas-Solid Reactions with a Moving
Boundary—III. Chem. Eng. Sci. 1972, 27 (4), 763–778. https://doi.org/10.1016/0009-
2509(72)85011-5.
(27) Ramachandran, P. A.; Doraiswamy, L. K. Modeling of Noncatalytic Gas-Solid
Reactions. AIChE J. 1982, 28 (6), 881–900. https://doi.org/10.1002/aic.690280602.

208
(28) Hoffman, A. S.; Azzam, S.; Zhang, K.; Xu, Y.; Liu, Y.; Bare, S. R.; Simonetti, D. A.
Direct Observation of the Kinetics of Gas–Solid Reactions Using in Situ Kinetic and
Spectroscopic Techniques. React. Chem. Eng. 2018, 3 (5), 668–675.
https://doi.org/10.1039/C8RE00020D.
(29) Bohart, G. S.; Adams, E. Q. Some Aspects of the Behavior of Charcoal with Respect to
Chlorine. J. Am. Chem. Soc. 1920, 42 (3), 523–544.
https://doi.org/10.1021/ja01448a018.
(30) Cooper, R. S. Slow Particle Diffusion in Ion Exchange Columns. Ind. Eng. Chem.
Fundam. 1965, 4 (3), 308–313. https://doi.org/10.1021/i160015a012.
(31) Yoshida, H.; Kataoka, T.; Ruthven, D. M. Analytical Solution of the Breakthrough Curve
for Rectangular Isotherm Systems. Chem. Eng. Sci. 1984, 39 (10), 1489–1497.
https://doi.org/10.1016/0009-2509(84)80007-X.
(32) Knox, J. C.; Ebner, A. D.; Levan, M. D.; Coker, R. F.; Ritter, J. A. Limitations of
Breakthrough Curve Analysis in Fixed-Bed Adsorption. Ind. Eng. Chem. Res. 2016, 55
(16), 4734–4748. https://doi.org/10.1021/acs.iecr.6b00516.
(33) Cheah, S.; Carpenter, D. L.; Magrini-Bair, K. A. Review of Mid- to High-Temperature
Sulfur Sorbents for Desulfurization of Biomass- and Coal-Derived Syngas. Energy Fuels
2009, 23 (11), 5291–5307. https://doi.org/10.1021/ef900714q.
(34) Shah, M. S.; Tsapatsis, M.; Siepmann, J. I. Hydrogen Sulfide Capture: From Absorption
in Polar Liquids to Oxide, Zeolite, and Metal–Organic Framework Adsorbents and
Membranes. Chem. Rev. 2017, 117 (14), 9755–9803.
https://doi.org/10.1021/acs.chemrev.7b00095.
(35) Vamvuka, D.; Arvanitidis, C.; Zachariadis, D. Flue Gas Desulfurization at High
Temperatures: A Review. Environ. Eng. Sci. 2004, 21 (4), 525–548.
https://doi.org/10.1089/1092875041358557.
(36) Yasyerli, S.; Dogu, G.; Ar, I.; Dogu, T. Activities of Copper Oxide and Cu−V and
Cu−Mo Mixed Oxides for H2S Removal in the Presence and Absence of Hydrogen and
Predictions of a Deactivation Model. Ind. Eng. Chem. Res. 2001, 40 (23), 5206–5214.
https://doi.org/10.1021/ie0010621.
(37) Azzam, S. A.; Alshafei, F. H.; López-Ausens, T.; Ghosh, R.; Biswas, A. N.; Sautet, P.;
Prikhodko, S.; Simonetti, D. A. Effects of Morphology and Surface Properties of Copper
Oxide on the Removal of Hydrogen Sulfide from Gaseous Streams. Ind. Eng. Chem. Res.
2019, 58 (40), 18836–18847. https://doi.org/10.1021/acs.iecr.9b03975.
(38) Rosso, I.; Galletti, C.; Bizzi, M.; Saracco, G.; Specchia, V. Zinc Oxide Sorbents for the
Removal of Hydrogen Sulfide from Syngas. Ind. Eng. Chem. Res. 2003, 42 (8), 1688–
1697. https://doi.org/10.1021/ie0208467.
(39) Lew, S.; Jothimurugesan, K.; Flytzani-Stephanopoulos, M. High-Temperature Hydrogen
Sulfide Removal from Fuel Gases by Regenerable Zinc Oxide-Titanium Dioxide

209
Sorbents. Ind. Eng. Chem. Res. 1989, 28 (5), 535–541.
https://doi.org/10.1021/ie00089a006.
(40) Chung, J. B.; Chung, J. S. Desulfurization of H2S Using Cobalt-Containing Sorbents at
Low Temperatures. Chem. Eng. Sci. 2005, 60 (6), 1515–1523.
https://doi.org/10.1016/j.ces.2004.11.002.
(41) Flytzani-Stephanopoulos, M.; Sakbodin, M.; Wang, Z. Regenerative Adsorption and
Removal of H2S from Hot Fuel Gas Streams by Rare Earth Oxides. Science 2006, 312
(5779), 1508. https://doi.org/10.1126/science.1125684.
(42) Wang, Z.; Flytzani-Stephanopoulos, M. Cerium Oxide-Based Sorbents for Regenerative
Hot Reformate Gas Desulfurization. Energy Fuels 2005, 19 (5), 2089–2097.
https://doi.org/10.1021/ef049664a.
(43) Guo, B.; Li, S.; Tian, Y. Performance of Cerium Oxides from Different Preparation
Methods for Desulfurizing Hot Coal Gas. ACS Omega 2019, 4 (5), 9301–9305.
https://doi.org/10.1021/acsomega.9b00247.
(44) Wang, J.; Wang, L.; Fan, H.; Wang, H.; Hu, Y.; Wang, Z. Highly Porous Copper Oxide
Sorbent for H2S Capture at Ambient Temperature. Fuel 2017, 209, 329–338.
https://doi.org/10.1016/j.fuel.2017.08.003.
(45) Wang, X.; Sun, T.; Yang, J.; Zhao, L.; Jia, J. Low-Temperature H2S Removal from Gas
Streams with SBA-15 Supported ZnO Nanoparticles. Chem. Eng. J. 2008, 142 (1), 48–
55. https://doi.org/10.1016/j.cej.2007.11.013.
(46) Dhage, P.; Samokhvalov, A.; Repala, D.; Duin, E. C.; Bowman, M.; Tatarchuk, B. J.
Copper-Promoted ZnO/SiO2 Regenerable Sorbents for the Room Temperature Removal
of H2S from Reformate Gas Streams. Ind. Eng. Chem. Res. 2010, 49 (18), 8388–8396.
https://doi.org/10.1021/ie100209a.
(47) Li, F.; Yang, G. H.; Lei, T.; Yang, S. Y.; Wang, Y. H.; Wang, Y.; Jia, L. P. Preparation
of Nano-Copper Oxide and Removal of Hydrogen Sulfide under Room Temperature.
Appl. Mech. Mater. 2014, 448–453, 583–588.
https://doi.org/10.4028/www.scientific.net/AMM.448-453.583.
(48) Patrick, V.; Gavalas, G. R.; Flytzani-Stephanopoulos, M.; Jothimurugesan, K. High-
Temperature Sulfidation-Regeneration of Copper(II) Oxide-Alumina Sorbents. Ind. Eng.
Chem. Res. 1989, 28 (7), 931–940. https://doi.org/10.1021/ie00091a008.
(49) Christoforou, S. C.; Efthimiadis, E. A.; Vasalos, I. A. Sulfidation of Mixed Metal Oxides
in a Fluidized-Bed Reactor. Ind. Eng. Chem. Res. 1995, 34 (1), 83–93.
https://doi.org/10.1021/ie00040a006.
(50) Slimane, R. B.; Abbasian, J. Regenerable Mixed Metal Oxide Sorbents for Coal Gas
Desulfurization at Moderate Temperatures. Adv. Environ. Res. 2000, 4 (2), 147–162.
https://doi.org/10.1016/S1093-0191(00)00017-4.

210
(51) Valsamakis, I.; Si, R.; Flytzani-Stephanopoulos, M. Stability of Lanthanum Oxide-Based
H2S Sorbents in Realistic Fuel Processor/Fuel Cell Operation. J. Power Sources 2010,
195 (9), 2815–2822. https://doi.org/10.1016/j.jpowsour.2009.11.047.
(52) Huang, G.; He, E.; Wang, Z.; Fan, H.; Shangguan, J.; Croiset, E.; Chen, Z. Synthesis and
Characterization of γ-Fe2O3 for H2S Removal at Low Temperature. Ind. Eng. Chem.
Res. 2015, 54 (34), 8469–8478. https://doi.org/10.1021/acs.iecr.5b01398.
(53) Förster, H.; Schuldt, M. Infrared Spectroscopic Study of the Adsorption of Hydrogen
Sulfide on Zeolites NaA and NaCaA. J. Colloid Interface Sci. 1975, 52 (2), 380–385.
https://doi.org/10.1016/0021-9797(75)90213-1.
(54) Karge, H. G.; Raskó, J. Hydrogen Sulfide Adsorption on Faujasite-Type Zeolites with
Systematically Varied Si-Al Ratios. J. Colloid Interface Sci. 1978, 64 (3), 522–532.
https://doi.org/10.1016/0021-9797(78)90394-6.
(55) Karge, H. G.; Ziółek, M.; Łaniecki, M. U.v./Vis and i.r. Spectroscopic Study of
Hydrogen Sulphide Adsorption on Faujasite-Type Zeolites. Zeolites 1987, 7 (3), 197–
202. https://doi.org/10.1016/0144-2449(87)90050-9.
(56) Howard, J.; Kadir, Z. A. The Adsorption of H2S on Some Transition Metal Exchanged
Zeolites: An Infrared Study. Spectrochim. Acta Part Mol. Spectrosc. 1985, 41 (6), 825–
831. https://doi.org/10.1016/0584-8539(85)80028-3.
(57) Garcia, C. L.; Lercher, J. A. Adsorption of Hydrogen Sulfide on ZSM 5 Zeolites. J. Phys.
Chem. 1992, 96 (5), 2230–2235. https://doi.org/10.1021/j100184a038.
(58) Crespo, D.; Qi, G.; Wang, Y.; Yang, F. H.; Yang, R. T. Superior Sorbent for Natural Gas
Desulfurization. Ind. Eng. Chem. Res. 2008, 47 (4), 1238–1244.
https://doi.org/10.1021/ie071145i.
(59) Hutson, N. D.; Reisner, B. A.; Yang, R. T.; Toby, B. H. Silver Ion-Exchanged Zeolites
Y, X, and Low-Silica X: Observations of Thermally Induced Cation/Cluster Migration
and the Resulting Effects on the Equilibrium Adsorption of Nitrogen. Chem. Mater.
2000, 12 (10), 3020–3031. https://doi.org/10.1021/cm000294n.
(60) Kumar, P.; Sung, C.-Y.; Muraza, O.; Cococcioni, M.; Al Hashimi, S.; McCormick, A.;
Tsapatsis, M. H2S Adsorption by Ag and Cu Ion Exchanged Faujasites. Spec. Issue -
Corma60 2011, 146 (1), 127–133. https://doi.org/10.1016/j.micromeso.2011.05.014.
(61) Liu, T.; First, E. L.; Faruque Hasan, M. M.; Floudas, C. A. A Multi-Scale Approach for
the Discovery of Zeolites for Hydrogen Sulfide Removal. 12th Int. Symp. Process Syst.
Eng. 25th Eur. Symp. Comput. Aided Process Eng. PSE-2015ESCAPE-25 31 May - 4
June 2015 Cph. Den. 2016, 91, 206–218.
https://doi.org/10.1016/j.compchemeng.2016.03.015.
(62) Maghsoudi, H.; Soltanieh, M.; Bozorgzadeh, H.; Mohamadalizadeh, A. Adsorption
Isotherms and Ideal Selectivities of Hydrogen Sulfide and Carbon Dioxide over Methane
for the Si-CHA Zeolite: Comparison of Carbon Dioxide and Methane Adsorption with

211
the All-Silica DD3R Zeolite. Adsorption 2013, 19 (5), 1045–1053.
https://doi.org/10.1007/s10450-013-9528-1.
(63) Hamon, L.; Serre, C.; Devic, T.; Loiseau, T.; Millange, F.; Férey, G.; Weireld, G. D.
Comparative Study of Hydrogen Sulfide Adsorption in the MIL-53(Al, Cr, Fe), MIL-
47(V), MIL-100(Cr), and MIL-101(Cr) Metal−Organic Frameworks at Room
Temperature. J. Am. Chem. Soc. 2009, 131 (25), 8775–8777.
https://doi.org/10.1021/ja901587t.
(64) Vellingiri, K.; Deep, A.; Kim, K.-H. Metal–Organic Frameworks as a Potential Platform
for Selective Treatment of Gaseous Sulfur Compounds. ACS Appl. Mater. Interfaces
2016, 8 (44), 29835–29857. https://doi.org/10.1021/acsami.6b10482.
(65) DeCoste, J. B.; Peterson, G. W. Metal–Organic Frameworks for Air Purification of Toxic
Chemicals. Chem. Rev. 2014, 114 (11), 5695–5727. https://doi.org/10.1021/cr4006473.
(66) Peralta, D.; Chaplais, G.; Simon-Masseron, A.; Barthelet, K.; Pirngruber, G. D. Metal–
Organic Framework Materials for Desulfurization by Adsorption. Energy Fuels 2012, 26
(8), 4953–4960. https://doi.org/10.1021/ef300762z.
(67) Vaesen, S.; Guillerm, V.; Yang, Q.; Wiersum, A. D.; Marszalek, B.; Gil, B.; Vimont, A.;
Daturi, M.; Devic, T.; Llewellyn, P. L.; Serre, C.; Maurin, G.; De Weireld, G. A Robust
Amino-Functionalized Titanium(Iv) Based MOF for Improved Separation of Acid
Gases. Chem. Commun. 2013, 49 (86), 10082–10084.
https://doi.org/10.1039/C3CC45828H.
(68) Yang, Q.; Vaesen, S.; Vishnuvarthan, M.; Ragon, F.; Serre, C.; Vimont, A.; Daturi, M.;
De Weireld, G.; Maurin, G. Probing the Adsorption Performance of the Hybrid Porous
MIL-68(Al): A Synergic Combination of Experimental and Modelling Tools. J. Mater.
Chem. 2012, 22 (20), 10210–10220. https://doi.org/10.1039/C2JM15609A.
(69) Petit, C.; Mendoza, B.; Bandosz, T. J. Hydrogen Sulfide Adsorption on MOFs and
MOF/Graphite Oxide Composites. Chem. Phys. Chem 2010, 11 (17), 3678–3684.
https://doi.org/10.1002/cphc.201000689.
(70) Allan, P. K.; Wheatley, P. S.; Aldous, D.; Mohideen, M. I.; Tang, C.; Hriljac, J. A.;
Megson, I. L.; Chapman, K. W.; De Weireld, G.; Vaesen, S.; Morris, R. E. Metal–
Organic Frameworks for the Storage and Delivery of Biologically Active Hydrogen
Sulfide. Dalton Trans. 2012, 41 (14), 4060–4066. https://doi.org/10.1039/C2DT12069K.
(71) Adib, F.; Bagreev, A.; Bandosz, T. J. Effect of Surface Characteristics of Wood-Based
Activated Carbons on Adsorption of Hydrogen Sulfide. J. Colloid Interface Sci. 1999,
214 (2), 407–415. https://doi.org/10.1006/jcis.1999.6200.
(72) Bagreev, A.; Adib, F.; Bandosz, T. J. Initial Heats of H2S Adsorption on Activated
Carbons: Effect of Surface Features. J. Colloid Interface Sci. 1999, 219 (2), 327–332.
https://doi.org/10.1006/jcis.1999.6485.

212
(73) Bandosz, T. J. Effect of Pore Structure and Surface Chemistry of Virgin Activated
Carbons on Removal of Hydrogen Sulfide. Carbon 1999, 37 (3), 483–491.
https://doi.org/10.1016/S0008-6223(98)00217-6.
(74) Adib, F.; Bagreev, A.; Bandosz, T. J. Adsorption/Oxidation of Hydrogen Sulfide on
Nitrogen-Containing Activated Carbons. Langmuir 2000, 16 (4), 1980–1986.
https://doi.org/10.1021/la990926o.
(75) Adib, F.; Bagreev, A.; Bandosz, T. J. Analysis of the Relationship between H2S Removal
Capacity and Surface Properties of Unimpregnated Activated Carbons. Environ. Sci.
Technol. 2000, 34 (4), 686–692. https://doi.org/10.1021/es990341g.
(76) Bandosz, T. J. On the Adsorption/Oxidation of Hydrogen Sulfide on Activated Carbons
at Ambient Temperatures. J. Colloid Interface Sci. 2002, 246 (1), 1–20.
https://doi.org/10.1006/jcis.2001.7952.
(77) Hussain, M.; Abbas, N.; Fino, D.; Russo, N. Novel Mesoporous Silica Supported ZnO
Adsorbents for the Desulphurization of Biogas at Low Temperatures. Chem. Eng. J.
2012, 188, 222–232. https://doi.org/10.1016/j.cej.2012.02.034.
(78) Elyassi, B.; Wahedi, Y. A.; Rajabbeigi, N.; Kumar, P.; Jeong, J. S.; Zhang, X.; Kumar,
P.; Balasubramanian, V. V.; Katsiotis, M. S.; Andre Mkhoyan, K.; Boukos, N.; Hashimi,
S. A.; Tsapatsis, M. A High-Performance Adsorbent for Hydrogen Sulfide Removal.
Microporous Mesoporous Mater. 2014, 190, 152–155.
https://doi.org/10.1016/j.micromeso.2014.02.007.
(79) Bhandari, D. A.; Bessho, N.; Koros, W. J. Hollow Fiber Sorbents for Desulfurization of
Natural Gas. Ind. Eng. Chem. Res. 2010, 49 (23), 12038–12050.
https://doi.org/10.1021/ie100157w.
(80) Seredych, M.; Bandosz, T. J. Reactive Adsorption of Hydrogen Sulfide on Graphite
Oxide/Zr(OH)4 Composites. Chem. Eng. J. 2011, 166 (3), 1032–1038.
https://doi.org/10.1016/j.cej.2010.11.096.
(81) Seredych, M.; Mabayoje, O.; Bandosz, T. J. Visible-Light-Enhanced Interactions of
Hydrogen Sulfide with Composites of Zinc (Oxy)Hydroxide with Graphite Oxide and
Graphene. Langmuir 2012, 28 (2), 1337–1346. https://doi.org/10.1021/la204277c.
(82) Ozekmekci, M.; Salkic, G.; Fellah, M. F. Use of Zeolites for the Removal of H2S: A
Mini-Review. Fuel Process. Technol. 2015, 139, 49–60.
https://doi.org/10.1016/j.fuproc.2015.08.015.
(83) Gibson, J. B.; Harrison, D. P. The Reaction between Hydrogen Sulfide and Spherical
Pellets of Zinc Oxide. Ind. Eng. Chem. Process Des. Dev. 1980, 19 (2), 231–237.
https://doi.org/10.1021/i260074a005.
(84) Skrzypski, J.; Bezverkhyy, I.; Heintz, O.; Bellat, J.-P. Low Temperature H2S Removal
with Metal-Doped Nanostructure ZnO Sorbents: Study of the Origin of Enhanced
Reactivity in Cu-Containing Materials. Ind. Eng. Chem. Res. 2011, 50 (9), 5714–5722.
https://doi.org/10.1021/ie200240e.

213
(85) Li, L.; Sun, T. H.; Shu, C. H.; Zhang, H. B. Low Temperature H2S Removal with 3-D
Structural Mesoporous Molecular Sieves Supported ZnO from Gas Stream. J. Hazard.
Mater. 2016, 311, 142–150. https://doi.org/10.1016/j.jhazmat.2016.01.033.
(86) Yang, Y.; Shi, Y.; Cai, N. Steam Regenerative Removal of Hydrogen Sulfide from Hot
Syngas by a Novel Tin Oxide and Yttrium Oxide Sorbent. Energy 2017, 122, 214–220.
https://doi.org/10.1016/j.energy.2017.01.081.
(87) Li, L.; Zhou, P.; Zhang, H.; Meng, X.; Li, J.; Sun, T. Mid-Temperature Deep Removal
of Hydrogen Sulfide on Rare Earth (RE=Ce, La, Sm, Gd) Doped ZnO Supported on KIT-
6: Effect of RE Dopants and Interaction between Active Phase and Support Matrix. Appl.
Surf. Sci. 2017, 407, 197–208. https://doi.org/10.1016/j.apsusc.2017.01.128.
(88) Wu, J.; Liu, D.; Zhou, W.; Liu, Q.; Huang, Y. Status of Coal Gas H2S Removal. In High-
Temperature H2S Removal from IGCC Coarse Gas; Wu, J., Liu, D., Zhou, W., Liu, Q.,
Huang, Y., Eds.; Springer Singapore: Singapore, 2018; pp 21–54.
https://doi.org/10.1007/978-981-10-6817-1_2.
(89) Yang, C.; Wang, J.; Fan, H.-L.; Shangguan, J.; Mi, J.; Huo, C. Contributions of Tailored
Oxygen Vacancies in ZnO/Al2O3 Composites to the Enhanced Ability for H2S Removal
at Room Temperature. Fuel 2018, 215, 695–703.
https://doi.org/10.1016/j.fuel.2017.11.037.
(90) Bezverkhyy, I.; Skrzypski, J.; Safonova, O.; Bellat, J.-P. Sulfidation Mechanism of Pure
and Cu-Doped ZnO Nanoparticles at Moderate Temperature: TEM and In Situ XRD
Studies. J. Phys. Chem. C 2012, 116 (27), 14423–14430.
https://doi.org/10.1021/jp303181d.
(91) Baird, T.; C. Campbell, K.; J. Holliman, P.; W. Hoyle, R.; Huxam, M.; Stirling, D.; Peter
Williams, B.; Morris, M. Cobalt-Zinc Oxide Absorbents for Low Temperature Gas
Desulfurisation. J. Mater. Chem. 1999, 9 (2), 599–605.
https://doi.org/10.1039/A806909C.
(92) Carnes, C. L.; Klabunde, K. J. Unique Chemical Reactivities of Nanocrystalline Metal
Oxides toward Hydrogen Sulfide. Chem. Mater. 2002, 14 (4), 1806–1811.
https://doi.org/10.1021/cm011588r.
(93) Habibi, R.; Rashidi, A. M.; Daryan, J. T.; zadeh, A. M. ali. Study of the Rod-Like and
Spherical Nano-ZnO Morphology on H2S Removal from Natural Gas. Appl. Surf. Sci.
2010, 257 (2), 434–439. https://doi.org/10.1016/j.apsusc.2010.07.007.
(94) Garces, H. F.; Galindo, H. M.; Garces, L. J.; Hunt, J.; Morey, A.; Suib, S. L. Low
Temperature H2S Dry-Desulfurization with Zinc Oxide. Microporous Mesoporous
Mater. 2010, 127 (3), 190–197. https://doi.org/10.1016/j.micromeso.2009.07.022.
(95) Garces, H. F.; Espinal, A. E.; Suib, S. L. Tunable Shape Microwave Synthesis of Zinc
Oxide Nanospheres and Their Desulfurization Performance Compared with Nanorods
and Platelet-Like Morphologies for the Removal of Hydrogen Sulfide. J. Phys. Chem. C
2012, 116 (15), 8465–8474. https://doi.org/10.1021/jp210755t.

214
(96) Baird, T.; Denny, P. J.; Hoyle, R.; McMonagle, F.; Stirling, D.; Tweedy, J. Modified
Zinc Oxide Absorbents for Low-Temperature Gas Desulfurisation. J. Chem. Soc.
Faraday Trans. 1992, 88 (22), 3375–3382. https://doi.org/10.1039/FT9928803375.
(97) Jiang, D.; Su, L.; Ma, L.; Yao, N.; Xu, X.; Tang, H.; Li, X. Cu–Zn–Al Mixed Metal
Oxides Derived from Hydroxycarbonate Precursors for H2S Removal at Low
Temperature. Appl. Surf. Sci. 2010, 256 (10), 3216–3223.
https://doi.org/10.1016/j.apsusc.2009.12.008.
(98) Twigg, M. V. Catalyst Handbook; Routledge, 2018.
(99) Davidson, J. M.; Lawrie, C. H.; Sohail, K. Kinetics of the Absorption of Hydrogen
Sulfide by High Purity and Doped High Surface Area Zinc Oxide. Ind. Eng. Chem. Res.
1995, 34 (9), 2981–2989.
(100) Novochinskii, I. I.; Song, C.; Ma, X.; Liu, X.; Shore, L.; Lampert, J.; Farrauto, R. J. Low-
Temperature H2S Removal from Steam-Containing Gas Mixtures with ZnO for Fuel Cell
Application. 1. ZnO Particles and Extrudates. Energy Fuels 2004, 18 (2), 576–583.
(101) Tu, K. N.; Gösele, U. Hollow Nanostructures Based on the Kirkendall Effect: Design
and Stability Considerations. Appl. Phys. Lett. 2005, 86 (9), 093111.
(102) Kroger, F. A. The Chemistry of Imperfect Crystals. Amst. Neth. 1974, 2.
(103) Skrzypski, J.; Bezverkhyy, I.; Heintz, O.; Bellat, J.-P. Low Temperature H2S Removal
with Metal-Doped Nanostructure ZnO Sorbents: Study of the Origin of Enhanced
Reactivity in Cu-Containing Materials. Ind. Eng. Chem. Res. 2011, 50 (9), 5714–5722.
(104) Hernández-Maldonado, A. J.; Yang, F. H.; Qi, G.; Yang, R. T. Desulfurization of
Transportation Fuels by π-Complexation Sorbents: Cu (I)-, Ni (II)-, and Zn (II)-Zeolites.
Appl. Catal. B Environ. 2005, 56 (1–2), 111–126.
(105) Kohn, W.; Sham, L. J. Self-Consistent Equations Including Exchange and Correlation
Effects. Phys. Rev. 1965, 140 (4A), A1133–A1138.
https://doi.org/10.1103/PhysRev.140.A1133.
(106) Keller, J. On the Formulation of the Hohenberg–Kohn–Sham Theory. Int. J. Quantum
Chem. 1986, 30 (S20), 767–768.
(107) Grönbeck, H. First Principles Studies of Metal-Oxide Surfaces. Top. Catal. 2004, 28 (1–
4), 59–69.
(108) Jia, M.-Y.; Xu, B.; Ding, X.-L.; He, S.-G.; Ge, M.-F. Experimental and Theoretical Study
of the Reactions between Manganese Oxide Cluster Anions and Hydrogen Sulfide. J.
Phys. Chem. C 2012, 116 (45), 24184–24192.
(109) Dhage, P.; Samokhvalov, A.; McKee, M. L.; Duin, E. C.; Tatarchuk, B. J. Reactive
Adsorption of Hydrogen Sulfide by Promoted Sorbents Cu‐ZnO/SiO2: Active Sites by
Experiment and Simulation. Surf. Interface Anal. 2013, 45 (5), 865–872.

215
(110) Polychronopoulou, K.; Galisteo, F. C.; Granados, M. L.; Fierro, J. L. G.; Bakas, T.;
Efstathiou, A. M. Novel Fe–Mn–Zn–Ti–O Mixed-Metal Oxides for the Low-
Temperature Removal of H2S from Gas Streams in the Presence of H2, CO2, and H2O.
J. Catal. 2005, 236 (2), 205–220.
(111) Casarin, M.; Maccato, C.; Tondello, E.; Vittadini, A. A Theoretical Investigation of
Brønsted Acids Chemisorption on ZnO (0001). Surf. Sci. 1995, 343 (1–2), 115–132.
(112) Jackson, K.; Pederson, M. R. Accurate Forces in a Local-Orbital Approach to the Local-
Density Approximation. Phys. Rev. B 1990, 42 (6), 3276.
(113) Rodriguez, J. A.; Maiti, A. Adsorption and Decomposition of H2S on MgO (100),
NiMgO (100), and ZnO (0001) Surfaces: A First-Principles Density Functional Study. J.
Phys. Chem. B 2000, 104 (15), 3630–3638.
(114) Becke, A. D. Density‐functional Thermochemistry. II. The Effect of the Perdew–Wang
Generalized‐gradient Correlation Correction. J. Chem. Phys. 1992, 97 (12), 9173–9177.
(115) Martin, R. M.; Martin, R. M. Electronic Structure: Basic Theory and Practical Methods;
Cambridge university press, 2004.
(116) Casarin, M.; Maccato, C.; Vittadini, A. An LCAO-LDF Study of the Chemisorption of
H2O and H2S on ZnO (0001) and ZnO (101̅0). Surf. Sci. 1997, 377, 587–591.
(117) Pandiyan, R. Growth by Radio Frequency Sputtering and Characterisation of Rare Earth
Doped Wide Bandgap Oxides, University of Trento, 2013.
(118) Ling, L.; Zhang, R.; Han, P.; Wang, B. DFT Study on the Sulfurization Mechanism
during the Desulfurization of H2S on the ZnO Desulfurizer. Fuel Process. Technol. 2013,
106, 222–230.
(119) Burke, K.; Perdew, J. P.; Wang, Y. Derivation of a Generalized Gradient Approximation:
The PW91 Density Functional. In Electronic density functional theory; Springer, 1998;
pp 81–111.
(120) Perdew, J. P.; Burke, K.; Ernzerhof, M. Generalized Gradient Approximation Made
Simple. Phys. Rev. Lett. 1996, 77 (18), 3865.
(121) Vanderbilt, D. Soft Self-Consistent Pseudopotentials in a Generalized Eigenvalue
Formalism. Phys. Rev. B 1990, 41 (11), 7892–7895.
https://doi.org/10.1103/PhysRevB.41.7892.
(122) Anisimov, V. I.; Zaanen, J.; Andersen, O. K. Band Theory and Mott Insulators: Hubbard
U Instead of Stoner I. Phys. Rev. B 1991, 44 (3), 943–954.
https://doi.org/10.1103/PhysRevB.44.943.
(123) Liechtenstein, A. I.; Anisimov, V. I.; Zaanen, J. Density-Functional Theory and Strong
Interactions: Orbital Ordering in Mott-Hubbard Insulators. Phys. Rev. B 1995, 52 (8),
R5467.

216
(124) Cramer, C. J. Essentials of Computational Chemistry: Theories and Models; John Wiley
& Sons, 2013.
(125) Koch, W.; Holthausen, M. C. A Chemist’s Guide to Density Functional Theory; John
Wiley & Sons, 2015.
(126) Kazemi, M.; Rad, A. S. Sulfur Mustard Gas Adsorption on ZnO Fullerene-like
Nanocage: Quantum Chemical Calculations. Superlattices Microstruct. 2017, 106, 122–
128.
(127) Tong, X.; Lv, J.; Zheng, Y.; Huang, L. DFT Study on the Interaction between S2 and
Zincite (101¯ 0) Surface. J. Taiwan Inst. Chem. Eng. 2018, 88, 18–24.
(128) Hao, S.; Rankin, R. B.; Johnson, J. K.; Sholl, D. S. Surface Reactions of AsH3, H2Se,
and H2S on the Zn2TiO4(010) Surface. Surf. Sci. 2011, 605 (7), 818–823.
https://doi.org/10.1016/j.susc.2011.01.025.
(129) Tamhankar, S. S.; Bagajewicz, M.; Gavalas, G. R.; Sharma, P. K.; Flytzani-
Stephanopoulos, M. Mixed-Oxide Sorbents for High-Temperature Removal of Hydrogen
Sulfide. Ind. Eng. Chem. Process Des. Dev. 1986, 25 (2), 429–437.
https://doi.org/10.1021/i200033a014.
(130) Laperdrix, E.; Costentin, G.; Saur, O.; Lavalley, J. C.; Nedez, C.; Savin-Poncet, S.;
Nougayrede, J. Selective Oxidation of H2S over CuO/Al2O3: Identification and Role of
the Sulfurated Species Formed on the Catalyst during the Reaction. J. Catal. 2000, 189
(1), 63–69.
(131) Park, S.; Park, S.; Jung, J.; Hong, T.; Lee, S.; Kim, H. W.; Lee, C. H2S Gas Sensing
Properties of CuO-Functionalized WO3 Nanowires. Ceram. Int. 2014, 40 (7), 11051–
11056.
(132) Westmoreland, P. R.; Harrison, D. P. Evaluation of Candidate Solids for High-
Temperature Desulfurization of Low-Btu Gases. Environ. Sci. Technol. 1976, 10 (7),
659–661.
(133) Kyotani, T.; Kawashima, H.; Tomita, A. High-Temperature Desulfurization with
Copper-Containing Sorbents. Environ. Sci. Technol. 1989, 23 (2), 218–223.
https://doi.org/10.1021/es00179a014.
(134) Hu, J.; Li, D.; Lu, J. G.; Wu, R. Effects on Electronic Properties of Molecule Adsorption
on CuO Surfaces and Nanowires. J. Phys. Chem. C 2010, 114 (40), 17120–17126.
(135) Sun, S.; Zhang, D.; Li, C.; Wang, Y. DFT Study on the Adsorption and Dissociation of
H 2 S on CuO (111) Surface. RSC Adv. 2015, 5 (28), 21806–21811.
(136) Zhang, J.; Liu, M.; Zhang, R.; Wang, B.; Huang, Z. Insight into the Properties of
Stoichiometric, Reduced and Sulfurized CuO Surfaces: Structure Sensitivity for H2S
Adsorption and Dissociation. Mol. Catal. 2017, 438, 130–142.

217
(137) Wöll, C. The Chemistry and Physics of Zinc Oxide Surfaces. Prog. Surf. Sci. 2007, 82
(2–3), 55–120.
(138) Cohen, A. J.; Mori-Sánchez, P.; Yang, W. Challenges for Density Functional Theory.
Chem. Rev. 2011, 112 (1), 289–320.
(139) Dudarev, S. L.; Botton, G. A.; Savrasov, S. Y.; Humphreys, C. J.; Sutton, A. P. Electron-
Energy-Loss Spectra and the Structural Stability of Nickel Oxide: An LSDA+ U Study.
Phys. Rev. B 1998, 57 (3), 1505.
(140) Maimaiti, Y.; Nolan, M.; Elliott, S. D. Reduction Mechanisms of the CuO (111) Surface
through Surface Oxygen Vacancy Formation and Hydrogen Adsorption. Phys. Chem.
Chem. Phys. 2014, 16 (7), 3036–3046.
(141) Mishra, A. K.; Roldan, A.; de Leeuw, N. H. CuO Surfaces and CO2 Activation: A
Dispersion-Corrected DFT+U Study. J. Phys. Chem. C 2016, 120 (4), 2198–2214.
https://doi.org/10.1021/acs.jpcc.5b10431.
(142) Fronzi, M.; Nolan, M. First-Principles Analysis of the Stability of Water on Oxidised and
Reduced CuO (111) Surfaces. RSC Adv. 2017, 7 (89), 56721–56731.
(143) Neveux, L.; Chiche, D.; Bazer-Bachi, D.; Favergeon, L.; Pijolat, M. New Insight on the
ZnO Sulfidation Reaction: Evidences for an Outward Growth Process of the ZnS Phase.
Chem. Eng. J. 2012, 181–182, 508–515. https://doi.org/10.1016/j.cej.2011.09.019.
(144) Schulz, K. H.; Cox, D. F. Photoemission and Low-Energy-Electron-Diffraction Study of
Clean and Oxygen-Dosed Cu2O (111) and (100) Surfaces. Phys. Rev. B 1991, 43 (2),
1610.
(145) Zhang, R.; Liu, H.; Li, J.; Ling, L.; Wang, B. A Mechanistic Study of H2S Adsorption
and Dissociation on Cu2O (1 1 1) Surfaces: Thermochemistry, Reaction Barrier. Appl.
Surf. Sci. 2012, 258 (24), 9932–9943.
(146) Becke, A. D. A Multicenter Numerical Integration Scheme for Polyatomic Molecules. J.
Chem. Phys. 1988, 88 (4), 2547–2553.
(147) Lin, J.; May, J. A.; Didziulis, S. V.; Solomon, E. I. Variable-Energy Photoelectron
Spectroscopic Studies of Hydrogen Sulfide Chemisorption on Cuprous Oxide and Zinc
Oxide Single-Crystal Surfaces: HS-Bonding to Copper (I) and Zinc (II) Sites Related to
Catalytic Poisoning. J. Am. Chem. Soc. 1992, 114 (12), 4718–4727.
(148) Stenlid, J. H.; Johansson, A. J.; Leygraf, C.; Brinck, T. Computational Analysis of the
Early Stage of Cuprous Oxide Sulphidation: A Top-down Process. Corros. Eng. Sci.
Technol. 2017, 52 (sup1), 50–53.
(149) Chen, H.-T.; Choi, Y.; Liu, M.; Lin, M. C. A First-Principles Analysis for Sulfur
Tolerance of CeO2 in Solid Oxide Fuel Cells. J. Phys. Chem. C 2007, 111 (29), 11117–
11122.

218
(150) Marrocchelli, D.; Yildiz, B. First-Principles Assessment of H2S and H2O Reaction
Mechanisms and the Subsequent Hydrogen Absorption on the CeO2 (111) Surface. J.
Phys. Chem. C 2012, 116 (3), 2411–2424. https://doi.org/10.1021/jp205573v.
(151) Mayernick, A. D.; Li, R.; Dooley, K. M.; Janik, M. J. Energetics and Mechanism for H2S
Adsorption by Ceria-Lanthanide Mixed Oxides: Implications for the Desulfurization of
Biomass Gasifier Effluents. J. Phys. Chem. C 2011, 115 (49), 24178–24188.
(152) Kullgren, J.; Lu, Z.; Yang, Z.; Hermansson, K. Sulfidation and Sulfur Recovery from
SO2 over Ceria. J. Phys. Chem. C 2014, 118 (31), 17499–17504.
(153) Bagheri, Z.; Moradi, M. DFT Study on the Adsorption and Dissociation of Hydrogen
Sulfide on MgO Nanotube. Struct. Chem. 2014, 25 (2), 495–501.
(154) Rodriguez, J. A.; Jirsak, T.; Pérez, M.; Chaturvedi, S.; Kuhn, M.; González, L.; Maiti, A.
Studies on the Behavior of Mixed-Metal Oxides and Desulfurization: Reaction of H2S
and SO2 with Cr2O3 (0001), MgO (100), and CrxMg1-xO (100). J. Am. Chem. Soc. 2000,
122 (49), 12362–12370.
(155) Schneider, W. F.; Li, J.; Hass, K. C. Combined Computational and Experimental
Investigation of SO x Adsorption on MgO. J. Phys. Chem. B 2001, 105 (29), 6972–6979.
(156) Xu, Y.-J.; Li, J.-Q.; Zhang, Y.-F. S Adsorption at Regular and Defect Sites of the MgO
(001) Surface: Cluster Model Study at DFT Level. Surf. Rev. Lett. 2003, 10 (04), 691–
695.
(157) Sasmaz, E.; Wilcox, J. Mercury Species and SO2 Adsorption on CaO (100). J. Phys.
Chem. C 2008, 112 (42), 16484–16490. https://doi.org/10.1021/jp801250h.
(158) Wang, W.; Fan, L.; Wang, G.; Li, Y. CO2 and SO2 Sorption on the Alkali Metals Doped
CaO(100)Surface: A DFT-D Study. Appl. Surf. Sci. 2017, 425, 972–977.
https://doi.org/10.1016/j.apsusc.2017.07.158.
(159) Ionescu, A.; Allouche, A.; Aycard, J.-P.; Rajzmann, M.; Hutschka, F. Study of γ-
Alumina Surface Reactivity: Adsorption of Water and Hydrogen Sulfide on Octahedral
Aluminum Sites. J. Phys. Chem. B 2002, 106 (36), 9359–9366.
(160) Peri, J. B. A Model for the Surface of γ-Alumina1. J. Phys. Chem. 1965, 69 (1), 220–
230.
(161) Knözinger, H.; Ratnasamy, P. Catalytic Aluminas: Surface Models and Characterization
of Surface Sites. Catal. Rev. 1978, 17 (1), 31–70.
https://doi.org/10.1080/03602457808080878.
(162) Tsyganenko, A. A.; Mardilovich, P. P. Structure of Alumina Surfaces. J. Chem. Soc.
Faraday Trans. 1996, 92 (23), 4843–4852.
(163) Arrouvel, C.; Toulhoat, H.; Breysse, M.; Raybaud, P. Effects of PH2O, PH2S, PH2 on the
Surface Properties of Anatase–TiO2 and γ-Al2O3: A DFT Study. J. Catal. 2004, 226 (2),
260–272.

219
(164) Rodriguez, J. A.; Chaturvedi, S.; Kuhn, M.; Hrbek, J. Reaction of H2S and S2 with
Metal/Oxide Surfaces: Band-Gap Size and Chemical Reactivity. J. Phys. Chem. B 1998,
102 (28), 5511–5519.
(165) Nigussa, K. N.; Borck, Ø.; Støvneng, J. A. Adsorption of H2S on α-Cr2O3 (0001)
Surfaces: A Density Functional Theory Investigation. Corros. Sci. 2016, 111, 1–12.
(166) Abbasi, A.; Sardroodi, J. J. Adsorption and Dissociation of H2S on Nitrogen-Doped TiO2
Anatase Nanoparticles: Insights from DFT Computations. Surf. Interfaces 2017, 8, 15–
27.
(167) Guo, J.; Janik, M. J.; Song, C. Density Functional Theory Study on the Role of Ceria
Addition in TixCe1–xO2 Adsorbents for Thiophene Adsorption. J. Phys. Chem. C 2012,
116 (5), 3457–3466.
(168) Song, J.; Niu, X.; Ling, L.; Wang, B. A Density Functional Theory Study on the
Interaction Mechanism between H2S and the α-Fe2O3 (0001) Surface. Fuel Process.
Technol. 2013, 115, 26–33.
(169) Lin, C.; Qin, W.; Dong, C. H2S Adsorption and Decomposition on the Gradually
Reduced α-Fe2O3 (001) Surface: A DFT Study. Appl. Surf. Sci. 2016, 387, 720–731.
(170) Wang, B.; Nisar, J.; Ahuja, R. Molecular Simulation for Gas Adsorption at NiO (100)
Surface. ACS Appl. Mater. Interfaces 2012, 4 (10), 5691–5697.
(171) Favergeon, L.; Morandini, J.; Pijolat, M.; Soustelle, M. A General Approach for Kinetic
Modeling of Solid-Gas Reactions at Reactor Scale: Application to Kaolinite
Dehydroxylation. Oil Gas Sci. Technol. – Rev. D’IFP Energ. Nouv. 2013, 68 (6), 1039–
1048. https://doi.org/10.2516/ogst/2012018.
(172) Sadegh-Vaziri, R.; Babler, M. U. Numerical Investigation of the Outward Growth of ZnS
in the Removal of H2S in a Packed Bed of ZnO. Chem. Eng. Sci. 2017, 158, 328–339.
https://doi.org/10.1016/j.ces.2016.10.038.
(173) Chrostowski, J. W.; Georgakis, C. Pore Plugging Model for Gas-Solid Reactions. In
Chemical Reaction Engineering; Weekman, V. W., Luss, D., Eds.; American Chemical
Society: Washington, D. C., 1978; Vol. 65, pp 225–237. https://doi.org/10.1021/bk-
1978-0065.ch019.
(174) Bhatia, S. K.; Perlmutter, D. D. A random pore model for fluid-solid reactions: I.
Isothermal, kinetic control. AIChE J. 1980, 26 (3), 379–386.
https://doi.org/10.1002/aic.690260308.
(175) Berg, K. L.; Olsen, S. E. Kinetics of Manganese Ore Reduction by Carbon Monoxide.
Metall. Mater. Trans. B 2000, 31 (3), 477–490. https://doi.org/10.1007/s11663-000-
0154-4.
(176) Bhatia, S. K.; Vartak, B. J. Reaction of Microporous Solids: The Discrete Random Pore
Model. Carbon 1996, 34 (11), 1383–1391. https://doi.org/10.1016/S0008-
6223(96)00080-2.

220
(177) Wen, C. Y. Noncatalytic Heterogenous Solid-Fluid Reaction Models. Ind. Eng. Chem.
1968, 60 (9), 34–54. https://doi.org/10.1021/ie50705a007.
(178) Dziembaj, R.; Malczyk, J.; Baranski, A. Oxygen Corrosion of Calcined Cokes: II.
Nonlinear Nucleation Model of This Oxygen Corrosion. Carbon 1991, 29 (3), 329–334.
https://doi.org/10.1016/0008-6223(91)90201-S.
(179) Evangelos A, E.; Stratis V, S. A Partially Overlapping Grain Model for Gas—Solid
Reactions. Chem. Eng. Sci. 1993, 48 (7), 1201–1212. https://doi.org/10.1016/0009-
2509(93)81002-D.
(180) Garza-Garza, O.; Duduković, M. P. A Variable Size Grain Model for Gas-Solid
Reactions with Structural Changes. Chem. Eng. J. 1982, 24 (1), 35–45.
https://doi.org/10.1016/0300-9467(82)80048-8.
(181) V. Sotirchos, S. On a Class of Random Pore and Grain Models for Gas-Solid Reactions.
Chem. Eng. Sci. 1987, 42 (5), 1262–1265. https://doi.org/10.1016/0009-2509(87)80084-
2.
(182) Cooper, R. S. Slow Particle Diffusion in Ion Exchange Columns. Ind. Eng. Chem.
Fundam. 1965, 4 (3), 308–313. https://doi.org/10.1021/i160015a012.
(183) Bohart, G. S.; Adams, E. Q. Some Aspects of The Behavior of Charcoal with Respect to
Chlorine. 1920, 42 (3), 523–544.
(184) Bohart, G. S.; Adams, E. Q. Some Aspects of the Behavior of Charcoal with Respect to
Chlorine. J. Am. Chem. Soc. 1920, 42 (3), 523–544.
https://doi.org/10.1021/ja01448a018.
(185) Belfiore, L. A. Transport Phenomena for Chemical Reactor Design; John Wiley & Sons,
2003.
(186) Lee, H. H. Heterogeneous Reactor Design; Butterworth, 1985.
(187) Cooney, D. O. Adsorption Design for Wastewater Treatment, 1 edition.; CRC Press:
Boca Raton, Fla., 1998.
(188) McCarthy, D. J. On the Applicability of the Nucleation Model for Oxidation of Carbons.
Carbon 1993, 31 (1), 63–69. https://doi.org/10.1016/0008-6223(93)90156-5.
(189) Poling, B. E.; Prausnitz, J. M.; O’Connell, J. P. The Properties of Gases and Liquids 5E;
McGraw Hill Professional, 2000.
(190) Szekely, J.; Evans, J. W.; Sohn, H. Gas-Solid Reactions; Elsevier, 1976.
https://doi.org/10.1016/B978-0-12-680850-6.X5001-X.
(191) Rosso, I.; Galletti, C.; Bizzi, M.; Saracco, G.; Specchia, V. Zinc Oxide Sorbents for the
Removal of Hydrogen Sulfide from Syngas. Ind. Eng. Chem. Res. 2003, 42 (8), 1688–
1697. https://doi.org/10.1021/ie0208467.

221
(192) Balichard, K.; Nyikeine, C.; Bezverkhyy, I. Nanocrystalline ZnCO3—A Novel Sorbent
for Low-Temperature Removal of H2S. J. Hazard. Mater. 2014, 264, 79–83.
https://doi.org/10.1016/j.jhazmat.2013.10.068.
(193) Kang, S.-H.; Bae, J. W.; Kim, S.-M.; Jun, K.-W. Effect of Phosphorus Modification on
Cu−ZnO−Al2O3 for the Removal of H2S. Energy Fuels. 2008, 22 (4), 2580-2584
https://doi.org/10.1021/ef800054h.
(194) Montes, D.; Tocuyo, E.; González, E.; Rodríguez, D.; Solano, R.; Atencio, R.; Ramos,
M. A.; Moronta, A. Reactive H2S Chemisorption on Mesoporous Silica Molecular
Sieve-Supported CuO or ZnO. Microporous Mesoporous Mater. 2013, 168, 111–120.
https://doi.org/10.1016/j.micromeso.2012.09.018.
(195) Elyassi, B.; Wahedi, Y. Al; Rajabbeigi, N.; Kumar, P.; Jeong, J. S.; Zhang, X.; Kumar,
P.; Balasubramanian, V. V; Katsiotis, M. S.; Andre Mkhoyan, K.; Boukos, N.; Hashimi,
S. Al; Tsapatsis, M. A High-Performance Adsorbent for Hydrogen Sulfide Removal.
Microporous Mesoporous Mater. 2014, 190, 152–155.
https://doi.org/10.1016/j.micromeso.2014.02.007.
(196) Pineda, M.; Palacios, J. M.; Alonso, L.; Garcı́a, E.; Moliner, R. Performance of Zinc
Oxide Based Sorbents for Hot Coal Gas Desulfurization in Multicycle Tests in a Fixed-
Bed Reactor. Fuel 2000, 79 (8), 885–895. https://doi.org/10.1016/S0016-
2361(99)00218-5.
(197) Bagajewicz, M. J.; Tamhankar, S. S.; Stephanopoulos, M. F.; Gavalas, G. R. Hydrogen
Sulfide Removal by Supported Vanadium Oxide. Environ. Sci. Technol. 1988, 22 (4),
467–470. https://doi.org/10.1021/es00169a017.
(198) Chauk, S. S.; Agnihotri, R.; Jadhav, R. A.; Misro, S. K.; Fan, L.-S. Kinetics of High-
Pressure Removal of Hydrogen Sulfide Using Calcium Oxide Powder. AIChE J. 2000,
46 (6), 1157–1167. https://doi.org/10.1002/aic.690460608.
(199) Karvan, O.; Atakül, H. Investigation of CuO/Mesoporous SBA-15 Sorbents for Hot Gas
Desulfurization. Fuel Process. Technol. 2008, 89 (9), 908–915.
https://doi.org/10.1016/j.fuproc.2008.03.004.
(200) Jiang, D.; Su, L.; Ma, L.; Yao, N.; Xu, X.; Tang, H.; Li, X. Cu–Zn–Al Mixed Metal
Oxides Derived from Hydroxycarbonate Precursors for H2S Removal at Low
Temperature. Appl. Surf. Sci. 2010, 256 (10), 3216–3223.
https://doi.org/10.1016/j.apsusc.2009.12.008.
(201) Sánchez, J. M.; Ruiz, E.; Otero, J. Selective Removal of Hydrogen Sulfide from Gaseous
Streams Using a Zinc-Based Sorbent. Ind. Eng. Chem. Res. 2005, 44 (2), 241–249.
https://doi.org/10.1021/ie0497902.
(202) Barin, I.; Kubaschewski, O.; Knacke, O. Thermochemical Properties of Inorganic
Substances: Supplement. Springer-Verlag: Berlin ; New York 1977, pp lxxxviii, 861 p.

222
(203) Karvan, O.; Sirkecioğlu, A.; Atakül, H. Investigation of Nano-CuO/Mesoporous SiO2
Materials as Hot Gas Desulphurization Sorbents. Fuel Process. Technol. 2009, 90 (12),
1452–1458. https://doi.org/10.1016/j.fuproc.2009.06.027.
(204) Balsamo, M.; Cimino, S.; de Falco, G.; Erto, A.; Lisi, L. ZnO-CuO Supported on
Activated Carbon for H2S Removal at Room Temperature. Chem. Eng. J. 2016, 304,
399–407. https://doi.org/10.1016/j.cej.2016.06.085.
(205) Ko, T.-H.; Chu, H.; Chaung, L.-K. The Sorption of Hydrogen Sulfide from Hot Syngas
by Metal Oxides over Supports. Chemosphere 2005, 58 (4), 467–474.
https://doi.org/10.1016/j.chemosphere.2004.09.029.
(206) Yasyerli, S.; Dogu, G.; Ar, I.; Dogu, T. Activities of Copper Oxide and Cu−V and
Cu−Mo Mixed Oxides for H2S Removal in the Presence and Absence of Hydrogen and
Predictions of a Deactivation Model. Ind. Eng. Chem. Res. 2001, 40 (23), 5206–5214.
https://doi.org/10.1021/ie0010621.
(207) Li, Z.; Flytzani-Stephanopoulos, M. Cu−Cr−O and Cu−Ce−O Regenerable Oxide
Sorbents for Hot Gas Desulfurization. Ind. Eng. Chem. Res. 1997, 36 (1), 187–196.
https://doi.org/10.1021/ie960245d.
(208) Azzam, S.; Simonetti, D. A. Linear Driving Force Approximations as Predictive Models
for Reactive Sorption. Energy Technol. 2019, 1900718.
https://doi.org/10.1002/ente.201900718.
(209) Carnes, C. L.; Klabunde, K. J. Unique Chemical Reactivities of Nanocrystalline Metal
Oxides toward Hydrogen Sulfide. Chem. Mater. 2002, 14 (4), 1806–1811.
https://doi.org/10.1021/cm011588r.
(210) Kayani, Z. N.; Umer, M.; Riaz, S.; Naseem, S. Characterization of Copper Oxide
Nanoparticles Fabricated by the Sol–Gel Method. J. Electron. Mater. 2015, 44 (10),
3704–3709. https://doi.org/10.1007/s11664-015-3867-5.
(211) Zhu, J.; Bi, H.; Wang, Y.; Wang, X.; Yang, X.; Lu, L. Synthesis of Flower-like CuO
Nanostructures via a Simple Hydrolysis Route. Mater. Lett. 2007, 61 (30), 5236–5238.
https://doi.org/10.1016/j.matlet.2007.04.037.
(212) Huang, J.; Tang, F.; Gu, C.; Shi, C.; Zhai, M. Flower-like CuO Hierarchical
Nanostructures: Synthesis, Characterization, and Property. Front. Optoelectron. 2012, 5
(4), 429–434. https://doi.org/10.1007/s12200-012-0293-7.
(213) Liu, C.; Zhang, L.; Deng, J.; Mu, Q.; Dai, H.; He, H. Surfactant-Aided Hydrothermal
Synthesis and Carbon Dioxide Adsorption Behavior of Three-Dimensionally
Mesoporous Calcium Oxide Single-Crystallites with Tri-, Tetra-, and Hexagonal
Morphologies. J. Phys. Chem. C 2008, 112 (49), 19248–19256.
https://doi.org/10.1021/jp8064568.
(214) Yu, J. C.; Xu, A.; Zhang, L.; Song, R.; Wu, L. Synthesis and Characterization of Porous
Magnesium Hydroxide and Oxide Nanoplates. J. Phys. Chem. B 2004, 108 (1), 64–70.
https://doi.org/10.1021/jp035340w.

223
(215) Biesinger, M. C.; Lau, L. W. M.; Gerson, A. R.; Smart, R. St. C. Resolving Surface
Chemical States in XPS Analysis of First Row Transition Metals, Oxides and
Hydroxides: Sc, Ti, V, Cu and Zn. Appl. Surf. Sci. 2010, 257 (3), 887–898.
https://doi.org/10.1016/j.apsusc.2010.07.086.
(216) Kresse, G.; Furthmüller, J. Efficient Iterative Schemes for Ab Initio Total-Energy
Calculations Using a Plane-Wave Basis Set. Phys. Rev. B 1996, 54 (16), 11169.
(217) Kresse, G.; Furthmüller, J. Efficiency of Ab-Initio Total Energy Calculations for Metals
and Semiconductors Using a Plane-Wave Basis Set. Comput. Mater. Sci. 1996, 6 (1), 15–
50.
(218) Kresse, G.; Hafner, J. Ab Initio Molecular-Dynamics Simulation of the Liquid-Metal–
Amorphous-Semiconductor Transition in Germanium. Phys. Rev. B 1994, 49 (20),
14251.
(219) Kresse, G.; Hafner, J. Ab Initio Molecular Dynamics for Liquid Metals. Phys. Rev. B
1993, 47 (1), 558.
(220) Wang, L.; Maxisch, T.; Ceder, G. Oxidation Energies of Transition Metal Oxides within
the GGA+ U Framework. Phys. Rev. B 2006, 73 (19), 195107.
(221) Zhang, Q.; Zhang, K.; Xu, D.; Yang, G.; Huang, H.; Nie, F.; Liu, C.; Yang, S. CuO
Nanostructures: Synthesis, Characterization, Growth Mechanisms, Fundamental
Properties, and Applications. Prog. Mater. Sci. 2014, 60, 208–337.
https://doi.org/10.1016/j.pmatsci.2013.09.003.
(222) Nolan, M.; Elliott, S. D. The P-Type Conduction Mechanism in Cu 2 O: A First
Principles Study. Phys. Chem. Chem. Phys. 2006, 8 (45), 5350–5358.
(223) Su, D.; Xie, X.; Dou, S.; Wang, G. CuO Single Crystal with Exposed {001} Facets - A
Highly Efficient Material for Gas Sensing and Li-Ion Battery Applications. Sci. Rep.
2014, 4 (1), 5753. https://doi.org/10.1038/srep05753.
(224) Mohan, V. M.; Raja, V.; Sharma, A. K.; Narasimha Rao, V. V. R. Ion Transport and
Battery Discharge Characteristics of Polymer Electrolyte Based on PEO Complexed with
NaFeF4 Salt. Ionics 2006, 12 (3), 219. https://doi.org/10.1007/s11581-006-0035-1.
(225) Aguirre, J. M.; GutiÃ\copyrightrrez, A.; Giraldo, O. Simple Route for the Synthesis of
Copper Hydroxy Salts. J. Braz. Chem. Soc. 2011, 22, 546–551.
(226) Zhang, Q.; Zhang, K.; Xu, D.; Yang, G.; Huang, H.; Nie, F.; Liu, C.; Yang, S. CuO
Nanostructures: Synthesis, Characterization, Growth Mechanisms, Fundamental
Properties, and Applications. Prog. Mater. Sci. 2014, 60, 208–337.
https://doi.org/10.1016/j.pmatsci.2013.09.003.
(227) Borodko, Y.; Lee, H. S.; Joo, S. H.; Zhang, Y.; Somorjai, G. Spectroscopic Study of the
Thermal Degradation of PVP-Capped Rh and Pt Nanoparticles in H2 and O2
Environments. J. Phys. Chem. C 2010, 114 (2), 1117–1126.
https://doi.org/10.1021/jp909008z.

224
(228) Kozak, D. S.; Sergiienko, R. A.; Shibata, E.; Iizuka, A.; Nakamura, T. Non-Electrolytic
Synthesis of Copper Oxide/Carbon Nanocomposite by Surface Plasma in Super-
Dehydrated Ethanol. Sci. Rep. 2016, 6, 21178.
(229) Biljana, Š.; E., B. C.; Alison, C.; G., C. R. Copper Oxide – Graphite Composite
Electrodes: Application to Nitrite Sensing. Electroanalysis 19 (1), 79–84.
https://doi.org/10.1002/elan.200603708.
(230) Sick, G.; Schwerdtfeger, K. Hot Desulfurization of Coal Gas with Copper. Metall. Trans.
B 1987, 18 (3), 603–609.
(231) Samokhvalov, A.; Tatarchuk, B. J. Characterization of Active Sites, Determination of
Mechanisms of H2S, COS and CS2 Sorption and Regeneration of ZnO Low-Temperature
Sorbents: Past, Current and Perspectives. Phys. Chem. Chem. Phys. 2011, 13 (8), 3197–
3209. https://doi.org/10.1039/C0CP01227K.
(232) Gibson, J. B.; Harrison, D. P. The Reaction between Hydrogen Sulfide and Spherical
Pellets of Zinc Oxide. Ind. Eng. Chem. Process Des. Dev. 1980, 19 (2), 231–237.
https://doi.org/10.1021/i260074a005.
(233) Lew, S.; Sarofim, A. F.; Flytzani-Stephanopoulos, M. Sulfidation of Zinc Titanate and
Zinc Oxide Solids. Ind. Eng. Chem. Res. 1992, 31 (8), 1890–1899.
https://doi.org/10.1021/ie00008a009.
(234) Ruiz-Martínez, J.; Beale, A. M.; Deka, U.; O’Brien, M. G.; Quinn, P. D.; Mosselmans,
J. F. W.; Weckhuysen, B. M. Correlating Metal Poisoning with Zeolite Deactivation in
an Individual Catalyst Particle by Chemical and Phase-Sensitive X-Ray Microscopy.
Angew. Chem. Int. Ed. 2013, 52 (23), 5983–5987.
https://doi.org/10.1002/anie.201210030.
(235) Flytzani-Stephanopoulos, M.; Sakbodin, M.; Wang, Z. Regenerative Adsorption and
Removal of H2S from Hot Fuel Gas Streams by Rare Earth Oxides. Science 2006, 312
(5779), 1508–1510. https://doi.org/10.1126/science.1125684.
(236) Neveux, L.; Chiche, D.; Pérez-Pellitero, J.; Favergeon, L.; Gay, A.-S.; Pijolat, M. New
Insight into the ZnO Sulfidation Reaction: Mechanism and Kinetics Modeling of the ZnS
Outward Growth. Phys. Chem. Chem. Phys. 2013, 15 (5), 1532–1545.
https://doi.org/10.1039/C2CP42988H.
(237) Liu, Y.; Meirer, F.; Williams, P. A.; Wang, J.; Andrews, J. C.; Pianetta, P. TXM-Wizard:
A Program for Advanced Data Collection and Evaluation in Full-Field Transmission X-
Ray Microscopy. J. Synchrotron Radiat. 2012, 19 (Pt 2), 281–287.
https://doi.org/10.1107/S0909049511049144.
(238) Meirer, F.; Cabana, J.; Liu, Y.; Mehta, A.; Andrews, J. C.; Pianetta, P. Three-
Dimensional Imaging of Chemical Phase Transformations at the Nanoscale with Full-
Field Transmission X-Ray Microscopy. J. Synchrotron Radiat. 2011, 18 (Pt 5), 773—
781. https://doi.org/10.1107/S0909049511019364.

225
(239) Gonzalez-Jimenez, I. D.; Cats, K.; Davidian, T.; Ruitenbeek, M.; Meirer, F.; Liu, Y.;
Nelson, J.; Andrews, J. C.; Pianetta, P.; de Groot, F. M. F.; Weckhuysen, B. M. Hard X-
Ray Nanotomography of Catalytic Solids at Work. Angew. Chem. Int. Ed. 2012, 51 (48),
11986–11990. https://doi.org/10.1002/anie.201204930.
(240) Lin, F.; Liu, Y.; Yu, X.; Cheng, L.; Singer, A.; Shpyrko, O. G.; Xin, H. L.; Tamura, N.;
Tian, C.; Weng, T.-C.; Yang, X.-Q.; Meng, Y. S.; Nordlund, D.; Yang, W.; Doeff, M.
M. Synchrotron X-Ray Analytical Techniques for Studying Materials Electrochemistry
in Rechargeable Batteries. Chem. Rev. 2017, 117 (21), 13123–13186.
https://doi.org/10.1021/acs.chemrev.7b00007.
(241) Ravel, B.; Newville, M. ATHENA, ARTEMIS, HEPHAESTUS: Data Analysis for X-
Ray Absorption Spectroscopy Using IFEFFIT. J. Synchrotron Radiat. 2005, 12 (4), 537–
541. https://doi.org/10.1107/S0909049505012719.
(242) Inorganic Crystal Structure Database – ICSD | FIZ Karlsruhe https://www.fiz-
karlsruhe.de/de/produkte-und-dienstleistungen/inorganic-crystal-structure-database-
icsd (accessed Aug 31, 2019).
(243) Weng, T.-C.; Waldo, G. S.; Penner-Hahn, J. E. A Method for Normalization of X-Ray
Absorption Spectra. J. Synchrotron Radiat. 2005, 12 (Pt 4), 506–510.
https://doi.org/10.1107/S0909049504034193.
(244) Kuzmin, A.; Chaboy, J. EXAFS and XANES Analysis of Oxides at the Nanoscale. IUCrJ
2014, 1 (Pt 6), 571–589. https://doi.org/10.1107/S2052252514021101.
(245) Velu, S.; Suzuki, K.; Gopinath, C. S.; Yoshida, H.; Hattori, T. XPS, XANES and EXAFS
Investigations of CuO/ZnO/Al2O3/ZrO2 Mixed Oxide Catalysts. Phys Chem Chem Phys
2002, 4 (10), 1990–1999. https://doi.org/10.1039/B109766K.
(246) Liu, H.; Zeng, F.; Gao, S.; Wang, G.; Song, C.; Pan, F. Contributions of Magnetic
Properties in Epitaxial Copper-Doped ZnO. Phys Chem Chem Phys 2013, 15 (31),
13153–13161. https://doi.org/10.1039/C3CP51894A.
(247) Dunne, S. R. Industrial Gas Phase Adsorptive Separations. In Zeolites in Industrial
Separation and Catalysis; John Wiley & Sons, Ltd, 2010; pp 273–305.
https://doi.org/10.1002/9783527629565.ch9.
(248) Ruthven, D. M. Principles of Adsorption and Adsorption Processes; John Wiley & Sons:
New York, 1984.
(249) Azzam, S. A.; Alshafei, F. H.; López-Ausens, T.; Ghosh, R.; Biswas, A. N.; Sautet, P.;
Prikhodko, S.; Simonetti, D. A. Effects of Morphology and Surface Properties of Copper
Oxide on the Removal of Hydrogen Sulfide from Gaseous Streams. Ind. Eng. Chem. Res.
2019, 58 (40), 18836–18847. https://doi.org/10.1021/acs.iecr.9b03975.
(250) Pattrick, R. A. D.; Mosselmans, J. F. W.; Charnock, J. M.; England, K. E. R.; Helz, G.
R.; Garner, C. D.; Vaughan, D. J. The Structure of Amorphous Copper Sulfide
Precipitates: An X-Ray Absorption Study. Geochim. Cosmochim. Acta 1997, 61 (10),
2023–2036. https://doi.org/10.1016/S0016-7037(97)00061-6.

226
(251) Fjellvåg, H.; Grønvold, F.; Stølen, S.; Andresen, A.; Müller-Käfer, R. Low-Temperature
Structural Distortion in CuS. Z. Krist. - Z Krist. 1988, 184, 111–121.
https://doi.org/10.1524/zkri.1988.184.1-2.111.
(252) Li, D.; Bancroft, G. M.; Kasrai, M.; Fleet, M. E.; Feng, X. H.; Yang, B. X.; Tan, K. H. S
K- and L-Edge XANES and Electronic Structure of Some Copper Sulfide Minerals.
Phys. Chem. Miner. 1994, 21 (5), 317–324. https://doi.org/10.1007/BF00202096.
(253) Kumar, P.; Nagarajan, R.; Sarangi, R. Quantitative X-Ray Absorption and Emission
Spectroscopies: Electronic Structure Elucidation of Cu2S and CuS. J. Mater. Chem. C
2013, 1 (13), 2448. https://doi.org/10.1039/c3tc00639e.
(254) Mercury - The Cambridge Crystallographic Data Centre (CCDC)
https://www.ccdc.cam.ac.uk/solutions/csd-system/components/mercury/ (accessed Oct
17, 2019).
(255) Bare, S.; Ressler, T. Chapter 6 Characterization of Catalysts in Reactive Atmospheres by
X-Ray Absorption Spectroscopy. Adv. Catal. - ADVAN CATAL 2009, 52, 339–465.
https://doi.org/10.1016/S0360-0564(08)00006-0.
(256) Koningsberger, D. C.; Prins, R. (eds. ). X-Ray Absorption: Principles, Applications,
Techniques of EXAFS, SEXAFS, and XANES; John Wiley and Sons,New York, NY:
United States, 1988.
(257) Bolin, T. B.; Wu, T.; Schweitzer, N.; Lobo-Lapidus, R.; Kropf, A. J.; Wang, H.; Hu, Y.;
Miller, J. T.; Heald, S. M. In Situ Intermediate-Energy X-Ray Catalysis Research at the
Advanced Photon Source Beamline 9-BM. Catal. Today 2013, 205, 141–147.
https://doi.org/10.1016/j.cattod.2012.09.034.
(258) Sharma, A.; Varshney, M.; Park, J.; Ha, T.-K.; Chae, K.-H.; Shin, H.-J. XANES, EXAFS
and Photocatalytic Investigations on Copper Oxide Nanoparticles and Nanocomposites.
RSC Adv. 2015, 5 (28), 21762–21771.
(259) Marinkovic, N. S.; Sasaki, K.; Adzic, R. R. Determination of Single- and Multi-
Component Nanoparticle Sizes by X-Ray Absorption Spectroscopy. J. Electrochem. Soc.
2018, 165 (15), J3222–J3230. https://doi.org/10.1149/2.0281815jes.
(260) Hoffman, A. S.; Azzam, S.; Zhang, K.; Xu, Y.; Liu, Y.; Bare, S. R.; Simonetti, D. A.
Direct Observation of the Kinetics of Gas–Solid Reactions Using in Situ Kinetic and
Spectroscopic Techniques. React. Chem. Eng. 2018, 3 (5), 668–675.
https://doi.org/10.1039/C8RE00020D.
(261) EVANS, H. T. Djurleite (Cu1.94S) and Low Chalcocite (Cu2S): New Crystal Structure
Studies. Science 1979, 203 (4378), 356–358.
(262) Koto, K.; Morimoto, N. The Crystal Structure of Anilite. Acta Crystallogr. B 1970, 26
(7), 915–924. https://doi.org/10.1107/S0567740870003370.
(263) R. J. Goble, R. I.; George Robinson. Geerite, Cu (Sub 1.60) S, a New Copper Sulfide
from Dekalb Township, New York. Can. Mineral. 1980, 18 (4), 519–523.

227
(264) Mumme, W. G.; Gable, R. W.; Petricek, V. The Crystal Structure of Roxbyite, Cu58S32.
Can. Mineral. 2012, 50 (2), 423–430. https://doi.org/10.3749/canmin.50.2.423.
(265) Rosso, I.; Galletti, C.; Bizzi, M.; Saracco, G.; Specchia, V. Zinc Oxide Sorbents for the
Removal of Hydrogen Sulfide from Syngas. Ind. Eng. Chem. Res. 2003, 42 (8), 1688–
1697. https://doi.org/10.1021/ie0208467.
(266) Garces, H. F.; Galindo, H. M.; Garces, L. J.; Hunt, J.; Morey, A.; Suib, S. L. Low
Temperature H2S Dry-Desulfurization with Zinc Oxide. Microporous Mesoporous
Mater. 2010, 127 (3), 190–197. https://doi.org/10.1016/j.micromeso.2009.07.022.
(267) Balichard, K.; Nyikeine, C.; Bezverkhyy, I. Nanocrystalline ZnCO3-A Novel Sorbent
for Low-Temperature Removal of H2S. J. Hazard. Mater. 2014, 264, 79–83.
https://doi.org/10.1016/j.jhazmat.2013.10.068.
(268) Girard, V.; Baudot, A.; Chiche, D.; Bazer-Bachi, D.; Bounie, C.; Geantet, C. Rational
Selection of Single Oxide Sorbents for Syngas Desulfurization Regenerable at Reduced
Temperature: Thermochemical Calculations and Experimental Study. Fuel 2014, 128,
220–230. https://doi.org/10.1016/j.fuel.2014.02.058.
(269) Jalan, V. Studies involving high temperature desulfurization/regeneration reactions of
metal oxides for fuel cell development. Final report
https://digital.library.unt.edu/ark:/67531/metadc1061781/ (accessed Aug 18, 2019).
https://doi.org/10.2172/5143010.
(270) Rosenqvist, T. Phase Equilibria in the Pyrometallurgy of Sulfide Ores. Metall. Trans. B
1978, 9 (3), 337–351. https://doi.org/10.1007/BF02654407.
(271) Elyassi, B.; Wahedi, Y. A.; Rajabbeigi, N.; Kumar, P.; Jeong, J. S.; Zhang, X.; Kumar,
P.; Balasubramanian, V. V.; Katsiotis, M. S.; Andre Mkhoyan, K.; Boukos, N.; Hashimi,
S. A.; Tsapatsis, M. A High-Performance Adsorbent for Hydrogen Sulfide Removal.
Microporous Mesoporous Mater. 2014, 190, 152–155.
https://doi.org/10.1016/j.micromeso.2014.02.007.
(272) Huang, G.; He, E.; Wang, Z.; Fan, H.; Shangguan, J.; Croiset, E.; Chen, Z. Synthesis and
Characterization of γ-Fe2O3 for H2S Removal at Low Temperature. Ind. Eng. Chem.
Res. 2015, 54 (34), 8469–8478. https://doi.org/10.1021/acs.iecr.5b01398.
(273) Baird, T.; Campbell, K. C.; Holliman, P. J.; Hoyle, R.; Stirling, D.; Williams, B. P. Mixed
Co-Zn-Al Oxides as Absorbents for Low-Temperature Gas Desulfurisation. J. Chem.
Soc. Faraday Trans. 1995, 91 (18), 3219–3230. https://doi.org/10.1039/FT9959103219.
(274) Xue, M.; Chitrakar, R.; Sakane, K.; Ooi, K. Screening of Adsorbents for Removal of
H2S at Room Temperature. Green Chem. 2003, 5 (5), 529–534.
https://doi.org/10.1039/B303167P.
(275) Azzam, S. A.; Alshafei, F. H.; López-Ausens, T.; Ghosh, R.; Biswas, A. N.; Sautet, P.;
Prikhodko, S.; Simonetti, D. A. Effects of Morphology and Surface Properties of Copper
Oxide on the Removal of Hydrogen Sulfide from Gaseous Streams. Ind. Eng. Chem. Res.
2019, 58 (40), 18836–18847. https://doi.org/10.1021/acs.iecr.9b03975.

228
(276) Grant, D. J. W.; York, P. A Disruption Index for Quantifying the Solid State Disorder
Induced by Additives or Impurities. II. Evaluation from Heat of Solution. Int. J. Pharm.
1986, 28 (2–3), 103–112. https://doi.org/10.1016/0378-5173(86)90233-4.
(277) Sun, X.-Y.; Zhang, X.; Sun, X.; Qian, N.-X.; Wang, M.; Ma, Y.-Q. Improved Adsorption
and Degradation Performance by S-Doping of (001)-TiO 2. Beilstein J. Nanotechnol.
2019, 10, 2116–2127. https://doi.org/10.3762/bjnano.10.206.
(278) Singhal, S.; Kaur, J.; Namgyal, T.; Sharma, R. Cu-Doped ZnO Nanoparticles: Synthesis,
Structural and Electrical Properties. Phys. B Condens. Matter 2012, 407 (8), 1223–1226.
https://doi.org/10.1016/j.physb.2012.01.103.
(279) Jansons, A. W.; Koskela, K. M.; Crockett, B. M.; Hutchison, J. E. Transition Metal-
Doped Metal Oxide Nanocrystals: Efficient Substitutional Doping through a Continuous
Growth Process. Chem. Mater. 2017, 29 (19), 8167–8176.
https://doi.org/10.1021/acs.chemmater.7b02176.
(280) AAsbrink, S.; Norrby, L.-J. A Refinement of the Crystal Structure of Copper(II) Oxide
with a Discussion of Some Exceptional e.s.d.’s. Acta Crystallogr. Sect. B 1970, 26 (1),
8–15. https://doi.org/10.1107/S0567740870001838.
(281) Azzam, S.; Alshafei, F. H.; Lopez-Ausens, T.; Ghosh, R.; Biswas, A. N.; Sautet, P.;
Prikhodko, S. V.; Simonetti, D. A. Effects of Morphology and Surface Properties of
Copper Oxide on the Removal of Hydrogen Sulfide from Gaseous Streams. Ind. Eng.
Chem. Res. 2019. https://doi.org/10.1021/acs.iecr.9b03975.
(282) Lamberti, C. The Use of Synchrotron Radiation Techniques in the Characterization of
Strained Semiconductor Heterostructures and Thin Films. Surf. Sci. Rep. 2004, 53 (1–5),
1–197. https://doi.org/10.1016/j.surfrep.2003.12.001.
(283) Pickering, I. J.; Prince, R. C.; Divers, T.; George, G. N. Sulfur K-Edge X-Ray Absorption
Spectroscopy for Determining the Chemical Speciation of Sulfur in Biological Systems.
FEBS Lett. 1998, 441 (1), 11–14. https://doi.org/10.1016/S0014-5793(98)01402-1.
(284) Fleet, M. E.; Liu, X.; Harmer, S. L.; King, P. L. Sulfur K-Edge XANES Spectroscopy:
Chemical State and Content Of Sulfur In Silicate Glasses. Can. Mineral. 2005, 43 (5),
1605–1618. https://doi.org/10.2113/gscanmin.43.5.1605.
(285) Asakura, H.; Shishido, T.; Teramura, K.; Tanaka, T. Local Structure and La L 1 and L 3
-Edge XANES Spectra of Lanthanum Complex Oxides. Inorg. Chem. 2014, 53 (12),
6048–6053. https://doi.org/10.1021/ic500381z.
(286) Abbasian, J.; Slimane, R. B. A Regenerable Copper-Based Sorbent for H2S Removal
from Coal Gases. Ind. Eng. Chem. Res. 1998, 37 (7), 2775–2782.
https://doi.org/10.1021/ie980047h.
(287) Sandra, F.; Schade, E.; Leistner, M.; Grothe, J.; Kaskel, S. Solvothermal Synthesis of a
Bismuth/Zinc Mixed Oxide Material for H2S Removal at Room Temperature: Synthesis,
Performance, Characterization and Regeneration Ability. Mater. Chem. Phys. 2017, 199,
329–339. https://doi.org/10.1016/j.matchemphys.2017.06.063.

229
(288) Jun, H. K.; Lee, T. J.; Ryu, S. O.; Kim, J. C. A Study of Zn−Ti-Based H2S Removal
Sorbents Promoted with Cobalt Oxides. Ind. Eng. Chem. Res. 2001, 40 (16), 3547–3556.
https://doi.org/10.1021/ie0011167.
(289) Jung, S. Y.; Lee, S. J.; Lee, T. J.; Ryu, C. K.; Kim, J. C. H2S Removal and Regeneration
Properties of Zn–Al-Based Sorbents Promoted with Various Promoters. Catal. Today
2006, 111 (3), 217–222. https://doi.org/10.1016/j.cattod.2005.10.029.
(290) Wang, J.; Yang, C.; Zhao, Y.-R.; Fan, H.-L.; Wang, Z.-D.; Shangguan, J.; Mi, J.
Synthesis of Porous Cobalt Oxide and Its Performance for H2S Removal at Room
Temperature. Ind. Eng. Chem. Res. 2017, 56 (44), 12621–12629.
https://doi.org/10.1021/acs.iecr.7b02934.
(291) Zeng, B.; Yue, H.; Liu, C.; Huang, T.; Li, J.; Zhao, B.; Zhang, M.; Liang, B.
Desulfurization Behavior of Fe–Mn-Based Regenerable Sorbents for High-Temperature
H2S Removal. Energy Fuels 2015, 29 (3), 1860–1867.
https://doi.org/10.1021/ef502092v.