POLYPHENYLENE SULFIDE (PPS) MARKET STUDY
33
POLYPHENYLENE SULFIDE (PPS) MARKET STUDY NOVEMBER 2010 © 2010 SRI CONSULTING PROCESS ECONOMICS PROGRAM 4300 Bohannon Drive, Ste 200 • Menlo Park, California 94025 Fax: (650) 330-1149 • Telephone: (650) 384-4307 e-mail: [email protected] POLYPHENYLENE SULFIDE (PPS) MARKET STUDY NOVEMBER 30, 2010 Prepared by: R. J. Chang with Hiroaki Mori and Wei Yang
Transcript of POLYPHENYLENE SULFIDE (PPS) MARKET STUDY

POLYPHENYLENE SULFIDE (PPS) MARKET STUDY NOVEMBER 2010
© 2010 SRI CONSULTING
PROCESS ECONOMICS PROGRAM
4300 Bohannon Drive, Ste 200 • Menlo Park, California 94025
Fax: (650) 330-1149 • Telephone: (650) 384-4307
e-mail: [email protected]
POLYPHENYLENE SULFIDE (PPS) MARKET STUDY
NOVEMBER 30, 2010
Prepared by: R. J. Chang
with Hiroaki Mori and Wei Yang
POLYPHENYLENE SULFIDE (PPS) MARKET STUDY NOVEMBER 2010 2
© 2010 SRI CONSULTING
The information provided in this publication has been obtained from a variety of sources, which SRI Consulting believes to be reliable. SRI Consulting makes no warranties as to the accuracy, completeness or correctness of the information in this publication. Consequently, SRI Consulting will not be liable for any technical inaccuracies, typographical errors or omissions contained in this publication. This publication is provided without warranties of any kind, either express or implied, including but not limited to, implied warranties of merchantability, fitness for a particular purpose, or non-infringement.
IN NO EVENT WILL SRI CONSULTING BE LIABLE FOR ANY INCIDENTAL, CONSEQUENTIAL OR INDIRECT DAMAGES (INCLUDING BUT NOT LIMITED TO DAMAGES FOR LOSS OF PROFITS, BUSINESS INTERRUPTION, OR THE LIKE) ARISING OUT OF THE USE OF THIS PUBLICATION, EVEN IF IT WAS NOTIFIED ABOUT THE POSSIBILITY OF SUCH DAMAGES. BECAUSE SOME STATES DO NOT ALLOW THE EXCLUSION OR LIMITATION OF LIABILITY FOR CONSEQUENTIAL OR INCIDENTAL DAMAGES, THE ABOVE LIMITATION MAY NOT APPLY TO YOU. IN SUCH STATES SRI CONSULTING’S LIABILITY IS LIMITED TO THE MAXIMUM EXTENT PERMITTED BY SUCH LAW.
Certain statements in this publication are projections or other forward-looking statements. Any such statements contained herein are based upon SRI Consulting’s current knowledge and assumptions about future events, including, without limitation, anticipated levels of global demand and supply, expected costs, trade patterns, and general economic, political, and marketing conditions. Although SRI Consulting believes that the expectations reflected in the forward-looking statements are reasonable, it cannot, and does not, guarantee, without limitation, future results, levels of activity, performance or achievements. Readers should verify through independent third-party sources any estimates, projections or other forward-looking statements or data contained herein before reaching any conclusions or making any investment decisions. SRI Consulting is not responsible for the Reader’s use of any information in this publication.
The absence of a specific trademark designation within this publication does not mean that proprietary rights may not exist in a particular name. No listing, description or designation in this publication is to be construed as affecting the scope, validity, or ownership of any trademark rights that may exist therein. SRI Consulting makes no warranties as to the accuracy of any such listing, description or designation, nor to the validity or ownership of any trademark.

POLYPHENYLENE SULFIDE (PPS) MARKET STUDY NOVEMBER 2010
3
© 2010 SRI CONSULTING
THIS REPORT WAS PREPARED BY SRI CONSULTING, (“SRIC”) FOR THE CLIENT COMPANY. THE OPINIONS, ANALYSIS, EVALUATIONS, OR RECOMMENDATIONS CONTAINED HEREIN ARE FOR THE SOLE USE AND BENEFIT OF THE CLIENT COMPANY. THERE ARE NO INTENDED THIRD PARTY BENEFICIARIES AND SRIC AND ITS AFFILIATES SHALL HAVE NO LIABILITY WHATSOEVER TO THIRD PARTIES FOR ANY DEFECT, DEFICIENCY, ERROR, OR OMISSION IN ANY STATEMENT CONTAINED IN OR IN ANY WAY RELATED TO THE STUDY. NEITHER SRIC NOR ANY PERSON ACTING ON SRIC’S BEHALF MAKES ANY WARRANTY, EXPRESS OR IMPLIED, OR ASSUMES ANY LIABILITY WITH RESPECT TO THE RELIANCE UPON OR USE OF ANY INFORMATION OR ANALYSIS DISCLOSED IN THE STUDY. ANY OPINIONS OR CONCLUSIONS REACHED IN THIS REPORT ARE DEPENDENT UPON NUMEROUS ASSUMPTIONS AND ECONOMIC CONDITIONS OVER WHICH SRIC HAS NO CONTROL, AND WHICH MAY OR MAY NOT OCCUR. RELIANCE UPON SUCH OPINIONS OR CONCLUSIONS BY ANY PERSON OR ENTITY IS AT THE SOLE RISK OF THE PERSON RELYING THEREON.

POLYPHENYLENE SULFIDE (PPS) MARKET STUDY NOVEMBER 2010 4
© 2010 SRI CONSULTING
TABLE OF CONTENTS
Table of Contents.......................................................................................................................................... 4
Executive Summary ...................................................................................................................................... 5
Introduction to Polyphenylene sulfide (PPS)................................................................................................ 5 Products..................................................................................................................................................... 5 Comparison of PPS with other high performance thermoplastics ............................................................ 7 Technology and Manufacture ................................................................................................................... 9 PPS Value Chain..................................................................................................................................... 10 PPS End-use markets .............................................................................................................................. 11
Electrical and Electronic Applications................................................................................................ 11 Automotive Applications .................................................................................................................... 12 Industrial Applications........................................................................................................................ 13 Coatings .............................................................................................................................................. 13 Filters and Filter Bags......................................................................................................................... 13 Aerospace Applications ...................................................................................................................... 15 Recycled PPS Replacement ................................................................................................................ 15 New Products...................................................................................................................................... 16
project Background and goals..................................................................................................................... 16
Total PPs Demand in China by market segment......................................................................................... 17 Electrical and Electronics Market ........................................................................................................... 18 Automotive Market ................................................................................................................................. 18 Industrial Applications............................................................................................................................ 18 Filter Bags............................................................................................................................................... 18 Aerospace and Defense Applications...................................................................................................... 19 Coatings .................................................................................................................................................. 20
Global Demand and Supply Dynamics....................................................................................................... 20 GLOBAL CAPACITY 2005-2015 ............................................................................................................... 20 global supply and Demand 2009............................................................................................................. 25 GLOBAL DEMAND 2008-2015 ................................................................................................................. 25 global capacity vs. demand 2008-2015................................................................................................... 27 Prices....................................................................................................................................................... 28
Market Position........................................................................................................................................... 30
About SRI Consulting................................................................................................................................. 30 Programs ................................................................................................................................................. 31
The Process Economics Program (PEP) ............................................................................................. 31 The Chemical Economics Handbook (CEH) ...................................................................................... 31 The World Petrochemicals Program (WP) ......................................................................................... 31 The Specialty Chemicals Update Program (SCUP)............................................................................ 31 The China Report................................................................................................................................ 31
Staff......................................................................................................................................................... 32 Clients ..................................................................................................................................................... 32 Report Authors........................................................................................................................................ 32

POLYPHENYLENE SULFIDE (PPS) MARKET STUDY NOVEMBER 2010
5
© 2010 SRI CONSULTING
EXECUTIVE SUMMARY
Following are the key findings of this updated PPS market research study:
Sino Polymer’s sales volume continues to grow. It increased from 7.2 kta in 2007 to 11.9 kta in 2008, and to 17.9 kta in 2009, all in neat resin basis. In the first half of 2010, the company achieved a sales volume of 11.1 kta.
Sino Polymer has been gaining market share by providing good-quality PPS resins and fibers while maintaining price advantages over its major competitors. It also offers faster delivery than most of its overseas suppliers. Since its initial production in 2004, it has increased its market share in China to about 52% in 2009.
PPS demand in China is expected to continue its rapid rise due to fast growth in industrial production and favorable government policies and regulations that are expected to stimulate PPS’s major end-use markets. Total PPS demand in China is forecast to grow from 40 kta in 2010 to 79 kta in 2015.
Since July 2010, Sino Polymer has started a project to add 15 thousand metric tons of PPS fiber capacity to be completed by the end of 2011. Also, the company has started the procurement of equipment since November 2009 to construct a new resin plant with 25 thousand metric tons additional capacity. The new resin plant is estimated to be completed also by mi-2012
Currently, Sino Polymer is the largest single PPS resin producer in the world in terms of capacity (with total resin capacity of 30 thousand metric tons) and leads the world in capacity for fiber-grade resins as well as in fiber production (5 thousand metric tons).
In 2010, Sino Polymer’s compound production capacity is about 30 thousand metric tons (or about 15 thousand metric tons on a resin basis).
Sino Polymer and Toray are the two most vertically integrated PPS producer in the world, having capability to produce various grades of resins, compounds, fibers, films, papers, and composites.
In addition to Sino Polymer’s capacity expansion, all major U.S. and Japanese producers have also increased capacities significantly in the past few years. With total capacity far exceeding domestic demand, US and Japanese producers will target China for growth, even more than in the past.
Thus, the PPS market in China is expected to become more and more competitive. PPS prices are expected to vary with the global capacity utilization rate, but overall will be constrained by the global overcapacity.
INTRODUCTION TO POLYPHENYLENE SULFIDE (PPS)
PRODUCTS
Polyphenylene sulfide (PPS) is a crystalline, wholly aromatic polymer that contains sulfide (–S–) linkages. The characteristics of the polymers depend on the molecular weight of the polymers. Three

POLYPHENYLENE SULFIDE (PPS) MARKET STUDY NOVEMBER 2010 6
© 2010 SRI CONSULTING
types of grades are available—neat resin, glass filled and glass/mineral filled. All PPS resins are characterized by outstanding chemical resistance and high-temperature stability, although they differ somewhat with respect to mechanical properties and processibility. PPS resin manufacturing processes are broadly divided into partial cross-linking (branched or standard) and linear processes. Branched PPS (a polymer molecule has side chains branching out from its backbone) was introduced commercially in the 1970s, and the resulting resin is dark in color, hard and brittle. Process refinements in the 1980s led to a linear polymer. Linear PPS polymer (a molecule essentially consists of a long backbone) is said to offer significant cost and performance benefits over branched PPS, and to overcome the weak points of branched PPS.
Related polymers include Ryton® polyphenylene sulfide sulfone (PPSS), a random copolymer developed by Phillips, and Amorvon® polythioethersulfone (PTES), a PPS/PPSS block copolymer produced by Dainippon Ink and Chemicals. (“Thioether” is an alternative name for the sulfide linkage and polymers that contain this functional group.) Phillips no longer manufactures PPSS, but Dainippon continues to produce PTES in Kashima, Japan. Polyphenylene sulfide’s physical properties include the following.
Outstanding Chemical Resistance. No known solvent is capable of dissolving PPS at temperatures below 204°C (400°F). PPS is often the material of choice for aggressive chemical environments because it can tolerate prolonged exposure to many organic solvents and limited exposure to inorganic acids and bases at elevated temperatures.
Excellent Thermal Stability. PPS’s heat deflection temperature (260°C, >500°F) and continuous-use temperature (200-240°C, 392-464°F) exceed those of PSO, PES, polyetherimide and engineering thermoplastics such as PET, PBT and polycarbonate. The only thermoplastics with better thermal stability are high-temperature LCPs (liquid crystal polymers) and some polyimides.
Good Dimensional Stability. PPS has a low coefficient of thermal expansion and does not absorb water. Moreover, the polymer exhibits very low creep under many loading conditions.
Inherent Flame Retardance. PPS achieves a UL rating of 94 V-0 at a thickness of one-thirty-second of an inch without the addition of flame retardants.
Good Electrical Properties. PPS provides both insulating properties and arc resistance. Table 1 presents representative properties of selected PPS resins.
Table 1
Representative Properties of Polyphenylene Sulfide Resins (40% glass-reinforced)
Ryton® R-4XT Fortron® 1140L4 Supec® G401
Specific Gravity 1.65 1.6 1.6 Water Absorption (percent in 24 hours) na 0.02 <0.01 Tensile Strength (1,000 psi) 28.0 29.0 24.5 Flexural Strength (1,000 psi) 40.5 40.0 35.0 Notched Izod Impact, 1/8 inch (ft-lb/inch of notch)
1.7
2.0
1.5
Coefficient of Linear Thermal Expansion (x 10-5 inch/inch/°F)
na
na
1.3
Heat Deflection Temperature (at 264 psi) >260°C 266°C >260°C Dielectric Strength (volts per 0.001 inch) 500 390 na Oxygen Index (percent) na 47 47

POLYPHENYLENE SULFIDE (PPS) MARKET STUDY NOVEMBER 2010
7
© 2010 SRI CONSULTING
Source: SRI Consulting.
Depending on the molecular weight of the polymer, PPS can be brittle and have a tendency to flash. “Flash” refers to the excess resin attached to the edges of an injection-molded part. This surplus material must be trimmed from the finished part in a second operation. Both problems have been reduced through the development of new grades with improved impact resistance and carefully tailored melt viscosities for specific applications. In addition, PPS producers have worked closely with compounders and customers to optimize processing conditions. Good mold fit and maintenance are critical to minimizing flash.
PPS competes with a wide variety of materials, including metals (e.g., stainless steel, brass, aluminum and alloys), thermoplastic polyesters (PBT and PCT), nylons, epoxies, and other high performance thermoplastics (LCPs, polyphthalamides, and nylon 46). However, PPS’s outstanding chemical resistance distinguishes it from all other competitors. Few materials can match PPS’s ability to tolerate hot, humid and corrosive conditions. The polymer is specified for many demanding applications because of its chemical resistance, excellent heat deflection temperature (HDT), good electrical properties, light weight and ease of fabrication relative to metals.
COMPARISON OF PPS WITH OTHER HIGH PERFORMANCE THERMOPLASTICS
PPS belongs to a group of high performance thermoplastics (HPTPs), which are high-priced, low-volume polymers that are sold for use in specialized applications that require a combination of extraordinary properties. These polymers represent a very small subset of the entire thermoplastics industry, which consists primarily of high-volume commodity thermoplastics (e.g., polyolefins, vinyls and styrenics) as well as medium-volume engineering thermoplastics (e.g., nylon, polyacetal, polyesters, polyphenylene ether alloys and polycarbonate). In the United States, for example, HPTPs represented only 0.1% of the total volume, and about 1% of the total value, of all thermoplastics sold in 2007.
The triangle in Figure 1 provides an overview of the thermoplastics world for amorphous and semicrystalline materials in the different price/performance sectors. In 2009, world consumption of these thermoplastic materials was approximately 150 million metric tons; commodity thermoplastics accounted for 174 million metric tons, engineering thermoplastic compounds (with ABS compounds included) for 10 million metric tons and high performance thermoplastics for only 0.1 million metric tons. The triangle is not to scale, and therefore gives a misleading picture of the distribution of the sales volumes over the different sectors; the bottom sector should be much wider and the top sector hardly noticeable.

POLYPHENYLENE SULFIDE (PPS) MARKET STUDY NOVEMBER 2010 8
© 2010 SRI CONSULTING
ABS
PMMA
PBT
ABS/PA POM
PP
HIPS
PVC
PSLLDPE HDPE
LDPE
Amorphous Semicrystalline
Pric
e/Pe
rfor
man
ce R
atio
High Performance Thermoplastics~0.1 Million Metric Tons
Engineering Thermoplastics~10 Million Metric Tons
Commodity Plastics140 Million Metric Tons
PSU
PC
PPS
PS/PPE
PC/ABS
PA6
PET
FIGURE 19World Consumption of Thermoplastics—2009
(not to scale)
Worldwide Consumption—2009: 150 Million Metric Tons
PC/PETTPE
PA66
PESPEI
PA46
PEEK
Figure 2 gives a more detailed price/performance comparison of PPS with other high performance thermoplastics.

POLYPHENYLENE SULFIDE (PPS) MARKET STUDY NOVEMBER 2010
9
© 2010 SRI CONSULTING
0
20
40
60
80
100
HPPA PAR PSO PPS LCP PES PEEK
FIGURE 2Prices and Properties of High Performance Thermoplastics—2007
Dollars per Kilogram
(HDT =280 F)
(HDT =345 F)
(HDT =345 F)
(HDT =345 F)
(HDT =351–469 F)
(HDT =398 F)
(HDT =340 F)
Com
bust
ion
Res
ista
nce
Com
bust
ion
Res
ista
nce
Che
mic
al R
esis
tanc
eE
lect
rical
Pro
pert
ies
Out
stan
ding
Che
mic
al R
esis
tanc
eC
ombu
stio
n R
esis
tanc
e
Exc
elle
nt D
imen
sion
al S
tabi
lity
Low
Shr
inka
geH
igh
Ten
sile
Str
engt
hE
lect
rical
Pro
pert
ies
Dim
ensi
onal
Sta
bilit
yC
ombu
stio
n R
esis
tanc
e
Exc
elle
nt C
hem
ical
Res
ista
nce
Mec
hani
cal P
rope
rtie
sR
eten
tion
of P
rope
rtie
s ov
er a
Wid
e T
Ran
ge
(w/ 30%glass fiber
HDT = >500 F)
HDT = Heat deflection temperature; T = temperature
Source: SRI Consulting.
When an application requires resistance to high temperature and combustion or chemical resistance , PPS is the material of choice in various industries. On a price/performance basis, PPS is most often selected high performance thermoplastic to replace metals.
TECHNOLOGY AND MANUFACTURE
PPS polymers were first introduced commercially in 1973 in the United States by Phillips Petroleum Company. Because of a strong patent position, Phillips was the only producer of PPS base resin worldwide for more than a decade. After the 1987 expiration of Phillips’ key patents, however, several new competitors entered the business. Among the newcomers was Kureha Chemical Industry, which had developed a proprietary one-step process for manufacturing linear PPS. In 1988, Kureha began producing linear PPS in Japan, and its joint venture partner, Hoechst Celanese, introduced the product to U.S. markets in 1993.
Phillips responded by filing suit against Kureha and Hoechst Celanese, claiming that Phillips’ patents covered a one-step manufacturing process similar to that used by Kureha and Hoechst Celanese. The dispute was resolved in 1990.
There appear to be no patent conflicts between Phillips and other Japanese producers, including DIC EP, Toray, and Tosoh Corporation.
Chevron Phillips produces its Ryton® PPS resin via the reaction of p-dichlorobenzene with sodium sulfide in a polar organic solvent, as shown in the following equation:

POLYPHENYLENE SULFIDE (PPS) MARKET STUDY NOVEMBER 2010 10
© 2010 SRI CONSULTING
n
S + 2n NaClCl + n Na2 Sn Cl
The initial product is, as its chemical formula suggests, linear. Subsequent air-curing at high temperatures builds different-molecular-weight polymers. Higher-molecular-weight polymers have somewhat better creep and fatigue resistance than the low-molecular-weight polymers.
The widely available organic intermediate, p-dichlorobenzene (used in mothballs), is commercially available from several sources in the United States, Europe and Japan. Neither of the U.S. producers is back-integrated to the monomer. In Japan, only Kureha Chemical has production capacity for p-dichlorobenzene. Hodogaya Chemicals, Tosoh’s former joint venture partner, recently announced it was discontinuing production of the monomer.
Because neat PPS is relatively brittle, the resin is usually compounded with glass, carbon fibers or mineral fillers to improve its impact strength and other mechanical properties. Some 85% of commercially available PPS products are compounds. These compounds generally contain about 60% PPS resin by weight in glass-filled and 35% PPS resin by weight in mineral/glass-filled grades. Blends with other resins (e.g., polyetherimide and PTFE) are also commercially available.
Although most PPS is fabricated by injection molding, the polymer can be successfully processed by lost-core, blow-molding, and extrusion techniques as well. Extrusion grades for film and fiber fabrication are also commercially available.
PPS VALUE CHAIN
Most high performance thermoplastics including PPS are compounded before fabrication of the final product. Plastics compounding is an operation in which a base polymer is combined with additives or other polymers to enhance the properties of the base polymer or to reduce the material costs. The resulting product is then formed into the desired shape by molding processes. As shown in Figure 3, compounding is in the middle stage of the plastics production value chain involving raw material and polymer manufacturer, compounder, molder, OEM systems supplier and end user.

POLYPHENYLENE SULFIDE (PPS) MARKET STUDY NOVEMBER 2010
11
© 2010 SRI CONSULTING
MonomerProducer
PolymerProducer
Com-pounder Molder
OEMSystemSupplier
End User
Process DevelopmentTechnology LeadershipQuality Improvement
Cost Reduction
Process DevelopmentApplications Development
Technical SupportComputer-Aided
EngineeringQuality Assurance
Development Partnership
Support
Feedback
FIGURE 3Value Chain for Plastics Production Process
Source: SRI Consulting.
Crystalline high performance polymers are usually compounded with glass fibers, mineral reinforcements or other polymers and so are about 40-50% of the amorphous high performance polymers. Most HPTP compounding is carried out in-house by the HPTP producer itself, although some compounding may be done by nonaffiliated companies that serve either the polymer producer on a toll conversion basis or the fabricator on a custom basis. Some independent compounders also produce their own lines of proprietary compounds for sale to specialized fabricators. In general, HPTP suppliers with global objectives tend to establish compounding facilities in other important market regions in advance of investing in local production facilities.
When PPS resins are used in the manufacture of PPS fiber for filter applications, polymer producers provide extrusion-grade resins to fiber producers to spin into fibers. Fibers are then made into felts or fabrics by specialized fabric producers. In the case of the filter bag application, felts and fabrics are made into filter bags and supplied to filter baghouse manufacturers. Filter baghouse is then supplied to the end users such as electrical power plants, industrial plants, thermal plants, or incinerators.
PPS END-USE MARKETS
ELECTRICAL AND ELECTRONIC APPLICATIONS
PPS has wide uses in electrical and electronic (E&E) markets. In China, a large use is in electrical appliance components. Electrical appliance applications include pump housing/impellers, circuit breakers, relay housings, connectors, bobbins, coil encapsulation, motor brush cards, fans and blowers, heat exchangers, thermostat housings, large and small appliances. Electronic applications include connectors, sockets, relays, switches, circuit breakers, encapsulation and packaging (transistors, capacitors, multichip modules, potting cups, power converters), bobbins and coils (microwave, power control modules, printer heads), CD/DVD optical pickup components, HDTV and projection light engine housing and inkjet cartridges.

POLYPHENYLENE SULFIDE (PPS) MARKET STUDY NOVEMBER 2010 12
© 2010 SRI CONSULTING
In recent years, an important trend in manufacturing electronic components is the use of lead-free solder, which requires plastic parts involved in the soldering process to withstand 240-260°C. PPS not only satisfies the high-temperature requirement but also its inherent flame resistance and excellent electrical properties make it a preferred and most cost-effective choice in this application. Another increasing requirement for PPS in E&E applications, however, is low chlorine content. Chlorine in PPS comes from two sources—sodium chloride impurity left as a polymerization by-product and bound chlorine which still bonds to the polymer molecules. High chlorine may cause corrosion in electronic circuits. Also, the European WEEE regulation specifies a limit of less than 900 ppm in E&E plastic components.
Sino Polymer has recently successfully developed a low-chlorine-grade PPS resin, which commands a price premium in the market. Some grades have demonstrated low chlorine levels of 250-310 ppm. In July 2008, Ticona introduced a low-chlorine grade (<900 ppm), Fortron 1140A66. The selling price is reportedly $14 per kilogram. Another way Sino Polymer can increase the value of its PPS is to obtain UL (Underwriters Laboratories) certification for its high temperature and flame resistance. UL certification is a lengthy and high-cost process. However, in the long run, it is worth the effort since many E&E parts require UL labeling.
Even with the recent rise in labor costs, due to its immense domestic market and superior infrastructure, China will continue to be the manufacturing center for electrical and electronic parts in the years to come. Growth rates in these markets are expected to be in line with GDP growth.
AUTOMOTIVE APPLICATIONS
PPS is increasingly used in the automotive industry where resistance to fuel, antifreeze and transmission and brake fluids at high under-the-hood temperatures is required. PPS automotive applications include fuel system parts (fuel rails, fuel injectors, injector bobbins, fuel pumps, fuel pump impellers, fuel pump caps, fuel line connectors, filter housings), electrical and electronic components (alternator components, sensors, switches, ignition components, brush holders for motors), wire coatings, induction systems (intake manifolds, air pumps, turbocharger components, hot air inlets), coolant systems (water pumps, flow meters, impellers, thermostat housings, tubes, pump caps, heater core tanks), engine components (seal housings, gasket carriers, camshafts, oil pumps, throttle bodies, heat shields), powertrains (lock-up collars, servo pistons, servo covers, engine gasket carriers, seal housings, cam shafts/forks, stators), brake systems (ABS motor components, electric brakes, pistons, valve bodies, vacuum pump components, ABS brake sensors), lighting (sockets, projector headlight reflectors), and transmission components.
In China, the auto industry has benefited from the government’s 50% tax cut on smaller vehicles. In 2008, China’s total automotive production still increased 5.2% compared with the previous year to reach 9.35 million units, in contrast to the dramatic declines in North America, Japan and Europe. In 2009, China’s auto production reached 12.89 million units, a dramatic 50% rise from 2008. In 2010, it is expected to reach 15.78 million units, a further 22.4% increase from 2009. In June 2010, the Chinese government further announced a trial program to subsidize environmentally friendly vehicles in five cities as part of efforts to reduce emissions and save energy. Under the program, the government offers up to RMB 3,000 ($442) for fuel economy gasoline-powered cars and up to RMB 60,000 ($8,850) for hybrid and electric vehicles. In the next few years, the Chinese auto market still looks bright although there is a question whether it can continue its +20% per year growth in the next five years.
There are 150 registered automakers in China, and smaller and independent automakers account for up to one-sixth of passenger car production. They strive to increase fuel economy by using more plastic parts and do not hesitate to try out new materials. China’s truck production is also expected to rise due to the government’s recent stimulus package which mainly invests in infrastructure. Building and construction

POLYPHENYLENE SULFIDE (PPS) MARKET STUDY NOVEMBER 2010
13
© 2010 SRI CONSULTING
require more trucks. PPS demand will not only be benefited from the overall growth in auto production but also the drive to improve fuel economy requires more plastics usage per vehicle. In particular, hybrid vehicles, due to higher under-the-hood temperature, will demand higher usage of PPS.
INDUSTRIAL APPLICATIONS
Industrial applications include oil field equipment, machine and appliance parts, pumps, valves and pipe fittings. These parts serve a mechanical function with heat or chemical resistance but no electrical function. PPS has benefited from the overall industry trend of replacing metals with plastics for weight reduction or better corrosion resistance.
There are two potential bright spots for PPS demand in this market segment. First, PPS is increasingly used in making the carrousel supporting ring for microwave ovens for its high-temperature and flame resistance. In 2009, China produced 60 million microwave ovens. The potential for this application could be very large. Second, PPS is replacing copper in valves and fittings for solar-powered water heaters. Some of the parts weigh 0.25 kg each, and thus present a large volume potential.
Coatings and filter bag applications can also be categorized under industrial applications, but they are discussed separately in this report.
COATINGS
Coatings are used primarily for corrosion protection of ferrous metals in the chemical and construction industries. PPS coatings can be applied by slurry coating, electrostatic coating on cold or hot surfaces, powder flocking or fluidized bed coating. All of these techniques require subsequent oven cure of the coatings at about 285-370°C to achieve the desired properties, which limits PPS in in-situ coating of large areas or substrates that cannot fit readily into a curing oven. Due to these limitations, PPS in coating applications accounts for only a small percentage of the total demand in the developed regions.
In China, however, there is significant demand for PPS coatings. Industry has developed various coating process such as suspension coating, powder coating, flame deposition and fusion deposition processes to accommodate a wide variety of coating parts. Other than selling through its distributors, Haton has constructed a 5,000 square meter coating application center to provide PPS coating service to the industry, which is expected to increase demand in this market segment.
FILTERS AND FILTER BAGS
Major filter and filter bag applications include coal boilers at coal thermal power stations and dust chamber filters for use in incinerators. On the one hand, PPS competes with other high-end fibers such as aramid, PTFE, polyimides and other special fibers. Figure 4 provides a comparison of chemical and heat resistance between PPS and other high-end fibers. PPS can withstand a temperature range of 160-180°C, and the prevailing temperature and acidic environment in coal-fired power plants, at a significantly lower cost. On the other hand, PPS competes with low-cost glass fiber or other organic fibers. PPS offers better heat and chemical resistance and longer service life. Typically PPS filter bags have a three-year service life versus six months for glass fiber. It significantly reduces maintenance costs and downtime in power and heat generation plants.

POLYPHENYLENE SULFIDE (PPS) MARKET STUDY NOVEMBER 2010 14
© 2010 SRI CONSULTING
FIGURE 4
Temperature and Chemical Resistance of PPS
Source: K-Tech website.
Coal-fired power plants represent about 74% of total power generation in China. In 2003, the Chinese government issued the new Standard for Air Pollutants Discharge in Coal-Fired Power Plants (GB13223-2003). It reduced the discharge limits of particulates from 200 mg/Nm3 to 50 mg/Nm3. Currently, about 80-90% of coal-fired power plants use electrostatic precipitators (ESPs). An ESP, manufactured in China, with a wet desulfurization unit (scrubber), although capable of removing up to 99% of dust, can barely meet the new discharge standard. The use of filter bags can remove up to 99.9% of dust to meet not only the current new regulation but also an even tighter regulation should the dust discharge limit be lowered to less than 50 mg/Nm3 in the future. Industry sources confirm that PPS has become the material of choice and the costs of PPS filter bags are coming down with service life achieving about three years, making the use of filter bags, particularly in conjunction with ESPs, an economical option for the power utilities. PPS fiber has been found to be a preferred filter material for reducing dust emission in coal-fired power plants. The GB 13223-2003 discharge standard started a new PPS application in filter bags and increased demand to about 11 thousand metric tons in 2009.
In September 2009, the Chinese government announced a new standard, GB13223-2010, to further reduce the discharge limit of particulates from 50 mg/Nm3 to 30 mg/Nm3. According to the new standard, for projects approved between January 1, 2004 and December 31, 2009, coal-fired power and thermal plants are required to meet the 30 mg/Nm3 discharge limit by January 1, 2015. The new regulation is expected to provide continuing impetus for PPS demand in the filter bags application in the next five years. Moreover, since the average life for PPS filter bags is about three years, there will be additional demand for replacing the bags installed in the previous years.
One potential threat could be imported ESPs, which are capable of reducing the discharge particulate level down to 30 mg/Nm3. Imported ESPs, however, are more expensive. Another risk factor is the performance of the PPS filter bags. If some major problem occurs such as due to poor quality that leads to shortened life, it could adversely affect future demand. However, no major problem has been reported at this time.

POLYPHENYLENE SULFIDE (PPS) MARKET STUDY NOVEMBER 2010
15
© 2010 SRI CONSULTING
AEROSPACE APPLICATIONS
In the United States, due to its unique combination of properties, PPS qualifies for a number of defense- or aerospace-related applications. Specifically, it meets the following MIL (military) specifications:
ASTM D4067-90 General specification approved for use by agencies of the Department of Defense to replace MIL-P-46174
MIL-M-24519 E Gamma ray resistant and UL-94 V-O rated
MIL-C-28754/31 Flat connectors
MIL-C-55302 Connector for printed circuit boards
MIL-C-83513 Connector, miniature, rack and panel
MIL-S-83734 Sockets, plug-ins, electronic components
MIL 83502 Sockets, leads
MIL-S-83505 Sockets, other
PPS composites have been used in making rudders and elevation in the Gulfstream G650 business jet. With the increasing use of composites in the manufacture of airplanes such as the Boeing Dreamliner 787, which uses up to 50% of composites in the primary structure including fuselage and wing, PPS composites are also expected to find greater use in airplane manufacturing in China.
In addition, PPS finds many other applications where its price/performance ratio, as shown in Figure 2, makes the most sense to replace metal parts for weight reduction in military equipment. Due to its confidential nature, demand in this category is difficult to estimate. Also, demand tends to be driven by the number of projects, which can vary widely each year.
In defense-related applications, until recent years PPS was considered a “strategic material” and exports to China by Western countries were restricted. Consumption in this market segment was limited by domestic supply until Deyang (now an operational subsidiary of Sino Polymer) successfully scaled up its production in 2006. Demand has grown rapidly with Deyang’s capacity expansion.
China’s defense budget for 2009 will increase by 14.9% to 481 billion renminbi, or about $70 billion, according to a spokesman for the National People’s Congress, China’s legislature, at a news conference on March 4, 2009. Demand for PPS in this segment is expected to grow at an average rate of 20% per year on the next five years.
RECYCLED PPS REPLACEMENT
It is estimated that about 10,000 tons of recycled PPS compounds are being used in China in 2010. Recycled PPS compounds have inferior properties and often contain higher impurities than the virgin materials, but they typically cost 40-60% less the virgin material and thus provide a strong incentive to compounders. Recycled PPS will continue to find use in the industry due to its attractive lower price, but it is expected to be gradually replaced by virgin PPS. The RoHS (Restriction on Hazardous Substances in
POLYPHENYLENE SULFIDE (PPS) MARKET STUDY NOVEMBER 2010 16
© 2010 SRI CONSULTING
Electrical and Electronic Applications) Directive, WEEE (EU Waste Electrical and Electronic Equipment) Directive and REACH (Registration, Evaluation and Authorization of Chemicals) regulations in Europe aim to phase out or place tight limits on the use of materials that contain heavy metals such as lead, mercury, cadmium, hexavalent chromium, and certain flame retardants. Similar environmental pressure is also mounting in other developed regions and increasing in China. Recycled materials increase the risks of containing these restricted chemicals. Most reputable end users such as those in E&E, automotive, filter bag and special applications markets prefer virgin material, if it can be obtained at reasonable cost without environmental risks. With the recent PPS price decline, industry will continue to shift toward virgin materials.
NEW PRODUCTS
New demand could be generated by developing new products. Sino Polymer has been developing the following new products/applications with high profit margins:
PPS film/paper products that have applications in capacitors, electrical insulation, and filtration media subjected to highly corrosive fluids. Sino Polymer has been supplying PPS film grade resins to a major company in the Republic of Korea for this application.
PPS compound for subway insulators: According to guidelines of the Chinese government, any city in China with a population greater than 6 million is required to build a subway system. Currently there are more than 16,000 kilometers of subway being planned in China. Sino Polymer has been working with approving authorities, distributors, and fabricators to develop this market. When qualified, demand is estimated to be 2 tons of PPS compound per kilometer.
In addition, Sino Polymer has supplied PPS for the construction of a bridge in Guizhou Province. The bridge is about 2.2 km and used about 50 tons of PPS compound (30 tons on neat resin basis). PPS compounds were used for corrosion resistance to salt water. As all polymers have good corrosion resistance and there are many possible lower cost alternatives, the application is judged not to be the best use of PPS. Thus, the future demand from this application is not included in the projection.
PROJECT BACKGROUND AND GOALS
SRIC has been contracted to verify the market conditions and to estimate demand growth in all PPS major end-use markets. This study consists of the following major goals:
To verify the company’s capacity in production capability for resins and fibers.
To assess the company’s R&D activities.
To analyze the company’s actual 2009 annual sales.
To conduct in-depth personal and telephone interviews with all major customers to obtain the following critical market information:
– Sales estimate for 2010
– Growth rate projection in each major market segment

POLYPHENYLENE SULFIDE (PPS) MARKET STUDY NOVEMBER 2010
17
© 2010 SRI CONSULTING
– Perception of Sino Polymer’s product quality and market position
– Foreign producers’ activities
– Price trends
To assess overall PPS demand in China by interviewing industry associations and end users in the supply chain:
– Filter baghouse equipment suppliers
– Baghouse Dust Collection Committee of China Industrial Association of Environmental Protection
– China Engineering Thermoplastics Industry Association
To update total domestic demand projections in 2010-2015.
To interview U.S. and Japanese PPS producers to gain their status and perspectives.
To update global PPS capacity.
To review global PPS demand for 2009 and estimate growth rates in 2009-2015 for all major regions.
To examine the global supply and demand balance in 2009-2015 and assess its potential impact on the Chinese market and Sino Polymer’s competitive landscape.
TOTAL PPS DEMAND IN CHINA BY MARKET SEGMENT
Table 2 presents total PPS demand estimates in China by major market segment on a neat resin basis:
Table 2
Total PPS Demand in China (metric tons, neat resin basis)
2007
2008
2009
2010
2011
2012
2013
2014
2015
Average Annual Growth Rate,
2010-2015 (percent)
E&E 6,450 6,627 7,290 8,019 8,660 9,353 10,101 10,909 11,782 8 Automotive 2,650 7,358 8,462 9,731 10,899 12,207 13,671 15,312 17,149 12 Industrial 1,350 2,753 3,083 3,453 3,730 4,028 4,350 4,698 5,074 8 Filter Bags 5,000 10,500 11,280 12,200 14,650 17,600 21,100 25,400 30,500 20 Aerospace 2,750 1,587 2,422 3,706 4,447 5,337 6,404 7,685 8,837 19 Coatings 500 575 1,856 2,794 3,213 3,695 4,249 4,887 5,375 14
Total 18,700 29,400 34,393 39,903 45,599 52,219 59,876 68,891 78,718 15% Source: SRI Consulting.

POLYPHENYLENE SULFIDE (PPS) MARKET STUDY NOVEMBER 2010 18
© 2010 SRI CONSULTING
Total PPS demand in China in 2009 reached 34 thousand metric tons, and it is estimated to reach 40 thousand metric tons in 2010. Total demand is broken down into market segments based on estimates from major distributors and interviews with industry associations.
ELECTRICAL AND ELECTRONICS MARKET
Demand for PPS in China in 2009 reached 7.3 thousand metric tons, and is expected to attain 8.0 thousand metric tons in 2010. The growth rate is forecast to be at 8% per year to reach 11.8 thousand metric tons by 2015.
AUTOMOTIVE MARKET
Demand for PPS in 2009 reached about 8.5 thousand metric tons and is expected to increase to 9.7 thousand metric tons in 2010. It is projected to grow at 12% per year to reach 17.1 thousand metric tons by 2015.
INDUSTRIAL APPLICATIONS
Demand for PPS in 2009 reached 3.1 thousand metric tons and is estimated to attain 3.4 thousand metric tons in 2010. The growth rate is forecast to be 8% per year to reach 5.1 thousand metric tons by 2005. If PPS makes significant inroads in microwave oven parts or water heater fittings, there will be significant upside in this market.
FILTER BAGS
In 2009, coal-fired power generation capacity in China reached about 600,000 megawatts, accounting for about 74% of the total power generation. It takes about 120 square meters of filter fabric per megawatt, and each square meter of PPS fabric weighs 0.5-0.55 kilogram. Assuming 100% market penetration, the total market potential for PPS for the filter bag application in power generation alone is estimated at 36 thousand metric tons. Combined demand in thermal plants, industrial plants, and incinerators is estimated at 20% that of the power plants, or 7 thousand metric tons. Thus, the total demand for PPS in filter bags is estimated at 42 thousand metric tons per year if PPS has 100% market share and all power plants and incinerators install PPS filter bags in one year. In addition, since the average service life of PPS filter bags is about three years, there will be a constant replacement market in a three-year cycle.
From 2007 to 2008, PPS demand for filter bags doubled to reach 10.5 thousand metric tons in 2008. Due to the impact of the financial crisis, demand grew only about 13% in 2009 to reach 11.3 thousand metric tons. Growth in 2010 continued to be moderate, and demand is expected to reach 12.2 thousand metric tons.
In September 2009, the Chinese government announced a new standard, GB13223-2010 to further reduce the discharge limit of particulates from 50 mg/Nm3 to 30 mg/Nm3. According to the new standard, for projects approved between January 1, 2004 and December 31, 2009, coal-fired power and thermal plants are required to meet the 30 mg/Nm3 discharge limit by January 1, 2015. The new regulation is expected to provide continuing impetus for PPS demand in the filter bag application in power and thermal plants in

POLYPHENYLENE SULFIDE (PPS) MARKET STUDY NOVEMBER 2010
19
© 2010 SRI CONSULTING
the next five years. Moreover, since the average life for PPS filter bags is about three years, there will be additional demand for replacing the bags installed in the previous years.
In the incinerator market, where PPS is subjected to a more acidic environment under high temperature, PPS is reportedly not ideal for the application based on industry experience in recent years. Demand is expected to diminish in the coming years.
Overall due to the tightened discharge limit, demand for PPS is expected to resume a higher growth rate of about 20% per year from 2010 to 2013 and accelerate somewhat in 2014-2015 as the industry faces the compliance deadline to reach 34 thousand metric tons in 2015, as shown in Table 3.
Table 3
PPS Demand for Filter Bags in China (metric tons)
Coal-Fired Power Plants
Thermal Plants
Incinerators
Total
2007 3,000 1,500 500 5,000 2008 7,000 2,200 800 10,500 2009 8,000 2,400 880 11,280 2010 9,500 2,700 -- 12,200 2011 11,400 3,250 -- 14,650 2012 13,700 3,900 -- 17,600 2013 16,400 4,700 -- 21,100 2014 19,700 5,700 -- 25,400 2015 23,600 6,900 -- 30,500 Sources: The Committee of Baghouse Dust Collection, China Industrial
Association of Environmental Protection; SRI Consulting.
There are two potential downside risks for this market. One potential threat could be imported ESPs, which are capable of reducing the discharge particulates level down to 30 mg/Nm3. Imported ESPs, however, are more expensive. Also, in the proposed 12th five-year economic plan which will be implemented in 2011-2015, promoting the use of new materials will be one of the priorities. Domestically produced new materials such as PPS are favored by the government’s policy. Another risk factor is the performance of the PPS filter bags. If some major problem occurs such as due to poor quality that leads to shortened life, it could adversely affect future demand. However, no major problem has been reported at this time.
AEROSPACE AND DEFENSE APPLICATIONS
PPS finds use in many other applications where its price/performance ratio, as shown in Figure 2, makes it logical for replacement of metal parts for weight reduction in military equipment. Due to its confidential nature, demand in this category is difficult to estimate. Also, demand tends to be driven by the number of projects, which can vary widely each year. However, in view of the growth rate of China’s defense spending and recent international tension in the Yellow Sea and South Sea of China, it is reasonable to estimate that China’s emphasis in defense readiness will continue, and demand for PPS in these special applications will grow rapidly in China.

POLYPHENYLENE SULFIDE (PPS) MARKET STUDY NOVEMBER 2010 20
© 2010 SRI CONSULTING
Demand for PPS in 2009 was 2.4 thousand metric tons, and it is expected to attain 3.7 thousand metric tons in 2010. The market is forecast to grow about 19% per year to reach 8.8 thousand metric tons by 2015.
COATINGS
Coatings are used primarily for corrosion protection of ferrous metals in the chemical and construction industries. PPS coatings can be applied by slurry coating, electrostatic coating on cold or hot surfaces, powder flocking, or fluidized bed coating. All these existing techniques require subsequent oven cure of the coatings at about 285-370°C to achieve the desired properties, which limits PPS in in-situ coating of large areas or substrates that cannot fit readily into a curing oven.
Demand in 2009 was 1.8 thousand metric tons and is expected to grow to 2.8 thousand metric tons. Due to many new projects developed by Sino Polymer and its distributors, demand is forecast to increase to about 5.4 thousand metric tons by 2015.
GLOBAL DEMAND AND SUPPLY DYNAMICS
GLOBAL CAPACITY 2005-2015
PPS is a global market and most producers in Japan and the US are looking for growth in China.
Table 4 presents global PPS producers and their year-end capacities for 2005-2010 as well as projected capacities for 2011-2015 based on announced plans:

POLYPHENYLENE SULFIDE (PPS) MARKET STUDY NOVEMBER 2010
21
© 2010 SRI CONSULTING
Table 4
World Producers of PPS Resins
Annual Year-End Nameplate Capacitya (thousands of metric tons, resin)
Company and
Plant Location 2005 2006 2007 2008 2009 2010 2011 2012 2013 2014 2015
United States
Chevron Phillips Chemical Company
Borger, TX
10.0
10.0
10.0
10.0
20.0
20.0
20.0
20.0
20.0
20.0
20.0
Fortron Industries
(owned jointly by Ticona LLC
and Kureha Chemical [Japan])
Wilmington, NC 7.3 10.0 15.0 15.0 15.0 15.0 15.0 15.0 15.0 15.0 15.0
Total 17.5 20.0 25.0 25.0 35.0 35.0 35.0 35.0 35.0 35.0 35.0
Japan
DIC EP, Inc.
Kashima, Ibaraki Prefecture 4.0 6.0 6.0 6.0 9.5 12.0 12.0 12.0 12.0 12.0 12.0
Sodegaura, Chiba Prefecture 4.0 4.0 4.0 4.0 4.0 4.0 4.0 4.0 4.0 4.0 4.0
Idemitsu Kosana 0 0 0 0 0 0 0 0 (10.0) (10.0) (10.0)
Kureha Chemical Industry Co., Ltd.
Iwaki, Fukushima Prefecture 6.0 10.0 10.0 10.0 10.0 10.0 10.0 10.0 10.0 10.0 10.0
Toray Industries, Inc.
Tokai, Aichi Prefecture 9.0 9.0 9.0 11.5 11.5 14.0 14.0 14.0 14.0 14.0 14.0
Tosoh Corporation
Yokkaichi, Mie Prefecture 2.0 2.5 2.5 2.5 2.5 2.5 3.0 3.0 3.0 3.0 3.0
Totalb 25.0 31.3 31.3 33.8 37.5 42.5 43.0 43.0 43.0 43.0 43.0
Korea, Republic of
SK Chemicalsa
na 0 0 0 0 0.03 0.03 0.03 0.03 (20.0) (20.0) (20.0)
China
Chengdu Letian Plastics Co., Ltd.
Chengdu, Sichuan 0 0.05 0.05 0.05 0.05 0.2 0.2 0.2 0.2 0.2 0.2
Sino Polymer & Fibre
Chengdu, Sichuan 0 6.0 6.0 6.0 6.0 6.0 6.0 6.0 6.0 6.0 6.0
Deyang, Sichuan 1.3 1.3 4.0 24.0 24.0 24.0 24..0 49.0 49.0 49.0 49.0
Southwest China Haohua Chemical
Co., Ltd.
Zigong, Sichuan 0 0.05 0.05 0.05
0.05 0.05
0.05 0.05 0.05 0.05 0.05
Total 1.3 7.4 10.1 30.1 30.1 30.25 30.25 55.25 55.25 55.25 55.25
World Totalb 43.8 58.7 66.4 88.9 102.6 107.8 108.3 133.3 133.3 133.3 133.3
a. Idemitsu and SK Capacity Expansion are still in the planning stage.
b. Total does not include Idemitsu and SK possible future expansion since no decision has been made.
Source: SRI Consulting.
Major producers have been expanding capacity to meet market demand. In the United States, Fortron Industries completed its twofold capacity expansion in its Wilmington plant to reach 15 thousand metric tons in October 2007, making it the largest single PPS plant in the world at the end of 2007. However, market conditions deteriorated significantly in late 2008, and the new plant utilization rate has been very

POLYPHENYLENE SULFIDE (PPS) MARKET STUDY NOVEMBER 2010 22
© 2010 SRI CONSULTING
low. It is estimated that in mid-2010, total production is about 8.4 thousand metric tons per year. Chevron Phillips (CP) started construction of a new production line in October 2007 with a 10 thousand metric ton capacity and completed it in June 2009. CP’s total capacity has reached 20 thousand metric tons, surpassing that of Fortron. Also due to the adverse market conditions, Chevron Phillips’ new capacity is largely unused at present. Starting in 2007, CP allocated some of its production capacity to make fiber resin and sell it in China for fiber spinning.
In Japan, Kureha increased its capacity from 6 thousand to 10 thousand metric tons from 2005 to 2006. Toray increased its capacity from 9 thousand to 11.5 thousand metric tons in 2008, and the company planned to further expand to 14 thousand metric tons by 2009. However, the expansion was postponed due to weak demand, and is now planned for completion in 2010. DIC increased its capacity at its plant in Kashima from 6 thousand to 9.5 thousand metric tons in 2009. DIC plans to further increase its capacity to 12 thousand metric tons by 2010. Combined with its plant in Sodegaura, which has a 4 thousand metric ton capacity, DIC has the highest company capacity in Japan, at 16 thousand metric tons at present. A possible new entrant to PPS resin production could be Idemitsu Kosan, which is considering building a new plant with 10 thousand metric ton capacity to be completed by 2013. Idemitsu currently has a significant PPS compounding business. The company started a compounding plant with a total compound capacity of 10 thousand metric tons, including PPS, in Guangdong, China in March 2010.
In the Republic of Korea, SK Chemicals introduced Ecotran PPS at Chinaplas in May 2009. Its current pilot plant capacity is 30 metric tons per year. The company will make a decision by the end of 2010 whether to start building a production plant with 20 thousand metric tons per year of capacity. If SK decides to go ahead, the new capacity will be not realized until 2013. Due to global overcapacity, SK’s capacity expansion is highly doubtful. Thus, it is not included in the summary of world capacity in Table 5.
In China, Sino Polymer completed a new production line at a new site in Deyang City in early 2007 with a 4 thousand metric ton capacity for injection molding resins. The new line replaced the 1.3 thousand metric ton production line, which has since been dismantled, at an old site in Deyang City. Sino Polymer has also built a new plant at the new site with a 20 thousand metric ton capacity for fiber-grade resins; production started in March 2008. When a major earthquake hit the area in May 2008, a significant amount of equipment was damaged. Repair was completed by October 2008, and the new plant was ready for full production. Together with its 6 thousand metric ton capacity in Chengdu, which the company built in 2006, Sino Polymer’s total resin capacity reached 30 thousand metric tons (26 thousand metric tons for fiber resins and 4 thousand metric tons for molding resins) to become the largest producer in the world, surpassing all U.S. and Japanese companies. In addition, the company has started production at its 5 thousand metric ton plant to produce PPS fibers (4 thousand metric tons for short fiber and one thousand metric tons for long fiber), making it the world’s leading PPS fiber producer. Fiber is a much higher-value-added product than resin.
Since July 2010, Sino Polymer has started a project to add 15 thousand metric tons of PPS fiber capacity to be completed by the end of 2011. Also, the company has started the procurement of equipment since November 2009 to construct a new resin plant with 25 thousand metric tons additional capacity. The new resin plant is estimated to be completed also by mi-2012.
Other than Sino Polymer, China currently has two other small producers, Southwest China Haohua Chemical and Chengdu Letian. Both seem to be having problems with scaling up pilot plant production. They are not expected to be serious players in the next few years.

POLYPHENYLENE SULFIDE (PPS) MARKET STUDY NOVEMBER 2010
23
© 2010 SRI CONSULTING
Although a relatively new producer, Sino Polymer has demonstrated its manufacturing capability in producing good quality resins, compounds and fibers. It has also been rapidly growing its market share in China in competition with all its foreign competitors. Based on the comments from its customers and assessment from SRIC, Sino Polymer has the following competitive advantages:
Sino Polymer generally offers a 5 to 10% price advantage over its foreign competitors.
It has good connection to industry associations and specifying authorities in several industries that facilitate fast market entry and product approval.
Sino Polymer is the preferred domestic supplier for aerospace/defense related applications.
The company offers fast delivery of its products normally in days versus its foreign competitors which have to ship its resin or compounds from overseas and often take 1-2 months.
In terms of manufacturing, it has demonstrated its capability to implement new capacity addition much faster than its competitors. It is new plant in Deyang with 20 metric tons capacity was built in about one year. Smaller expansions by Fortron and Chevron Phillips took approximately two years.
Sin Polymer also focuses on new product development which allows the company to get into new applications. While its long established foreign competitors mostly stayed with traditionally markets such as automotive and electrical and electronics.
In terms of product quality, Sino Polymer is perceived to supply good quality products in all applications. However, it is often viewed as a close second to its foreign competitors in several areas:
Polyplastics (a JV between Kureha and Ticona) is perceived as the compounder that offers the highest quality compounds for injection molding.
Toyobo and Toray are considered to have the highest quality fibers.
Fortron is perceived as the technology leader in linear PPS and low chlorine PPS.
Table 5 presents a summary of global capacity by region for 2005-2015.
POLYPHENYLENE SULFIDE (PPS) MARKET STUDY NOVEMBER 2010 24
© 2010 SRI CONSULTING
Table 5
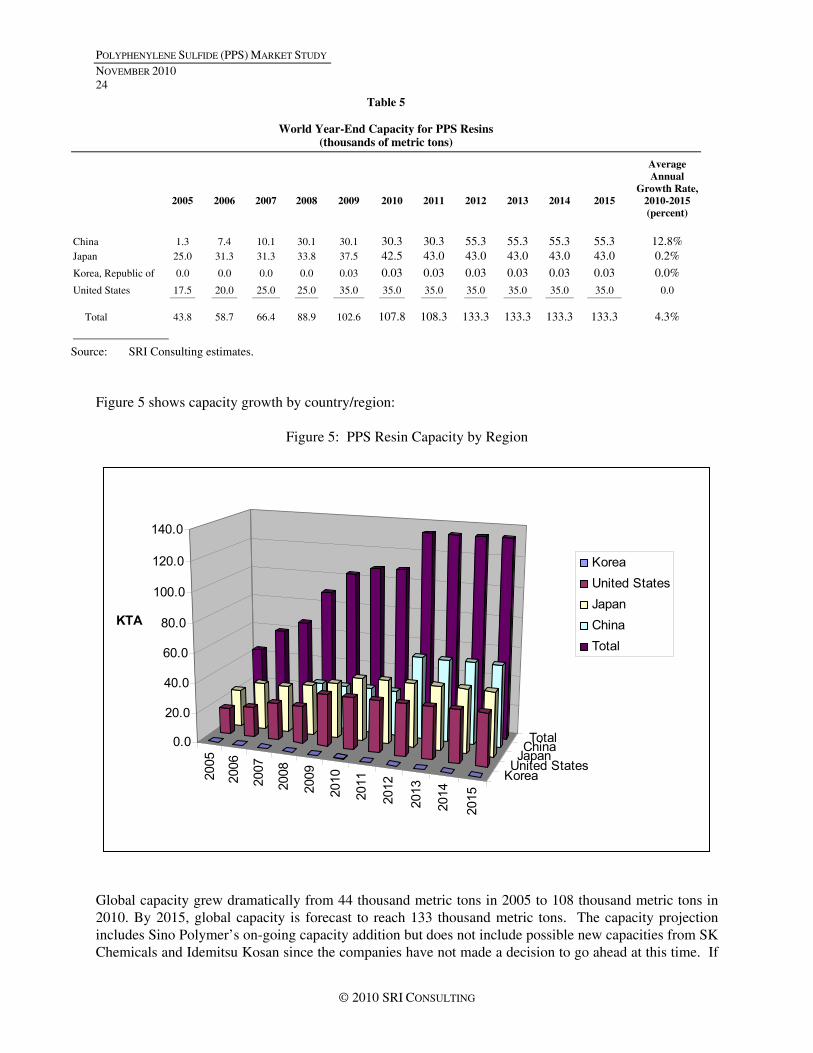
World Year-End Capacity for PPS Resins (thousands of metric tons)
2005
2006
2007
2008
2009
2010
2011
2012
2013
2014
2015
Average Annual
Growth Rate, 2010-2015 (percent)
China 1.3 7.4 10.1 30.1 30.1 30.3 30.3 55.3 55.3 55.3 55.3 12.8% Japan 25.0 31.3 31.3 33.8 37.5 42.5 43.0 43.0 43.0 43.0 43.0 0.2%
Korea, Republic of 0.0 0.0 0.0 0.0 0.03 0.03 0.03 0.03 0.03 0.03 0.03 0.0%
United States 17.5 20.0 25.0 25.0 35.0 35.0 35.0 35.0 35.0 35.0 35.0 0.0
Total 43.8 58.7 66.4 88.9 102.6 107.8 108.3 133.3 133.3 133.3 133.3 4.3%
Source: SRI Consulting estimates.
Figure 5 shows capacity growth by country/region:
Figure 5: PPS Resin Capacity by Region
2005
2006
2007
2008
2009
2010
2011
2012
2013
2014
2015
KoreaUnited StatesJapanChinaTotal0.0
20.0
40.0
60.0
80.0
100.0
120.0
140.0
KTA
KoreaUnited StatesJapanChinaTotal
Global capacity grew dramatically from 44 thousand metric tons in 2005 to 108 thousand metric tons in 2010. By 2015, global capacity is forecast to reach 133 thousand metric tons. The capacity projection includes Sino Polymer’s on-going capacity addition but does not include possible new capacities from SK Chemicals and Idemitsu Kosan since the companies have not made a decision to go ahead at this time. If

POLYPHENYLENE SULFIDE (PPS) MARKET STUDY NOVEMBER 2010
25
© 2010 SRI CONSULTING
both companies decide to enter the market, an additional 30 thousand metric tons could be added to the total capacity by the end of 2013 at earliest.
GLOBAL SUPPLY AND DEMAND 2009
Table 6 presents global supply/demand by region in 2009:
Table 6
World Supply/Demand for PPS Resins—2009
(thousands of metric tons)
Annual Capacity
Production
Operating Rate (percent)
Net Exports
Consumption
United States 35 18.3 52.3 11.3 7.0 Europe 0 0 na –5.5 5.5 Japan 37.5 24 64 11.7 12.3 China 30.1 17.9 59.7 –16.5 34.4 Rest of the World 0 0 na –1.0 1
Total 102.6 60.2 58.7% 0 60.2 Source: SRI Consulting.
In 2009, PPS was in a state of significant overcapacity with global capacity of 102 thousand metric tons far exceeding total demand of 60 thousand metric tons. On a regional basis, Japan had the highest total capacity of 37.5 thousand metric tons, accounting for 36.5% of the total, followed by the United States at 34.1%, and China at 29.3% (with almost all the capacity from Sino Polymer).
China had the highest estimated total demand of 34.4 thousand metric tons, far surpassing the markets in Japan, Europe and the United States. For the market in China, the apparent market share for Sino Polymer at the end of 2009 is estimated at about 52% on a neat resin basis. Japanese producers, notably DIC, Kureha and Toray, accounted for approximately 32%, and U.S. producers Chevron Phillips and Fortron accounted for about 16% of the market share.
The apparent consumption of virgin PPS resin in China should be considered as a lower estimate of PPS consumption since it does not account for probable imports of PPS in fiber form or the consumption of recycled PPS material.
GLOBAL DEMAND 2008-2015
Table 7 presents global demand for PPS by region in 2008-2015.

POLYPHENYLENE SULFIDE (PPS) MARKET STUDY NOVEMBER 2010 26
© 2010 SRI CONSULTING
Table 7
World Demand for PPS By Region (thousands of metric tons)
2008
2009
2010
2011
2012
2013
2014
2015
Average Annual Growth Rate,
2010-2015 (percent)
United States 10.1 7.0 8.5 8.7 8.8 9.0 9.2 9.4 2 Europe 6.5 5.5 6.3 6.5 6.7 6.9 7.1 7.3 3 Japan 13.8 12.3 13.2 14.8 15.9 16.6 17.3 18.1 7 China 29.2 34.4 39.9 45.6 52.2 59.8 68.9 78.7 15 Rest of the World 2.0 1.0 1.5 1.6 1.7 1.8 1.9 2.0 6
Total 61.6 60.2 69.4 77.2 85.3 94.1 104.4 115.5 11% Source: SRI Consulting.
Global demand is expected to reach 69 thousand metric tons in 2010. It is forecast to grow at 11% per year from 2010 to 2015 to reach 116 thousand metric tons by 2015. China is expected to grow at 16% per year in the same period due to strong growth in industrial production and favorable government policy. Japan is expected to grow at 7% per year due to increasing demand in hybrid car production. Demand growth in the U.S. and Europe is expected to be low to moderate at 2-3% per year.
For the U.S. and Japanese producers, demand growth in their domestic markets and Europe will not be able to absorb the major increased capacities of past years. China is clearly the main target for their future growth. For example, in an investor’s day presentation given by Celanese (which owns Fortron) on December 11, 2007, the senior company executives targeted China’s automotive market for the growth of the company’s engineering thermoplastics and the filter bag applications in coal-fired power plants for PPS. Similarly, Chevron Phillips has also recognized the growth potential in the filter bag application in China, and it allocated some manufacturing capacity to make and sell fiber-grade resin in 2007.
Thus, Sino Polymer should expect more intensified foreign competition, not only in the traditional electrical and electronic, automotive and industrial markets but also in filter bag applications.

POLYPHENYLENE SULFIDE (PPS) MARKET STUDY NOVEMBER 2010
27
© 2010 SRI CONSULTING
GLOBAL CAPACITY VS. DEMAND 2008-2015
Figure 6 presents global PPS capacity vs. demand in 2008-2015.
Figure 6: World Capacity and Demand with Projected Operation Rate for PPS
0.0
20.0
40.0
60.0
80.0
100.0
120.0
140.0
2008 2009 2010 2011 2012 2013 2014 2015
(KTA
)
0.0%
10.0%
20.0%
30.0%
40.0%
50.0%
60.0%
70.0%
80.0%
90.0%
100.0%
Ope
ratio
n Ra
te (%
)
Capacity (KTA) Demand (KTA) Operation Rate (%)

POLYPHENYLENE SULFIDE (PPS) MARKET STUDY NOVEMBER 2010 28
© 2010 SRI CONSULTING
PRICES
In China, for an injection-molding compound containing 40% glass fiber, the price was about RMB120 per kilogram ($14.49 per kilogram) in 2002 before Sino Polymer entered the market. It was about RMB60 per kilogram ($7.40 per kilogram) in 2005, and it firmed up to about RMB80 per kilogram ($10.10 per kilogram) in 2006, in line with international prices. From October 2007 to February 2008, the price for Ryton® (Chevron Phillips) R-4 (40% glass filled) and R-7 (60% fillers) was reported at RMB80 and RMB55 per kilogram, respectively. Since the global financial crisis starting in October 2008, Sino Polymer has offered up to 10% price reductions while Polyplastics (Fortron) and Chevron Philips have offered 3-5% reductions. Sino Polymer offers more of a price reduction in order to grow market share. Sino Polymer has been able to maintain a price advantage over its competitors while delivering quality products in the past few years.
In China, the market prices for PPS short fiber were RMB88-120 per kilogram before the financial crisis but have decreased to RMB85-110 per kilogram since the financial crisis began. Toyobo, Toray and Polyplastics (Fortron) are at the high end while two other domestic fiber manufacturers—Jiangsu Reitai and Dongguang Sinluen—are at the low end of the price spectrum. Sino Polymer had positioned its price in the middle of the range, about RMB105 per kilogram, before the crisis. The company has lowered its price to RMB94-98 per kilogram to maintain its market position.
Figure 7 presents price trends for Sino Polymer PPS from January 2008 to June 2010.
Figure 7: Price Trend for Sino Polymer
20,000
40,000
60,000
80,000
100,000
120,000
140,000
1 2 3 4 1 2 3 4 1 2 3 4
Injection Resin
Compound
Fiber
Thousands of Metric Tons
2008 2009 2010

POLYPHENYLENE SULFIDE (PPS) MARKET STUDY NOVEMBER 2010
29
© 2010 SRI CONSULTING
The figure shows that prices were going lower from mid-2008 till the first quarter of 2009, but have since recovered. In the rest of 2009, however, the average compound price went up to about RMB56,000/ton from the depressed level of about RMB40,000/ton while the fiber price increased to RMB95,000/ton from the low level of RMB72,000/ton. In the first half of 2010, the compound price further increased to RMB 63,000/ton while the fiber price decreased to RMB87,000/ton.
Globally, PPS will be in an overcapacity condition as discussed earlier. The U.S. and Japanese producers, with their capacity far exceeding their domestic demand, are expected to market their products aggressively in the faster growing market in China. Toray and DIC are reportedly in a price war for injection-grade compounds. Chevron Phillips closed its compounding plant in Singapore in 2009 and has since supplied its compounds from its compounding plant in Texas. Due to the long lead time, Chevron Phillips has abandoned some smaller customers and instead has concentrated on large-volume users. Chevron Phillips was reportedly to offer its R-7 compound (60% filler) at RMB34,000/ton for high-volume orders. Due to the global overcapacity and expected fierce competition, prices are projected to remain under pressure but fluctuate according to the global operating rate, as shown in Figure 8.
Figure 8: World Operating Rates and Price Projection for PPS
0.0%10.0%20.0%30.0%40.0%50.0%60.0%70.0%80.0%90.0%
100.0%
2008 2009 2010 2011 2012 2013 2014 2015
%
44,00046,00048,00050,00052,00054,00056,00058,00060,00062,000
RM
B/to
n
Operation Rate (%) Average Compound Price
Historically, PPS foreign producers have exerted excellent price discipline to maintain good margins. Table 8 presents historical PPS list price from Fortron.
Table 8
U.S. List Prices for Polyphenylene Sulfide Resinsa (dollars per kilogram)
1995 1998 2001 2005 2007 February 2008
Other Injection-Molding Compounds Fortron 1140L4a 7.76 7.76b 7.76b 9.08 9.98 9.98 Fortron Mineral-Glass Compounds 5.51-7.36 -- 4.87-7.36 6.40 7.04-8.10 7.04-8.10 Fortron Resin Powders/Pellets 9.79-14.30 -- 9.79-14.60 11.60-18.00 12.70-19.80 19.80

POLYPHENYLENE SULFIDE (PPS) MARKET STUDY NOVEMBER 2010 30
© 2010 SRI CONSULTING
a. Natural color, 40% glass fiber–reinforced.
b. Based on a 42 thousand pound truckload purchase.
Source: Company price lists.
In 2005 as the supply was tight and raw material costs rose, the company raised prices to maintain its margin. As the financial crisis hit in late 2008, Fortron elected to idle most of its 7.5 kta new capacity to reduce supply. Similarly, Toray delayed its previously announced capacity expansion from 11.5 to 14 kta until June 2010.
In 2010-2015, due to global overcapacity, it will be a highly competitive market in China. However, it is expected that most players will continue to adjust production and exert price discipline to avoid significant price erosion that erode their margins.
MARKET POSITION
Since it started PPS production in 2005, Sino Polymer has established itself as the dominant producer in China.
With rapid capacity expansion, it also became the largest single producer globally with a total capacity of 30 thousand metric tons.
Sino Polymer and Toray are currently the most vertically integrated PPS producers in the world, having capability to produce various grades of resins, compounds, fibers, films, papers, and composites.
Sino Polymer has been gaining market share by providing good-quality PPS resins and fibers while maintaining price advantages over its major competitors. It also offers fast delivery over most of its overseas suppliers. Since its initial production in 2004, it has increased its market share to about 52% in 2009.
However, all major U.S. and Japanese producers have also increased capacities significantly in the past few years. With total capacity far exceeding domestic demand, the U.S. and Japanese producers will target China for growth, even more than in the past. Globally PPS is in a overcapacity condition that will increase competition and constrain prices in the next few years.
ABOUT SRI CONSULTING
SRI Consulting (SRIC) is the world’s leading business research service for the global chemical industry. SRIC publishes research reports and conducts client-sponsored research. Publishing for almost sixty years, SRI Consulting is the preeminent source for in-depth business and process analysis. Reports are available as individual report purchases and through subscription services.

POLYPHENYLENE SULFIDE (PPS) MARKET STUDY NOVEMBER 2010
31
© 2010 SRI CONSULTING
With headquarters in Menlo Park, California, SRIC is a leading business-to-business media and information company. SRIC is a trade name and a registered trademark of SRI International, used under license.
PROGRAMS
THE PROCESS ECONOMICS PROGRAM (PEP)
The Process Economics Program (PEP) is the core technology and cost analysis program for the chemical and related industries at SRIC. PEP provides thorough and up-to-date technical and economic evaluations of both state-of-the-art commercial processes and potentially promising processes under development. More than 100 companies, many of which have been subscribers since the program began in 1963, sponsor the PEP program. The program’s evaluations cover both commodity and specialty chemicals and polymers.
THE CHEMICAL ECONOMICS HANDBOOK (CEH)
CEH is an ongoing multiclient service for the chemical and allied products industries. Published continuously since 1950 on 280 topics, CEH is supported by more than 250 sponsors in more than 35 countries worldwide. CEH is the world’s leading source of chemical marketing research and business analysis. It provides accurate and timely information on the history, status, market analysis of trends and driving forces influencing current and future product demand in six major commercial chemical areas such as petrochemical feedstocks and basic petrochemicals, organic intermediates, polymers (plastics and resins), agricultural chemicals (fertilizers, pesticides, and animal feeds), inorganic commodity chemicals including industrial gases, and specialty chemicals and other chemical product groups (dyes, pigments, plastics additives, surface-active agents, elastomers, fibers and surface coatings).
THE WORLD PETROCHEMICALS PROGRAM (WP)
WP, with data history back to 1972, provides full worldwide coverage on more than 50 petrochemicals in over 85 countries and regions. Partial data on another 150 products are maintained as well. WP provides growth trend forecasts for each product covered by country or region, supply/demand‚ foreign trade‚ and end-use information by product and country, as well as plant-by-plant information on ownership‚ location‚ capacities‚ expansion plans‚ raw materials requirements‚ and product disposition for more than 8‚000 petrochemical and derivative plants.
THE SPECIALTY CHEMICALS UPDATE PROGRAM (SCUP)
SCUP provides strategic analysis and insight into 32 major classes of functional and market-directed specialty chemicals. This business research service focuses on the industry/business environment and market dynamics, identifying key factors required for successful operation and alerting management to the trends and opportunities in the current and future specialty chemicals marketplace.
THE CHINA REPORT
The China Report is a reliable and accurate resource for organizations and individuals requiring a thorough understanding of the development and status of the commercial chemical industry in China. Petrochemicals, organic chemical intermediates, polymers, fibers, agricultural chemicals and inorganic

POLYPHENYLENE SULFIDE (PPS) MARKET STUDY NOVEMBER 2010 32
© 2010 SRI CONSULTING
chemicals are included. Major producers are listed, along with capacity, production, consumption, price and trade data, including projections for five-year periods.
STAFF
Globally, SRIC’s team is rich in its diversity of people, cultures and knowledge. SRIC has eighty researchers and business analysts who focus on diverse regions and how these regions interconnect with the global economy. These experts have technical and market intelligence in petrochemicals, polymers, specialty and fine chemicals, agricultural chemicals, and inorganics.
CLIENTS
SRIC’s clients are Fortune Global 100 companies and leaders in the chemical industry and financial community. Clients depend on the objective and relevant data SRIC provides on global chemical markets and technology that enables them to make better and more informed business decisions. SRIC’s clients build successful businesses by relying on the accurate and in-depth products and services provided by SRIC. The reliability of SRIC’s business resources is reflected in exceptional client retention.
REPORT AUTHORS
Dr. R. J. (Rong-Jong) Chang
Dr. Chang is currently the Group Director of Process Economics Program and Carbon Footprint Initiative at SRIC. Since joining SRI Consulting in 2005, He has been an author of several reports on elastomers, high performance thermoplastics and specialty chemicals. Before joining SRI Consulting, He had 26 years industrial experience in the rubber, adhesive, plastic, electrical, power, automotive and coating industries. He held key positions with 3L&T Inc. (Vice President of Technology), Raychem/Tyco Electronics (Principal Engineer), 3M Co., and General Tire. Dr. Chang received his Ph.D. in Polymer Science from the University of Akron, Ohio, MASc Chemical Engineering from University of Waterloo, Ontario, Canada, and BS Chemical Engineering from National Taiwan University, Taipei, Taiwan. Dr. Chang holds 17 US patents and has published 17 technical papers. In the past four years, Dr. Chang has conducted several due diligence studies related to acquisition, IPO or licensing on PPS and other polymers/chemicals.
Vivien (Wei) Yang
Ms Vivien Yang has more than eight years of experience in the chemical industry, including six years with SINOPEC Petroleum Processing Research Institute. Since joining SRI Consulting in 2006, she has been an author of more than twenty market research reports covering a wide range of specialty chemical market segments including PPS. Ms. Yang holds a BS degree in Chemical Engineering from Hebei University of Technology and MS degree in Refining Chemistry from Kunming Science and Technology University and Research Institute of Petroleum Processing.

POLYPHENYLENE SULFIDE (PPS) MARKET STUDY NOVEMBER 2010
33
© 2010 SRI CONSULTING
Hiroaki Mori
Mr. Hiroaki Mori is a Senior Consultant based in SRIC’s Tokyo office. He has more than 35 years of experience in the chemical industry mainly with Ube Industries. Since joining SRI Consulting in 2008, he has been an author of many market research reports particularly on engineering thermoplastics.