iron sulfide scale removal using - OAKTrust
149
IRON SULFIDE SCALE REMOVAL USING ALTERNATIVE DISSOLVERS A Dissertation by RAJA SUBRAMANIAN RAMANATHAN Submitted to the Office of Graduate and Professional Studies of Texas A&M University in partial fulfillment of the requirements for the degree of DOCTOR OF PHILOSOPHY Chair of Committee, Hadi Nasrabadi Committee Members, Maria Barrufet Jerome Schubert Mahmoud El-Halwagi Head of Department, Jeff Spath May 2021 Major Subject: Petroleum Engineering Copyright 2021 Raja Subramanian Ramanathan
-
Upload
khangminh22 -
Category
Documents
-
view
0 -
download
0
Transcript of iron sulfide scale removal using - OAKTrust

IRON SULFIDE SCALE REMOVAL USING
ALTERNATIVE DISSOLVERS
A Dissertation
by
RAJA SUBRAMANIAN RAMANATHAN
Submitted to the Office of Graduate and Professional Studies of
Texas A&M University
in partial fulfillment of the requirements for the degree of
DOCTOR OF PHILOSOPHY
Chair of Committee, Hadi Nasrabadi
Committee Members, Maria Barrufet
Jerome Schubert
Mahmoud El-Halwagi
Head of Department, Jeff Spath
May 2021
Major Subject: Petroleum Engineering
Copyright 2021 Raja Subramanian Ramanathan
ii
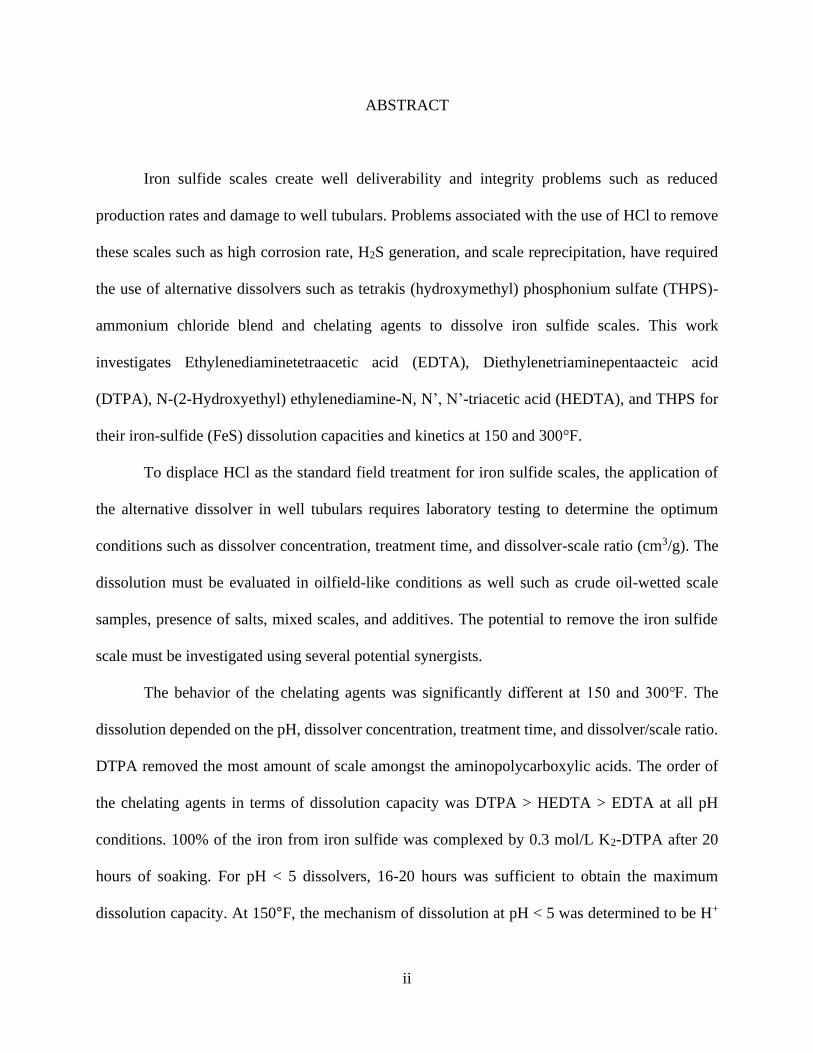
ABSTRACT
Iron sulfide scales create well deliverability and integrity problems such as reduced
production rates and damage to well tubulars. Problems associated with the use of HCl to remove
these scales such as high corrosion rate, H2S generation, and scale reprecipitation, have required
the use of alternative dissolvers such as tetrakis (hydroxymethyl) phosphonium sulfate (THPS)-
ammonium chloride blend and chelating agents to dissolve iron sulfide scales. This work
investigates Ethylenediaminetetraacetic acid (EDTA), Diethylenetriaminepentaacteic acid
(DTPA), N-(2-Hydroxyethyl) ethylenediamine-N, N’, N’-triacetic acid (HEDTA), and THPS for
their iron-sulfide (FeS) dissolution capacities and kinetics at 150 and 300°F.
To displace HCl as the standard field treatment for iron sulfide scales, the application of
the alternative dissolver in well tubulars requires laboratory testing to determine the optimum
conditions such as dissolver concentration, treatment time, and dissolver-scale ratio (cm3/g). The
dissolution must be evaluated in oilfield-like conditions as well such as crude oil-wetted scale
samples, presence of salts, mixed scales, and additives. The potential to remove the iron sulfide
scale must be investigated using several potential synergists.
The behavior of the chelating agents was significantly different at 150 and 300. The
dissolution depended on the pH, dissolver concentration, treatment time, and dissolver/scale ratio.
DTPA removed the most amount of scale amongst the aminopolycarboxylic acids. The order of
the chelating agents in terms of dissolution capacity was DTPA > HEDTA > EDTA at all pH
conditions. 100% of the iron from iron sulfide was complexed by 0.3 mol/L K2-DTPA after 20
hours of soaking. For pH < 5 dissolvers, 16-20 hours was sufficient to obtain the maximum
dissolution capacity. At 150°F, the mechanism of dissolution at pH < 5 was determined to be H+

iii
attack with surface complexation. At 300°F, the dissolution of the scale was significantly improved
in alkaline dissolvers. There was an improvement in the effectiveness of the ligands due to the
lowering of Fe-S bond strength and increased activity of the chelating agent. THPS-ammonium
chloride blend was also optimized for its maximum iron sulfide scale removal. The role of
corrosion inhibitor and H2S scavenger did not decrease the dissolution characteristics of the
alternative dissolvers. Mixed scales containing calcium carbonate impacted the dissolution of iron
sulfide due to the dissolver’s preference to remove the calcium deposit. Overall, the dissolution of
the total deposit was unaffected. Synergists such as potassium iodide, potassium citrate, and
sodium fluoride helped enhance the dissolution capacity of EDTA and DTPA at 150 and 300°F.
The role of THPS and chelating agents in iron-sulfide dissolution has not been thoroughly
investigated. No study reports the optimum treatment parameters. The role of the pH of the
dissolver also needs more attention. Oilfield-like conditions are rarely studied in the laboratory for
scale removal research. New synergists are also introduced that could help improve the dissolution
rate. The current work provides an in-depth investigation of alternative dissolvers so that chemical
operators could design field treatments for the removal of iron sulfide scale.
iv
DEDICATION
This dissertation is dedicated to my grandmother, parents, and my brother. My Ph.D.
journey has been tough especially because of the international distance between my family and
myself, but I am sure that the fruits of the struggle will be worth it. Without their constant support,
this would have been difficult to achieve.
I also want to dedicate the dissertation to the memory of Dr. Hisham Nasr-El-Din, who was
my research advisor until he passed away. He was a pillar of support to my education and research
and this work could not have been completed without his blessings.

v
ACKNOWLEDGEMENTS
I would like to thank Dr. Hisham Nasr-El-Din, who was my committee chair prior to his
passing in July 2020. I would also like to thank my committee chair, Dr. Hadi Nasrabadi, for his
support and his crucial mentorship during the transition. I would like to thank Dr. Maria Barrufet,
Dr. Jerome Schubert, and Dr. Mahmoud El-Halwagi for serving as the committee members. Ms.
Gia Alexander is acknowledged for proofreading this dissertation. Mr. John Maldonado is
appreciated for his role as the department facilities manager and for his personal help in fixing
issues related to the equipment maintenance.
I would like to thank my friends, colleagues, and the department faculty and staff for
making my time at Texas A&M University a great experience.
Finally, thanks to my parents and my brother for their encouragement.

vi
CONTRIBUTORS AND FUNDING SOURCES
Contributors
This work was supervised by a dissertation committee consisting of Professor Dr. Hadi
Nasrabadi [Petroleum Engineering], Dr. Jerome Schubert [Petroleum Engineering], Dr. Maria
Barrufet [Petroleum Engineering], and Dr. Mahmoud El-Halwagi [Chemical Engineering].
Funding Sources
All work conducted for the dissertation was completed by the student independently.

vii
NOMENCLATURE
IAP Ion Activation Product
SI Saturation Index
ICP-OES Inductively Coupled Plasma-Optical Emission Spectrometer
SEM Scanning Electron Microscopy
SRB Sulfate Reducing Bacteria
BEC Big Escambria Creek
XRD X-ray Diffraction
DTPA Diethylenetriaminepentaacetic Acid
ATP Adenosine Triphosphate
THPS Tetrakis(hydroxymethyl)phosphonium Sulfate
SMU South Monagas Unit
EDTA Ethylenediaminetetraacetic Acid
APCA Aminopolycarboxylic Acid
HEDTA Hydroxyethylethylenediaminetriacetic Acid
DFT Density Functional Theory

viii
TABLE OF CONTENTS
Page
ABSTRACT .................................................................................................................................... ii
DEDICATION ............................................................................................................................... iv
ACKNOWLEDGEMENTS ............................................................................................................ v
CONTRIBUTORS AND FUNDING SOURCES ......................................................................... vi
NOMENCLATURE ..................................................................................................................... vii
LIST OF FIGURES ........................................................................................................................ x
LIST OF TABLES ....................................................................................................................... xiv
CHAPTER I INTRODUCTION ..................................................................................................... 1
CHAPTER II ALTERNATIVE SCALE DISSOLVERS ............................................................. 16
Chemistry of Aminopolycarboxylic Acids ............................................................................... 16
Applications of Aminopolycarboxylic Acids ........................................................................... 21
Chemistry of THPS ................................................................................................................... 25
CHAPTER III PROBLEM STATEMENT ................................................................................... 28
CHAPTER IV OBJECTIVES....................................................................................................... 30
CHAPTER V MATERIALS......................................................................................................... 32
Chemical dissolvers and additives ............................................................................................ 32
Mineral Scale ............................................................................................................................ 34
Corrosion Coupons ................................................................................................................... 36
CHAPTER VI EXPERIMENTAL METHODS ........................................................................... 37
ix
Bottle Solubility Test ................................................................................................................ 37
Autoclave Solubility Test ......................................................................................................... 39
Corrosion Test ........................................................................................................................... 41
CHAPTER VII RESULTS AND DISCUSSION ......................................................................... 43
Screening Alternative Dissolvers .............................................................................................. 45
Aminopolycarboxylic Acid: Effect of pH ................................................................................ 58
Aminopolycarboxylic Acid: Effect of Dissolver Concentration .............................................. 61
Aminopolycarboxylic Acid: Effect of Treatment Time ........................................................... 69
Aminopolycarboxylic Acid: Effect of Coordination Number .................................................. 73
Aminopolycarboxylic Acid: Effect of Temperature ................................................................. 75
Aminopolycarboxylic Acid: Effect of Dissolver/Scale Ratio at 300°F .................................... 79
Aminopolycarboxylic Acid: Effect of Salinity on Scale Solubility ......................................... 80
Aminopolycarboxylic Acid: Effect of Crude Oil Coating on Scale ......................................... 82
Aminopolycarboxylic Acid: Effect of Mixed Scales ................................................................ 83
Aminopolycarboxylic Acid: Effect of Synergists ..................................................................... 85
Aminopolycarboxylic Acid: Mechanism of Iron Sulfide Scale Dissolution ............................ 92
THPS: Effect of Ammonium Chloride ..................................................................................... 95
THPS: Effect of Concentration ................................................................................................. 97
THPS: Effect of Treatment Time ............................................................................................ 100
THPS: Effect of Dissolver/Scale Ratio ................................................................................... 102
THPS: Effect of Salinity ......................................................................................................... 108
THPS: Effect of Crude Oil Coating and Additives on Scale .................................................. 110
THPS: Effect of Mixed Scales ................................................................................................ 112
Selecting the Best Dissolver ................................................................................................... 114
CHAPTER VIII CONCLUSIONS AND FUTURE WORK ...................................................... 118
REFERENCES ........................................................................................................................... 122

x
LIST OF FIGURES
Page
Fig. 1—Scale build-up in well tubulars. ..........................................................................................3
Fig. 2—General structure of a chelate-metal complex. .................................................................17
Fig. 3—Common examples of aminopolycarboxylic acids (Almubarak et al. 2017b). ................18
Fig. 4—Speciation diagrams for EDTA (after Harris 2007) and DTPA (after Moulin et al.
2003). ..............................................................................................................................20
Fig. 5—Chemical structure of THPS. ............................................................................................26
Fig. 6—THPS-iron (II) complex (Talbot et al. 2002) ....................................................................27
Fig. 7—XRD pattern of the iron sulfide scale sample (Batch 1). ..................................................35
Fig. 8—XRD pattern of the iron sulfide scale sample (Batch 2). ..................................................35
Fig. 9—XRD pattern of the iron sulfide scale sample (Batch 3). ..................................................36
Fig. 10—Pyrex bottles used for the solubility tests. ......................................................................39
Fig. 11—Schematic diagram of the autoclave apparatus...............................................................41
Fig. 12—Effect of formic acid concentration on the dissolution of the iron sulfide scale. ...........46
Fig. 13— Effect of maleic acid concentration on the dissolution of the iron sulfide scale. ..........47
Fig. 14—Effect of citric acid concentration on the dissolution of the iron sulfide scale. .............49
Fig. 15—Effect of lactic acid concentration on the dissolution of the iron sulfide scale. .............50
Fig. 16—Effect of oxalic acid concentration on the dissolution of the iron sulfide scale. ............52
Fig. 17—Effect of Na2EDTA concentration on the dissolution of the iron sulfide scale. .............53
Fig. 18—Effect of K5DTPA concentration on the dissolution of the iron sulfide scale. ...............54
Fig. 19—Summary of the screening study using equimolar concentration alternative
dissolvers for FeS scale removal. ...................................................................................57
Fig. 20—Effect of pH on the iron-sulfide dissolution capacity after 72 hours of soaking. ...........58

xi
Fig. 21—Effect of concentration on the iron sulfide dissolution at pH < 5 after 72 hours of
soaking. ..........................................................................................................................63
Fig. 22—Effect of concentration on the iron sulfide dissolution at pH between 5 and 9 after 72
hours of soaking. ............................................................................................................64
Fig. 23—Dissolver consumption as a function of dissolver concentration for acidic chelating
solutions (pH < 5) after 72 hours of soaking. .................................................................67
Fig. 24—Iron sulfide dissolution as a function of time for Na2-EDTA at 150°F. .........................70
Fig. 25—Iron-sulfide dissolution vs. time for K-HEDTA at 150°F. .............................................70
Fig. 26—Iron sulfide dissolution vs time for K2-DTPA at 150°F. ................................................71
Fig. 27—Dissolution of iron sulfide as a function of time at pH between 5 and 9 of EDTA and
150°F. .............................................................................................................................72
Fig. 28—Comparison of fractional dissolution as a function of time for pH < 5 (K2-DTPA)
and pH > 10 (K5-DTPA) DTPA solution and 150°F. ....................................................73
Fig. 29—(a) Na2-EDTA (b) K2-DTPA (c) K-HEDTA solutions after 72 hours of reactions
with iron sulfide. ............................................................................................................74
Fig. 30—Effect of temperature on the dissolution of iron sulfide at pH between 5 and 9. ...........77
Fig. 31—Effect of temperature on the dissolution of iron sulfide at pH > 10. ..............................77
Fig. 32—Effect of dissolver/scale ratio on the dissolution capacity of the ligands at 300°F
after 20 hours of soaking. ...............................................................................................79
Fig. 33—Effect of sodium and calcium ions in dissolver solution on the dissolution capacity
of K2-DTPA at 150°F. ....................................................................................................81
Fig. 34—Dissolution capacity of K2-DTPA in presence of crude oil coated iron sulfide scale
sample at 150°F. .............................................................................................................82
Fig. 35—Selectivity of K2-DTPA towards a mixed scale sample at 150°F. .................................84
Fig. 36—Impact of synergists to Na2-EDTA's dissolution capacity at 150°F. ..............................87
Fig. 37—Impact of synergists to K2-DTPA's dissolution capacity at 150°F. ................................87
Fig. 38—Impact of synergists to K-HEDTA's dissolution capacity at 150°F. ..............................88
Fig. 39—Effect of base type on the dissolution capacity of EDTA at 300°F. ...............................89
Fig. 40—Impact of synergists on Na4-EDTA’s dissolution capacity at 300°F. ............................90

xii
Fig. 41—Impact of synergists on K4-EDTA’s dissolution capacity at 300°F. ..............................90
Fig. 42—Impact of synergists on K5-DTPA’s dissolution capacity at 300°F. ..............................91
Fig. 43—Impact of synergists on K3-HEDTA’s dissolution capacity at 300°F. ...........................91
Fig. 44— SEM image: (a) original iron sulfide particles having continuous non-porous
structure and (b) undissolved iron sulfide particles after dissolution with 0.3 mol/L
K2-DTPA (pH 3.6) at 150°F for 20 hours, showing smooth (red box) and porous
(red circle) structures. .....................................................................................................93
Fig. 45— SEM image of undissolved iron sulfide particles after reaction with 0.3 mol/L Na4-
EDTA (pH 10.2) at 150°F for 20 hours, showing smooth surfaces, indicating no
surface activity. ..............................................................................................................94
Fig. 46— SEM image of undissolved iron sulfide particles after reaction with 0.2 mol/L Na4-
EDTA (pH 10.2) at 300°F for 8 hours, showing rounded surfaces. ...............................94
Fig. 47—Effect of adding NH4Cl to THPS on the iron sulfide dissolution at 150°F and
soaking time of 48 hours. ...............................................................................................96
Fig. 48—Effect of blend concentration on the iron sulfide dissolution at 150°F and soaking
time of 48 hours. .............................................................................................................98
Fig. 49—Effect of THPS-ammonium chloride blend concentration on the dissolver
effectiveness to remove iron sulfide scale at 150°F. ......................................................99
Fig. 50— Effect of treatment time on the dissolution capacity using THPS-ammonium
chloride blend at 150°F. ...............................................................................................101
Fig. 51—Change in the dissolution capacity at different intervals of time. ................................102
Fig. 52—Effect of dissolver/scale ratio on the dissolution capacity at 150°F and soaking time
of 48 hours. ...................................................................................................................103
Fig. 53—Effect of D/S ratio on the dissolution capacity of THPS-ammonium chloride blend
to dissolve iron sulfide scale at 150°F. The soaking time was 48 hours. .....................104
Fig. 54—Effect of D/S ratio on the THPS-ammonium chloride blend dissolver effectiveness
at 150°F. .......................................................................................................................106
Fig. 55—Dissolution capacity of the THPS-ammonium chloride blend when it is prepared
using deionized water and when prepared using 5 wt% NaCl. ....................................109
Fig. 56—Calcium sulfate precipitate when THPS is mixed with 1 wt% CaCl2. .........................110
Fig. 57—Dissolution capacity of a THPS-ammonium chloride blend in presence of crude oil
coated iron sulfide scale sample at 150°F. ...................................................................111
xiii
Fig. 58—Effect of additives on the iron sulfide scale solubility at 150°F. ..................................111
Fig. 59—Selectivity of the THPS-ammonium chloride blend for mixed scale samples. ............113
Fig. 60—Comparison of dissolution capacity between the dissolvers to remove crude wetted
iron sulfide at 150°F. ....................................................................................................115
Fig. 61—Comparison of dissolution capacity between the dissolvers to remove mixed scale
deposits at 150°F. The D/S ratio is 100/1 cm3/g and the treatment time is 20 hours. ..116

xiv
LIST OF TABLES
Page
Table 1—pKa values of the chelating agents used in this study (Chang and Matijević 1983). ... 19
Table 2—List of dissolvers used in this work. ............................................................................. 33
Table 3—Results of the iron sulfide scale dissolution test using formic acid. ............................. 46
Table 4—Results of the iron sulfide scale dissolution test using maleic acid. ............................. 48
Table 5—Results of the iron sulfide scale dissolution test using citric acid. ............................... 49
Table 6—Results of the iron sulfide scale dissolution test using lactic acid. ............................... 51
Table 7—Results of the iron sulfide scale dissolution test using oxalic acid. .............................. 52
Table 8—Results of the iron sulfide scale dissolution test using Na2EDTA. ............................... 54
Table 9—Results of the iron sulfide scale dissolution test using K5DTPA. ................................. 55
Table 10—Summary of results from the dissolver screening tests. .............................................. 56
Table 11—Initial and final pH values of Na2-EDTA, K-HEDTA, and K2-DTPA after reaction
with iron sulfide for 72 hours at 150°F. ...................................................................... 60
Table 12—Results of the effect of pH of aminopolycarboxylic acid on scale solubility test at
150°F. .......................................................................................................................... 61
Table 13—Results of the effect of concentration of aminopolycarboxylic acid on scale
solubility test at 150°F and pH < 5. ............................................................................ 65
Table 14—Results of the effect of concentration of aminopolycarboxylic acid on scale
solubility test at 150°F and 5 < pH < 9. ...................................................................... 66
Table 15—Dissolver consumption and dissolver effectiveness for the aminopolycarboxylic
dissolvers with pH < 9. ............................................................................................... 68
Table 16—Iron sulfide dissolution capacity of aminopolycarboxylic acids at 150 and 300°F. ... 78
Table 17—Selectivity of 0.4 mol/L K2-DTPA in an 1:1 iron sulfide-calcium carbonate mixed
system with a D/S ratio of 50/1 cm3/g. ....................................................................... 85
Table 18—Effect of adding NH4Cl to THPS on the iron sulfide solubility at 150°F. .................. 97
xv
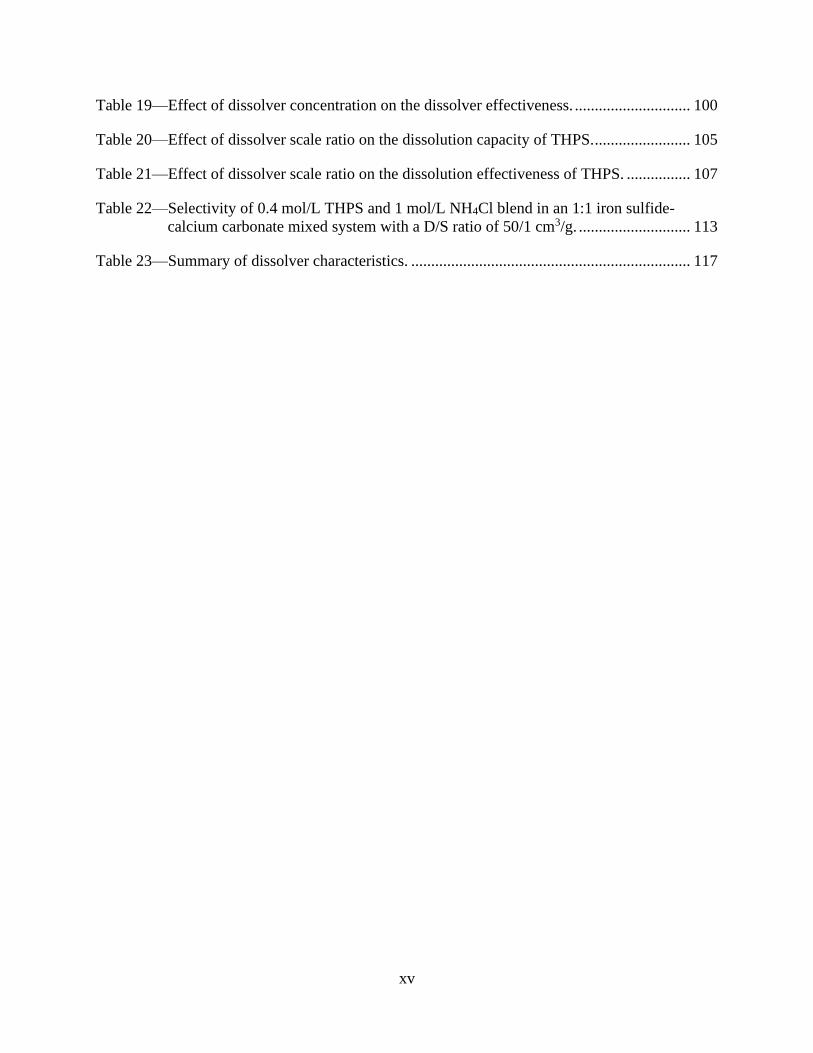
Table 19—Effect of dissolver concentration on the dissolver effectiveness. ............................. 100
Table 20—Effect of dissolver scale ratio on the dissolution capacity of THPS. ........................ 105
Table 21—Effect of dissolver scale ratio on the dissolution effectiveness of THPS. ................ 107
Table 22—Selectivity of 0.4 mol/L THPS and 1 mol/L NH4Cl blend in an 1:1 iron sulfide-
calcium carbonate mixed system with a D/S ratio of 50/1 cm3/g. ............................ 113
Table 23—Summary of dissolver characteristics. ...................................................................... 117

CHAPTER I
INTRODUCTION
The solubility of a salt or mineral in a solution can be defined as the property of the solute
to be dissolved in the solution. It is a dynamic parameter that results from opposing processes of
dissolution and precipitation. At equilibrium, the two processes occur at a constant rate. Solubility
is generally expressed as a concentration term (for example, as g of solute per kg of solvent,
molarity, or mole fraction). The solubility of the salt or mineral in brine depends on the physical
and chemical properties of the solute and the solvent, as well as external factors such as
temperature, pressure, pH, alkalinity, and chemical interactions with other components. The
dynamic nature of the solubility is often expressed in terms of the solubility product. The solubility
product, Ksp, is like the equilibrium product. When a salt/mineral is in a solution, there is a
dissolution reaction, which occurs as follows (Eq. 1):
𝐴𝑎𝐵𝑏(𝑠) 𝑎𝐴(𝑎𝑞) + 𝑏𝐵(𝑎𝑞), …………………..….…………………...……. (1)
The law of mass action at equilibrium dictates the following equation as the solubility
product of the dissolution reaction (Eq. 2):
𝐾𝑠𝑝 = [𝐴]𝑎[𝐵]𝑏
[𝐴𝑎𝐵𝑏], ……………………………..….…………………...…… (2)
where the terms in parenthesis indicate the concentration of each specific component. The
denominator concentration term, [AaBb], is considered to be unity as it exists in the solid form.
The simplest solubility classification rule shows the mineral to be soluble when Ksp > 1 and
insoluble at Ksp ≤ 1. However, there are several factors that make this classification inadequate.

2
The state of equilibrium may not always exist and another factor, called the Ion Activation Product
(IAP) in the solution is defined as Eq. 3:
𝐼𝐴𝑃 = [𝐴]𝑎𝑐𝑡𝑢𝑎𝑙𝑎 [𝐵]𝑎𝑐𝑡𝑢𝑎𝑙
𝑏 , ……………………………..….……………………. (3)
The solution at non-equilibrium conditions can be undersaturated, saturated, or
supersaturated with the salt/mineral. The Saturation Index (SI) of a solution is a quantitative
indicator of the scaling tendency and determines whether the solution is undersaturated, saturated,
or supersaturated at non-equilibrium conditions. It is given in Eq. 4:
𝑆𝐼 = 𝑙𝑜𝑔10 (𝐼𝐴𝑃
𝐾𝑠𝑝), ……………………………..….…………………...…… (4)
The solution is saturated, undersaturated, and supersaturated when SI = 0, < 0, and > 0,
respectively. Scaling is the inorganic salt/mineral precipitation from supersaturated solutions.
Organic scaling can be referred to as wax/asphaltenes/hydrates precipitation. Scales build up over
time and affect core processes in industries. The problem of scales exists in industrial refining
plants, transport and storage facilities, oilfield tubulars, pumps, and water pipelines. Scaling can
occur because of physical or chemical changes and external factors such as a change in pressure,
temperature, alkalinity, and pH. Carbonates, sulfides, sulfates, oxides, silicates, hydroxides, and
phosphates are some common types of inorganic deposits. The formation of each scale is unique
and based on its environment. In the oil and gas industry, the most common scales are carbonates,
sulfides, sulfates, and oxides. These deposits are commonly found in the well tubulars, pipelines,
and downhole equipment such as pumps. The source of the scaling issues can originate from
mixing two incompatible waters, supersaturated reservoir brines during production or the
corrosion products in the tubulars or pipelines. The consequences of tubular scaling, as a result of

3
fluid incompatibility, high salinity, or high-pressure drawdown, includes but is not limited to
reduced productivity, damaged wells, and crude oil emulsions. Sulfide scales can cause a corrosive
effect on ferrous metals (Smith and Miller 2013). Downhole pumps can get damaged and near
wellbore areas may get affected. These problems interfere with productivity and reduce its
effectiveness. Fig. 1 demonstrates a well tubular affected by scaling.
Fig. 1—Scale build-up in well tubulars.
The Hagen-Poiseuille equation (Eq. 5) shows the relationship between the pressure drop,
flow rate, and the diameter of the well tubular. When the effective diameter for production
decreases, the productivity index, q/∆P, decreases.
∆𝑃 = 128𝑞𝜇𝐿
𝜋𝐷4 , …………………………………………………..….……………. (5)
The decrease in the productivity index can create economic impacts. In the United States,
the scaling issues cost $1.4 billion annually (Frenier 2002). In the UK North Sea, more than four
million barrels of oil production is lost annually, mainly due to barium sulfate scales (Graham and
Mackay 2004). High water-cuts can lead to increased scaling problems, which usually occurs in

4
mature fields. Continuous monitoring of the produced water samples using an Inductively Coupled
Plasma Optical Emission Spectrometer (ICP-OES) is important to understand the scaling tendency
for the well. Squeeze treatments are used as preventive measures to delay the formation of the
scale. The treatment involves the injection of an inhibitor as a matrix squeeze program or pumped
through a spaghetti pipe into the production tubing. An inhibitor works by reducing the rate of
scale formation through adsorbing onto critical sites of the scale crystals and blocking the
formation of larger crystals. These inhibitors are tailored to requirements and their effectiveness is
highly dependent on the success of the field application. The treatments have a life beyond which
the formation of scale increases. Frequent treatments can be done throughout the life of the well.
The expensive and continuous treatment using scale inhibitors has pushed several operators to use
scale removal methods instead.
The removal of these deposits is essential to improve fluid flow rates and decrease pressure
drop, reduce corrosion, increase the lifetime of equipment, and improve operational safety.
Descaling is done using mechanical methods such as hydro blasting and particulate blasting. These
methods have disadvantages in treating inaccessible locations of the wellbore and treatment
economics. Chemical methods of descaling are popular due to its ease of treatment and its
effectiveness. However, extensive R&D efforts must be done to identify a suitable chemical
program to treat the scale. The removal of scales requires in-depth knowledge of the target scale
and careful treatment planning to ensure high effectiveness. The efficiency of chemical treatments
is determined by evaluating the reaction rate of the chemical with the scale, the surface area of
contact, optimum concentration and volume, and scale characteristics such as composition,
morphology, and mass.

5
The sulfide scale is difficult to treat as it has a lower solubility compared to carbonates and
sulfates. Since the solubility product of iron sulfide is low with a value of 10-18.1 at 77°F (Martell
et al. 1996), it precipitates much more easily than the other scales. Liu et al. (2017) presented a
new approach to study the iron sulfide precipitation kinetics using an anoxic plug flow reactor and
contributed valuable thermodynamic and kinetic data for scale prediction and control in the oil and
gas industry. They studied the iron sulfide precipitation kinetics at a different temperature, ionic
strength, and ferrous ion-sulfide ratio. A pseudo-first-order reaction with respect to the ferrous ion
concentration was observed when its concentration is much lower than the sulfide ion
concentration. They also found that precipitation is accelerated at high temperatures and high ionic
strength conditions. The solubility of pyrrhotite, Fe1-xS, in ultra-pure water, was measured at 77 to
185 by Murcia et al. (2018). By using precipitated iron sulfide in equilibrium with the ultra-pure
water, they found that the solubility increased by 54 times at 185°F compared to 77°F. Morse and
Cornwell (1987) reported the separation of iron sulfides into two categories: acid-volatile sulfide
and pyrite. They characterized different samples of iron sulfide minerals through Scanning
Electron Microscopy (SEM) and analytical techniques. Rickard and Luther (2007) presented a
comprehensive review of the thermodynamic behavior of iron sulfide chemistry in marine
environments. They studied sulfur and iron stability diagrams, molecular orbital data, and chemical
interactions to understand the formation of different species of iron sulfides at different
environmental conditions. They documented the formation mechanisms of mackinawite, cubic
FeS, troilite, pyrrhotite, smythite, greigite, pyrite, and marcasite.
In the oilfield, iron sulfide scales are formed in well tubulars and pipelines and can create
production-related issues such as lower productivity rate, loss of injectivity, emulsion formation,
and damaged equipment. Iron sulfide is the most common type of sulfide scale. Even small

6
amounts of iron-containing scale, often viewed as insignificant, are capable of placing large
volumes of precipitate in the formation (Walker et al. 1991). Iron sulfides are oil-wet in nature and
the presence of the oil film hinders its solubility (Wylde et al. 2015). The scale also leads to well
surveillance and intervention problems. There are different kinds of mechanisms for the formation
of iron sulfide in the oilfield. The sources of iron are hematite in reservoir rocks, chlorite clays,
iron oxides in drilling fluids, and corrosion products. The iron can be released into the produced
water over time. Sulfur can be present as either hydrogen sulfide in sour gas wells or sulfates in
injection water. The hydrogen sulfide is present as either free gas or can be formed by reducing
sulfates using the Sulfate Reducing Bacteria (SRB), also known as biotic souring, in the formation.
An overview of SRB and its detrimental effect on oil production was described by Cord-Ruwisch
et al. (1987). Hydrogen sulfide concentration can be as high as 20-30 mol% in wells. Hydrogen
sulfide is also formed due to thermochemical sulfur reduction of organic sulfur compounds (abiotic
souring) or hydrolysis of metal sulfides (Nasr-El-Din and Al-Humaidan 2001). The mitigation of
H2S at this level is not economical (Chen et al. 2019). A good review of sour gas production
experience along with scale formation in sour wells was documented by Ramachandran et al.
(2015). The combination of iron and sulfur at various environmental conditions such as pH,
temperature, and pressure can lead to the formation of different types of iron sulfide scales. A thin
layer of scale is beneficial for sour gas corrosion protection (Przybylinski 2001). However, scale
buildup can quickly lead to the aforementioned production issues. Corrosion is cited as the main
cause of iron-sulfide scale formation (Chen et al. 2018). A large concentration of iron (> 60,000
mg/L) was released from a test coupon because of a corrosion-inhibited HCl attack during an
acidizing operation. A corrosion and scale monitoring tool was introduced downhole and 3-4 µm
of iron sulfide was found to be deposited in 3 months of field production in a sour-gas well.
7
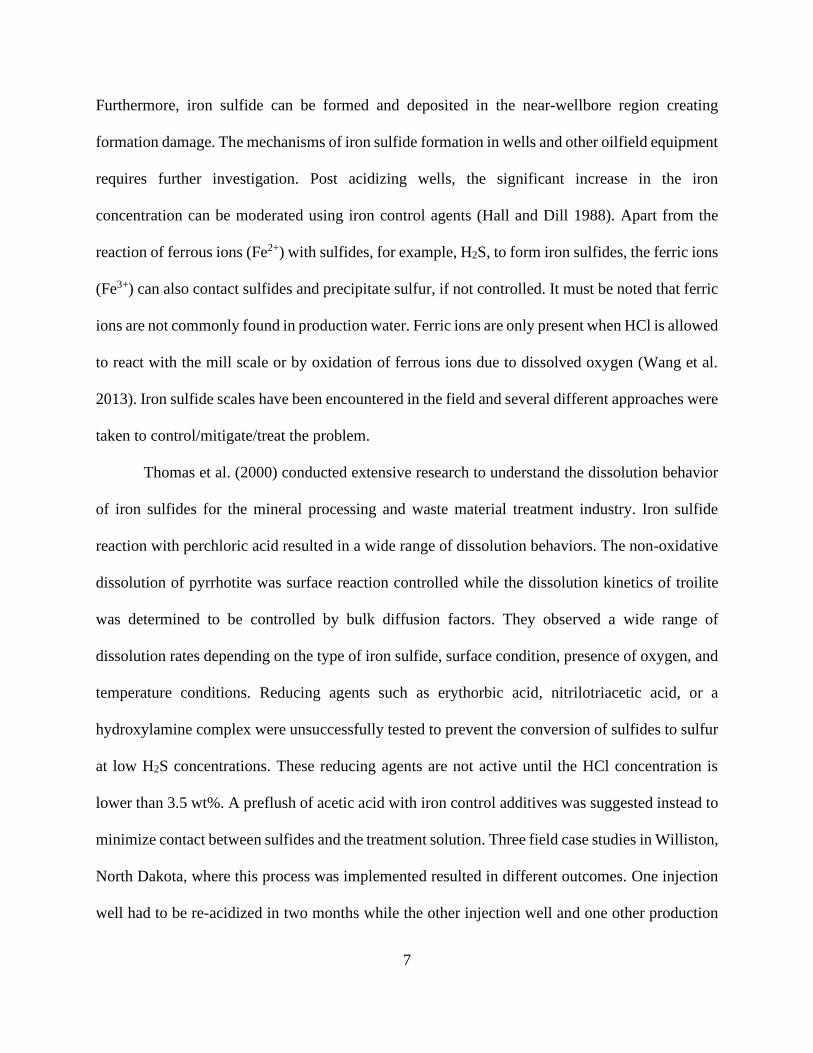
Furthermore, iron sulfide can be formed and deposited in the near-wellbore region creating
formation damage. The mechanisms of iron sulfide formation in wells and other oilfield equipment
requires further investigation. Post acidizing wells, the significant increase in the iron
concentration can be moderated using iron control agents (Hall and Dill 1988). Apart from the
reaction of ferrous ions (Fe2+) with sulfides, for example, H2S, to form iron sulfides, the ferric ions
(Fe3+) can also contact sulfides and precipitate sulfur, if not controlled. It must be noted that ferric
ions are not commonly found in production water. Ferric ions are only present when HCl is allowed
to react with the mill scale or by oxidation of ferrous ions due to dissolved oxygen (Wang et al.
2013). Iron sulfide scales have been encountered in the field and several different approaches were
taken to control/mitigate/treat the problem.
Thomas et al. (2000) conducted extensive research to understand the dissolution behavior
of iron sulfides for the mineral processing and waste material treatment industry. Iron sulfide
reaction with perchloric acid resulted in a wide range of dissolution behaviors. The non-oxidative
dissolution of pyrrhotite was surface reaction controlled while the dissolution kinetics of troilite
was determined to be controlled by bulk diffusion factors. They observed a wide range of
dissolution rates depending on the type of iron sulfide, surface condition, presence of oxygen, and
temperature conditions. Reducing agents such as erythorbic acid, nitrilotriacetic acid, or a
hydroxylamine complex were unsuccessfully tested to prevent the conversion of sulfides to sulfur
at low H2S concentrations. These reducing agents are not active until the HCl concentration is
lower than 3.5 wt%. A preflush of acetic acid with iron control additives was suggested instead to
minimize contact between sulfides and the treatment solution. Three field case studies in Williston,
North Dakota, where this process was implemented resulted in different outcomes. One injection
well had to be re-acidized in two months while the other injection well and one other production

8
well was successfully cleaned the first time with an increase in production rate. Kasnick and Engen
(1989) reported the formation of light brown-black, porous scales at the bottom half of the tubing
string and that corrosion occurs under the scale. Gas condensate breakout at lower depths naturally
inhibited the formation of scales. Upon observing multiple wells, they found that acidized wells
produced the iron sulfide scales by reprecipitation. Ford et al. (1992) presented a three-part analysis
on optimizing chemical treatment and successfully removed damage created by scales in several
wells in northeast British Columbia. In this study, the authors recommended a tube cleanout prior
to any acidizing treatment to prevent reprecipitation as well as premature acid consumption due to
scale dissolution in the tubing during acidizing operations. Khuff reservoir wells in Bahrain were
affected by iron sulfide and iron carbonate scaling issues due to corrosion products (Mirza and
Prasad 1999). A study of a few wells developed in the 1970s showed that discontinuation of
adequate corrosion inhibition was one of the main factors for increasing corrosion and
consequently iron sulfide scale formation. Acid stimulation of the formation in presence of scales
in the tubulars also caused the increase in scale deposition. Mechanical methods of scale removal
were considered but they found several disadvantages such as difficulty in lifting scale particles,
the use of expensive mud to kill well, impossible maneuvering through downhole equipment, and
coiled tubing injection pressure (size 1.5/1.75”) limitation especially at deeper locations. The
company decided to use 15% HCl through coiled tubing as the treatment procedure.
The scale treatment in Khuff gas wells has been an evolving process over the years (Wang
et al. 2016). The process of descaling during 1980-2005 was primarily HCl stimulation. The
process of using HCl was stopped after 2005 due to safety and reprecipitation concerns. Since
2015, the wells have been treated using coiled tubing superfoam without reservoir isolation. Buali
et al. (2014) used mechanical means with the help of a fluidic oscillator and hydrajet tool in iron

9
sulfide contaminated Ghawar field wells at 300°F. They provided a detailed description of the
mechanical scale removal process with well test curves. Espinosa et al. (2016) presented a new
live descaling operation process in the Ghawar field using mechanical means. Wells in the Big
Escambia Creek (BEC) suffered corrosion and iron sulfide scale deposition problems in the 1970s
(Smith and Pakalapati 2004). The state-of-the-art technology to understand scale formation has
developed to a great extent over the years. They observed that iron sulfide scales were formed on
top of other scales such as iron oxide and iron chlorides and quickly became the dominant scale
due to a high concentration of H2S in those wells. A field study in the Ghawar oilfield showed that
43% of the scales formed are iron sulfides (Chen et al. 2016). In that study, they characterized
scale samples from gas wells with up to 10% H2S content, very low water production (2
bbl/MMscfd), and no previous subsurface corrosion or scale management treatments. X-ray
Diffraction (XRD) tests showed pyrrhotite (Fe1-xS) as the dominant phase of iron sulfide followed
by troilite and mackinawite.
Franco et al. (2008) provided an engineering study to evaluate mineral scale impact on
production and described mitigation strategies. An analysis of the water geochemical data through
continuous sampling and scale prediction via software helped in identifying the type and mass of
scale deposited. The skin damage was quantified by using that data in conjunction with actual and
forecasted production data. The paper suggested that the impact of scaling was higher when the
reservoir has been depleted for several years. Strategies to investigate possible solutions must start
with an extensive laboratory study and to find the best corrosion and scale inhibitors depending on
factors such as type of reservoir fluids, reservoir rock, temperature, and pressure. Secondly, a
determination for the best chemical deployment methods must be considered based on the area of
scale deposition. Thorough tracking of the field data is essential to understand and develop future
10
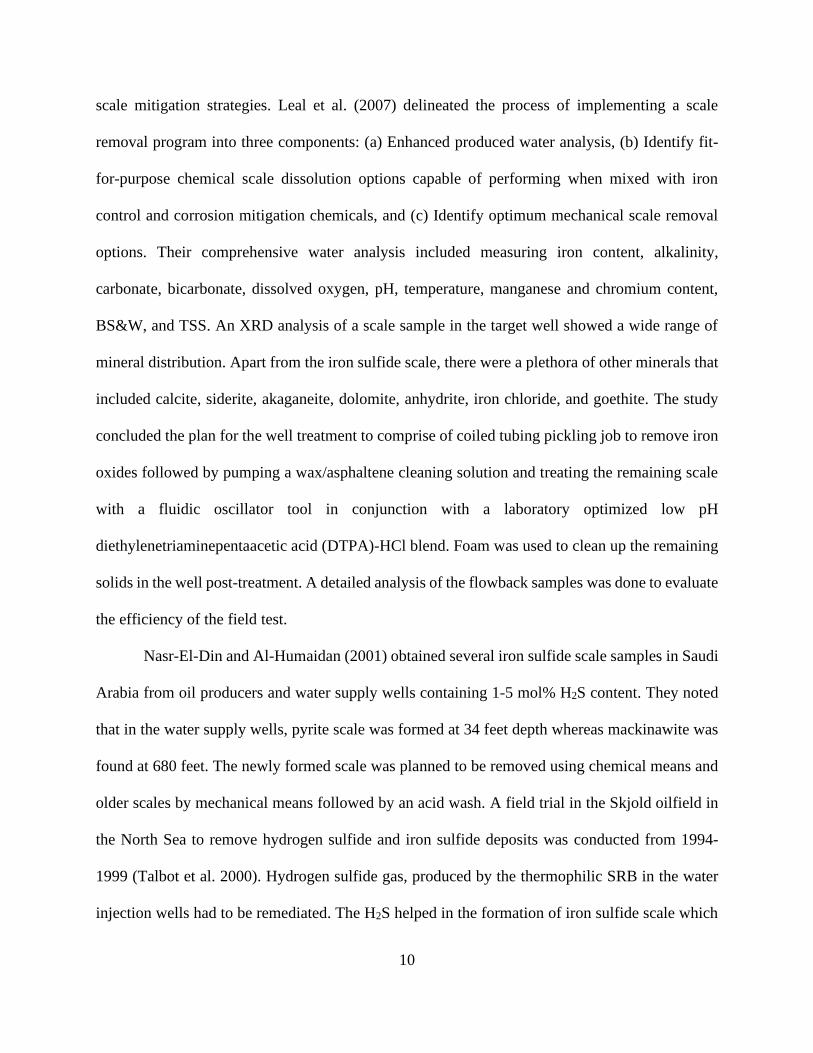
scale mitigation strategies. Leal et al. (2007) delineated the process of implementing a scale
removal program into three components: (a) Enhanced produced water analysis, (b) Identify fit-
for-purpose chemical scale dissolution options capable of performing when mixed with iron
control and corrosion mitigation chemicals, and (c) Identify optimum mechanical scale removal
options. Their comprehensive water analysis included measuring iron content, alkalinity,
carbonate, bicarbonate, dissolved oxygen, pH, temperature, manganese and chromium content,
BS&W, and TSS. An XRD analysis of a scale sample in the target well showed a wide range of
mineral distribution. Apart from the iron sulfide scale, there were a plethora of other minerals that
included calcite, siderite, akaganeite, dolomite, anhydrite, iron chloride, and goethite. The study
concluded the plan for the well treatment to comprise of coiled tubing pickling job to remove iron
oxides followed by pumping a wax/asphaltene cleaning solution and treating the remaining scale
with a fluidic oscillator tool in conjunction with a laboratory optimized low pH
diethylenetriaminepentaacetic acid (DTPA)-HCl blend. Foam was used to clean up the remaining
solids in the well post-treatment. A detailed analysis of the flowback samples was done to evaluate
the efficiency of the field test.
Nasr-El-Din and Al-Humaidan (2001) obtained several iron sulfide scale samples in Saudi
Arabia from oil producers and water supply wells containing 1-5 mol% H2S content. They noted
that in the water supply wells, pyrite scale was formed at 34 feet depth whereas mackinawite was
found at 680 feet. The newly formed scale was planned to be removed using chemical means and
older scales by mechanical means followed by an acid wash. A field trial in the Skjold oilfield in
the North Sea to remove hydrogen sulfide and iron sulfide deposits was conducted from 1994-
1999 (Talbot et al. 2000). Hydrogen sulfide gas, produced by the thermophilic SRB in the water
injection wells had to be remediated. The H2S helped in the formation of iron sulfide scale which
11
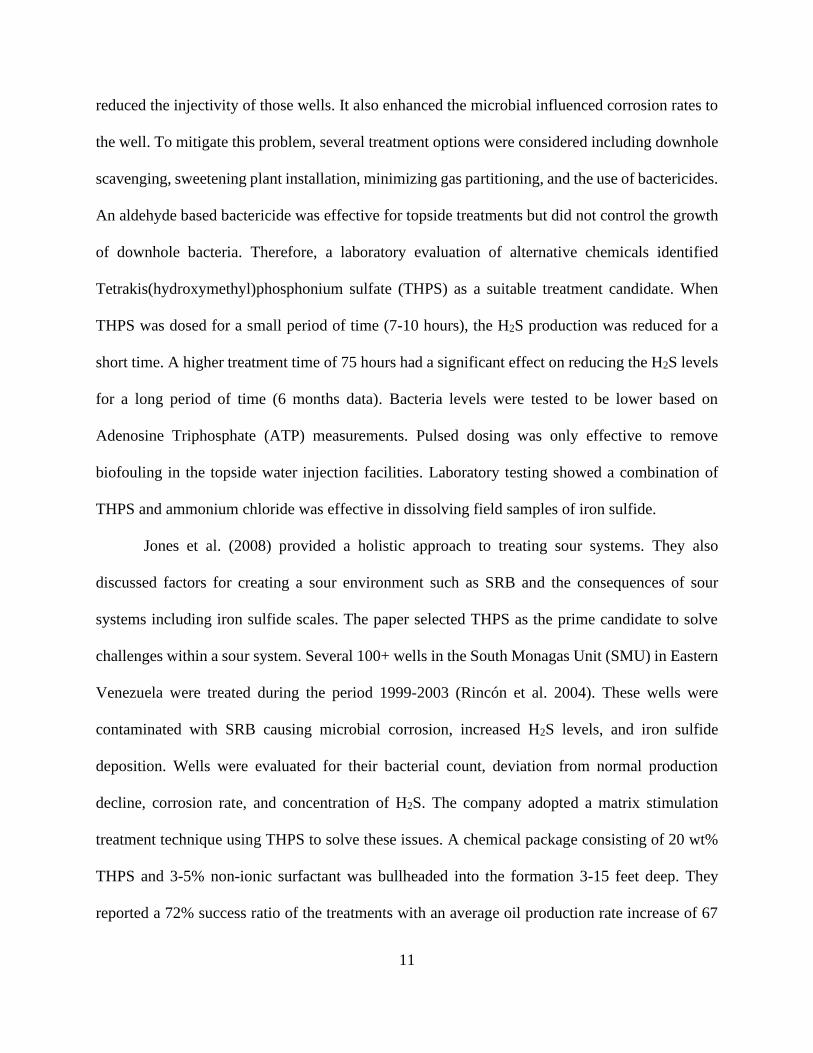
reduced the injectivity of those wells. It also enhanced the microbial influenced corrosion rates to
the well. To mitigate this problem, several treatment options were considered including downhole
scavenging, sweetening plant installation, minimizing gas partitioning, and the use of bactericides.
An aldehyde based bactericide was effective for topside treatments but did not control the growth
of downhole bacteria. Therefore, a laboratory evaluation of alternative chemicals identified
Tetrakis(hydroxymethyl)phosphonium sulfate (THPS) as a suitable treatment candidate. When
THPS was dosed for a small period of time (7-10 hours), the H2S production was reduced for a
short time. A higher treatment time of 75 hours had a significant effect on reducing the H2S levels
for a long period of time (6 months data). Bacteria levels were tested to be lower based on
Adenosine Triphosphate (ATP) measurements. Pulsed dosing was only effective to remove
biofouling in the topside water injection facilities. Laboratory testing showed a combination of
THPS and ammonium chloride was effective in dissolving field samples of iron sulfide.
Jones et al. (2008) provided a holistic approach to treating sour systems. They also
discussed factors for creating a sour environment such as SRB and the consequences of sour
systems including iron sulfide scales. The paper selected THPS as the prime candidate to solve
challenges within a sour system. Several 100+ wells in the South Monagas Unit (SMU) in Eastern
Venezuela were treated during the period 1999-2003 (Rincón et al. 2004). These wells were
contaminated with SRB causing microbial corrosion, increased H2S levels, and iron sulfide
deposition. Wells were evaluated for their bacterial count, deviation from normal production
decline, corrosion rate, and concentration of H2S. The company adopted a matrix stimulation
treatment technique using THPS to solve these issues. A chemical package consisting of 20 wt%
THPS and 3-5% non-ionic surfactant was bullheaded into the formation 3-15 feet deep. They
reported a 72% success ratio of the treatments with an average oil production rate increase of 67

12
bbl oil/day and a high production rate increase of 300%. The removal of the iron sulfide scale was
discussed to be a factor in the lower water-cuts after treatment in 50% of the wells. 87% of the
wells showed lower H2S levels for about five months post-treatment. Bacteria levels were reduced
by a million times, three weeks after the treatment. However, after five months, the bacteria levels
increased to about half of the original levels before the THPS injection. The control of bacteria
stemmed from residual THPS left in the formation, which was slowly produced with time.
Microbial induced corrosion rates were reduced by about 90% and were attributed to being the
biggest benefit of the treatment economically vs. doing a rig workover that consumes production
downtime and money. The paper also reported that iron sulfide scales were mainly formed within
5 feet of the formation. They recommended a treatment radius of 3 feet.
Hafiz et al. (2017) showed that the iron-sulfide scale remains as troilite, FeS, at high
temperatures. Pyrite exists at shallower depths compared to troilite and mackinawite (Mahmoud
et al. 2015). The iron-sulfide scale continues to pose problems in the oil field; therefore, more
effort needs to be made to understand it. The case studies have shown that iron sulfide scales are
complex and the treatment approach is still very traditional. This indicates the lack of extensive
research to obtain better and more effective solutions. Chemical removal of iron sulfide is more
attractive than mechanical methods because of several reasons such as better accessibility, lower
cost, and ease of treatment. Traditionally, hydrochloric acid is used to dissolve iron sulfide, FeS,
as it is easily available and reacts very quickly. However, it is well known that HCl can cause
corrosion problems and lead to high amounts of H2S production, consequently precipitating sulfur
(Nasr-El-Din et al. 2000a, Nasr-El-Din et al. 2000b; Hajj et al. 2015). The generation of hydrogen
sulfide is a major safety issue as well as it is highly toxic. Iron reprecipitation is yet another major
issue associated with HCl treatment as iron is not soluble in acid at pH > 1.9 (Nasr-El-Din et al.

13
2000b). As mentioned in the case studies, the release of a large quantity of iron in the solution
stream can lead to re-deposition. The iron in the solution stream has to be controlled via the use of
iron control agents which add cost to the treatment. Furthermore, hydrochloric acid is highly
corrosive when used without any inhibitors or intensifiers. The addition of excessive amounts of
corrosion inhibitors may lead to formation damage and increased costs (Kudrashou and Nasr-El-
Din 2019). Hydrogen sulfide scavengers have to be added to the HCl stream, to minimize the
evolution of toxic H2S. These additives affect the dissolution rate of the iron sulfide scale and
render it less effective. Thus, alternative dissolvers are required that can effectively dissolve iron
sulfide, have a low corrosion rate, produce less H2S, be stable at high-temperature conditions, and
not reprecipitate iron or sulfur.
The search for an alternative dissolver that can compete with hydrochloric acid has been
an active topic for the past decade. Different kinds of acids and complexing agents are viable
candidates for iron sulfide dissolution. The complex nature of iron sulfide scales and associated
environmental conditions in wells or pipelines prompt an in-depth investigation of these alternative
dissolvers. Wang et al. (2017) reviewed some of these dissolvers and its efficacy in removing iron
sulfide scales. One of the prominent solutions has been THPS, a biocide. Laboratory testing
showed THPS to be effective in controlling H2S and removing iron sulfide deposits (Talbot et al.
2000, Wylde and Winning 2004, Jones et al. 2012, Wylde et al. 2016). The removal of iron sulfide
deposits occurs because of complex formation between THPS and iron. The presence of
ammonium chloride was shown to improve the effectiveness of the treatment. The concentration
ratio of THPS-ammonium chloride was an important factor in dissolving these deposits. Static
scale dissolution studies at ambient conditions showed that THPS with ammonium chloride can
be effective in removing certain forms of iron sulfide. Troilite, FeS, was demonstrated to dissolve
14
more effectively in 30% THPS than 7.5% HCl at ambient pressure and 122°F. However, the use
of THPS in the oilfield has caused similar issues to HCl, in terms of corrosion and H2S generation.
Wylde et al. (2016) reported that the efficacy of THPS is highly affected at high-pressure
conditions. 50 wt% THPS was found to have a corrosivity of 0.05 and 0.1 lbm/ft2 at 122 and 212°F
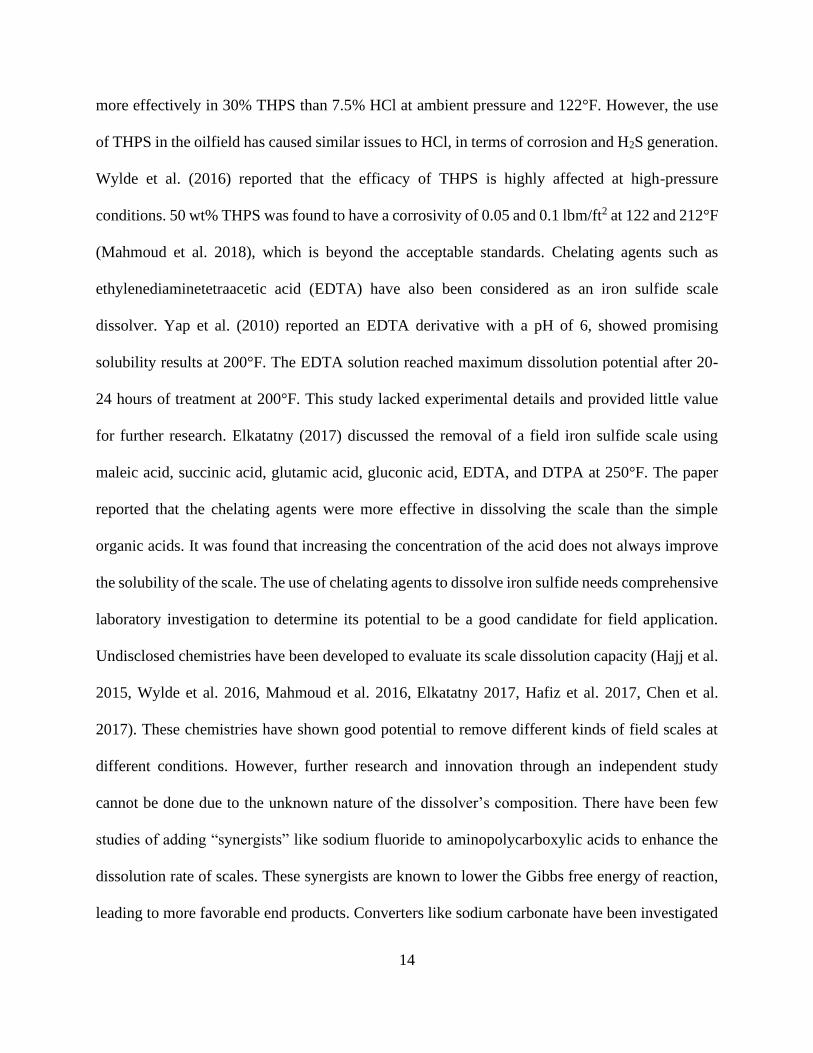
(Mahmoud et al. 2018), which is beyond the acceptable standards. Chelating agents such as
ethylenediaminetetraacetic acid (EDTA) have also been considered as an iron sulfide scale
dissolver. Yap et al. (2010) reported an EDTA derivative with a pH of 6, showed promising
solubility results at 200°F. The EDTA solution reached maximum dissolution potential after 20-
24 hours of treatment at 200°F. This study lacked experimental details and provided little value
for further research. Elkatatny (2017) discussed the removal of a field iron sulfide scale using
maleic acid, succinic acid, glutamic acid, gluconic acid, EDTA, and DTPA at 250°F. The paper
reported that the chelating agents were more effective in dissolving the scale than the simple
organic acids. It was found that increasing the concentration of the acid does not always improve
the solubility of the scale. The use of chelating agents to dissolve iron sulfide needs comprehensive
laboratory investigation to determine its potential to be a good candidate for field application.
Undisclosed chemistries have been developed to evaluate its scale dissolution capacity (Hajj et al.
2015, Wylde et al. 2016, Mahmoud et al. 2016, Elkatatny 2017, Hafiz et al. 2017, Chen et al.
2017). These chemistries have shown good potential to remove different kinds of field scales at
different conditions. However, further research and innovation through an independent study
cannot be done due to the unknown nature of the dissolver’s composition. There have been few
studies of adding “synergists” like sodium fluoride to aminopolycarboxylic acids to enhance the
dissolution rate of scales. These synergists are known to lower the Gibbs free energy of reaction,
leading to more favorable end products. Converters like sodium carbonate have been investigated

15
as potential catalysts. These converters help in forming more soluble products thus preventing any
precipitated product. Synergists have not been used to dissolve FeS scales. Any incremental
dissolution from using these synergists must be investigated.

16
CHAPTER II
ALTERNATIVE SCALE DISSOLVERS
The need for alternative dissolvers to remove the iron sulfide scale has increased over the
past two decades. The increase in drilling activity has also led to a higher number of sour gas wells
across the world. The inherent characteristic of sour gas wells is the formation of iron sulfide
scales. The health and safety aspects in the oil and gas industry have improved tremendously and
it is necessary to displace hydrochloric acid as the main method of scale removal as it is toxic.
Also, literature has reported other significant problems such as reprecipitation, corrosion, and low
thermal stability due to HCl treatment as mentioned earlier.
Some dissolvers such as aminopolycarboxylic acids (APCA) and THPS have been tested
in some wells and the results have looked promising. These organic acids have a different
mechanism of scale removal and are based on the chelation of the metal ions. Unlike HCl, this
reaction leads to a more stable complex, limiting the reversibility of the reaction and thus reducing
reprecipitation. Chelating agents are also more thermally stable than HCl (Sokhanvarian et al.
2016). Its chemistry is unique and must be fully understood to design successful treatments.
Chemistry of Aminopolycarboxylic Acids
Chelating agents with one or more nitrogen atoms and two or more carboxyl groups are
termed as aminopolycarboxylic acids. They work by forming coordination bonds with metal ions,
creating a ring-like complex (Fig. 2). The affinity of the chelating agent towards the metal ion is
determined by its stability constant. The stability of such complexes is commonly found to be high

17
and depends on the type of metal ion, pH, concentration, system pressure, and temperature
(Almubarak et al. 2017a). The stability of these complexes increases with the increase in the
number of electron donor groups and the number of chelate rings.
Fig. 2—General structure of a chelate-metal complex.
Chelating agents such as EDTA, DTPA, and hydroxyethylethylenediaminetriacetic acid
(HEDTA) have been used in food, biomedical, soil, wastewater, and oil industries. The
dissociation constants of these acids are orders of magnitude higher than HCl and thus is reaction
limited. The complex with the metal ion is formed by the ligand donating electrons to the metal
ion. The electron donors on these compounds are usually the nitrogen and the oxygen atoms. The
nitrogen atom has a lone pair of electrons whereas the oxygen atom in the carboxylic acid is
unsaturated. These aminopolycarboxylic acids can combine with metal atoms to form complexes
such as EDTA-Fe2+, EDTA-Fe3+, and DTPA-Mg2+. Some common examples of
aminopolycarboxylic acids are given in Fig. 3.

18
Fig. 3—Common examples of aminopolycarboxylic acids (Almubarak et al. 2017b).
EDTA is a hexadentate chelating agent capable of using six ligands to capture the metal
ion. Similarly, DTPA is an octadentate chelating agent having eight locations that can donate
electrons to the metal ion. HEDTA’s structure is similar to EDTA, except that one carboxyl group
is replaced with a hydroxyl group, making it more soluble at low pH conditions (Frenier 2001).
These chelating agents can be available in their acidic or salt form. The acidic form of the ligand
has multiple locations in its chemical structure where deprotonation can occur by increasing the
pH. Different species of a chelating agent are formed by deprotonation, and, for a chelant having
four ligands like EDTA, the deprotonation equations can be written as follows (Eqs. 6-9) (Spencer
1958):
H4Y H3Y- + H+ , …………………………………………………..….…………. (6)
H3Y- H2Y
2- + H+, …………………………………………….………..………… (7)

19
H2Y2- HY3- + H+ ,
……………….………………………………………………... (8)
HY3- Y4- + H+, …………………………………………..…………………….. (9)
where HmYm-n is the chelating agent with m hydrogen atoms from the carboxylic acid
groups. The pKa values for EDTA, HEDTA, and DTPA is given in Table 1. Fig. 4 presents the
distribution of the ionic species of EDTA and DTPA with pH at 77°F. For example, at pH 4.4,
EDTA mainly exists as H2Y2-. DTPA is in the form of H2Y
-3 at pH 6.4. Each species of the
chelating agent is unique in the way it forms a complex with the metal ions. Chelating agents are
known to adsorb onto solid surfaces and destabilize the crystal structure of the mineral (Chang and
Matijević 1983). The metal ion is removed from the mineral surface and forms a complex in the
interface between the solid and the bulk solution.
pKa EDTA DTPA HEDTA
a1 1.99 2.14 2.8
a2 2.67 2.38 5.6
a3 6.16 4.26 10.3
a4 10.37 8.60 -
a5 - 10.53 -
Table 1—pKa values of the chelating agents used in this study (Chang and Matijević 1983).

20
Fig. 4—Speciation diagrams for EDTA (after Harris 2007) and DTPA (after Moulin et al.
2003).
Therefore, the effectiveness of the chelating agent depends on (a) diffusion of the active
ligands from the bulk solution, (b) surface adsorption, (c) surface reaction, (d) complex desorption,
and (e) complex diffusion into the bulk solution. The rate-limiting step is dependent on the
chemistry of the chelating agent. The type of mineral, dissolver concentration, dissolver pH,
21
chemical impurity, and system temperature are some of the factors that govern this process. The
literature has limited information on using chelating agents to dissolve iron-sulfide scales and does
not investigate its dissolution mechanism.
Applications of Aminopolycarboxylic Acids
Almubarak et al. (2017b) and Kamal et al. (2018) provide literature reviews of chelating
agents that are used to enhance the productivity of oil/gas wells. They present a review of
laboratory and field case studies of its application in acidizing, iron control, scale dissolution, and
hydraulic fracturing. The studies also demonstrate the advantages and shortcomings of using this
class of organic acids for well stimulation. The study of the interactions of iron-sulfide scale with
chelating agents is complicated by the physical and chemical properties of the solid and the ligand
solution. Surface defects, surface area, surface charge, solution pH, solution concentration, and the
presence of other cations/anions in solution are some parameters that can alter the solid-liquid
reaction. The pressure and temperature are external factors that also play a key role in the
dissolution/precipitation process. Perry et al. (2005) noted the application of ligands promoted
dissolution for calcite minerals in petroleum wells, boilers, and heater tubes. They used atomic
force microscopy to investigate different surface locations of chelant attack. They noted that ligand
dominated dissolution occurred at linear defects whereas water dominated dissolution occurred at
point defects. The calcite dissolution occurred through rhombohedral pit formation at the 1014
crystal surface. Chelating agents have also been used to treat other types of scales such as barite
(Geri et al. 2017), calcium sulfate (Al-khaldi et al. 2011), and calcite (LePage et al. 2011). Geri et
al. (2017) investigated the optimum concentration, pH, and type of base required to obtain the

22
maximum dissolution of barite at 200°F. They implemented a simple calculation to estimate an
appropriate dissolver-scale ratio (cm3/g). 20 wt% K5-DTPA and K4-EDTA were determined to be
the optimum blends of the dissolver for barite dissolution. Al-khaldi et al. (2011) found that
gypsum, CaSO4, had a negative impact on the performance of mud acid treatments. EDTA was
employed as an alternate dissolver that removed more calcium sulfate scales than the mud acid
and prevented reprecipitation. A molecular modeling effort was done to use standard Density
Functional Theory (DFT) and report the dissolution behavior of pyrite in DTPA solutions (Buijs
et al. 2018). They concluded that the reaction between DTPA and pyrite was thermodynamically
controlled with low activation barriers. A separate DFT investigation was carried out to study the
interactions between HEDTA, EDTA, and DTPA and ferrous/ferric ions (Onawole et al. 2019).
They observed that DTPA formed a seven-coordination bond with ferrous ions instead of eight, as
suggested by its denticity.
Frenier (2001) investigated the role of HEDTA, EDTA, and DTPA to dissolve alkaline
earth deposits. This work introduced solvent formulations based on hydroxyaminocarboxylic acids
because of their unique ability to be soluble at pH < 4. Low-pH (< 5) chelating agents were found
to dissolve more calcite than their high-pH (> 7) counterparts at 72, 150, and 190°F. Torres et al.
(1989) and Chang and Matijević (1983) discussed the mechanisms of metal hydrous oxide
dissolution with chelating agents. In-depth investigations of the kinetics of ligand adsorption and
surface dissolution led these researchers to make suggestions about the mechanisms of the ligand-
solid interactions at different pH levels and temperatures. The authors observed similar dissolution
behavior (an early increase of dissolution followed by a plateau) with time at pH 3-11. However,
the quantities of hematite dissolved using excess EDTA, HEDTA, and DTPA were different. This
difference increased as the temperature increased. The acidic form of EDTA is known to chelate

23
calcium ions from calcium carbonate through H+ attack and free calcium-ion sequestering (Fredd
and Fogler 1996). Calcite dissolution kinetics was observed to be dependent on the H+
concentration. The authors defined two mechanisms to dissolve calcite: surface complexation and
solution complexation. The surface complexation is related to the chelation of the metal ions
through surface adsorption and destabilization of the bond between the calcium and carbonate
ions. Solution complexation is the free metal ion chelation from the solution. The metal ions are
released into the solution because of iron sulfide dissociation. The Fe2+ ions released into the
solution are chelated and the equilibrium is shifted to eventually dissolve the scale. The pH of the
dissolver was crucial in determining the dissolution mechanism. The increase in protonation of the
chelating agent led to a higher rate of dissolution.
Putnis et al. (1995) studied the effect of concentration, temperature, and scale surface area
by conducting kinetic dissolution tests with barium sulfate using DTPA. The reaction rate was
observed to be controlled by the desorption of the Ba-DTPA complex from the solid surface. These
researchers also found that the efficiency of the solvent in dissolving the barium sulfate is inversely
related to the solvent concentration. Atomic force microscopy of the barite particles after
dissolution with DTPA indicated trapezoidal pits (Wang et al. 1999). These authors also concluded
that one DTPA molecule could bind to two or three Ba2+ cations exposed on the scale surface.
Dunn and Yen (1999) investigated surface pitting phenomena on the barite scale when soaked in
DTPA.
Lakatos et al. (2002) and Paul and Fieler (1992) tested different ‘converters’ such as
potassium carbonate, potassium hydroxide, potassium fluorides, and oxalic acid as a synergist to
EDTA and DTPA in dissolving barite in a batch reactor at 25°C. Paul and Fieler (1992) postulated
that converters act by following a solid/solid conversion reaction. For example, if sodium

24
carbonate is added to the dissolver, the barium sulfate gets converted to barium carbonate which
is much easier to dissolve using the aminopolycarboxylic acids. They also showed that the Gibbs
free energy of conversion of barium sulfate to barium carbonate is almost 0, which is favorable.
70% of the barium sulfate was converted to barium carbonate in their experiments. Upon
calculating the Gibbs free energy of the barite conversion to other compounds using various
synergists, they found that fluoride and oxalate anions were the best candidates for the conversion
process. They reported that oxalate anions worked well with DTPA but not with EDTA. Paul and
Morris (1994) conducted a similar study at 100°C and claimed that barite was easily dissolved
using a combination of DTPA and formate anions with an ionization constant of less than 102 (Ka
< 10-2). Lakatos et al. (2002) tested this effect using EDTA and five different organic acids as
synergists for barite dissolution. They reported that all the synergists but oxalic acid does not
improve EDTA’s dissolution capacity. Oxalic acid does not yield a positive or negative effect on
the dissolution rate or capacity. These synergists were added after optimizing the EDTA’s
parameters for maximum barite solubility and was discussed as the reason for negative results with
the synergists. The authors suggested that the synergists could play an important role in enhancing
the barite solubility under non-optimized conditions of the primary dissolver. They also implied
that optimizing the primary dissolver is a more cost-effective approach than the addition of the
synergists/converters. Morris and Paul (1992) evaluated mercaptoacetate, hydroxyacetate,
salicylate, and aminoacetate as potential synergists to DTPA for barite scale removal at 100°C and
claimed that all the synergists were effective in improving the rate of dissolution. The dissolution
capacity of the DTPA solution increased by 10-35% when these synergists were added. Tate
(1995) claimed that EDTA with a hydroxycarboxylic acid such as sodium glucoheptonate as a
synergist helped in removing scales such as potassium fluorosilicate and alkaline earth metal

25
compounds. Putnis et al. (1995) tested the efficiency of the DTPA and oxalic acid combination in
the dissolution of barium sulfate scale deposits. They found that equimolar concentrations of
DTPA and oxalic acid provided the best composition in scale removal efficiency. There was a 10-
20% improvement in the scale dissolved at 23 and 100°C. No details about the dissolution
enhancement mechanism were discussed. Zaid and Wolf (2001) claimed a dissolver comprising
of EDTA, ammonium hydroxide, and aminotristmethylidine diphosphonic acid with sodium
bicarbonate as a synergist to dissolve barium sulfate and calcium sulfate at 100-170°F. Yu et al.
(2016) tested several synergists including amines, oxalates, formates, chlorides, carbonates,
glycols, amides, and a new unnamed compound “OT1” to NTA, EDTA, and DTPA for barite scale
dissolution. They reported that only OT1 with DTPA enhanced the rate of dissolution. They
suggested that OT1 acted as a good dispersant and distorted the barite lattice effectively, promoting
the chelation of the separated barium crystals by the DTPA. Mahmoud et al. (2018) conducted
dissolution studies of a field scale comprising 48% pyrrhotite, 39% pyrite, and 13% Fe2CO3 at 70-
150°C and 500 psi for 48 hours in an HPHT cell. They determined the optimum dissolver to be a
blend of 20% DTPA + 9% K2CO3 with a pH of 11. The blend dissolved almost 90% of the scales
and had a corrosion rate of 0.0004 lbm/ft2 at 120°C without generating any H2S. Reyes-Garcia and
Holan (2020) showed the potential of acetic acid-based derivatives as synergists for calcium sulfate
dissolution.
Chemistry of THPS
THPS has been known as a biocide in the oil and gas industry for several decades. The
structure of THPS is presented in Fig. 5.

26
Fig. 5—Chemical structure of THPS.
THPS is an organophosphorus compound and is four-coordinate. It is soluble in water and
is chemically stable for long periods of time in absence of oxygen. The presence of oxygen has
been shown to convert THPS into its oxide form. It was discovered that THPS was capable of
dissolving iron sulfide during a biocide treatment. The reaction imparted a pink color in the
production water stream. The pink color was formed only in presence of ammonium ions.
Laboratory investigations showed that THPS forms a complex with the ferrous ions in presence of
ammonium ions. Jeffery et al. (2000) studied a complex created by the reaction of THPS and iron
sulfide in a presence of ammonium ions. They explained the reduction of pH due to the liberation
of the counter ion of ammonium salts as acid as shown in Eq. 10.
2[P(CH2OH)4]2SO4 + 2NH4Cl + Fe2+
→ [Fe(H2O)2RP(CH2N(CH2PR2)CH2)2PR]SO4 · 4H2O + 2HCl ………. (10)
Fig. 6 demonstrates this complex.

27
Fig. 6—THPS-iron (II) complex (Talbot et al. 2002)
The application of THPS in the oilfield is well documented. Some case studies in dissolving
iron sulfide have been discussed previously. In most cases, THPS has been used as a biocide with
an added benefit of dissolving iron sulfide scales. Laboratory studies to dissolve iron sulfide using
THPS has been limited. Gilbert et al. (2002) reviewed the chemistry behind the dissolution of iron
sulfide using THPS over a wide range of conditions. Experimental results showed that the
dissolution of troilite and pyrite increases with an increase in THPS and NH4Cl concentration (or
phosphonate concentration). However, they did not optimize the treatment. Hussein and Mohamed
(2017) studied THPS for dissolving zinc sulfide and lead sulfide under different conditions. They
tested THPS with different additives of ammonium ions and found that ammonium chloride was
the best additive for scale dissolution. The release of acid as a byproduct of the THPS reaction
with iron sulfide has negative ramifications in terms of corrosion. Studies have reported the
corrosion rate to be as high as 0.06 lb/ft2 for a test period of four hours at 85°C (Wang et al. 2015).
The increase in the corrosion rates should be an indicator to optimize the treatment parameters to
dissolve scales as well as protect the tubulars from damage.

28
CHAPTER III
PROBLEM STATEMENT
There is a need to investigate potential alternative iron sulfide scale removal chemicals in
more detail. The testing of these chemicals at different field conditions is necessary to gauge its
real-time effectiveness. Currently, there are several alternative dissolvers including simple organic
acids such as maleic acid, formic acid, acetic acid, and more complex chemicals like chelating
agents and THPS. The application of such chemicals is an expensive process in the oil and gas
industry. Wells that are shut in for scale treatment can cost millions of dollars in production
revenue losses for the operator. Therefore, optimizing the treatment time is essential for these
specialty chemicals to be economically effective. The concentration and volume of the dissolvers
affect the scale dissolution in a non-linear way and are important to evaluate. Optimizing the
volume/weight ratio of the dissolver to the iron sulfide can lead to improved economics as well.
The influence of external factors such as pressure and temperature can change the scale solubility.
The addition of synergists such as potassium iodide and potassium citrate can catalyze the iron
sulfide dissolution and reduce the production downtime. Iron sulfide scales are inherently oil-wet
scales and laboratory evaluation using such scales can yield actual performance of the dissolvers.
Scales are protected from dissolution when it is coated with crude oil and some chemicals can
penetrate the oleic layer better than others. Also, it is rarely seen that the scales formed in well
tubulars or pipelines are of homogeneous composition. Multiple scales can exist at the same time
and each dissolver has a specific tendency to dissolve one of those scales. The selectivity of scale
removal must be determined by conducting a series of experiments at varying conditions.
Literature studies often evaluate the scale dissolution in absence of saline water. This can skew

29
results especially at a higher pressure and temperature conditions. The presence of other chemical
additives such as corrosion inhibitor, mutual solvent, and H2S scavenger can also affect the
dissolution behavior of the iron-sulfide scale. Corrosion tests must be conducted when selecting
an optimum dissolver. The damage done by the alternative dissolver must not exceed its positive
impact. The presence of competing ions in the dissolver solution may also limit its scale removal
capacity. For example, dissolvers prepared with seawater will have calcium ions and chelating
agents’ scale removal performance will be limited due to the reduced active concentration after
chelating the calcium ions in solution. Also, the compatibility of the dissolver with different kinds
of salts needs to be evaluated. This impact needs to be quantified and addressed when selecting
the optimum dissolver composition.

30
CHAPTER IV
OBJECTIVES
Alternative dissolvers are important to investigate as they can lead to displacing HCl as the
primary treatment option. The concentration, pH, and scale treatment time are important factors in
deciding the optimum treatment for iron sulfide scales in well tubulars, pipelines, or boilers.
Dissolver effectiveness in presence of multiple scales, additives such as corrosion inhibitor, H2S
scavenger, and mutual solvent, presence of crude oil wetted scale particles, and the role of brine
composition must be evaluated in order to fully understand the efficacy of these alternative
dissolvers. New synergists to the aminopolycarboxylic acids can enhance the dissolution rate and
reduce downtime of the wells. The objectives of this work include:
1. Screen high potential alternative dissolvers from maleic acid, formic acid, lactic acid,
acetic acid, citric acid, oxalic acid, disodium EDTA, and pentapotassium DTPA for iron
sulfide dissolution at 150°F and 1,000 psi.
2. Evaluate the effect of pH, concentration, treatment time, and type of dissolver (EDTA,
HEDTA, DTPA, and THPS) on the solubility of the iron-sulfide scale at 150 and 300°F.
3. Investigate the addition of synergists such as potassium chloride, potassium formate,
sodium fluoride, potassium citrate, and potassium iodide to the chelating agents for its iron
sulfide dissolution rate.
4. Assess the selectivity of the iron sulfide scale dissolver in presence of another scale for
example calcium carbonate.
5. Investigate the effect of crude oil wetted iron sulfide scale particles on its solubility.

31
6. Analyze the effect of mutual solvent, H2S scavenger, and corrosion inhibitor on the
dissolution effectiveness.
7. Evaluate the role of using produced water composition (to prepare the dissolver) on the
scale solubility.

32
CHAPTER V
MATERIALS
The investigation of the alternative dissolvers for iron sulfide dissolution required the use
of laboratory material and experimental apparatus. This chapter details the chemicals, solid scale
particles, and corrosion coupons used in this study.
Chemical dissolvers and additives
Table 2 lists the dissolvers used in this study, their pH, and their concentration ranges.
Formic acid and lactic acid with activities of 90% were obtained and diluted with deionized water
to required concentrations. Maleic acid, citric acid, and oxalic acid as reagent grade chemicals.
These organic compounds were prepared at concentrations of 1-10 wt% for the screening tests.
The fully protonated forms of the aminopolycarboxylic acids being investigated were purchased
as reagent grade chemicals and used. The pH of the aminopolycarboxylic acids was increased by
adding sodium hydroxide or potassium hydroxide. Different species of the aminopolycarboxylic
acids were formed by adding the equivalent concentration of the base. THPS (75%) and
ammonium chloride (>99.5%) were purchased from Compass Chemical and Sigma Aldrich,
respectively. 37 wt% HCl was purchased locally and diluted to reach the required concentration.
Different concentrations of the chemicals were prepared using deionized water with a resistivity
of 18.2 MΩ-cm. Salts such as NaCl and CaCl2 were purchased as ACS grade and added to the
dissolver solutions as required.

33
Wherever stated, a corrosion inhibitor containing quaternary ammonium and sulfur
compounds was used as an additive for the organic acids and another corrosion inhibitor with a
quaternary ammonium compound, organic amine resin salt, and formic acid was used for the HCl.
Ethyleneglycolmonobutylether (EGMBE) was used as a mutual solvent. A hydrogen sulfide
scavenger was added to remove H2S from the system, wherever stated.
Reagent grade potassium chloride, potassium iodide, sodium fluoride, citric acid, and
formic acid (90% activity) were used as synergists to the aminopolycarboxylic acids. Citric acid
and formic acid were mixed with equivalents of potassium hydroxide to obtain their salt form.
Dissolver Concentration (mol/L) Initial pH
Formic acid 0.2 – 2 1.4 – 2.1
Maleic acid 0.1 – 1 0.8 – 1.4
Citric acid 0.05 – 0.5 1.6 – 2.1
Lactic acid 0.1 – 1 1.7 – 2.2
Oxalic acid 0.1 – 1 0.6 – 1.3
Na2-EDTA 0.05 – 0.2 4.4
Na3-EDTA 0.1 – 0.4 5.1 – 8.3
Na4-EDTA 0.1 – 0.4 10.1 – 10.7
K-HEDTA 0.05 – 0.3 3.7 - 4
K2-HEDTA 0.1 – 0.4 6.2 – 6.7
K3-HEDTA 0.1 – 0.3 11.2 – 11.5
K2-DTPA 0.1 – 0.3 3.4 – 3.6
K3-DTPA 0.1 – 0.3 5.9 – 6.6
K5-DTPA 0.1 – 0.3 11.5 – 11.7
THPS 0.4 – 1.9 2.3 – 4
HCl 4.4 0
Table 2—List of dissolvers used in this work.

34
Mineral Scale
For all of the experiments, iron sulfide sticks acquired from Sigma Aldrich (CAS No. 1317-
37-9) were pulverized using an agate mortar and pestle. The pulverized iron sulfide particles were
sieved as required. The particle size of the scale was 75-150 µm. The constant size of iron sulfide
particles was used to keep the surface area of the scale consistent for all experiments. X-ray
Diffraction (XRD) analysis of the scale indicated the presence of iron sulfide minerals such as
troilite, and pyrrhotite along with elemental iron. Three batches of iron sulfide particles were used
in this study. The composition of the iron sulfide powder varied between each batch. Figs. 7, 8,
and 9 present the XRD pattern of the minerals in the iron sulfide scale samples for batch 1, 2, and
3, respectively. Batch 1 contained pyrrhotite (67%), mackinawite (23%), troilite (5%), and
remaining wuestite (5%). Batch 1 was used for screening the dissolvers. X-ray Diffraction (XRD)
analysis of the Batch 2 particles indicated troilite (75%), pyrrhotite (6%), elemental iron (14%),
and remaining maghemite (5%). This batch was used to evaluate the scale solubility using
aminopolycarboxylic acids. Batch 3 indicated the presence of troilite (87%) and pyrrhotite (6%)
along with elemental iron (7%). Any form of comparison between the dissolvers was made using
the same batch of iron sulfide thus ensuring consistency.
Marble disks with a purity of 99% calcium carbonate were ground using the agate mortar
and pestle and sieved to 75-150 µm.

35
Fig. 7—XRD pattern of the iron sulfide scale sample (Batch 1).
Fig. 8—XRD pattern of the iron sulfide scale sample (Batch 2).
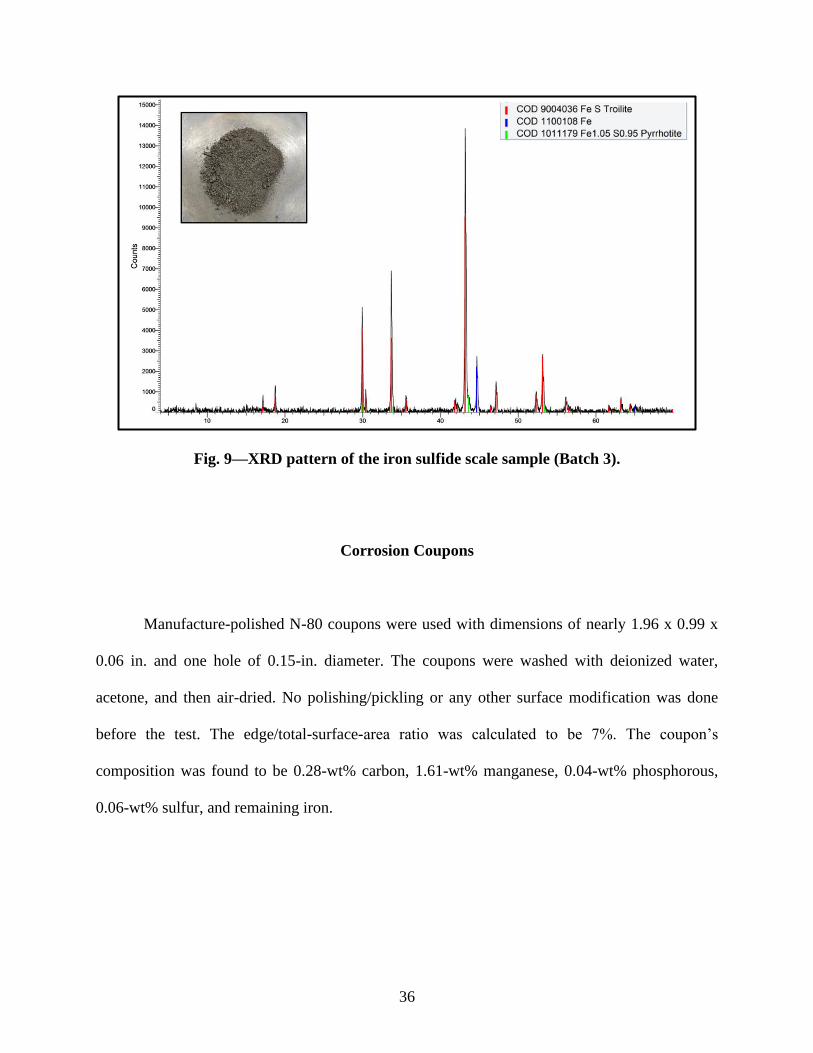
36
Fig. 9—XRD pattern of the iron sulfide scale sample (Batch 3).
Corrosion Coupons
Manufacture-polished N-80 coupons were used with dimensions of nearly 1.96 x 0.99 x
0.06 in. and one hole of 0.15-in. diameter. The coupons were washed with deionized water,
acetone, and then air-dried. No polishing/pickling or any other surface modification was done
before the test. The edge/total-surface-area ratio was calculated to be 7%. The coupon’s
composition was found to be 0.28-wt% carbon, 1.61-wt% manganese, 0.04-wt% phosphorous,
0.06-wt% sulfur, and remaining iron.

37
CHAPTER VI
EXPERIMENTAL METHODS
The dissolution of iron sulfide scales was studied in a laboratory atmosphere with an
emphasis on the analysis of the results. Commonly, scale solubility is determined using bottle tests.
This experimental method is not adequate to describe the reaction behavior at high pressure-high
temperature and hypoxic conditions. This chapter describes the experimental methods used to
achieve the objectives of this work.
Bottle Solubility Test
10 cm3 of the prepared dissolver was added to a Pyrex culture tube containing 0.1 g of the
iron-sulfide scale (Fig. 10). The dissolver scale ratio was set at 100/1, 50/1, or 20/1 cm3/g. The
tests were conducted in a static mode without stirring. The Pyrex tube had Teflon-lined screw caps
that provided an excellent seal and prevented any fluid loss at 150°F. The culture tube was kept in
a conventional oven and 0.05 cm3 of the supernatant fluid was withdrawn for sampling at 1, 4, 8,
20, 30, 48, and 72 hours. The fluid was diluted to 10 cm3 and was analyzed for iron concentration
using ICP-OES. The remaining solids were filtered with a 1-5 µm filter paper. The solids were
rinsed thoroughly with isopropanol and dried at 212°F for 12 hours. SEM analysis was done on
the dried solids. The pH of the dissolver was measured before and after the test. To test the
dissolution of crude oil-wetted iron sulfide samples, a pre-determined amount of iron sulfide was
initially placed in a filter paper and crude oil was poured into the filter paper. After pouring 50 cm3
of crude oil, the iron sulfide particles were removed from the filter paper and mixed with the

38
dissolver. A mixed scale system comprising of equal amounts of iron sulfide and calcium
carbonate was also treated using the alternative dissolvers. Two parameters were calculated based
on the measurements made: (1) dissolving capacity (C/Co) and (2) dissolver consumption. The
dissolution capacity is defined as the ratio of the concentration of iron (mg/L) in the spent dissolver
to the concentration of iron (mg/L) at 100% dissolution using 20 wt% HCl. Each experiment was
repeated 3 times and an average was taken. The error margin in the results was below 5%. It is
given by Eq. 11:
Dissolution Capacity (CCo
) = Concentration of Fe in the spent dissolver (mg/L)
Concentration of Fe in the initial iron sulfide (mg/L) , ..... (11)
The dissolver consumption (also referred as degree of saturation) is a measure of the
dissolver concentration needed (in mol/L) to achieve the ultimate dissolution of the iron-sulfide
scale at time t. It is calculated by the ratio of maximum concentration of iron chelated to the
concentration of chelating agent. Eq. 12 presents the dissolver consumption as:
Dissolver Consumption (at time t) = Molarity of Fe in the dissolver (mol/L)Molarity of the dissolver (mol/L)
, ……...... (12)
Effective scale dissolution from a technical and economic standpoint requires high
dissolution capacity and high dissolver consumption. Eq. 13 indicates the dissolver effectiveness
which considers both of the above-mentioned parameters.
Dissolver Effectiveness= Dissolution Capacity * Dissolver Consumption , ………........ (13)

39
Fig. 10—Pyrex bottles used for solubility tests. The top and bottom photo is at time t = 0 and
t = 72 hours, respectively.
Autoclave Solubility Test
To replicate the hypoxic and pressurized conditions in the field, similar experiments to the
bottle tests were performed using an autoclave (Fig. 11). The components of the autoclave are as
follows:
1. Series 4523 1 liter Hastelloy B benchtop reactor
2. C-clamps
3. A rotor that can be used to provide agitation
4. Thermocouple
5. Heating jacket

40
6. Pressure gauge
7. Primary scrubber
8. Secondary scrubber
9. Nitrogen cylinder
10. Sampling port
Scrubber stages were installed with 1 mol/L NaOH solution to neutralize any H2S from the
reaction after the conclusion of the experiment. The test was performed using 250 cm3 of the
dissolver and the iron sulfide scale powder, its weight being based on the dissolver-scale ratio. The
autoclave was assembled immediately and purged with nitrogen to create a hypoxic atmosphere.
The pressure and temperature were set at 1,000 psi and 300°F, respectively. The initial pressure
was set at a lower value such that the final pressure would reach 1,000 psi after heating the cell to
the desired temperature. Samples were collected at various time intervals through the sampling
port. The solubility of the scale was determined based on the dissolver sample’s ICP-OES analysis.
The concentration of generated H2S was measured using Draeger tubes. The autoclave was acid
washed two times and air-dried after the experiment to remove residual iron sulfide scale particles.
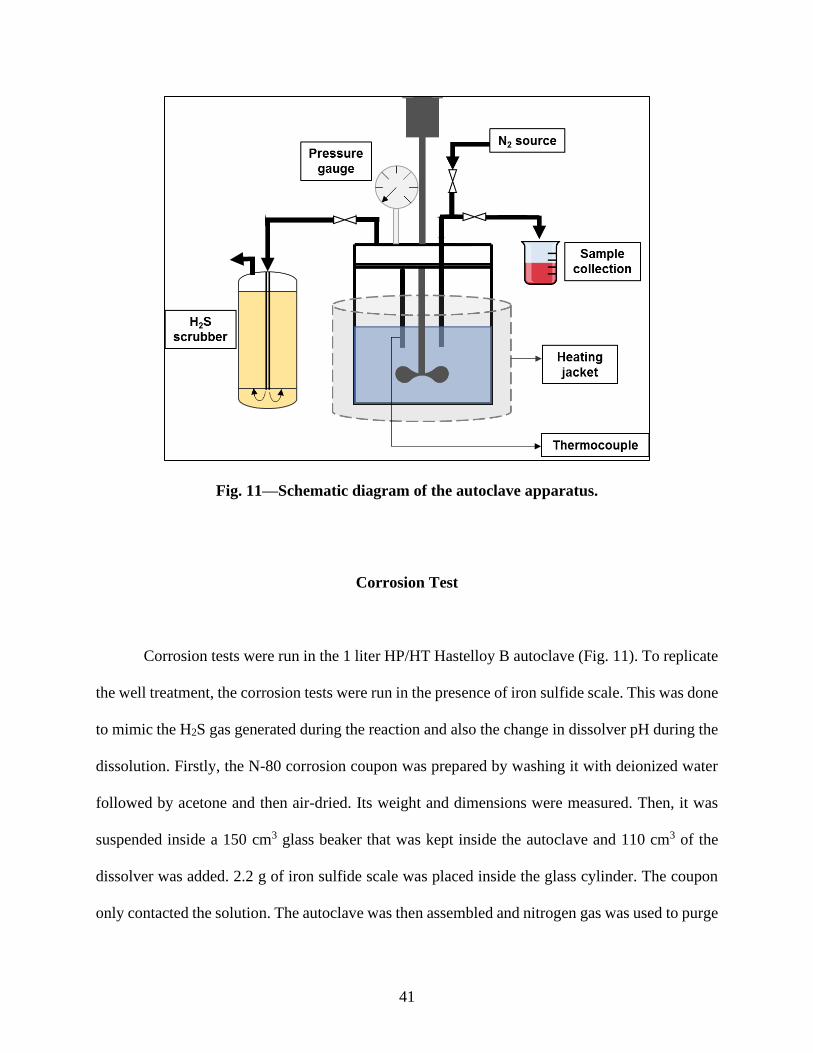
41
Fig. 11—Schematic diagram of the autoclave apparatus.
Corrosion Test
Corrosion tests were run in the 1 liter HP/HT Hastelloy B autoclave (Fig. 11). To replicate
the well treatment, the corrosion tests were run in the presence of iron sulfide scale. This was done
to mimic the H2S gas generated during the reaction and also the change in dissolver pH during the
dissolution. Firstly, the N-80 corrosion coupon was prepared by washing it with deionized water
followed by acetone and then air-dried. Its weight and dimensions were measured. Then, it was
suspended inside a 150 cm3 glass beaker that was kept inside the autoclave and 110 cm3 of the
dissolver was added. 2.2 g of iron sulfide scale was placed inside the glass cylinder. The coupon
only contacted the solution. The autoclave was then assembled and nitrogen gas was used to purge
42
oxygen and maintain a pressure of 1,000 psi inside the cell. The initial pressure was set at a lower
value such that the final pressure would reach 1,000 ± 30 psi after heating the cell to the desired
temperature. It took half-hour to heat the cell to the desired temperature and half hour to cool down
the system after the test. The test was conducted for 8 hours excluding the heating/cooling time.
Upon completion of the test, the corrosion coupon was washed with deionized water, acetone, and
weighed. The difference in the weight of the coupon from the initial weight determined the
corrosion rate. The pH of the solution before and after the test was measured. The H2S
concentration inside the autoclave was measured using Draeger tubes.

43
CHAPTER VII
RESULTS AND DISCUSSION1,2
The current work investigates the iron sulfide (FeS) scale dissolution using alternative
dissolvers such as simple organic acids, aminopolycarboxylic acids, and THPS. Several
parameters such as dissolver concentration, pH, treatment time, dissolver-scale ratio, pressure, and
temperature were evaluated as part of this research. Furthermore, the iron sulfide scale solubility
was evaluated in presence of corrosion inhibitors, H2S scavengers, mutual solvent, calcium
carbonate scale, crude oil, and competing salts. The scale solubility was tested when potential
synergists such as potassium iodide and potassium citrate were added along with the
aminopolycarboxylic acids. This study to optimize these parameters included corrosion tests to
weigh the positives and negatives of the alternative treatment option.
The scale dissolution is affected by many different parameters and this work approached
the problem by investigating the scale solubility considering one parameter at a time while keeping
others constant. The research was conducted using the solubility and corrosion tests along with the
sample analysis using the ICP-OES and SEM. The solubility tests were performed 3 times and the
average results were reported with an error of less than 5%.
____________________________________ 1 Reprinted with permission from “New Insights into the Dissolution of Iron Sulfide Using Chelating
Agents” by Ramanathan, R., Nasr-El-Din, H. A., and Zakaria, A. S. SPE J 25 (06): 3145-3159, Copyright
2020 by Society of Petroleum Engineers.
2 Reprinted with permission from “A Comparative Experimental Study of Alternative Iron Sulfide Scale
Dissolvers in the Presence of Oilfield Conditions and Evaluation of New Synergists to
Aminopolycarboxylic Acids” by Ramanathan, R. and Nasr-El-Din, H. A. SPE J: 1-23, Copyright 2021 by
Society of Petroleum Engineers.

44
The current chapter conflates the results of numerous experiments and presents an in-depth
discussion to articulate the chemical and physical phenomena occurring during the scale
dissolution process at different conditions.
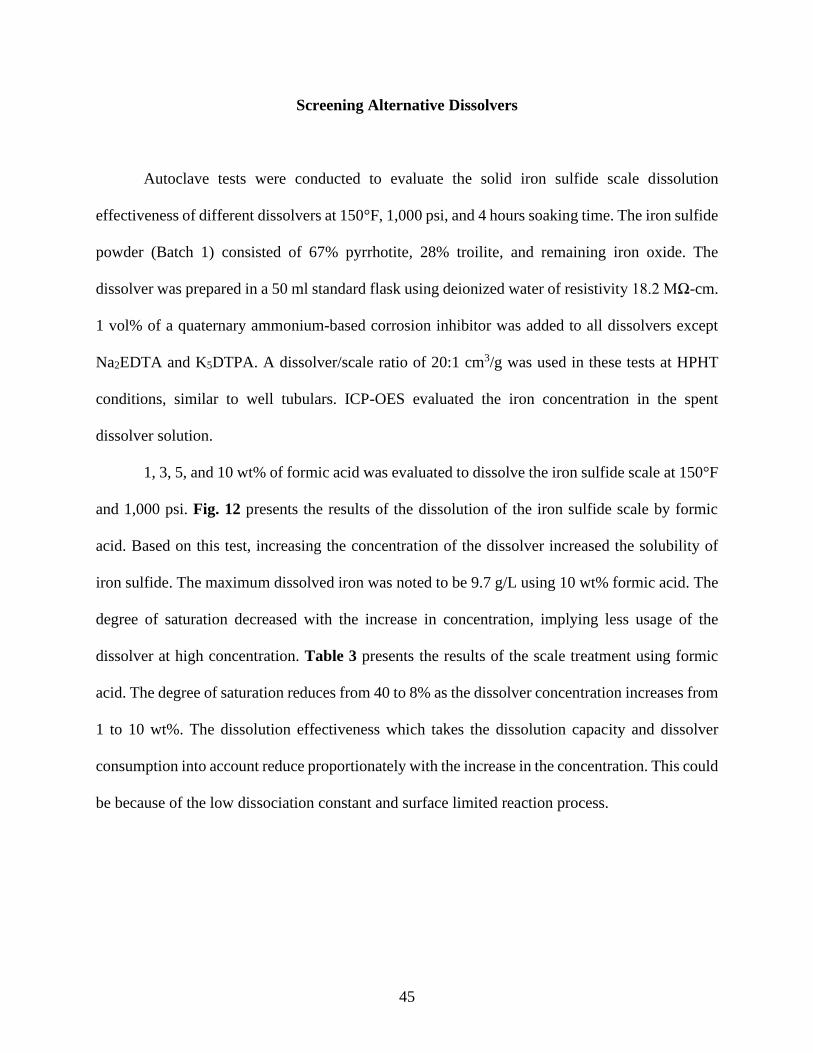
45
Screening Alternative Dissolvers
Autoclave tests were conducted to evaluate the solid iron sulfide scale dissolution
effectiveness of different dissolvers at 150°F, 1,000 psi, and 4 hours soaking time. The iron sulfide
powder (Batch 1) consisted of 67% pyrrhotite, 28% troilite, and remaining iron oxide. The
dissolver was prepared in a 50 ml standard flask using deionized water of resistivity 18.2 MΩ-cm.
1 vol% of a quaternary ammonium-based corrosion inhibitor was added to all dissolvers except
Na2EDTA and K5DTPA. A dissolver/scale ratio of 20:1 cm3/g was used in these tests at HPHT
conditions, similar to well tubulars. ICP-OES evaluated the iron concentration in the spent
dissolver solution.
1, 3, 5, and 10 wt% of formic acid was evaluated to dissolve the iron sulfide scale at 150°F
and 1,000 psi. Fig. 12 presents the results of the dissolution of the iron sulfide scale by formic
acid. Based on this test, increasing the concentration of the dissolver increased the solubility of
iron sulfide. The maximum dissolved iron was noted to be 9.7 g/L using 10 wt% formic acid. The
degree of saturation decreased with the increase in concentration, implying less usage of the
dissolver at high concentration. Table 3 presents the results of the scale treatment using formic
acid. The degree of saturation reduces from 40 to 8% as the dissolver concentration increases from
1 to 10 wt%. The dissolution effectiveness which takes the dissolution capacity and dissolver
consumption into account reduce proportionately with the increase in the concentration. This could
be because of the low dissociation constant and surface limited reaction process.

46
Dissolver
Concentration
(wt%)
Dissolution
Capacity (%)
Degree of
Saturation (%)
Dissolution
Effectiveness (%)
Formic
acid
1 16 40 6.3
3 19 17 3.1
5 19 10 2.0
10 31 8 2.4
Table 3—Results of the iron sulfide scale dissolution test using formic acid.
Fig. 12—Effect of formic acid concentration on the dissolution of the iron sulfide scale.

47
Similar to formic acid, improved scale dissolution resulted from increasing the maleic acid’s
concentration. Maximum solubility of 10.6 g/L iron was obtained at 10 wt% maleic acid. It had a
better degree of saturation than formic acid, implying more effectiveness at higher concentrations.
Fig. 13 demonstrates the results of the dissolution studies of the iron sulfide scale with maleic acid.
Table 4 presents the dissolution capacity, degree of saturation, and dissolution effectiveness as a
function of the dissolver concentration. The dissolver effectiveness is maximum at 5 wt% maleic
acid. This shows that using maleic acid at 5 wt% is more economically effective than 10 wt%.
Fig. 13— Effect of maleic acid concentration on the dissolution of the iron sulfide scale.

48
Dissolver
Concentration
(wt%)
Dissolution
Capacity (%)
Degree of
Saturation (%)
Dissolution
Effectiveness (%)
Maleic
acid
1 6 42 2.7
3 16 35 5.6
5 27 36 9.6
10 35 23 8.0
Table 4—Results of the iron sulfide scale dissolution test using maleic acid.
Fig. 14 shows the effect of the concentration of citric acid on the dissolution of the iron
sulfide scale. Even though the dissolution is lower than maleic acid or formic acid, its degree of
saturation is higher. This shows that it is more effective at high concentrations. The maximum
solubility of iron measured by the ICP-OES was 7.6 g/L. Table 5 shows the results of the
dissolution test at different concentrations of citric acid. The results indicate that the dissolution
effectiveness is maximum at 5 wt% citric acid. Even though the dissolution capacity increases with
dissolver concentration, it is important to take into account the degree of saturation which
ultimately decides the economic effectiveness of scale treatment.

49
Fig. 14—Effect of citric acid concentration on the dissolution of the iron sulfide scale.
Dissolver
Concentration
(wt%)
Dissolution
Capacity (%)
Degree of
Saturation (%)
Dissolution
Effectiveness (%)
Citric acid
1 9 94 8.1
3 13 47 6.0
5 19 41 7.9
10 24 26 6.3
Table 5—Results of the iron sulfide scale dissolution test using citric acid.

50
Lactic acid was the worst performer in terms of the dissolution capacity as well as the
degree of saturation. Fig. 15 shows that as the lactic acid’s concentration increases, the solubility
of iron flattens out. The maximum dissolved iron concentration was measured to be 4.3 g/L at 10
wt%. Table 6 presents the dissolution capacity, degree of saturation, and dissolver effectiveness
as a function of lactic acid concentration. The dissolver effectiveness is low and decreases with
the increase in the dissolver’s concentration. With this data, it can be implied that lactic acid is not
a good dissolver for iron sulfide scales.
Fig. 15—Effect of lactic acid concentration on the dissolution of the iron sulfide scale.

51
Dissolver
Concentration
(wt%)
Dissolution
Capacity (%)
Degree of
Saturation (%)
Dissolution
Effectiveness (%)
Lactic
acid
1 8 40 3.2
3 11 18 1.9
5 12 12 1.5
10 14 7 1.0
Table 6—Results of the iron sulfide scale dissolution test using lactic acid.
The reaction of oxalic acid and iron sulfide yields iron (II) oxalate. This is highly insoluble
in water (0.08 g/L) and instantaneously precipitates. As shown in Fig. 16, the iron in the spent
solution is extremely low. A visual analysis of the scale powder after reaction shows decolorization
due to the conversion of iron sulfide to iron (II) oxalate. Table 7 presents the results of the
dissolution test using oxalic acid at 150°F and 1,000 psi. Oxalic acid is not a good dissolver of iron
sulfide.

52
Fig. 16—Effect of oxalic acid concentration on the dissolution of the iron sulfide scale.
Dissolver
Concentration
(wt%)
Dissolution
Capacity (%)
Degree of
Saturation (%)
Dissolution
Effectiveness (%)
Oxalic
acid
1 1 5 0
3 1 2 0
5 2 2 0
10 1 1 0
Table 7—Results of the iron sulfide scale dissolution test using oxalic acid.
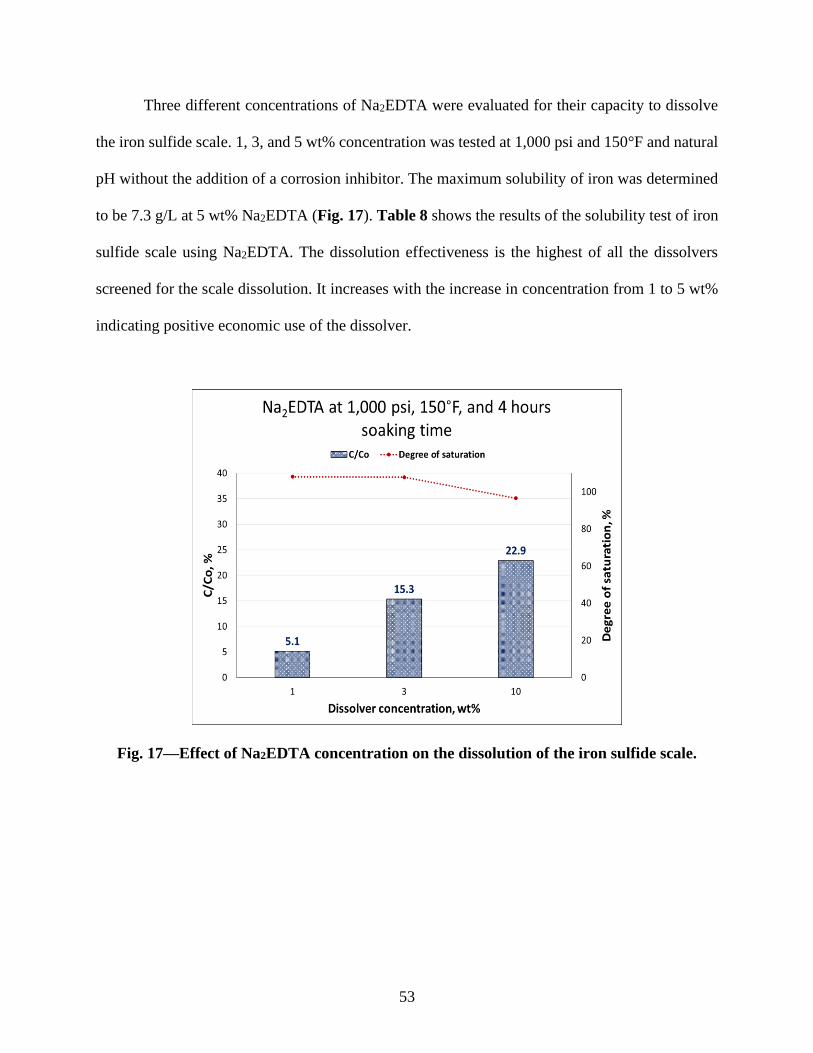
53
Three different concentrations of Na2EDTA were evaluated for their capacity to dissolve
the iron sulfide scale. 1, 3, and 5 wt% concentration was tested at 1,000 psi and 150°F and natural
pH without the addition of a corrosion inhibitor. The maximum solubility of iron was determined
to be 7.3 g/L at 5 wt% Na2EDTA (Fig. 17). Table 8 shows the results of the solubility test of iron
sulfide scale using Na2EDTA. The dissolution effectiveness is the highest of all the dissolvers
screened for the scale dissolution. It increases with the increase in concentration from 1 to 5 wt%
indicating positive economic use of the dissolver.
Fig. 17—Effect of Na2EDTA concentration on the dissolution of the iron sulfide scale.
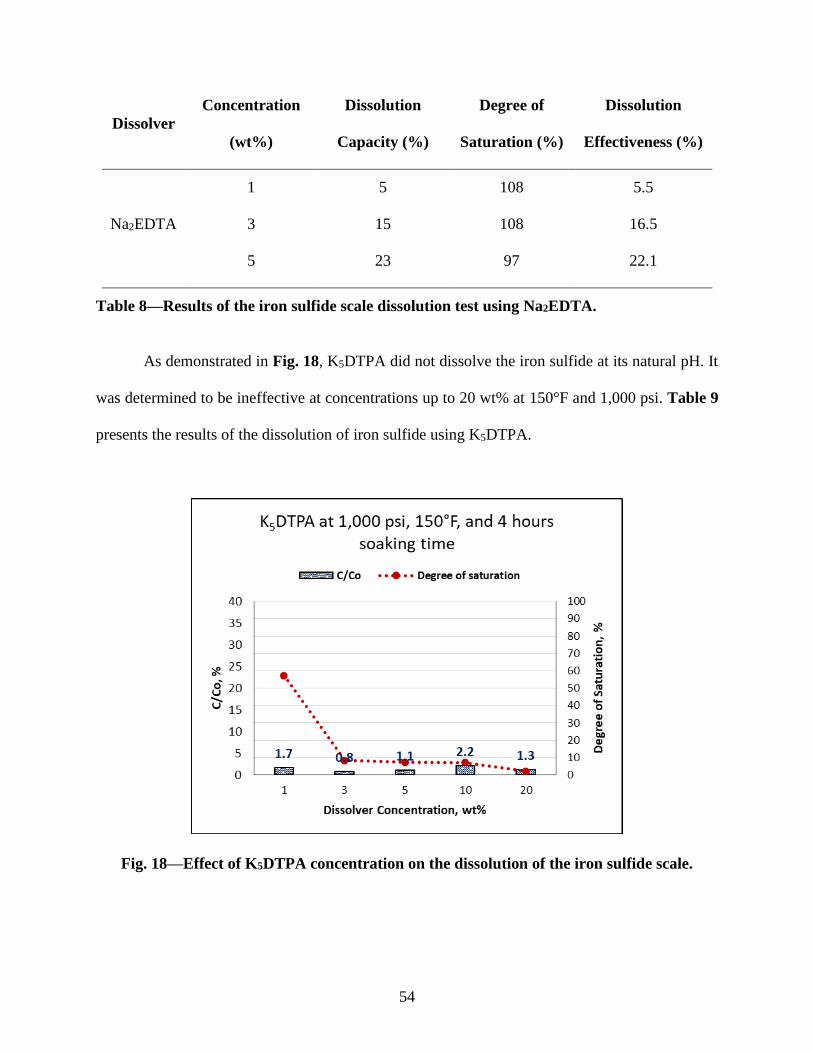
54
Dissolver
Concentration
(wt%)
Dissolution
Capacity (%)
Degree of
Saturation (%)
Dissolution
Effectiveness (%)
Na2EDTA
1 5 108 5.5
3 15 108 16.5
5 23 97 22.1
Table 8—Results of the iron sulfide scale dissolution test using Na2EDTA.
As demonstrated in Fig. 18, K5DTPA did not dissolve the iron sulfide at its natural pH. It
was determined to be ineffective at concentrations up to 20 wt% at 150°F and 1,000 psi. Table 9
presents the results of the dissolution of iron sulfide using K5DTPA.
Fig. 18—Effect of K5DTPA concentration on the dissolution of the iron sulfide scale.

55
Dissolver
Concentration
(wt%)
Dissolution
Capacity (%)
Degree of
Saturation (%)
Dissolution
Effectiveness (%)
K5DTPA
1 2 57 1
3 1 8 0.1
5 1 7 0.1
10 2 7 0
20 1 2 0
Table 9—Results of the iron sulfide scale dissolution test using K5DTPA.
The results of the autoclave tests are summarized in Table 10. C/Co is a ratio that describes
the amount of iron in the spent dissolver solution vs the initial amount present. The degree of
saturation (or dissolver consumption) shows the activity of the dissolver and its effective usage at
different concentrations. The table also shows the H2S concentration inside the 1-liter autoclave at
the end of 4 hours.
The concentration of the dissolvers must be translated into a mol/L basis to provide an apt
comparison of the dissolvers for screening purposes. Fig. 19 shows the dissolution capacity of 0.1
mol/L solutions of formic acid, maleic acid, lactic acid, citric acid, oxalic acid, and disodium
EDTA at 150°F, 1,000 psi, and 4 hours soaking time.
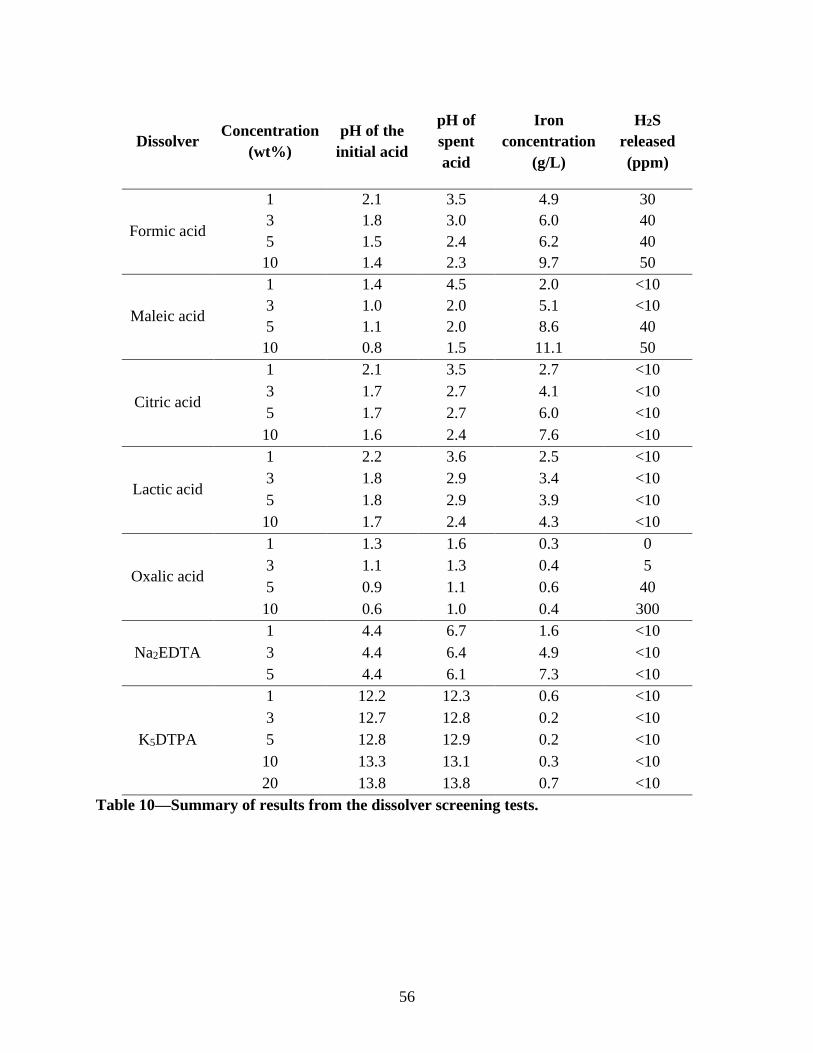
56
Dissolver Concentration
(wt%)
pH of the
initial acid
pH of
spent
acid
Iron
concentration
(g/L)
H2S
released
(ppm)
Formic acid
1 2.1 3.5 4.9 30
3 1.8 3.0 6.0 40
5 1.5 2.4 6.2 40
10 1.4 2.3 9.7 50
Maleic acid
1 1.4 4.5 2.0 <10
3 1.0 2.0 5.1 <10
5 1.1 2.0 8.6 40
10 0.8 1.5 11.1 50
Citric acid
1 2.1 3.5 2.7 <10
3 1.7 2.7 4.1 <10
5 1.7 2.7 6.0 <10
10 1.6 2.4 7.6 <10
Lactic acid
1 2.2 3.6 2.5 <10
3 1.8 2.9 3.4 <10
5 1.8 2.9 3.9 <10
10 1.7 2.4 4.3 <10
Oxalic acid
1 1.3 1.6 0.3 0
3 1.1 1.3 0.4 5
5 0.9 1.1 0.6 40
10 0.6 1.0 0.4 300
Na2EDTA
1 4.4 6.7 1.6 <10
3 4.4 6.4 4.9 <10
5 4.4 6.1 7.3 <10
K5DTPA
1 12.2 12.3 0.6 <10
3 12.7 12.8 0.2 <10
5 12.8 12.9 0.2 <10
10 13.3 13.1 0.3 <10
20 13.8 13.8 0.7 <10
Table 10—Summary of results from the dissolver screening tests.

57
Fig. 19—Summary of the screening study using equimolar concentration alternative
dissolvers for FeS scale removal.
As shown in Fig. 19, the best dissolver for iron sulfide scale dissolution is the complex
aminopolycarboxylic acid Na2EDTA. Simple organic acids have high dissociation constants
limiting its surface reaction with the scale. Na2EDTA also has an added benefit of providing more
stability to the reaction products because of complex formation. Based on this investigation, the
aminopolycarboxylic acids were studied in more detail in the subsequent sub-sections.

58
Aminopolycarboxylic Acid: Effect of pH
For the following subsections, the batch 2 of iron sulfide particles were used with a
composition of troilite (75%), pyrrhotite (6%), elemental iron (14%), and remaining maghemite
(5%). The speciation of the aminopolycarboxylic acid varies with pH. As the pH increases, the
ligands are deprotonated. The species of DTPA, HEDTA, and EDTA at acidic conditions of pH <
5 consisted of K2-DTPA, K-HEDTA, and Na2-EDTA, respectively. Table 2 shows the type of
species of the chelating agents used at various pH conditions. Fig. 20 shows a bar chart that
compares the dissolved iron from iron sulfide as a function of pH after 72 hours of dissolution at
150°F.
Fig. 20—Effect of pH on the iron-sulfide dissolution capacity after 72 hours of soaking.

59
The iron sulfide solubility is the highest at pH < 5 for EDTA, HEDTA, and DTPA. The
low pH values ranged from 3.5 to 4.4, moderate pH from 6.3 to 8.2, and high pH values greater
than 10. The results in Fig. 20 show that the dissolution of iron sulfide is strongly dependent on
the pH of the chelating agent. At 0.2 mol/L and pH < 5, DTPA, HEDTA, and EDTA show iron
concentrations in the spent solutions of 6.3, 5.2, and 4.4 g/L, respectively. The solubility of DTPA
dropped to 2.3 g/L at moderate pH and 0.17 g/L at high pH. HEDTA’s solubility dropped to 1.5
g/L and 0.12 g/L at high pH. Finally, EDTA’s solubility dropped to 1.5 g/l at moderate pH and
0.16 g/L at high pH. The higher concentration of H+ ions in the acidic ligand dissolvers is crucial
in promoting dissolution. The H+ ions can react with the sulfur atoms in the iron sulfide and
produce hydrogen sulfide. The reactions associated with the acidic dissolution of iron sulfide using
Na2-EDTA, for example, are as follows:
H2L2-+FeS FeSH22++L4-, …...…………………………………………….. (14)
FeSH22++L4-→FeL2-+H2S, …………………………….…………………… (15)
The Fe2+ in Eq. 14 is sequestered by the ligand. The stability constant of Eq. 15 is high
and prevents the reprecipitation of the iron sulfide. The FeSH22+ is unstable and the bond between
Fe and S breaks, resulting in Fe2+ and H2S. The Fe2+ gets chelated by the chelating agent in the
solution. The H2S will be in the solution phase at high-pressure conditions, increasing the corrosion
of tubulars. The dissolution continues in the forward direction until the concentration of H+ ions is
reduced to 0. Table 11 demonstrates the final pH of 0.2 mol/L Na2-EDTA, K-HEDTA, and K2-
DTPA solutions after reaction with the iron sulfide for 72 hours at 150°F. The final pH values of
Na2-EDTA, K-HEDTA, and K2-DTPA are 6.1, 6.0, and 4.0, respectively. The low final pH value
of 4.0 using K2-DTPA is due to the completed reaction with the iron sulfide scale and the presence

60
of excess H+ ions in solution. As Chang and Matijević (1983) noted in the case of iron oxides,
chelation can occur by surface complexation as well. The chelating agent adsorbs on the surface
of the scale at the iron lattice site and creates a charge imbalance leading to the removal of Fe2+
ions from the surface of the iron sulfide.
Dissolver Initial pH Final pH
0.2 mol/L Na2-EDTA 4.4 6.1
0.2 mol/L K-HEDTA 3.7 6.0
0.2 mol/L K2-DTPA 3.6 4.1
Table 11—Initial and final pH values of Na2-EDTA, K-HEDTA, and K2-DTPA after reaction
with iron sulfide for 72 hours at 150°F.
At moderate and high pH conditions, the H+ concentration is low and does not play a major
role in the dissolution of the scale. The adsorption of the ligands on the surface of the iron sulfide
and the surface reaction to remove the Fe2+ ion may be the rate-limiting step at pH > 5. The
negative charge contributed by the chelating agent must be higher than the sulfur atom to break
the bond. Increasing the temperature increases the system energy thus helping to break the Fe-S
bond or overcome the lattice energy. However, at 150°F, the rate of dissolution is very slow and
does not complete even after 72 hours. The dissolution of the scale occurs primarily as a result of
solution complexation, where the dissociation of the iron sulfide leads to Fe2+ release into the
solution where it is subsequently chelated. Table 12 presents the results of the effect of pH of
aminopolycarboxylic acids on scale dissolution tests at all the sampling times.

61
Dissolution Capacity
Dissolver pH 1
hour
4
hours
8
hours
20
hours
30
hours
48
hours
72
hours
0.2 mol/L Na2-EDTA 4.4 0.19 0.38 0.46 0.57 0.61 0.65 0.69
0.2 mol/L Na3-EDTA 8.2 0.01 0.04 0.05 0.09 0.12 0.22 0.23
0.2 mol/L Na4-EDTA 10.7 0.00 0.01 0.01 0.01 0.02 0.02 0.03
0.2 mol/L K-HEDTA 4.0 0.31 0.52 0.61 0.70 0.71 0.78 0.82
0.2 mol/L K2-HEDTA 6.5 0.02 0.04 0.09 0.13 0.17 0.20 0.24
0.2 mol/L K3-HEDTA 11.2 0.00 0.01 0.01 0.01 0.01 0.01 0.02
0.2 mol/L K2-DTPA 3.6 0.19 0.84 0.90 0.96 0.96 0.96 0.99
0.2 mol/L K3-DTPA 6.3 0.03 0.12 0.15 0.27 0.28 0.31 0.36
0.2 mol/L K5-DTPA 11.6 0.00 0.01 0.01 0.02 0.02 0.02 0.03
Table 12—Results of the effect of pH of aminopolycarboxylic acid on scale solubility test at
150°F.
Aminopolycarboxylic Acid: Effect of Dissolver Concentration
The concentration of the fully dissolved iron from the 0.1 g iron sulfide powder is 0.11
mol/L. It requires a 1:1 molar ratio of the chelating agent to the iron for complete sequestration of
Fe2+ ions. This study shows the effect of concentration of the ligand on the iron sulfide solubility.
At pH < 5, chelating agents have limited solubility in water. EDTA at pH < 5 was evaluated to
dissolve iron sulfide at 0.05, 0.1, and 0.2 mol/L. Concentrations of greater than 0.25 mol/L EDTA
could not be prepared at pH < 5. Similarly, DTPA and HEDTA were evaluated for its iron sulfide
dissolution at 0.05, 0.1, 0.2, and 0.3 mol/L for pH < 5. Since the solubility of the chelating agents

62
increased with the pH, these ligands were studied to dissolve iron sulfide at 0.1, 0.2, 0.3, and 0.4
mol/L and pH > 5.
In acidic conditions (pH < 5), the solubility of iron sulfide increased with the increase in
concentration (Fig. 21). It was found that there is a decrease in incremental dissolution with an
increase in concentration. For example, when the concentration was changed from 0.05 to 0.1
mol/L K-HEDTA, the incremental dissolution was 81%. However, when the concentration
changed from 0.1 to 0.2 mol/L, the incremental dissolution was 48%. Similarly, there was a 17%
improvement in dissolution for 0.3 mol/L when compared to 0.2 mol/L K-HEDTA. This shows
that there is excess chelating agent in high concentration solutions. There could be steric hindrance
effects in the interface between the solids and the bulk solution, limiting the activity of the
chelating agent and preventing further dissolution. The trend was similar for Na2-EDTA and K2-
DTPA as well.

63
Fig. 21—Effect of concentration on the iron sulfide dissolution at pH < 5 after 72 hours of
soaking.
For chelating solutions at 5 < pH < 9, the incremental solubility with higher concentration
solutions was minimal (Fig. 22). At 0.05 mol/L Na3-EDTA, the iron dissolved from iron sulfide
was noted to be 0.95 g/L. It increased to 1.65 g/L for 0.1 mol/L Na3-EDTA. However, for 0.4
mol/L Na3-EDTA, the dissolution did not improve and the final iron concentration in the dissolver
was measured to be 1.62 g/L. This showed that increasing the concentration beyond a 1:1 molar
ratio of iron sulfide to the neutral/alkaline chelating agent (pH > 5) does not yield additional
dissolution. This is due to the mechanism of dissolution of iron sulfide by solution complexation
at moderate and high pH conditions. There is no significant activity at the surface of the scale. The
dissolution of iron sulfide occurs as a result of surface activity as well as solution complexation at
pH < 5. Thus, it can be concluded that the solubility of iron sulfide is dependent on the

64
concentration only at pH < 5. From this study, a molar ratio of 3:1 K2-DTPA/FeS at pH = 3.6
sequesters 100% of the available iron. 69% of the available iron from the iron sulfide is dissolved
in a 2:1 molar ratio of Na2-EDTA and scale. This investigation found the maximum dissolution of
iron sulfide to be at the maximum possible concentration of the chelating agent at acidic conditions.
Tables 13 and 14 show the results of the effect of dissolver concentration on the scale solubility
tests at all sampling times.
Fig. 22—Effect of concentration on the iron sulfide dissolution at pH between 5 and 9 after
72 hours of soaking.

65
Dissolution Capacity
Dissolver 1
hour
4
hours
8
hours
20
hours
30
hours
48
hours
72
hours
0.05 mol/L Na2-EDTA 0.04 0.10 0.14 0.17 0.20 0.24 0.26
0.1 mol/L Na2-EDTA 0.14 0.30 0.39 0.42 0.46 0.49 0.49
0.2 mol/L Na2-EDTA 0.19 0.38 0.46 0.57 0.61 0.65 0.69
0.05 mol/L K-HEDTA 0.07 0.13 0.15 0.22 0.27 0.29 0.31
0.1 mol/L K-HEDTA 0.19 0.33 0.39 0.46 0.46 0.48 0.49
0.2 mol/L K-HEDTA 0.31 0.52 0.61 0.70 0.71 0.78 0.82
0.3 mol/L K-HEDTA 0.42 0.76 0.83 0.90 0.90 0.92 0.96
0.1 mol/L K2-DTPA 0.07 0.41 0.51 0.59 0.59 0.60 0.60
0.2 mol/L K2-DTPA 0.19 0.84 0.90 0.96 0.96 0.96 0.99
0.3 mol/L K2-DTPA 0.24 0.93 1.00 1.00 1.00 1.00 1.00
Table 13—Results of the effect of concentration of aminopolycarboxylic acid on scale
solubility test at 150°F and pH < 5.

66
Dissolution Capacity
Dissolver 1
hour
4
hours
8
hours
20
hours
30
hours
48
hours
72
hours
0.05 mol/L Na3-EDTA 0.01 0.02 0.04 0.06 0.07 0.12 0.15
0.1 mol/L Na3-EDTA 0.03 0.03 0.04 0.10 0.14 0.22 0.26
0.2 mol/L Na3-EDTA 0.01 0.04 0.05 0.09 0.12 0.22 0.23
0.3 mol/L Na3-EDTA 0.01 0.02 0.05 0.08 0.08 0.19 0.24
0.05 mol/L K2-HEDTA 0.02 0.04 0.06 0.07 0.09 0.12 0.19
0.1 mol/L K2-HEDTA 0.02 0.03 0.07 0.10 0.14 0.16 0.20
0.2 mol/L K2-HEDTA 0.02 0.04 0.09 0.13 0.17 0.20 0.24
0.3 mol/L K2-HEDTA 0.03 0.05 0.09 0.14 0.21 0.25 0.29
0.1 mol/L K3-DTPA 0.01 0.08 0.10 0.15 0.23 0.26 0.30
0.2 mol/L K3-DTPA 0.03 0.12 0.15 0.27 0.28 0.31 0.36
0.3 mol/L K3-DTPA 0.02 0.13 0.20 0.25 0.28 0.33 0.37
Table 14—Results of the effect of concentration of aminopolycarboxylic acid on scale
solubility test at 150°F and 5 < pH < 9.
The dissolver consumption as a function of dissolver concentration is plotted in Fig. 23 for
the acidic chelating agents. The dissolver consumption reduces as the concentration increases. For
K2-DTPA, the dissolver consumption reduces from 0.68 to 0.41 when its concentration increases
from 0.1 to 0.3 mol/L. Similarly, the dissolver consumption reduces as the ligand concentration
increases for K-HEDTA and Na2-EDTA. The reduction in the dissolver consumption can be
explained by the restriction of incremental dissolution at the solid-liquid interface as a result of the
excess chelating agent. The low dissolver consumption at high concentrations can yield bad
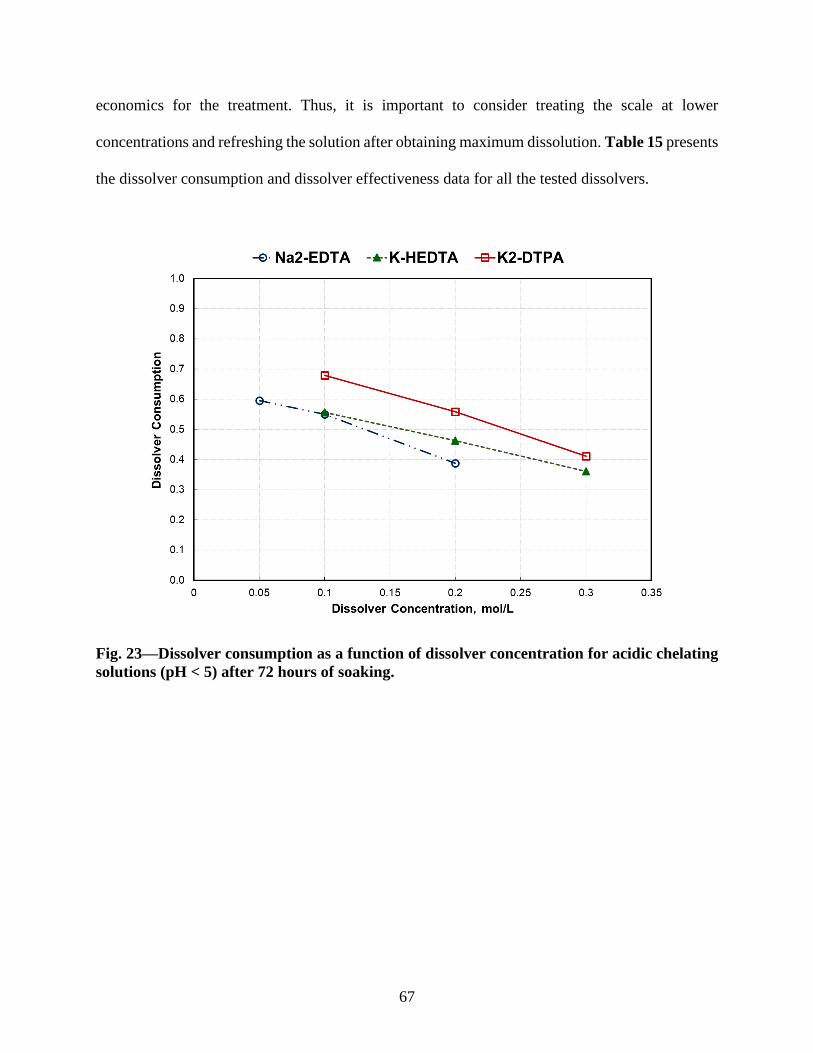
67
economics for the treatment. Thus, it is important to consider treating the scale at lower
concentrations and refreshing the solution after obtaining maximum dissolution. Table 15 presents
the dissolver consumption and dissolver effectiveness data for all the tested dissolvers.
Fig. 23—Dissolver consumption as a function of dissolver concentration for acidic chelating
solutions (pH < 5) after 72 hours of soaking.

68
Dissolver Dissolver Consumption Dissolver Effectiveness
0.05 mol/L Na2-EDTA 0.60 0.16
0.1 mol/L Na2-EDTA 0.55 0.27
0.2 mol/L Na2-EDTA 0.39 0.27
0.05 mol/L Na3-EDTA 0.34 0.05
0.1 mol/L Na3-EDTA 0.29 0.08
0.2 mol/L Na3-EDTA 0.13 0.03
0.3 mol/L Na3-EDTA 0.09 0.02
0.05 mol/L K-HEDTA 0.69 0.21
0.1 mol/L K-HEDTA 0.56 0.27
0.2 mol/L K-HEDTA 0.46 0.38
0.3 mol/L K-HEDTA 0.36 0.35
0.05 mol/L K2-HEDTA 0.43 0.08
0.1 mol/L K2-HEDTA 0.23 0.05
0.2 mol/L K2-HEDTA 0.13 0.03
0.3 mol/L K2-HEDTA 0.11 0.03
0.1 mol/L K2-DTPA 0.68 0.41
0.2 mol/L K2-DTPA 0.56 0.55
0.3 mol/L K2-DTPA 0.41 0.45
0.1 mol/L K3-DTPA 0.34 0.10
0.2 mol/L K3-DTPA 0.20 0.07
0.3 mol/L K3-DTPA 0.14 0.05
Table 15—Dissolver consumption and dissolver effectiveness for the aminopolycarboxylic
dissolvers with pH < 9.

69
Aminopolycarboxylic Acid: Effect of Treatment Time
A chelating agent’s dissolution rate depends on its pH. The research presented here
investigated the dissolution of iron sulfide scale for a period of 72 hours. Supernatant samples of
0.05 cm3 were taken at 1, 4, 8, 20, 30, 48, and 72 hours. ICP-OES analysis determined the iron
concentration in the dissolver solutions. Optimization of treatment time is crucial for scale
dissolution to make it economical in the field. The treatment is discontinued when the incremental
dissolution over time is minimal. In the field, this could mean removing the spent dissolver after
the optimized treatment time and replacing it with a new solution for continued treatment. Figs.
24, 25, and 26 present a semi-log plot for the iron concentration in the spent dissolver vs time.
These results demonstrate that at pH < 5, the solubility of iron sulfide scale reaches the maximum
within 16-20 hours, and there is no further significant increase in the dissolution after 20 hours. It
was observed that higher concentration solutions reach their peak faster than low concentration
dissolvers. The dissolution rate may be reduced due to the consumption of H+ ions in the solution.
Interaction between the dissolver and scale solids is limited when H+ is consumed from the
chelating agent. The surface of the iron sulfide changes to a more sulfur-rich layer, which inhibits
further dissolution as well. This was observed from the SEM study, which will be addressed in the
following sections. At 150°F, the system energy is low and does not promote the chelating agent
to destabilize the Fe-S bond. However, an increase in the temperature may lead to bond cleavage
and subsequent chelation of the iron.

70
Fig. 24—Iron sulfide dissolution as a function of time for Na2-EDTA at 150°F.
Fig. 25—Iron-sulfide dissolution vs. time for K-HEDTA at 150°F.

71
Fig. 26—Iron sulfide dissolution vs time for K2-DTPA at 150°F.
Experimental results reveal that the dissolution did not flatten out for higher pH dissolvers
(Fig. 27). The iron concentration in the spent dissolver continued to increase throughout 72 hours
of the experiment. Since H+ concentration is low at higher pH conditions, the mechanism of
dissolution is primarily solution complexation. Aljeban et al. (2018) reported similar findings of
the nature of dissolving iron sulfide using an alkaline chelating solution developed by Chen et al.
(2017). These researchers noticed that, at 250°F, the pyrrhotite chips continued to be dissolved in
the alkaline chelating dissolver up to 24 hours (maximum time tested), whereas an acidic chelating
dissolver achieved maximum dissolution in four hours. Surface adsorption of the chelating agent
contributes very little to the dissolution of iron sulfide at 150°F.

72
Fig. 27—Dissolution of iron sulfide as a function of time at pH between 5 and 9 of EDTA and
150°F.
Surface defects can cause the Fe2+ to be released from the solid and, consequently, become
chelated by the dissolver. Fig. 28 compares the chelated dissolution as a fraction of the maximum
dissolution vs time for low and high pH solutions of DTPA. While designing a field treatment for
iron sulfide dissolution, the treatment time must be strongly considered and optimized. The results
presented in this work demonstrated that 20 hours is the optimum treatment time for the dissolution
of the iron-sulfide scale by EDTA, HEDTA, and DTPA at pH < 5.

73
Fig. 28—Comparison of fractional dissolution as a function of time for pH < 5 (K2-DTPA)
and pH > 10 (K5-DTPA) DTPA solution and 150°F.
Aminopolycarboxylic Acid: Effect of Coordination Number
The three chelating agents studied in this research belong to the same class of
aminopolycarboxylic acids. HEDTA has two nitrogen atoms, three carboxylic groups, and one
hydroxyl group. The number of active ligands, in this case, is five (Fig. 3). The presence of the
hydroxyl group enhances its solubility in water at pH < 5, and, hence, a concentration of 0.3 mol/L
K-HEDTA can be prepared at pH = 3.7.
EDTA has two nitrogen atoms and four carboxylic groups, making it a hexadentate ligand.
DTPA has three nitrogen groups and five carboxylic groups and is termed as an octadentate ligand.
DTPA has the highest stability for most metal ions among the three aminopolycarboxylic acids

74
studied here. Fig. 20 demonstrates the difference in the dissolution of iron sulfide by the three
chelating agents at acidic conditions (pH < 5). DTPA is the best dissolver for iron sulfide, followed
by HEDTA, and lastly EDTA. The iron dissolved from iron sulfide was measured to be 6.3 g/L in
the case of 0.2 mol/L K2-DTPA, 5.2 g/L at 0.2 mol/L K-HEDTA, and 4.4 g/L at 0.2 mol/L Na2-
EDTA. The trend of the scale dissolution is consistent with the pH level of the dissolver. 0.2 mol/L
K2-DTPA has the lowest pH, followed by 0.2 mol/L K-HEDTA, and Na2-EDTA has the highest
pH. Even though the stability constant of EDTA is higher than that of HEDTA for Fe2+/Fe3+ ions,
these tests show that the H+ concentration is the major factor for the scale dissolution. Frenier
(2001) made a similar observation to dissolve alkaline earth deposits. After reaction with the iron-
sulfide scale, the initially colorless dissolver changed to pale yellow, whereas for K-HEDTA the
color changed to red (Fig. 29). Therefore, this work indicates using K2-DTPA instead of Na2-
EDTA and K-HEDTA to dissolve the iron-sulfide scale.
Fig. 29—(a) Na2-EDTA (b) K2-DTPA (c) K-HEDTA solutions after 72 hours of reactions
with iron sulfide.

75
At 150°F and pH > 5, the dissolution of iron sulfide by EDTA, HEDTA, and DTPA is
minimal. The dissolution occured as a result of solution complexation, where iron from the iron
sulfide was released into the solution and chelated by the ligands. The release of iron occured due
to the dissociation of the iron sulfide. At 150°F, the release of iron is very slow and minimal, hence
the low dissolution capacities of the dissolver. At pH between 5 and 9, a 0.2 mol/L solution of
Na3-EDTA, K2-HEDTA, and K3-DTPA showed 23, 24, and 36% dissolution capacity,
respectively, after 72 hours of soaking. At pH > 10, Na4-EDTA, K3-HEDTA, and K5-DTPA
dissolve 3, 2, 2% of iron from the iron-sulfide scale, respectively. This result shows that the
chelating agents are not effective in dissolving the iron-sulfide scale at 150°F. To evaluate the
solubility of the scale at a higher temperature, the same tests were conducted at 300°F.
Aminopolycarboxylic Acid: Effect of Temperature
Figs. 30 and 31 present the results of the solubility test of the iron-sulfide scale using
EDTA, HEDTA, and DTPA at 5 < pH < 9 and pH > 10, respectively. The figures compare the
dissolution capacity at 150 and 300°F. At 300°F, the rate of dissolution appears faster than at 150°F
for all ligands tested. Between pH 5 and 9, the dissolution capacity of Na3-EDTA, K2-HEDTA,
and K3-DTPA increased to 0.69, 0.68, and 0.81 at 300°F from 0.23, 0.24, and 0.36 at 150°F,
respectively. Similarly, at pH > 10, the dissolution capacity of Na4-EDTA, K3-HEDTA, and K5-
DTPA increased to 0.85, 0.76, and 1 at 300°F from 0.03, 0.02, and 0.03 at 150°F, respectively.
The increase in the dissolution at 300°F is due to the increased iron sulfide dissociation in addition

76
to the increased activity of the chelating agent at the surface of the scale. At 77°F, the iron-sulfur
bond dissociation energy is 339 kJ/mol (Dean 1999). At higher temperatures, the system energy
will increase, the iron sulfide bond or the lattice energy can be overcome, thus allowing chelating
agents to remove the metal ions from the scale surface.
These results indicate that the chelating agents are more effective at pH > 10 than at 5 <
pH < 9 when the dissolution is taking place at 300°F. EDTA, HEDTA, and DTPA dissolve 23, 11,
and 23% more iron from the iron sulfide at pH > 10 than at pH between 5 and 9. This difference
maybe because of the higher number of deprotonated sites on the chelating agents at pH > 10.
Those sites can be used to destabilize the iron-sulfur bond on the surface of the scale, leading to
higher dissolution. Na4-EDTA, K3-HEDTA, and K5-DTPA also have higher stability constants for
Fe2+ than Na3-EDTA, K2-HEDTA, and K3-DTPA, respectively. Table 16 presents the dissolution
capacity of the solubility tests at 150 and 300°F as a function of time.
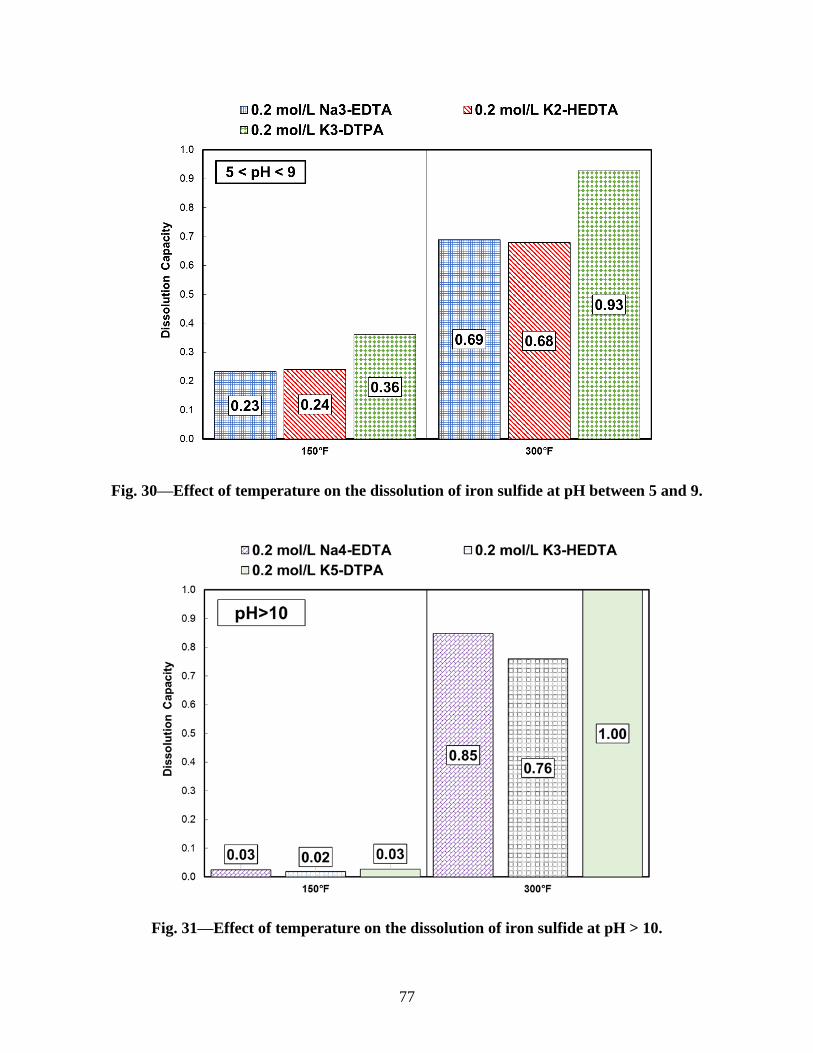
77
Fig. 30—Effect of temperature on the dissolution of iron sulfide at pH between 5 and 9.
Fig. 31—Effect of temperature on the dissolution of iron sulfide at pH > 10.

78
Dissolution Capacity
Dissolver Temperature
(°F)
1
hour
4
hours
20
hours
48
hours
72
hours
0.2 mol/L Na3-EDTA 150 0.01 0.04 0.09 0.22 0.23
0.2 mol/L Na4-EDTA 150 0.00 0.01 0.01 0.02 0.03
0.2 mol/L K2-HEDTA 150 0.02 0.04 0.13 0.20 0.24
0.2 mol/L K3-HEDTA 150 0.00 0.01 0.01 0.01 0.02
0.2 mol/L K3-DTPA 150 0.03 0.12 0.27 0.31 0.36
0.2 mol/L K5-DTPA 150 0.00 0.01 0.02 0.02 0.03
0.2 mol/L Na3-EDTA 300 0.10 0.20 0.35 0.56 0.69
0.2 mol/L Na4-EDTA 300 0.04 0.17 0.61 0.76 0.85
0.2 mol/L K2-HEDTA 300 0.16 0.30 0.57 0.67 0.68
0.2 mol/L K3-HEDTA 300 0.08 0.16 0.63 0.75 0.76
0.2 mol/L K3-DTPA 300 0.42 0.51 0.65 0.81 0.93
0.2 mol/L K5-DTPA 300 0.07 0.21 0.85 0.94 1.0
Table 16—Iron sulfide dissolution capacity of aminopolycarboxylic acids at 150 and 300°F.

79
Aminopolycarboxylic Acid: Effect of Dissolver/Scale Ratio at 300°F
The effectiveness of the dissolver depends on the dissolver/scale ratio. It is important in
field applications where the amount of scale is a known quantity. This work investigates the effect
of the dissolver/scale ratio by adding 0.1, 0.2, and 0.5 g to 10 cm3 of the dissolver, giving ratios of
100/1, 50/1, and 20/1 cm3/g, respectively. Fig. 32 presents the results of using pH > 5 ligand
solutions of EDTA, HEDTA, and DTPA at 100/1, 50/1, and 20/1 dissolver/scale ratios at 300°F
and 20 hours soaking time. As shown in Fig. 32, the iron sulfide solubility decreases as the
dissolver/scale ratio decreases. However, the best dissolver at any dissolver/scale ratio remains to
be K5DTPA, followed by Na4EDTA. These results indicate that a 100/1 dissolver/scale ratio must
be used in the field to achieve maximum dissolution.
Fig. 32—Effect of dissolver/scale ratio on the dissolution capacity of the ligands at 300°F
after 20 hours of soaking.

80
Aminopolycarboxylic Acid: Effect of Salinity on Scale Solubility
The following subsections related to the iron sulfide scale dissolution used a different batch
of iron sulfide particles (Batch III). X-ray Diffraction (XRD) analysis of the scale indicated the
presence of iron sulfide minerals such as troilite (87%), pyrrhotite (6%), and elemental iron (7%).
This is important as this batch contained a higher proportion of troilite than the previous batch.
Fig. 33 shows the dissolution capacity of 0.4 mol/L K2-DTPA to dissolve the iron sulfide
scale at 150°F as a function of time when prepared with 5 wt% NaCl and deionized water. There
was no significant change in the dissolution capacity as a result of using 5 wt% NaCl to prepare
the dissolver. A test was run to evaluate the role of calcium ions in solution on the scale solubility
using 0.4 mol/L K2-DTPA. The dissolver prepared with 5 wt% NaCl and 1 wt% CaCl2 showed
slow dissolution initially but did not show any hindrance overall at the end of 20 hours to the scale
solubility at 150°F. This was due to the excess concentration of the dissolver. Increasing the
concentration of CaCl2 may affect the iron sulfide dissolution behavior because of the chelation of
the competing Ca2+ ion.

81
Fig. 33—Effect of sodium and calcium ions in dissolver solution on the dissolution capacity
of K2-DTPA at 150°F.
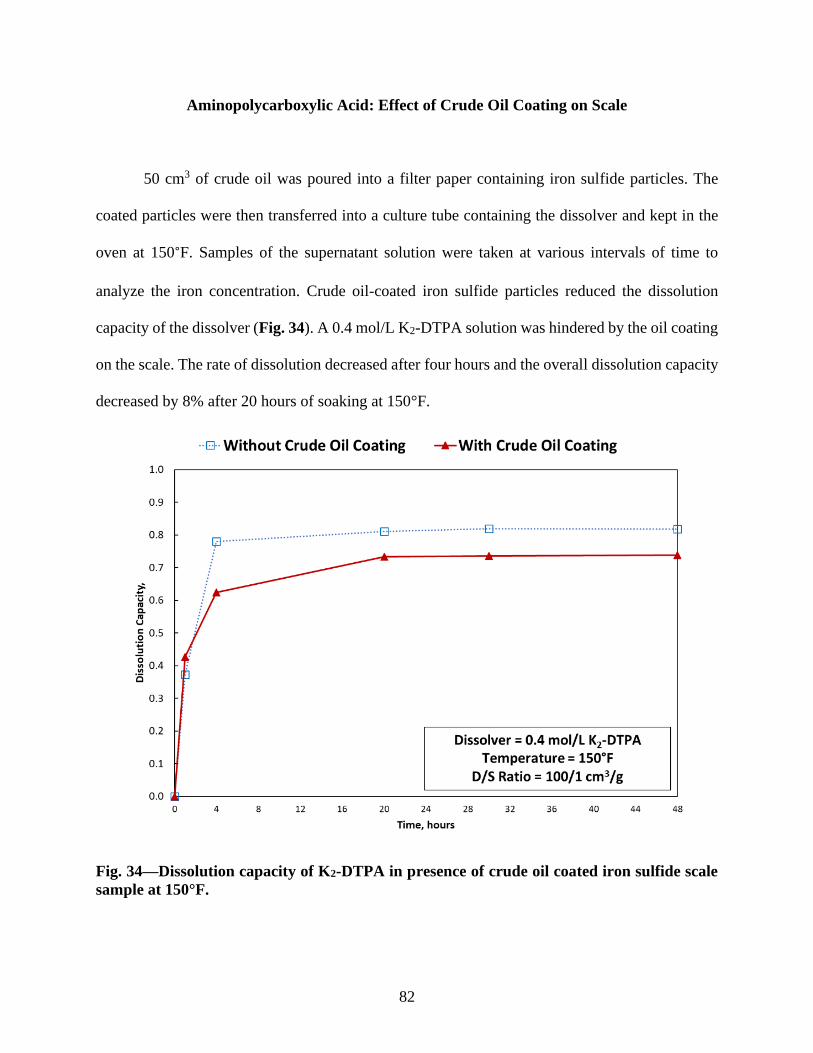
82
Aminopolycarboxylic Acid: Effect of Crude Oil Coating on Scale
50 cm3 of crude oil was poured into a filter paper containing iron sulfide particles. The
coated particles were then transferred into a culture tube containing the dissolver and kept in the
oven at 150°F. Samples of the supernatant solution were taken at various intervals of time to
analyze the iron concentration. Crude oil-coated iron sulfide particles reduced the dissolution
capacity of the dissolver (Fig. 34). A 0.4 mol/L K2-DTPA solution was hindered by the oil coating
on the scale. The rate of dissolution decreased after four hours and the overall dissolution capacity
decreased by 8% after 20 hours of soaking at 150°F.
Fig. 34—Dissolution capacity of K2-DTPA in presence of crude oil coated iron sulfide scale
sample at 150°F.

83
Aminopolycarboxylic Acid: Effect of Mixed Scales
The selectivity of the chelating agents towards different kinds of minerals can result in a
change in the solubility of the target scale. Literature studies have shown that aminopolycarboxylic
acids like EDTA, HEDTA, and DTPA have more affinity towards Ca2+ ions than Fe2+. In a mixed
system of iron sulfide and calcium carbonate scales, if XFe and XCa are dissolved fractions of the
total iron and calcium in the solution, then:
YCa-Fe=XCa
XFe,
…...…………………………………………….. (16)
Where YCa-Fe is the selectivity of the aminopolycarboxylic acid to dissolve calcium-based
mineral over iron-based mineral. If the ratio is 1, the dissolver is not selective as it dissolves both
the scales equally. If the value of YCa-Fe is greater than 1, it indicates that the dissolver prefers to
dissolve the calcium-based scale more than the iron-based scale.
In the well tubulars with high H2S and CO2 content, the presence of calcium carbonate
scales is prevalent along with iron sulfides. Fig. 35 demonstrates the decrease in the iron sulfide
dissolution when calcium carbonate was present along with iron sulfide scale in equal weight
proportion and a D/S ratio of 50/1 cm3/g. It is known that K2-DTPA solution has a higher affinity
towards calcium than iron. During the first 4 hours of soaking the scale mixture with 0.4 mol/L
K2-DTPA at 150°F, the fraction of calcium carbonate dissolved is 1.0 compared to 0.46 of iron
sulfide. The control experiment without calcium carbonate scale and a D/S ratio of 100/1 cm3/g
had a dissolution capacity of 0.78 during the first four hours of soaking. The reduction in the
fraction dissolved from 0.78 to 0.46 was due to the selectivity of the chelating agent towards the
calcium carbonate scale. This selectivity led to an overall decrease in iron sulfide scale dissolution
capacity from 0.82 to 0.69 after 48 hours at 150°F. However, the total scale fraction (calcium

84
carbonate and iron sulfide) dissolved did not significantly change, indicating no negative impact
on the dissolver’s performance as a result of multiple scales. In well tubulars and pipelines
containing multiple scales, it is important to remove all kinds of scales and choose a dissolver that
is not affected overall by the presence of multiple scales. This study shows that K2-DTPA is a good
candidate for such applications. Table 17 presents the selectivity data for K2-DTPA in an iron
sulfide and calcium carbonate mixed scale system. The dissolver preferred to dissolve calcium
carbonate until it was completely dissolved. Then, the K2-DTPA dissolved iron sulfide at a faster
rate. Overall, after 48 hours the K2-DTPA solution selected to dissolve calcium carbonate at a rate
1.5 times more than the iron sulfide.
Fig. 35—Selectivity of K2-DTPA towards a mixed scale sample at 150°F.

85
1 hour 4 hours 20 hours 30 hours 48 hours
XFe 0.16 0.46 0.66 0.67 0.69
XCa 0.8 1.0 1.0 1.0 1.0
YCa-Fe 4.7 2.2 1.5 1.5 1.5
Table 17—Selectivity of 0.4 mol/L K2-DTPA in an 1:1 iron sulfide-calcium carbonate
mixed system with a D/S ratio of 50/1 cm3/g.
Aminopolycarboxylic Acid: Effect of Synergists
The dissolution capacity of aminopolycarboxylic acids can be improved by adding
synergists or converters. These chemicals enhance the scale dissolution by lowering the Gibbs free
energy of the system or by forming more soluble products during a conversion reaction. For
example, the conversion of barium sulfate to barium carbonate is an almost spontaneous process
with a Gibbs free energy value close to 0. The barium carbonate is then a much easier scale to
dissolve and hence there is an enhancement in the dissolution rate. The physical mechanism of this
conversion process has been postulated as the change in the crystal structure of the barite scale due
to the adsorption of the synergist on its surface. The reaction of the synergist on the crystal yields
a more soluble compound, barium carbonate, for its subsequent dissolution by the
aminopolycarboxylic acid. These synergists do not tend to dissolve the scale by itself. Some
common synergists such as oxalic acid, sodium carbonate, and sodium fluoride have been shown
to enhance the dissolution rate of sulfate scales. Barite and calcium sulfate scales have been
dissolved using the aminopolycarboxylic acid and synergist combination. However, these
synergists do not work on all kinds of scales and types of aminopolycarboxylic acids. Some studies

86
have also shown that these synergists do not work on already optimized compositions of the
aminopolycarboxylic acids. To the knowledge of the author, the role of synergists on enhancing
the dissolution rate has not been evaluated for FeS scales. This study investigated 0.2 mol/L
solutions of potassium iodide, potassium chloride, potassium formate, sodium fluoride, and
potassium citrate as synergists to 0.2 mol/L EDTA, DTPA, and HEDTA at 150 and 300°F.
Figs. 36, 37, and 38 demonstrate the impact of adding synergists to Na2-EDTA, K2-DTPA,
and K-HEDTA, respectively, at 150°F. There was no synergy observed with K2-DTPA or K-
HEDTA. The dissolution capacity decreased as a result of adding potassium iodide, potassium
chloride, potassium formate, and potassium citrate. However, there was an improvement in
dissolution when potassium iodide and potassium citrate were added to Na2-EDTA. The addition
of potassium iodide and potassium citrate to Na2-EDTA improved the scale solubility by 13 and
10%, respectively. The increase in the dissolution rate was observable from the first sampling point
of 1 hour. Potassium citrate increased the dissolution capacity of Na2-EDTA from 17 to 28% in
the first hour of dissolution. The improvement in scale solubility with the help of potassium iodide
was shown from the 4th hour. Previous studies with other kinds of scale dissolution have also
shown that only some aminopolycarboxylic acid is affected positively by the synergists (Lakatos
et al. 2002, Yu et al. 2016). Potassium citrate may help in improving the scale dissolution as a
reducing agent, similar to the Na2-EDTA.

87
Fig. 36—Impact of synergists to Na2-EDTA's dissolution capacity at 150°F.
Fig. 37—Impact of synergists to K2-DTPA's dissolution capacity at 150°F.

88
Fig. 38—Impact of synergists to K-HEDTA's dissolution capacity at 150°F.
The synergists were tested at 300°F as well. Since the acidic forms of the chelating agents
generate high concentrations of hydrogen sulfide at 300°F (> 2,000 ppm in 8 hours of treatment),
this study focused on their basic forms, Na4-EDTA, K4-EDTA, K5-DTPA, and K3-HEDTA. At
300°F, the system energy is high and leads to increased dissolution of iron sulfide. The tetrasodium
salt of EDTA was evaluated against its tetrapotassium salt counterpart to understand the difference
in the scale solubility. Fig. 39 demonstrates the iron sulfide scale solubility using the sodium and
potassium variant of EDTA. The tetrapotassium salt dissolved more iron sulfide and at a higher
dissolution rate than the tetrasodium salt. The tetrapotassium salt has higher stability constant with
Fe2+/Fe3+ ions making it better as a scale dissolver as well. The dissolution capacity of K4-EDTA
at the end of 8 hours was 95% when the dissolver-scale ratio was 100:1 cm3/g. The dissolution
capacity of Na4-EDTA could be improved by adding potassium iodide or sodium fluoride (Fig.
40). In 8 hours of scale dissolution, there was a 10 and 8% improvement in the dissolution capacity

89
by adding 0.2 mol/L potassium iodide and 0.2 mol/L sodium fluoride, respectively, to 0.2 mol/L
Na4-EDTA at 300°F. Adding synergists to K4-EDTA did not lead to any significant improvement
in the scale solubility in the 8 hours of testing (Fig. 41). However, in the first one hour, adding 0.2
mol/L tripotassium citrate acted as a synergist to K4-EDTA, increasing the scale solubility from
27 to 44%. Similarly, adding 0.2 mol/L potassium formate improved the scale solubility by 12%
in the first hour of dissolution. This synergistic activity slowed down and at the end of 8 hours,
there was a 3-5% increase in solubility when compared to its control. Unlike the tests conducted
at 150°F, the tests at 300°F showed that potassium iodide and sodium fluoride with K5-DTPA
could enhance the iron sulfide scale solubility by 8-10% (Fig. 42). This effect was not observed
with K3-HEDTA (Fig. 43).
Fig. 39—Effect of base type on the dissolution capacity of EDTA at 300°F.

90
Fig. 40—Impact of synergists on Na4-EDTA’s dissolution capacity at 300°F.
Fig. 41—Impact of synergists on K4-EDTA’s dissolution capacity at 300°F.

91
Fig. 42—Impact of synergists on K5-DTPA’s dissolution capacity at 300°F.
Fig. 43—Impact of synergists on K3-HEDTA’s dissolution capacity at 300°F.

92
Aminopolycarboxylic Acid: Mechanism of Iron Sulfide Scale Dissolution
As discussed previously, the mechanism of iron-sulfide dissolution depends on the
dissolver’s pH. The selection of the dissolver concentration and the scale treatment time is also
dependent on the pH. At pH < 5, the mechanism of iron-sulfide dissolution is dominated by the
attack of H+ ions on the surface of the scale. The H+ ions react with the scale to produce H2S and
free Fe2+ ions. The Fe2+ ions are chelated by the ligands. The process continues until either (a) the
H+ concentration is reduced to 0 or (b) the iron on the surface is completely removed, exposing a
layer of sulfur. For alkaline solutions (pH > 10), complexation is the mechanism of dissolving iron
sulfide. The dissociation of the iron sulfide results in free Fe2+ in solution, which is then chelated
by the ligands. The dissociation of iron sulfide in the dissolver is the rate-limiting step, and, at
150°F, it is minimal for all the chelating agents, thus yielding low dissolution.
The role of H+ ions in the dissolution of the iron-sulfide scale at 150°F was studied using
SEM. The undissolved iron sulfide after the reaction with the chelating agent was filtered with a
1-5 µm filter paper, washed with isopropanol, and dried at 212°F for 12 hours. The dried iron-
sulfide particles were studied under an SEM to observe its morphology. Fig. 44 shows an iron-
sulfide particle before and after reaction with K2-DTPA. The images show pits and holes on the
surface. This texture indicates H+ attack on the particle (Fig 44b). There are smooth surfaces as
well as porous surfaces on the particle. An EDS test on the smooth surfaces reveals mainly sulfur
(97%) and very low iron content (3%). The porous surfaces show both iron (37%) and sulfur
(63%). The elemental analysis of the pitting area shows a higher concentration of sulfur (84%)
than the porous surface. This result shows that the layer of iron sulfide is attacked by the H+ ions,
releasing the iron from the surface. A layer of sulfur is present underneath the top layer and is
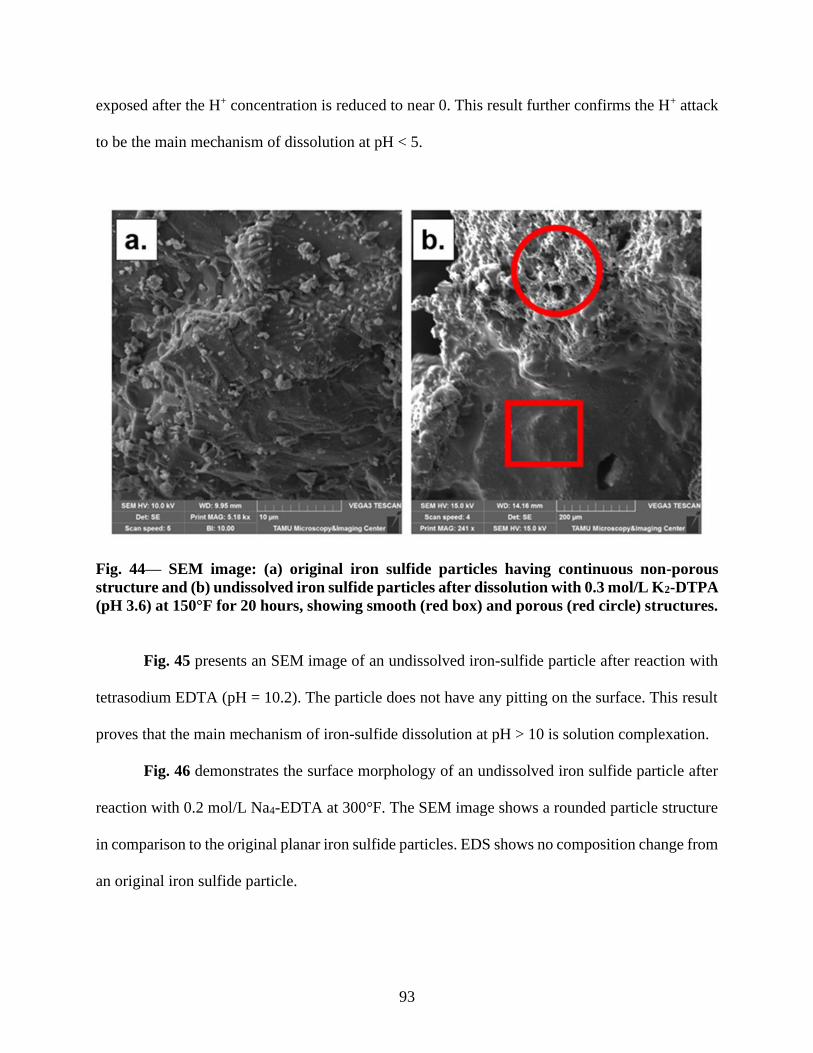
93
exposed after the H+ concentration is reduced to near 0. This result further confirms the H+ attack
to be the main mechanism of dissolution at pH < 5.
Fig. 44— SEM image: (a) original iron sulfide particles having continuous non-porous
structure and (b) undissolved iron sulfide particles after dissolution with 0.3 mol/L K2-DTPA
(pH 3.6) at 150°F for 20 hours, showing smooth (red box) and porous (red circle) structures.
Fig. 45 presents an SEM image of an undissolved iron-sulfide particle after reaction with
tetrasodium EDTA (pH = 10.2). The particle does not have any pitting on the surface. This result
proves that the main mechanism of iron-sulfide dissolution at pH > 10 is solution complexation.
Fig. 46 demonstrates the surface morphology of an undissolved iron sulfide particle after
reaction with 0.2 mol/L Na4-EDTA at 300°F. The SEM image shows a rounded particle structure
in comparison to the original planar iron sulfide particles. EDS shows no composition change from
an original iron sulfide particle.

94
Fig. 45— SEM image of undissolved iron sulfide particles after reaction with 0.3 mol/L Na4-
EDTA (pH 10.2) at 150°F for 20 hours, showing smooth surfaces, indicating no surface
activity.
Fig. 46— SEM image of undissolved iron sulfide particles after reaction with 0.2 mol/L Na4-
EDTA (pH 10.2) at 300°F for 8 hours, showing rounded surfaces.
95
THPS: Effect of Ammonium Chloride
Batch 3 of iron sulfide particles used in the following subsections indicated the presence
of troilite (87%) and pyrrhotite (6%) along with elemental iron (7%). This study evaluated the
solubility of iron sulfide in the THPS-ammonium chloride blend solution at 150°F. The
stoichiometry of the reaction between the blend and the scale is important and can affect the
dissolution behavior. The reaction of the dissolver blend with the iron sulfide scale was allowed
to continue for 48 hours at 150°F in culture tubes.
The THPS and NH4Cl concentration was varied from 0.4 – 1.9 (15 – 60 wt%) and 0 – 2
mol/L (0 – 10 wt%), respectively. Fig. 47 shows the influence of ammonium chloride on the
solubility of the scale by THPS at 100/1 cm3/g dissolver-scale ratio. At 0.75 mol/L THPS, the
addition of 1 and 2 mol/L NH4Cl increased the dissolution capacity from 12% in absence of NH4Cl
to 66 and 96%, respectively, after 48 hours of soaking. The iron sulfide was chelated by a complex
formed between the THPS and iron sulfide in presence of an ammonium ion. Without the
ammonium ion, there is no complex formed, yielding no solubility of the scale at 150°F. Any field
treatment must include ammonium chloride to remove the iron sulfide scale effectively. Table 18
shows the results of the solubility test using THPS and ammonium chloride at 150°F.

96
Fig. 47—Effect of adding NH4Cl to THPS on the iron sulfide dissolution at 150°F and soaking
time of 48 hours.

97
THPS: Effect of Concentration
Fig. 48 demonstrates the effect of dissolver concentration on the dissolution capacity of
the THPS-ammonium chloride blend. There is an optimum value of the blend concentration
beyond which there is a negligible improvement in the dissolution capacity. A 0.4 mol/L THPS
and 1 mol/L NH4Cl blend showed a dissolution capacity of 0.66 after 48 hours of soaking. The
dissolution capacity increased with the blend concentration and a maximum dissolution capacity
was reached for a 0.75 mol/L THPS and 2 mol/L NH4CL. This blend yielded a dissolution capacity
Dissolution Capacity
Dissolver Initial
pH
Final
pH
1
hour
4
hours
20
hours
30
hours
48
hours
0.4 mol/L THPS 3.3 3.7 0.02 0.03 0.05 0.07 0.09
0.4 mol/L THPS + 1 mol/L NH4Cl 3.1 0.3 0.03 0.10 0.46 0.55 0.67
0.4 mol/L THPS + 2 mol/L NH4Cl 3.1 0 0.03 0.09 0.38 0.42 0.67
0.75 mol/L THPS 3.6 4.3 0.02 0.03 0.07 0.09 0.12
0.75 mol/L THPS + 1 mol/L NH4Cl 3.2 0.2 0.03 0.13 0.43 0.52 0.66
0.75 mol/L THPS + 2 mol/L NH4Cl 3 0.0 0.04 0.18 0.82 0.88 0.96
1.9 mol/L THPS 4.1 4.2 0.02 0.03 0.06 0.08 0.10
1.9 mol/L THPS + 1 mol/L NH4Cl 3.4 0.2 0.03 0.14 0.40 0.47 0.66
1.9 mol/L THPS + 2 mol/L NH4Cl 3.3 0.0 0.03 0.23 0.69 0.85 0.96
Table 18—Effect of adding NH4Cl to THPS on the iron sulfide solubility at 150°F.
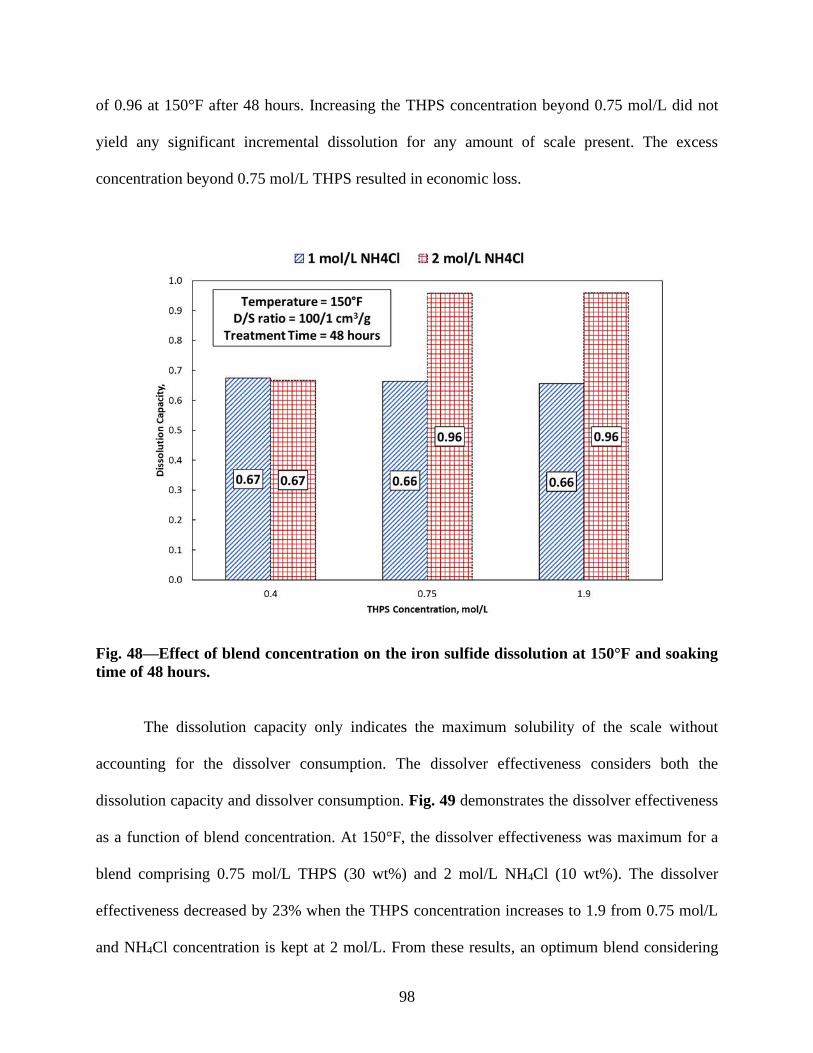
98
of 0.96 at 150°F after 48 hours. Increasing the THPS concentration beyond 0.75 mol/L did not
yield any significant incremental dissolution for any amount of scale present. The excess
concentration beyond 0.75 mol/L THPS resulted in economic loss.
Fig. 48—Effect of blend concentration on the iron sulfide dissolution at 150°F and soaking
time of 48 hours.
The dissolution capacity only indicates the maximum solubility of the scale without
accounting for the dissolver consumption. The dissolver effectiveness considers both the
dissolution capacity and dissolver consumption. Fig. 49 demonstrates the dissolver effectiveness
as a function of blend concentration. At 150°F, the dissolver effectiveness was maximum for a
blend comprising 0.75 mol/L THPS (30 wt%) and 2 mol/L NH4Cl (10 wt%). The dissolver
effectiveness decreased by 23% when the THPS concentration increases to 1.9 from 0.75 mol/L
and NH4Cl concentration is kept at 2 mol/L. From these results, an optimum blend considering

99
both the solubility and economics would comprise of 0.75 mol/L THPS and 2 mol/L NH4Cl. Table
19 shows the dissolver effectiveness as a function of time and dissolver concentration.
Fig. 49—Effect of THPS-ammonium chloride blend concentration on the dissolver
effectiveness to remove iron sulfide scale at 150°F.
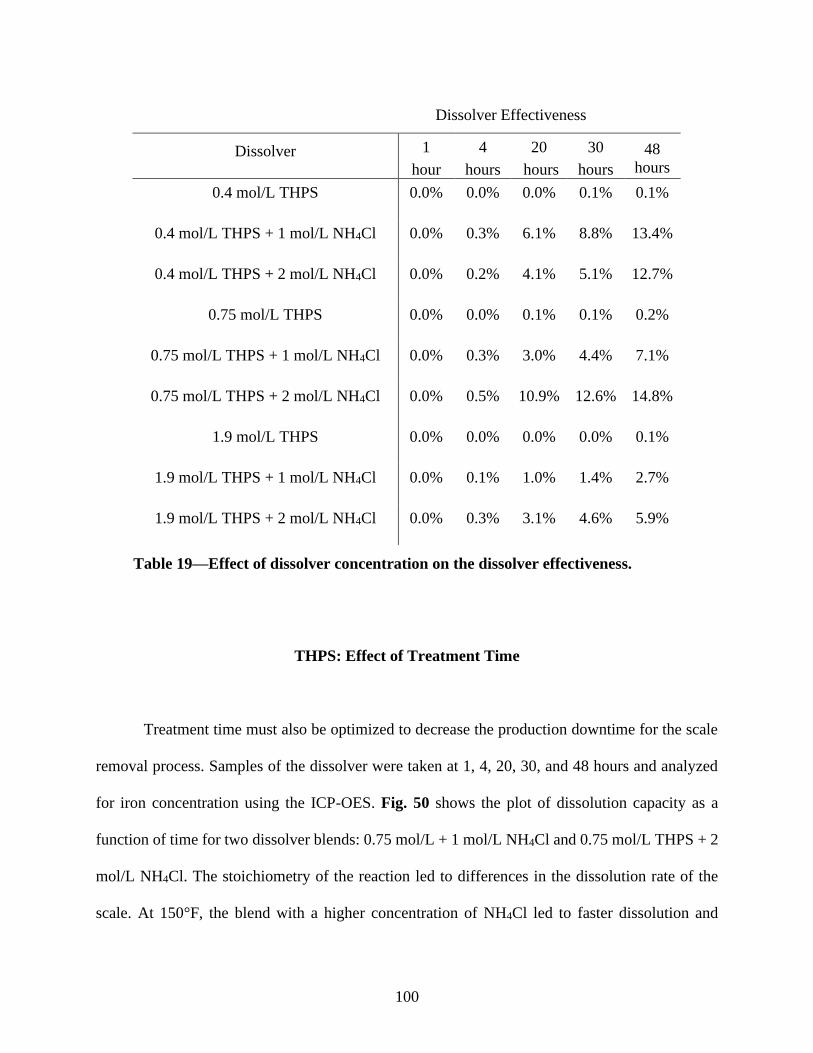
100
THPS: Effect of Treatment Time
Treatment time must also be optimized to decrease the production downtime for the scale
removal process. Samples of the dissolver were taken at 1, 4, 20, 30, and 48 hours and analyzed
for iron concentration using the ICP-OES. Fig. 50 shows the plot of dissolution capacity as a
function of time for two dissolver blends: 0.75 mol/L + 1 mol/L NH4Cl and 0.75 mol/L THPS + 2
mol/L NH4Cl. The stoichiometry of the reaction led to differences in the dissolution rate of the
scale. At 150°F, the blend with a higher concentration of NH4Cl led to faster dissolution and
Dissolver Effectiveness
Dissolver 1
hour
4
hours
20
hours
30
hours
48
hours
0.4 mol/L THPS 0.0% 0.0% 0.0% 0.1% 0.1%
0.4 mol/L THPS + 1 mol/L NH4Cl 0.0% 0.3% 6.1% 8.8% 13.4%
0.4 mol/L THPS + 2 mol/L NH4Cl 0.0% 0.2% 4.1% 5.1% 12.7%
0.75 mol/L THPS 0.0% 0.0% 0.1% 0.1% 0.2%
0.75 mol/L THPS + 1 mol/L NH4Cl 0.0% 0.3% 3.0% 4.4% 7.1%
0.75 mol/L THPS + 2 mol/L NH4Cl 0.0% 0.5% 10.9% 12.6% 14.8%
1.9 mol/L THPS 0.0% 0.0% 0.0% 0.0% 0.1%
1.9 mol/L THPS + 1 mol/L NH4Cl 0.0% 0.1% 1.0% 1.4% 2.7%
1.9 mol/L THPS + 2 mol/L NH4Cl 0.0% 0.3% 3.1% 4.6% 5.9%
Table 19—Effect of dissolver concentration on the dissolver effectiveness.

101
eventually plateaued after 30 hours, yielding no significant incremental dissolution. The blend with
lower NH4Cl concentration, however, dissolved the scale slowly and never plateaued in the 48
hours of testing. Fig. 51 demonstrates the change in dissolution capacity at different intervals of
time. From the figure, it is clear that most of the scale dissolution occurred at 4-30 hours. For the
blend with lower NH4Cl concentration, the dissolution continued even after 30 hours.
Fig. 50— Effect of treatment time on the dissolution capacity using THPS-ammonium
chloride blend at 150°F.

102
Fig. 51—Change in the dissolution capacity at different intervals of time.
THPS: Effect of Dissolver/Scale Ratio
The dissolution capacity also depended on the mass of the scale present and the dissolver
volume. This work investigated the dissolution capacity of the THPS-ammonium chloride blend
for different dissolver/scale ratios: 100/1, 50/1, 20/1, and 10/1 cm3/g. At 0.4 mol/L THPS and 2
mol/L NH4Cl, the dissolution capacity decreased from 0.67 to 0.41 as the D/S ratio changes from
100/1 to 20/1 cm3/g, respectively (Fig. 52). Fig. 53 presents the dissolution capacity for the
different D/S ratios, using 0.75 mol/L THPS and 2 mol/L NH4Cl as the dissolver. The results show
no significant change in the dissolution capacity when the D/S ratio decreased from 100/1 to 50/1
cm3/g. However, the dissolution capacity declined to 0.42 from 0.96 when the dissolver volume

103
changed from 100 to 10 cm3 for 1 g of scale. The decrease in the dissolver volume limited the
number of moles to react with the iron sulfide scale. This led to a decrease in dissolution capacity.
However, the decrease in the dissolver volume by ten times only led to a 56% decrease in the
dissolution capacity. Table 20 shows the dissolution capacity as a function of dissolver-scale ratios
for the tested dissolver concentrations.
Fig. 52—Effect of dissolver/scale ratio on the dissolution capacity at 150°F and soaking time
of 48 hours.

104
Fig. 53—Effect of D/S ratio on the dissolution capacity of THPS-ammonium chloride blend
to dissolve iron sulfide scale at 150°F. The soaking time was 48 hours.

105
Dissolver Dissolver Scale
Ratio (cm3/g)
Dissolution
Capacity (48 hours)
0.4 mol/L THPS 100/1 0.09
0.4 mol/L THPS + 1 mol/L NH4Cl 100/1 0.67
0.4 mol/L THPS + 2 mol/L NH4Cl 100/1 0.67
0.75 mol/L THPS 100/1 0.12
0.75 mol/L THPS + 1 mol/L NH4Cl 100/1 0.66
0.75 mol/L THPS + 2 mol/L NH4Cl 100/1 0.96
1.9 mol/L THPS 100/1 0.10
1.9 mol/L THPS + 1 mol/L NH4Cl 100/1 0.66
1.9 mol/L THPS + 2 mol/L NH4Cl 100/1 0.96
0.4 mol/L THPS 50/1 0.08
0.4 mol/L THPS + 1 mol/L NH4Cl 50/1 0.51
0.4 mol/L THPS + 2 mol/L NH4Cl 50/1 0.51
0.75 mol/L THPS 50/1 0.10
0.75 mol/L THPS + 1 mol/L NH4Cl 50/1 0.68
0.75 mol/L THPS + 2 mol/L NH4Cl 50/1 0.91
1.9 mol/L THPS 50/1 0.09
1.9 mol/L THPS + 1 mol/L NH4Cl 50/1 0.62
1.9 mol/L THPS + 2 mol/L NH4Cl 50/1 0.99
0.4 mol/L THPS 20/1 0.06
0.4 mol/L THPS + 1 mol/L NH4Cl 20/1 0.41
0.4 mol/L THPS + 2 mol/L NH4Cl 20/1 0.41
0.75 mol/L THPS 20/1 0.07
0.75 mol/L THPS + 1 mol/L NH4Cl 20/1 0.50
0.75 mol/L THPS + 2 mol/L NH4Cl 20/1 0.71
1.9 mol/L THPS 20/1 0.05
1.9 mol/L THPS + 1 mol/L NH4Cl 20/1 0.54
1.9 mol/L THPS + 2 mol/L NH4Cl 20/1 0.74
Table 20—Effect of dissolver scale ratio on the dissolution capacity of THPS.
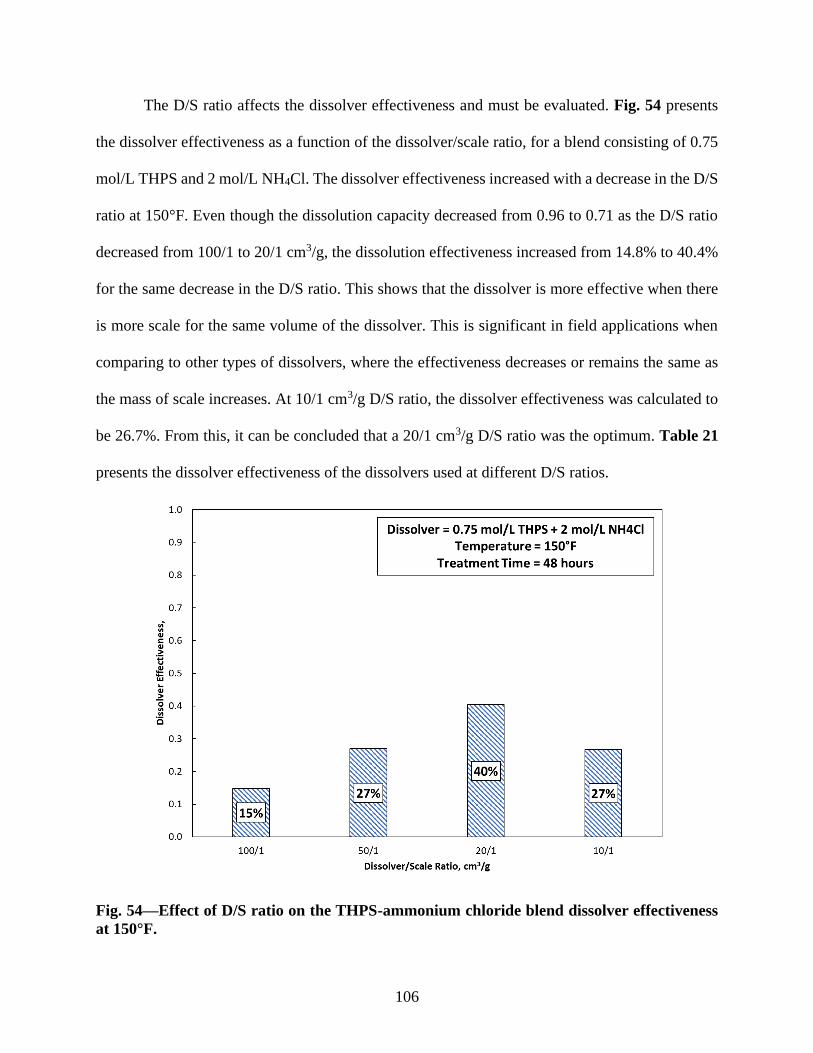
106
The D/S ratio affects the dissolver effectiveness and must be evaluated. Fig. 54 presents
the dissolver effectiveness as a function of the dissolver/scale ratio, for a blend consisting of 0.75
mol/L THPS and 2 mol/L NH4Cl. The dissolver effectiveness increased with a decrease in the D/S
ratio at 150°F. Even though the dissolution capacity decreased from 0.96 to 0.71 as the D/S ratio
decreased from 100/1 to 20/1 cm3/g, the dissolution effectiveness increased from 14.8% to 40.4%
for the same decrease in the D/S ratio. This shows that the dissolver is more effective when there
is more scale for the same volume of the dissolver. This is significant in field applications when
comparing to other types of dissolvers, where the effectiveness decreases or remains the same as
the mass of scale increases. At 10/1 cm3/g D/S ratio, the dissolver effectiveness was calculated to
be 26.7%. From this, it can be concluded that a 20/1 cm3/g D/S ratio was the optimum. Table 21
presents the dissolver effectiveness of the dissolvers used at different D/S ratios.
Fig. 54—Effect of D/S ratio on the THPS-ammonium chloride blend dissolver effectiveness
at 150°F.

107
Dissolver Dissolver Scale
Ratio (cm3/g)
Dissolution
Effectiveness (48 hours)
0.4 mol/L THPS 100/1 0.1%
0.4 mol/L THPS + 1 mol/L NH4Cl 100/1 13.4%
0.4 mol/L THPS + 2 mol/L NH4Cl 100/1 12.7%
0.75 mol/L THPS 100/1 0.2%
0.75 mol/L THPS + 1 mol/L NH4Cl 100/1 7.1%
0.75 mol/L THPS + 2 mol/L NH4Cl 100/1 14.8%
1.9 mol/L THPS 100/1 0.1%
1.9 mol/L THPS + 1 mol/L NH4Cl 100/1 2.7%
1.9 mol/L THPS + 2 mol/L NH4Cl 100/1 5.9%
0.4 mol/L THPS 50/1 0.1%
0.4 mol/L THPS + 1 mol/L NH4Cl 50/1 14.6%
0.4 mol/L THPS + 2 mol/L NH4Cl 50/1 15.0%
0.75 mol/L THPS 50/1 0.3%
0.75 mol/L THPS + 1 mol/L NH4Cl 50/1 14.9%
0.75 mol/L THPS + 2 mol/L NH4Cl 50/1 26.9%
1.9 mol/L THPS 50/1 0.1%
1.9 mol/L THPS + 1 mol/L NH4Cl 50/1 4.9%
1.9 mol/L THPS + 2 mol/L NH4Cl 50/1 12.5%
0.4 mol/L THPS 20/1 0.1%
0.4 mol/L THPS + 1 mol/L NH4Cl 20/1 23.8%
0.4 mol/L THPS + 2 mol/L NH4Cl 20/1 23.7%
0.75 mol/L THPS 20/1 0.4%
0.75 mol/L THPS + 1 mol/L NH4Cl 20/1 20.0%
0.75 mol/L THPS + 2 mol/L NH4Cl 20/1 40.4%
1.9 mol/L THPS 20/1 0.1%
1.9 mol/L THPS + 1 mol/L NH4Cl 20/1 9.3%
1.9 mol/L THPS + 2 mol/L NH4Cl 20/1 17.5%
Table 21—Effect of dissolver scale ratio on the dissolution effectiveness of THPS.

108
THPS: Effect of Salinity
Oilfield chemicals are prepared with brines having monovalent and divalent ions that may
alter the performance of the dissolvers evaluated in the laboratory, usually prepared with deionized
water. This study evaluated the dissolution capacity when the dissolvers were prepared using 5
wt% NaCl. Fig. 55 shows the dissolution capacity as a function of time for a blend of 0.4 mol/L
THPS and 1 mol/L NH4Cl. The plot showed the differences in the dissolution capacity when one
of the dissolvers is prepared with deionized water and the other with 5 wt% NaCl. There was no
change in the scale dissolution capacity until 30 hours of soaking. After 30 hours, the dissolver
prepared with 5 wt% NaCl showed a lower dissolution capacity than the same dissolver prepared
with deionized water. Brines containing Ca2+ ions should not be mixed with the THPS as it will
precipitate CaSO4 which is another difficult deposit to remove. Fig. 56 shows the calcium sulfate
precipitate when 0.4 mol/L THPS was mixed with 1 wt% CaCl2.

109
Fig. 55—Dissolution capacity of the THPS-ammonium chloride blend when it is prepared
using deionized water and when prepared using 5 wt% NaCl.

110
Fig. 56—Calcium sulfate precipitate when THPS is mixed with 1 wt% CaCl2.
THPS: Effect of Crude Oil Coating and Additives on Scale
The iron sulfide scale is an oil-wet scale and the layer of crude oil on the scale particles
may affect its solubility. In this study, a predetermined weight of iron sulfide particles was coated
with crude oil by pouring the crude oil through a filter paper containing the scale particles. 50 cm3
of crude oil was poured to ensure a good coating. The scale was then used for solubility testing.
Fig. 57 demonstrates the dissolution capacity with time for iron sulfide scale particles with and
without crude oil coating. The results indicated faster dissolution when the particles were coated
with crude oil. The maximum dissolution was also higher for the crude oil wetted scale. The
maximum dissolution capacity increased from 0.73 to 0.86 when the crude oil particles were
coated and dissolved in 0.4 mol/L THPS + 1 mol/L NH4Cl for 48 hours at 150°F. Additives such
as corrosion inhibitor and H2S scavenger did not affect the solubility of the iron sulfide scale (Fig.
58).
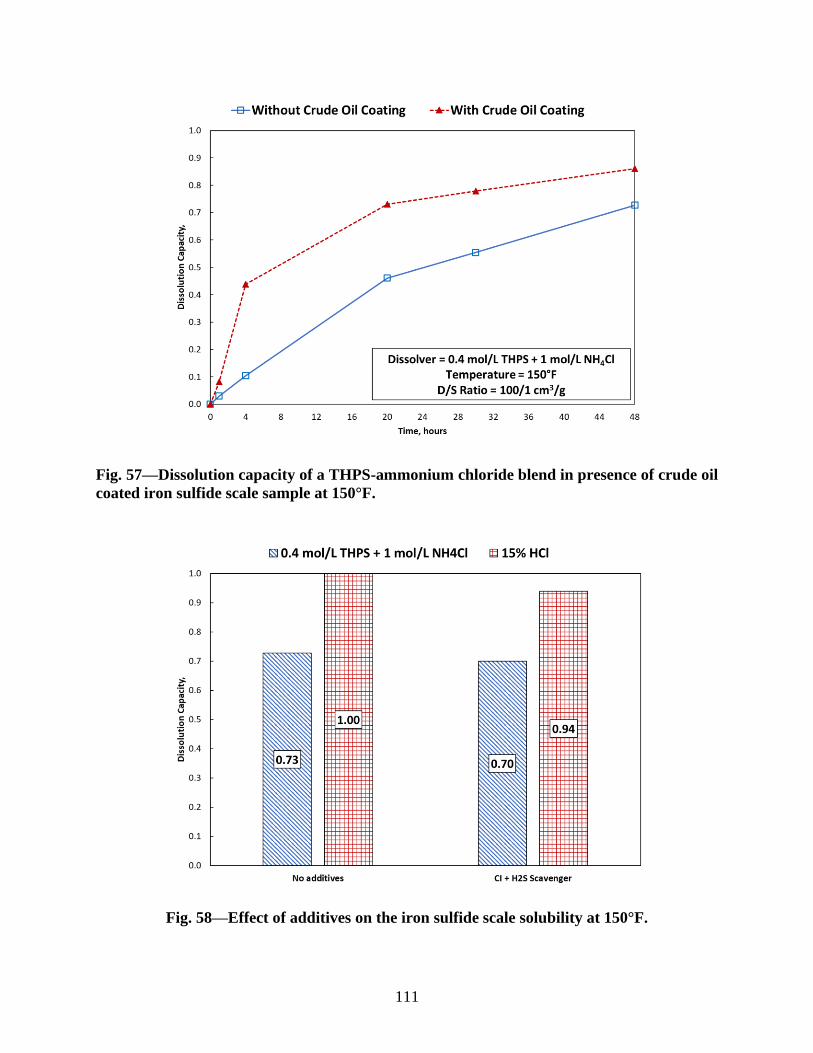
111
Fig. 57—Dissolution capacity of a THPS-ammonium chloride blend in presence of crude oil
coated iron sulfide scale sample at 150°F.
Fig. 58—Effect of additives on the iron sulfide scale solubility at 150°F.

112
THPS: Effect of Mixed Scales
In wells with significant CO2 and H2S concentration in the production stream, iron sulfide
is commonly found to be deposited with other types of scales such as calcium carbonate. The
presence of other scales can affect the solubility of iron sulfide. The selectivity of the dissolver in
removing multiple inorganic deposits was studied. When equal amounts of iron sulfide and
calcium carbonate with a D/S ratio of 50/1 cm3/g were used as a mixed scale sample, a 0.4 mol/L
THPS and 1 mol/L NH4Cl dissolver blend showed good selectivity to removing iron sulfide (Fig.
59). From the previously stated results, this dissolver blend had a dissolution capacity of 0.55 when
only iron sulfide was present. The mixed scale deposit only slightly hindered the dissolver blend
to dissolve iron sulfide. The fraction of iron sulfide dissolved in the mixed deposit sample was
calculated to be 0.47. 30% of the calcium carbonate scale was also removed from the mixed scale
deposit. The low value of solubility of calcium carbonate may be due to the conversion of calcium
carbonate to calcium sulfate in the presence of THPS. Calcium sulfate immediately precipitated,
creating a secondary problem from the dissolution process. Table 22 presents the selectivity of 0.4
mol/L THPS and 1 mol/L NH4Cl blend to remove a mixed scale deposit of iron sulfide and calcium
carbonate (1:1) at a D/S ratio of 50/1 cm3/g.

113
Fig. 59—Selectivity of the THPS-ammonium chloride blend for mixed scale samples.
1 hour 4 hours 20 hours 30 hours 48 hours
XFe 0.08 0.29 0.53 0.47 0.70
XCa 0.16 0.24 0.38 0.40 0.46
YCa-Fe 1.9 0.8 0.7 0.9 0.7
Table 22—Selectivity of 0.4 mol/L THPS and 1 mol/L NH4Cl blend in an 1:1 iron sulfide-
calcium carbonate mixed system with a D/S ratio of 50/1 cm3/g.

114
Selecting the Best Dissolver
There are certain advantages and disadvantages in using HCl, THPS-ammonium chloride
blend, or K2-DTPA to dissolve iron sulfide. Tests were conducted including solubility and
corrosion that indicated the potential of using the three dissolvers in different situations. This work
has yielded the optimum concentration, treatment time, and D/S ratio for scale removal. Also, the
impact of crude oil coated scale, presence of other salts in solution, and the presence of calcium
carbonate on the iron sulfide scale solubility was evaluated. The corrosion rate of the dissolvers
on N-80 coupons was tested at 150°F. This section will summarize the results and provide a direct
comparison to hydrochloric acid as the iron sulfide scale dissolver at 150°F.
Fig. 60 demonstrates the solubility of the crude oil wetted iron sulfide scale using THPS-
ammonium chloride blend, K2-DTPA, and 15 wt% HCl. The concentration of THPS, ammonium
chloride, K2-DTPA was 0.75, 2, and 0.4 mol/L, respectively. 1 vol% EGMBE as a mutual solvent
was added to K2-DTPA and the HCl and THPS-ammonium chloride blend was mixed with 1 vol%
mutual solvent, corrosion inhibitor, and H2S scavenger. The dissolver scale ratio was 20/1 cm3/g
and the treatment time was set at 20 hours. The scale removal after 20 hours was the highest when
15 wt% HCl was used followed by the THPS-ammonium chloride blend and the K2-DTPA. The
dissolution capacity of the HCl, THPS-ammonium chloride blend, and K2-DTPA after 20 hours of
scale treatment was 0.91, 0.6, and 0.46, respectively. However, after four hours, the dissolution
capacity of K2-DTPA was higher than the THPS-ammonium chloride blend by 110%. This is
because K2-DTPA reacts very quickly with the scale in comparison to the THPS-ammonium
chloride blend. K2-DTPA achieves its maximum dissolution capacity within the first four hours of

115
treatment. During field treatments, it is recommended to refresh the K2-DTPA solution every four
hours to achieve higher overall solubility of the scale.
Fig. 60—Comparison of dissolution capacity between the dissolvers to remove crude wetted
iron sulfide at 150°F.
In presence of calcium carbonate scale, the order of iron sulfide scale dissolution capacity
is HCl > THPS-ammonium chloride blend ≈ K2-DTPA throughout the time of treatment (Fig. 61).
It should be noted that the THPS-ammonium chloride blend would precipitate calcium sulfate and
it is not recommended to be used in the field. Overall, the alternative dissolvers perform similarly
when the mixed scale is present. Therefore, K2-DTPA is recommended over THPS-ammonium
chloride blend to dissolve mixed scales.

116
Fig. 61—Comparison of dissolution capacity between the dissolvers to remove mixed scale
deposits at 150°F. The D/S ratio is 100/1 cm3/g and the treatment time is 20 hours.
Corrosion tests indicated good protection to the N-80 coupon due to the corrosion inhibitor.
The THPS-ammonium chloride blend and HCl in presence of 1 vol% corrosion inhibitor yielded
a corrosion rate of 0.027 and 0.004 lb/ft2, respectively. The corrosion rate of K2-DTPA without a
corrosion inhibitor was 0.064 lb/ft2. H2S concentration was also measured at the end of the
corrosion tests. The H2S generated by the dissolution process using HCl was recorded to be 1,800
ppm compared to 30 and 0 ppm by K2-DTPA and THPS-ammonium chloride blend, respectively.
The high H2S concentration during the HCl treatment is a safety risk and must be moderated.
Based on the current work, a summary of the characteristics of HCl, THPS-ammonium
chloride blend, and K2-DTPA is given in Table 23. There are some advantages to using the
alternative chemicals over HCl for the iron sulfide dissolution. However, it is necessary to know
the parameters of the scale such as scale mass, composition, and presence of hydrocarbons before

117
implementing the treatment. This work has optimized the dissolver parameters to be used in the
field. The choice of using alternative chemicals such as K2-DTPA and THPS-ammonium chloride
blend also is also dependent on economics and safety.
Characteristic HCl THPS-ammonium
chloride blend K2-DTPA
Overall Dissolution Capacity
of Iron Sulfide High Moderate Moderate
H2S Generation (after
adding 1 vol% H2S
scavenger)
High No H2S Low to none
Corrosion Rate (With
Additives) Low Low
Moderate
(without CI)
Time to Reach Maximum
Dissolution Short (<1 hour) Long (20-30 hours) Short (4 hours)
Mixed Scale Removal
Potential High
Worst (Creates
precipitate with
calcium ions)
Moderate
Tolerance to Crude Oil
Wetted Scale Good tolerance Best tolerance Low tolerance
Additives Required
Corrosion
inhibitor, H2S
scavenger
Corrosion inhibitor,
H2S scavenger Mutual solvent
Table 23—Summary of dissolver characteristics.

118
CHAPTER VIII
CONCLUSIONS AND FUTURE WORK
Alternative iron-sulfide scale dissolvers are required to replace the corrosive and toxic use
of conventional HCl field treatments. The literature reveals that the understanding of iron-sulfide
scale (FeS) dissolution by chelating agents and THPS is still not well understood. The dissolver
pH, chelant concentration, dissolver/scale ratio, temperature, and treatment time are parameters
that have not been investigated in detail for iron-sulfide scale dissolution. The presence of mixed
scales and hydrocarbons can affect its solubility. The dissolver prepared for field application can
have monovalent/divalent ions. To address these gaps in the literature, the present work evaluated
the effectiveness of THPS, EDTA, HEDTA, and DTPA at various pH, dissolver concentration,
and dissolver/scale ratio to dissolve iron-sulfide scale at 150 and 300°F over a soaking time of 72
hours. Furthermore, it evaluates the role of additives such as corrosion inhibitor and H2S scavenger
on the dissolution rate of the scale. Corrosion tests were conducted to identify any metal losses
using the optimized dissolvers. The current work also introduces new synergists for the chelating
agents that could help improve the rate of dissolution. The results of this work lead to the following
conclusions:
1. At all pH levels, the maximum iron-sulfide solubility was achieved by DTPA
followed by HEDTA and EDTA amongst the aminopolycarboxylic acids.
2. At 150°F, iron-sulfide scale dissolution was maximum at pH < 5, at which 99% of
the iron from the iron-sulfide scale was dissolved by 0.2 mol/L K2-DTPA with a pH
3.5.
3. At pH > 5 and 150°F, the iron-sulfide dissolution capacity did not exceed 36%.
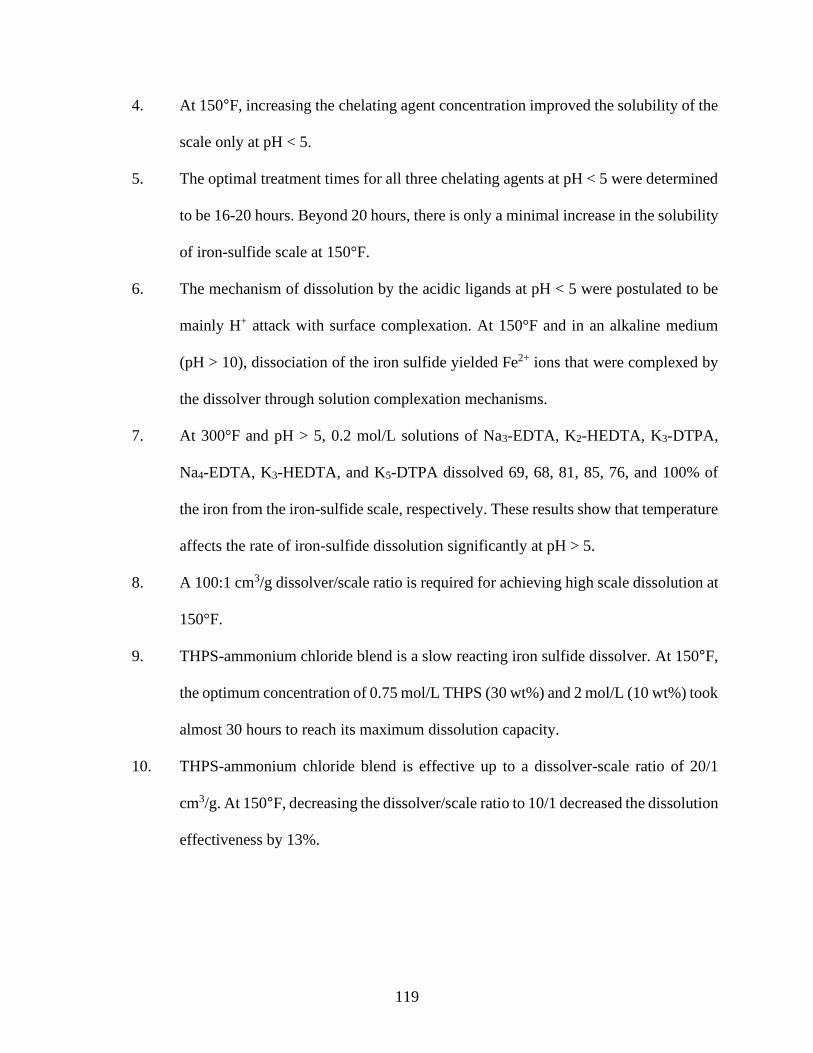
119
4. At 150°F, increasing the chelating agent concentration improved the solubility of the
scale only at pH < 5.
5. The optimal treatment times for all three chelating agents at pH < 5 were determined
to be 16-20 hours. Beyond 20 hours, there is only a minimal increase in the solubility
of iron-sulfide scale at 150°F.
6. The mechanism of dissolution by the acidic ligands at pH < 5 were postulated to be
mainly H+ attack with surface complexation. At 150°F and in an alkaline medium
(pH > 10), dissociation of the iron sulfide yielded Fe2+ ions that were complexed by
the dissolver through solution complexation mechanisms.
7. At 300°F and pH > 5, 0.2 mol/L solutions of Na3-EDTA, K2-HEDTA, K3-DTPA,
Na4-EDTA, K3-HEDTA, and K5-DTPA dissolved 69, 68, 81, 85, 76, and 100% of
the iron from the iron-sulfide scale, respectively. These results show that temperature
affects the rate of iron-sulfide dissolution significantly at pH > 5.
8. A 100:1 cm3/g dissolver/scale ratio is required for achieving high scale dissolution at
150°F.
9. THPS-ammonium chloride blend is a slow reacting iron sulfide dissolver. At 150°F,
the optimum concentration of 0.75 mol/L THPS (30 wt%) and 2 mol/L (10 wt%) took
almost 30 hours to reach its maximum dissolution capacity.
10. THPS-ammonium chloride blend is effective up to a dissolver-scale ratio of 20/1
cm3/g. At 150°F, decreasing the dissolver/scale ratio to 10/1 decreased the dissolution
effectiveness by 13%.

120
11. K2-DTPA can be used to dissolve mixed scales containing calcium carbonate. THPS-
ammonium chloride blend precipitates calcium sulfate and must not be used when
calcium-containing scales are present.
12. Scale solubility was unaffected by the use of the specific corrosion inhibitor and H2S
scavenger in this paper.
13. When crude oil-coated scale samples are present, K2-DTPA’s dissolution capacity is
affected. There was an 8% decrease in the overall dissolution capacity of the 0.4
mol/L dissolver solution when the scale was coated with crude oil. THPS-ammonium
chloride blend’s dissolution capacity was unaffected with the crude oil-coated scale.
14. K2-DTPA can replace HCl where H2S generation is a safety risk. A solution of 0.4
mol/L K2-DTPA with 1 vol% mutual solvent with a refresh time of 4 hours can be
used to remove iron sulfide scales with no reprecipitation or H2S generation issues.
15. Potassium iodide and potassium citrate are good synergists to Na2-EDTA at 150°F.
In addition to those two synergists, sodium fluoride can also be added to Na4-EDTA
and K5-DTPA for enhancing the iron sulfide scale dissolution at 300°F.
Based on this investigation, the authors recommend the use of 0.2 mol/L DTPA at pH < 5 at
150°F to obtain maximum solubility of iron-sulfide scale. The treatment time must not exceed 20
hours and the dissolver must be refreshed to ensure continued dissolution of the scale. At 300°F,
0.2 mol/L K5-DTPA with pH 11.6 can be used instead of its acidic counterpart to dissolve the iron-
sulfide scale without H2S generation. The current work defines best possible conditions for the
applicability of the alternative dissolvers in the field. It also provides the negative ramifications of
adopting the alternative dissolvers such as long treatment times and incompatibility/precipitation
121
issues. Chemical companies will benefit from new synergistic blends reported in this paper. The
present work also provides valuable experimental data for future modeling and simulation studies.
Future work could include the investigation of biodegradable chelating agents such as L-
Glutamic Acid, N-N Diacetic acid and N-(1-carboxylatoethyl)iminodiacetate for the iron sulfide
scale dissolution. The benefits of other synergists like acetic acid derivatives could also be tested.
Real field scales containing numerous types of deposits could be used to formulate a dissolver
composition.

122
REFERENCES
Al-khaldi M. H., AlJuhani, A., Al-Mutairi, S. H., et al. 2011. New Insights into the Removal of
Calcium Sulfate Scale. Presented at the SPE European Formation Damage Conference,
Noordwijk, The Netherlands, 7-10 June. SPE-144158-MS. https://doi.org/10.2118/144158-
MS.
Aljeban, N., Chen, T., and Balharth, S. 2018. Kinetics Study of Iron Sulfide Scale Dissolution.
Presented at the Abu Dhabi International Petroleum Exhibition and Conference, Abu Dhabi,
UAE, 12-15 November. SPE-192675-MS. https://doi.org/10.2118/192675-MS.
Almubarak, T., Ng, J. H., and Nasr-El-Din, H. A. 2017a. Oilfield Scale Removal by Chelating
Agents: An Aminopolycarboxylic Acids Review. Presented at the SPE Western Regional
Meeting, Bakersfield, California, 23-27 April. SPE-185636-MS.
https://doi.org/10.2118/185636-MS.
Almubarak, T., Ng, J. H., and Nasr-El-Din, H. A. 2017b. Chelating Agents in Productivity
Enhancement: A Review. Presented at the SPE Oklahoma City Oil and Gas Symposium,
Oklahoma City, Oklahoma, 27-31 March. SPE-185097-MS. https://doi.org/10.2118/185097-
MS.
Buali, M., Ginest, N., Leal, J., et al. 2014. Extreme Challenges in FeS Scale Cleanout Operation
Overcome using Temporary Isolation, High Pressure Coiled Tubing, and Tailored Fluid
Systems. Presented at the SPE International Oilfield Scale Conference and Exhibition,
Aberdeen, Scotland, United Kingdom, 14-15 May. SPE-169759-MS.
https://doi.org/10.2118/169759-MS.

123
Buijs, W., Hussein, I. A., Mahmoud, M. et al. 2018. Molecular Modeling Study Toward
Development of H2S-free Removal of Iron Sulfide Scale from Oil and Gas Wells. Industrial &
Engineering Chemistry Research 57 (31): 10095-10104.
https://doi.org/10.1021/acs.iecr.8b01928.
Chang, H. C. and Matijević, E. 1983. Interactions of Metal Hydrous Oxides with Chelating Agents:
IV. Dissolution of Hematite. J. Colloid and Interface Science 92 (2): 479-488.
https://doi.org/10.1016/0021-9797(83)90169-8.
Chen, T., Wang, Q., Chang, F. F., et al. 2016. New Developments in Iron Sulfide Scale Dissolvers.
Presented at CORROSION 2016, Vancouver, Canada, 6-10 March. NACE-2016-7264.
Chen, T., Wang, Q., Chang, F., et al. 2017. Multi-Functional and Non-Acidic Iron Sulfide Scale
Dissolver for Downhole Applications. Presented at the Abu Dhabi International Petroleum
Exhibition and Conference, Abu Dhabi, UAE, 13-16 November. SPE-188924-MS.
https://doi.org/10.2118/188924-MS.
Chen, T., Wang, Q., Chang, F. et al. 2018. Iron Sulfide Deposition in Sour Gas Wells: A Corrosion
Induced Scale Problem. Presented at the SPE International Oilfield Corrosion Conference and
Exhibition, Aberdeen, Scotland, UK, 18-19 June. SPE-190910-MS.
https://doi.org/10.2118/190910-MS.
Chen, T., Wang, Q., Chang, F. et al. 2019. Recent Development and Remaining Challenges of Iron
Sulfide Scale Mitigation in Sour-Gas Wells. SPE Prod & Oper. SPE-199365-PA (in press;
posted December 2019). https://doi.org/10.2118/199365-PA.
Cord-Ruwisch, R., Kleinitz, W. and Widdel, F. 1987. Sulfate-reducing Bacteria and Their
Activities in Oil Production. J Pet Technol 39 (01): 97-106. SPE-13554-PA.
https://doi.org/10.2118/13554-PA.

124
Dean, J. A. 1999. Properties of Atoms, Radicals, and Bonds. In Lange’s Handbook of Chemistry,
fifteenth edition. New York, New York: McGraw-Hill, Inc.
Dunn, K. and Yen, T. F. 1999. Dissolution of Barium Sulfate Scale Deposits by Chelating Agents.
Environmental Science & Technology 33 (16): 2821-2824. https://doi.org/10.1021/es980968j.
Elkatatny, S. 2017. New Formulation for Iron Sulfide Scale Removal. Presented at the SPE Middle
East Oil & Gas Show and Conference, Manama, Kingdom of Bahrain, 6-9 March. SPE-183914-
MS. https://doi.org/10.2118/183914-MS.
Espinosa G, M. A., Leal, J. A., Driweesh, S. M., et al. 2016. First Time Live Descaling Operation
in Saudi using Coiled Tubing Fiber Optic Real-Time Telemetry Rugged Tool, Foamed Fluid
and Pressure Fluid Management System. Presented at the SPE Kingdom of Saudi Arabia
Annual Technical Symposium and Exhibition, Dammam, Saudi Arabia, 25-28 April. SPE-
182763-MS. https://doi.org/10.2118/182763-MS.
Ford, W. G. F., Walker, M. L., Halterman, M. P., et al. 1992. Removing a Typical Iron Sulfide
Scale: The Scientific Approach. Presented at the SPE Rocky Mountain Regional Meeting,
Casper, Wyoming, 18-21 May. SPE-24327-MS. https://doi.org/10.2118/24327-MS.
Franco, C. A., Al-Marri, H. M., Al-Asiri, M. A., et al. 2008. Understanding The Nature Of The
Mineral Scale Problems In Ghawar Gas Condensate Wells To Describe And Apply The Right
Approach Of Mitigation. Presented at the CORROSION 2008, New Orleans, Louisiana, 16-20
March. NACE-08347.
Fredd, C. N. and Fogler, H. S. 1996. Alternative Stimulation Fluids and Their Impact on Carbonate
Acidizing. Presented at the SPE Formation Damage Control Symposium, Lafayette, Louisiana,
14-15 February. SPE-31074-MS. https://doi.org/10.2118/31074-MS.

125
Frenier, W. W. 2001. Novel Scale Removers Are Developed for Dissolving Alkaline Earth
Deposits. Presented at the SPE International Symposium on Oilfield Chemistry, Houston,
Texas, 13-16 February. SPE-65027-MS. https://doi.org/10.2118/65027-MS.
Frenier, W. W. 2002. Scale Control Slides. Sugarland, Texas: Schlumberger Well Services.
Geri, B., Salem, B., Mahmoud, M. A., et al. 2017. Evaluation of Barium Sulfate (Barite) Solubility
Using Different Chelating Agents at a High Temperature. J. Petroleum Science and Technology
7 (1): 42-56. https://doi.org/10.22078/jpst.2017.707.
Gilbert, P. D., Grech, J. M., and Talbot, R. E. 2002. Tetrakis (Hydroxymethyl) Phosphonium
Sulfate (THPS) for Dissolving Iron Sulfides Downhole and Topside. Presented at
CORROSION 2000, Denver, Colorado, 7-11 April. NACE-02030.
Graham, G. M. and Mackay, E. J. 2004. A Background to Inorganic Scaling-Mechanism
Formation and Control. Short Course. Presented in the SPE Formation Damage Symposium,
Lafayette, Louisiana, 17 February.
Hall, B. E. and Dill, W. R. 1988. Iron Control Additives for Limestone and Sandstone Acidizing
of Sweet and Sour Wells. Presented at the SPE Formation Damage Control Symposium,
Bakersfield, California, 8-9 February. SPE-17157-MS. https://doi.org/10.2118/17157-MS.
Harris, C. 2007. Quantitative Chemical Analysis, seventh edition. China Lake, California: Craig
Bleyer.
Hafiz, T., Hoegerl, M., AlSuwaij, A., et al. 2017. Synthetic Iron Sulfide Scale and Polymeric Scale
Dissolvers. Presented at the SPE Middle East Oil & Gas Show and Conference, Manama,
Kingdom of Bahrain, 6-9 March. SPE-183954-MS. https://doi.org/10.2118/183954-MS.

126
Hajj, H. E., Peng, Y., Fan, C. et al. 2015. A Systematic Approach to Dissolve Iron Sulfide Scales.
Presented at the SPE Middle East Oil and Gas Show and Conference, Manama, Kingdom of
Bahrain, 8-11 March. SPE-172794-MS. https://doi.org/10.2118/172794-MS.
Hussein, A.E. and Mohamed, H.S. 2017. Studying the Use of Tetrakis (hydroxymethyl)
Phosphonium Sulfate (THPS) as Zinc Sulfide and Lead Sulfide Scales Dissolver and the Factors
Influencing the Dissolution. International Journal of Corrosion and Scale Inhibition 6 (3): 349-
358. https://doi.org/10.17675/2305-6894-2017-6-3-9.
Jeffery, J. C., Odell, B., Stevens, N. et al. 2000. Self-Assembly of a Novel Water-Soluble Iron(II)
Macrocyclic Phosphine Complex from Tetrakis (Hydroxymethyl) Phosphonium Sulfate and
Iron(II) Ammonium Sulfate: Single Crystal X-Ray Structure of the Complex
[Fe(H2O)2RP(CH2N(CH2PR2)CH2)2PR]SO4·4H2O (R = CH2OH). Chemical
Communications 1: 101-102. http://dx.doi.org/10.1039/a908309j.
Jones, C. R., Collins, G. R., Downward, B. L., et al. 2008. Thps: A Holistic Approach to Treating
Sour Systems. Presented at the CORROSION 2008, New Orleans, Louisiana, 16-20 March.
NACE-08659.
Jones, C., Downward, B., Edmunds, S. et al. 2012. Thps: A Review of the First 25 Years, Lessons
Learned, Value Created and Visions for the Future. Presented at CORROSION 2012, Salt Lake
City, Utah, 11-15 March. NACE-2012-1505.
Kamal, M. S., Hussein, I., Mahmoud, M. et al. 2018. Oilfield Scale Formation and Chemical
Removal: A Review. J. Pet. Sci. Eng. 171: 127-139.
https://doi.org/10.1016/j.petrol.2018.07.037.

127
Kasnick, M. A. and Engen, R. J. 1989. Iron Sulfide Scaling and Associated Corrosion in Saudi
Arabian Khuff Gas Wells. Presented at the Middle East Oil Show, Bahrain, 11-14 March. SPE-
17933-MS. https://doi.org/10.2118/17933-MS.
Kudrashou, V. Y. and Nasr-El-Din, H. A. 2019. Formation Damage and Compatibility Issues
Associated with Use of Corrosion Inhibitors in Well Acidizing: A Review. Presented at the
SPE/ICoTA Coiled Tubing and Well Intervention Conference and Exhibition, The Woodlands,
Texas, 26-27 March. SPE-194301-MS. http://dx.doi:10.2118/194301-MS.
Lakatos, I., Lakatos-Szabo, J., and Kosztin, B. 2002. Optimization of Barite Dissolvers by Organic
Acids and pH Regulation. Presented at the International Symposium on Oilfield Scale,
Aberdeen, United Kingdom, 30-31 January. SPE-74667-MS. https://doi.org/10.2118/74667-
MS.
Leal, J. A., Solares, J. R., Nasr-El-Din, H. A., et al. 2007. A Systematic Approach to Remove Iron
Sulphide Scale: A Case History. Presented at the SPE Middle East Oil and Gas Show and
Conference, Manama, Bahrain, 11-14 March. SPE-105607-MS.
https://doi.org/10.2118/105607-MS.
LePage, J., Wolf, C. D., Bemelaar, J. et al. 2011. An Environmentally Friendly Stimulation Fluid
for High-Temperature Applications. SPE J. 16 (01): 104-110. SPE-121709-PA.
https://doi.org/10.2118/121709-PA.
Liu, Y., Zhang, Z., Bhandari, N. et al. 2017. New Approach to Study Iron Sulfide Precipitation
Kinetics, Solubility, and Phase Transformation. Industrial & Engineering Chemistry Research
56 (31): 9016-9027. https://doi.org/10.1021/acs.iecr.7b01615.
Mahmoud, M. A., Kamal, M., Bageri, B. S., et al. 2015. Removal of Pyrite and Different Types of
Iron Sulfide Scales in Oil and Gas Wells without H2S Generation. Presented at the International

128
Petroleum Technology Conference, Doha, Qatar, 6-9 December. IPTC-18279-MS.
https://doi.org/10.2523/IPTC-18279-MS.
Mahmoud, M., Hussein, I. A., Sultan, A. et al. 2018. Development of Efficient Formulation for
the Removal of Iron Sulfide Scale in Sour Production Wells. The Canadian J. Chemical
Engineering 96 (12): 2526-2533. https://doi.org/10.1002/cjce.23241.
Martell, A. E., Motekaitis, R. J., Chen, D. et al. 1996. Selection of new Fe(III)/Fe(II) Chelating
Agents as Catalysts for the Oxidation of Hydrogen Sulfide to Sulfur by Air. Canadian J.
Chemistry 74 (10): 1872-1879. https://doi.org/10.1139/v96-210.
Mirza, M. S. and Prasad, V. 1999. Scale Removal in Khuff Gas Wells. Presented at the Middle
East Oil and Show Conference, Bahrain, 20-23 February. SPE-53345-MS.
https://doi.org/10.2118/53345-MS.
Morse, J. W. and Cornwell, J. C. 1987. Analysis and Distribution of Iron Sulfide Minerals in
Recent Anoxic Marine Sediments. Marine Chemistry 22 (1): 55-69.
https://doi.org/10.1016/0304-4203(87)90048-X.
Morris, R. L. and Paul, J. M. 1992. Sulfate Scale Dissolution. U.S. Patent 5,084,105.
Moulin, C., Amekraz, B., Steiner, V. et al. 2003. Speciation Studies on DTPA Using the
Complementary Nature of Electrospray Ionization Mass Spectrometry and Time-resolved
Laser-induced Fluorescence. Applied Spectroscopy 57 (9): 1151-1161.
https://doi.org/10.1366/00037020360696026.
Murcia, D. C. F., Fosbøl, P. L., and Thomsen, K. 2018. Measurement of Iron and Lead Sulfide
Solubility Below 100°C. Fluid Phase Equilibria 475: 118-126.
https://doi.org/10.1016/j.fluid.2018.07.033.

129
Nasr-El-Din, H. A., Fadhel, B. A., Al-Humaidan, A. Y. et al. 2000a. An Experimental Study of
Removing Iron Sulfide Scale from Well Tubulars. Presented at the International Symposium
on Oilfield Scale, Aberdeen, United Kingdom, 26-27 January. SPE-60205-MS.
https://doi.org/10.2118/60205-MS.
Nasr-El-Din, H. A., Al-Humaidan, A. Y., Fadhel, B. A. et al. 2000b. Effect of Acid Additives on
the Efficiency of Dissolving Iron Sulfide Scale. Presented at CORROSION 2000, Orlando,
Florida, 26-31 March. NACE-00439.
Nasr-El-Din, H. A. and Al-Humaidan, A. Y. 2001. Iron Sulfide Scale: Formation, Removal, and
Prevention. Presented at the International Symposium on Oilfield Scale, Aberdeen, United
Kingdom, 30-31 January. SPE-68315-MS. https://dx.doi.org/10.2118/68315-MS.
Onawole, A. T., Hussein, I. A., Sultan, A. et al. 2019. Molecular and Electronic Structure
Elucidation of Fe2+/Fe3+ Complexed Chelators Used in Iron Sulfide Scale Removal in Oil and
Gas Wells. Can J Chem Eng 97 (7): 2021-2027. https://doi.org/10.1002/cjce.23463.
Patel, D., Ramanathan, R., and Nasr-El-Din, H. A. 2019. Optimization and Thermal Stability of
the THPS and NH4Cl Blend to Dissolve Iron Sulfide FeS Scale at HPHT Conditions. Presented
at the Abu Dhabi International Petroleum Exhibition & Conference, Abu Dhabi, UAE, 11-14
November. SPE-197632-MS. https://doi.org/10.2118/197632-MS.
Paul, J. M., and Fieler, E. R. 1992. A New Solvent for Oilfield Scales. Presented at the SPE Annual
Technical Conference and Exhibition, Washington, D.C., 4-7 October. SPE-24847-MS.
https://doi.org/10.2118/24847-MS.
Paul, J. M. and Morris, R. L. 1994. Composition for Removing an Alkaline Earth Metal Sulfate
Scale. U.S. Patent 5,282,995.

130
Perry IV, T. D., Duckworth, O. W., Kendall, T. A. et al. 2005. Chelating Ligand Alters the
Microscopic Mechanism of Mineral Dissolution. J. American Chemical Society 127 (16): 5744-
5745. https://doi.org/10.1021/ja042737k.
Przybylinski, J. L. 2001. Iron Sulfide Scale Deposit Formation and Prevention under Anaerobic
Conditions Typically Found in the Oil Field. Presented at the SPE International Symposium on
Oilfield Chemistry, Houston, Texas, 13-16 February. SPE-65030-MS.
https://dx.doi.org/10.2118/65030-MS.
Putnis, A., Putnis, C., and Paul, J. 1995. The Efficiency of a DTPA-Based Solvent in the
Dissolution of Barium Sulfate Scale Deposits. Presented at the SPE International Symposium
on Oilfield Chemistry, San Antonio, Texas, 14-17 February. SPE-29094-MS.
https://doi.org/10.2118/29094-MS.
Ramanathan, R. S., Nasr-El-Din, H. A., Zakaria, A. S. 2020. New Insights into the Dissolution of
Iron Sulfide Using Chelating Agents. SPE J. 25 (06): 3145-3159. SPE-202469-PA.
https://doi.org/10.2118/202469-PA.
Ramanathan, R. and Nasr-El-Din, H. A. 2021. A Comparative Experimental Study of Alternative
Iron Sulfide Scale Dissolvers in the Presence of Oilfield Conditions and Evaluation of New
Synergists to Aminopolycarboxylic Acids. SPE J. SPE-205005-PA (in press; posted 13 January
2021). https://doi.org/10.2118/205005-PA.
Ramachandran, S., Al-Muntasheri, G., Leal, J. et al. 2015. Corrosion and Scale Formation in High
Temperature Sour Gas Wells: Chemistry and Field Practice. Presented at the SPE International
Symposium on Oilfield Chemistry, The Woodlands, Texas, 13-15 April. SPE-173713-MS.
https://doi.org/10.2118/173713-MS.
131
Reyes-Garcia, E. and Holan, K. H. 2020. Removing Scale Damage with Fast-Acting Anhydrite
CaSO4 Removal System. Presented at the SPE International Conference and Exhibition on
Formation Damage Control, Louisiana, New Orleans, 19-21 February. SPE-199304-MS.
https://doi.org/10.2118/199304-MS.
Rickard, D. and Luther, G. W. 2007. Chemistry of Iron Sulfides. Chemical Reviews 107 (2): 514-
562. https://doi.org/10.1021/cr0503658.
Rincón, P. R., Vinccler, B., McKee, J. P., et al. 2004. Biocide Stimulation in Oilwells for
Downhole Corrosion Control and Increasing Production. Presented at the 1st International
Symposium on Oilfield Corrosion, Aberdeen, United Kingdom, 28 May. SPE-87562-MS.
https://doi.org/10.2118/87562-MS.
Smith, J. S. and Miller, J. D. A. 1975. Nature of Sulphides and their Corrosive Effect on Ferrous
Metals: A Review. British Corrosion Journal 10 (3): 136-143.
https://doi.org/10.1179/000705975798320701.
Smith, S. N. and Pakalapati, R. 2004. Thirty Years of Downhole Corrosion Experience at Big
Escambia Creek: Corrosion Mechanisms and Inhibition. Presented at the CORROSION 2004,
New Orleans, Louisiana, 28 March-1 April. NACE-04744.
Sokhanvarian, K., Nasr-El-Din, H. A., and Wolf, C. A. 2016. Thermal Stability of Oilfield
Aminopolycarboxylic Acids/Salts. SPE Prod & Ops 31 (01): 12-21. SPE-157426-PA.
https://doi.org/10.2118/157426-PA.
Spencer, C. 1958. The Chemistry of Ethylenediamine Tetra-acetic Acid in Sea Water. J. Marine
Biological Association of the United Kingdom 37 (1): 127-144.
https://doi.org/10.1017/S0025315400014880.
132
Talbot, R. E., Larsen, J., and Sanders, P. F. 2000. Experience with the Use of
Tetrakishydroxymethylphosphonium Sulfate (THPS) for the Control of Downhole Hydrogen
Sulfide. Presented at CORROSION 2000, Orlando, Florida, USA, 26-31 March. NACE-00123.
Tate, R. D. 1997. Composition for Removing Scale. U.S. Patent 5,685,918.
Thomas, J. E., Smart, R. S. C., and Skinner, W. M. 2000. Kinetic Factors for Oxidative and Non-
oxidative Dissolution of Iron Sulfides. Minerals Engineering 13 (10-11): 1149-1159.
https://doi.org/10.1016/S0892-6875(00)00098-4.
Torres, R., Blesa, M. A. and Matijević, E. 1989. Interactions of Metal Hydrous Oxides with
Chelating Agents: VIII. Dissolution of Hematite. J. Colloid and Interface Science 131 (2): 567-
579. https://doi.org/10.1016/0021-9797(89)90199-9.
Walker, M. L., Dill, W. R., Besler, M. R. et al. 1991. Iron Control in West Texas Sour-Gas Wells
Provides Sustained Production Increases. J Pet Technol 43 (05): 603-607. SPE-20122-PA.
https://dx.doi.org/10.2118/20122-PA.
Wang, K. S., Resch, R., Dunn, K. et al. 1999. Dissolution of the Barite (001) Surface by the
Chelating Agent DTPA as Studied with Non-Contact Atomic Force Microscopy. Colloids and
Surfaces A: Physicochemical and Engineering Aspects 160 (3): 217-227.
https://doi.org/10.1016/S0927-7757(99)00183-1.
Wang, X., Qu, Q., Berry, S. et al. 2013. Iron Sulfide Removal: A Nonacidic Alternative to
Hydrochloric Acid Treatment. Presented at the SPE European Formation Damage Conference
& Exhibition, Noordwijk, The Netherlands, 5-7 June. SPE-165199-MS.
https://doi.org/10.2118/165199-MS.
Wang, Q., Shen, S., Badairy, H., et al. 2015. Laboratory Assessment of Tetrakis (hydroxymethyl)
Phosphonium Sulfate as Dissolver for Scales Formed in Sour Gas Wells. International Journal
133
of Corrosion and Scale Inhibition 4 (3): 235-254. https://doi.org/10.17675/2305-6894-2015-4-
3-235-254.
Wang, Q., Leal, J., Syafii, I., et al. 2016. Iron Sulfide and Removal in Scale Formation Sour Gas
Wells. Presented at the SPE International Oilfield Scale Conference and Exhibition, Aberdeen,
Scotland, United Kingdom, 11-12 May. SPE-179869-MS. https://doi.org/10.2118/179869-MS.
Wang, Q., Chen, T., Chang, F. F., et al. 2017. Iron Sulfide Scale Dissolver for Downhole
Application: Where Are We Now? Presented at the SPE International Conference on Oilfield
Chemistry, Montgomery, Texas, USA, 3-5 April. SPE-184513-MS.
https://doi.org/10.2118/184513-MS.
Wylde, J. J. and Winning, I. G. 2004. Challenges and Solutions Associated with the Development
of a Iron Scale Dissolver Chemistry. Presented at CORROSION 2004, Louisiana, New Orleans,
28 March-1 April. NACE-04730.
Wylde, J. J., Okocha, C., Bluth, M. et al. 2015. Iron Sulfide Inhibition: Field Application of an
Innovative Polymeric Chemical. Presented at the SPE International Symposium on Oilfield
Chemistry, The Woodlands, Texas, USA, 13-15 April. SPE-173730-MS.
https://doi.org/10.2118/173730-MS.
Wylde, J. J., Okocha, C., Smith, R. et al. 2016. Dissolution of Sulfide Scale: A Step Change with
a Novel, High Performance, Non-Mineral Acid Chemical. Presented at the SPE International
Oilfield Scale Conference and Exhibition, Aberdeen, Scotland, United Kingdom, 11-12 May.
SPE-179880-MS. https://dx.doi.org/10.2118/179880-MS.
Yap, J., Fuller, M. J., Schafer, L. A., et al. 2010. Removing Iron Sulfide Scale: A Novel Approach.
Presented at the Abu Dhabi International Petroleum Exhibition & Conference, Abu Dhabi,
UAE, 1-4 November. SPE-138520-MS. https://doi.org/10.2118/138520-MS.

134
Yu, T., Yang, X., Yuan, J., et al. 2016. Preparation and Performance Evaluation of a Highly
Effective Barium Sulfate Descaling System Based on Ammonium Carboxy Chelating Agent
DTPA. Russian Journal of Applied Chemistry 89 (7): 1145-1157.
https://doi.org/10.1134/S1070427216070156.
Zaid, G. H. and Wolf, B. A. 2001. Composition for Dissolving Metal Sulfates. U.S. Patent
6,331,513.