Fundamentals of Finance
19
1
-
Upload
khangminh22 -
Category
Documents
-
view
0 -
download
0
Transcript of Fundamentals of Finance

1

Fundamentals of
Finance
CASH IS KING
By: Angel Cordero Rico BBA-MBA 2
6th of March 2018

Fundamentals of
Finance
CASH IS KING
By: Angel Cordero Rico BBA-MBA 3
6th of March 2018

Fundamentals of Finance
Summary
80% of bankruptcy is due to informal and incompetent operationalmanagement
It is crutial to fix the concept of Operational Working Capital (moneyretained that needs to be financed). You can get actual large profit BUT absolutely lack of CASH. If you know that Profit is not equal to CASH, there is no problem: you can plan and finance that deficit. Problems
arise when you are not aware of that. CASH IS KING4

Quick Review
Analysis Decision Making Outcomes
Potential Detection Potential IntegrationPotential
Enhance.5
Mision Business Definition
Vision Business Portofolio Strategy
Values Competitive Strategy
Growth Strategy
S. Objectives
Strategies
Funtionals
Operational Decisions
Corporate Strategies
3º STEP
Action Plans
Prioritization Plans
& Actions
Budget &
P&L Forecasts
Eviromental
Analysis
Internal Analysis
Diagnosis
1º STEP
Strategic Decisions
Strategic
Objectives
System
2º STEP

2. DIAGNOSIS
INTERNAL COMPANY
Size Analisis Funcional Portofolio &
Activity Factores Clave Éxito Activities
Sector Cadena de Valor
Organizatinal Struct. Tech
Objectives (current)
Strategy (today) EXTERNAL BUSINESS
Profit Demanda SBUs
Equity Oferta LYFE CYCLE
Problems Intensidad Competitiva Experiencie
Challenges SI / NO Competencia Leader positioning
SBUs
4. DIAGNOSIS 5. ANALYSIS
6.
FUNDAMEN
TAL
COMPETEN
CIES
1. COMPANY DATA
Strategic
GLOBAL
STRATEGIC ANALYSIS PROCESS 3. Vs
COMPETITOR
S

Strategy & Objectives
High Level
OBJECTIVES FUNCTIONAL PROCESS SCENARIOS OUTCOME DECISION
INVESTMENT
Volume
Rate & Pace Alternative 1
Type Alternative 2
Disinvestment Alternative 3
FINANCING
EQUITY Alternative 1
LONG TERMS LIABILITY Alternative 2
SHORT TERM LIABILITY Alternative 3
STRUCTURE
Amortization Alternatie 1
Extension Alternative 2
Flexibility Alternative 3
Outsourcing
STRATEGIC
DECISION
ANALYSIS
STRATEGIC
DECISIONS
STABLESupplies
Financial
Structure
Overheads
INTENSE
CRISIS
MODERATE
CRISIS
Profitability
Positioning
Optimal
Dimension
Balanced
Financial
Strcuture
Type of
Product
Revenue
% UNCERTAINTY

Fundamentals of Finance
Any strategy must be quantified.
During the strategic process at a very high level: rule of a thumb
Once the project advances, it will be adopting more and moregranularity.
And every period, we measure against forecast, baselines and soon.
As uncertainty decreases, more detail is available…

Financial Structure
Long Term & Short Term Equity & External capital
Metrics
Time Value of Money (IRR) SeeExcel File.Value Generation (NPV)
3 FINANCIAL STATEMENTS
INCOME
BALANCE
CASH FLOW

Income Statement: Cumulativeperiod of time
Metrics (See Excel File)ROI, ROE, ROS
Income Statement
Current
Period:
Before After
Changes: Changes:
Revenue: 1.300$ 1.300$
Cost of Goods Sold (COGS): 100 100
Gross Profit: 1.200 1.200
Operating Expenses: 200 200
Depreciation: - -
Stock-Based Compensation: - -
Amortization of Intangibles: - -
Operating Income: 1.000 1.000
(+) Interest Income: - -
(-) Interest Expense: - -
Gain / (Loss) on Sale of PP&E: - -
Gain / (Loss) on Sale of ST Inv.: - -
(-) Goodwill Impairment: - -
(-) PP&E Write-Down: - -
Pre-Tax Income: 1.000 1.000
Income Tax Provision: 300 300
Current Portion of Taxes: 300 300
Deferred Portion of Taxes: - -
Net Income: 700 700
(-) Preferred Dividends: - -
Net Income to Common: 700$ 700$
ROS = Return On Sales
= 700 / 1300 = 53,8%

Income Statement: Cumulativeperiod of timeMetrics (See Excel File)ROI, ROE, ROS
ROS = Return On Sales
= 700 / 1300 = 53,8%
What integrates IncomeStatement:
To appear on the Income Statement, each item must meet the following criteria:
1. It must correspond to ONLY the period shown on the Income Statement. If you’re paying for an asset that will last for 10-20 years, the initial money spent would not appear on a 1-year Income Statement. But your monthly rent would appear.
2. It must affect the company’s taxes. For example, interest paid on debt is tax-deductible, so it appears on the Income Statement. But repaying debt principal is not tax-deductible, so it does not appear on the Income Statement.
Always Appears: Revenue, COGS, Operating Expenses, Depreciation, Amortization, Stock-Based Compensation, Interest Income and Expense, Gains / (Losses), Write-Downs, Impairments, Other Income / (Expenses), Taxes, and Net Income.
Never Appears: Capital Expenditures, Purchasing or Selling Investments or PP&E (Plants, Property & Equipment), Dividends, Issuing orRepaying Debt Principal, Issuing or Repurchasing Shares, and Changes to Balance Sheet Items such as Cash, Debt, Accounts Receivable, or
Accounts Payable.

Balance Sheet
Metrics (See Excel File)ROI, ROE, ROS
ROI = Return OnInvestment (Asset)= 700 / 2,000 = 35%
ROE = Return On Equity = 700/ 1000 = 70%
Balance Sheet
Beginning of
Current Period:
Assets:
Current Assets:
Cash & Cash-Equivalents: 100$
Short-Term Investments: 100
Accounts Receivable: 100
Prepaid Expenses: 100
Inventory: 100
Total Current Assets: 500
Long-Term Assets:
Plants, Property & Equipment: 1.000
Other Intangible Assets: 300
Long-Term Investments: 100
Goodwill: 100
Total Long-Term Assets: 1.500
Total Assets: 2.000$
Liabilities & Equity:
Current Liabilities:
Revolver (Short-Term Debt): 100$
Accounts Payable: 200
Accrued Expenses: 200
Total Current Liabilities: 500
Long-Term Liabilities:
Deferred Revenue: 200
Deferred Tax Liability: 200
Long-Term Debt: 100
Total Long-Term Liabilities: 500
Total Liabilities: 1.000$
Equity:
Shareholders' Equity:
Common Stock & APIC: 600
Treasury Stock: (100)
Retained Earnings: 300
Accum. Other Compr. Income: 100
Total Shareholders' Equity: 900
Preferred Stock: 100
Total Equity: 1.000$
Total Liabilities & Equity: 2.000$

Balance: period of time
Metrics (See Excel File)Working CapitalDebt Structure
WC = AR + Inventory - AP
What integrates Balance Sheet:
1.The Balance Sheet shows the company's resources (its Assets) and how it paid for those resources – its Liabilities & Equity – at a specific point in time.So, the Income Statement shows revenue and expenses from January 1, 20XX to December 31, 20XX, but the Balance Sheet only shows the company's resources ON January 1, 20XX or ON December 31, 20XX.
2. Assets must always equal Liabilities + Equity – if the Balance Sheet does not balance, it's wrong. If you want a house – an asset – that costs $1 million, could you use a $380K mortgage and $200K in saved-up income to pay for it? No! The Balance Sheet would go out of balance! You’d have to borrow or save more. So, you either take out a mortgage for $800K, or you wait and save up an additional $620K.
3. An Asset is something that will result in, directly or indirectly, additional cash in the future, or is something that can be sold for cash. You typically split Assets into “Current” or “Short-Term” (anything that lasts for less than 1 year) and “Non-Current” or “Long-Term” (anything that lasts for more than 1 year).
4. A Liability is something that will result in, directly or indirectly, less cash in the future. Again, you typically split these into “Current” or “Short-Term” and then “Non-Current” or “Long-Term.” Liabilities are usually related to external parties – lenders, suppliers, or the government.
5. An “Equity” line item is a funding source, like a Liability, but it will not result in less cash in the future.

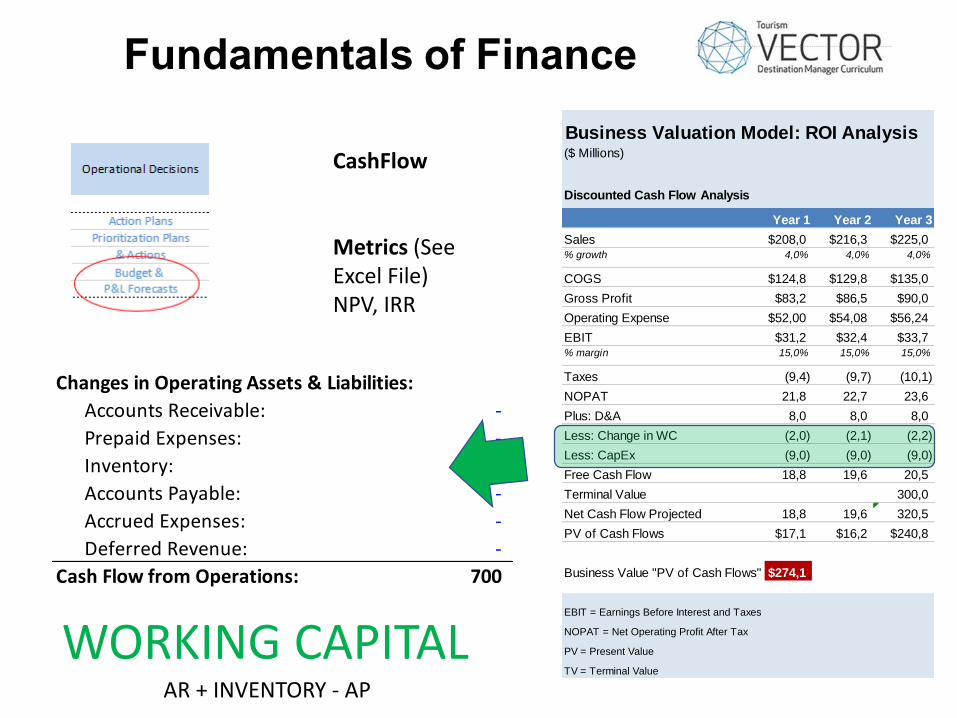
CashFlow
Metrics (SeeExcel File)NPV, IRR
Cash Flow Statement
Current
Period:
Before After
Changes: Changes:
Operating Activities:
Net Income to Common: 700$ 700$
Non-Cash Expenses & Other Adjustments:
(+) Depreciation: - -
(+) Stock-Based Compensation: - -
(+) Amortization of Intangibles: - -
(+) Deferred Income Taxes: - -
(Gain) / Loss on Sale of PP&E: - -
(Gain) / Loss on Sale of ST Inv.: - -
(+) Goodwill Impairment: - -
(+) PP&E Write-Down: - -
Changes in Operating Assets & Liabilities:
Accounts Receivable: - -
Prepaid Expenses: - -
Inventory: - -
Accounts Payable: - -
Accrued Expenses: - -
Deferred Revenue: - -
Cash Flow from Operations: 700 700
Investing Activities:
(-) Buy Short-Term Investments: - -
(+) Sell Short-Term Investments: - -
(-) Buy Long-Term Investments: - -
(+) Sell Long-Term Investments: - -
(-) Capital Expenditures: - -
(+) PP&E Sale Proceeds: - -
Cash Flow from Investing: - -
Financing Activities:
(-) Common Dividends Issued: - -
(+) Issue Long-Term Debt: - -
(-) Repay Long-Term Debt: - -
(+) Issue Short-Term Debt: - -
(-) Repay Short-Term Debt: - -
(+) Issue Preferred Stock: - -
(-) Repay Preferred Stock: - -
(-) Repurchase Shares: - -
(+) Issue New Shares: - -
Cash Flow from Financing: - -
FX Rate Effects: - -
Beginning Cash: 100$ 100$
Increase / (Decrease) in Cash: 700$ 700$
Cash & Cash Equivalents: 800$ 800$
Business Valuation Model: ROI Analysis($ Millions)
Discounted Cash Flow Analysis
Year 1 Year 2 Year 3
Sales $208,0 $216,3 $225,0% growth 4,0% 4,0% 4,0%
COGS $124,8 $129,8 $135,0
Gross Profit $83,2 $86,5 $90,0
Operating Expense $52,00 $54,08 $56,24
EBIT $31,2 $32,4 $33,7% margin 15,0% 15,0% 15,0%
Taxes (9,4) (9,7) (10,1)
NOPAT 21,8 22,7 23,6
Plus: D&A 8,0 8,0 8,0
Less: Change in WC (2,0) (2,1) (2,2)
Less: CapEx (9,0) (9,0) (9,0)
Free Cash Flow 18,8 19,6 20,5
Terminal Value 300,0
Net Cash Flow Projected 18,8 19,6 320,5
PV of Cash Flows $17,1 $16,2 $240,8
Business Value "PV of Cash Flows" $274,1
EBIT = Earnings Before Interest and Taxes
NOPAT = Net Operating Profit After Tax
PV = Present Value
TV = Terminal Value
CashFlow
Metrics (SeeExcel File)NPV, IRR
Business Valuation Model: ROI Analysis($ Millions)
Discounted Cash Flow Analysis
Year 1 Year 2 Year 3
Sales $208,0 $216,3 $225,0% growth 4,0% 4,0% 4,0%
COGS $124,8 $129,8 $135,0
Gross Profit $83,2 $86,5 $90,0
Operating Expense $52,00 $54,08 $56,24
EBIT $31,2 $32,4 $33,7% margin 15,0% 15,0% 15,0%
Taxes (9,4) (9,7) (10,1)
NOPAT 21,8 22,7 23,6
Plus: D&A 8,0 8,0 8,0
Less: Change in WC (2,0) (2,1) (2,2)
Less: CapEx (9,0) (9,0) (9,0)
Free Cash Flow 18,8 19,6 20,5
Terminal Value 300,0
Net Cash Flow Projected 18,8 19,6 320,5
PV of Cash Flows $17,1 $16,2 $240,8
Business Value "PV of Cash Flows" $274,1
EBIT = Earnings Before Interest and Taxes
NOPAT = Net Operating Profit After Tax
PV = Present Value
TV = Terminal Value
Changes in Operating Assets & Liabilities:
Accounts Receivable: -
Prepaid Expenses: -
Inventory: -
Accounts Payable: -
Accrued Expenses: -
Deferred Revenue: -
Cash Flow from Operations: 700
WORKING CAPITALAR + INVENTORY - AP

CashFlow: capex projections
Metrics (See Excel File)Working CapitalDebt Structure
What integratesCashFlow
Major Capital Expenditure Model: ROI Analysis
Year 0 Year 1 Year 2 Year 3 Year 4 Year 5 Year 6 Year 7 Total
6.000.000 6.000.000 6.000.000 6.000.000 6.000.000 6.000.000 - 36.000.000
0,310 0,326 0,342 0,359 0,377 0,396
1.860.000 1.953.000 2.050.650 2.153.183 2.260.842 2.373.884 - 12.651.558
0,120 0,124 0,127 0,131 0,135 0,139
(720.000) (741.600) (763.848) (786.763) (810.366) (834.677) - (4.657.255)
0,030 0,031 0,032 0,033 0,034 0,035
(180.000) (185.400) (190.962) (196.691) (202.592) (208.669) - (1.164.314)
(900.000) (927.000) (954.810) (983.454) (1.012.958) (1.043.347) - (5.821.569)
960.000 1.026.000 1.095.840 1.169.728 1.247.884 1.330.537 - 6.829.989
51,6% 52,5% 53,4% 54,3% 55,2% 56,0% 54,0%
(200.000) (206.000) (212.180) (218.545) (225.102) (231.855) (25.000) (1.318.682)
(304.167) (304.167) (304.167) (304.167) (304.167) (304.167) - (1.825.000)
- - - - - - 250.000 250.000
(504.167) (510.167) (516.347) (522.712) (529.268) (536.021) 225.000 (2.893.682)
455.833 515.833 579.493 647.016 718.615 794.516 225.000 3.936.307
(145.867) (165.067) (185.438) (207.045) (229.957) (254.245) (72.000) (1.259.618)
309.967 350.767 394.055 439.971 488.658 540.271 153.000 2.676.689
(334.167) (16.708) (17.544) (18.421) (19.342) (20.309) 426.491 -
304.167 304.167 304.167 304.167 304.167 304.167 - 1.825.000
Total Investment (2.075.000)
Project Cash Flow (2.075.000) 279.967 638.225 680.678 725.717 773.483 824.128 579.491 2.426.689
Payback 3,66
NPV 472.230 NPV Rate 15%
IRR 21,4%
PI 1,23
Taxes
Net Income
Working Capital Investment
Add back depreciation/amortization
Maintenance and Support
Depreciation
Other Income (Expense)
Total Operating Expense
Profit Before Taxes
Operating Expense
Units Produced
Per Part Rate
Revenue
Material per Part Rate
Material
Direct Labor per Part Rate
Direct Labor
Total COGS
Gross Profit

Balance: period of time
Metrics (See Excel File)Working CapitalDebt Structure
CF = NOPAT + Amortization- CapEx- Change in WC
What integrates Cash Flow:
The Cash Flow Statement, like the Income Statement, tracks changes over a period (one year, quarter, month, etc.).
It exists for 2 main reasons:
1) You may have recorded non-cash revenue, expenses, or taxes on the Income Statement. If you did, then you need to make an adjustment on the Cash Flow Statement to reflect this. Remember, these cash/non-cash differences are the whole reason why the 3 financial statements exist in the first place!
2) There may be additional cash inflows and outflows that have NOT appeared on the Income Statement. For example, Capital Expenditures and Dividends both impact a company’s cash balance, but neither one appears on the Income Statement. NOPAT (Net Operating Profit After Taxes):
Operating Income * (1 – Tax Rate)

CF = NOPAT + Amortization- CapEx- Change in WC
KEEP THIS IN MINDWorking Capital is an investment to operate the company. Is an investment
that must be financed. The amount ofWorking Capital, lacks in CASH.

19
Thank You.
Next content: Intro to Project Management.