Investigation of ferroelectric effects in two sulfide deposits1
Upload
khangminh22Category
view
1download
0
1
Vol.:(0123456789)
Scientific Reports | (2020) 10:22209 | https://doi.org/10.1038/s41598-020-79395-8
www.nature.com/scientificreports
Modelling of hydrogen sulfide fate and emissions in extended aeration sewage treatment plant using TOXCHEM simulationsHaider M. Zwain1,2*, Basim K. Nile3, Ahmed M. Faris4,5, Mohammadtaghi Vakili6 & Irvan Dahlan7,8
Odors due to the emission of hydrogen sulfide (H2S) have been a concern in the sewage treatment plants over the last decades. H2S fate and emissions from extended aeration activated sludge (EAAS) system in Muharram Aisha-sewage treatment plant (MA-STP) were studied using TOXCHEM model. Sensitivity analysis at different aeration flowrate, H2S loading rate, wastewater pH, wastewater temperature and wind speed were studied. The predicted data were validated against actual results, where all the data were validated within the limits, and the statistical evaluation of normalized mean square error (NMSE), geometric variance (VG), and correlation coefficient (R) were close to the ideal fit. The results showed that the major processes occurring in the system were degradation and emission. During summer (27 °C) and winter (12 °C), about 25 and 23%, 1 and 2%, 2 and 2%, and 72 and 73% were fated as emitted to air, discharged with effluent, sorbed to sludge, and biodegraded, respectively. At summer and winter, the total emitted concentrations of H2S were 6.403 and 5.614 ppm, respectively. The sensitivity results indicated that aeration flowrate, H2S loading rate and wastewater pH highly influenced the emission and degradation of H2S processes compared to wastewater temperature and wind speed. To conclude, TOXCHEM model successfully predicted the H2S fate and emissions in EAAS system.
Odors emission from sewage treatment plants (STPs) are longstanding environmental issue that receives ongo-ing attention as a result of urbanization and population expansion. The emission of odors from STPs causes unpleasant nuisances for plant workers and people nearby. Odors cause several health effects such as headache, nausea, and respiratory-related issues. Some odors can be toxic and cause adverse health impacts such as death. Furthermore, odor has negative social economic effects by reducing the price of properties and prospects for tourism due to esthetic nuisance1.
Apart from that, odor problems close to STPs were associated with hydrogen sulfide (H2S) emission as a major source for annoying odors even at very low concentrations. H2S is colorless, flammable, associated with a rotten egg smell and very toxic gas. H2S is generated from the combination of decomposition of organic sulfur from feces and reduction of inorganic sulfur compounds from the sulfate ion (SO4
2−) by bacteria and archaea under anaerobic conditions2. H2S has very low odor threshold limit, however its malodor can even be noticed below 1 ppm, whereas human’s odor threshold between 0.0005 and 1.5 ppm. Long human’s exposure (8 h) to concentrations ranges from 2 to 5 ppm causes headache, nausea and tearing of eyes, while concentration of 50 ppm causes respiratory tract irritation. Single exposure to 500 ppm results in sudden unconsciousness and death if the levels are over 1000 ppm3.
OPEN
1College of Water Resources Engineering, Al-Qasim Green University, Al-Qasim, Babylon 51013, Iraq. 2Department of Civil and Architectural Engineering, College of Engineering, Sultan Qaboos University, Al Khoudh, P.O. Box 33, 123 Muscat, Oman. 3College of Engineering, University of Kerbala, Kerbala 56100, Iraq. 4School of Civil Engineering, Iran University of Science and Technology, 1684613114 Narmak, Tehran, Iran. 5Kerbala Sewerage Directorate, Kerbala 56001, Iraq. 6Green Intelligence Environmental School, Yangtze Normal University, Chongqing 408100, China. 7School of Chemical Engineering, Universiti Sains Malaysia, Engineering Campus, Seri Ampangan, 14300 Nibong Tebal, Penang, Malaysia. 8Solid Waste Management Cluster, Science and Engineering Research Centre, Universiti Sains Malaysia, Engineering Campus, Seri Ampangan, 14300 Nibong Tebal, Penang, Malaysia. *email: [email protected]

2
Vol:.(1234567890)
Scientific Reports | (2020) 10:22209 | https://doi.org/10.1038/s41598-020-79395-8
www.nature.com/scientificreports/
Despite that, there is a high lack of clear legal acts and guidelines regulating H2S emission and dispersion. Hence, a proper control of it is important to reduce nuisances experienced by the exposed populations. The direct way of controlling human exposure to odor is by avoiding the discharge of odor from the origin. Baawain et al.4 reported that specific odor exposure can primarily be quantified by the integral results of sources of emission, dis-persion route, and characteristics of receptor. Different methods (i.e. models, surveys and chamber monitoring) have been used to study odor nuisance to estimate the degree of odors emission from STP1,2,5,6. The management of H2S can be assisted by mathematical models to understand its fate and emission. The mechanisms of pollut-ants removal in these models are the degradation and volatilization from different processes. Such mechanisms depends on biological reactions and mass transfer in the liquid and gas phases7.
Accordingly, TOXCHEM model is an efficient tool for the prediction of volatile organic compounds (VOCs) fate and hazardous air pollutants (HAPs) emission within/from wastewater treatments plants (WWTPs). As an alternative to Water9 software, TOXCHEM was first developed in early 1990s by US Environmental Protection Agency to overcome limitations of Water9. It is based on mass balance of several compounds in WWTPs for each operation unit, taking into account many physical, chemical, and biological processes such as sorption, stripping, volatilization and biodegradation. It is mainly used for VOC air emissions estimates from wastewater collection systems, WWTPs, and disposal facilities. This also include the reduction of air emission by planning, designing and optimization of process projects. In addition, it can also be implemented to predict the loads/concentrations of contaminants in the water effluent, and residual solids streams8.
Karbala state is geologically characterized by gypsum soil and high levels of groundwater, especially in the district where the plant is located. Hence, the groundwater contains very high concentrations of sulfide (SO4
2−) compounds that infiltrate into the sewer system, leading to increased SO4
2− concentrations in sewage, in addition to several other wastewater sources containing SO4
2−. In that sewer systems, sewage are going through oxygen depletion, variable flow rate and velocity, and long retention time that consequently lead to the decomposition of SO4
2− to H2S gas dissolved in wastewater. As a results, Muharram Aisha sewage treatment plant (MA-STP) is receiving high concentrations of H2S that result in the emission of sever odors in the area, which casing problems to the workers and people in the surrounding area. Studies on the modelling of odors exposure associated with H2S from STPs’ are very limited. Therefore, the study aims to model the H2S fate at different treatment units of MA-STP and emission from these units to the atmosphere, during summer and winter, using TOXCHEM V4.1 simulations. In addition, sensitivity analysis is conducted to understand the effect of variation in aeration flowrate, H2S loading rate, wastewater pH level, wastewater temperature and wind speed on the fate and emission of H2S.
Materials and methodsSite location and description. Muhhram Aisha sewage treatment plant (MA-STP) is located in Al-Hindiya District, at about 20 km from the center of the Karbala, and nearly 110 km to the south of Baghdad, the capital of Iraq.
The geographical coordinates of MA-STP are 32° 31′ 41.4516′′ N and 44° 13′ 12.2664′′ E (Latitude: 32.528181 and Longitude: 44.220074). The treatment system used is extended aeration activated sludge (EAAS), as shown in Fig. 1. It is designed to serve 50,000 people with an estimated discharge flow rate of 8000 m3/day, and the operational conditions are listed in Table 1. The system consisted of aerated grit chamber with oil–water separa-tor (API) unit, diffused aerated activated sludge unit, secondary clarifier, chlorine disinfection unit, and drying beds unit for sludge management.
Figure 1. Schematic diagram of EEAS system in MA-STP.

3
Vol.:(0123456789)
Scientific Reports | (2020) 10:22209 | https://doi.org/10.1038/s41598-020-79395-8
www.nature.com/scientificreports/
Sampling and analysis. To assess the performance of the MA-STP, influent and effluent samples were monthly measured from January 2019 to December 2019. Three replicates were analyzed for pH, COD, BOD5, TSS, NO3
−, NO2, NH4+, SO4
2−, H2S, Oil & grease and PO43− as specified by standard procedures for analysis of
water and waste water9, and only average values were reported. The influent and effluent characteristics is tabu-lated in Table 2, and the effluents were compared with the Iraqi effluent standard10. Throughout the year, the wind speed was ranged from 5 to 25 km/h, and the direction was mostly north-west (305°). The conversation of soluble H2S in wastewater to gas emitted from STP is calculated based on the following equation derived from the ideal gas law at standard conditions11:
where V is volume occupied by the gas (L) = 22.414 L at standard temperature.
Model development. To simulate the H2S fate and emission from various treatment processes in MA-STP during summer and winter, TOXCHEM V4.1 simulation was used. In TOXCHEM V4.1, H2S has similar features like volatile organic compounds (VOC), which can be removed by liquid–gas mass transfer and biodegradation processes. In EAAS system, liquid–gas mass transfer occurs by two mechanisms: first is by volatilization to the atmosphere that is due to striping by diffused bubble aeration and volatilization from open surfaces; second is by sorption process of H2S to the sludge. Fate and emission processes of H2S in the MA-STP can be summarized in the following four methods:
1. Biological sorption of H2S from liquid phase to the sludge formed in the system.2. Striping by diffused aeration that causes volatilization of H2S to the atmosphere.3. Volatilization of H2S from open surfaces of treatment units.4. Biodegradation of H2S by activated sludge process.
(1)H2S emission(
ppm)
=
(
V Lmole of H2S
)
×H2S concentration(
mg/L)
(103g/mg)(
34.08g
mole of H2S
)
Table 1. Operational conditions of MASTP-EAAS.
Parameter Value
Mixed liquor suspended solids (MLSS) (mg/L) 3000
Food/microorganism (F/M) ratio (kg BOD/kg MLVSS day) 0.09
Solids loading rates (SLR) (kg MLSS/m2 h) 2.9
Overflow (m3/m2 day) 13
Hydraulic retention time (HRT) (h) 16
Dissolved oxygen (DO) (mg/L) 2.5
Solids retention time (SRT) (day) 25
Return activated sludge (RAS) (%) 75
Sludge volume index (SVI) (mL/g) 66
Discharge (Q) (m3/day) 8000
Summer temperature (°C) 27
Winter temperature (°C) 12
Table 2. Characteristics of influent in MASTP. All parameters in mg/L except for pH; ND is not detected (< 1 mg/L).
Parameter Influent concentration (mg/L) Effluent concentration (mg/L) Permissible limits (mg/L)
pH 7.2 7 6–9
COD 450 35 100
BOD 280 10 40
TSS 300 20 60
NO3− 0 35 50
NO2 0 ND –
NH4+ 20 ND 10
SO42− 1050 1175 400
H2S 35 1 3
Oil and grease 40 2 10
PO43− 15 1 3

4
Vol:.(1234567890)
Scientific Reports | (2020) 10:22209 | https://doi.org/10.1038/s41598-020-79395-8
www.nature.com/scientificreports/
In the MA-STP system, air diffusers have been used to provide aeration at the grit chamber and activated sludge tank. For diffused bubble aeration, the rate of stripping is represented by concentration of pollutants in the wastewater and is written as:
where rd is diffused aeration stripping rate (mg/h), kd is diffused aeration stripping constant, C is volatile com-pound concentration in the water (mg/m3), fnon is pH dependent fraction of non-dissociated compound, and V is aeration basin volume (m3).
It is assumed that the motion of air on the top of basin (i.e. open system) is adequate to volatilize H2S, thus the volatilization rate is given by:
where rv is rate of volatilization (mg/h), and kv is volatilization rate constant (1/h).Due to that MA-STP system is based on suspended growth mechanisms, suspended growth biodegradation
was used in the model. Subsequently, H2S biodegradation is expressed by Monod reaction as shown in the fol-lowing equation:
where rb is the biodegradation rate (mg/h), kb is the coefficient of first order biodegradation rate (L/mg VSS/h), X is the biomass concentration (mg/L), and Ks is the half saturation constant (mg/L).
H2S transfers from the liquid phase to the suspended solids and to the residual dead biomass by mean of sorption. Sorption of H2S onto the sludge is described by a linear isotherm in low pollutant concentrations and it is computed by the following equation:
where q is the pollutant concentration in solid phase (µg/g), and Kp is the coefficient of sorption partition (L/g).
Model validation. To evaluate the characteristic of data predicted by TOXCHEM V4.1, all measured and predicted data were compared using the statistical parameters recommended by Chang and Hanna12, which include fractional bias (FB), geometric mean bias (MG), normalized mean square error (NMSE), geometric vari-ance (VG), correlation coefficient (R), and fraction of predictions within a factor of two observations (FAC2). Results of measured H2S values discharged with effluent and emitted to atmosphere in 12 months are compared with the predicted H2S values by TOXCHEM V4.1. The statistical parameters used are presented in Eqs. (6)–(11):
where Co is the measured H2S value, Cp is the predicted H2S value, Co is the average over measured data, Cp is the average over predicted data, and σ is the standard deviation over the dataset. The acceptable limits for these statistical parameters are shown in Table 3.
Sensitivity analysis. Among many crucial processes to understand the effect of various operational param-eters on the fate and emission of H2S is sensitivity analysis. In this investigation, sensitivity analysis was applied to comprehend the fate and emission of H2S by using the major influencing parameters on the treatment process of extended aeration systems, which include aeration flowrate, H2S loading rate (MLSS concentration in the diffused aerated activated sludge reactor), wastewater pH level, wastewater temperature and wind speed. Differ-
(2)rd = kd C fnon V
(3)rv = kv C fnon V
(4)rb = kb
(
C
1+ CKs
)
XV
(5)q = KpC
(6)FB =
(
Co − Cp
)
0.5(
Co + Cp
)
(7)MG = exp(
lnCo − lnCp
)
(8)NMSE =
(
Co − Cp
)2
CoCp
(9)VG = exp(
lnCo − lnCp
)2
(10)R =
(
Co − Co
)(
Cp − Cp
)
σCoσCp
(11)FAC2 =
(
Cp
Co
)

5
Vol.:(0123456789)
Scientific Reports | (2020) 10:22209 | https://doi.org/10.1038/s41598-020-79395-8
www.nature.com/scientificreports/
ent aeration flowrate (2500–15,000 m3/h), H2S loading rate (5–35 mg H2S/g MLSS/day), wastewater pH levels (5–10), wastewater temperatures (10–30 °C), and wind speeds (5–25 km/h) were applied.
Results and discussionThe performance evaluation of MA-STP. Table 2 shows the performance evaluation of the MA-STP Al-Hindiya District, Karbala, Iraq. Removal efficiency of 92, 96, 93, 100, 98, 95 and 93% were achieved for COD, BOD5, TSS, NH4
+, H2S, Oil & grease and PO43−, respectively. According to the Iraqi standards10, the MA-STP
performed very well to remediate all pollutants, except for SO42−. High influent SO4
2− concentration and oxida-tion of H2S result in excess presence of SO4
2− concentration in the system13, therefor it is higher in effluent than the influent. However, neutral pH and high degradation of organics indicated a stable biological process. NH4
+ and NO2 was not detected in the effluent due to complete nitrification process achieved by the EAAS system8. In contrast, about 35 mg/L of NO3
− was observed in the effluent because the treatment system does not include denitrification process that need to be considered to improve the system performance. Furthermore, high oil & grease removal attributed to the application of oil–water separator (API) in the aerated grit chamber. Besides, dissolved H2S was detected at trace level in the effluent, because most of it was degraded in the treatment process and the rest was emitted to the atmosphere.
Results validation. TOXCHEM V4.1 model is used to simulate the H2S fate throughout the MA-STP and emission out of it. The influent characteristics and EAAS system operational conditions were the inputs, and H2S fate (% and mg/L) and emission values (ppm) were the output of the model. From these applied characteristic and operational variables, model simulations were generated and compared with H2S analysis in the sampling points of emitted H2S at the top of each treatment unit and dissolved H2S with effluent. Table 3 presents statistical data validation of predicted and measured H2S emitted to atmosphere and discharged with effluent. In compari-son, all data were validated within the limits, and dataset NMSE, VG, and R were close to the ideal fit.
FB and MG measure mean bias and indicate systematic errors which lead to underestimate or overestimate the measured data. FB of 0.25 (more than zero) and MG of 1.28 (more than one) evidence that TOXCHEM under predicted H2S concentration discharged with effluent, while FB of − 0.29 (less than zero) and MG of 0.75 (less than one) indicate that the model over predicted H2S emission to atmosphere. However, both of FB and MG showed that the error in all data are within acceptable limits and less than 30%. NMSE and VG showed that data scattering around the true value and they both reflected systematic random errors from unpredictable fluctuations. The results of both of NMSE and VG are very close to ideal fit, indicating that there is no random error for the predicted data over measured.
The coefficient of correlation (R) reflects the linear relationship between modeled and observed data. Both R values, 0.9 for H2S concentration discharged with effluent and 0.89 for H2S emission to atmosphere, indicated a strong correlation between predicted and measured data. The highest R values is required but not sufficient, therefore FAC2 is important factor for evaluation and validation as it’s the most robust measure that is not affected by either low or high outliers. The results of FAC2 revealed that 78% (FAC2 = 0.78) of H2S concentra-tion discharged with effluent and 75% (FAC2 = 1.34) of H2S emission to atmosphere were within a factor of two of the measured data.
In addition, Fig. 2 shows a scattering comparison of measured and predicted H2S that are emitted to atmos-phere and discharged with effluent. Distribution of data and coefficient of determination (R2) are adopted to check the goodness of model fit. The results showed that the predicted and measured data were well scattered around the linear line, where measured emission was slightly less than predicted and measured discharged concentration was slightly higher than the predicted, and R2 values showed that data are in a good fit. The TOX-CHEM model could sufficiently describe the experimental data of H2S fate and emission. In comparison with other studies on the modeling of H2S using AERMOD7, CALPUFF14, and GOSTELOW15, statistical analysis of TOXCHEM V4.1 model are very satisfactory to study H2S due to valid prediction with less limitations and errors.
H2S fate and emission. STP are a major source of gaseous emissions that contain odorants and greenhouse gases. Figure 3 shows the H2S fate (%) throughout the MA-STP. The EAAS system receives about 280 kg/day of
Table 3. Statistical parameters of data validation of H2S emitted to atmosphere and discharged with effluent.
Parameter
Discharged with effluent Emitted to atmosphere
Ideal fit Validation limitsMeasured Predicted Measured Predicted
Average 0.48 0.37 4.46 5.98
Standard deviation 0.21 0.17 0.29 0.35
Fractional bias (FB) 0.25 − 0.29 0 − 0.3 ≤ FB ≤ 0.3
Geometric mean bias (MG) 1.28 0.75 1 0.7 ≤ MG ≤ 1.3
Normalized mean square error (NMSE) 0.08 0.09 0 ≤ 1.5
geometric variance (VG) 1.08 1.09 1 ≤ 4
Correlation coefficient (R) 0.9 0.89 1 Close to 1
Factor of two observations (FAC2) (%) 0.78 1.34 1 0.5 ≤ FAC2 ≤ 2

6
Vol:.(1234567890)
Scientific Reports | (2020) 10:22209 | https://doi.org/10.1038/s41598-020-79395-8
www.nature.com/scientificreports/
H2S that is processed throughout the treatment units. During summer (27 °C) and winter (12 °C), about 25 and 23%, 1 and 2%, 2 and 2%, and 72 and 73% were fated as emitted to air, discharged with effluent, sorbed to sludge, and biodegraded, respectively. The results revealed that the major processes occurring are: (1) degradation, where most of the H2S was oxidized by aerobic process; and (2) emission, where some of the H2S was emitted to the atmosphere by H2S stripping and vitalization from open surfaces. In addition to seasonal variation, sorption of H2S to the dead biomass and discharge of H2S with effluent were slightly observed. Although the key function
y = 1.1603x + 0.7995R² = 0.9572
5.0
5.4
5.8
6.2
6.6
7.0
3.8 4.0 4.2 4.4 4.6 4.8 5.0
Pred
icte
d E
mitt
ed H
2S (p
pm)
Measured Emitted H2S (ppm)
a)
y = 0.7968x - 0.0085R² = 0.9601
0.1
0.2
0.3
0.4
0.5
0.6
0.7
0.1 0.2 0.3 0.4 0.5 0.6 0.7 0.8
Pred
icte
d E
fflue
nt H
2S (m
g/L
)
Measured Effluent H2S (mg/L)
b)
Figure 2. The comparison of measured (x-axis) and predicted (y-axis) H2S: (a) emitted to atmosphere and (b) discharged with effluent.
25
1 2
72
23
2 2
73
0
10
20
30
40
50
60
70
80
To Air With effluent To Sludge Biodegraded
H2S
Dis
pers
ion
(%)
Summer 27°C Winter 12°C
Figure 3. H2S dispersion (%) throughout the EEAS system in MA-STP during summer and winter.

7
Vol.:(0123456789)
Scientific Reports | (2020) 10:22209 | https://doi.org/10.1038/s41598-020-79395-8
www.nature.com/scientificreports/
of activated sludge process is to eliminate organic pollutants, the EAAS system has successfully achieved desul-furization of about 74% of H2S (degradation and sorption).
In an aerobic conditions, natural microorganisms called sulfide oxidizing bacteria (SOB) play a major role in the desulfurization of H2S. H2S is oxidized by chemolithoautotrophic bacteria from the genus Thiobacillus group that has high affinity to sulfide compounds (H2S, HS− and S2−)16. In aqueous solution, H2S presents in forms that are highly depending on pH level. As the sewage pH is about 7 at STP, H2S is primarily dissociates to form bisulfide (HS−) (Eq. (12)). Sulfide (S2−) is another form of H2S (Eq. (13)) that is generally neglected because of its insignificant presence except at very high pH, and H2S form may be predominant below pH 513.
In STP where aeration is provided, HS− is biologically oxidized to firstly elemental sulfur (S0) and subsequently to sulfate (SO4
2−), as shown in the following reactions17:
Complete oxidation of HS− to SO42− requires the consumption of two oxygen molecules, but this reaction is
reversible if limited amount of oxygen is supplied and elemental S0 might accumulate13. However, elemental S0 is end-product of oxidation process that is necessary for the growth of microorganisms and directly consumed for the synthesis of cellular protein needed for new cells production18. Excess amounts of elemental S0 and SO4
2− are sorbed to the biomass and/or released with the effluent.
Volatilization describes the process whereby an odorant (H2S) is transferred from an area source such as the surface of diffused aerated activated sludge reactor to the atmosphere15. Figure 3 displays that about 70 kg/day (23%) of total H2S was volatized from the MA-STP to atmosphere, and Fig. 4 shows the emission distribu-tion of H2S from each unit (% of the total emission). The results revealed that summer has emitted higher H2S compared to winter, in which most of it was from diffused aerated activated sludge reactor (> 50%), followed by aerated grit chamber (API) (25–50%) and sludge drying beds (25–50%). The mechanism of H2S emission is volatilization by air stripping and open surfaces. The H2S emission is a physicochemical process that contains
(12)H2S(aqueous) → HS− + H+(
pKa = 7.05, 5 < pH ≤ 10)
(13)HS− → S2− + H+(
pKa = 12.9, pH ≥ 11)
(14)HS− + 0.5 O2 → S0 + OH−
(15)S0 + OH−+ 1.5 O2 → SO2−
4 + H+
Figure 4. Emission of H2S to atmosphere from each unit (% of the total emission): (a) summer and (b) winter.
8
Vol:.(1234567890)
Scientific Reports | (2020) 10:22209 | https://doi.org/10.1038/s41598-020-79395-8
www.nature.com/scientificreports/
liquid and gas phases. Only H2S (aqueous) can transfer across the sewage-air interface, allowing it to be emitted as gas from STP19, as shown in Eq. (16).
A STP brings huge quantities of sewage into contact with air that boost the stripping of odorants, which can be significant odor source. Due to aeration process, biological oxidation tends to decrease liquid-phase odorant concentrations. However, recycling of activated sludge is a notable way for odor control due to the recycling of biomass containing sulfur compounds from secondary clarifiers to the aerobic activated sludge reactors. This fosters the consumption of odor compounds before they volatilize from the liquid phase to the atmosphere16. Furthermore, the available surface area for gas transfer is believed to affect the emission of H2S from open sur-faces to the atmosphere. This was also proved by Parsons et al.20 whom found that the greater open surface area of the source the greater H2S concentration emitted to atmosphere.
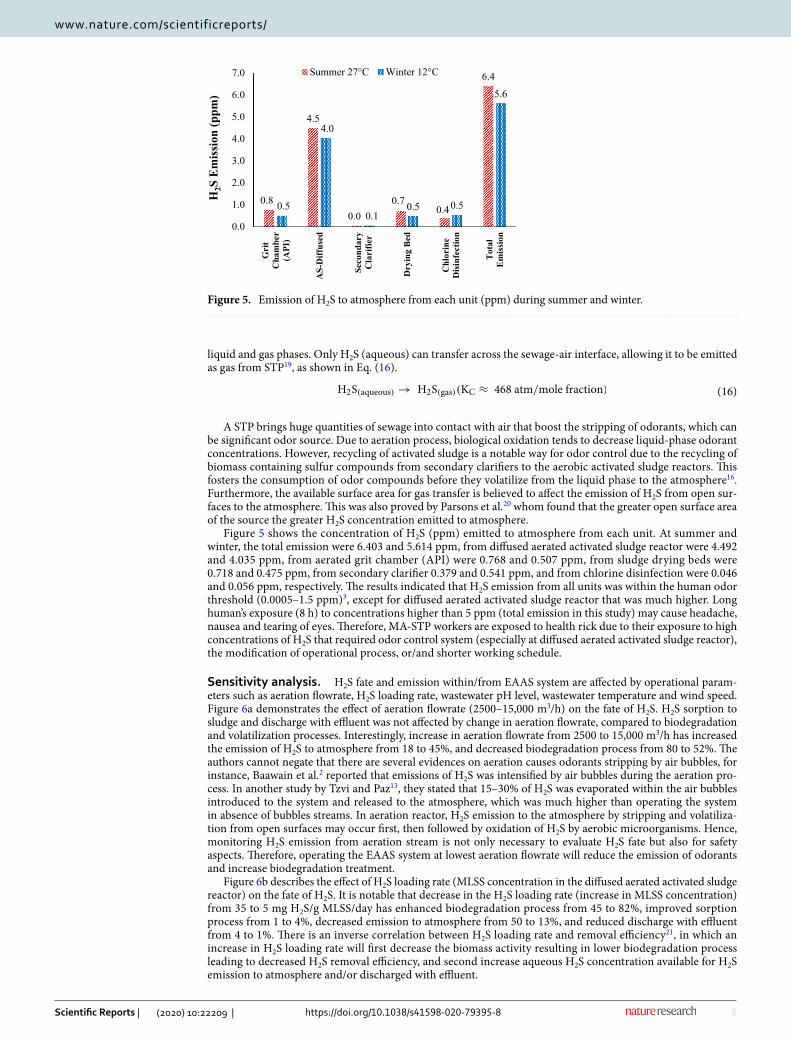
Figure 5 shows the concentration of H2S (ppm) emitted to atmosphere from each unit. At summer and winter, the total emission were 6.403 and 5.614 ppm, from diffused aerated activated sludge reactor were 4.492 and 4.035 ppm, from aerated grit chamber (API) were 0.768 and 0.507 ppm, from sludge drying beds were 0.718 and 0.475 ppm, from secondary clarifier 0.379 and 0.541 ppm, and from chlorine disinfection were 0.046 and 0.056 ppm, respectively. The results indicated that H2S emission from all units was within the human odor threshold (0.0005–1.5 ppm)3, except for diffused aerated activated sludge reactor that was much higher. Long human’s exposure (8 h) to concentrations higher than 5 ppm (total emission in this study) may cause headache, nausea and tearing of eyes. Therefore, MA-STP workers are exposed to health rick due to their exposure to high concentrations of H2S that required odor control system (especially at diffused aerated activated sludge reactor), the modification of operational process, or/and shorter working schedule.
Sensitivity analysis. H2S fate and emission within/from EAAS system are affected by operational param-eters such as aeration flowrate, H2S loading rate, wastewater pH level, wastewater temperature and wind speed. Figure 6a demonstrates the effect of aeration flowrate (2500–15,000 m3/h) on the fate of H2S. H2S sorption to sludge and discharge with effluent was not affected by change in aeration flowrate, compared to biodegradation and volatilization processes. Interestingly, increase in aeration flowrate from 2500 to 15,000 m3/h has increased the emission of H2S to atmosphere from 18 to 45%, and decreased biodegradation process from 80 to 52%. The authors cannot negate that there are several evidences on aeration causes odorants stripping by air bubbles, for instance, Baawain et al.2 reported that emissions of H2S was intensified by air bubbles during the aeration pro-cess. In another study by Tzvi and Paz13, they stated that 15–30% of H2S was evaporated within the air bubbles introduced to the system and released to the atmosphere, which was much higher than operating the system in absence of bubbles streams. In aeration reactor, H2S emission to the atmosphere by stripping and volatiliza-tion from open surfaces may occur first, then followed by oxidation of H2S by aerobic microorganisms. Hence, monitoring H2S emission from aeration stream is not only necessary to evaluate H2S fate but also for safety aspects. Therefore, operating the EAAS system at lowest aeration flowrate will reduce the emission of odorants and increase biodegradation treatment.
Figure 6b describes the effect of H2S loading rate (MLSS concentration in the diffused aerated activated sludge reactor) on the fate of H2S. It is notable that decrease in the H2S loading rate (increase in MLSS concentration) from 35 to 5 mg H2S/g MLSS/day has enhanced biodegradation process from 45 to 82%, improved sorption process from 1 to 4%, decreased emission to atmosphere from 50 to 13%, and reduced discharge with effluent from 4 to 1%. There is an inverse correlation between H2S loading rate and removal efficiency21, in which an increase in H2S loading rate will first decrease the biomass activity resulting in lower biodegradation process leading to decreased H2S removal efficiency, and second increase aqueous H2S concentration available for H2S emission to atmosphere and/or discharged with effluent.
(16)H2S(aqueous) → H2S(gas)(KC ≈ 468 atm/mole fraction)
0.8
4.5
0.00.7
0.4
6.4
0.5
4.0
0.10.5 0.5
5.6
0.0
1.0
2.0
3.0
4.0
5.0
6.0
7.0
Gri
tC
ham
ber
(API
)
AS-
Diff
used
Seco
ndar
yC
lari
fier
Dry
ing
Bed
Chl
orin
eD
isinf
ectio
n
Tot
alE
mis
sion
H2S
Em
issi
on (p
pm)
Summer 27°C Winter 12°C
Figure 5. Emission of H2S to atmosphere from each unit (ppm) during summer and winter.

9
Vol.:(0123456789)
Scientific Reports | (2020) 10:22209 | https://doi.org/10.1038/s41598-020-79395-8
www.nature.com/scientificreports/
Figure 6c displays the effect of wastewater pH level on the fate of H2S, in which it effects first the dissocia-tion of H2S in aqueous solution, and second the mechanism of H2S removal. The results vouch that increase in pH between 5 and 10 decreased the emission of H2S to atmosphere from 35 to 5%, making it more dissolved in sewage and increased biodegradation process from 62 to 90%, whereas sorption to sludge and discharge with effluent were not much effected. As pH increases, the fraction of available H2S decreases due to its dissociation into HS− (Eqs. (12), (13)). Higher pH solution led to less H2S available for transferring from STP treatment units into the atmosphere, whereas H2S stripping is favored under acidic conditions17. Chaiprapat et al.22 observed that as pH of the wastewater decreased, the efficiency of H2S removal of the system slightly decreased due to lowered solubility of H2S, which lead to higher ionic strength of wastewater. Low solubility makes H2S and O2 in gas form become deficient for SOB to execute biochemical reactions in the liquid form.
Moreover, the oxidation of sulfide compounds produces H+ (Eq. (17)), leading to drop in the pH in the aerobic unit of STP. Low pH level may inhibit biodegradation process because under acidic environment, H2S is union-ized and has neutral molecule that is very toxic to microorganism in the system as it can permeate through the cell membrane better than HS– and S2–1. However, continuous wastewater feeding in STP provides recirculation and alkalinity buffering to maintain pH and hinder acidity. This indicate that using aeration for biological oxida-tion wouldn’t results in external release of H2S, and decrease the risk of H2S stripping.
Figure 6. Sensitivity analysis of different H2S dispersion: (a) aeration flowrate, (b) MLSS concentration, (c) wastewater pH level, (d) wastewater temperature, and (e) wind speed.

10
Vol:.(1234567890)
Scientific Reports | (2020) 10:22209 | https://doi.org/10.1038/s41598-020-79395-8
www.nature.com/scientificreports/
Temperature is another key factor influencing the physicochemical properties of gases, influencing the Henry gas law and kinetics of biological processes. Figure 6d presents the effect of wastewater temperature ranges from 5 to 35 °C on the fate of H2S. It was observed that temperature mainly effected the mass transfer of H2S, either dissolved in wastewater or volatized to atmosphere. Increase in temperature from 5 to 35 has increased the emis-sion of H2S from 22 to 27% and decreased its content in wastewater from 3 to 0%, while effects on degradation and sorption processes were limited. The findings evince that aqueous H2S condensed at a lower temperature and emitted to atmosphere at high temperature. Similarly, Baawain et al.2 confirmed that high temperature has increased H2S emissions from ponds sewage treatment system. Other studies also reported that aqueous solution temperature highly effected the mass transfer rate of H2S, in which the overall mass transfer from liquid phase to gas phase increases with temperature6.
Figure 6e display the effect of wind speed (friction velocity) on the emission of H2S from STP to the atmos-phere. It was seen that increase in wind speed from 5 to 35 km/h has slightly increased the volatilization of H2S from 25 to 27% and decreased degradation process from 72 to 70%, whereas sorption and dissolution of gas in wastewater processes were not affected. However, this can show that wind speed has limited effect on the gas emission but of course will highly influence the dispersion of odors away from its generation source. Similarly, slight higher emission rate of H2S was observed with higher wind speed2. Wind speed is usually correlated with mass transfer and emission, where it is evident on wind speeds over 4 m/s, and nearly undetectable below this speed5. However, the wind speed reported to be associated with H2S concentration more than the emission rate, in which higher wind speed dilutes the concentration of H2S and disperses it for long distance6. In this regards, Santos et al.15 reported that wind speed did not have a significant effect on overall mass transfer of H2S, suggest-ing that volatilization will depend more on turbulence of liquid phase than wind speed.
ConclusionTOXCHEM V4.1 simulation showed that EAAS system worked as biological treatment method for the removal of H2S. The main processes occurring in the EAAS system are (1) H2S compounds (HS−) formation, (2) H2S biological degradation, (3) H2S volatilization, (4) H2S stripping, (5) H2S compounds sorption, and (6) discharged H2S with effluents. The date predicted by TOXCHEM V4.1 simulation were validated and close to ideal fit. The main H2S processes observed were degradation by about 73% and stripping by about 23%. Total H2S emission from the MA-STP, especially from diffused aerated activated sludge reactor, may put the workers and surround-ing population at a health risk. Operating the EAAS system at low aeration flowrate, high MLSS concentration, and slightly high pH are recommended to limit the emission of H2S to the atmosphere. Thus, TOXCHEM V4.1 model can potentially be utilized for other plants/projects to predict H2S fate and dispersion, and analysis of its results can be used as a beneficial output for decision makers.
Received: 10 October 2020; Accepted: 8 December 2020
References 1. Sun, S., Jia, T., Chen, K., Peng, Y. & Zhang, L. Simultaneous removal of hydrogen sulfide and volatile organic sulfur compounds
in off-gas mixture from a wastewater treatment plant using a two-stage bio-trickling filter system. Front. Environ. Sci. Eng. 13, 60 (2019).
2. Baawain, M., Al-Mamun, A., Omidvarborna, H. & Al-Sulaimi, I. N. Measurement, control, and modeling of H2S emissions from a sewage treatment plant. Int. J. Environ. Sci. Technol. 16, 2721–2732 (2018).
3. Occupational Health and Safety Administration (OSHA). Hydrogen Sulfide (US Department of Labors, Occupational Health and Safety Administration, Boise, 2018).
4. Baawain, M., Al-Mamun, A., Omidvarborna, H. & Al-Jabri, A. Assessment of hydrogen sulfide emission from a sewage treatment plant using AERMOD. Environ. Monit. Assess. 189, 263 (2017).
5. Moreno-Silva, C. et al. Hydrogen sulphide emissions and dispersion modelling from a wastewater reservoir using flux chamber measurements and AERMOD® simulations. Atmos. Environ. 224, 117263 (2020).
6. Carrera, L., Springer, F., Lipeme-Kouyi, G. & Buffiere, P. A review of sulfide emissions in sewer networks: Overall approach and systemic modelling. Water Sci. Technol. 73, 1231–1242 (2016).
7. Augusto, M. R., Campos, B., Carvalho, V. S. B. & Calheiros, H. C. Modeling of H2S dispersion in Brazil with Aermod: Case study of water resource recovery facility in south of Brazil. Rev. Bras. Meteorol. 34, 497–504 (2019).
8. Zwain, H. M., Vakili, M., Faris, A. M. & Dahlan, I. Modeling the fate of phenol in moving bed biofilm reactor sewage treatment plant. In Proc. AICCE’ 19. AICCE 2019. Lecture Notes in Civil Engineering (ed. Mohamed-Nazri, F.) (Springer, Cham, 2019).
9. American Public Health Association (APHA). Standard Methods for the Examination of Water and Wastewater (American Public Health Association, American Water Works Association and Water Environment Federation, New York, 2017).
10. Al-Iraqiya, A.-W. Iraqi Regulation Number 3: National Limits for the Use of Secondary Treated Effluents in Agricultural Irrigation 4223–4231 (Ministry of Justice of Iraq, Baghdad, 2012).
11. Burton, F. L. et al. Wastewater Engineering: Treatment and Resource Recovery (McGraw-Hill Education, New York, 2013). 12. Chang, J. C. & Hanna, S. R. Air quality model performance evaluation. Meteorol. Atmos. Phys. 87, 167–196 (2004). 13. Tzvi, Y. & Paz, Y. Highly efficient method for oxidation of dissolved hydrogen sulfide in water, utilizing a combination of UVC
light and dissolved oxygen. J. Photochem. Photobiol. A 372, 63–70 (2019). 14. Gulia, S., Kumar, A. & Khare, M. Performance evaluation of CALPUFF and AERMOD dispersion models for air quality assessment
of an industrial complex. J. Sci. Ind. Res. 74, 302–307 (2015). 15. Santos, J. M. et al. An experimental determination of the H2S overall mass transfer coefficient from quiescent surfaces at wastewater
treatment plants. Atmos. Environ. 60, 18–24 (2012). 16. Barbusiński, K. & Kalemba, K. Use of biological methods for removal of H2S from biogas in wastewater treatment plants—A review.
Archit. Civ. Eng. Environ. 9, 103–112 (2016). 17. Quijano, G., Figueroa-González, I. & Buitrón, G. Fully aerobic two-step desulfurization process for purification of highly H2S-laden
biogas. J. Chem. Technol. Biotechnol. 93, 3553–3561 (2018).
(17)HS− + 2O2 → SO2−4 + H+

11
Vol.:(0123456789)
Scientific Reports | (2020) 10:22209 | https://doi.org/10.1038/s41598-020-79395-8
www.nature.com/scientificreports/
18. Zhang, L. et al. Chemical and biological technologies for hydrogen sulfide emission control in sewer systems: A review. Water Res. 42, 1–12 (2008).
19. Long, Y., Fang, Y., Shen, D., Feng, H. & Chen, T. Hydrogen sulfide (H(2)S) emission control by aerobic sulfate reduction in landfill. Sci. Rep. 6, 38103–38103 (2016).
20. Parsons, S. A., Smith, N., Gostelow, P. & Wishart, J. Hydrogen sulphide dispersion modelling—Urban and rural case studies. Water Sci. Technol. 41, 117–126 (2000).
21. Moussavi, G., Naddafi, K., Mesdaghinia, A. & Deshusses, M. A. The removal of H2S from process air by diffusion into activated sludge. Environ. Technol. 28, 987–993 (2007).
22. Chaiprapat, S., Mardthing, R., Kantachote, D. & Karnchanawong, S. Removal of hydrogen sulfide by complete aerobic oxidation in acidic biofiltration. Process Biochem. 46, 344–352 (2011).
AcknowledgementsAuthors around the world are writing their work under many unfortunate situations. On the 2nd of August 2020, I (H.M.Z.) was diagnosed with COVID-19 positive. A feeling of pain, weakness, fair, and uncertainty; I found in completing writing this paper an inspiration to continue living, lift up my self-helpless, and looking forward a full recovery. In this occasion, I would like to thank all researchers around the world who are hardly working to find solutions for this pandemic catastrophe. A special thanks to all physician, including my wife, and medical staff for their sacrifice. I am grateful for my wife and parents for looking after me and not making me feel neglected. Furthermore, the support of Department of Civil and Architectural Engineering, College of Engineering, Sultan Qaboos University is highly appreciated.
Author contributionsB.K.N. and A.H.F. conceived the study. H.M.Z. conceptualized the methodology, analyzed the data, and wrote the first and successive drafts of the manuscript. M.V. and I.D. contributed to the writing of the manuscript and to the interpretation of results.
Competing interests The authors declare no competing interests.
Additional informationCorrespondence and requests for materials should be addressed to H.M.Z.
Reprints and permissions information is available at www.nature.com/reprints.
Publisher’s note Springer Nature remains neutral with regard to jurisdictional claims in published maps and institutional affiliations.
Open Access This article is licensed under a Creative Commons Attribution 4.0 International License, which permits use, sharing, adaptation, distribution and reproduction in any medium or
format, as long as you give appropriate credit to the original author(s) and the source, provide a link to the Creative Commons licence, and indicate if changes were made. The images or other third party material in this article are included in the article’s Creative Commons licence, unless indicated otherwise in a credit line to the material. If material is not included in the article’s Creative Commons licence and your intended use is not permitted by statutory regulation or exceeds the permitted use, you will need to obtain permission directly from the copyright holder. To view a copy of this licence, visit http://creat iveco mmons .org/licen ses/by/4.0/.
© The Author(s) 2020
Copyright © 2022 FDOKUMEN