Apoptosis & senescence: cell fate determination in inhibitor ...
123
Apoptosis & senescence: cell fate determination in inhibitor-treated melanoma cells Dissertation zur Erlangung des naturwissenschaftlichen Doktorgrades der Bayerischen Julius-Maximilians-Universität Würzburg vorgelegt von Andreas Borst Geboren am 20.10.1984 in Würzburg Würzburg, 2017
-
Upload
khangminh22 -
Category
Documents
-
view
7 -
download
0
Transcript of Apoptosis & senescence: cell fate determination in inhibitor ...

Apoptosis & senescence: cell fate determination in inhibitor-treated melanoma cells
Dissertation
zur Erlangung des naturwissenschaftlichen Doktorgrades
der Bayerischen Julius-Maximilians-Universität Würzburg
vorgelegt von
Andreas Borst
Geboren am 20.10.1984 in Würzburg
Würzburg, 2017

Eingereicht am: ………………………………………..……..
Mitglieder der Promotionskommission:
Vorsitzender: ……………………………………………..
1.Gutachter: PD Dr. Roland Houben
2.Gutachter: Prof. Dr. Krohne
Tag des Promotionskolloquiums: ……………………..…
Doktorurkunde ausgehändigt am: ………………….…….

Table of contents Page
1. Preface 1
2. Summary 2
3. Zusammenfassung 4
4. Introduction 6
4.1. The epidermis: macroscopic and cellular structure 6
4.2. Merkel cell carcinoma (MCC) 7
4.2.1. Merkel cell polyomavirus (MCV) 8
4.2.2. MCV T antigens in MCC carcinogenesis 12
4.2.3. MCV and tumor suppressor proteins 12
4.3 Melanoma 14
4.3.1. The MAPK pathway as a therapeutic target in melanoma 19
4.3.2. MAPK inhibition & apoptosis in melanoma 23
4.3.3. Immunotherapy in melanoma 26
5. Discussion 29
5.1. Current state and outlook of immune-based therapies in melanoma & MCC 29
5.2. Current state and outlook of targeted therapies in melanoma 33
5.2.1. Bcl-2 family members as potential targets for melanoma therapy 35
5.3. Potential of targeted therapies in MCC 38
5.4. Combining targeted and immune-based therapies:
the future of melanoma treatment? 40
6. Reference list 42
7. Articles 61
Vemurafenib induces senescence features in melanoma cells (article I) 61
Supplemental material (article I) 70
Mechanisms of p53 restriction in Merkel cell carcinoma cells are independent
of the Merkel cell polyomavirus T antigens (article II) 82
Rb1 is the crucial target of the Merkel cell polyomavirus large T antigen in
Merkel cell carcinoma cells (article III) 90
BIK is involved in BRAF/MEK inhibitor induced apoptosis in
melanoma cell lines (article IV) 103
Supplemental material (article IV) 112
8. Eidesstattliche Erklärung 119
9. Danksagung 120

1. Preface
The herein presented thesis consists of a selection of four original articles that are published.
Furthermore, this thesis includes a shared summary, introduction, and discussion concerning
these four articles, which are attached at the end of the thesis:
Article I (shared first author): Haferkamp S, Borst A, Adam C, Becker TM, Motschenbacher S, Windhovel S, Hufnagel AL, Houben R, Meierjohann S: Vemurafenib induces senescence features in melanoma cells. J Invest Dermatol 133:1601-1609 (2013). Article II: Houben R, Dreher C, Angermeyer S, Borst A, Utikal J, Haferkamp S, Peitsch WK, Schrama D, Hesbacher S: Mechanisms of p53 restriction in Merkel cell carcinoma cells are independent of the Merkel cell polyoma virus T antigens. J Invest Dermatol 133:2453-2460 (2013). Article III: Hesbacher S, Pfitzer L, Wiedorfer K, Angermeyer S, Borst A, Haferkamp S, Scholz CJ, Wobser M, Schrama D, Houben R: RB1 is the crucial target of the Merkel cell polyomavirus Large T antigen in Merkel cell carcinoma cells. Oncotarget 7:32956-32968 (2016). Article IV (first author): Borst A, Haferkamp S, Grimm J, Rosch M, Zhu G, Guo S, Li C, Gao T, Meierjohann S, Schrama D, Houben R: BIK is involved in BRAF/MEK inhibitor induced apoptosis in melanoma cell lines. Cancer Lett 404:70-78 (2017). The work presented in this thesis was carried out from June 2012 to May 2016. It was
supervised by principal supervisor PD Dr. rer. nat. Roland Houben. Experimental work was
performed at the Department of Dermatology of the University Hospital Wuerzburg,
Germany.
1

2. Summary
Neoplasms of the skin represent the most frequent tumors worldwide; fortunately, most of
them are benign or semi-malignant and well treatable. However, the two most aggressive and
deadly forms of malignant skin-neoplasms are melanoma and Merkel cell carcinoma (MCC),
being responsible for more than 90% of skin-cancer related deaths. The last decade has yielded
enormous progress in melanoma therapy with the advent of targeted therapies, like BRAF or
MEK inhibitors, and immune-stimulating therapies, using checkpoint antibodies targeting CTLA-
4, PD-1 or PD-L1. Very recent studies suggest that also MCC patients benefit from a treatment
with checkpoint antibodies. Nevertheless, in an advanced metastatic stage, a cure for both of
these aggressive malignancies is still hard to achieve: while only a subset of patients experience
durable benefit from the immune-based therapies, the widely applicable targeted therapies
struggle with development of resistances that inevitably occur in most patients, and finally lead
to their death. The four articles included in this thesis addressed current questions concerning
therapy and carcinogenesis of melanoma and MCC. Moreover, they are discussed in the light of
the up-to-date research regarding targeted and immune-based therapies. In article I we
demonstrated that besides apoptosis, MAPK pathway inhibition in BRAF-mutated melanoma
cells also induces senescence, a permanent cell cycle arrest. These cells may provide a source
for relapse, as even permanently arrested cancer cells can contribute to a pro-tumorigenic
milieu. To identify molecular factors determining the differential response, we established M14
melanoma cell line derived single cell clones that either undergo cell death or arrest when
treated with BRAF/MEK inhibitors. Using these single cell clones, we demonstrated in article IV
that downregulation of the pro-apoptotic BH3-only protein BIK via epigenetic silencing is
involved in apoptosis deficiency, which can be overcome by HDAC inhibitors. These
observations provide a possible explanation for the lack of a complete and durable response to
MAPK inhibitor treatment in melanoma patients, and suggest the application of HDAC inhibitors
as a complimentary therapy to MAPK pathway inhibition. Concerning MCC, we scrutinized the
interactions between the Merkel cell polyomavirus’ (MCV) T antigens (TA) and the tumor
suppressors p53 and Rb in article II and III, respectively. In article III, we demonstrated that the
cell cycle master regulator Rb is the crucial target of MCV large T (LT), while it - in contrast to
2

other polyomavirus LTs - exhibits much lower affinity to the related proteins p107 and p130.
Knockdown of MCV LT led to proliferation arrest in MCC cells, which can be rescued by
knockdown of Rb, but not by knockdown of p107 and p130. Contrary to Rb, restriction of p53 in
MCC seems to be independent of the MCV TAs, as we demonstrated in article II. In conclusion,
the presented thesis has revealed new molecular details, regarding the response of melanoma
cells towards an important treatment modality and the mechanisms of viral carcinogenesis in
MCC.
3

3. Zusammenfassung
Die häufigsten Tumore weltweit sind Neoplasien der Haut; glücklicherweise sind die meisten
dieser benigne oder semi-maligne und gut behandelbar. Die beiden aggressivsten und
tödlichsten Formen bösartiger Hauttumoren sind das Melanom und das Merkelzell-Karzinom
(MCC), welche verantwortlich für über 90% aller durch Hauttumore verursachten Todesfälle
sind. Im letzten Jahrzehnt gab es jedoch erstaunliche Fortschritte in der Therapie des malignen
Melanoms, was vor allem durch das Aufkommen der zielgerichteten Therapien wie den BRAF
oder MEK Inhibitoren und den immunstimulierenden Therapien, welche Checkpoint-Antikörper
gegen CTLA-4, PD-1 oder PD-L1 verwenden, bedingt ist. Neueste Studien legen nahe, dass auch
MCC Patienten von diesen Checkpoint-Antikörpern profitieren können. In fortgeschrittenen,
metastasierten Stadien ist jedoch für beide Malignitäten eine Heilung immer noch sehr schwer
erreichbar: nur eine kleine Gruppe der Patienten erreichen einen dauerhaften Nutzen durch die
Immuntherapien, während die breit anwendbaren zielgerichteten Therapien mit der
Entwicklung von Resistenzen zu kämpfen haben, welche unausweichlich in den meisten
Patienten entstehen und letztendlich zu deren Tod führen. Die vier dieser Dissertation
beigefügten Publikationen adressierten aktuelle Fragestellungen bezüglich Therapie und
Karzinogenese des Melanoms und des MCCs. Des Weiteren werden diese im Licht des heutigen
Forschungsstandes diskutiert, im Besonderen mit Blick auf die zielgerichteten und
immunbasierten Therapien. In Publikation I zeigten wir, dass Inhibition des MAPK Signalwegs in
BRAF-mutierten Melanom-Zellen neben Apoptose auch zu Seneszenz, einem permanenten
Zellzyklusarrest, führen kann. Diese Zellen können der Ursprung der Resistenzbildung sein, da
auch permanent arretierte Krebszellen zu einem Tumor-fördernden Milieu beitragen können.
Um molekulare Faktoren zu identifizieren, die für diese unterschiedliche Behandlungsreaktion
ursächlich sind, haben wir Einzelzellklone aus der M14 Melanom-Zelllinie etabliert, welche
entweder mit Zelltod oder Arrest auf die BRAF/MEK Inhibitor Behandlung reagieren. Mit Hilfe
dieser Klone zeigten wir in Publikation IV, dass die Herunterregulierung des pro-apoptotischen
BH3-only Proteins BIK durch einen epigenetischen Mechanismus zur Apoptose-Resistenz dieser
Zellen führt, was durch den Einsatz von HDAC-Inhibitoren umgangen werden kann. Diese
Beobachtungen bieten eine mögliche Erklärung für das Ausbleiben eines vollständigen und
4

dauerhaften Ansprechens auf die MAPK-Inhibitor Behandlung der Melanom-Patienten, und
legen den Einsatz von HDAC-Inhibitoren als komplementäre Therapieoption nahe. Beim MCC
haben wir jeweils die Interaktion zwischen den Merkelzell-Polyomavirus (MCV) T Antigenen (TA)
und den Tumor-Suppressoren p53 und Rb in Publikation II und III näher betrachtet. In
Publikation III haben wir gezeigt, dass das zentrale, Zellzyklus-regulierende Protein Rb das
vorrangige Ziel des MCV large T Antigens (LT) ist, während es - im Gegensatz zu anderen
Polyomavirus-LTs - viel weniger Affinität zu den verwandten Proteinen p107 und p 130 aufweist.
Der Knockdown des MCV LT führte zu Proliferationsarrest in MCC Zellen, welcher durch
Knockdown von Rb aufgehoben werden konnte, nicht jedoch durch Knockdown von p107 und
p130. Die Restriktion von p53 scheint im Gegensatz zu Rb im MCC unabhängig von den MCV TAs
zu sein, wie wir in Publikation II gezeigt haben. Zusammenfassend gibt diese Dissertation
Aufschluss über neue molekulare Zusammenhänge bezüglich der Reaktion von Melanom-Zellen
gegenüber einer wichtigen Behandlungsmöglichkeit und den Mechanismen der viralen
Karzinogenese des MCC.
5

4. Introduction
4.1. The epidermis: macroscopic and cellular structure
The skin is the largest organ of the human body and has an important role in immunity, water
homeostasis, thermal regulation, sensation, and a multitude of other functions. It is build up in
three layers of ectodermal tissue: the epidermis, the dermis, and the hypodermis (subcutaneous
tissue). The outer layer of the skin - the epidermis - is the first mechanical and immunological
barrier between the body and environmental threats like pathogens, radiation or chemicals,
some of which have the potential to cause DNA damage and thereby can be classified as
carcinogenic substances (1). It contains no blood vessels and is nourished by diffusion from the
underlying dermis. The epidermis is subdivided into five layers: stratum basale, stratum
spinosum, stratum granulosum, stratum lucidum, and stratum corneum (see Fig. 1A). The most
common cells in the epidermis are keratinocytes (about 95%), which are continuously generated
at the basal layer, wander up the strata, while changing their appearance during the process of
keratinization and finally die before they reach the corneum. Besides immunologically active
Langerhans cells, residing within the stratum spinosum, two additional cell types are found in
the basal layer: (I) Merkel cells, which are touch sensitive oval-shaped mechanoreceptors that
form synaptic contacts with sensory neurons and are abundant in sensitive skin and (II)
melanocytes, melanin producing cells with dendritic arms mainly responsible for skin coloring
and UV protection (2, 3).
Highly aggressive neoplastic skin malignancies named after these two cell types are known as
Merkel cell carcinoma (MCC) (Fig. 1B) and melanoma (Fig. 1C), respectively. In the four
publications this thesis is based on, established cell lines derived from the aforementioned two
skin cancers were used to address and elucidate molecular biological questions arising in the
context of up-to-date cancer research.
6

Fig. 1: Structural overview of the epidermis; Merkel cell carcinoma and melanoma lesions. A: layers and cell types commonly found in the epidermis (image adapted from (4)). B: Merkel cell carcinoma; a dome-shaped nodule present on the leg of a patient (image adapted from (5)). C: Typical superficial spreading melanoma lesion (image adapted from (6)).
4.2. Merkel cell carcinoma (MCC)
Merkel cell carcinoma is a very aggressive neuroendocrine skin cancer, occurring mostly in
elderly and/or immunosuppressed patients. The median age of patients diagnosed with MCC
is 76.2 years for women and 73.6 years for men (7). Although MCC is still a rare disease, with
approximately 0.6 new cases per 100.000, its incidence is steadily increasing in different
countries (7). Most often the tumors arise in sun-exposed areas like the head and neck (8).
Clinical characteristics for MCC have been summarized under the acronym AEIOU:
asymptomatic/lack of tenderness, expanding rapidly, immunosuppression, older than age 50,
and UV exposed site on a fair-skinned person (9). Diagnosis of MCC can be challenging, in
particular when based on morphology, as small cell lung cancer displays very similar features
(10). An important characteristic to distinguish MCC from other tumors is the presence of peri-
nuclear cyto-keratin (CK)-20. Moreover, the lack of thyroid transcription factor-1 (TTF-1) may
also serve as a marker (10).
7

Current treatment therapies are surgical resection of the primary tumor, commonly followed by
radiotherapy which grants good loco-regional control. As MCC is associated with occurrence of
early nodal and distant metastasis, also chemotherapy can be applied in advanced stages and
has a high response rate of 60-75%, which is, however, only of very limited duration and not
resulting in significantly increased overall survival (OS) (11, 12). Therefore, chemotherapeutic
regimens are often only applied with palliative intention (13). Very recent reports suggest that
immune checkpoint blockade may be able to achieve lasting responses in a large proportion of
patients with metastatic MCC (14, 15); this aspect will be discussed later.
Transformation of epidermal Merkel cells had been considered to be the source of MCC,
originally termed trabecular neuroendocrine carcinoma (16, 17). This view, however, has been
challenged recently and epidermal stem cells, other skin derived precursor cells as well as pre-B
cells are discussed as possible cells of origin for MCC (18, 19). Although the cell of origin is
unclear, understanding of the molecular-biological events involved in development and
progression of MCC has made major advances in the last decade: the fact that besides UV-
exposure also immunosuppression is a risk factor for MCC has provided a rationale to search for
a viral etiology. In 2008, DNA sequence analysis finally revealed the presence of the Merkel cell
polyomavirus (MCV) in 80% of MCC tumors (20). In most cases, the viral DNA is clonally
integrated into the genome of the MCV-positive tumor cells, suggesting MCV infection as a
crucial event in the pathogenesis of MCC.
4.2.1. Merkel cell polyomavirus (MCV)
MCV is a double-stranded DNA virus of the Polyomaviridae family consisting of 73 species
identified so far; 13 of these are known to infect humans (21). Since the discovery of the simian
virus 40 (SV40) decades ago, polyomaviruses have been suspected to bear the potential to
induce human cancer, because in experimental animal studies virus infection leads to tumor
formation following integration of viral DNA in the genome of the host cells (22-25). Still, MCV is
so far the only member of this virus family which could be linked to a human cancer. MCV is an
ubiquitary virus which can be detected frequently on human skin and other environmental
surfaces (26). Furthermore, about 80% of all people over the age of 50 are sero-positive for
8

antibodies against the MCV capsid protein VP1 (27, 28). The reasons why MCC is nevertheless a
rare cancer are not yet fully understood. The circumstance that specific mutations truncating
one of the viral proteins in conjunction with accidental integration of the viral genome into the
human genome has to occur, may contribute to its uncommonness. Furthermore, rarity of the
cell of origin and/or rarity of its infection by MCV may contribute to the fact that MCC is
relatively uncommon, despite the high prevalence of MCV (29).
The MCV genome consists of 5,387 base pairs and encodes, like other polyomaviruses, for two
distinct groups of proteins. The T antigens (TA), which bear transforming potential, are
expressed early after infection. In case of MCV, a large T antigen (LT), small T antigen (ST), and
57k T antigen (57kT) are derived by alternative splicing of a common precursor mRNA (5, 20).
Additionally, in an alternate coding frame ALTO, a protein of unknown function, is encoded by
the LT mRNA (30). The second group of viral proteins consists of the capsid proteins (VP1-3),
which are expressed in later stages of the viral life cycle and constitute the envelope of newly
formed viruses. These transport the viral genome to other cells after host cell lysis (5). For MCV,
however, VP3 is inactive or not expressed at all. An overview of the MCV genome organization is
summarized in Fig. 2A. Several oncogenic viruses require the cellular DNA replication machinery
for their own reproduction and have therefore acquired the ability to activate the host’s cell
cycle machinery. As a consequence, they presumably acquired transforming potential (31).
Transformation induced by polyomaviruses is attributed to the T antigens, which can interfere
with different cell cycle regulatory pathways and proliferation cascades and are able to impair
tumor suppressor mechanisms (31). The different MCV T antigens share the N-terminal amino-
acid sequence containing a DnaJ domain for binding the cellular heat shock protein HSC70 and
the so called conserved region 1 (CR1). However, they differ substantially in the C-terminal
region, determining the functional variability of the T antigen splice products (20, 32) (Fig. 2B).
The LT antigen is encoded by two exons and has several functions in MCV infection like initiation
of viral replication and altering the host cell’s cell cycle (5, 33). Besides the above mentioned
DnaJ and CR1 domain, several further domains conserved among polyomavirus LTs are present
in MCV LT: the retinoblastoma protein (Rb) binding domain, a specific nuclear localization
sequence (NLS), the origin-binding domain (OBD) as well as a DNA binding and a helicase
domain. The presence of the NLS results in nuclear localization of MCV LT when expressed in
9

mammalian cells (34). From studies with SV40 polyomavirus LT, it is known that the OBD and
helicase region also mediate interactions with a multitude of cellular proteins - the most
prominent of them is the tumor suppressor protein p53. Though, MCV LT does not bind to p53
(35-37). In most cases of MCC tumor cells, the integrated MCV genome contains mutations
truncating the C-terminus of LT, aborting the virus’s ability to replicate and also eliminating
growth suppressive properties of the C-terminus (37-39). Generally, however, the Rb-binding
site is preserved in the MCC associated truncated versions of the LT protein.
The MCV ST antigen consists of 186 amino acids and plays a role in viral replication and cellular
transformation (5). The C-terminal region is produced via transcriptional read-through of the
exon splice site used by LT and 57kT. ST can be found in the nucleus as well as in the cytoplasm
(40). The typical polyomavirus protein phosphatase 2A (PP2A) Aα subunit binding site is unique
for the ST antigen and is important for viral replication and virus-induced transformation in
other polyomaviruses (41). A recently discovered MCV ST domain is the LT-stabilization domain,
which mediates inactivation of the ubiquitin ligase SCF (Fbw7) and thereby represses
proteasomal degradation of LT (42).
In contrast, little is known about the 57k protein that shares a MCV unique region (MUR) with
LT, consisting of a sequence located between the first exon and the OBD, which contains the Rb-
binding domain. Furthermore, there is some degree of homology between 57kT and SV40 17kT,
what plays a role in promoting host cell proliferation (43, 44). In tumor cells nevertheless, a
distinction between LT and 57kT is not relevant because the truncating mutations in most cases
delete all diverging C-terminal parts of the two proteins. The MCV genome resembles other
polyomaviruses not only in its organization and proteins encoded, but also – just like other
family members - encodes a microRNA, which is involved in regulating early viral gene
expression (45).
10

Fig. 2: Mapping of the MCV genome and the alternatively spliced MCV T antigens. A: The MCV genome consists of a non-coding control region (NCCR) containing promoter elements as well as the origin of replication. An early gene region contains the large T antigen (LT), small T antigen (ST), 57kT antigen (57kT), and an alternative T antigen open reading frame (ALTO). The late gene region is coding for the capsid proteins (VP1-3) and a microRNA (miRNA) regulating early viral transcription levels (image adapted from (5)). B: All T antigen isoforms originate in one pre-mRNA and encode the conserved CR1 epitope and DnaJ (HSC70 binding) domain. Unique for the ST antigen are two PP2A binding sites, a PP2A Aβ/PP4C binding site, and a large T-stabilization domain. LT and 57kT share a MCV-unique region in the second exon with a retinoblastoma protein (Rb) binding domain and the origin binding domain (OBD), while LT additionally has C-terminal zinc finger, leucine zipper, ATPase, and helicase domains (5, 46).
A
B
11
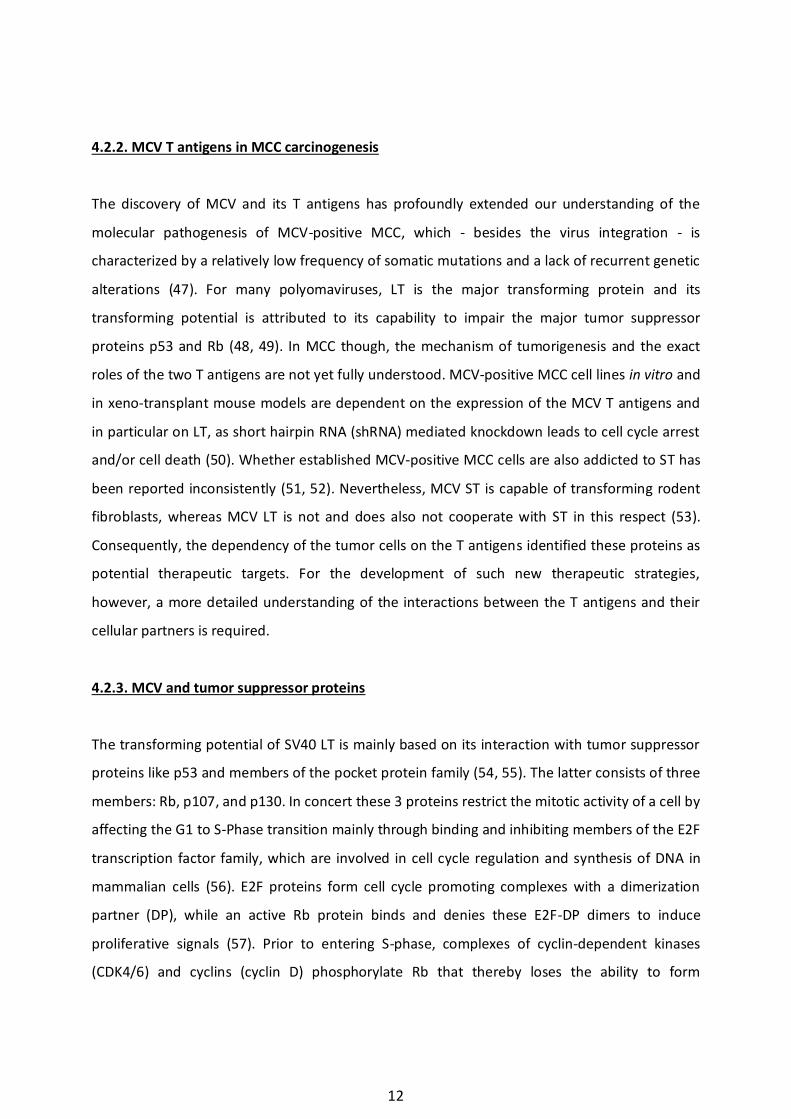
4.2.2. MCV T antigens in MCC carcinogenesis
The discovery of MCV and its T antigens has profoundly extended our understanding of the
molecular pathogenesis of MCV-positive MCC, which - besides the virus integration - is
characterized by a relatively low frequency of somatic mutations and a lack of recurrent genetic
alterations (47). For many polyomaviruses, LT is the major transforming protein and its
transforming potential is attributed to its capability to impair the major tumor suppressor
proteins p53 and Rb (48, 49). In MCC though, the mechanism of tumorigenesis and the exact
roles of the two T antigens are not yet fully understood. MCV-positive MCC cell lines in vitro and
in xeno-transplant mouse models are dependent on the expression of the MCV T antigens and
in particular on LT, as short hairpin RNA (shRNA) mediated knockdown leads to cell cycle arrest
and/or cell death (50). Whether established MCV-positive MCC cells are also addicted to ST has
been reported inconsistently (51, 52). Nevertheless, MCV ST is capable of transforming rodent
fibroblasts, whereas MCV LT is not and does also not cooperate with ST in this respect (53).
Consequently, the dependency of the tumor cells on the T antigens identified these proteins as
potential therapeutic targets. For the development of such new therapeutic strategies,
however, a more detailed understanding of the interactions between the T antigens and their
cellular partners is required.
4.2.3. MCV and tumor suppressor proteins
The transforming potential of SV40 LT is mainly based on its interaction with tumor suppressor
proteins like p53 and members of the pocket protein family (54, 55). The latter consists of three
members: Rb, p107, and p130. In concert these 3 proteins restrict the mitotic activity of a cell by
affecting the G1 to S-Phase transition mainly through binding and inhibiting members of the E2F
transcription factor family, which are involved in cell cycle regulation and synthesis of DNA in
mammalian cells (56). E2F proteins form cell cycle promoting complexes with a dimerization
partner (DP), while an active Rb protein binds and denies these E2F-DP dimers to induce
proliferative signals (57). Prior to entering S-phase, complexes of cyclin-dependent kinases
(CDK4/6) and cyclins (cyclin D) phosphorylate Rb that thereby loses the ability to form
12

complexes with E2F-DP and is deactivated (58, 59). Rb usually remains in a phosphorylated state
throughout S, G2, and M phase. The E2F proteins are generally split into two functional groups:
transcription activators and repressors. In activators it has been shown that E2F binding with Rb
masks the transactivation domain responsible for transcription activation, while in E2F
repressors binding of pocket proteins (especially p107 and p130) leads to formation of repressor
complexes to silence target genes (60, 61). Historically, it has been supposed that the pocket
proteins suppress transcriptional activity by direct interaction with chromatin-bound E2F
molecules at their corresponding promoters, what - according to some studies - appears to be
true only for p107 and p130 (62-64). Rb however, is undetectable at these promoters in the
context of transcriptional repression. Importantly, Rb-mediated and p107/p130-mediated cell
cycle control is not redundant; indeed, a lot of E2F-responsive genes are dysregulated in
p107/p130-deficient cells (56).
Another important tumor suppressor protein is the aforementioned p53, which is a
transcription factor that is found inactivated by mutations or deletions in more than 50% of
human tumors (65). P53 is also referred to as the “guardian of the genome”, due to its central
role in the response to genotoxic stress and UV radiation. Depending on the context, p53 can
induce cell cycle arrest, senescence, DNA repair, and apoptosis and contributes thereby to
genomic stability and counteracts tumor formation (66). Various intra- and extracellular stress
induced stimuli can activate p53; these include for example: DNA damage, oxidative stress,
osmotic shock, ribonucleotide depletion, loss of adhesion or deregulated oncogene expression
(67-69). P53 activity is mainly regulated by two mechanisms: (I) phosphorylation of certain N-
terminal serine/threonine residues enhances its transcriptional activity. (II) Increasing or
decreasing the half-life of the protein. The latter is mediated by murine double minute 2
(MDM2) or in humans human double minute 2 (HDM2), a E3 ubiquitin ligase which tags p53 for
proteasomal degradation (70). Because of an auto-regulatory mechanism, p53 levels are kept
low in unstressed cells, as HDM2 expression is regulated by p53. Stress induced transcription of
phosphatase and tensin homologue (PTEN) for example, inhibits HDM2/p53 complex formation
and subsequently leads to p53 activation (71). In contrast to SV40 LT, MCV LT was reported not
to be able to bind p53 and in the MCC associated LT proteins the C-terminus responsible for
direct interaction of SV40 LT with p53 is missing (39, 72). However, the LxCxE motif known to be
13

essential for binding of the Rb family proteins is preserved in MCV LT expressed in MCC cells and
it has been demonstrated that this LxCxE motif is required for MCV LT to promote growth of
MCC cells (73). One publication included in this thesis (article III) investigates in detail which of
the three Rb family proteins are bound and inactivated by the MCV LT antigen in MCC, while a
second paper (article II) describes whether MCV T antigens are involved in restricting the tumor
suppressor function of p53 in MCC.
4.3. Melanoma
Melanoma is a highly malignant tumor derived from the melanin producing cells in the
epidermis, the melanocytes (Fig. 1C). Established risk factors for the development of melanoma
include light skin and UV exposure, in particular excessive sunburns in childhood (74). The
American Cancer Society’s estimated lifetime risk of Caucasian men being diagnosed with
melanoma is 1/35, while for Caucasian women it is 1/54 (75). Despite accounting for only 4% of
all skin cancers, about 80% of skin cancer related deaths are attributed to melanoma and the 5-
year survival for advanced metastatic melanoma still remains low, ranging from 12-28% (76-79).
According to the American Joint Committee on Cancer (AJCC), melanoma is classified in four
clinical stages with some stages being further subdivided regarding the size of the primary
tumor, involvement of local or distant lymph nodes, and the presence and location of distant
metastasis (see Table 1&2). Patients with Stage IV melanoma are associated with a very poor
prognosis and a mean survival of 8–10 months in large cohort analysis studies. A more accurate
staging categorizes patients into stage IV sub-groups with only cutaneous metastases (M1a),
lung metastases (M1b) or other visceral metastases (M1c), which yield associated 5-year
survival rates of 18.8%, 6.7%, and 9.5%, respectively (77). When detected at early stage I,
excision of the primary tumor results in an almost 100% cure rate. Therefore, self-examination
and self-awareness can be lifesaving. Typical signs allowing melanoma detection by visual
inspection are summarized in the “ABCDE“-rule: Asymmetry, border irregularity, color variation,
diameter greater than 6mm, and evolving over time (78, 80) (Fig. 3). As mentioned above, the
prognosis is much worse if the cancer has already spread and the 5-year OS correlates directly
with the stage of the primary tumor and the presence of nodal and/or distant metastasis.
14

Today’s treatment options in this stage are mainly immuno-based treatments or targeted
therapies, which will be described later on. Other therapy options, like radiation or cryotherapy,
merely play a minor role in the treatment of melanoma (81).
Fig. 3: “ABCDE” characteristics of melanoma. ABCD characteristics help to distinguish between malignant melanoma and an ordinary mole (image adapted from (82)). Ordinary moles usually have a symmetrical form, even borders, one color, are smaller than 6mm and don’t change or evolve over time. Malignant melanomas often present as asymmetrical lesions with uneven borders, have multiple colors varying from brown to black or blue, and grow larger than a 6mm diameter while changing over time (83).
symmetrical smaller than 6mm
one color even borders ordinary nevus
asymmetrical larger than 6mm
Multiple colors
uneven borders evolving - changes in size, shape and color
15

Table 1: TNM staging categories for cutaneous melanoma. Abbreviations: Tis, tumor in situ; NA, not applicable; LDH, lactate dehydrogenase. *Micrometastases are diagnosed after sentinel lymph node biopsy. #Macrometastases are defined as clinically detectable nodal metastases confirmed pathologically. Data obtained from (77).
Primary Tumor Thickness (mm) Ulceration Status/Mitosis
T
Tis NA NA
T1 ≤ 1.00
a: Without ulceration and mitosis < 1/mm2
b: With ulceration or mitosis ≥ 1/mm2
T2 1.01-2.00 a: Without ulceration
b: With ulceration
T3 2.01-4.00 a: Without ulceration
b: With ulceration
T4 >4.00 a: Without ulceration
b: With ulceration Nodal Involvement No. of Metastatic Nodes Nodal Metastatic Burden
N
N0 0 NA
N1 1 a: Micrometastasis* b: Macrometastasis#
N2 2-3
a: Micrometastasis* b: Macrometastasis#
c: In tranist metastasis/satellites without metastatic nodes
N3
4+ metastatic nodes, or matted nodes, or in Transit metastases/satellites with
metastatic nodes
Distant Metastasis Site Serum LDH
M
M0 No distant metastasis NA
M1a Distant skin, subcutaneous, or nodal metastases Normal
M1b Lung metastases Normal
M1c All other visceral metastases Normal
Any distant metastases Elevated
16

Table 2: Anatomic stage groupings for cutaneous melanoma. *Clinical staging includes microstaging of the primary melanoma and clinical/ radiologic evaluation for metastases. By convention, it should be used after complete excision of the primary melanoma with clinical assessment for regional and distant metastases. #Pathologic staging includes microstaging of the primary melanoma and pathologic information about the regional lymph nodes after partial (i.e., sentinel node biopsy) or complete lymphadenectomy. Pathologic stage 0 or stage IA patients are the exception; they do not require pathologic evaluation of their lymph nodes. Data obtained from (77).
Clinical Staging* Pathologic Staging#
T N M T N M 0 Tis N0 M0 0 Tis N0 M0
IA T1a N0 M0 IA T1a N0 M0
IB T1b N0 M0
IB T1b N0 M0
T2a N0 M0 T2a N0 M0
IIA T2b N0 M0
IIA T2b N0 M0
T3a N0 M0 T3a N0 M0
IIB T3b N0 M0
IIB T3b N0 M0
T4a N0 M0 T4a N0 M0
IIC T4b N0 M0 IIC T4b N0 M0
III Any T N>0 M0
IIIA T1-4a N1a M0
T1-4a N2a M0
IIIB
T1-4b N1a M0 T1-4b N2a M0
T1-4a N1b M0
T1-4a N2b M0 T1-4a N2c M0
IIIC
T1-4b N1b M0
T1-4b N2b M0 T1-4b N2c M0
Any T N3 M0
IV Any T Any N M1 IV Any T Any N M1
17

Until recently, the standard first line treatment was dacarbazine, the only chemotherapeutic
agent approved for the treatment of metastatic melanoma by the Food and Drug
Administration (FDA) before 2011. The response rates of for dacabazine were rather low (7 to
12%) and the median OS of treated stage IV melanoma patients was only 5 to 8 months (84-87).
In the last 15 years, however, major progress in understanding the molecular biological
mechanisms underlying the process of developing melanoma has been made: a set of frequent
molecular changes that occur during the transformation of a melanocyte to a malignant
melanoma cell have been described, leading to the loss of cell cycle control. Growth stimulating
mutations in the proto-oncogenes NRAS or BRAF, resulting in hyper-activation of the mitogen-
activated protein kinase (MAPK) pathway, which is described later, have been reported in
roughly 90% of melanomas (88, 89). However, these mutations do not suffice to evoke
malignancy since proliferation is mostly interrupted by tumor-suppressor mechanisms that
activate stress induced senescence (90); this is probably the situation in most benign nevi.
Additional mutations occurring in the tumor-suppressor genes cyclin-dependent kinase inhibitor
2A (CDKN2A), which encodes for 2 distinct tumor-suppressor proteins p16INK4A and p14ARF, PTEN
or p53 are found with moderate frequencies in melanoma and may contribute to overcoming
senescence (76). Furthermore, changes in genes or expression patterns of genes that are
involved in melanocytic differentiation or cell adhesion have been described to play a role on
the way towards malignancy. These are for example amplification of microphthalmia-associated
transcription factor (MITF), decreased expression or loss of E-cadherin and melanocyte-specific
gene melastatin1 (TRPM1) and aberrant or increased expression of N-cadherin, αVβ3 integrin,
survivin and matrix metalloproteinase2 (MMP-2) (76). A more recent approach based on a large
number of melanoma samples categorizes four different melanoma subtypes, regarding the
most common driver oncogenes found: mutant BRAF, mutant RAS, mutant NF1 or triple wild-
type (89). All three named oncogenes are part of the MAPK pathway, highlighting its central role
in melanoma. The following chapter takes a closer look at this pathway and describes several
approaches provided by targeted therapies to exploit melanoma’s dependency on it (oncogene
addiction), what has become a pillar of modern day melanoma treatment.
18

4.3.1. The MAPK pathway as a therapeutic target in melanoma
Activation of the MAPK pathway occurs after binding of an extracellular growth stimulating
signaling molecule, like epidermal growth factor (EGF), to a transmembrane receptor tyrosine
kinase (RTK), such as the epidermal growth factor receptor (EGFR) (91). Receptor activation and
phosphorylation of its tyrosine residues leads to the recruitment of docking proteins like GRB2,
containing a SH2 domain that binds to the phosphor-tyrosine residues of the activated receptor.
GRB2 additionally binds the guanine nucleotide exchange factor SOS with its two SH3 domains.
When the GRB2-SOS complex docks to a phosphorylated RTK, SOS becomes activated and that
promotes the removal of GDP from a RAS protein. RAS can now bind a GTP molecule and
become active, resulting in initiation of RAS-RAF complex formation followed by
phosphorylation of MEK1/2, which in turn catalyzes the phosphorylation of ERK1/2. ERKs
translocate into the nucleus and regulate a multitude of cellular processes, like embryogenesis,
cell differentiation, cell proliferation, and cell death by interaction with several transcription
factors (92).
Some of the first oncogenes described in humans encode for the aforementioned RAS proteins
with three main isotypes (HRAS, KRAS, and NRAS), and RAS mutations are also frequently found
in melanoma, most of them being NRAS mutations (93). Unfortunately, direct inhibition of RAS
with tipifarnib, a farnesyltransferase inhibitor (FTI), has been ineffective, making RAS elusive as
a potential single target for effective treatment of metastatic melanoma (94). It is thought that
the RAS proteins can escape that inhibition by prenylation through a geranylgeranyl transferase
that transfers an alternate isoprenoid group to RAS and allows continued activity (95, 96).
Nevertheless, targeting RAS in a multi-agent, multi-targeted approach may hold promise: a
phase I clinical trial combining tipifarnib and sorafenib (a BRAF-inhibitor) showed stable disease
in patients with different cancers, including one with metastatic melanoma (97). Additionally, an
in vitro study revealed that the combination of lonafarnib (another FTI) and sorafenib led to
improved sorafenib-induced apoptosis and suppression of melanoma cell invasion in raft culture
assays (98).
The RTK c-kit is a transmembrane protein that transduces extracellular stimuli into the
cytoplasm and universally expressed in mature human melanocytes, where it fosters
19

proliferation and survival trough signaling pathways like MAPK, PI3K/AKT, and JAK-STAT by
receptor dimerization and auto-phosphorylation after ligand binding. Although rare in most
cancers, relatively high numbers of c-kit-activating mutations and/or amplifications (28–39%)
have been reported in melanomas of mucosal, acral, and sun-damaged skin (99, 100). Preclinical
data demonstrated that melanoma cells harboring c-kit mutations show reduced proliferation
and increased apoptosis, along with suppression of the MAPK, PI3K, JAK-STAT, and anti-
apoptotic pathways, when treated with imatinib, an ATP-competitive inhibitor of several
tyrosine kinases (101). Two clinical trials with selected melanoma patients that harbor c-kit
mutations or amplifications displayed clinically significant results: one study reported a median
progression-free survival (PFS) of 12 weeks and an OS of 46 weeks (102), while another study
resulted in a median PFS of 3.5 months and an OS of 14 months (103). Other RTK inhibitors, like
dasatinib and nilotinib, have also demonstrated responses in melanoma patients with c-kit
mutations (104, 105), while lacking efficacy in unselected melanoma patients, similar to imatinib
(106-108).
Further and essentially the most important targetable mutations in melanoma alter Valine 600
in the in the serine/threonine-protein kinase BRAF, rendering it constitutively active. Indeed,
approximately 50% of melanomas harbor a mutation in this kinase, with the substitution of
valine to the phosphorylation mimicking glutamic acid being the most common (BRAFV600E),
whereas lysine or arginine substitutions have also been reported (109, 110). Blocking specifically
the mutated BRAF protein with a small molecule inhibitor leads to subsequent cell cycle arrest
and apoptosis in melanoma cells (111). This has fundamentally changed the treatment options
for metastatic and/or unresectable melanoma with BRAF mutation: in 2011, the FDA approved
the first selective BRAFV600E inhibitor for melanoma called vemurafenib (PLX4032), which
showed impressive clinical results (112, 113). In phase I and II clinical trials, significant tumor
shrinkage and treatment-induced clinical responses were reported in more than 50% of the
patients treated, and improved OS and PFS in patients with BRAFV600E mutant metastatic
melanoma could be achieved (114, 115). Furthermore, a phase III study demonstrated superior
outcome compared to cytostatic treatment: for patients with the BRAFV600E mutation, the
estimated median PFS in the vemurafenib group was 6.9 months compared to 1.6 months for
the dacarbazine group (116). Until now, new selective BRAF inhibitors are continuously under
20

development and subject to clinical trials, and some have also achieved FDA approval, like
dabrafenib (117).
As BRAF-mutated cells frequently possess enhanced sensitivity towards MEK inhibition (118),
MEK1/2 inhibitors like trametinib - which has gained FDA approval in 2013 - also yielded
promising results in the treatment of melanoma (119). The combination of the BRAFV600E
inhibitor dabrafenib and trametinib in inhibitor-treatment naive patients showed a significant
improvement in PFS/OS, and a reduction of serious side effects like the appearance of
cutaneous squamous cell carcinomas was observed as well (120-122). Therefore, combined
targeting of mutant BRAF and the downstream kinase MEK has become today’s standard of care
for patients with advanced BRAFV600 mutated melanoma (123, 124). An overview of the MAPK
pathway and established or developmental drugs to inhibit key kinases are depicted in Fig. 4.
Despite this exciting progress, most patients with BRAF or MEK inhibitor-responsive melanoma
show - due to outgrowth of treatment resistant cells - tumor progression or relapse within less
than a year , which can only be delayed by combinatory treatment (BRAF + MEK inhibitor) (125).
Hence, uncovering the molecular mechanisms of intrinsic and acquired resistances to
BRAF/MEK inhibition has been a major duty in melanoma research over the last years. In this
respect, it has been demonstrated that most resistances can be classified in one of the following
three patterns: (I) Reactivation of ERK signaling, what can be caused by up-regulation of
receptor tyrosine kinases like PDGFR-β, expression of mutant NRAS variants, alternatively
spliced drug-insensitive BRAFV600E variants or BRAFV600E amplification (126, 127). (II) Activation of
alternative pathways like the phosphoinositide 3-kinase/protein kinase B (PI3K/AKT) pathway,
which is commonly linked to intrinsic and/or acquired resistance to MAPK inhibition in
melanoma cells (128, 129). (III) Dysfunctional apoptotic signaling can be the cause of resistance
(130-133). The latter was the major topic of this thesis and resulted in the first-author
publication article IV. The next chapter focuses mainly on this issue.
21

Fig. 4: Targeting the MAPK pathway with small molecule inhibitors. Growth Factor (GF) binding to a trans-membrane receptor tyrosine kinase (RTK) transduces the proliferation signal into the cytoplasm. From there, a signaling cascade from RAS to RAF to MEK to ERK leads the stimulus into the nucleus, where gene expression is modified and promotes proliferation, survival, angiogenesis, and in case of cancer cells, invasion or metastases. V600E-mutant BRAF creates such intracellular signals without the binding of an extracellular stimulator. Different small molecule inhibitors can bind to key kinases of the MAPK signaling cascade to suppress growth stimulating signals, what results in cell death or cell cycle arrest.
22

4.3.2. MAPK inhibition & apoptosis in melanoma
Apoptosis, a caspase dependent form of programmed cell death, is a highly regulated and
controlled process with pivotal importance in multicellular organisms and central roles in
development and homeostasis (134). Two major apoptosis mediating pathways have been
described: the extrinsic pathway is characterized by an extracellular ligand (e.g. TNFα/FAS),
which binds to a specific death-receptor and activates caspase 8 or 10. Extrinsic mediated
apoptosis has a crucial function in inflammation and the immune response to infected/aberrant
cells. The intrinsic apoptosis pathway is triggered by intracellular stimuli, like irreparable DNA
damage or cytotoxic stress, and is activated via cytochrome C release from the mitochondria
and subsequent caspase 9 cleavage. After distinct signaling cascades, which are strictly
regulated, both pathways finally result in effector caspase 3 cleavage and subsequent death
substrate activation, leading to the execution of the cell death program (134, 135). Members of
the B-cell lymphoma (Bcl)-2 protein family play a central role in initiation and regulation of
intrinsic apoptosis, and can be divided into three sub-groups : the first group includes the pro-
apoptotic Bcl-2 homology domain 3-only (BH3-only) proteins (BIM, BIK, BAD, BID, HRK, BMF,
NOXA and PUMA), which sensitize for or trigger apoptotic signals. These BH3-only proteins can
inhibit the second group, the anti-apoptotic Bcl-2 family members (BCL-2, BCL-xL, BCL-w, Bfl-1
and Mcl-1) that in turn bear the potential to functionally repress the third group, consisting of
the pro-apoptotic effectors BAK and BAX, which finally induce cytochrome C release from the
mitochondria (134, 136-138). Furthermore, it has been described that BH3-only protein induced
BAX/BAK activation, which is necessary for the execution of intrinsic apoptosis, is not only
indirectly achieved by blocking the anti-apoptotic Bcl-2 family members, but can also occur
directly through BID and BIM (139, 140). A general overview of the intrinsic apoptosis pathway
and the structural setup of the Bcl-2 family proteins is given in Fig. 5a&b.
The specificity of the BH3-only proteins is divergent: while BIM and PUMA appear to be less
selective and have the potential to bind all anti-apoptotic Bcl-2 proteins, Noxa targets only Mcl-
1 and Bfl-1, Bad has affinity for Bcl-2, Bcl-w and Bcl-X(L), while BIK/NBK inhibits specifically only
Bcl-2 and Bcl-X(L) (141, 142).
23

Fig. 5a: The intrinsic apoptosis pathway and its key proteins. The decision between life and death of a cell is made at the mitochondria and determined by a shift in the balance between pro- and anti- apoptotic factors. Intracellular stimuli like cytotoxic stress, DNA damage or oncogene activation can trigger the pro-apoptotic BH3-only members of the Bcl-2 family in a p53 mediated or p53 independent manner, while survival pathways, like the MAPK or PI3K/AKT pathway, can counteract the BH3-only protein activation. Once activated, BH3-only proteins inhibit the anti-apoptotic Bcl-2 members, what in turn leads to Bax/Bak activation and subsequent changes of the outer mitochondrial membrane permeability, releasing several inter-membrane factors like cytochrome C, SMAC or AIF (apoptosis inducing factor) into the cytosol. Cytochrome C triggers the formation of the apoptosome, an Apaf-1 (apoptosis activating factor 1) multimer, which allows binding and activation of initiator caspase 9 followed by cleavage of effector caspase 3 that has several targets (death substrates) to activate or inactivate. The apoptotic potential of the released factors is dependent on IAP (inhibitor of apoptosis) proteins like XIAP, which are antagonized by SMAC (Diablo) and other released factors like HtrA2/Omi. In contrast, the apoptotic activity of AIF seems to take place after translocation to the nucleus, and is caspase-independent (135, 138).
24

Fig. 5b: Members of the Bcl-2 protein family. The Bcl-2 protein family consists of 3 sub-groups: anti-apoptotic factors like the name-giving Bcl-2, pro-apoptotic effectors like Bax and Bak, and BH3-only initiators of apoptosis. One to four so called Bcl-2 homology domains (BH1-4) are found in all, while a transmembrane domain (TM) at the C-terminal side is present only in some family members. The BH1 and BH2 domains function predominantly in pore formation and dimerization with pro-apoptotic BH3-only members, and the BH3 domain has a role in homo- and hetero- dimerization between the Bcl-2 family members. The BH4 domain is unique for the anti-apoptotic Bcl-2 members, and interacts with or regulates several other proteins involved in apoptosis (138, 143).
25

Several mechanisms involved in activation of BH3-only proteins have been reported (138, 144):
phosphorylation, dephosphorylation, receptor triggered conformational changes or cleavage,
and p53 mediated induction of transcription. Furthermore, proteasomal degradation and
alternative splicing contribute to their diversity and regulation; for example, about 10 isoforms
have been described for BIM, with BIMS, BIML and BIMEL being most prominent (138, 145-148).
It has also been shown that transcriptional gene-silencing through epigenetic mechanisms, like
DNA methylation or histone modification, can play a part in downregulation of BH3-only
proteins, and this phenomenon is also associated with BRAF inhibitor resistance in melanoma
(144, 149).
As mentioned above, defects or aberrations in the apoptotic signaling cascades are a central
issue that can confer resistance to small molecule inhibitor treatment in melanoma. Indeed,
evasion of cell-death is a common feature of tumor cells and also considered as one of the
hallmarks of cancer (150). It has been reported that the intrinsic apoptosis pathway in
melanoma is suppressed by active BRAF signaling, inhibiting expression of the BH3-only protein
Bcl-2 interacting mediator of cell death (BIM) (147), whereas inhibition of the MAPK pathway
triggers stress stimuli that induce upregulation of BIM and PUMA for subsequent apoptosis in
melanoma cells (151-154). However, not all cells are killed, and the survivors may provide a
source for relapse or a niche supporting tumor regrowth (155). Therefore, the major topic of
this thesis and the two included publications dealing with melanoma, was to analyze the
response of melanoma cells to the BRAFV600 inhibitor vemurafenib and/or the MEK1/2 inhibitor
trametinib treatment (article I), and to determine molecular characteristics, which affect the cell
fate decision between death and survival (article IV).
4.3.3. Immunotherapy in melanoma
The immune system can recognize and target cancer cells, but is often held in check by
inhibitory signals, which in healthy cells mediate self-tolerance and thereby avoid collateral
tissue damage by an anti-microbial immune response (156). Avoiding immune destruction has
also been added as a new emerging hallmark of some and perhaps all cancers by Hanahan &
Weinberg in 2011, as the scientific community has got more aware of the important role of the
26
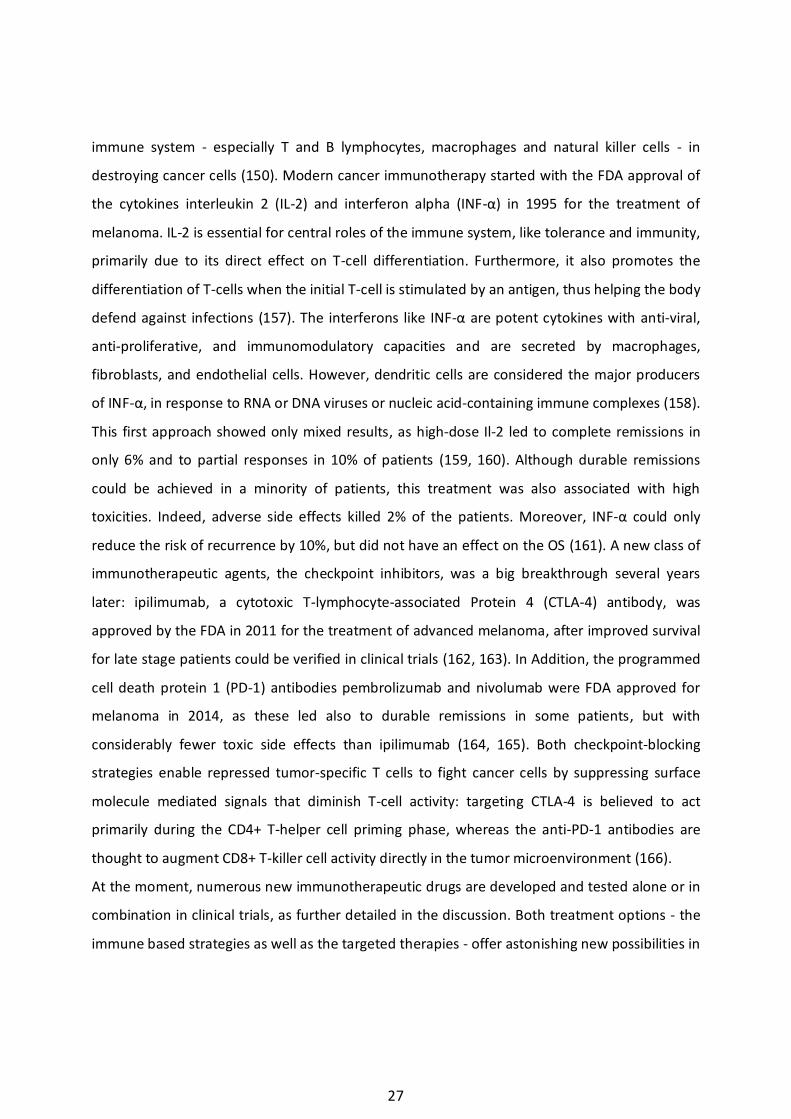
immune system - especially T and B lymphocytes, macrophages and natural killer cells - in
destroying cancer cells (150). Modern cancer immunotherapy started with the FDA approval of
the cytokines interleukin 2 (IL-2) and interferon alpha (INF-α) in 1995 for the treatment of
melanoma. IL-2 is essential for central roles of the immune system, like tolerance and immunity,
primarily due to its direct effect on T-cell differentiation. Furthermore, it also promotes the
differentiation of T-cells when the initial T-cell is stimulated by an antigen, thus helping the body
defend against infections (157). The interferons like INF-α are potent cytokines with anti-viral,
anti-proliferative, and immunomodulatory capacities and are secreted by macrophages,
fibroblasts, and endothelial cells. However, dendritic cells are considered the major producers
of INF-α, in response to RNA or DNA viruses or nucleic acid-containing immune complexes (158).
This first approach showed only mixed results, as high-dose Il-2 led to complete remissions in
only 6% and to partial responses in 10% of patients (159, 160). Although durable remissions
could be achieved in a minority of patients, this treatment was also associated with high
toxicities. Indeed, adverse side effects killed 2% of the patients. Moreover, INF-α could only
reduce the risk of recurrence by 10%, but did not have an effect on the OS (161). A new class of
immunotherapeutic agents, the checkpoint inhibitors, was a big breakthrough several years
later: ipilimumab, a cytotoxic T-lymphocyte-associated Protein 4 (CTLA-4) antibody, was
approved by the FDA in 2011 for the treatment of advanced melanoma, after improved survival
for late stage patients could be verified in clinical trials (162, 163). In Addition, the programmed
cell death protein 1 (PD-1) antibodies pembrolizumab and nivolumab were FDA approved for
melanoma in 2014, as these led also to durable remissions in some patients, but with
considerably fewer toxic side effects than ipilimumab (164, 165). Both checkpoint-blocking
strategies enable repressed tumor-specific T cells to fight cancer cells by suppressing surface
molecule mediated signals that diminish T-cell activity: targeting CTLA-4 is believed to act
primarily during the CD4+ T-helper cell priming phase, whereas the anti-PD-1 antibodies are
thought to augment CD8+ T-killer cell activity directly in the tumor microenvironment (166).
At the moment, numerous new immunotherapeutic drugs are developed and tested alone or in
combination in clinical trials, as further detailed in the discussion. Both treatment options - the
immune based strategies as well as the targeted therapies - offer astonishing new possibilities in
27

the treatment of metastatic melanoma, and have massively improved the PFS and OS of
patients (Table 3).
Table 3: Treatment specific average survival in metastatic melanoma. Abbreviations: PFS, progression-free survival; OS, overall survival; n.d., not done. Data obtained from (167).
Therapeutic strategy First line therapy % PFS at 6 months % OS at 12 months % OS at 24 months
Chemotherapy 22.1 42.2 22.6
BRAF inhibitors 55.4 63.4 37.6 BRAF + MEK inhibitors 72.3 76.9 53.5
CTLA-4 inhibitors 39.3 50.4 28.6
PD-1 inhibitors 51.1 72.2 59.3 CTLA-4 + PD-1 inhibitors 63.8 73.1 62.9
Second line or higher % PFS at 6 months % OS at 12 months % OS at 24 months
Chemotherapy 20.7 45.8 27.3
BRAF inhibitors 55.9 56.9 n.d.
MEK inhibitors 21.3 42.3 n.d.
BRAF + MEK inhibitors 75.9 80.1 52.8 CTLA-4 inhibitors 21.8 48.6 29.1
PD-1 inhibitors 40.2 62.1 45.3
CTLA-4 + PD-1 inhibitors 73.2 86.9 n.d.
28

5. Discussion
Despite great advances in understanding the molecular pathogenesis of cancer in the last 50
years, cancer-related death rates in the western civilization have only marginally been reduced,
leaving cancer the second most frequent cause of death after cardiovascular diseases in
Germany (168). While today some malignancies like testicular cancer are curable in most cases,
MCC and melanoma still present a challenge to treat, and in an advanced, metastatic stage the
five-year OS remains very low and ranges between 0-18% for MCC and less than 30% for
melanoma (79, 169, 170). Due to these yet unsatisfying numbers, basic and clinical research has
been carried out, and has led not only to new insights in the pathogenic mechanisms of these
tumor entities, but also yielded new treatment approaches, which are todays new standard of
care for advanced melanoma and MCC (123, 171, 172). Indeed, for MCC as well as for
melanoma, immunotherapeutic approaches have shown the capability to increase the survival
of patients. These therapies act through inhibition of signals which suppress T cell function. The
applied agents are antibodies targeting CTLA-4 (Ipilimumab), PD-1 (nivolumab or
pembrolizumab) or PD-Ligand1 (PD-L1) (avelumab), and increase activity of cytotoxic CD8+ T
cells, which are able to induce the extrinsic apoptosis pathway in the cancer cells. For
melanoma, a second approach using small molecule kinase inhibitors specifically targeting
activated oncogenic signaling pathways in the tumor cells is also applied, which induces the
intrinsic apoptosis pathway. Here, these new therapies and further potential approaches for the
treatment of MCC and melanoma will be discussed, with special emphasis on the topics
addressed in the articles enclosed in this thesis.
5.1. Current state and outlook of immune-based therapies in melanoma & MCC
Immunotherapy with CTLA-4 and PD-1 antibodies is an established treatment for metastatic
melanoma nowadays; however, not all patients do benefit from this approach and experience
lasting responses. Furthermore, patients tend to react very differently to immunotherapy, and
so far there are almost no predictive markers that identify those patients, who will potentially
benefit from an immune-based therapy (173). According to the nature of the adaptive immune
29

system, presentation of antigenic peptides by major histocompatibility complex (MHC) class I
molecules on the tumor cell surface is a prerequisite for the recognition by T-cells, and the
response to an immunotherapy (174). Therefore, in particular tumors expressing viral antigens
and many so called neoantigens, which correlate with a high burden of somatic mutations, are
thought to be especially suited for immune-based approaches (175). MCC as well as melanoma
fulfill these criteria, as MCV-negative MCC and cutaneous melanoma are the cancers with the
highest load of somatic mutations, and MCV-positive MCC depends on the expression of the
viral T antigens (47, 50, 89). Indeed, it has been shown that melanoma patients with a
particularly high burden of clonal neoantigens have a greater benefit from immune-based
therapies (175). Moreover, T cells recognizing clonal neoantigens were detectable in those
patients, who experienced a durable clinical response (173, 175). This suggests the individual
clonal neoantigen load as a possible predictive biomarker for the selection of patients indicated
for immunotherapy.
It is expected that the combination of different drugs will be the key to improve the therapeutic
success of immunotherapies in melanoma, since most malignancies seem to exploit multiple
strategies to avoid the recognition and destruction through the immune system (immune
escape mechanisms) at one. This includes loss of antigenicity, loss of immunogenicity or the
establishment of an immunosuppressive microenvironment (176, 177). For example, the
combination of ipilimumab and IL-2 led to complete response rates after a long follow-up in
melanoma patients of 17%, compared to 7% in patients receiving ipilimumab with gp100
peptides (178). In 2015, a randomized phase III trial reported increased efficacy and safety for
the use of combination-therapy of nivolumab and ipilimumab or nivolumab monotherapy,
compared to ipilimumab monotherapy (179). Nevertheless, the search for more potential
target-molecules besides the common targets CTLA-4, PD-1, and its ligand PD-L1 still is ongoing:
recently, it has been reported that T-cell immunoreceptor with Ig and immunoreceptor
tyrosine-based inhibition motif domains (TIGIT) is an immune checkpoint molecule that can limit
CD8+ T-killer cell antitumor responses, in a comparable way to CTLA-4 and PD-1 (180, 181). Co-
blockade of TIGIT and PD-1 has been proposed based on investigations, demonstrating that
TIGIT-positive cells often co-express PD-1 (182). Another study suggests diphencyprone (DPCP),
which has been used in melanoma patients as a sensitizing agent to induce tumor regression, as
30
a potential complementary agent to anti-PD-1 blockade, as PD-1 expression was significantly
elevated in DPCP-applied regions (183).
Cytotoxic T-cells mediate cell death to the target tumor- or infected cell by the extrinsic, death
receptor mediated apoptosis pathway, what results in initiator caspase 8 activation (184). As
described in the introduction, BH3-only proteins of the Bcl-2 family play a pivotal role in
intrinsic, mitochondria mediated apoptosis, and moreover, we outline the role of the BH3-only
protein Bcl-2 interacting killer (BIK) for melanoma cell death after MAPK-pathway inhibition in
article IV. These proteins, including BIK, could also play a role in extrinsic mediated apoptosis
initiated by immunotherapy, as there is interaction between both pathways, for example
through caspase 8 conducted cleavage and activation of the BH3-only protein Bid (135, 185).
This truncated Bid protein (tBid) counteracts the anti-apoptotic Bcl-2 family members, outlining
the importance of BH3-only proteins, also for the immune response. Furthermore, shared
mechanisms of death induction by targeted and immunotherapy are also suggested by the
observation that BRAF mutated patients, which were previously treated with BRAF inhibitors,
demonstrate a reduced response rate in subsequent immunotherapy, compared to BRAF wild
type patients treated solely with immunotherapy (186). To evaluate the relevance of BIK in
melanoma treated with immune-stimulatory agents, co-culture of the M14-derived single cell
clones described in article IV or patient derived BIK knockout melanoma cells with patient-
derived cytotoxic T-cells, could elucidate the relevance of BIK expression under immunotherapy-
conditions.
For MCC, there is a strong rationale that immune-based therapies could also be successful in the
treatment of this cancer. Several clinical trials, applying immune checkpoint inhibitors as
monotherapy or in combination with other agents for the treatment of advanced MCC, have
recently been published or are still ongoing. Very promising results have been reported by two
phase II trials in 2016: pembrolizumab, as first line treatment, was associated with a high
response rate of 56% in 26 treatment-naive MCC patients, and avelumab, a PD-L1 antibody, as
second line treatment for patients with chemo-refractory disease, could also reach a 32%
response rate (14, 15). Both studies reported efficacy in MCV-positive and negative patients
with a manageable safety profile. Further MCC-associated clinical trials are numerous and
explore different immune-system associated strategies: these include, for example, the targeted
31

delivery of the Interleukin-12 (IL-12) gene - a pro-inflammatory cytokine, capable of stimulating
the production of interferon gamma (IFN-γ) by natural killer and T-cells, which is also known to
promote cell-mediated immunity and to activate anti-tumor responses (187) – by using
intratumoral injection of a plasmid, followed by in vivo electroporation (NCT01440816). In
addition, the use of IL-12 in combination with paclitaxel, a mitosis inhibiting toxin also known as
taxol, is evaluated and compared to paclitaxel alone in an open-label, randomized phase II trial
(NCT02054884). Furthermore, it has been demonstrated that MCV antigen-specific T cells are
detectable in MCC patients, and these are capable of effectively kill MCV-positive MCC cell lines
(188). Based on these findings, a phase I/II study (NCT02584829) evaluating safety and efficacy
of avelumab in combination with MHC class I upregulation, mediated by interferon beta (IFN-β)
administration and autologous T-cell transfer, is currently ongoing. Another phase I study is a
proof-of-concept clinical trial, testing intratumoral injection of glucopyranosyl lipid adjuvant-
stable emulsion (GLA-SE), a toll-like receptor-4 agonist, in patients with MCC (NCT02035657).
Preliminary data has indicated that G100 (GLA-SE delivered intratumorally) is well tolerated and
promotes inflammatory changes in the tumor microenvironment, thereby activating T-cells
(189, 190). Taken together, this suggests the use of immunotherapies for both MCC variants. In
March 2017, avelumab was the first treatment that gained FDA approval for metastatic MCC,
and it will probably only be a matter of time until the next immune-based therapy for MCC
achieves FDA approval.
The observed response towards immunotherapy does not depend on whether MCC is MCV
associated or not. It is therefore likely that in MCV-negative cases a high neoepitope load –
indeed virus-negative MCCs harbor more tumor neoantigens than melanomas or non-small cell
lung cancers, due to their high frequency of somatic mutations (47) - provides targets for tumor-
specific T cells, while in MCV-positive cases, which are characterized by a very low mutation
load, viral epitopes serve as targets (191). In this respect, it is important that MCV-positive cells
have been shown to be dependent on the expression of the viral proteins ST and LT (50, 52), not
allowing MCC cells to evade the immune system by loss of expression of these antigens. In
article III we were able to explain the LT dependency, as this protein is required to inactivate the
tumor suppressor Rb, which in the absence of growth signals inhibits cellular proliferation (56).
Thus, MCV TAs appear very viable as potential targets for immunotherapy; although the
32

dependency on LT may be lost in certain cases, for example, through a homozygous deletion of
the Rb allele, as we demonstrated for the MCC cell line LoKe in article III, rendering this cell line
independent of MCV-LT expression. However, MCV ST seems to fulfill a more complex and also
indispensable role in virus-positive MCC (52, 53), and thus the loss of ST-dependency seems
more unlikely, even though some data challenge its requirement for MCC proliferation (51).
Expression levels of MCV ST and LT seem to differ substantially (51), most likely due to pre-
mRNA or post-transcriptional protein processing, since both TA-variants are alternatively spliced
viral proteins originating in one pre-mRNA (see Fig.2). Therefore it is at least questionable, if
they could be expressed completely independent from each other. Importantly, in murine
models using the B16 melanoma cell line expressing MCV LT or ST, DNA vaccines against both
TAs generated antitumor effects mainly mediated by peptide-specific CD4+/CD8+ T-cells, and
these mice experienced enhanced survival compared to those vaccinated with an empty vector
(192, 193), further suggesting these structures as immunotherapeutic targets.
5.2. Current state and outlook of targeted therapies in melanoma
Small-molecule inhibitor based therapy for melanoma was developed after the BRAFV600E
mutation was discovered in 2002, what finally resulted in FDA approval of vemurafenib, the first
MAPK pathway targeting drug in 2011 (112, 113). Notably, the MAPK signaling pathway, which
is strongly associated with proliferation and survival, still remains the most important to target.
Soon after vemurafenib approval, the initial euphoria for small molecule inhibitors was abruptly
lowered, as the awareness of resistances arose, which melanoma cells inevitably develop in the
vast majority of patients after continuous therapy (125). Mechanisms of intrinsic or acquired
resistance to BRAF or combined BRAF/MEK inhibition are many-sided, and vary between tumors
and/or even within tumors. Lately, the most important mechanisms involved in intrinsic and
acquired resistance have been reviewed by Amaral et al. in European Journal of Cancer. For
intrinsic resistance, which is defined by the absence of response to BRAF/MEK inhibitor therapy
(even despite the presence of a BRAFV600 mutation), these include hepatocyte growth factor
(HGF) stromal secretion, RTK signal alterations, COT expression, RAC1 gene mutations,
neurofibromatosis 1 (NF1) dependent mechanisms, aberrations in cyclin and cyclin-dependent
33

kinase (CDK) expression or activity, and many more (194). Acquired resistance is described as an
initial strong response to the inhibitor treatment, although a drug-tolerant sub-population of
cells persists, what finally leads to progressive disease caused by proliferative resistant clones.
Common sources of acquired resistances are RAS mutations, MAPK reactivation through a RAF
isoform switch (ARAF,CRAF) or elevated CRAF levels, alternative BRAF splicing or amplification,
activating mutations in the PI3K/AKT pathway, and so on (195). Many of these mechanisms
identified overlap and fall into both categories; in fact, this classification is largely artificial, and
some mechanisms are just incompletely understood, also putting a spotlight on the redundancy
of some cellular pathways. Thus, it is believed that further improvements of the efficacy of
targeted therapies can be achieved by a supplementary agent, targeting additionally those
molecules involved in intrinsic resistance or acquired resistance to BRAF/MEK inhibition.
The tumor heterogeneity, characterized by the presence of different sub-populations that react
differently to the BRAF/MEK inhibitor treatment, is a major issue to consider when we search
for answers to resistance development. Cells with different cell cycle profiles, especially a slow
cycling phenotype, appear to be refractory to cytotoxic and targeted therapy treatment (196-
198). The importance of the cell cycle in intrinsic resistance to signaling inhibitors has also been
emphasized by Beaumont et al., who point out that a temporary G1 or G2 arrest confers
resistance to specific treatment conditions (199). Cells in a growth-arrested state often exhibit
increased mitochondrial metabolic activity, are high in autophagy, and may even show markers
of senescence; a condition that can be induced by BRAF inhibition itself, as we demonstrated in
the enclosed article I. Moreover, growth arrested cancer cells can still pose a threat for the
organism: temporarily arrested (quiescent) cells can re-enter the cell cycle, and also
permanently arrested (senescent) cells can be harmful by secreting factors that contribute to a
pro-tumorigenic milieu. These changes in the secretome, paradoxically provoked by BRAF
inhibitor treatment, can stimulate the outgrowth, dissemination, and metastasis of drug-
resistant cancer cell clones or foster the survival of drug-sensitive cancer cells (200). Therefore,
the ideal targeted therapy should aim at maximizing the eradication of cancer cells, rather than
driving them into senescence or quiescence.
34

5.2.1. Bcl-2 family members as potential targets for melanoma therapy
Another condition in a sub-population of melanoma cells that mediates treatment resistance is
apoptosis deficiency (130-133). A pivotal role in intrinsic, mitochondrial mediated apoptosis,
which is induced by MAPK pathway inhibitor treatment in melanoma, plays the Bcl-2 protein
family (136-138). The balance between pro-apoptotic and anti-apoptotic Bcl-2 proteins is of
central importance for the induction of intrinsic apoptosis. Increased levels of anti-apoptotic
Bcl-2 family members, like Bcl-X(L) and especially Mcl-1, which are commonly upregulated in
progressing melanomas, have frequently been linked to resistance against small molecule
inhibitors and cytotoxic agents (201-203); however, the role of Bcl-2 itself is still controversial
(204-207). Targeting BCL-2 - either directly (for example by the use of inhibitors (208, 209)) or
indirectly (for instance with BH3-mimetics that mimic the pro-apoptotic BH3-only proteins and
thereby neutralize anti-apoptotic Bcl-2 family members (210, 211)) - has been demonstrated to
effectively kill melanoma cells, and, even more important, melanoma cells with cancer stem
cell-like characteristics, which are often made responsible for tumor persistence (212).
Furthermore, the use of proteasomal inhibitors may in part exert its anti-tumorigenic effect by
reducing proteasome dependent degradation of the BH3-only Proteins BIK, BIM, and NOXA
(213-215). Additionally, epigenetic silencing of BH3-only proteins has been described in
different cellular contexts, and can contribute to BRAF inhibitor resistance (144, 149). Indeed,
we could identify epigenetic silencing of BIK as a potential mechanism to render melanoma cells
refractory to BRAF/MEK inhibitor induced apoptosis, as demonstrated in article IV. We have
shown that in melanoma cells lacking basal BIK expression, treatment with histone deacetylase
inhibitors (HDACi) leads to increased Histone 3 Lysine 9 acetylation of the BIK promoter and de-
repression of BIK expression. Moreover, the HDACi treatment made the previously refractory
cells susceptible to apoptosis induction by BRAF/MEK inhibitors. This provides further pre-
clinical prove for the therapeutic use of small molecules, upregulating or mimicking BH3-only
proteins (210, 211), with special emphasis on BIK. Although some HDACi have been tested and
approved for peripheral and cutaneous lymphoma and myeloma (216-218), in melanoma
however, clinical trials with HDACi as monotherapy did not have the desired results (219, 220).
Nevertheless some studies are still running, like the evaluation of vorinostat in resistant BRAF-
35

mutated advanced melanoma (NCT02836548). We and others provide a rationale for using
HDACi in combination with BRAF/MEK inhibitor treatment or immunotherapy (221, 222). Some
trials that combine immunotherapy with HDACi in melanoma, have already started as well: one
study is recruiting patients for the treatment with panobinostat and ipilimumab (NCT02032810);
another will evaluate the selective HDAC6 inhibitor ACY-241 in combination with ipilimumab
and nivolumab (NCT02935790).
Similarly, first efforts at targeting Bcl-2 family members failed, most likely because of unfitting
delivery systems and the unstable nature of the compounds, like antisense, single-chain
antibodies, ribozymes, BH3 peptides and hydrocarbon stapling (223). Up-to-date approaches
focus on more stable BH3-mimetics, like ABT-263 (navitoclax), an oral version of ABT-737 and
ABT-199 (venetoclax). Both showed encouraging performance in hematologic tumors, and
resulted in FDA approval of the latter for chronic lymphocytic leukemia (224-228).
Unfortunately, none of these inhibit Mcl-1, what may be the reason for the inefficiency of ABT-
737/ABT-263 single agent treatment in melanoma, as Mcl-1 is central for apoptosis-resistance in
this cancer (229-232). However, it has been reported that ABT-737 sensitizes melanoma cells for
BRAF inhibition mediated apoptosis (233), what is in line with our observation that upregulation
of BIK via ectopic expression or HDACi has a similar effect, as both have the potential to inhibit
Bcl-2 and Bcl-X(L) (234). At the moment, one phase I/II study is recruiting patients to explore the
combination of dabrafenib with trametinib and navitoclax in BRAF-mutant melanoma and other
solid tumors (NCT01989585). Currently, many inhibitors targeting Mcl-1 are developed that
could complement BRAF/MEK inhibitor therapy: promising compounds for instance are
maritoclax, WP1130, UMI-77, clitocine, and compound 11, which have shown efficacy in animal
studies (235-239), but data from clinical trials are still missing. Figure 6 schematically
summarizes the potential use of HDACi and BH3-mimetics as a complementary therapy to MAPK
pathway inhibition.
36

Fig. 6: HDACi and BH3-mimetics may help to overcome apoptosis defiance in MAPK pathway inhibition. Apoptosis is the preferred outcome of MAPK pathway inhibition in melanoma cells. Factors that avoid apoptosis, like an active MAPK pathway, a low amount of BH3-only proteins or a high amount of anti-apoptotic Bcl-2 members are depicted in a red color, while factors that contribute to an apoptotic response, like a high amount of BH3-only proteins or activation of BAX/BAK are illustrated in blue. HDAC inhibition, proteasomal inhibition, and BH3-mimetics bear great potential to maximize the apoptotic response towards MAPK pathway inhibition. This is mediated by shifting the balance between anti-apoptotic Bcl-2 family members and pro-apoptotic BH3-only proteins in the direction of the latter.
37

5.3. Potential of targeted therapies in MCC
Unlike in melanoma, tumor-suppressors and especially oncogenes are not frequently mutated in
virus-positive MCC, but numerous receptor kinases and ligands that may serve as therapeutic
targets are expressed. These are PI3K/AKT, c-kit, platelet-derived growth factor A & B (PDGFA &
PDGFB), vascular endothelial growth factors A and C as well as vascular endothelial growth
factor receptor-2 (VEGF-A, VEGF-C, VEGFR-2) (240-243). One case reported a 92-year old
woman with a complete resolution of a MCV and KIT positive tumor, after application of the
tyrosine kinase inhibitor imatinib in combination with radiotherapy (244). Unfortunately, a
phase II clinical trial of imatinib in MCC was canceled prematurely due to poor performance
status, with the majority of patients progressing rapidly within one to two cycles of treatment
(245). Multi-targeted kinase inhibitors could have better clinical effectivity in advanced MCC,
and a clinical trial administering cabozantinib, a c-met and VEGFR-2 inhibitor, to MCC patients is
running at the moment (NCT02036476). Activating mutations of the PI3K/AKT pathway have
also been observed in MCC, suggesting the use of inhibitors of this pathway (241). In a case
report, the PI3K inhibitor idelalisib was able to achieve a complete response in a patient with
stage IV MCC (246). The mammalian target of rapamycin (mTOR) inhibitors MLN0128 and
everolimus are investigated in ongoing trials for advanced MCC (NCT02514824 and
NCT00655655), as mTOR is described as activated in MCC and a known regulator of the
PI3K/AKT and MAPK pathway (247, 248).
Given that in many cancers tumor-suppressors are frequently mutated, deleted, silenced or
dysfunctional by other reasons, restoring wild-type tumor suppressor activity appears to be a
reasonable approach to eradicate cancer. This can be achieved either by direct virus-mediated
and non-virus-mediated delivery methods, transporting functional tumor suppressor genes to
their destination and ectopic expression of these (gene therapy), or by inhibitors that disrupt
interactions between tumor suppressor genes and their negative regulators (249). This attempt
may also be suitable for MCC, as reactivation of a single tumor-suppressor like Rb or p53 may be
sufficient to stop MCC cell proliferation and/or induce apoptosis, how our data from the two
enclosed MCC articles suggest (article II & article III).
38

The role of p53 in MCC is still not sufficiently elucidated: The majority of MCC lines show wild-
type p53 expression with some transcriptional activity, which is not sufficient to restrict survival
or proliferation in these cells, as we demonstrate in article II. It has been reported that despite
the lack of the C-terminal p53-binding domain, SV40 LT is still able to inhibit p53-dependent
transcription (250, 251), which may hint to a similar ability of MCV LT. However, our data from
article II do not support this thesis, since knockdown of MCV TAs has no impact on p53
transcriptional activity in MCC cells. Additionally, according to these data, p53 reactivation
through inhibition of its main negative regulator human double minute 2 (HDM2) with nutlin-3a
is promising in vitro, and the application of a related agent (RG7112) has shown some clinical
activity in liposarcoma and leukemia (252, 253). Moreover, local adenoviral delivery of a
recombinant p53 gene with standard treatments showed good results in clinical studies (254,
255). A lot of clinical trials are going on exploring the effectivity and safety of the p53 gene
therapy in various cancers and drug combinations (NCT02429037, NCT02435186,
NCT02842125). Patients with still localized MCC could also benefit from a similar approach, and
possibly experience a lower recurrence rate after tumor excision.
In contrast to p53, the role of Rb in MCC is clearer: inactivation of Rb either by mutations
occurring frequently in virus-negative MCC, or by MCV LT in virus-positive MCC seems to be a
crucial step in MCC carcinogenesis, and necessary for most MCC cells to proliferate (47, 73).
Therefore, Rb reactivation is a logic effort to battle MCC. Blockade of Rb phosphorylation and
maintenance of efficient E2F repression may be achieved by CDK-inhibitors, such as the highly
selective CDK4/6 inhibitor PD-0332991 (palbociclib), which also yielded positive results in
clinical trials (256-258). For MCC however, inhibition of CDKs appears not suitable, since Rb
inactivation occurs downstream of CDKs. Because inactivation of Rb by MCV LT in MCV-positive
MCC occurs by direct interaction of these two proteins (article III), development of small
molecules interfering specifically with Rb/LT binding would be of great interest.
Taken together, targeted therapies that aim at reactivation of tumor-suppressors rather than
oncogene blockade remain a viable strategy to fight cancer in the future, although a lot of
considerable uncertainty remains. Many experiments and clinical trials to date are hindered by
the lack of efficacy, specificity, and serious safety concerns by enhanced tumor suppressor
activity in healthy cells. Furthermore, development of inhibitors for protein-protein interaction
39

rather than kinases with well-defined ATP-binding pockets is far more challenging, as these
interfaces typically consist of large surface areas that display a lack of well-defined structures
(249, 259).
5.4. Combining targeted and immune-based therapies: the future of melanoma treatment?
A possibility to achieve improved overall survival, which is increasingly explored in clinical
melanoma research, is the combination of therapies: in particular, combining the high response
rates of the targeted therapies with the longevity of the immunotherapies appears to be
attractive. This approach may reduce the short-lived benefits of the BRAF/MEK inhibitors, and a
broader number of patients could benefit than with CTLA-4/PD-1 blockade alone (260, 261).
Furthermore, targeted therapy can affect antitumor immunity, and complications can be
avoided or synergies may arise when applied together or sequential in a certain combination or
order (186). In xenograft models, it has been shown that the effectivity of BRAF inhibition is at
least partly dependent on the presence of CD8+ T-killer cells (262), and another study reported
that BRAF inhibition and PD-1 blockade function in a synergistic manner (263). In contrast, MEK
inhibition alone or in combination was associated with suppressed human T-lymphocyte
proliferation, cytokine production, and antigen-specific expansion, whereas treatment with
dabrafenib had no effect (264). In melanoma patients it has been shown that the MAPK
pathway plays an important role in cancer immune evasion by secreting immune-suppressive
cytokines like interleukin 6 & 10 (IL-6 & IL-10), while tumor samples after being exposed to
vemurafenib had reduced levels of these cytokines (265, 266). Moreover, an increase in
melanoma differentiation antigens, as well as a significant increase in clonal intra-tumoral CD8+
T-killer cells, has been reported after initiation of BRAF treatment. These findings were also
associated with down regulated IL-6, IL-8, IL-1α and VEGF. Notably, increased
immunomodulatory molecules, namely PD-1 and PD-L1, have been detected following BRAF
inhibition, suggesting a potential immune-based mechanism of resistance, which might be
overcome by applying the respective checkpoint antibodies (261, 266-269). Furthermore, BRAF
inhibition in patients was associated with reduced immunosuppression mediated by myeloid
derived suppressor cells (270).
40

Translation into clinical studies with large patient cohorts has already begun, and a first attempt
of combining immune- with targeted therapy was the combination of the initial flagships of
each treatment approach: ipilimumab and vemurafenib. This study was discontinued due to
dose limiting toxicities and massive hepatotoxic adverse effects experienced by most patients
(271). Recently, a clinical trial finished that utilizes dabrafenib with or without trametinib
combined with ipilimumab in patients with BRAF-mutated metastatic melanoma
(NCT01767454), where in the doublet arm administering dabrafenib with ipilimumab no dose
limiting toxicities were observed, while the addition of trametinib was associated with severe
gastrointestinal toxicity (272). These experiences teach us that there are a lot of challenges to
overcome, until one day the two therapy approaches can finally be used successfully, as severe
adverse events seem to occur frequently. However, myriads of clinical trials are currently
conducted, evaluating different protocols of combining immunotherapeutics with MAPK
pathway inhibitors in melanoma: one phase Ib study investigates the use of atezolizumab, an
PD-L1 antibody, in combination with vemurafenib or vemurafenib plus cobimetinib in
participants with BRAF-mutant melanoma (NCT01656642). Another trial scrutinizes the safety
and efficacy of pembrolizumab in combination with trametinib and dabrafenib (NCT02130466).
Further, not checkpoint antibody based approaches, try to use cytokines (NCT01603212,
NCT01943422) or tumor infiltrating lymphocytes (NCT00338377, NCT01585415, NCT01659151)
along with targeted therapies.
Taken together, metastatic melanoma treatment has undergone an astonishing development
and faced many scientific breakthroughs in the past 10 years, but this progress also has added
much complexity to the management of melanoma patients. The appropriate timing and/or
sequencing of targeted therapy and immunotherapy remain to be elucidated, but synergies
most likely exist between both treatment options. However, the potential benefits seem to be
bought by a substantial increase in toxicity, and more studies are clearly needed for a better
understanding of the responses to these types of therapy. The insights gained will eventually
help identifying suitable patients for each of the established therapies, and further improve
treatment outcome.
41

6. Reference list
(1) Proksch E, Brandner JM, Jensen JM. The skin: an indispensable barrier. Exp Dermatol 2008;17:1063-72.
(2) Munde PB, Khandekar SP, Dive AM, Sharma A. Pathophysiology of merkel cell. J Oral Maxillofac Pathol 2013;17:408-12.
(3) Tolleson WH. Human melanocyte biology, toxicology, and pathology. J Environ Sci Health C Environ Carcinog Ecotoxicol Rev 2005;23:105-61.
(4) headandneckcancerguide.org. http://headandneckcancerguide.org/adults/introduction-to-head-and-neck-cancer/skin-cancer/anatomy/. 2017.
Ref Type: Online Source
(5) Stakaityte G, Wood JJ, Knight LM, Abdul-Sada H, Adzahar NS, Nwogu N, et al. Merkel cell polyomavirus: molecular insights into the most recently discovered human tumour virus. Cancers (Basel) 2014;6:1267-97.
(6) NHS. http://www.nhs.uk/conditions/malignant-melanoma/pages/introduction.aspx. 2017. Ref Type: Online Source
(7) Hughes MP, Hardee ME, Cornelius LA, Hutchins LF, Becker JC, Gao L. Merkel Cell Carcinoma: Epidemiology, Target, and Therapy. Curr Dermatol Rep 2014;3:46-53.
(8) Albores-Saavedra J, Batich K, Chable-Montero F, Sagy N, Schwartz AM, Henson DE. Merkel cell carcinoma demographics, morphology, and survival based on 3870 cases: a population based study. J Cutan Pathol 2010;37:20-7.
(9) Heath M, Jaimes N, Lemos B, Mostaghimi A, Wang LC, Penas PF, et al. Clinical characteristics of Merkel cell carcinoma at diagnosis in 195 patients: the AEIOU features. J Am Acad Dermatol 2008;58:375-81.
(10) Hanly AJ, Elgart GW, Jorda M, Smith J, Nadji M. Analysis of thyroid transcription factor-1 and cytokeratin 20 separates merkel cell carcinoma from small cell carcinoma of lung. J Cutan Pathol 2000;27:118-20.
(11) Tothill R, Estall V, Rischin D. Merkel cell carcinoma: emerging biology, current approaches, and future directions. Am Soc Clin Oncol Educ Book 2015;e519-e526.
(12) Becker J, Mauch C, Kortmann RD, Keilholz U, Bootz F, Garbe C, et al. Short German guidelines: Merkel cell carcinoma. J Dtsch Dermatol Ges 2008;6 Suppl 1:S15-S16.
(13) Becker JC. Merkel cell carcinoma. Ann Oncol 2010;21 Suppl 7:vii81-vii85.
(14) Kaufman HL, Russell J, Hamid O, Bhatia S, Terheyden P, D'Angelo SP, et al. Avelumab in patients with chemotherapy-refractory metastatic Merkel cell carcinoma: a multicentre, single-group, open-label, phase 2 trial. Lancet Oncol 2016;17:1374-85.
42

(15) Nghiem PT, Bhatia S, Lipson EJ, Kudchadkar RR, Miller NJ, Annamalai L, et al. PD-1 Blockade with Pembrolizumab in Advanced Merkel-Cell Carcinoma. N Engl J Med 2016;374:2542-52.
(16) Tang CK, Toker C. Trabecular carcinoma of the skin: further clinicopathologic and ultrastructural study. Mt Sinai J Med 1979;46:516-23.
(17) Tang CK, Toker C. Trabecular carcinoma of the skin: an ultrastructural study. Cancer 1978;42:2311-21.
(18) Tilling T, Moll I. Which are the cells of origin in merkel cell carcinoma? J Skin Cancer 2012;2012:680410.
(19) Zur HA, Rennspiess D, Winnepenninckx V, Speel EJ, Kurz AK. Early B-cell differentiation in Merkel cell carcinomas: clues to cellular ancestry. Cancer Res 2013;73:4982-7.
(20) Feng H, Shuda M, Chang Y, Moore PS. Clonal integration of a polyomavirus in human Merkel cell carcinoma. Science 2008;319:1096-100.
(21) Calvignac-Spencer S, Feltkamp MC, Daugherty MD, Moens U, Ramqvist T, Johne R, et al. A taxonomy update for the family Polyomaviridae. Arch Virol 2016;161:1739-50.
(22) zur HH. Novel human polyomaviruses--re-emergence of a well known virus family as possible human carcinogens. Int J Cancer 2008;123:247-50.
(23) Major EO, Mourrain P, Cummins C. JC virus-induced owl monkey glioblastoma cells in culture: biological properties associated with the viral early gene product. Virology 1984;136:359-67.
(24) Miller NR, McKeever PE, London W, Padgett BL, Walker DL, Wallen WC. Brain tumors of owl monkeys inoculated with JC virus contain the JC virus genome. J Virol 1984;49:848-56.
(25) Shah KV, Daniel RW, Strandberg JD. Sarcoma in a hamster inoculated with BK virus, a human papovavirus. J Natl Cancer Inst 1975;54:945-50.
(26) Foulongne V, Courgnaud V, Champeau W, Segondy M. Detection of Merkel cell polyomavirus on environmental surfaces. J Med Virol 2011;83:1435-9.
(27) Tolstov YL, Pastrana DV, Feng H, Becker JC, Jenkins FJ, Moschos S, et al. Human Merkel cell polyomavirus infection II. MCV is a common human infection that can be detected by conformational capsid epitope immunoassays. Int J Cancer 2009;125:1250-6.
(28) Viscidi RP, Rollison DE, Sondak VK, Silver B, Messina JL, Giuliano AR, et al. Age-specific seroprevalence of Merkel cell polyomavirus, BK virus, and JC virus. Clin Vaccine Immunol 2011;18:1737-43.
(29) DeCaprio JA. Merkel cell polyomavirus and Merkel cell carcinoma. Philos Trans R Soc Lond B Biol Sci 2017;372.
(30) Carter JJ, Daugherty MD, Qi X, Bheda-Malge A, Wipf GC, Robinson K, et al. Identification of an overprinting gene in Merkel cell polyomavirus provides evolutionary insight into the birth of viral genes. Proc Natl Acad Sci U S A 2013;110:12744-9.
43

(31) Moore PS, Chang Y. Why do viruses cause cancer? Highlights of the first century of human tumour virology. Nat Rev Cancer 2010;10:878-89.
(32) Adam C, Baeurle A, Brodsky JL, Wipf P, Schrama D, Becker JC, et al. The HSP70 modulator MAL3-101 inhibits Merkel cell carcinoma. PLoS One 2014;9:e92041.
(33) Topalis D, Andrei G, Snoeck R. The large tumor antigen: a "Swiss Army knife" protein possessing the functions required for the polyomavirus life cycle. Antiviral Res 2013;97:122-36.
(34) Nakamura T, Sato Y, Watanabe D, Ito H, Shimonohara N, Tsuji T, et al. Nuclear localization of Merkel cell polyomavirus large T antigen in Merkel cell carcinoma. Virology 2010;398:273-9.
(35) Lane DP, Simanis V, Bartsch R, Yewdell J, Gannon J, Mole S. Cellular targets for SV40 large T-antigen. Proc R Soc Lond B Biol Sci 1985;226:25-42.
(36) Poulin DL, Kung AL, DeCaprio JA. p53 targets simian virus 40 large T antigen for acetylation by CBP. J Virol 2004;78:8245-53.
(37) Cheng J, Rozenblatt-Rosen O, Paulson KG, Nghiem P, DeCaprio JA. Merkel cell polyomavirus large T antigen has growth-promoting and inhibitory activities. J Virol 2013;87:6118-26.
(38) Kassem A, Schopflin A, Diaz C, Weyers W, Stickeler E, Werner M, et al. Frequent detection of Merkel cell polyomavirus in human Merkel cell carcinomas and identification of a unique deletion in the VP1 gene. Cancer Res 2008;68:5009-13.
(39) Shuda M, Feng H, Kwun HJ, Rosen ST, Gjoerup O, Moore PS, et al. T antigen mutations are a human tumor-specific signature for Merkel cell polyomavirus. Proc Natl Acad Sci U S A 2008;105:16272-7.
(40) Moens U, Van GM, Johannessen M. Oncogenic potentials of the human polyomavirus regulatory proteins. Cell Mol Life Sci 2007;64:1656-78.
(41) Pallas DC, Shahrik LK, Martin BL, Jaspers S, Miller TB, Brautigan DL, et al. Polyoma small and middle T antigens and SV40 small t antigen form stable complexes with protein phosphatase 2A. Cell 1990;60:167-76.
(42) Kwun HJ, Shuda M, Feng H, Camacho CJ, Moore PS, Chang Y. Merkel cell polyomavirus small T antigen controls viral replication and oncoprotein expression by targeting the cellular ubiquitin ligase SCFFbw7. Cell Host Microbe 2013;14:125-35.
(43) Comerford SA, Schultz N, Hinnant EA, Klapproth S, Hammer RE. Comparative analysis of SV40 17kT and LT function in vivo demonstrates that LT's C-terminus re-programs hepatic gene expression and is necessary for tumorigenesis in the liver. Oncogenesis 2012;1:e28.
(44) Zerrahn J, Knippschild U, Winkler T, Deppert W. Independent expression of the transforming amino-terminal domain of SV40 large I antigen from an alternatively spliced third SV40 early mRNA. EMBO J 1993;12:4739-46.
(45) Seo GJ, Chen CJ, Sullivan CS. Merkel cell polyomavirus encodes a microRNA with the ability to autoregulate viral gene expression. Virology 2009;383:183-7.
44

(46) Shuda M, Arora R, Kwun HJ, Feng H, Sarid R, Fernandez-Figueras MT, et al. Human Merkel cell polyomavirus infection I. MCV T antigen expression in Merkel cell carcinoma, lymphoid tissues and lymphoid tumors. Int J Cancer 2009;125:1243-9.
(47) Goh G, Walradt T, Markarov V, Blom A, Riaz N, Doumani R, et al. Mutational landscape of MCPyV-positive and MCPyV-negative Merkel cell carcinomas with implications for immunotherapy. Oncotarget 2016;7:3403-15.
(48) Hahn WC, Dessain SK, Brooks MW, King JE, Elenbaas B, Sabatini DM, et al. Enumeration of the simian virus 40 early region elements necessary for human cell transformation. Mol Cell Biol 2002;22:2111-23.
(49) Bikel I, Montano X, Agha ME, Brown M, McCormack M, Boltax J, et al. SV40 small t antigen enhances the transformation activity of limiting concentrations of SV40 large T antigen. Cell 1987;48:321-30.
(50) Houben R, Shuda M, Weinkam R, Schrama D, Feng H, Chang Y, et al. Merkel cell polyomavirus-infected Merkel cell carcinoma cells require expression of viral T antigens. J Virol 2010;84:7064-72.
(51) Angermeyer S, Hesbacher S, Becker JC, Schrama D, Houben R. Merkel cell polyomavirus-positive Merkel cell carcinoma cells do not require expression of the viral small T antigen. J Invest Dermatol 2013;133:2059-64.
(52) Shuda M, Chang Y, Moore PS. Merkel cell polyomavirus-positive Merkel cell carcinoma requires viral small T-antigen for cell proliferation. J Invest Dermatol 2014;134:1479-81.
(53) Shuda M, Kwun HJ, Feng H, Chang Y, Moore PS. Human Merkel cell polyomavirus small T antigen is an oncoprotein targeting the 4E-BP1 translation regulator. J Clin Invest 2011;121:3623-34.
(54) Imai Y, Chumakov A, Miller C, Said J, Koeffler H. T-antigen of sv40 blocks p53 transactivation but not p53 specific binding to DNA. Int J Oncol 1994;5:945-53.
(55) Sullivan CS, Cantalupo P, Pipas JM. The molecular chaperone activity of simian virus 40 large T antigen is required to disrupt Rb-E2F family complexes by an ATP-dependent mechanism. Mol Cell Biol 2000;20:6233-43.
(56) Cobrinik D. Pocket proteins and cell cycle control. Oncogene 2005;24:2796-809.
(57) Wu CL, Zukerberg LR, Ngwu C, Harlow E, Lees JA. In vivo association of E2F and DP family proteins. Mol Cell Biol 1995;15:2536-46.
(58) Korenjak M, Brehm A. E2F-Rb complexes regulating transcription of genes important for differentiation and development. Curr Opin Genet Dev 2005;15:520-7.
(59) Munger K, Howley PM. Human papillomavirus immortalization and transformation functions. Virus Res 2002;89:213-28.
(60) Chen HZ, Tsai SY, Leone G. Emerging roles of E2Fs in cancer: an exit from cell cycle control. Nat Rev Cancer 2009;9:785-97.
45

(61) Maiti B, Li J, de BA, Gordon F, Timmers C, Opavsky R, et al. Cloning and characterization of mouse E2F8, a novel mammalian E2F family member capable of blocking cellular proliferation. J Biol Chem 2005;280:18211-20.
(62) Takahashi Y, Rayman JB, Dynlacht BD. Analysis of promoter binding by the E2F and pRB families in vivo: distinct E2F proteins mediate activation and repression. Genes Dev 2000;14:804-16.
(63) Balciunaite E, Spektor A, Lents NH, Cam H, Te RH, Scime A, et al. Pocket protein complexes are recruited to distinct targets in quiescent and proliferating cells. Mol Cell Biol 2005;25:8166-78.
(64) Cam H, Balciunaite E, Blais A, Spektor A, Scarpulla RC, Young R, et al. A common set of gene regulatory networks links metabolism and growth inhibition. Mol Cell 2004;16:399-411.
(65) Hollstein M, Sidransky D, Vogelstein B, Harris CC. p53 mutations in human cancers. Science 1991;253:49-53.
(66) Green DR, Chipuk JE. p53 and metabolism: Inside the TIGAR. Cell 2006;126:30-2.
(67) Han ES, Muller FL, Perez VI, Qi W, Liang H, Xi L, et al. The in vivo gene expression signature of oxidative stress. Physiol Genomics 2008;34:112-26.
(68) Vogelstein B, Lane D, Levine AJ. Surfing the p53 network. Nature 2000;408:307-10.
(69) Vousden KH. Activation of the p53 tumor suppressor protein. Biochim Biophys Acta 2002;1602:47-59.
(70) Blagosklonny MV. Loss of function and p53 protein stabilization. Oncogene 1997;15:1889-93.
(71) Mayo LD, Dixon JE, Durden DL, Tonks NK, Donner DB. PTEN protects p53 from Mdm2 and sensitizes cancer cells to chemotherapy. J Biol Chem 2002;277:5484-9.
(72) Sastre-Garau X, Peter M, Avril MF, Laude H, Couturier J, Rozenberg F, et al. Merkel cell carcinoma of the skin: pathological and molecular evidence for a causative role of MCV in oncogenesis. J Pathol 2009;218:48-56.
(73) Houben R, Adam C, Baeurle A, Hesbacher S, Grimm J, Angermeyer S, et al. An intact retinoblastoma protein-binding site in Merkel cell polyomavirus large T antigen is required for promoting growth of Merkel cell carcinoma cells. Int J Cancer 2012;130:847-56.
(74) Garibyan L, Fisher DE. How sunlight causes melanoma. Curr Oncol Rep 2010;12:319-26.
(75) Siegel R, Ma J, Zou Z, Jemal A. Cancer statistics, 2014. CA Cancer J Clin 2014;64:9-29.
(76) Miller AJ, Mihm MC, Jr. Melanoma. N Engl J Med 2006;355:51-65.
(77) Balch CM, Gershenwald JE, Soong SJ, Thompson JF, Atkins MB, Byrd DR, et al. Final version of 2009 AJCC melanoma staging and classification. J Clin Oncol 2009;27:6199-206.
(78) Jerant AF, Johnson JT, Sheridan CD, Caffrey TJ. Early detection and treatment of skin cancer. Am Fam Physician 2000;62:357-6, 381.
46

(79) Sandru A, Voinea S, Panaitescu E, Blidaru A. Survival rates of patients with metastatic malignant melanoma. J Med Life 2014;7:572-6.
(80) Friedman RJ, Rigel DS, Kopf AW. Early detection of malignant melanoma: the role of physician examination and self-examination of the skin. CA Cancer J Clin 1985;35:130-51.
(81) Maverakis E, Cornelius LA, Bowen GM, Phan T, Patel FB, Fitzmaurice S, et al. Metastatic melanoma - a review of current and future treatment options. Acta Derm Venereol 2015;95:516-24.
(82) consumerhealthdigest.com. https://www.consumerhealthdigest.com/health-conditions/melanoma.html. 2017.
Ref Type: Online Source
(83) melanoma.org. https://www.melanoma.org/understand-melanoma/diagnosing-melanoma/detection-screening/abcdes-melanoma. 2017.
Ref Type: Online Source
(84) Avril MF, Aamdal S, Grob JJ, Hauschild A, Mohr P, Bonerandi JJ, et al. Fotemustine compared with dacarbazine in patients with disseminated malignant melanoma: a phase III study. J Clin Oncol 2004;22:1118-25.
(85) Bedikian AY, Millward M, Pehamberger H, Conry R, Gore M, Trefzer U, et al. Bcl-2 antisense (oblimersen sodium) plus dacarbazine in patients with advanced melanoma: the Oblimersen Melanoma Study Group. J Clin Oncol 2006;24:4738-45.
(86) Chapman PB, Einhorn LH, Meyers ML, Saxman S, Destro AN, Panageas KS, et al. Phase III multicenter randomized trial of the Dartmouth regimen versus dacarbazine in patients with metastatic melanoma. J Clin Oncol 1999;17:2745-51.
(87) Middleton MR, Lorigan P, Owen J, Ashcroft L, Lee SM, Harper P, et al. A randomized phase III study comparing dacarbazine, BCNU, cisplatin and tamoxifen with dacarbazine and interferon in advanced melanoma. Br J Cancer 2000;82:1158-62.
(88) Nikolaou VA, Stratigos AJ, Flaherty KT, Tsao H. Melanoma: new insights and new therapies. J Invest Dermatol 2012;132:854-63.
(89) The Cancer Genome Atlas Network. Genomic Classification of Cutaneous Melanoma. Cell 2015;161:1681-96.
(90) Braig M, Schmitt CA. Oncogene-induced senescence: putting the brakes on tumor development. Cancer Res 2006;66:2881-4.
(91) Schulze WX, Deng L, Mann M. Phosphotyrosine interactome of the ErbB-receptor kinase family. Mol Syst Biol 2005;1:2005.
(92) Pearson G, Robinson F, Beers GT, Xu BE, Karandikar M, Berman K, et al. Mitogen-activated protein (MAP) kinase pathways: regulation and physiological functions. Endocr Rev 2001;22:153-83.
47

(93) Albino AP, Nanus DM, Mentle IR, Cordon-Cardo C, McNutt NS, Bressler J, et al. Analysis of ras oncogenes in malignant melanoma and precursor lesions: correlation of point mutations with differentiation phenotype. Oncogene 1989;4:1363-74.
(94) Gajewski TF, Salama AK, Niedzwiecki D, Johnson J, Linette G, Bucher C, et al. Phase II study of the farnesyltransferase inhibitor R115777 in advanced melanoma (CALGB 500104). J Transl Med 2012;10:246.
(95) Sebti SM, Der CJ. Opinion: Searching for the elusive targets of farnesyltransferase inhibitors. Nat Rev Cancer 2003;3:945-51.
(96) Whyte DB, Kirschmeier P, Hockenberry TN, Nunez-Oliva I, James L, Catino JJ, et al. K- and N-Ras are geranylgeranylated in cells treated with farnesyl protein transferase inhibitors. J Biol Chem 1997;272:14459-64.
(97) Hong DS, Sebti SM, Newman RA, Blaskovich MA, Ye L, Gagel RF, et al. Phase I trial of a combination of the multikinase inhibitor sorafenib and the farnesyltransferase inhibitor tipifarnib in advanced malignancies. Clin Cancer Res 2009;15:7061-8.
(98) Niessner H, Beck D, Sinnberg T, Lasithiotakis K, Maczey E, Gogel J, et al. The farnesyl transferase inhibitor lonafarnib inhibits mTOR signaling and enforces sorafenib-induced apoptosis in melanoma cells. J Invest Dermatol 2011;131:468-79.
(99) Curtin JA, Fridlyand J, Kageshita T, Patel HN, Busam KJ, Kutzner H, et al. Distinct sets of genetic alterations in melanoma. N Engl J Med 2005;353:2135-47.
(100) Curtin JA, Busam K, Pinkel D, Bastian BC. Somatic activation of KIT in distinct subtypes of melanoma. J Clin Oncol 2006;24:4340-6.
(101) Jiang X, Zhou J, Yuen NK, Corless CL, Heinrich MC, Fletcher JA, et al. Imatinib targeting of KIT-mutant oncoprotein in melanoma. Clin Cancer Res 2008;14:7726-32.
(102) Carvajal RD, Antonescu CR, Wolchok JD, Chapman PB, Roman RA, Teitcher J, et al. KIT as a therapeutic target in metastatic melanoma. JAMA 2011;305:2327-34.
(103) Guo J, Si L, Kong Y, Flaherty KT, Xu X, Zhu Y, et al. Phase II, open-label, single-arm trial of imatinib mesylate in patients with metastatic melanoma harboring c-Kit mutation or amplification. J Clin Oncol 2011;29:2904-9.
(104) Woodman SE, Trent JC, Stemke-Hale K, Lazar AJ, Pricl S, Pavan GM, et al. Activity of dasatinib against L576P KIT mutant melanoma: molecular, cellular, and clinical correlates. Mol Cancer Ther 2009;8:2079-85.
(105) Cho JH, Kim KM, Kwon M, Kim JH, Lee J. Nilotinib in patients with metastatic melanoma harboring KIT gene aberration. Invest New Drugs 2012;30:2008-14.
(106) Kluger HM, Dudek AZ, McCann C, Ritacco J, Southard N, Jilaveanu LB, et al. A phase 2 trial of dasatinib in advanced melanoma. Cancer 2011;117:2202-8.
48

(107) Wyman K, Atkins MB, Prieto V, Eton O, McDermott DF, Hubbard F, et al. Multicenter Phase II trial of high-dose imatinib mesylate in metastatic melanoma: significant toxicity with no clinical efficacy. Cancer 2006;106:2005-11.
(108) Ugurel S, Hildenbrand R, Zimpfer A, La RP, Paschka P, Sucker A, et al. Lack of clinical efficacy of imatinib in metastatic melanoma. Br J Cancer 2005;92:1398-405.
(109) Amaria RN, Lewis KD, Jimeno A. Vemurafenib: the road to personalized medicine in melanoma. Drugs Today (Barc ) 2012;48:109-18.
(110) Houben R, Becker JC, Kappel A, Terheyden P, Brocker EB, Goetz R, et al. Constitutive activation of the Ras-Raf signaling pathway in metastatic melanoma is associated with poor prognosis. J Carcinog 2004;3:6.
(111) Yang H, Higgins B, Kolinsky K, Packman K, Go Z, Iyer R, et al. RG7204 (PLX4032), a selective BRAFV600E inhibitor, displays potent antitumor activity in preclinical melanoma models. Cancer Res 2010;70:5518-27.
(112) Chapman PB, Hauschild A, Robert C, Haanen JB, Ascierto P, Larkin J, et al. Improved survival with vemurafenib in melanoma with BRAF V600E mutation. N Engl J Med 2011;364:2507-16.
(113) Flaherty KT, Yasothan U, Kirkpatrick P. Vemurafenib. Nat Rev Drug Discov 2011;10:811-2.
(114) Sosman JA, Kim KB, Schuchter L, Gonzalez R, Pavlick AC, Weber JS, et al. Survival in BRAF V600-mutant advanced melanoma treated with vemurafenib. N Engl J Med 2012;366:707-14.
(115) Flaherty KT, Puzanov I, Kim KB, Ribas A, McArthur GA, Sosman JA, et al. Inhibition of mutated, activated BRAF in metastatic melanoma. N Engl J Med 2010;363:809-19.
(116) McArthur GA, Chapman PB, Robert C, Larkin J, Haanen JB, Dummer R, et al. Safety and efficacy of vemurafenib in BRAF(V600E) and BRAF(V600K) mutation-positive melanoma (BRIM-3): extended follow-up of a phase 3, randomised, open-label study. Lancet Oncol 2014;15:323-32.
(117) Hauschild A, Grob JJ, Demidov LV, Jouary T, Gutzmer R, Millward M, et al. Dabrafenib in BRAF-mutated metastatic melanoma: a multicentre, open-label, phase 3 randomised controlled trial. Lancet 2012;380:358-65.
(118) Solit DB, Garraway LA, Pratilas CA, Sawai A, Getz G, Basso A, et al. BRAF mutation predicts sensitivity to MEK inhibition. Nature 2006;439:358-62.
(119) Flaherty KT, Robert C, Hersey P, Nathan P, Garbe C, Milhem M, et al. Improved survival with MEK inhibition in BRAF-mutated melanoma. N Engl J Med 2012;367:107-14.
(120) Flaherty KT, Infante JR, Daud A, Gonzalez R, Kefford RF, Sosman J, et al. Combined BRAF and MEK inhibition in melanoma with BRAF V600 mutations. N Engl J Med 2012;367:1694-703.
(121) Long GV, Stroyakovskiy D, Gogas H, Levchenko E, De BF, Larkin J, et al. Combined BRAF and MEK inhibition versus BRAF inhibition alone in melanoma. N Engl J Med 2014;371:1877-88.
49

(122) Robert C, Karaszewska B, Schachter J, Rutkowski P, Mackiewicz A, Stroiakovski D, et al. Improved overall survival in melanoma with combined dabrafenib and trametinib. N Engl J Med 2015;372:30-9.
(123) Eroglu Z, Ribas A. Combination therapy with BRAF and MEK inhibitors for melanoma: latest evidence and place in therapy. Ther Adv Med Oncol 2016;8:48-56.
(124) Strickland LR, Pal HC, Elmets CA, Afaq F. Targeting drivers of melanoma with synthetic small molecules and phytochemicals. Cancer Lett 2015;359:20-35.
(125) Hartsough E, Shao Y, Aplin AE. Resistance to RAF inhibitors revisited. J Invest Dermatol 2014;134:319-25.
(126) Poulikakos PI, Persaud Y, Janakiraman M, Kong X, Ng C, Moriceau G, et al. RAF inhibitor resistance is mediated by dimerization of aberrantly spliced BRAF(V600E). Nature 2011;480:387-90.
(127) Shi H, Moriceau G, Kong X, Lee MK, Lee H, Koya RC, et al. Melanoma whole-exome sequencing identifies (V600E)B-RAF amplification-mediated acquired B-RAF inhibitor resistance. Nat Commun 2012;3:724.
(128) Gopal YN, Deng W, Woodman SE, Komurov K, Ram P, Smith PD, et al. Basal and treatment-induced activation of AKT mediates resistance to cell death by AZD6244 (ARRY-142886) in Braf-mutant human cutaneous melanoma cells. Cancer Res 2010;70:8736-47.
(129) Shao Y, Aplin AE. Akt3-mediated resistance to apoptosis in B-RAF-targeted melanoma cells. Cancer Res 2010;70:6670-81.
(130) Haq R, Yokoyama S, Hawryluk EB, Jonsson GB, Frederick DT, McHenry K, et al. BCL2A1 is a lineage-specific antiapoptotic melanoma oncogene that confers resistance to BRAF inhibition. Proc Natl Acad Sci U S A 2013;110:4321-6.
(131) Jazirehi AR, Nazarian R, Torres-Collado AX, Economou JS. Aberrant apoptotic machinery confers melanoma dual resistance to BRAF(V600E) inhibitor and immune effector cells: immunosensitization by a histone deacetylase inhibitor. Am J Clin Exp Immunol 2014;3:43-56.
(132) Shao Y, Le K, Cheng H, Aplin AE. NF-kappaB Regulation of c-FLIP Promotes TNFalpha-Mediated RAF Inhibitor Resistance in Melanoma. J Invest Dermatol 2015;135:1839-48.
(133) Serasinghe MN, Missert DJ, Asciolla JJ, Podgrabinska S, Wieder SY, Izadmehr S, et al. Anti-apoptotic BCL-2 proteins govern cellular outcome following B-RAF(V600E) inhibition and can be targeted to reduce resistance. Oncogene 2015;34:857-67.
(134) Green DR. Means to an end: apoptosis and other cell death mechanisms. Cold Spring Harbor, N.Y: Cold Spring Harbor Laboratory Press; 2011.
(135) Plotz M, Eberle J. BH3-only proteins: possible proapoptotic triggers for melanoma therapy. Exp Dermatol 2014;23:375-8.
50
(136) Baig S, Seevasant I, Mohamad J, Mukheem A, Huri HZ, Kamarul T. Potential of apoptotic pathway-targeted cancer therapeutic research: Where do we stand? Cell Death Dis 2016;7:e2058.
(137) Hata AN, Engelman JA, Faber AC. The BCL2 Family: Key Mediators of the Apoptotic Response to Targeted Anticancer Therapeutics. Cancer Discov 2015;5:475-87.
(138) Eberle J, Hossini AM. Expression and function of bcl-2 proteins in melanoma. Curr Genomics 2008;9:409-19.
(139) Letai A, Bassik MC, Walensky LD, Sorcinelli MD, Weiler S, Korsmeyer SJ. Distinct BH3 domains either sensitize or activate mitochondrial apoptosis, serving as prototype cancer therapeutics. Cancer Cell 2002;2:183-92.
(140) Czabotar PE, Lessene G, Strasser A, Adams JM. Control of apoptosis by the BCL-2 protein family: implications for physiology and therapy. Nat Rev Mol Cell Biol 2014;15:49-63.
(141) Chen L, Willis SN, Wei A, Smith BJ, Fletcher JI, Hinds MG, et al. Differential targeting of prosurvival Bcl-2 proteins by their BH3-only ligands allows complementary apoptotic function. Mol Cell 2005;17:393-403.
(142) Boyd JM, Gallo GJ, Elangovan B, Houghton AB, Malstrom S, Avery BJ, et al. Bik, a novel death-inducing protein shares a distinct sequence motif with Bcl-2 family proteins and interacts with viral and cellular survival-promoting proteins. Oncogene 1995;11:1921-8.
(143) Pistritto G, Trisciuoglio D, Ceci C, Garufi A, D'Orazi G. Apoptosis as anticancer mechanism: function and dysfunction of its modulators and targeted therapeutic strategies. Aging (Albany NY) 2016;8:603-19.
(144) Lomonosova E, Chinnadurai G. BH3-only proteins in apoptosis and beyond: an overview. Oncogene 2008;27 Suppl 1:S2-19.
(145) Akgul C, Moulding DA, Edwards SW. Alternative splicing of Bcl-2-related genes: functional consequences and potential therapeutic applications. Cell Mol Life Sci 2004;61:2189-99.
(146) Ewings KE, Wiggins CM, Cook SJ. Bim and the pro-survival Bcl-2 proteins: opposites attract, ERK repels. Cell Cycle 2007;6:2236-40.
(147) Cartlidge RA, Thomas GR, Cagnol S, Jong KA, Molton SA, Finch AJ, et al. Oncogenic BRAF(V600E) inhibits BIM expression to promote melanoma cell survival. Pigment Cell Melanoma Res 2008;21:534-44.
(148) Nikrad M, Johnson T, Puthalalath H, Coultas L, Adams J, Kraft AS. The proteasome inhibitor bortezomib sensitizes cells to killing by death receptor ligand TRAIL via BH3-only proteins Bik and Bim. Mol Cancer Ther 2005;4:443-9.
(149) Shao Y, Aplin AE. BH3-only protein silencing contributes to acquired resistance to PLX4720 in human melanoma. Cell Death Differ 2012;19:2029-39.
(150) Hanahan D, Weinberg RA. Hallmarks of cancer: the next generation. Cell 2011;144:646-74.
51

(151) Beck D, Niessner H, Smalley KS, Flaherty K, Paraiso KH, Busch C, et al. Vemurafenib potently induces endoplasmic reticulum stress-mediated apoptosis in BRAFV600E melanoma cells. Sci Signal 2013;6:ra7.
(152) Paraiso KH, Xiang Y, Rebecca VW, Abel EV, Chen YA, Munko AC, et al. PTEN loss confers BRAF inhibitor resistance to melanoma cells through the suppression of BIM expression. Cancer Res 2011;71:2750-60.
(153) Rohrbeck L, Gong JN, Lee EF, Kueh AJ, Behren A, Tai L, et al. Hepatocyte growth factor renders BRAF mutant human melanoma cell lines resistant to PLX4032 by downregulating the pro-apoptotic BH3-only proteins PUMA and BIM. Cell Death Differ 2016;23:2054-62.
(154) Wang YF, Jiang CC, Kiejda KA, Gillespie S, Zhang XD, Hersey P. Apoptosis induction in human melanoma cells by inhibition of MEK is caspase-independent and mediated by the Bcl-2 family members PUMA, Bim, and Mcl-1. Clin Cancer Res 2007;13:4934-42.
(155) Sondergaard JN, Nazarian R, Wang Q, Guo D, Hsueh T, Mok S, et al. Differential sensitivity of melanoma cell lines with BRAFV600E mutation to the specific Raf inhibitor PLX4032. J Transl Med 2010;8:39.
(156) Andersen MH, Schrama D, Thor SP, Becker JC. Cytotoxic T cells. J Invest Dermatol 2006;126:32-41.
(157) Liao W, Lin JX, Leonard WJ. IL-2 family cytokines: new insights into the complex roles of IL-2 as a broad regulator of T helper cell differentiation. Curr Opin Immunol 2011;23:598-604.
(158) Ronnblom L, Eloranta ML, Alm GV. Role of natural interferon-alpha producing cells (plasmacytoid dendritic cells) in autoimmunity. Autoimmunity 2003;36:463-72.
(159) Atkins MB, Kunkel L, Sznol M, Rosenberg SA. High-dose recombinant interleukin-2 therapy in patients with metastatic melanoma: long-term survival update. Cancer J Sci Am 2000;6 Suppl 1:S11-S14.
(160) Atkins MB, Lotze MT, Dutcher JP, Fisher RI, Weiss G, Margolin K, et al. High-dose recombinant interleukin 2 therapy for patients with metastatic melanoma: analysis of 270 patients treated between 1985 and 1993. J Clin Oncol 1999;17:2105-16.
(161) Lawson DH. Choices in adjuvant therapy of melanoma. Cancer Control 2005;12:236-41.
(162) Hodi FS, O'Day SJ, McDermott DF, Weber RW, Sosman JA, Haanen JB, et al. Improved survival with ipilimumab in patients with metastatic melanoma. N Engl J Med 2010;363:711-23.
(163) Lipson EJ, Drake CG. Ipilimumab: an anti-CTLA-4 antibody for metastatic melanoma. Clin Cancer Res 2011;17:6958-62.
(164) Philips GK, Atkins M. Therapeutic uses of anti-PD-1 and anti-PD-L1 antibodies. Int Immunol 2015;27:39-46.
(165) Sullivan RJ, Flaherty KT. Immunotherapy: Anti-PD-1 therapies-a new first-line option in advanced melanoma. Nat Rev Clin Oncol 2015;12:625-6.
52

(166) Topalian SL, Drake CG, Pardoll DM. Immune checkpoint blockade: a common denominator approach to cancer therapy. Cancer Cell 2015;27:450-61.
(167) Ugurel S, Rohmel J, Ascierto PA, Flaherty KT, Grob JJ, Hauschild A, et al. Survival of patients with advanced metastatic melanoma: the impact of novel therapies-update 2017. Eur J Cancer 2017;83:247-57.
(168) Statistisches Bundesamt Germany. https://www.destatis.de/DE/ZahlenFakten/GesellschaftStaat/Gesundheit/Todesursachen/Todesursachen.html. 2017. 7-9-2017.
Ref Type: Online Source
(169) Lemos BD, Storer BE, Iyer JG, Phillips JL, Bichakjian CK, Fang LC, et al. Pathologic nodal evaluation improves prognostic accuracy in Merkel cell carcinoma: analysis of 5823 cases as the basis of the first consensus staging system. J Am Acad Dermatol 2010;63:751-61.
(170) Santamaria-Barria JA, Boland GM, Yeap BY, Nardi V, Dias-Santagata D, Cusack JC, Jr. Merkel cell carcinoma: 30-year experience from a single institution. Ann Surg Oncol 2013;20:1365-73.
(171) Schadendorf D, Lebbe C, Zur HA, Avril MF, Hariharan S, Bharmal M, et al. Merkel cell carcinoma: Epidemiology, prognosis, therapy and unmet medical needs. Eur J Cancer 2017;71:53-69.
(172) Tsao H, Fukunaga-Kalabis M, Herlyn M. Recent Advances in Melanoma and Melanocyte Biology. J Invest Dermatol 2017;137:557-60.
(173) Van Allen EM, Miao D, Schilling B, Shukla SA, Blank C, Zimmer L, et al. Genomic correlates of response to CTLA-4 blockade in metastatic melanoma. Science 2015;350:207-11.
(174) Coulie PG, Van den Eynde BJ, van der Bruggen P, Boon T. Tumour antigens recognized by T lymphocytes: at the core of cancer immunotherapy. Nat Rev Cancer 2014;14:135-46.
(175) McGranahan N, Furness AJ, Rosenthal R, Ramskov S, Lyngaa R, Saini SK, et al. Clonal neoantigens elicit T cell immunoreactivity and sensitivity to immune checkpoint blockade. Science 2016;351:1463-9.
(176) Kim R, Emi M, Tanabe K. Cancer immunoediting from immune surveillance to immune escape. Immunology 2007;121:1-14.
(177) Beatty GL, Gladney WL. Immune escape mechanisms as a guide for cancer immunotherapy. Clin Cancer Res 2015;21:687-92.
(178) Prieto PA, Yang JC, Sherry RM, Hughes MS, Kammula US, White DE, et al. CTLA-4 blockade with ipilimumab: long-term follow-up of 177 patients with metastatic melanoma. Clin Cancer Res 2012;18:2039-47.
(179) Larkin J, Chiarion-Sileni V, Gonzalez R, Grob JJ, Cowey CL, Lao CD, et al. Combined Nivolumab and Ipilimumab or Monotherapy in Untreated Melanoma. N Engl J Med 2015;373:23-34.
(180) Johnston RJ, Yu X, Grogan JL. The checkpoint inhibitor TIGIT limits antitumor and antiviral CD8+ T cell responses. Oncoimmunology 2015;4:e1036214.
53

(181) Johnston RJ, Comps-Agrar L, Hackney J, Yu X, Huseni M, Yang Y, et al. The immunoreceptor TIGIT regulates antitumor and antiviral CD8(+) T cell effector function. Cancer Cell 2014;26:923-37.
(182) Inozume T, Yaguchi T, Furuta J, Harada K, Kawakami Y, Shimada S. Melanoma Cells Control Antimelanoma CTL Responses via Interaction between TIGIT and CD155 in the Effector Phase. J Invest Dermatol 2016;136:255-63.
(183) Gulati N, Garcet S, Fuentes-Duculan J, Gilleaudeau P, Sullivan-Whalen M, Li X, et al. Molecular Profiling of Immune Activation Associated with Regression of Melanoma Metastases Induced by Diphencyprone. J Invest Dermatol 2016;136:2101-3.
(184) Krammer PH, Arnold R, Lavrik IN. Life and death in peripheral T cells. Nat Rev Immunol 2007;7:532-42.
(185) Li H, Zhu H, Xu CJ, Yuan J. Cleavage of BID by caspase 8 mediates the mitochondrial damage in the Fas pathway of apoptosis. Cell 1998;94:491-501.
(186) Simeone E, Grimaldi AM, Festino L, Giannarelli D, Vanella V, Palla M, et al. Correlation between previous treatment with BRAF inhibitors and clinical response to pembrolizumab in patients with advanced melanoma. Oncoimmunology 2017;6:e1283462.
(187) Trinchieri G. Interleukin-12 and the regulation of innate resistance and adaptive immunity. Nat Rev Immunol 2003;3:133-46.
(188) Lyngaa R, Pedersen NW, Schrama D, Thrue CA, Ibrani D, Met O, et al. T-cell responses to oncogenic merkel cell polyomavirus proteins distinguish patients with merkel cell carcinoma from healthy donors. Clin Cancer Res 2014;20:1768-78.
(189) Iribarren K, Bloy N, Buque A, Cremer I, Eggermont A, Fridman WH, et al. Trial Watch: Immunostimulation with Toll-like receptor agonists in cancer therapy. Oncoimmunology 2016;5:e1088631.
(190) Schneider LP, Schoonderwoerd AJ, Moutaftsi M, Howard RF, Reed SG, de Jong EC, et al. Intradermally administered TLR4 agonist GLA-SE enhances the capacity of human skin DCs to activate T cells and promotes emigration of Langerhans cells. Vaccine 2012;30:4216-24.
(191) Iyer JG, Afanasiev OK, McClurkan C, Paulson K, Nagase K, Jing L, et al. Merkel cell polyomavirus-specific CD8(+) and CD4(+) T-cell responses identified in Merkel cell carcinomas and blood. Clin Cancer Res 2011;17:6671-80.
(192) Gomez B, He L, Tsai YC, Wu TC, Viscidi RP, Hung CF. Creation of a Merkel cell polyomavirus small T antigen-expressing murine tumor model and a DNA vaccine targeting small T antigen. Cell Biosci 2013;3:29.
(193) Zeng Q, Gomez BP, Viscidi RP, Peng S, He L, Ma B, et al. Development of a DNA vaccine targeting Merkel cell polyomavirus. Vaccine 2012;30:1322-9.
(194) Amaral T, Sinnberg T, Meier F, Krepler C, Levesque M, Niessner H, et al. The mitogen-activated protein kinase pathway in melanoma part I - Activation and primary resistance mechanisms to BRAF inhibition. Eur J Cancer 2017;73:85-92.
54

(195) Amaral T, Sinnberg T, Meier F, Krepler C, Levesque M, Niessner H, et al. MAPK pathway in melanoma part II-secondary and adaptive resistance mechanisms to BRAF inhibition. Eur J Cancer 2017;73:93-101.
(196) Zhang G, Herlyn M. Linking SOX10 to a slow-growth resistance phenotype. Cell Res 2014;24:906-7.
(197) Roesch A, Fukunaga-Kalabis M, Schmidt EC, Zabierowski SE, Brafford PA, Vultur A, et al. A temporarily distinct subpopulation of slow-cycling melanoma cells is required for continuous tumor growth. Cell 2010;141:583-94.
(198) Roesch A, Vultur A, Bogeski I, Wang H, Zimmermann KM, Speicher D, et al. Overcoming intrinsic multidrug resistance in melanoma by blocking the mitochondrial respiratory chain of slow-cycling JARID1B(high) cells. Cancer Cell 2013;23:811-25.
(199) Beaumont KA, Hill DS, Daignault SM, Lui GY, Sharp DM, Gabrielli B, et al. Cell Cycle Phase-Specific Drug Resistance as an Escape Mechanism of Melanoma Cells. J Invest Dermatol 2016;136:1479-89.
(200) Obenauf AC, Zou Y, Ji AL, Vanharanta S, Shu W, Shi H, et al. Therapy-induced tumour secretomes promote resistance and tumour progression. Nature 2015;520:368-72.
(201) Fofaria NM, Frederick DT, Sullivan RJ, Flaherty KT, Srivastava SK. Overexpression of Mcl-1 confers resistance to BRAFV600E inhibitors alone and in combination with MEK1/2 inhibitors in melanoma. Oncotarget 2015;6:40535-56.
(202) Hartman ML, Talar B, Gajos-Michniewicz A, Czyz M. MCL-1, BCL-XL and MITF Are Diversely Employed in Adaptive Response of Melanoma Cells to Changes in Microenvironment. PLoS One 2015;10:e0128796.
(203) Boisvert-Adamo K, Longmate W, Abel EV, Aplin AE. Mcl-1 is required for melanoma cell resistance to anoikis. Mol Cancer Res 2009;7:549-56.
(204) Zhuang L, Lee CS, Scolyer RA, McCarthy SW, Zhang XD, Thompson JF, et al. Mcl-1, Bcl-XL and Stat3 expression are associated with progression of melanoma whereas Bcl-2, AP-2 and MITF levels decrease during progression of melanoma. Mod Pathol 2007;20:416-26.
(205) Espindola MB, Corleta OC. Bcl-2 expression is not associated with survival in metastatic cutaneous melanoma: a historical cohort study. World J Surg Oncol 2008;6:65.
(206) Trisciuoglio D, Desideri M, Ciuffreda L, Mottolese M, Ribatti D, Vacca A, et al. Bcl-2 overexpression in melanoma cells increases tumor progression-associated properties and in vivo tumor growth. J Cell Physiol 2005;205:414-21.
(207) Benimetskaya L, Ayyanar K, Kornblum N, Castanotto D, Rossi J, Wu S, et al. Bcl-2 protein in 518A2 melanoma cells in vivo and in vitro. Clin Cancer Res 2006;12:4940-8.
(208) Mukherjee N, Lu Y, Almeida A, Lambert K, Shiau CW, Su JC, et al. Use of a MCL-1 inhibitor alone to de-bulk melanoma and in combination to kill melanoma initiating cells. Oncotarget 2016.
55
(209) Nemati F, de MC, Lang G, Kraus-Berthier L, Carita G, Sastre-Garau X, et al. Targeting Bcl-2/Bcl-XL induces antitumor activity in uveal melanoma patient-derived xenografts. PLoS One 2014;9:e80836.
(210) Liu Y, Xie M, Song T, Sheng H, Yu X, Zhang Z. A novel BH3 mimetic efficiently induces apoptosis in melanoma cells through direct binding to anti-apoptotic Bcl-2 family proteins, including phosphorylated Mcl-1. Pigment Cell Melanoma Res 2015;28:161-70.
(211) Jang GH, Lee M. BH3-mimetic gossypol-induced autophagic cell death in mutant BRAF melanoma cells with high expression of p21Cip(1).). Life Sci 2014;102:41-8.
(212) Mukherjee N, Schwan JV, Fujita M, Norris DA, Shellman YG. Alternative Treatments For Melanoma: Targeting BCL-2 Family Members to De-Bulk and Kill Cancer Stem Cells. J Invest Dermatol 2015;135:2155-61.
(213) Nikrad M, Johnson T, Puthalalath H, Coultas L, Adams J, Kraft AS. The proteasome inhibitor bortezomib sensitizes cells to killing by death receptor ligand TRAIL via BH3-only proteins Bik and Bim. Mol Cancer Ther 2005;4:443-9.
(214) Zhu H, Zhang L, Dong F, Guo W, Wu S, Teraishi F, et al. Bik/NBK accumulation correlates with apoptosis-induction by bortezomib (PS-341, Velcade) and other proteasome inhibitors. Oncogene 2005;24:4993-9.
(215) Fernandez Y, Verhaegen M, Miller TP, Rush JL, Steiner P, Opipari AW, Jr., et al. Differential regulation of noxa in normal melanocytes and melanoma cells by proteasome inhibition: therapeutic implications. Cancer Res 2005;65:6294-304.
(216) Lane AA, Chabner BA. Histone deacetylase inhibitors in cancer therapy. J Clin Oncol 2009;27:5459-68.
(217) Ververis K, Hiong A, Karagiannis TC, Licciardi PV. Histone deacetylase inhibitors (HDACIs): multitargeted anticancer agents. Biologics 2013;7:47-60.
(218) Harada T, Hideshima T, Anderson KC. Histone deacetylase inhibitors in multiple myeloma: from bench to bedside. Int J Hematol 2016.
(219) Haas NB, Quirt I, Hotte S, McWhirter E, Polintan R, Litwin S, et al. Phase II trial of vorinostat in advanced melanoma. Invest New Drugs 2014;32:526-34.
(220) Hauschild A, Trefzer U, Garbe C, Kaehler KC, Ugurel S, Kiecker F, et al. Multicenter phase II trial of the histone deacetylase inhibitor pyridylmethyl-N-{4-[(2-aminophenyl)-carbamoyl]-benzyl}-carbamate in pretreated metastatic melanoma. Melanoma Res 2008;18:274-8.
(221) Hornig E, Heppt MV, Graf SA, Ruzicka T, Berking C. Inhibition of histone deacetylases in melanoma-a perspective from bench to bedside. Exp Dermatol 2016;25:831-8.
(222) Lai F, Guo ST, Jin L, Jiang CC, Wang CY, Croft A, et al. Cotargeting histone deacetylases and oncogenic BRAF synergistically kills human melanoma cells by necrosis independently of RIPK1 and RIPK3. Cell Death Dis 2013;4:e655.
56

(223) Thomas S, Quinn BA, Das SK, Dash R, Emdad L, Dasgupta S, et al. Targeting the Bcl-2 family for cancer therapy. Expert Opin Ther Targets 2013;17:61-75.
(224) Gandhi L, Camidge DR, Ribeiro de OM, Bonomi P, Gandara D, Khaira D, et al. Phase I study of Navitoclax (ABT-263), a novel Bcl-2 family inhibitor, in patients with small-cell lung cancer and other solid tumors. J Clin Oncol 2011;29:909-16.
(225) Roberts AW, Seymour JF, Brown JR, Wierda WG, Kipps TJ, Khaw SL, et al. Substantial susceptibility of chronic lymphocytic leukemia to BCL2 inhibition: results of a phase I study of navitoclax in patients with relapsed or refractory disease. J Clin Oncol 2012;30:488-96.
(226) Wilson WH, O'Connor OA, Czuczman MS, LaCasce AS, Gerecitano JF, Leonard JP, et al. Navitoclax, a targeted high-affinity inhibitor of BCL-2, in lymphoid malignancies: a phase 1 dose-escalation study of safety, pharmacokinetics, pharmacodynamics, and antitumour activity. Lancet Oncol 2010;11:1149-59.
(227) Crombie J, Davids MS. Venetoclax for the treatment of patients with chronic lymphocytic leukemia. Future Oncol 2017.
(228) King AC, Peterson TJ, Horvat TZ, Rodriguez M, Tang LA. Venetoclax: A First-in-Class Oral BCL-2 Inhibitor for the Management of Lymphoid Malignancies. Ann Pharmacother 2017;51:410-6.
(229) Lucas KM, Mohana-Kumaran N, Lau D, Zhang XD, Hersey P, Huang DC, et al. Modulation of NOXA and MCL-1 as a strategy for sensitizing melanoma cells to the BH3-mimetic ABT-737. Clin Cancer Res 2012;18:783-95.
(230) Miller LA, Goldstein NB, Johannes WU, Walton CH, Fujita M, Norris DA, et al. BH3 mimetic ABT-737 and a proteasome inhibitor synergistically kill melanomas through Noxa-dependent apoptosis. J Invest Dermatol 2009;129:964-71.
(231) Keuling AM, Felton KE, Parker AA, Akbari M, Andrew SE, Tron VA. RNA silencing of Mcl-1 enhances ABT-737-mediated apoptosis in melanoma: role for a caspase-8-dependent pathway. PLoS One 2009;4:e6651.
(232) Chen S, Dai Y, Harada H, Dent P, Grant S. Mcl-1 down-regulation potentiates ABT-737 lethality by cooperatively inducing Bak activation and Bax translocation. Cancer Res 2007;67:782-91.
(233) Wroblewski D, Mijatov B, Mohana-Kumaran N, Lai F, Gallagher SJ, Haass NK, et al. The BH3-mimetic ABT-737 sensitizes human melanoma cells to apoptosis induced by selective BRAF inhibitors but does not reverse acquired resistance. Carcinogenesis 2013;34:237-47.
(234) van Delft MF, Wei AH, Mason KD, Vandenberg CJ, Chen L, Czabotar PE, et al. The BH3 mimetic ABT-737 targets selective Bcl-2 proteins and efficiently induces apoptosis via Bak/Bax if Mcl-1 is neutralized. Cancer Cell 2006;10:389-99.
(235) Belmar J, Fesik SW. Small molecule Mcl-1 inhibitors for the treatment of cancer. Pharmacol Ther 2015;145:76-84.
(236) Quinn BA, Dash R, Azab B, Sarkar S, Das SK, Kumar S, et al. Targeting Mcl-1 for the therapy of cancer. Expert Opin Investig Drugs 2011;20:1397-411.
57

(237) Sun JG, Li H, Li X, Zeng X, Wu P, Fung KP, et al. Clitocine targets Mcl-1 to induce drug-resistant human cancer cell apoptosis in vitro and tumor growth inhibition in vivo. Apoptosis 2014;19:871-82.
(238) Wei G, Margolin AA, Haery L, Brown E, Cucolo L, Julian B, et al. Chemical genomics identifies small-molecule MCL1 repressors and BCL-xL as a predictor of MCL1 dependency. Cancer Cell 2012;21:547-62.
(239) Abulwerdi F, Liao C, Liu M, Azmi AS, Aboukameel A, Mady AS, et al. A novel small-molecule inhibitor of mcl-1 blocks pancreatic cancer growth in vitro and in vivo. Mol Cancer Ther 2014;13:565-75.
(240) Brunner M, Thurnher D, Pammer J, Geleff S, Heiduschka G, Reinisch CM, et al. Expression of VEGF-A/C, VEGF-R2, PDGF-alpha/beta, c-kit, EGFR, Her-2/Neu, Mcl-1 and Bmi-1 in Merkel cell carcinoma. Mod Pathol 2008;21:876-84.
(241) Hafner C, Houben R, Baeurle A, Ritter C, Schrama D, Landthaler M, et al. Activation of the PI3K/AKT pathway in Merkel cell carcinoma. PLoS One 2012;7:e31255.
(242) Nardi V, Song Y, Santamaria-Barria JA, Cosper AK, Lam Q, Faber AC, et al. Activation of PI3K signaling in Merkel cell carcinoma. Clin Cancer Res 2012;18:1227-36.
(243) Su LD, Fullen DR, Lowe L, Uherova P, Schnitzer B, Valdez R. CD117 (KIT receptor) expression in Merkel cell carcinoma. Am J Dermatopathol 2002;24:289-93.
(244) Loader DE, Feldmann R, Baumgartner M, Breier F, Schrama D, Becker JC, et al. Clinical remission of Merkel cell carcinoma after treatment with imatinib. J Am Acad Dermatol 2013;69:e181-e183.
(245) Samlowski WE, Moon J, Tuthill RJ, Heinrich MC, Balzer-Haas NS, Merl SA, et al. A phase II trial of imatinib mesylate in merkel cell carcinoma (neuroendocrine carcinoma of the skin): A Southwest Oncology Group study (S0331). Am J Clin Oncol 2010;33:495-9.
(246) Shiver MB, Mahmoud F, Gao L. Response to Idelalisib in a Patient with Stage IV Merkel-Cell Carcinoma. N Engl J Med 2015;373:1580-2.
(247) Kannan A, Lin Z, Shao Q, Zhao S, Fang B, Moreno MA, et al. Dual mTOR inhibitor MLN0128 suppresses Merkel cell carcinoma (MCC) xenograft tumor growth. Oncotarget 2016;7:6576-92.
(248) Lin Z, McDermott A, Shao L, Kannan A, Morgan M, Stack BC, Jr., et al. Chronic mTOR activation promotes cell survival in Merkel cell carcinoma. Cancer Lett 2014;344:272-81.
(249) Guo XE, Ngo B, Modrek AS, Lee WH. Targeting tumor suppressor networks for cancer therapeutics. Curr Drug Targets 2014;15:2-16.
(250) Quartin RS, Cole CN, Pipas JM, Levine AJ. The amino-terminal functions of the simian virus 40 large T antigen are required to overcome wild-type p53-mediated growth arrest of cells. J Virol 1994;68:1334-41.
(251) Rushton JJ, Jiang D, Srinivasan A, Pipas JM, Robbins PD. Simian virus 40 T antigen can regulate p53-mediated transcription independent of binding p53. J Virol 1997;71:5620-3.
58
(252) Andreeff M, Kelly KR, Yee K, Assouline S, Strair R, Popplewell L, et al. Results of the Phase I Trial of RG7112, a Small-Molecule MDM2 Antagonist in Leukemia. Clin Cancer Res 2016;22:868-76.
(253) Ray-Coquard I, Blay JY, Italiano A, Le CA, Penel N, Zhi J, et al. Effect of the MDM2 antagonist RG7112 on the P53 pathway in patients with MDM2-amplified, well-differentiated or dedifferentiated liposarcoma: an exploratory proof-of-mechanism study. Lancet Oncol 2012;13:1133-40.
(254) Liu S, Chen P, Hu M, Tao Y, Chen L, Liu H, et al. Randomized, controlled phase II study of post-surgery radiotherapy combined with recombinant adenoviral human p53 gene therapy in treatment of oral cancer. Cancer Gene Ther 2013;20:375-8.
(255) Shen A, Liu S, Yu W, Deng H, Li Q. p53 gene therapy-based transarterial chemoembolization for unresectable hepatocellular carcinoma: A prospective cohort study. J Gastroenterol Hepatol 2015;30:1651-6.
(256) Bollard J, Miguela V, Ruiz de GM, Venkatesh A, Bian CB, Roberto MP, et al. Palbociclib (PD-0332991), a selective CDK4/6 inhibitor, restricts tumour growth in preclinical models of hepatocellular carcinoma. Gut 2017;66:1286-96.
(257) Flaherty KT, Lorusso PM, Demichele A, Abramson VG, Courtney R, Randolph SS, et al. Phase I, dose-escalation trial of the oral cyclin-dependent kinase 4/6 inhibitor PD 0332991, administered using a 21-day schedule in patients with advanced cancer. Clin Cancer Res 2012;18:568-76.
(258) Fry DW, Harvey PJ, Keller PR, Elliott WL, Meade M, Trachet E, et al. Specific inhibition of cyclin-dependent kinase 4/6 by PD 0332991 and associated antitumor activity in human tumor xenografts. Mol Cancer Ther 2004;3:1427-38.
(259) Knudsen ES, Wang JY. Targeting the RB-pathway in cancer therapy. Clin Cancer Res 2010;16:1094-9.
(260) Hermel DJ, Ott PA. Combining forces: the promise and peril of synergistic immune checkpoint blockade and targeted therapy in metastatic melanoma. Cancer Metastasis Rev 2017;36:43-50.
(261) Kim T, Amaria RN, Spencer C, Reuben A, Cooper ZA, Wargo JA. Combining targeted therapy and immune checkpoint inhibitors in the treatment of metastatic melanoma. Cancer Biol Med 2014;11:237-46.
(262) Knight DA, Ngiow SF, Li M, Parmenter T, Mok S, Cass A, et al. Host immunity contributes to the anti-melanoma activity of BRAF inhibitors. J Clin Invest 2013;123:1371-81.
(263) Cooper ZA, Juneja VR, Sage PT, Frederick DT, Piris A, Mitra D, et al. Response to BRAF inhibition in melanoma is enhanced when combined with immune checkpoint blockade. Cancer Immunol Res 2014;2:643-54.
(264) Vella LJ, Pasam A, Dimopoulos N, Andrews M, Knights A, Puaux AL, et al. MEK inhibition, alone or in combination with BRAF inhibition, affects multiple functions of isolated normal human lymphocytes and dendritic cells. Cancer Immunol Res 2014;2:351-60.
59

(265) Sumimoto H, Imabayashi F, Iwata T, Kawakami Y. The BRAF-MAPK signaling pathway is essential for cancer-immune evasion in human melanoma cells. J Exp Med 2006;203:1651-6.
(266) Frederick DT, Piris A, Cogdill AP, Cooper ZA, Lezcano C, Ferrone CR, et al. BRAF inhibition is associated with enhanced melanoma antigen expression and a more favorable tumor microenvironment in patients with metastatic melanoma. Clin Cancer Res 2013;19:1225-31.
(267) Cooper ZA, Frederick DT, Juneja VR, Sullivan RJ, Lawrence DP, Piris A, et al. BRAF inhibition is associated with increased clonality in tumor-infiltrating lymphocytes. Oncoimmunology 2013;2:e26615.
(268) Wilmott JS, Long GV, Howle JR, Haydu LE, Sharma RN, Thompson JF, et al. Selective BRAF inhibitors induce marked T-cell infiltration into human metastatic melanoma. Clin Cancer Res 2012;18:1386-94.
(269) Khalili JS, Liu S, Rodriguez-Cruz TG, Whittington M, Wardell S, Liu C, et al. Oncogenic BRAF(V600E) promotes stromal cell-mediated immunosuppression via induction of interleukin-1 in melanoma. Clin Cancer Res 2012;18:5329-40.
(270) Schilling B, Sucker A, Griewank K, Zhao F, Weide B, Gorgens A, et al. Vemurafenib reverses immunosuppression by myeloid derived suppressor cells. Int J Cancer 2013;133:1653-63.
(271) Ribas A, Hodi FS, Callahan M, Konto C, Wolchok J. Hepatotoxicity with combination of vemurafenib and ipilimumab. N Engl J Med 2013;368:1365-6.
(272) Minor DR, Puzanov I, Callahan MK, Hug BA, Hoos A. Severe gastrointestinal toxicity with administration of trametinib in combination with dabrafenib and ipilimumab. Pigment Cell Melanoma Res 2015;28:611-2.
60

Vemurafenib Induces Senescence Features inMelanoma CellsSebastian Haferkamp1,4, Andreas Borst1,4, Christian Adam1, Therese M. Becker2, Stephanie Motschenbacher1,Simone Windhovel1, Anita L. Hufnagel3, Roland Houben1,5 and Svenja Meierjohann3,5
A large proportion of human melanomas harbor a mutation leading to permanent activation of the serine/threonine kinase BRAF, and as a consequence, they have developed dependence on BRAF/mitogen-activatedprotein kinase signaling. Accordingly, BRAF inhibitors such as Vemurafenib show a good anti-tumorigenic effecton metastases with the BRAFV600E mutation. Although an initial period of sustained tumor regression is usuallyobserved after Vemurafenib treatment, tumors often relapse at the same site, and apoptosis induction ofmelanoma cells in vitro is incomplete. Here, we demonstrate, using a large panel of melanoma cell lines, thatVemurafenib induces features of stress-induced senescence in addition to apoptosis. This senescence phenotypeis characterized by heterochromatin formation, changes in cell shape, and increased senescence-associatedb-galactosidase activity. Importantly, senescence features induced by BRAFV600E inhibition was also detected inhuman melanoma cells xenografted into nude mice. Our observations provide a possible explanation for the lackof complete and durable pro-apoptotic effect of Vemurafenib in patients.
Journal of Investigative Dermatology advance online publication, 14 February 2013; doi:10.1038/jid.2013.6
INTRODUCTIONPatients with metastatic melanoma have a poor prognosis andonly limited therapeutic options are available (Miller andMihm, Jr, 2006; Garbe et al., 2011). However, the identifi-cation of oncogenic BRAF in the majority of melanomas andthe demonstration that BRAF mutant melanoma cells arelargely dependent on BRAF/mitogen-activated protein kinase(MAPK) signaling have been important findings with highpharmacological impact (Puzanov and Flaherty, 2010). Morethan 80% of these BRAF mutations lead to a valine toglutamate exchange at position 600, rendering the proteinpermanently active by releasing an intra-molecular inhibitoryinteraction (Davies et al., 2002). Therefore, specific BRAFV600E
inhibitors such as Vemurafenib (PLX4032) are beneficial to alarge proportion of melanoma patients (Puzanov and Flaherty,
2010). The overall response rate of patients with BRAFV600E-positive melanomas to Vemurafenib is roughly 50% andresponsive patients display significant tumor regression andprolonged survival (Chapman et al., 2011). Although thestrategy of inhibiting mutant BRAF is the most successfulmelanoma treatment option so far, in most cases, the initialphase of tumor regression is followed by Vemurafenib resistance,disease relapse, and death of the patients (Aplin et al., 2011;Chapman et al., 2011). Consequently, the elucidation ofresistance mechanisms is a highly investigated area and hasrevealed the involvement of CRAF, AKT, receptor tyrosinekinases, and BRAF amplifications or splice variants in BRAFinhibitor resistance (Fedorenko et al., 2011). To better understandand improve BRAF inhibitor therapy, it is also crucial to evaluatethe phenotypic cellular responses and thereby the extent ofapoptosis versus cell cycle arrest initiated by Vemurafenib.
BRAF signaling can have different effects on cells ofmelanocyte origin. On the one hand, BRAF activation inprimary melanocytes in vitro induces an irreversible growtharrest termed senescence, which is regarded as a major tumorsuppressor mechanism (Michaloglou et al., 2005). Senescenceis triggered by a variety of cellular stresses, such as telomereattrition, UV exposure, reactive oxygen stress or—as in case ofBRAFV600E expression—oncogene activation (oncogene-induced senescence; Ogrunc and d’Adda di Fagagna, 2011).In contrast to quiescent cells, senescent cells can be arrestedin G0/G1 or G2/M and develop a characteristic flat and/ormultinuclear phenotype. Benign melanocytic nevi, whichfrequently harbor oncogenic BRAF mutations, remain stablygrowth arrested for decades and display markers of oncogene-induced senescence, such as an increased activity of theacidic b-galactosidase and induction of the tumor suppressor
ORIGINAL ARTICLE
1Department of Dermatology, Venereology and Allergology, UniversityHospital Wurzburg, Wurzburg, Germany; 2Westmead Institute for CancerResearch, The University of Sydney at Westmead Millennium Institute,Westmead Hospital, Westmead, Australia and 3Department of PhysiologicalChemistry I, Biocenter, University of Wurzburg, Wurzburg, Germany
Correspondence: Roland Houben, Department of Dermatology, Venereologyand Allergology, University Hospital Wurzburg, Josef-Schneider-Street 2,Wurzburg 97080, Germany. E-mail: [email protected] orSvenja Meierjohann, Department of Physiological Chemistry I, University ofWurzburg, Biocenter, Am Hubland, 97074 Wurzburg, Germany.E-mail: [email protected]
4The first two authors contributed equally to this work.5The last two authors contributed equally to this work.
Received 16 December 2011; revised 31 August 2012; accepted 29 October2012; accepted article preview online 15 January 2013
Abbreviations: ERK, extracellular signal–regulated kinase; MAPK, mitogen-activated protein kinase; SA-b-Gal, senescence-associated b-galactosidase;Vem, Vemurafenib
& 2013 The Society for Investigative Dermatology www.jidonline.org 1
7. Articles
61
Andy
Underline

p16 (Michaloglou et al., 2005). Therefore, it has beensuggested that benign nevi are an in vivo example ofoncogene-induced senescence, and overcoming senescenceis regarded as a key step in the progression to melanoma.However, the presence of senescent nevus cells remainscontroversial (Cotter et al., 2007; Gray-Schopfer et al., 2008;Michaloglou et al., 2008; Tran et al., 2012).On the other hand, in BRAF-mutant melanoma, BRAF is
essential for tumor survival and proliferation. BRAF signaling isinvolved in preventing apoptosis—e.g., by shifting the balancebetween pro- and anti-apoptotic proteins in the direction ofthe latter—and in cell cycle progression—e.g., by inducing thetranscription of cyclin D and by suppressing cell cycle-inhibitory proteins, which are also relevant for mediatingsenescence (Balmanno and Cook, 2009). Vemurafenibtreatment of melanoma cell lines was associated with a pro-apoptotic response (Lee et al., 2010; Sondergaard et al., 2010;Tap et al., 2010), the preferred outcome of tumor therapy.However, in other tumor types, the inhibition of the driveroncogene also promoted senescence. For instance, non-small-cell lung cancer cells treated with EGFR or MAPK/extracellularsignal–regulated (ERK) kinase inhibitors (Hotta et al., 2007;Wang et al., 2011) and colorectal cancer cells treated withvascular endothelial growth factor receptor 2 inhibitorsunderwent cellular senescence (Hasan et al., 2011).Here, we investigated the effect of Vemurafenib on apop-
tosis and senescence in a series of human melanoma cell lines.
RESULTSTo determine the response of melanoma cells to BRAFinhibition, we used a panel of 14 melanoma cell lines: 10carried the BRAFV600E mutation, 1 harbored the BRAFV600K
mutation, and 3 expressed wild-type BRAF. Seven of theBRAFV600E mutant cell lines are well-characterized lines fromthe NCI-60 panel (http://discover.nci.nih.gov/cellminer/muta-tionGeneLoad.do). The cells were treated with 0.5mM Vemur-afenib, a concentration previously demonstrated to effectivelyinhibit ERK1/2 signaling in BRAFV600E-mutant cells (Josephet al., 2010), and cell cycle distribution was analyzed by flowcytometry. After 2 days of treatment, the M14 cell lineresponded by undergoing cell death in 15% of the cellpopulation, but the proportion of dead cells decreased afterprolonged Vemurafenib exposure (Figure 1a). In the BRAF-mutant Malme 3M cell line, cell death was induced in adelayed manner and did not start before 4 days of Vemur-afenib exposure (Supplementary Figure S1a online). However,in M14 and Malme 3M cells, an increased proportion of thesurviving cells was found in G0/G1 after 7 days of Vemur-afenib treatment (Figure 1a and Supplementary Figure S1aonline). Most cell lines showed a clear increase in theproportion of G0/G1 cells in response to Vemurafenib, butno evidence of cell death (Supplementary Figure 1b online).As a control, we included the melanoma cell line WMM1175,which expresses inducible p16 and can be triggered intosenescence by addition of isopropyl-b-D-thiogalactopyrano-side (Haferkamp et al., 2008). Again, p16 expression causedaccumulation of cells in G0/G1 (Supplementary Figure S1bonline). Unexpectedly, the two BRAF-mutant melanoma cell
lines LOX IMVI and RPMI 7951 showed no alteration of cellcycle phases in response to Vemurafenib. We also examinedthe proliferation behavior of several melanoma cell lines byperforming carboxyfluorescein diacetate retention analyses.Here, cells are labeled with carboxyfluorescein diacetate,which is diluted out of proliferating cells over time but largelyretained in non-proliferating cells. Figure 1c shows that thedegree of label retention of the melanoma cell lines inresponse to Vemurafenib is comparable with the label reten-tion in WMM1175 cells after 5 days of isopropyl-b-D-thioga-lactopyranoside-induced p16 expression, which drives thecells into the senescence program.
As expected, all BRAF-mutant melanoma cell lines thatresponded to Vemurafenib showed diminished MAPKactivity, as detected by reduced P-ERK1/2 levels (Figure 2).In addition, they also displayed diminished the accumula-tion of P-Rb, a marker of cell cycle arrest (Figure 2). LOXIMVI cells, which showed no reduction of P-ERK1/2 inresponse to Vemurafenib, displayed no reduction of P-Rb. InRPMI 7951 cells, reduction of P-ERK1/2 as well as P-Rb wasnoted in response to Vemurafenib, despite a lacking effect onthe cell cycle.
To investigate the long-term effects of Vemurafenib, wetreated the cell lines with the drug for 7 days. In many of thecell lines that previously showed an increase in G0/G1,namely M19-Mel, SK-MEL-28, UACC-62, UACC-257, andFM88, we observed a characteristic change in cell shape toan enlarged and flattened phenotype, which is reminiscent ofsenescence (Supplementary Figure S2 online). Some of theenlarged cells were binucleated or multinucleated (Figure 3a,b). This phenotype was never observed in the cell linesexpressing wild-type BRAF, but only in cell lines carryingmutated BRAF. All cells displaying an enlarged phenotypeshowed increased senescence-associated b-galactosidase(SA-b-Gal) activity, supporting the notion that Vemurafenibcan induce senescence features in BRAF-dependent mela-noma cell lines (Figure 3c). In addition, cell lines withoutobvious cell shape alterations such as M14, Malme 3M, andMel2a also showed increased SA-b-Gal staining (Figure 3d).The accumulation of nuclear heterochromatin and promyelo-cytic leukemia (PML)-positive nuclear bodies often accompa-nies senescence (Narita et al., 2003; Courtois-Cox et al.,2008), and trimethylated H3K9 (H3K9me3) as well as PMLare well-established markers for these structures (Krauss, 2008;Vernier et al., 2011). We first analyzed the protein amount ofPML and H3K9me3 in untreated and Vemurafenib-treatedmelanoma cells (Figure 4a). An increase of either one of thesemarkers or both of them was observed in those cell lines thatshowed SA-b-Gal staining in more than 10% of the cellpopulation in response to Vemurafenib (compare Figures 3dand 4a). We also performed immunofluorescence staining ofPML in nine of the BRAF mutant cell lines and found that theresults concurred with our western blot data (Figure 4b andSupplementary Figure S3 online). All these data gained fromin vitro analyses of the melanoma cell lines are summarized inSupplementary Table S1 online.
The tumor suppressor protein p16 is an important regulatorof senescence in response to different cellular stress signals.
S Haferkamp et al.Induction of Senescence by Vemurafenib
2 Journal of Investigative Dermatology
62

However, p16 is frequently inactivated in melanoma, andgermline p16 mutations predispose to this cancer type(Castellano et al., 1997; Sharpless and Chin, 2003). In linewith these data, p16 expression was only detectable in twocell lines (SK-MEL-28 and Mel2a). Unexpectedly, it was evendownregulated in the presence of Vemurafenib, suggestingthat the observed decreased Rb phosphorylation is notmediated by p16 (Supplementary Figure S4 online).To establish whether growth inhibition of Vemurafenib-
treated cells was irreversible, as characteristic for senescent asopposed to quiescent cells, we investigated the colonyformation capacity of those cells that display Vemurafenib-dependent senescence features and included control cells,which do not display senescence features (MDA-MB-435,RPMI 7951, Mel Juso). Following 5 days of Vemurafenibtreatment, cells were washed to remove media with drug, andequal numbers of control- or Vemurafenib-treated cells wereseeded at low density and cultivated for 8 and 9 days in the
absence of the inhibitor. Colony formation was then mon-itored by crystal violet staining. Except M19-Mel and Mel2a,all cell lines that display Vemurafenib-dependent senescencefeatures showed reduced capacity to form colonies, reachingsignificance in case of Malme 3M, SK-MEL-28, UACC-62, andFM88 (Figure 5a, b). In particular, the colony-forming capacityof SK-MEL-28 cells was reduced by 480% (Figure 5a, b).Here, the colonies formed by Vemurafenib pretreated SK-MEL-28 cells were much smaller than their counterparts fromthe control population. In addition, many enlarged singlecells, having obviously not undergone cell division afterremoval of Vemurafenib, were detectable (Figure 5a). Thecolony-forming capacity of the control cells RPMI 7951 andMel Juso were not affected by Vemurafenib pretreatment(Figure 5b). Curiously, in M19 Mel and MD-MBA 435 cells,Vemurafenib pretreatment even led to enhanced colonyformation, although this did not reach statistical significance(Figure 5b).
Control
300G1
Sub–
G1
Sub–
G1S +
G2/M
S +
G2/M200
100
0
300G1
Sub–
G1
S +
G2/M Sub–
G1
S +
G2/M
G1 G1
200
100
00 1,023
300
200
100
0
300100%
80%
60%
40%
20%
0%
200
100
00 1,023 0 2 4 70 1,0230
Control 2 d Vem 4 d Vem 7 d VemM19-Mel
1,023
2 d Vem 4 d Vem 7 d Vem Sub G1 S
G2/MG0/G1
M14
100%
80%
60%
40%
20%
0%0 2 4 7
Sub G1 S
G2/MG0/G1300
G1
Sub–
G1
S +
G2/M
G1
Sub–
G1
S +
G2/M
G1G1
Sub–
G1
Sub–
G1
S +
G2/M
S +
G2/M
200
100
0
300
200
100
00
200300 250
200
150
100
50
0
250
200
150
100
50
010
010
110
210
310
4
100 10
110
2 103
104
Count
M14
250
200
150
100
50
0
180160140120100
806040200
100
101
102
103
104
100
CFDA fluorescence CFDA fluorescence
102
103 10
410
1
WMM1175 M19-Mel
180160140120100806040
Count
Count
Count
Count
Count
200
250
200
150
100
50
0
100
101
102
103
104
100
CFDA fluorescence
CFDA fluorescence CFDA fluorescence CFDA fluorescence
Malme-3M UACC-62 FM88
101
102
103
104
1,023 0 1,023 0 1,023
300
200
100
0
300
200
100
00 1,023
Figure 1. Apoptosis and G1 accumulation in response to BRAFV600E inhibition. (a) Left: Cell cycle profile of M14 cells treated with the solvent DMSO or with
0.5mM Vemurafenib (Vem) for 2, 4, and 7 days (d). Medium and inhibitor were changed every second day. Right: Bar graph representation, including standard
deviations, of the cell cycle profiles of M14 cells after indicated times of Vem treatment. (b) Left: Cell cycle profile of M19-Mel cells under the same conditions as
described in a. Right: Bar graph representation, including standard deviations, of the M19-Mel cell cycle profile after indicated times of Vem treatment. FACS
analyses were repeated twice, and the presented profiles are representative. Data are mean values from three independent experiments. (c) Flow cytometry analysis
of carboxyfluorescein diacetate (CFDA)-labeled cells. The histogram plot on day 0 is displayed in green. The blue and red lines represent the histogram plots of the
CFDA fluorescence, following 6 days in the absence and presence of 0.5mM Vem or 4mM isopropyl-b-D-thiogalactopyranoside (WMM1175), respectively.
S Haferkamp et al.Induction of Senescence by Vemurafenib
www.jidonline.org 3
63

To confirm these data in an independent assay, weperformed SA-b-Gal staining of those cell lines that displayedsignificantly reduced colony formation in Figure 5b as well asMDA-MB-435 cells as control. Nine days after withdrawal ofVemurafenib, the percentage of SA-b-Gal-positive cells was
still increased compared with control cells in SK-MEL-28,UACC-62, and FM88 cells (Figure 5c). Owing to the high SA-b-Gal background staining of Malme 3M cells, a differencecould not be detected here. Altogether, we could show thatthe senescence-inducing effect of Vemurafenib is sustainable
LOX IMVI
UACC-62 UACC-
257
Mel2a FM88 M26 Mel Juso WueMel45
– –+ + – + – + – + – + – + Vem
P-Rb
Rb
P-ERK1/2
ERK1/2
M14 M19-Mel Malme-
3M
MDA-MB-
435
RPMI-
7951
SK-MEL-
28
– –+ + – + – + – + – + – + Vem
P-Rb
Rb
P-ERK1/2
ERK1/2
Figure 2. ERK1/2 inhibition and Rb dephosphorylation by Vemurafenib (Vem). Western blot analysis of the indicated melanoma cell lines after 48h of treatment
with the solvent DMSO (—) or 0.5mM Vem. Cell lysates were analyzed for the expression of phospho-Rb (Ser 780), total Rb, phospho-ERK1/2 (Thr 202/Tyr 204),
and total ERK1/2.
M14 SK-MEL-28 UACC-62
Ctrl
Vem
M14 SK-MEL-28 UACC-62
Ctrl
Vem
40.00
30.00
20.00
10.00
0.00
Perc
enta
ge
*
*
*
*
*
Ctrl
Vem
LO
X IM
VI
M14
M19-M
el
Malm
e 3
M
MD
A-M
B-4
35
RP
MI-
7951
SK
-ME
L-2
8
UA
CC
-62
UA
CC
-257
Mel2
a
FM
88
M26
Mel Juso
WueM
el4
5BRAFV600E BRAFV600K BRAFwt
100.00
80.00
60.00
40.00
20.00
0.00
*
** **
*
*
**
*
*
Ctrl
Vem
LO
X IM
VI
M14
M19-M
el
Malm
e 3
M
MD
A-M
B-4
35
RP
MI-
7951
SK
-ME
L-2
8
UA
CC
-62
UA
CC
-257
Mel2
a
FM
88
M26
Mel Juso
WueM
el4
5
BRAFV600E BRAFV600K BRAFwt
Perc
enta
ge
M14 SK-MEL-28 UACC-62
Ctrl
2 µM
5 µM
6.0%
71.4%
74.4%
6.0%
80.0%
78.9% 88.4%
87.1%
3.1%
Figure 3. Appearance of senescent cells in response to BRAFV600E inhibition. (a) Phase contrast images of indicated cell lines after 7 days of control (Ctrl; DMSO)
or Vemurafenib (Vem) treatment (0.5mM). Red arrows indicate binucleated or multinucleated cells, bars¼ 20mm. (b) Quantification of binucleated and
multinuclead cells after Vem treatment in percent. (c) Senescence-associated b-galactosidase (SA-b-Gal) staining of indicated cell lines after 7 days of control
(DMSO) or Vem treatment (0.5mM), bars¼ 20mm. (d) Quantification of SA-b-Gal-positive cells after Vem treatment in percent. (e) SA-b-Gal staining of M14, SK-
MEL-28, and UACC-62 cells after 7 days of control (DMSO) or Vem treatment with indicated concentrations. The percentage of SA-b-Gal-positive cells in each
cell population is indicated, bar¼ 20mm. Data shown are derived from three independent experiments. Standard deviations are indicated. *Po0.05, **Po0.001
(Student’s t-test, two-tailed, paired).
S Haferkamp et al.Induction of Senescence by Vemurafenib
4 Journal of Investigative Dermatology
64

in some cell lines even after drug release. As only a fraction ofthe cell population (between 20% and 85%, see Figure 3d)becomes senescent because of the Vemurafenib treatment, thepercentage of terminally arrested senescent cells in a cellpopulation naturally decreases with time, dependent on thecell cycle duration of the unaffected cells. It is possible that theconsequential expansion and colony formation of unaffectedcells leads to the underestimation of the fraction of terminallyarrested and senescent cells at the beginning of drugwithdrawal.To determine whether an increase in Vemurafenib concen-
tration affects the degree of apoptosis and senescence induc-tion, we selected nine BRAFV600E-positive cell lines andtreated them with 2 and 5mM of the inhibitor in addition tothe previously used 0.5mM. Compared with 0.5mM, 2 and 5mMVemurafenib led to a slightly stronger inhibition of P-ERK1/2 insome, but not all cell lines (Supplementary Figure S5 online).In concordance with the data shown above, LOX IMVI cellswere irresponsive to Vemurafenib irrespective of the appliedconcentration. To analyze the effect of the increased Vemur-afenib concentration on cell growth and death, we monitoredcellular density in the absence or presence of the inhibitor
over a 5-day period using the X-celligence system (Roche;Supplementary Figure S6a). This assay allows detection of theimpedance or electric resistance of the cell population, whichusually correlates with cell density: while cell growth leadsto an increasing cell index, cell death is represented by adecreasing cell index. Because of their round cell shape,LOX IMVI cells are not suitable for this kind of analysis andwere therefore omitted. In most cell lines, 2 and 5mMVemurafenib decreased cell density compared with 0.5mM,indicating that the inhibitor is capable of inducing predomi-nantly cell death instead of senescence at higher concentra-tions. In case of M19-Mel and UACC-62, addition ofVemurafenib first led to an increase of cell index, which canbe attributed to the strongly increased cell shape thatalso influences impedance (see Supplementary Figures S2and S6 online). Thus, we complemented these data with aBrdU incorporation analysis, showing the extent of viableand proliferating cells, as well as detection of dead cells byflow cytometry (Supplementary Figure S6b and S7a online).Both assays also demonstrated that increased Vemurafenibconcentrations had an enhanced effect on the cells. In mostcell lines, induction of cell death went along with increases in
LOX IMVI M14 M19-Mel Malme-
3M
MDA-MB-
435
RPMI-
7951
SK-MEL-
28– – – – – – –
– – – – – – –
+ + + + + + +
+ + + + + + +
UACC-62 UACC-
257
Mel2a FM88 M26 Mel Juso WueMel
45
Vem
PML
H3k9me3
β-Actin
Vem
PML
H3k9me3
β-Actin
M14 M19-Mel
Control
Vem
Control
Vem
SK-MEL-28 UACC-62
PML DAPI PML DAPI
PML DAPI PML DAPI
PML DAPI PML DAPI
DAPIPMLDAPIPML
Figure 4. Vemurafenib causes the generation of heterochromatin and promyelocytic leukemia (PML) bodies in some melanoma cell lines. (a) Western blot
analysis of the indicated melanoma cell lines after 48h of treatment with the solvent DMSO (control) or 0.5mM Vemurafenib (Vem). Cell lysates were analyzed for
the expression of PML and trimethylated histone H3 (H3K9me3). b-Actin served as loading control. (b) Immunofluorescence showing focal nuclear accumulation
of PML in indicated melanoma cell lines. Whole cells are depicted in phase contrast images, and the nuclei are visualized by 4’,6-diamidino-2-phenylindole
(DAPI) staining, bar¼ 20mm.
S Haferkamp et al.Induction of Senescence by Vemurafenib
www.jidonline.org 5
65

the pro-apoptotic protein PUMA, thus indicating cell death byapoptosis (Supplementary Figure S7b online).However, even though 2 and 5mM Vemurafenib concen-
trations led to a stronger apoptosis response comparedwith 0.5mM, we found that many of the surviving cellsdisplayed senescence features such as flattened cell shapeand positive SA-b-Gal staining, which was visible in up to80% of the cell population (Figure 3e and SupplementaryFigure S8 online).To exclude that senescence induction upon BRAF inhibition
is an in vitro artifact, we analyzed the effect of Vemurafenib ina mouse model. Tumors were induced in Nude mice(Hsd:Athymic Nude-Foxn1nu) by subcutaneous injection ofSK-MEL-28 cells. After the tumors had reached a size ofapproximately 150mm3, the animals were treated by dailyintraperitoneal administration of 25mg Vemurafenib per kg
body weight. This led to initial tumor regression (Figure 6a).Control animals received the same volume of the solventMiglyol 812, and here tumors continued growing. Tumorswere excised following 7 days of treatment when tumorregression was evident in all Vemurafenib-treated mice (day25 after start of the experiment). In accordance with thein vitro data, the tumor cells of inhibitor-treated micedisplayed increased SA-b-Gal activity compared with thecontrol tumors (Figure 6b). In addition, we could observe adecrease of the proliferation marker Ki67, a slight, butnonsignificant increase of PML and H3K9me3, and theoccasional appearance of multinucleated cells in tumors fromVemurafenib-treated mice. An increase of apoptosis, mea-sured by cleaved caspase 3 and TUNEL, was not noted.However, as tumor regression was rather prominent immedi-ately after the addition of Vemurafenib (Figure 6a), apoptosis
*****
**
*
% C
ha
ng
e in
co
lony fo
rma
tio
n
100.00
75.00
50.00
25.00
0.00
–25.00
–50.00
–75.00
–100.00
% SA-β Gal Malme 3M
Control
Vem release
17.3 ± 5.7 4.0 ± 3.0
13.6 ± 3.2
7.0 ± 1.4
15.3 ± 0.4
8.5 ± 0.7
12.0 ± 0.2
1.8 ± 1.7
0.9 ± 0.120.9 ± 1.2
SK-MEL-28 UACC-62 FM88 MDA-MB-435
M1
4
M1
9-M
el
Ma
lme
3M
MD
A-M
B-4
35
RP
MI-
79
51
SK
-ME
L-2
8
UA
CC
-62
UA
CC
-25
7
Me
l2a
FM
88
Me
l Ju
so
Control Vem
Figure 5. Detection of senescence features after release from Vemurafenib (Vem). (a, b) Indicated cell lines were treated for 5 days with 0.5mM Vem. After
extensive washing, cells were seeded at very low density to allow monitoring of colony formation by single cells (10.000 cells per T75 cell culture flasks) and were
cultivated in the absence of Vem. After 8 and 9 days, cell colonies were stained with crystal violet. (a) Photomicrographs of colonies and single cells of the cell line
SK-MEL-28, bar (control)¼ 100mm, bar (Vem)¼20mm. (b) Change of colony number in Vemurafenib-treated compared with untreated cells. Standard deviations
are indicated. *Po0.05, **Po0.001, ***Po0.0001 (Student’s t-test, two-tailed, paired). (c) Percentage of senescence-associated b-galactosidase (SA-b-Gal)-
positive cells after control treatment or 5-day Vem treatment (0.5mM), followed by an 8-day release.
S Haferkamp et al.Induction of Senescence by Vemurafenib
6 Journal of Investigative Dermatology
66

has most likely taken place earlier and was not detectableanymore at the time of tumor excision.
DISCUSSIONAberrant activation of BRAF in primary melanocytes andfibroblasts induces permanent cell cycle arrest through onco-gene-induced senescence (Michaloglou et al., 2005). Here weshow that the induction of senescence is also an importantresponse to BRAF inhibition in BRAFV600E and BRAFV600K -mutant melanoma cells. In this respect, we demonstrate thatout of nine BRAFmutant cell lines that respond with cell cyclearrest to Vemurafenib treatment, eight display at least twomarkers of senescence-like typical changes in cell size and
shape, increased SA-b-Gal activity, or H3K9me3-positiveheterochromatic foci and PML bodies (see SupplementaryTable S1 online). In the cell line LOX IMVI, Vemurafenib didnot affect ERK1/2 phosphorylation at all, indicating that thereason for BRAF inhibitor resistance is likely found upstreamof ERK1/2. Possible mechanisms for such a phenomenoninclude enhanced receptor tyrosine kinase signaling, thedevelopment of BRAF splice mutants, or mutations in thekinase COT1, all of which can overcome the inhibitory effectof Vemurafenib on ERK1/2 (Johannessen et al., 2010;Villanueva et al., 2010; Poulikakos et al., 2011).
Most melanoma cells rely on an activated MAPK pathway,which is most often triggered by oncogenic BRAFV600E. RAF
Re
lative
ch
an
ge
in
tu
mo
r vo
lum
e
3.5
3
2.5
2
1.5
1
0.5
0
β-Gal
20x
100x
ContCont
Cont
Vem
Cont
Vem
Vem Vem ContCont Vem Vem ContCont Vem Vem Cont Vem
100
80
20
0
60
40
PML KI67 H3K9me3 Cleav. casp TUNEL MNC
Days
Start of treatment
Cont
Vem
0 10 20 30 40
Figure 6. Shrinkage of xenotransplanted tumors in mice treated with Vemurafenib (Vem) is associated with the induction of senescence-associated
b-galactosidase (SA-b-Gal) activity. In 12 nude mice, two tumors each were induced by subcutaneous injection of SK-MEL 28 cells. After 18 days, when the
tumors reached a volume of around 150mm3 (indicated by arrow), the animals received intraperitoneal injections of either phosphate-buffered saline/DMSO or
Vemurafenib (25mgkgÿ1). (a) Tumor growth curve of control (Cont)-treated and Vem-treated cells. Tumor size was measured and relative mean values
(±standard deviation) are displayed. (b) Senescence and apoptosis markers in xenotransplanted tumors after 7 days of treatment (day 25 after tumor cell injection).
Tumors were analyzed for the appearance of senescence markers, namely, multinucleated cells (MNCs), increased SA-b-Gal activity, and the expression of PML,
trimethylated histone H3 (H3K9me3), and the proliferation marker Ki67. Apoptotic cells were detected using TUNEL assay and immunohistochemical staining of
cleaved caspase 3 (Cleav. casp). Cell counts of each marker (including standard deviations) are shown in the histogram and correspond to the mean count number
of three different tumors of each group (bar (20� )¼200mm, bar (100� )¼ 10mm). PML, promyelocytic leukemia.
S Haferkamp et al.Induction of Senescence by Vemurafenib
www.jidonline.org 7
67
proteins phosphorylate and activate MAPK/ERK kinase, andMAPK/ERK kinase activates the ERK 1 and 2, which targetmore than 70 different substrates in different subcellularcompartments (Chen et al., 2001). ERK1/2 can exert theirpro-tumorigenic function through different mechanisms.ERK1/2-dependent phosphorylation of the transcriptionfactor FOXO3a leads to its proteasomal degradation, thusresulting in the reduced expression of the FOXO3a-dependentexpression of pro-apoptotic Bcl-2-like protein 11 (Balmannoand Cook, 2009). Notably, pro-apoptotic PUMA is alsoinduced by FOXO3a, and might therefore be indirectlyregulated by ERK1/2 (You et al., 2006). In addition, directBcl-2-like protein 11 and Bcl-2-associated death phosphory-lation by ERK1/2 reduces protein stability or prevents bindingof anti-apoptotic proteins, respectively, thereby shifting thebalance between pro- and anti-apoptotic proteins in favor ofcell survival. However, the cyclin-dependent kinase inhibitorgene CDKN1B (encoding p27KIP1) is another target gene ofFOXO3a, which is blocked by ERK1/2. In addition, cell cycle-promoting genes such as CCND1 (cyclin D1) and c-MYC areinduced by this pathway (Kerkhoff et al., 1998; Ciuffredaet al., 2009). Interestingly, small interfering RNA-mediateddownregulation of the ERK1/2 target gene c-MYC inestablished melanoma cells results in senescence (Zhuanget al., 2008). Thus, next to anti-apoptosis, proliferation is amajor function of the ERK1/2 pathway in tumors.The effect of Vemurafenib on melanoma cells expressing
the BRAFV600E oncogene, the main activator of the ERK1/2pathway in melanoma, is generally described as pro-apoptotic(Lee et al., 2010; Tap et al., 2010; Qin et al., 2012). Althoughwe could confirm this effect, in particular, when we used highconcentrations of Vemurafenib, we found that a substantialproportion of surviving cells displays features of senescence.These data demonstrate that apoptosis and senescenceresponse do not exclude each other in a cell population.Although apoptosis induction is the preferred effect of drug
treatment in cancer, senescence is also considered an eligibletreatment objective (Acosta and Gil, 2012). It is known thatsenescence triggers a local immune response, which helps toclear the tumor mass (Chien et al., 2011). As nude mice stillpossess natural killer cells, which reportedly display anti-melanoma activity, the observed tumor regression can beeasily explained. However, senescent cells can also provide amicroenvironment that increases the metastatic abilities ofneighboring cells (Ohanna et al., 2011), and might therebycontribute to resistance. Furthermore, cancer cells that weredriven into senescence by chemotherapeutic agents candevelop chemoresistant side populations with cancer stemcell-like properties (Achuthan et al., 2011). BRAF has a role inregulating mitosis, and BRAF inhibition impairs spindleformation and leads to chromosomal missegregation in HeLacells (Borysova et al., 2008). Similar events might take place inVemurafenib-treated melanoma cells, with the risk of causingincreased genomic instability and selection for drug-resistantcells with more aggressive tumorigenic phenotypes. Theinvolvement of senescence in melanoma regression andresistance in Vemurafenib-treated patients will be the subjectof our future studies.
MATERIALS AND METHODSCell cultureHuman melanoma cell lines LOX IMVI, M14, M19-Mel, Malme 3M,
MDA-MB-435, RPMI 7951, SK-MEL-28, UACC-62, and UACC-257
were cultivated in DMEM and FM88, Mel2A, WuMel45, M26, and
Mel Juso in RPMI-1640. For all cell lines, the medium was
supplemented with 10% fetal calf serum, penicillin (100Umlÿ 1,
Gibco, Darmstadt, Germany), and streptomycin (100mgmlÿ 1,
Gibco). The WMM1175 cells have been described previously
(Becker et al., 2001). For induction of p16, 4mM isopropyl-b-D-
thiogalactopyranoside was added to the culture medium.
SA-b-Gal stainingCells were either left untreated or were treated with indicated
concentrations of Vemurafenib for 7 days, unless specified otherwise,
before being washed with phosphate-buffered saline (PBS; pH 7.2)
and fixed with 3.7% formaldehyde in PBS (pH 7.2) for 5min at room
temperature. After rinsing the cells with PBS (pH 7.2), they were
subjected to b-Gal assay as described elsewhere (Dimri et al., 1995)
and then examined by light microscopy.
Cell lysis and immunoblot analysisAttached and floating cells were harvested, rinsed twice with PBS,
and were analyzed by western blot analysis as specified in the
Supplemental information online.
ImmunofluorescenceCells were seeded on glass coverslips, treated for the indicated times
with 0.5mM Vemurafenib, and were fixed for 5min at 4 1C in 100%
methanol, followed by a permeabilization step in 100% acetone
at 4 1C. Cells were then blocked with 1% bovine serum albumin
and probed with anti-PML antibody (1:100; PG-M3; Santa Cruz
Biotechnology, Santa Cruz, CA). Alexa Fluor 594 goat-anti-mouse
(Invitrogen, Darmstadt, Germany) was used as secondary antibody.
Nuclear counterstaining was performed with 4’,6-diamidino-2-
phenylindole.
Flow cytometryCells were treated with 0.5, 2, and 5mM Vemurafenib or the solvent
DMSO alone. After indicated timespans, attached cells and floating
cells in the medium supernatant were harvested and fixed in 70%
ethanol. Details of the analysis are given in the Supplemental Material
section.
XenotransplantationFor tumor induction, SK-MEL-28 was injected subcutaneously into
each lateral flank of 6-week-old female nude mice. When the
tumors reached a volume of around 150mm3, mice were randomly
divided into a vehicle control group and a Vemurafenib
treatment group, as specifed in the Supplemental Materials section
in detail. All the animal experiments were approved by the local
authorities (government of Unterfranken) according to the legal
requirements.
ImmunohistochemistryThree-micrometer sections of formalin-fixed and paraffin-embedded
tumors were treated and stained as described previously (Houben
et al., 2012; see also Supplementary Materials online).
S Haferkamp et al.Induction of Senescence by Vemurafenib
8 Journal of Investigative Dermatology
68

CONFLICT OF INTERESTThe authors state no conflict of interest.
ACKNOWLEDGMENTSWe thank Lena Volkert for excellent technical assistance and Helen Rizos forthe critical review of the manuscript. This work was supported by grants fromthe Deutsche Krebshilfe (German Melanoma Research Network), the IZKFWurzburg, and the German Research Council (Transregio 17: RAS-dependentpathways in human cancers).
SUPPLEMENTARY MATERIAL
Supplementary material is linked to the online version of the paper at http://www.nature.com/jid
REFERENCES
Achuthan S, Santhoshkumar TR, Prabhakar J et al. (2011) Drug-inducedsenescence generates chemoresistant stemlike cells with low reactiveoxygen species. J Biol Chem 286:37813–29
Acosta JC, Gil J (2012) Senescence: a new weapon for cancer therapy. TrendsCell Biol 22:211–9
Aplin AE, Kaplan FM, Shao Y (2011) Mechanisms of resistance to RAFinhibitors in melanoma. J Invest Dermatol 131:1817–20
Balmanno K, Cook SJ (2009) Tumour cell survival signalling by the ERK1/2pathway. Cell Death Differ 16:368–77
Becker TM, Rizos H, Kefford RF et al. (2001) Functional impairment ofmelanoma-associated p16(INK4a) mutants in melanoma cells despiteretention of cyclin-dependent kinase 4 binding. Clin Cancer Res 7:3282–8
Borysova MK, Cui Y, Snyder M et al. (2008) Knockdown of B-Raf impairsspindle formation and the mitotic checkpoint in human somatic cells. CellCycle 7:2894–901
Castellano M, Pollock PM, Walters MK et al. (1997) CDKN2A/p16 isinactivated in most melanoma cell lines. Cancer Res 57:4868–75
Chapman PB, Hauschild A, Robert C et al. (2011) Improved survival withvemurafenib in melanoma with BRAF V600E mutation. N Engl J Med364:2507–16
Chen Z, Gibson TB, Robinson F et al. (2001) MAP kinases. Chem Rev101:2449–76
Chien Y, Scuoppo C, Wang X et al. (2011) Control of the senescence-associated secretory phenotype by NF-kappaB promotes senescence andenhances chemosensitivity. Genes Dev 25:2125–36
Ciuffreda L, Del BD, Desideri M et al. (2009) Growth-inhibitory andantiangiogenic activity of the MEK inhibitor PD0325901 in malignantmelanoma with or without BRAF mutations. Neoplasia 11:720–31
Cotter MA, Florell SR, Leachman SA et al. (2007) Absence of senescence-associated beta-galactosidase activity in human melanocytic nevi in vivo.J Invest Dermatol 127:2469–71
Courtois-Cox S, Jones SL, Cichowski K (2008) Many roads lead to oncogene-induced senescence. Oncogene 27:2801–9
Davies H, Bignell GR, Cox C et al. (2002) Mutations of the BRAF gene inhuman cancer. Nature 417:949–54
Dimri GP, Lee X, Basile G et al. (1995) A biomarker that identifies senescenthuman cells in culture and in aging skin in vivo. Proc Natl Acad Sci USA92:9363–7
Fedorenko IV, Paraiso KH, Smalley KS (2011) Acquired and intrinsic BRAFinhibitor resistance in BRAF V600E mutant melanoma. Biochem Pharma-col 82:201–9
Garbe C, Eigentler TK, Keilholz U et al. (2011) Systematic review of medicaltreatment in melanoma: current status and future prospects. Oncologist16:5–24
Gray-Schopfer VC, Soo JK, Bennett DC (2008) Comment on ‘‘Absence ofsenescence-associated beta-galactosidase activity in human melanocyticnevi in vivo’’. J Invest Dermatol 128:1581–4
Haferkamp S, Becker TM, Scurr LL et al. (2008) p16INK4a-induced senescenceis disabled by melanoma-associated mutations. Aging Cell 7:733–45
Hasan MR, Ho SH, Owen DA et al. (2011) Inhibition of VEGF induces cellularsenescence in colorectal cancer cells. Int J Cancer 129:2115–23
Hotta K, Tabata M, Kiura K et al. (2007) Gefitinib induces prematuresenescence in non-small cell lung cancer cells with or without EGFRgene mutation. Oncol Rep 17:313–7
Houben R, Adam C, Baeurle A et al. (2012) An intact retinoblastoma protein-binding site in Merkel cell polyomavirus large T antigen is required forpromoting growth of Merkel cell carcinoma cells. Int J Cancer 130:847–56
Johannessen CM, Boehm JS, Kim SY et al. (2010) COT drives resistance to RAFinhibition through MAP kinase pathway reactivation. Nature 468:968–72
Joseph EW, Pratilas CA, Poulikakos PI et al. (2010) The RAF inhibitor PLX4032inhibits ERK signaling and tumor cell proliferation in a V600E BRAF-selective manner. Proc Natl Acad Sci USA 107:14903–8
Kerkhoff E, Houben R, Loffler S et al. (1998) Regulation of c-myc expression byRas/Raf signalling. Oncogene 16:211–6
Krauss V (2008) Glimpses of evolution: heterochromatic histone H3K9methyltransferases left its marks behind. Genetica 133:93–106
Lee JT, Li L, Brafford PA et al. (2010) PLX4032, a potent inhibitor of the B-RafV600E oncogene, selectively inhibits V600E-positive melanomas. PigmentCell Melanoma Res 23:820–7
Michaloglou C, Soengas MS, Mooi WJ et al. (2008) Comment on ‘‘Absence ofsenescence-associated beta-galactosidase activity in human melanocyticnevi in vivo’’. J Invest Dermatol 128:1582–3
Michaloglou C, Vredeveld LC, Soengas MS et al. (2005) BRAFE600-associatedsenescence-like cell cycle arrest of human naevi. Nature 436:720–4
Miller AJ, Mihm MC Jr (2006) Melanoma. N Engl J Med 355:51–65
Narita M, Nunez S, Heard E et al. (2003) Rb-mediated heterochromatinformation and silencing of E2F target genes during cellular senescence.Cell 113:703–16
Ogrunc M, d’Adda di Fagagna F (2011) Never-ageing cellular senescence. Eur JCancer 47:1616–22
Ohanna M, Giuliano S, Bonet C et al. (2011) Senescent cells develop a PARP-1and nuclear factor-{kappa}B-associated secretome (PNAS). Genes Dev25:1245–61
Poulikakos PI, Persaud Y, Janakiraman M et al. (2011) RAF inhibitor resistanceis mediated by dimerization of aberrantly spliced BRAF(V600E). Nature480:387–90
Puzanov I, Flaherty KT (2010) Targeted molecular therapy in melanoma. SeminCutan Med Surg 29:196–201
Qin J, Xin H, Nickoloff BJ (2012) Specifically targeting ERK1 or ERK2 killsmelanoma cells. J Transl Med 10:15
Sharpless E, Chin L (2003) The INK4a/ARF locus and melanoma. Oncogene22:3092–8
Sondergaard JN, Nazarian R, Wang Q et al. (2010) Differential sensitivity ofmelanoma cell lines with BRAFV600E mutation to the specific Rafinhibitor PLX4032. J Transl Med 8:39
Tap WD, Gong KW, Dering J et al. (2010) Pharmacodynamic characterizationof the efficacy signals due to selective BRAF inhibition with PLX4032 inmalignant melanoma. Neoplasia 12:637–49
Tran SL, Haferkamp S, Scurr LL et al. (2012) Absence of distinguishing senes-cence traits in human melanocytic nevi. J Invest Dermatol 132:2226–34
Vernier M, Bourdeau V, Gaumont-Leclerc MF et al. (2011) Regulation of E2Fsand senescence by PML nuclear bodies. Genes Dev 25:41–50
Villanueva J, Vultur A, Lee JT et al. (2010) Acquired resistance to BRAFinhibitors mediated by a RAF kinase switch in melanoma can beovercome by cotargeting MEK and IGF-1R/PI3K. Cancer Cell 18:683–95
Wang M, Morsbach F, Sander D et al. (2011) EGF receptor inhibitionradiosensitizes NSCLC cells by inducing senescence in cells sustainingDNA double-strand breaks. Cancer Res 71:6261–9
You H, Pellegrini M, Tsuchihara K et al. (2006) FOXO3a-dependent regulationof Puma in response to cytokine/growth factor withdrawal. J Exp Med203:1657–63
Zhuang D, Mannava S, Grachtchouk V et al. (2008) C-MYC overexpression isrequired for continuous suppression of oncogene-induced senescence inmelanoma cells. Oncogene 27:6623–34
S Haferkamp et al.Induction of Senescence by Vemurafenib
www.jidonline.org 9
69

Supplemental Material
Supplementary Materials and Methods
X-celligence analysis – 1.5x10³ cells were seeded on wells of a gold-layered 96-well-
plate (Roche) and were monitored for the indicated timespan using the X-celligence system
(Roche), as instructed by the manufacturer. Every five hours, resistance of the cell population
was measured and was recorded as “cell index”. The assay was done in triplicate, and two
independent biological experiments were performed.
BrdU incorporation assay – Cells were pretreated with 0, 0.5, 2 or 5 !M Vemurafenib
for 5 days and then incubated with 10 µM BrdU for 12 h. BrdU incorporation was quantified
using a colorimetric BrdU cell proliferation ELISA, as recommended by the manufacturer
(Roche).
Flow cytometry - For flow cytometry analysis, DNA was stained with 69 mM
propidium iodide in 38 mM sodium citrate and 100 mg/ml RNase A for 30 min at 37°C.
Samples were analyzed in a Beckman Coulter Cytomics FC 500. To analyze altered
proliferation by a second method we applied carboxyfluorescein diacetate (CFDA) which can
be used to label cells. Prior to treatment with Vemurafenib, cells were labeled applying the
Vybrant CFDA SE Cell Tracer Kit (Invitrogen) according to the manufacturer’s instructions.
Changes of the green fluorescence in control and Vemurafenib-treated cells were analyzed in
a FACSCanto (BD Biosciences).
Cell lysis and immunoblot analysis – Cells were lysed in lysis buffer (20 mM HEPES
(pH 7.8), 500 mM NaCl, 5 mM MgCl2, 5 mM KCl, 0.1% deoxycholate, 0.5% Nonidet-P40,
10 !g/ml aprotinin, 10 !g/ml leupeptin, 200 !M Na3VO4, 1 mM PMSF and 100 mM NaF).
Proteins were resolved by SDS/PAGE and analyzed by immunoblotting using the following
primary antibodies: Anti-!-actin (C-4; Santa Cruz Biotechnology), anti p16 (N20; Santa Cruz
Biotechnology) anti-PML (H238, PG-M3; Santa Cruz Biotechnology), anti-PUMA (Cell
70

Signaling), anti-ERK2 (C14; Santa Cruz Biotechnology), anti-ERK1/2 (Cell Signaling), anti-
phospho-ERK1/2 (Thr202/Tyr204; Cell Signaling), anti-phospho Rb (Ser780; Cell Signaling),
anti-H3K9me3 (Active Motif), anti-Retinoblastoma protein (C15, Santa Cruz Biotechnology )
and anti-tubulin (Sigma-Aldrich). The secondary antibodies were conjugated with horseradish
peroxidase and were directed against mouse (Pierce) or rabbit (Bio-Rad).
Immunohistochemistry - For the detection of senescence markers previously validated
primary antibodies were used recognizing Ki-67 (clone SP6; Lab Vision Corp.), cleaved
caspase 3 (Asp175, clone 5A1E; Cell Signaling), PML (H238, clone PG-M3; Santa Cruz
Biotechnology), anti-H3K9me3 (07-442; Millipore) and biotinylated multispecies-specific
secondary antibody (DAKO) (Tomita 2010, Tran et al 2012). TUNEL assays were performed
using the in situ cell death detection kit (Roche) according to the manufacturer’s instructions.
Xenotransplantation - Six-week-old female nude mice (Hsd:Athymic Nude-Foxn1nu
),
were obtained from Harlan Laboratories (Eystrup, Germany). For tumor induction, 5*106 SK-
MEL-28 cells suspended in PBS supplemented with 50% BD MatrigelTM
Basement
Membrane Matrix (BD Biosciences, Heidelberg, Germany) were injected s.c. into each lateral
flank of the mice. The size of the tumor was measured twice weekly using a slide gauche.
When the tumors reached a volume of around 150 mm3 (day 18 after cell injection), the mice
were randomly divided into two groups (n=6): vehicle control group (mice injected
intraperitoneally with PBS/DMSO daily), Vemurafenib group (mice injected intraperitoneally
with 25 mg/kg Vemurafenib daily). For further analysis subcutaneously grown tumors were
surgically removed. Subsequently the tumors were divided and snap-frozen in liquid nitrogen
and formalin-fixed, paraffin-embedded.
71

Supplemental references
Tomita T (2010). Cleaved caspase-3 immunocytochemical staining for pancreatic islets and
pancreatic endocrine tumors: A potential marker for biological malignancy. Islets 2: 82-88.
Tran SL, Haferkamp S, Scurr LL, Gowrishankar K, Becker TM, Desilva C et al (2012).
Absence of distinguishing senescence traits in human melanocytic nevi. J Invest Dermatol
132: 2226-2234.
72
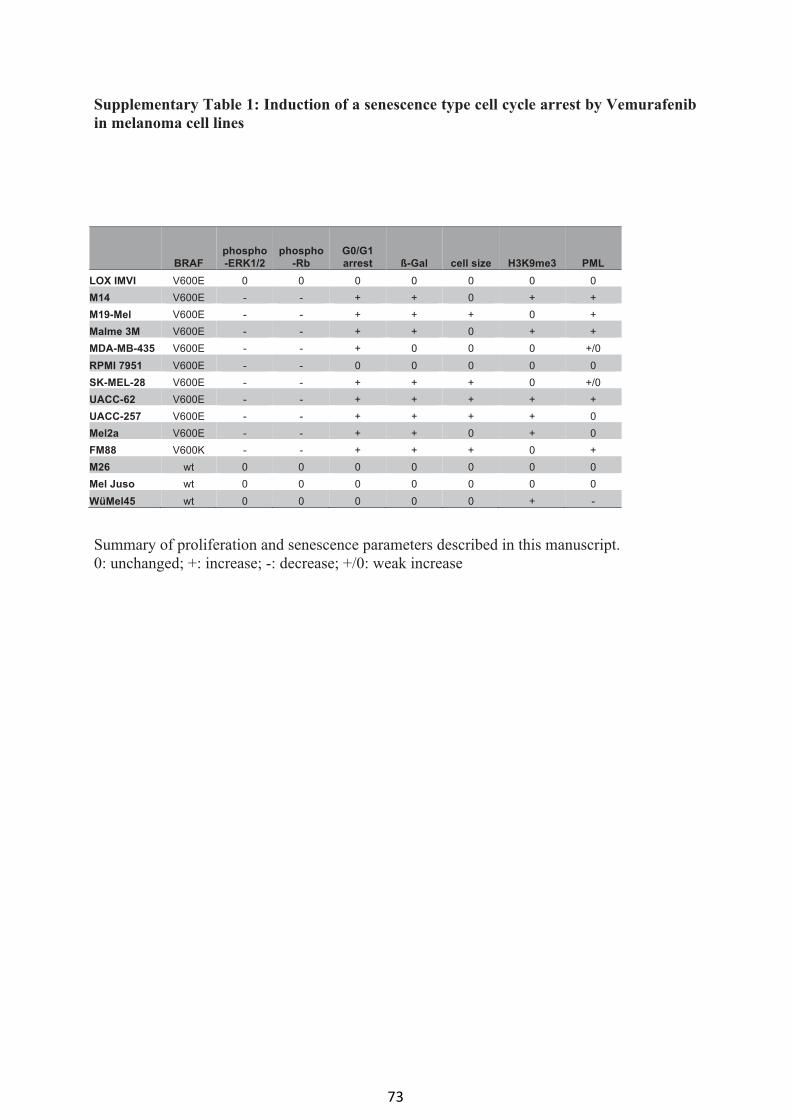
Supplementary Table 1: Induction of a senescence type cell cycle arrest by Vemurafenib
in melanoma cell lines
Summary of proliferation and senescence parameters described in this manuscript.
0: unchanged; +: increase; -: decrease; +/0: weak increase
BRAF
phospho
-ERK1/2
phospho
-Rb
G0/G1
arrest ß-Gal cell size H3K9me3 PML
LOX IMVI V600E 0 0 0 0 0 0 0
M14 V600E - - + + 0 + +
M19-Mel V600E - - + + + 0 +
Malme 3M V600E - - + + 0 + +
MDA-MB-435 V600E - - + 0 0 0 +/0
RPMI 7951 V600E - - 0 0 0 0 0
SK-MEL-28 V600E - - + + + 0 +/0
UACC-62 V600E - - + + + + +
UACC-257 V600E - - + + + + 0
Mel2a V600E - - + + 0 + 0
FM88 V600K - - + + + 0 +
M26 wt 0 0 0 0 0 0 0
Mel Juso wt 0 0 0 0 0 0 0
WüMel45 wt 0 0 0 0 0 + -
73

Supplementary figure legends
Figure S1: Effect of Vemurafenib on the cell cycle
Bar graph representation of the cell cycle profiles of melanoma cells after indicated times of
Vemurafenib or IPTG (WMM1175) treatment. Data are mean values from three independent
experiments. Standard deviations are indicated.
74

Figure S2: Effect of Vemurafenib on melanoma cell shape
Phase contrast images of indicated melanoma cell lines treated for 7 days with the solvent
DMSO (control) or with 0.5 !M Vemurafenib (Vem), (bar=20!m).
Figure S2
SK-MEL-28
control Vem
LOX-IMVI
M19-Mel
M14
UACC-62
UACC-257
Malme-3M
control Vem
RPMI 7951
MDA-MB-435
Mel Juso
M26
WueMel45
Mel2a
FM88 FM
M2M2
75

Figure S3: PML body formation by Vemurafenib
Immunofluorescence showing focal nuclear accumulation of PML in indicated melanoma cell
lines. The nuclei are visualized by DAPI staining, (bar=20!m).
Figure S3
LOX IMVI
MDA-MB- 435
Malme-3M
PML
PML
DAPI
DAPI
Vem
control
PML DAPI
PML DAPI
Vem
control
Vem
control
PML DAPI
PML DAPI
PML
PML
DAPI
DAPI
RPMI-7951
Vem
control
PML DAPI
PML DAPI
UACC-257
Vem
control
76

Figure S4: Effect of Vemurafenib on p16
Western blot of total cell lysates derived from the indicated cell lines after 2 days in the
presence or absence of 0.5 !M Vemurafenib. Tubulin served as loading control.
77

Figure S5: Inhibition of ERK1/2 by increasing concentrations of Vemurafenib
Western blot of the indicated melanoma cell lines after 48 h of treatment with the solvent
DMSO (-) or with 0.5 !M, 2 !M and 5 !M Vemurafenib (Vem). Cell lysates were analyzed
for the expression of phospho-ERK1/2 (Thr 202/ Tyr 204). Total ERK2 served as loading
control.
78

Figure S6: Effect of increasing concentration of Vemurafenib on cell growth and DNA
synthesis
a: X-celligence measurement of indicated melanoma cells in presence of the indicated
concentration of Vemurafenib up to 120 hours (5 days). The cell index represents the
impedance of the cell population on a well of a 96-well dish. b: BrdU incorporation of
indicated cell lines that were pretreated with the indicated concentrations of Vemurafenib for
5 days before incubation with BrdU for 12 h. The significance of differences between the
DMSO control and the different Vemurafenib treatments are indicated. Standard deviations
are indicated.*: p<0.05, **: p<0.001 (Student`s t-test, two-tailed, paired).
79

Figure S7: Apoptosis induction by Vemurafenib
Cells were treated for 5 days with the indicated concentrations of Vemurafenib, before cells
and their supernatant were harvested and subjected to analyses. a: Cells were analyzed by
flow cytometry, and the percentage of cells in subG1 are indicated. b: Western blot showing
the induction of the pro-apoptotic protein PUMA in response to Vemurafenib treatment.
Tubulin served as loading control.
80

Figure S8: Induction of senescence in response to increased Vemurafenib concentration
SA-!-Gal staining of indicated cell lines after seven days of control (DMSO) or Vemurafenib
treatment with the indicated concentrations. The percentage of SA-!-Gal-positive cells after
Vemurafenib treatment is indicated.
Figure S8
control 2 !M
LOX-IMVI
M19-Mel
Malme-3M
RPMI 7951
MDA-MB-435
5 !M
WueMel45
Mel2a
UACC-257
FM88
Mel Juso
M26
0.0% 0.6% 0.6%
1.9% 16.8% 15.0%
3.8% 4.2% 3.3%
6.4% 85.5% 79.9%
2.8% 78.4% 81.8%
3.7% 2.7% 6.7%
2.9% 4.5% 8.3%
2.0% 2.9% 4.3%
16.8% 36.4% 34.7%
4.5% 12.9% 12.3%
9.2% 14.4% 12.6%
6%0% 0.
.4%
.4%
2%4.2%
.5.5%
81

Mechanisms of p53 Restriction in Merkel CellCarcinoma Cells Are Independent of the Merkel CellPolyoma Virus T AntigensRoland Houben1, Christina Dreher1, Sabrina Angermeyer1, Andreas Borst1, Jochen Utikal2,3,Sebastian Haferkamp1, Wiebke K. Peitsch3, David Schrama1,4 and Sonja Hesbacher1
Merkel cell carcinoma (MCC) is a rare and very aggressive skin cancer with viral etiology. The tumor-associatedMerkel cell polyoma virus (MCV) belongs to a group of viruses encoding T antigens (TAs) that can inducetumorigenesis by interfering with cellular tumor-suppressor proteins like p53. To explore possible modes of p53inactivation in MCC p53 sequencing, expression analysis and reporter gene assays for functional analyses wereperformed in a set of MCC lines. In one MCV-negative and one MCV-positive cell line, p53 inactivating mutationswere found. In the majority of MCC lines, however, wild-type p53 is expressed and displays some transcriptionalactivity, which is yet not sufficient to effectively restrict cellular survival or growth in these cell cultures.Interestingly, the MCV TAs are not responsible for this critical lack in p53 activity, as TA knockdown in MCV-positive MCC cells does not induce p53 activity. In contrast, inhibition of the ubiquitin ligase HDM-2 (humandouble minute 2) by Nutlin-3a leads to p53 activation and p53-dependent apoptosis or cell cycle arrest in five outof seven p53 wild-type MCC lines, highlighting p53 as a potential target for future therapies of this aggressivetumor.
Journal of Investigative Dermatology (2013) 133, 2453–2460; doi:10.1038/jid.2013.169; published online 16 May 2013
INTRODUCTIONMerkel cell carcinoma (MCC) of the skin is a rare and veryaggressive neuroendocrine tumor with more than 3-fold rise inincidence over the past decades (Hodgson, 2005). As MCChas a high tendency to metastasize, and there are no curativeor life-prolonging therapies available for patients withdistant metastases (Tai et al., 2000; Becker, 2010), there is agreat need to understand the molecular events driving thiscancer.Until recently, virtually nothing was known about
oncogenes and tumor suppressors contributing to the patho-genesis of MCC (Lemos and Nghiem, 2007). However, animportant step forward was the discovery of the Merkel cell
polyoma virus (MCV) that is clonally integrated in the genomeof the cancer cells in the majority of MCCs (Feng et al., 2008;Sastre-Garau et al., 2009). Integration of the virus beforeclonal expansion of the tumor cells as well as addictionof MCV-positive MCC cells to the expression of viraloncoproteins suggest that MCV is a major driver of MCCdevelopment and progression (Houben et al., 2010, 2012a).The polyomaviruses oncoproteins are the T antigens (TAs).
All polyomaviruses encode alternatively spliced Largeand small T antigen (LT and sT). Further splice variants aremiddle T antigen, 17 kT and 57 kT, that are encoded bymurine polyomaviruses, simian virus 40 (SV40) and MCV,respectively (Shuda et al., 2008; Cheng et al., 2009; Gjoerupand Chang, 2010). Oncogenic transformation by the viral TAsis mediated by interaction with a multitude of cellularproteins. For example, protein phosphatase 2A is targeted bySV40 sT, whereas SV40 LT is capable of inactivating thetumor-suppressor proteins retinoblastoma protein and p53(Gjoerup and Chang, 2010).
p53—also referred to as guardian of the genome—is atranscription factor that can modulate the expression ofhundreds of genes (Song and Xu, 2007). In normal cells,p53 is frequently undetectable because of continuousubiquitination by HDM-2 (human double minute 2) andsubsequent proteasomal degradation (Blagosklonny, 1997).On several types of stresses including DNA damage oroncogene activation, p53 gets activated and inducescell cycle arrest, DNA repair, apoptosis, or senescence
ORIGINAL ARTICLE
1Department of Dermatology, Venereology and Allergology, UniversityHospital Wurzburg, Wurzburg, Germany; 2Skin Cancer Unit, German CancerResearch Center (DKFZ), Heidelberg, Germany; 3Department of Dermatology,Venereology and Allergology, University Medical Center Mannheim,University of Heidelberg, Mannheim, Germany and 4Department of GeneralDermatology, Medical University Graz, Graz, Austria
Correspondence: Roland Houben, Department of Dermatology, Venereologyand Allergology, University Hospital Wurzburg, Josef-Schneider-Strasse 2,D-97080 Wurzburg, Germany. E-mail: [email protected]
Received 30 October 2012; revised 20 March 2013; accepted 21 March2013; accepted article preview online 5 April 2013; published online 16 May2013
Abbreviations: GFP, green fluorescent protein; HDM-2, human doubleminute 2; LT, large T antigen; MCC, Merkel cell carcinoma; MCV, Merkel cellpolyoma virus; shRNA, short hairpin RNA; sT, small T antigen; SV40, simianvirus 40; TA, T antigen
& 2013 The Society for Investigative Dermatology www.jidonline.org 2453
82

(Green and Chipuk, 2006; Lavin and Gueven, 2006; Sherr,2006). Thereby, p53 is central for the suppression of cancer,and its inactivation is one of the characteristics of cancer.Indeed, mutations of p53 are found in approximately half ofall tumors (Roemer, 1999). Most of these aberrations aremissense mutations in the central DNA-binding domain thatabolish the transcriptional capacity and may render p53dominant negative over coexpressed wild-type p53 (vanOijen and Slootweg, 2000). Beside mutations, further modesof p53 inactivation contributing to tumor development havebeen described, including the ability of certain viral proteinsto impair p53 function. Indeed, p53 inactivation is a commonfeature of all DNA tumor viruses (Levine, 2009).p53 inactivation by polyomaviruses was described mainly
as a function of LT that binds to p53 and thereby abrogates itsability to act as a transcription factor (Bargonetti et al., 1992;Jiang et al., 1993; Pipas and Levine, 2001). MCV LTs in MCCcells, however, lack a putative p53-binding domain becauseof tumor-associated T-antigen deletion mutations generallypresent in MCC-associated MCV genomes (Shuda et al., 2008;Sastre-Garau et al., 2009). Nevertheless, recent reportssuggested that mutations in p53 occur preferentially in MCCtumors that fail to express MCV LT (Sihto et al., 2011; Rodiget al., 2012). For example, p53 mutations were found in over50% of MCCs lacking MCV LT expression but were notdetectable in LT-positive MCCs (Sihto et al., 2011). Theseobservations suggest that even MCV with truncated LT is able
to inactivate p53. In line with this notion, it has been reportedthat, on one hand, SV40 LT lacking the C-terminalp53-binding domain is still able to inhibit p53-dependenttranscription (Quartin et al., 1994; Rushton et al., 1997)and, on the other hand, SV40 sT can repress p53 function(Gjoerup et al., 2000).
Here we analyze the p53 signaling pathway in MCV-positive and MCV-negative MCC lines. Most of these celllines harbor wild-type but insufficiently active p53 protein.We exclude the MCV TAs as relevant inhibitors of p53 activityin MCC and demonstrate that p53-dependent cell death or cellcycle arrest can be activated by a small-molecule inhibitor ofHDM-2.
RESULTS AND DISCUSSIONp53 inactivating mutations in 2 of 14 MCC linesThe frequency of p53 inactivating mutations has been reportedto be relatively low in MCC, i.e., 10% (1 in 10 tumors),14%(3 in 21 tumors) or 27% (11 in 40 tumors) (Van Gele et al.,2000; Lassacher et al., 2008; Sihto et al., 2011). Thus, as a firststep of a comprehensive p53 pathway analysis in MCC, wedetermined the p53 status in 14 MCC lines by sequencingexons 5–8 in a series of 14 MCC lines. We found that similarto the published tissue analyses only two MCC cell lines (14%)had p53 mutations, whereas the remaining 12 cell linesdisplayed wild-type sequences in the p53 mutation hot spotregion (Table 1).
Table 1. MCV and p53 status of the MCC cell lines analyzed in this study
Response to Nutlin-3a
MCV þ
p53 status(exons 5–81)
p53mRNA
p53protein
p53-specificreporteractivity
p53protein
Reporteractivity
p53targets
Cyclearrest Apoptosis
1 BroLi Yes Wild type þ þ þ þ þ þ ÿ þ
2 WaGa Yes Wild type þ þ þ þ þ þ þ ÿ þ
3 Mkl-1 Yes Wild type þ þ þ þ þ þ þ ÿ þ
4 MKL-2 Yes Wild type þ þ ÿ ÿ ÿ ÿ ÿ ÿ ÿ
5 PeTa Yes Wild type þ þ þ þ þ þ þ ÿ þ
6 MS-1 Yes Hemizygousdeletion
aa 251–253
þ þ þ þ þ ? ND ND ND ND ND
7 AlDo Yes Wild type þ þ þ ND ND ND ND ND ND
8 WoWe Yes Wild type ND ND ND ND ND ND ND ND
9 HeRo Yes Wild type ND ND ND ND ND ND ND ND
10 KaRi Yes Wild type ND ND ND ND ND ND ND ND
11 LoKe Yes Wild type ND ND ND ND ND ND ND ND
12 MCC26
No Wild type þ ÿ ÿ ÿ ÿ ÿ ÿ ÿ
13 UISO No Wild type þ þ þ þ þ þ þ þ ÿ
14 MCC13 No P278S and S241Pboth heterozygous
þ þ þ þ þ ? ÿ ÿ ÿ ÿ ÿ
Abbreviations: MCC, Merkel cell carcinoma; MCV, Merkel cell polyoma virus; ND, not done; ?, data difficult to interpret.1Exons 5–8 harbor 95% of the known p53 mutations (Vousden and Lu, 2002).
R Houben et al.p53 in Merkel Cell Carcinoma
2454 Journal of Investigative Dermatology (2013), Volume 133
83

The MCV-negative cell line MCC13 carried two differentmutations in exon 7 and exon 8 (Table 1). As we cannotdistinguish whether these two mutations affect the same ordifferent alleles, it is unknown whether all the p53 moleculesexpressed in MCC13 are mutant or not. However, accordingto the IARC (International Agency for Research on Cancer)p53 mutation database, both loss-of-function and dominant-negative effects on wild-type p53 have been described for theP278S mutation in exon 8, suggesting that p53 is indeedinactivated in this cell line (Petitjean et al., 2007). For thep53 deletion mutant lacking amino acids 251–253, whichis present homo- or more likely hemizygously in theMCV-positive line MS-1, functional data are not available.Nevertheless, as several substitution mutants of thedeleted amino acids have been characterized as inactive,this deletion mutant is likely to be inactivating (Petitjeanet al., 2007).
p53 expression and activity in MCC cell linesNext we analyzed p53 mRNA and protein expression in nineMCC cell lines using real-time PCR and immunoblot. In thetwo p53 mutant cell lines (MCC13 and MS-1), the high mRNAexpression level correlated with high p53 protein expression(Figure 1a). Accumulation of mutant p53 in tumor cells is awell-known, although not yet fully understood, phenomenon(Soussi, 2007). Among the seven p53 wild-type cell lines,
however, p53 protein expression levels were diverging anddid not correlate with mRNA expression. In two cell lines(MCC26 and MKL-2), p53 protein was not detectable despitep53 mRNA expression (Figure 1a), suggesting very strictposttranscriptional repression of p53 expression. In theremaining five p53 wild-type cell lines, p53 protein wasexpressed at levels sufficient for detection by western blot.To estimate the transcriptional activity of p53 in the different
MCC lines, we stably transduced the cells with a reporter geneconstruct (pGreenFire) expressing green fluorescent protein(GFP) under the control of a p53 response element. Themean GFP expression was measured by flow cytometry andnormalized for the relative number of incorporated pGreen-Fire copies as determined by real-time PCR. Surprisingly, thenormalized GFP expression from the pGreenFire construct didnot correlate with p53 expression (Figure 1a). As it has beendemonstrated that p53 reporter assays may sometimes yieldunspecific responses (Wischhusen et al., 2004), short hairpinRNA (shRNA) knockdown of p53 was performed to determinewhether the observed GFP expression is p53 dependent. In thetwo p53 mutant cell lines (MS-1 and MCC13), GFP reporterexpression was increased, and in MCC13, p21 was inducedupon p53 knockdown (Figure 1b), suggesting that predomi-nantly an inhibitory activity of mutant p53 was eliminatedin these cells. In the two cell lines lacking detectable p53expression (MCC26 and MKL-2), GFP expression remained
MCV negative
10,000
1,000
100
10
1
0
p53
HDM-2
Tubulin
6,000
Re
po
rte
r g
en
e a
ssa
y5,000
4,000
3,000
Me
an
GF
P f
luo
resce
nce
1,000
0
MC
C2
6
UIS
O
Wa
Ga
Bro
Li
MK
L-1
MK
L-2
AID
o
MS
-1
MC
C1
3
2,000
MC
C1
3
MC
C2
6
UIS
O
Wa
Ga
Bro
Li
MK
L-1
MK
L-2
AID
o
Imm
un
ob
lot
Re
al-tim
e P
CR
MS
-1
Re
lative
mR
NA
exp
ressio
n
MCV positive
150%
100%
50%
0%
–50%
*
***
*
** *** * * *
Re
lative
ch
an
ge
s in
GF
P f
luo
resce
nce
–100%
p53
MC
C2
6
UIS
O
Wa
Ga
Bro
Li
MK
L-1
MK
L-2
Pe
Ta
MS
-1
MC
C1
3
p21
Bax
Tubulin
30,000
20,000
10,000
0
MCC
cell lines
Melanoma
cell lines
Sp
ecific
p5
3 r
ep
ort
er
activity (
follo
win
g p
53
kn
ockd
ow
n)
shRNA
scr
p5
3
scr
p5
3
scr
p5
3
scr
p5
3
scr
p5
3
scr
p5
3
scr
p5
3
scr
p5
3
scr
p5
3
Figure 1. p53 expression and transcriptional activity in Merkel cell carcinoma (MCC) cell lines. (a) Upper bar graph: real-time PCR analysis of p53 mRNA relative
to glyceraldehyde-3-phosphate dehydrogenase (GAPDH) depicted on a log scale. Immunoblot: p53 protein analysis. Lower bar graph: indicated MCC lines
(p53 mutant lines underlined) were stably transduced with a p53 reporter construct expressing green fluorescent protein (GFP; pGreenFire). Mean GFP
fluorescence was monitored by flow cytometry and normalized to the relative number of pGreenFire copies integrated into the cellular genome as determined by
real-time PCR. (b) The cells were infected with short hairpin RNA (shRNA) expression constructs containing either a scrambled (scr) or a sequence targeting p53.
Immunoblot: on day 4 after infection, total cell lysates were analyzed for the indicated proteins. Bar graph: mean GFP fluorescence of the scr control cells
minus that of p53 knockdown cells (p53-specific GFP expression). Mean values (±SD) derived from at least three independent experiments are shown (statistics:
one-sample t-test *Po0.05, **Po0.005, and ***Po0.0005). (c) Box-and-whiskers plot: p53-specific GFP expression of seven p53 wild-type MCC cell lines
compared with that of six p53 wild-type melanoma cell lines.
R Houben et al.p53 in Merkel Cell Carcinoma
www.jidonline.org 2455
84

almost unchanged on application of the p53 shRNA, implyingthat in these cases GFP expression from the pGreenFireconstruct is not driven by p53. In contrast, in the remainingfive p53 wild-type cell lines (UISO, WaGa, BroLi, MKL-1, andPeTa), GFP expression was at least partially p53 dependent.The p53-specific reporter gene activities in MCC lines, how-ever, were low compared with the reporter gene activitiesfound in p53 wild-type melanoma cell lines (Figure 1c).Nonetheless, p53 was observed to drive expression of itstarget gene p21 in all five p53 wild-type MCC lines, as p53knockdown led to decreased p21 levels (Figure 1b).Obviously, however, p21 expression levels and p53 activityare not sufficient to effectively restrict growth of theseproliferating tumor cells, evoking the question of what islimiting p53 activity in MCC.
MCC-derived MCV TAs do not repress p53 activity whenoverexpressed in cells with high endogenous p53 activityInhibition of p53 is a central feature of SV40 LT in transfor-mation (Bargonetti et al., 1992; Jiang et al., 1993; Pipas andLevine, 2001). Truncated MCV LTs expressed in MCC cells,however, generally lack the C-terminal half of the proteinand thereby the potential p53-binding domain (Shuda et al.,2008; Sastre-Garau et al., 2009). Nonetheless, the demon-stration of p53 inhibiting activity for the N-terminus of SV40LT (Quartin et al., 1994; Rushton et al., 1997) as well as forSV40 sT (Gjoerup et al., 2000), and the recently publishedobservation of p53 mutations only in LT-negative MCCs (Sihtoet al., 2011), argue for a role of the MCV TAs in repression ofp53 in MCC.To evaluate the capacity of the MCV TAs in inhibiting p53,
we utilized two p53 wild-type melanoma cell lines with highp53-specific pGreenFire reporter gene activity (UACC-62 andMel-U) as a model system. Importantly, GFP expression inthese cells can almost completely be abrogated by p53knockdown (data not shown). These cells were infected witha lentiviral expression vector encoding MCV TALT279* (sT andLT truncated at amino acid 279 resembling the stop codonposition of the MCC line WaGa). An SV40 TA (sT and LT)expression construct encoding full-length SV40 LT was usedfor control purposes. Expression of the different LT proteinswas confirmed by immunoblot (Figure 2a). The presence ofSV40 TA as well as of MCC-derived MCV TALT279* stimulatedcell cycle progression of the melanoma cell lines (data notshown). In SV40 TA–transduced cells, increased S-phase entrywas accompanied by reduced p53 reporter gene activity, asexpected. However, on expression of MCV TALT279*, the p53reporter gene activity was elevated in both cell lines(Figure 2b). SV40 TA strongly increased p53 levels, aspreviously reported (Rushton et al., 1997), whereas MCVTALT279* elevated p53 expression only moderately (Figure 2aand c). When p53 reporter gene activity is normalized to thep53 protein levels, it becomes clear that SV40 TA stronglysuppresses p53 reporter gene activity, whereas MCC-derivedMCV TA does not (Figure 2d). A major regulator of p53expression and activity is human double minute (HDM-2(Harris and Levine, 2005). Therefore, we analyzed whetherectopic TA expression would affect HDM-2 levels: HDM-2
was strongly increased upon SV40 TA but was unaffected byMCV TALT279* expression (Figure 2a).
p53 transcriptional activity in MCC cells is not altered onknockdown of MCV TAsTo confirm the lack of impact of MCV TAs on p53, weanalyzed p53 reporter gene activity following knockdown ofthe MCV TAs in five MCV-positive MCC lines. On applicationof an shRNA targeting LT and sT (Houben et al., 2010), p53reporter gene activity remained unchanged in three cell lines(WaGa, BroLi, and PeTa), whereas MKL-1 and MKL-2displayed a small but statistically insignificant increase inGFP expression (Figure 3). Expression of p53 and—moreimportantly—expression of the p53 target genes p21,HDM-2, and Bax, however, was not elevated upon TAknockdown (Figure 3), suggesting that MCV sT and thetruncated MCV LT do not repress p53 function in any of thefive investigated cell lines. These findings together with theinability of overexpressed MCV TALT279* to suppress p53activity (Figure 2) and the observation of a p53 mutation inthe MCV-positive cell line MS-1 (Table 1) argue against aninhibition of the p53 pathway in MCV-positive MCCs by theMCV TAs.
Mel-U
SV40 LT
75%
Mel-U
UACC-62
50%
25%
*
*
** **
******
**
**
*
0%
–25%
–50%
Changes in p
53 r
eport
er
activity
–75%
25%
0%
–25%
–50%
Changes in p
53 r
eport
ed a
ctivity
norm
aliz
ed to p
53 e
xpre
ssio
n
–75%
–100%
MCV TA LT279* SV40 TA
MCV LT
HDM-2
p53
Tubulin
1,500%
1,250%
1,000%
750%
500%
250%Incre
ase in p
53 e
xpre
ssio
n
0%
MCV TA LT279* SV40 TAMCV TA LT279* SV40 TA
UACC-62
Vecto
r
SV
40 T
A
MC
V T
A LT
27
9*
Vecto
r
SV
40 T
A
MC
V T
A LT
27
9*
Mel-U
UACC-62
Mel-U
UACC-62
Figure 2. Overexpression of Merkel cell carcinoma (MCC)–derived Merkel
cell polyoma virus (MCV) T antigens (TAs) does not repress p53. The indicated
melanoma cell lines with high p53-specific green fluorescent protein (GFP)
reporter gene expression were infected with the indicated lentiviral vectors
containing simian virus 40 (SV40) or MCV TA gene, respectively. MCV
TALT279* codes for MCV small T antigen (sT) and for MCV large T antigen (LT)
truncated at amino acid 279, whereas SV40 TA contains wild-type sequences.
(a) Immunoblot with cell lysates harvested 4 days after infection. (b) Changes in
the mean GFP fluorescence measured on day 4. Mean values (±SD) from eight
independent experiments are given. (c) Immunoblot signals for p53 relative
to tubulin were quantified using the ImageJ software and data from five
independent experiments. Mean values (±SD) are given. (d) Changes in p53
reporter expression normalized to p53 expression derived as described in c.
*Po0.05, **Po0.005, and ***Po0.0005; one-sample t-test.
R Houben et al.p53 in Merkel Cell Carcinoma
2456 Journal of Investigative Dermatology (2013), Volume 133
85

p53 is activated by Nutlin-3a in 5 out of 7 p53 wild-type MCCcell linesNext we asked whether it is possible to reactivate p53 in MCCcells. In this respect we tested two compounds. Cisplatin is aDNA crosslinking antineoplastic agent frequently used fortreatment of metastasized MCC that may activate p53 via theDNA damage response pathway (Tai et al., 2000; Pectasideset al., 2006; Pabla et al., 2008). Nutlin-3a specifically inhibitsthe E3 ubiquitin ligase HDM-2 (Secchiero et al., 2011) that isexpressed in all analyzed MCC cell lines with the exception ofMCC13 (Figure 1a). HDM-2 is the key player of severalnegative autoregulatory loops of p53 that, in the absence ofp53-stabilizing signals, keep p53 levels low (Harris andLevine, 2005). HDM-2 promotes proteasomal degradation ofthe p53 protein through polyubiquitination of the C-terminus(Kubbutat et al., 1997; Michael and Oren, 2003). Moreover,HDM-2 binding can affect p53 through direct repression of itstranscriptional activity (Oliner et al., 1993).The p53 mutant cell line MCC13 was not affected by
Nutlin3-a. In contrast, 5 out of 7 p53 wild-type cell lines
(UISO, WaGa, BroLi, MKL-1, and PeTa) responded toNutlin-3a treatment with increased GFP expression from thep53 reporter (Figure 4a), induction of p53 expression, andinduction of at least two of the three p53 target proteins p21,Bax, and HDM-2 (Figure 4b). This corresponded with induc-tion of cell cycle arrest in the MCV-negative cell line UISOand induction of apoptosis in the MCV-positive WaGa, BroLi,MKL-1, and PeTa, as indicated by an increased sub-G1population in cell cycle analysis after 40hours of Nutlin-3atreatment (Figure 4c, d and e). Induction of cell death by p53reactivation distinguishes these MCC cell lines from manyother p53 wild-type cancer cell lines that, although frequentlyresponding with cell cycle arrest, are impaired in theirapoptotic response to Nutlin-3a (Tovar et al., 2006; Tsenget al., 2010). The observed Nutlin-3a effects on MCC cellswere mediated by p53, as p53 knockdown reverted Nutlin-3a-induced p53 reporter gene activity (data not shown) andprevented cell cycle arrest or apoptosis (Figure 4f). Therefore,repressed p53 activity due to HDM-2 activity might constitutea major factor for growth and survival of these MCC cells.
Cisplatin did not provoke a clearcut p53 response.Induction of p53 reporter gene activity was for most cell linesmuch less pronounced compared with Nutlin-3a (Figure 4a),there was no induction of the p53 target genes p21 andHDM-2 (Figure 4b), and—although the sub-G1 fraction wasincreased in all MCC cell lines (Figure 4e)—only in case ofBroLi the induction of cell death was p53 dependent(Figure 4f). These results suggest that MCC cells have a generaldefect in activation of wild-type p53 by the DNA damageresponse pathway. This may be one of the reasons why thistumor entity frequently progresses without p53 mutations(Table 1 and see Van Gele et al., 2000; Lassacher et al.,2008) and it may contribute to the limited long-term efficacyof DNA-damaging agents and radiotherapy in advancedMCC (Voog et al., 1999; Tai et al., 2000; Poulsen et al.,2003, 2006; Becker, 2010).
Neither Cisplatin nor Nutlin-3a treatment led to detectablep53 expression in MCC26 and MKL-2 cells (Figure 4b).Therefore, the strict repression of p53 expression in thesetwo cell lines does not appear to be mediated by HDM-2. Asp53 mRNA is expressed in both cell lines (Figure 1a andTable 1) either inhibition of p53 translation (e.g., by RNPC1;Zhang et al., 2011) or HDM-2-independent degradation ofp53 are possible mechanisms for its repression. The latter mayplay a role for MCC26 as incubation with the proteasomeinhibitor bortezomib provoked a weak p53 band in immu-noblot analysis and a 3-fold increase in GFP expression fromthe p53 reporter construct (data not shown).
Induction of p53 protein upon HDM-2 knockdown in four of fiveNutlin-3a-sensitive MCC cell linesAlthough Nutlin-3a is regarded to be a highly selectivemolecule targeting the HDM-2/p53 interaction (Patton et al.,2006), inhibitor experiments always bear the risk to provokeunspecific effects not related to the targeted protein. Therefore,we aimed to complement the Nutlin-3a results by HDM-2knockdown experiments. Application of an HDM-2 shRNA inthe five cell lines responding with p53 activation to Nutlin-3a
70%
n=7
P=0.626
shRNA
Wa
Ga
scr
TA
scr
TA
scr
TA
scr
TA
scr
TA
Bro
Li
MK
L-1
MK
L-2
Pe
Ta
MCV LT
p53
Bax
p21
HDM-2
Tubulin
n=4
P=0.362
n=7
P=0.051
n=6
P=0.059n=3
P=0.736
50%
30%
–10%
–30%
Re
lative
ch
an
ge
s in
GF
P f
luo
resce
nce
10%
Figure 3. Knockdown of Merkel cell polyoma virus (MCV) T antigens (TAs)
does not increase p53 activity in MCV-positive Merkel cell carcinoma (MCC)
cells. The indicated MCC cell lines stably transduced with a p53 reporter
construct (pGreenFire) were infected with a lentiviral short hairpin RNA
(shRNA) vector targeting both T antigens (Houben et al., 2010). On day 4 after
infection, green fluorescent protein (GFP) total cell lysates were analyzed by
immunoblot for the expression of the indicated proteins. Reporter gene
expression was measured by flow cytometry. Mean values (±SD), number of
independent experiments, and P-values of a one-sample t-test are annotated for
all cell lines examined. HDM-2, human double minute 2; LT, large T antigen;
scr, scrambled.
R Houben et al.p53 in Merkel Cell Carcinoma
www.jidonline.org 2457
86

let to induction of p53 and the p53 target p21 in WaGa, PeTa,BroLi, and UISO (Figure 5), confirming that p53 in these celllines is controlled by HDM-2. Moreover, HDM-2 knockdownlike Nutlin-3a treatment provoked significant apoptosis inWaGa, BroLi, and PeTa cells (Figure 5). In contrast, inMKL-1 cells we could not induce any sign of p53 activationwith the HDM-2 shRNA. This, as well as the fact that in theother cell lines induction of p53 expression is not aspronounced as on Nutlin-3a treatment, is likely due to lessefficient and less synchronous repression of HDM-2 functionby the shRNA compared with Nutlin-3a.
ConclusionIn summary, we demonstrate that expression and activity ofp53—which is frequently wild type in MCC—is not repressedby the MCV TAs but can be restored by HDM-2 antagonism.
This p53 reactivation induces cell cycle arrest or apoptosis inthe majority of MCC cell lines. Therefore, p53 reactivation byinhibition of HDM-2 may be a possible future therapeuticapproach. Phase-I clinical trials using the Nutlin-3a-relatedcompound RG7112 for treatment of hematologic malignancies(nCT00623870) and solid tumors (nCT00559533) are currentlyongoing (http://www.clinicaltrials.gov/). A clinically approvedHDM-2 inhibitor will hopefully become available in the future.
MATERIALS AND METHODSEthics statementThis study was conducted according to the Declaration of
Helsinki Principles and approved by the institutional review
board of Wurzburg University Hospital (Ethikkommission der
Medizinischen Fakultat der Universitat Wurzburg; sequential study
number 124/05).
700
a
b
c f
d
e
20
15
10
5
Cells
in S
phase (
%)
0
100
80
60
40
20S
ub-G
1 c
ells
(%
)
0
8016
14
12
10
8
6
Cells
in S
phase (
%)
4
2
0
70
60
50
40
30
Sub-G
1 c
ells
(%
)
20
10
0shRNAscr p53
UISO
scr
UISO WaGa BroLi MKL-1 PeTa
p53 scr p53 scr p53 scr p53 scr p53
MCC13 MCC26 UISO WaGa BroLi MKL-1
DMSO
Nutlin-3a
Cisplatin
DMSO
Nutlin-3a
Cisplatin
DMSO
Nutlin-3a
Cisplatin
MKL-2 PeTa
MCC13 MCC26 UISO WaGa BroLi MKL-1 MKL-2 PeTa
Nutlin-3a
Cisplatin600
500
300
0
DM
SO
Nutlin
-3a
Cis
pla
tin
DM
SO
Nutlin
-3a
Cis
pla
tin
DM
SO
Nutlin
-3a
Cis
pla
tin
DM
SO
Nutlin
Cis
pla
tin
DM
SO
Nutlin
-3a
Cis
pla
tin
DM
SO
Nutlin
-3a
Cis
pla
tin
DM
SO
Nutlin
-3a
Cis
pla
tin
DM
SO
Nutlin
-3a
Cis
pla
tin
MCC13
p53
p21
Bax (20 kDa)
HDM-2
Tubulin
WaGa
DM
SO
Nutlin
-3a
Cis
pla
tin
UISO MCC26
MCC26 UISO
**** **
*
**
**
**
**
***
*** **
**
**
*
*
**
***
**
WaGa MKL-1 MKL-2 PeTaBroLi
200
100
Incre
ase in G
FP
expre
ssio
n (
%)
400
Bax? (40 kDa)
Figure 4. Induction of p53-dependent apoptosis or cell cycle arrest by Nutlin-3a. The indicated cells stably transduced with a green fluorescent protein (GFP) p53
reporter construct were treated with 10mM Nutlin-3a or 10mgmlÿ1 Cisplatin. After 24hours, cells were analyzed by flow cytometry for GFP expression and cell
lysates were subjected to immunoblot analysis. Cell cycle analysis was performed after 40hours of treatment. (a) Changes in GFP expression relative to
control cells are given (mean values (±SD) of at least five experiments). (b) Immunoblot analyzing of the indicated proteins. (c) Examples of histogram plots from
the cell cycle analysis. (d, e) Mean values (±SD) of at least five experiments for cells in S or sub-G1, respectively. (f) Results of the cell cycle analysis of
cells treated with Nutlin-3a or Cisplatin 4 days after infection with a lentiviral short hairpin RNA (shRNA) vector either targeting p53 or expressing a scrambled (scr)
control shRNA. *Po0.05, **Po0.005, and ***Po0.0005. (a) One-sample t-test. (d, e) Repeated measures analysis of variance (ANOVA).
R Houben et al.p53 in Merkel Cell Carcinoma
2458 Journal of Investigative Dermatology (2013), Volume 133
87

Cell cultureA series of cell lines from patients with histologically confirmed MCC
was established in our departments, including PeTa, AlDo, HeRo,
KaRi, and WoWe, as well as BroLi, WaGa, and LoKe. Procedures for
establishment of the three latter cell lines have been described
previously (Houben et al., 2010, 2012b). All cell lines mentioned
as well as MKL-1 (Shuda et al., 2008), MKL-2, and MS-1 (Houben
et al., 2010) harbor MCV DNA. In contrast, UISO (Ronan et al.,
1993), MCC13 (Leonard et al., 1995), and MCC 26 (Van Gele et al.,
2002) are MCV negative. MCC lines were grown in RPMI-1640
supplemented with 10% fetal calf serum, 100Umlÿ 1 penicillin, and
0.1mgmlÿ 1 streptomycin.
Sequence analysis of p53 exons 5–8Genomic DNA was extracted from the different MCC cell lines and
subjected to seminested PCR using the primers previously reported
(Houben et al., 2011). The amplicons were sequenced by Sanger
sequencing.
Lentiviral p53 reporter gene assay and shRNA transferTo establish cells with an integrated p53 reporter gene, the lentiviral
vector pGreenFire (System Biosciences, Mountain View, CA) was
used that codes for puromycin resistance and GFP under the control
of a p53-responsive element (4� 50-CGACATGCCCGGGCATGT-30).
Knockdown of p53 or MCV TA expression was achieved by lentiviral
shRNA expression constructs described previously (Houben et al.,
2010, 2011). For overexpression of TAs in melanoma cell lines
carrying a GFP p53 reporter, a wild-type SV40 TA gene (Lin and
Simmons, 1991) or an MCV TA gene carrying a stop codon mutation
at codon 279 (Houben et al., 2012a) were cloned into the vector
pCDHred. This was done to allow identification of the infected cells
within a GFP-expressing population. pCDHred was derived from the
vector pCDH-CMV-MCS-EF1-copGFP (System Biosciences) by
replacing the copGFP sequence with a turboRFP. Infectious viruses
were raised by transfecting HEK293T cells and target cells were
infected as previously described (Houben et al., 2012a). Pure
populations carrying the pGreenFire reporter were selected by
culturing the cells in the presence of puromycin. GFP expression
from the reporter was analyzed by flow cytometry. The relative
presence of the reporter constructs in the genomic DNA of the
selected cells was analyzed by real-time PCR and calculated relative
to the highly repetitive DNA elements LINE1 using the DDCt method.
ImmunoblotCells were lysed in RIPA buffer, protein concentration was deter-
mined and equal amounts of protein were resolved by SDS-PAGE.
Immunoblotting was performed as described previously (Houben
et al., 2012a). The following primary antibodies were applied: MCV
LT (CM2B4), p53 (D-01), p21 (C-19), HDM-2 (SMP14; all from Santa
Cruz Biotechnology, Santa Cruz, CA), Bax (2D2) (eBioscience,
San Diego, CA), SV40 LT (Abcam, Cambridge, MA), and tubulin
(Sigma-Aldrich, Taufkirchen, Germany).
Cell cycle analysisDNA was stained with propidium iodide as described previously
(Houben et al., 2007). Analysis of the cellular DNA content was
performed on a FACSCanto flow cytometer (Becton Dickinson,
Heidelberg, Germany).
CONFLICT OF INTERESTThe authors state no conflict of interest.
ACKNOWLEDGMENTSThis study was funded by the Wilhelm-Sander-Stiftung (2007.057.3). We thankJohanna Kobler, Claudia Siedel, and Daria Lisicki for excellent technicalassistance.
REFERENCES
Bargonetti J, Reynisdottir I, Friedman PN et al. (1992) Site-specific binding ofwild-type p53 to cellular DNA is inhibited by SV40 T antigen and mutantp53. Genes Dev 6:1886–98
Becker JC (2010) Merkel cell carcinoma. Ann Oncol 21(Suppl 7):vii81–5,vii81-vii85
Blagosklonny MV (1997) Loss of function and p53 protein stabilization.Oncogene 15:1889–93
Cheng J, DeCaprio JA, Fluck MM et al. (2009) Cellular transformation bySimian Virus 40 and Murine Polyoma Virus T antigens. Semin Cancer Biol19:218–28
Feng H, Shuda M, Chang Y et al. (2008) Clonal integration of a polyomavirusin human Merkel cell carcinoma. Science 319:1096–100
Gjoerup O, Chang Y (2010) Update on human polyomaviruses and cancer.Adv Cancer Res 106:1–51
Gjoerup O, Chao H, DeCaprio JA et al. (2000) pRB-dependent, J domain-independent function of simian virus 40 large T antigen in override of p53growth suppression. J Virol 74:864–74
Green DR, Chipuk JE (2006) p53 and metabolism: Inside the TIGAR. Cell126:30–2
30
*
*
**60
40
20
Incre
ase
in s
ub
-G1
ce
lls (%
)
0
20
10
0
UISO
Tubulin
HDM-2
p53
p21
WaGa BroLi MKL-1 PeTa
De
cre
ase
of
ce
lls in
S+
G2
/M (
%)
Figure 5. Induction of p53 and apoptosis by HDM-2 (human double
minute 2) knockdown in WaGa, BroLi, and PeTa cells. The indicated Merkel
cell carcinoma (MCC) cell lines were infected with a lentiviral short hairpin
RNA (shRNA) vector targeting HDM-2. After 4 days, total cell lysates were
harvested and subjected to immunoblot analysis. At the same time point,
cell cycle analysis was performed; in the graphs the increase of cells in
SþG2/M phase and sub-G1 cells are displayed for UISO or WaGa, BroLi,
MKL-1, and PeTa, respectively. Mean values (±SD) of at least three
independent experiments are given. *Po0.05 and **Po0.005; one-sample
t-test.
R Houben et al.p53 in Merkel Cell Carcinoma
www.jidonline.org 2459
88

Harris SL, Levine AJ (2005) The p53 pathway: positive and negative feedbackloops. Oncogene 24:2899–908
Hodgson NC (2005) Merkel cell carcinoma: changing incidence trends. J SurgOncol 89:1–4
Houben R, Adam C, Baeurle A et al. (2012a) An intact retinoblastoma protein-binding site in Merkel cell polyomavirus large T antigen is requiredfor promoting growth of Merkel cell carcinoma cells. Int J Cancer130:847–56
Houben R, Grimm J, Willmes C et al. (2012b) Merkel cell carcinoma andMerkel cell polyomavirus: evidence for hit-and-run oncogenesis. J InvestDermatol 132:254–6
Houben R, Hesbacher S, Schmid CP et al. (2011) High-level expression ofwild-type p53 in melanoma cells is frequently associated with inactivity inp53 reporter gene assays. PLoS One 6:e22096
Houben R, Ortmann S, Schrama D et al. (2007) Activation of the MAP kinasepathway induces apoptosis in the Merkel cell carcinoma cell line UISO.J Invest Dermatol 127:2116–22
Houben R, Shuda M, Weinkam R et al. (2010) Merkel cell polyomavirus-infected Merkel cell carcinoma cells require expression of viral Tantigens. J Virol 84:7064–72
Jiang D, Srinivasan A, Lozano G et al. (1993) SV40 T antigen abrogates p53-mediated transcriptional activity. Oncogene 8:2805–12
Kubbutat MH, Jones SN, Vousden KH (1997) Regulation of p53 stability byMdm2. Nature 387:299–303
Lassacher A, Heitzer E, Kerl H et al. (2008) p14ARF hypermethylation iscommon but INK4a-ARF locus or p53 mutations are rare in Merkel cellcarcinoma. J Invest Dermatol 128:1788–96
Lavin MF, Gueven N (2006) The complexity of p53 stabilization andactivation. Cell Death Differ 13:941–50
Lemos B, Nghiem P (2007) Merkel cell carcinoma: more deaths but still nopathway to blame. J Invest Dermatol 127:2100–3
Leonard JH, Dash P, Holland P et al. (1995) Characterisation of four Merkelcell carcinoma adherent cell lines. Int J Cancer 60:100–7
Levine AJ (2009) The common mechanisms of transformation by the smallDNA tumor viruses: The inactivation of tumor suppressor gene products:p53. Virology 384:285–93
Lin JY, Simmons DT (1991) The ability of large T antigen to complex with p53is necessary for the increased life span and partial transformation ofhuman cells by simian virus 40. J Virol 65:6447–53
Michael D, Oren M (2003) The p53-Mdm2 module and the ubiquitin system.Semin Cancer Biol 13:49–58
Oliner JD, Pietenpol JA, Thiagalingam S et al. (1993) Oncoprotein MDM2conceals the activation domain of tumour suppressor p53. Nature362:857–60
Pabla N, Huang S, Mi QS et al. (2008) ATR-Chk2 signaling in p53 activationand DNA damage response during cisplatin-induced apoptosis. J BiolChem 283:6572–83
Patton JT, Mayo LD, Singhi AD et al. (2006) Levels of HdmX expression dictatethe sensitivity of normal and transformed cells to Nutlin-3. Cancer Res66:3169–76
Pectasides D, Pectasides M, Psyrri A et al. (2006) Cisplatin-based chemother-apy for merkel cell carcinoma of the skin. Cancer Invest 24:780–5
Petitjean A, Mathe E, Kato S et al. (2007) Impact of mutant p53 functionalproperties on TP53 mutation patterns and tumor phenotype: lessons fromrecent developments in the IARC TP53 database. Hum Mutat 28:622–9
Pipas JM, Levine AJ (2001) Role of T antigen interactions with p53 intumorigenesis. Semin Cancer Biol 11:23–30
Poulsen M, Rischin D, Walpole E et al. (2003) High-risk Merkel cell carcinomaof the skin treated with synchronous carboplatin/etoposide and radiation:a Trans-Tasman Radiation Oncology Group Study–TROG 96:07. J ClinOncol 21:4371–6
Poulsen MG, Rischin D, Porter I et al. (2006) Does chemotherapy improvesurvival in high-risk stage I and II Merkel cell carcinoma of the skin? Int JRadiat Oncol Biol Phys 64:114–9
Quartin RS, Cole CN, Pipas JM et al. (1994) The amino-terminal functions ofthe simian virus 40 large T antigen are required to overcome wild-typep53-mediated growth arrest of cells. J Virol 68:1334–41
Rodig SJ, Cheng J, Wardzala J et al. (2012) Improved detection suggests allMerkel cell carcinomas harbor Merkel polyomavirus. J Clin Invest122:4645–53
Roemer K (1999) Mutant p53: gain-of-function oncoproteins and wild-type p53inactivators. Biol Chem 380:879–87
Ronan SG, Green AD, Shilkaitis A et al. (1993) Merkel cell carcinoma: in vitroand in vivo characteristics of a new cell line. J Am Acad Dermatol29:715–22
Rushton JJ, Jiang D, Srinivasan A et al. (1997) Simian virus 40 T antigen canregulate p53-mediated transcription independent of binding p53. J Virol71:5620–3
Sastre-Garau X, Peter M, Avril MF et al. (2009) Merkel cell carcinoma of theskin: pathological and molecular evidence for a causative role of MCV inoncogenesis. J Pathol 218:48–56
Secchiero P, Bosco R, Celeghini C et al. (2011) Recent advances in thetherapeutic perspectives of Nutlin-3. Curr Pharm Des 17:569–77
Sherr CJ (2006) Divorcing ARF and p53: an unsettled case. Nat Rev Cancer6:663–73
Shuda M, Feng H, Kwun HJ et al. (2008) T antigen mutations are a humantumor-specific signature for Merkel cell polyomavirus. Proc Natl Acad SciUSA 105:16272–7
Sihto H, Kukko H, Koljonen V et al. (2011) Merkel cell polyomavirus infection,large T antigen, retinoblastoma protein and outcome in Merkel cellcarcinoma. Clin Cancer Res 17:4806–13
Song H, Xu Y (2007) Gain of function of p53 cancer mutants in disruptingcritical DNA damage response pathways. Cell Cycle 6:1570–3
Soussi T (2007) p53 alterations in human cancer: more questions than answers.Oncogene 26:2145–56
Tai PT, Yu E, Winquist E et al. (2000) Chemotherapy in neuroendocrine/Merkelcell carcinoma of the skin: case series and review of 204 cases. J ClinOncol 18:2493–9
Tovar C, Rosinski J, Filipovic Z et al. (2006) Small-molecule MDM2 antagonistsreveal aberrant p53 signaling in cancer: implications for therapy. ProcNatl Acad Sci USA 103:1888–93
Tseng HY, Jiang CC, Croft A et al. (2010) Contrasting effects of nutlin-3on TRAIL- and docetaxel-induced apoptosis due to upregulation ofTRAIL-R2 and Mcl-1 in human melanoma cells. Mol Cancer Ther9:3363–74
Van Gele M, Kaghad M, Leonard JH et al. (2000) Mutation analysis of P73 andTP53 in Merkel cell carcinoma. Br J Cancer 82:823–6
Van Gele M, Leonard JH, Van RN et al. (2002) Combined karyotyping, CGHand M-FISH analysis allows detailed characterization of unidentifiedchromosomal rearrangements in Merkel cell carcinoma. Int J Cancer101:137–45
van Oijen MG, Slootweg PJ (2000) Gain-of-function mutations in the tumorsuppressor gene p53. Clin Cancer Res 6:2138–45
Voog E, Biron P, Martin JP et al. (1999) Chemotherapy for patientswith locally advanced or metastatic Merkel cell carcinoma. Cancer85:2589–95
Vousden KH, Lu X (2002) Live or let die: the cell’s response to p53. Nat RevCancer 2:594–604
Wischhusen J, Melino G, Weller M (2004) p53 and its family members –reporter genes may not see the difference. Cell Death Differ 11:1150–2
Zhang J, Cho SJ, Shu L et al. (2011) Translational repression of p53 by RNPC1,a p53 target overexpressed in lymphomas. Genes Dev 25:1528–43
R Houben et al.p53 in Merkel Cell Carcinoma
2460 Journal of Investigative Dermatology (2013), Volume 133
89

Oncotarget32956www.impactjournals.com/oncotarget
www.impactjournals.com/oncotarget/ Oncotarget, Vol. 7, No. 22
RB1 is the crucial target of the Merkel cell polyomavirus Large T antigen in Merkel cell carcinoma cells
Sonja Hesbacher1,* 1,2,*, Katharina Wiedorfer1, Sabrina Angermeyer1, Andreas Borst1, Sebastian Haferkamp3 4, Marion Wobser1, David Schrama1, Roland Houben1
1Department of Dermatology, Venereology und Allergology, University Hospital Würzburg, Würzburg, Germany
2 Department of Pharmacy, Center for Drug Research, University of Munich (Ludwigs-Maximilians-Universität), Munich, Germany
3Department of Dermatology, University of Regensburg, Regensburg, Germany
4Core Unit Systems Medicine, University of Würzburg, Würzburg, Germany
*These authors have contributed equally to this work
Correspondence to: Roland Houben, e-mail: [email protected]
Keywords: Merkel cell carcinoma, polyomavirus, Large T antigen, retinoblastoma protein, viral carcinogenesis
Received: November 09, 2015 Accepted: March 28, 2016 Published: April 18, 2016
ABSTRACT
The pocket protein (PP) family consists of the three members RB1, p107 and
p130 all possessing tumor suppressive properties. Indeed, the PPs jointly control
the G1/S transition mainly by inhibiting E2F transcription factors. Notably, several
viral oncoproteins are capable of binding and inhibiting PPs. Merkel cell polyomavirus
(MCPyV) is considered as etiological factor for Merkel cell carcinoma (MCC) with
expression of the viral Large T antigen (LT) harboring an intact PP binding domain
interaction of MCPyV-LT with the PPs. Co-IP experiments indicate that MCPyV-LT
binds potently only to RB1. Moreover, MCPyV-LT knockdown-induced growth arrest in
MCC cells can be rescued by knockdown of RB1, but not by p107 or p130 knockdown.
Accordingly, cell cycle arrest and E2F target gene repression mediated by the single
Moreover, data from an MCC patient indicate that loss of RB1 rendered the MCPyV-
positive MCC cells LT independent. Thus, our results suggest that RB1 is the dominant
tumor suppressor PP in MCC, and that inactivation of RB1 by MCPyV-LT is largely
INTRODUCTION
Several members of the polyomaviridae family (e.g.
Simian Virus 40 (SV-40)) are capable of inducing tumor
formation in animal models [1, 2], and the potential of
SV40 to transform their host cells has been ascribed to the
expression of viral oncoproteins, i.e. the T antigens (TA)
[3]. Up to date, however, the Merkel Cell Polyomavirus
(MCPyV) described in 2008 is the polyomavirus that is
widely accepted to be causal for a human malignancy,
namely Merkel Cell Carcinoma (MCC) [4, 5].
MCC is a highly aggressive skin cancer, and although
it is relatively rare its incidence is increasing considerably
[6]. Notably, in the vast majority of MCCs the MCPyV
genome can be detected [7-9], and the observed clonal
integration of the virus in the genome of the tumor cells
[5] implies the causal relationship between MCPyV and
MCC. This is further sustained by the addiction of MCPyV-
positive MCC cells to expression of the T antigens [10],
particularly due to a dependence on Large T antigen (LT) for
MCC cell growth [11]. Interestingly, MCC-associated LTs
are, due to stop codon mutations or pre-mature integration
break points, generally truncated deleting the C-terminus
required for viral replication but always preserving the
LxCxE motif found in many proteins which interact with
pocket proteins (PPs) [12, 13].
The PP family comprises three members, i.e. the
Retinoblastoma protein 1 (RB1) and the two RB-like
proteins p107 (RBL1) and p130 (RBL2). The family name
refers to their binding ‘pockets’ mediating interaction with
90

Oncotarget32957www.impactjournals.com/oncotarget
a multitude of other proteins [14]. All PPs bind to and
thus regulate the activity of transcription factors of the
E2F family. These interactions are regarded as central in
controlling cell cycle progression from G1 to S phase [15].
Regulation of G1/S transition by PPs and E2Fs is a complex
and at least partially redundant interplay of activator E2Fs
(E2F-1, E2F-2, E2F-3a) preferentially binding RB1 and
repressor E2Fs (E2F-3b, E2F-4, E2F-5) interacting with
one or more of the PPs [16]. In normal quiescent cells, the
PPs bound to E2Fs repress transcription of E2F-dependent
promoters by different mechanisms; e.g. by recruiting
histone deacetylases (HDACs) [17]. Upon phosphorylation
by cyclin/cyclin-dependent kinase (CDK) complexes in
late G1 PPs dissociate from their E2F partners, leading to
Besides phosphorylation by CDKs, the suppressive
function of the PPs can be halted by different viral
proteins, such as HPV-E7, Ad-E1A and SV40-LT [18].
The binding of these oncoproteins via the conserved
LxCxE motif results in disruption of repressive complexes
of PPs with E2F family members leading to enhanced
proliferation, and can thereby contribute to induction of
cell transformation [18, 19].
knockdown-induced growth inhibition in MCC cells
by ectopically expressed MCPyV-LT is dependent on
an intact LxCxE motif suggested that PP inactivation
is a critical function of MCPyV-LT in MCC [11]. Thus,
here we address the questions which PPs are essential to
be targeted by MCPyV-LT in MCC cells, and whether
function of this viral protein in its natural tumor host
cells. We provide evidence that inactivation of only RB1
supporting growth of MCC cells.
RESULTS
Homozygous deletion of the RB1 gene in an
MCPyV-positive cell line not depending on
MCPyV-LT expression
expression of the pocket proteins in MCPyV-positive
MCC cell lines. Real time quantitative PCR revealed that
all PPs are expressed in almost all cell lines with generally
higher mRNA levels for p107 and p130 than for RB1
(Figure 1a). The only exception was the cell line LoKe
for which no RB1 expression could be detected. Notably,
LoKe, although encoding a functional truncated MCPyV-
LT [20], is up to date the only MCPyV-positive MCC
cell line tested which is not dependent on LT expression
expression of all PPs in all other cell lines as well as the
lack of RB1 expression in LoKe (Figure 1b).
Since real time PCR with genomic DNA suggested
that lack of RB1 expression is due to a loss of the RB1
gene (data not shown), we performed a comparative
genomic hybridization for LoKe. This analysis revealed
several genomic aberrations, with the relevant one being
a very sharp homozygous deletion of the genomic region
13q14.2 (Figure 1c; basepairs 48.816.847 – 50.073.157
according to assembly GRCh37.p13) affecting only RB1
and 10 additional genes (CAB39L, CDADC1, CYSLTR2,
FNDC3A, ITM2B, LPAR6, MLNR, PHF11, RCBTB2,
SETDB2).
The cell line LoKe was generated from a patient
with metastatic MCC. Thus, to explore whether loss of
RB1 had occurred after integration of MCPyV during
tumor progression, we analyzed a metastasis excised at
the time when the cell line LoKe was established and the
primary tumor excised 3 years before. Real time PCR
revealed largely reduced presence of the RB1 gene in both
tumors suggesting that at least the majority of tumor cells
had lost both RB1 alleles. Immunohistochemistry on tissue
sections revealed that in the metastasis all tumor cells
were negative for RB1, in line with loss of both alleles
of the RB1 gene (Figure 1d). In contrast, in the primary
tumor RB1 expression was heterogeneous with most parts
lacking RB1 entirely (Figure 1d upper panel) while some
minor areas demonstrated RB1 expression in a subset
of tumor cells (Figure 1d middle panel). Sequencing of
MCPyV-LT in genomic DNA derived from the primary
tumor and several different metastases (including those
analysed by immunohistochemistry) revealed that they all
harboured the same unique stop codon present in the LoKe
cell line (GenBank: KJ128381.1) implying that they are all
clonally related.
MCPyV-LT knockdown can largely be rescued
by RB1 knockdown
The LoKe cell line is characterized by loss of RB1
and independence of LT expression. In addition, analysis
of the coding sequence of p107 and p130 demonstrated
that both proteins are not affected by mutations (data not
shown). These results suggest that inactivation of RB1
– but not the two other pocket proteins – is an essential
function of MCPyV-LT in MCC cells. Consequently, to
to substitute functionally for MCPyV-LT we performed
shRNA knockdown experiments targeting MCPyV-LT and
the different PP family members in MCC cells. To this end,
we used the MCPyV-positive cell lines MKL-1, WaGa,
BroLi and MKL-2 stably transduced with TA.shRNA.tet,
a vector allowing Doxycycline (Dox)-inducible expression
of an shRNA targeting all MCPyV-T antigen mRNAs [11].
because the only effective LT-targeting shRNA exerts
considerable off-target effects [11]. The TA.shRNA.tet
cells were then stably transduced with a second shRNA
91
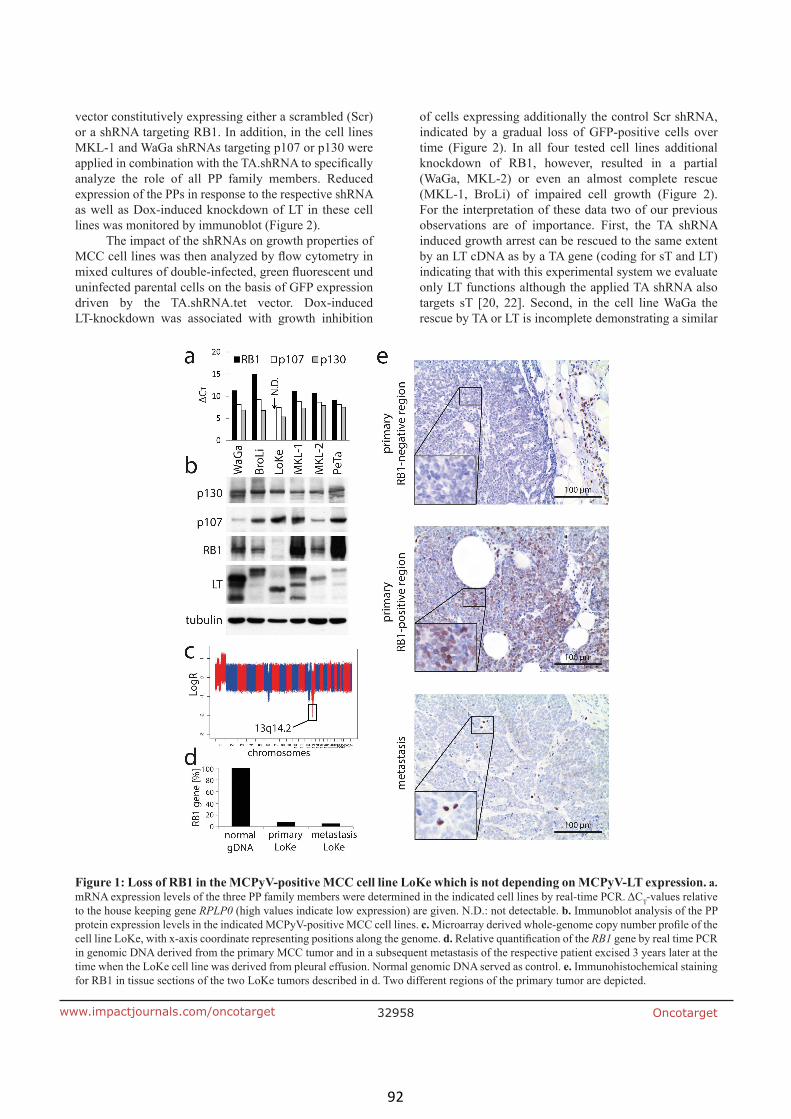
Oncotarget32958www.impactjournals.com/oncotarget
vector constitutively expressing either a scrambled (Scr)
or a shRNA targeting RB1. In addition, in the cell lines
MKL-1 and WaGa shRNAs targeting p107 or p130 were
analyze the role of all PP family members. Reduced
expression of the PPs in response to the respective shRNA
as well as Dox-induced knockdown of LT in these cell
lines was monitored by immunoblot (Figure 2).
The impact of the shRNAs on growth properties of
uninfected parental cells on the basis of GFP expression
driven by the TA.shRNA.tet vector. Dox-induced
LT-knockdown was associated with growth inhibition
of cells expressing additionally the control Scr shRNA,
indicated by a gradual loss of GFP-positive cells over
time (Figure 2). In all four tested cell lines additional
knockdown of RB1, however, resulted in a partial
(WaGa, MKL-2) or even an almost complete rescue
(MKL-1, BroLi) of impaired cell growth (Figure 2).
For the interpretation of these data two of our previous
observations are of importance. First, the TA shRNA
induced growth arrest can be rescued to the same extent
by an LT cDNA as by a TA gene (coding for sT and LT)
indicating that with this experimental system we evaluate
only LT functions although the applied TA shRNA also
targets sT [20, 22]. Second, in the cell line WaGa the
rescue by TA or LT is incomplete demonstrating a similar
Figure 1: Loss of RB1 in the MCPyV-positive MCC cell line LoKe which is not depending on MCPyV-LT expression. a.
T-values relative
to the house keeping gene RPLP0 (high values indicate low expression) are given. N.D.: not detectable. b. Immunoblot analysis of the PP
protein expression levels in the indicated MCPyV-positive MCC cell lines. c.
cell line LoKe, with x-axis coordinate representing positions along the genome. d. RB1 gene by real time PCR
in genomic DNA derived from the primary MCC tumor and in a subsequent metastasis of the respective patient excised 3 years later at the
time when the LoKe cell line was derived from pleural effusion. Normal genomic DNA served as control. e. Immunohistochemical staining
for RB1 in tissue sections of the two LoKe tumors described in d. Two different regions of the primary tumor are depicted.
92

Oncotarget32959www.impactjournals.com/oncotarget
rescue activity as achieved by RB1 knockdown (Figure
2; [20, 22]). Hence, it is likely that the TA shRNA exerts
growth inhibiting off-target effects in WaGa. Interestingly,
RB1 and p130 are induced upon TA shRNA induction
(Figure 2) potentially contributing to the incomplete
substitute for MCPyV-LT in the cell lines WaGa, MKL-1
and BroLi and at least partially capable to rescue the loss
of LT in MKL-2 cells. In contrast, knockdown of p107 or
p130 did not affect the growth inhibition induced by LT
knockdown in WaGa and MKL-1 cells (Figure 2).
the possibility that paracrine effects distort proliferation
measurements in the mixed culture assay [23], cell cycle
analyses were performed in MKL-1 and WaGa cells
following TA and RB1 knockdown. In accordance with
the results of the mixed culture assay, TA shRNA-induced
be reversed by additional knockdown of RB1 (Figure 3a
and 3b). Moreover, quantitative RT-PCR experiments
revealed that TA shRNA-induced cell cycle arrest was
associated with reduced expression of cell cycle related
Figure 2: MCPyV-LT knockdown induced growth inhibition can be rescued by RB1 knockdown. MCPyV positive cell
lines MKL-1, WaGa, BroLi and MKL-2 transduced with a Dox-inducible TA.shRNA.tet vector system were infected with lentiviral shRNA
constructs targeting RB1 (all cell lines), p107 or p130 (MKL-1 and WaGa). A Scr shRNA served as control. Pure populations infected with
the PP shRNA constructs were established by antibiotic selection. Following 5 days of Dox treatment total cell lysates were harvested and
analyzed by immunoblot for expression of MCPyV-LT and the different PPs. To evaluate changes in cellular growth, mixed populations of
93

Oncotarget32960www.impactjournals.com/oncotarget
RB1 target genes CCNB1, MYB, PLK1 and CDC6 while
upon additional knockdown of RB1 expression levels
were hardly affected (Figure 3c).
Strict overlap of genes regulated by MCPyV-LT
and RB1 in MCC cells
To further scrutinize the extent RB1 inactivation
can compensate for TA knockdown with respect to gene
expression in MCC cells, we performed NanoString
nCounter™ gene expression analyses [24]. To this end, the
controls) was determined for mRNA derived from WaGa
cells upon TA.shRNA expression. These cells were
additionally stably transduced with either a construct
coding for an shRNA-insensitive TA gene [11], with the
RB1 shRNA or with the respective control vectors (cDNA
vector; Scr shRNA). 90 genes demonstrating very low
expression (less than 25 copies) were excluded from
the analysis of differential expression upon TA.shRNA
expression since for very rare mRNAs variability due to
technical issues can be expected to be rather high [24].
From the remaining 155 cancer genes 21 gene demonstrated
a more than 2-fold alteration in expression upon induced
TA knock down, either downregulation (13 genes) or
upregulation (8 genes), respectively (Figure 4). For all these
21 genes the TA.shRNA-induced changes were reversed
by either TA re-expression or shRNA-mediated RB1
inactivation (Figure 4). Most of the genes downregulated
following TA knockdown (e.g. BIRC5 (survivin), BLM,
CDC25a, BRCA 1 and 2, MYBL2, CCNA2, RAD54L,
HHMR, TYMS) have previously been described as E2F
Figure 3: RB1 knockdown reverses TA knockdown-induced cell cycle arrest and E2F target gene repression. WaGa
and MKL-1 cells double infected with inducible TA-shRNA and constitutive Scr- or RB1-shRNA expression constructs were cultured for
5 days in the absence or presence of Dox. a and b. Fixed cells were stained with propidium iodide and DNA content was determined by
c. Relative expression levels of the indicated cell cycle-related RB target genes were
T method. RPLP0 served as endogenous control for normalization and Scr shRNA-infected cells
performed using paired student’s t-test. (**p<0.005; *p<0.05).
94

Oncotarget32961www.impactjournals.com/oncotarget
and/or RB1 target genes [25-28], a notion sustained by
the observed re-expression upon RB1 knockdown (Figure
4). Others however, and in particular some of the genes
upregulated upon TA.shRNA application (e.g. PLAUR,
FGFR3, TIMP3) do not belong to the well established
RB1 target genes. Nevertheless, re-expression upon RB1
knockdown suggests that these genes are at least indirectly
regulated by RB1 in WaGa. Importantly, the observation
that expression of every gene differentially expressed upon
TA knockdown could be reversed by RB1 knockdown
further supports that RB1 inactivation is the predominant
function of truncated MCPyV-LT in MCC cells.
MCPyV-LT preferentially interacts with RB1
rescue MCPyV-TA knockdown induced growth inhibition
of MCPyV-positive MCC cells is surprising for two
reasons. First, redundant functions of the PPs have been
shown in many aspects, (e.g. unrestricted growth of
pocket proteins [29]) and second, the related SV40-LT
has been demonstrated to be capable of binding and
inhibiting all three pocket proteins [30, 31]. Since the
binding capacity of MCPyV-LT to RB1 is established [12,
32], we wondered whether MCPyV-LT can also bind to
p107 and p130. Hence, transient co-expression of His-
tagged versions of the three pocket proteins and V5-tagged
SV40-LT or MCPyV-LT278 in 293T cells was followed by
immunoprecipitations with an anti-His-tag antibody. As
expected, SV40-LT co-immunoprecipitated with all three
pocket proteins. In contrast, MCPyV-LT278 demonstrated a
selective binding to RB1 (Figure 5a).
MCPyV-LT fails to inhibit functionality of p107
and p130
A lack of co-immunoprecipitation cannot formally
proof the absence of interaction between two proteins.
We thus analyzed next whether MCPyV-LT is able
to functionally interfere with the PPs. To address this
question in a model system that allows unequivocal
distinction of the different PPs, we utilized mouse
Figure 4: Overlap of genes regulated by MCPyV-TA and RB1 in MCC cells. TA-shRNA was expressed in WaGa cells stably
transduced with either empty vector, vector coding for MCPyV-TA, a Scr-shRNA vector or an RB1-shRNA construct. After 5 days LT
and RB1 protein levels were analyzed by immunoblot, and mRNA expression levels of 245 cancer related genes were analyzed using
the NanoString nCounter™ gene expression system [24]. 90 genes were excluded from further analysis due to very low expression. The
absolute expression values of the remaining 155 genes were normalized to the mean value of the 6 house keeping genes. Depicted are the
relative mRNA expression levels, i.e. TA-shRNA expressing cells relative to their controls, of the 21 genes displaying a more than two fold
change in the empty vector and the Scr-shRNA cells.
95
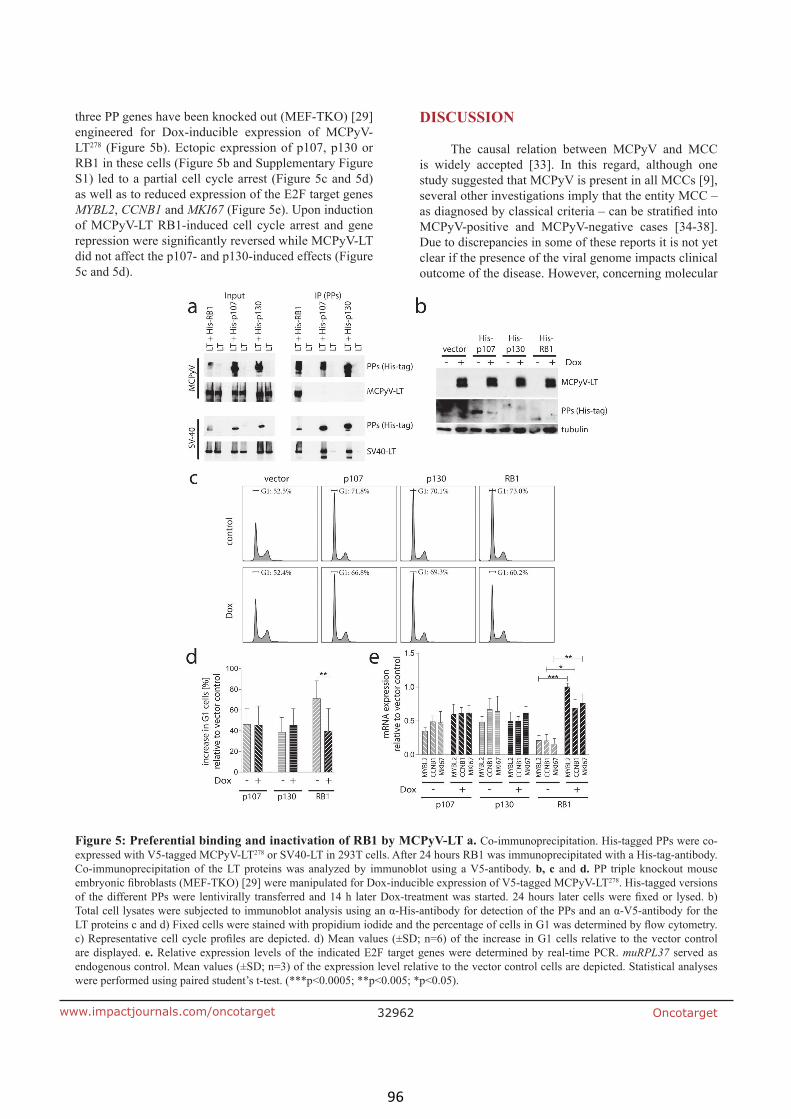
Oncotarget32962www.impactjournals.com/oncotarget
three PP genes have been knocked out (MEF-TKO) [29]
engineered for Dox-inducible expression of MCPyV-
LT278 (Figure 5b). Ectopic expression of p107, p130 or
RB1 in these cells (Figure 5b and Supplementary Figure
S1) led to a partial cell cycle arrest (Figure 5c and 5d)
as well as to reduced expression of the E2F target genes
MYBL2, CCNB1 and MKI67 (Figure 5e). Upon induction
of MCPyV-LT RB1-induced cell cycle arrest and gene
did not affect the p107- and p130-induced effects (Figure
5c and 5d).
DISCUSSION
The causal relation between MCPyV and MCC
is widely accepted [33]. In this regard, although one
study suggested that MCPyV is present in all MCCs [9],
several other investigations imply that the entity MCC –
MCPyV-positive and MCPyV-negative cases [34-38].
Due to discrepancies in some of these reports it is not yet
clear if the presence of the viral genome impacts clinical
outcome of the disease. However, concerning molecular
Figure 5: Preferential binding and inactivation of RB1 by MCPyV-LT a. Co-immunoprecipitation. His-tagged PPs were co-
expressed with V5-tagged MCPyV-LT278 or SV40-LT in 293T cells. After 24 hours RB1 was immunoprecipitated with a His-tag-antibody.
Co-immunoprecipitation of the LT proteins was analyzed by immunoblot using a V5-antibody. b, c and d. PP triple knockout mouse 278. His-tagged versions
are displayed. e. Relative expression levels of the indicated E2F target genes were determined by real-time PCR. muRPL37 served as
were performed using paired student’s t-test. (***p<0.0005; **p<0.005; *p<0.05).
96

Oncotarget32963www.impactjournals.com/oncotarget
differences, several recent sequencing studies consistently
reported that MCPyV-negative MCCs in contrast to
MCPyV-positive cases are characterized by frequent
deletions/mutations of the RB1 gene [39-41]. Thus,
RB1 inactivation seems to be an essential step in MCC
development with inactivation occurring either genetically
or in MCPyV-positive tumors by expression of a truncated
LT with a generally preserved RB binding site [12, 13]. In
the related SV40-LT this binding site contributes to LT’s
capability to inactivate all three pocket protein members,
i.e. RB1, p130 and p107 [42].
MCPyV-LT, however, seems to discriminate
between the different PPs. This is supported by our co-
IP experiments in 293T cells as well as our functional
data derived from co-expression of PPs and MCPyV-
LT in triple PP knockout cells. We observed preferential
binding of MCPyV-LT to RB1 compared to the two other
PP family members, and demonstrated also a differential
capability to interfere functionally with the different PPs.
Indeed, co-expression of truncated MCPyV-LT can reverse
cell cycle arrest and E2F target gene expression induced
by RB1, but not the effects induced by p107 or p130 in
MEF-TKO cells. This restricted interaction capacity with
PPs distinguishes MCPyV-LT from LTs encoded by other
polyomaviruses. Indeed, SV40-LT has the potential to
abrogate RB1- as well as p130- and p107-induced gene
repression and cell cycle arrest in RB1-/- Saos cells [43].
Moreover, also LT proteins from the human JC and BK
polyomaviruses have been demonstrated to bind to all
three PPs [44, 45]. Interestingly JC-LT exhibits the highest
[45].
The observed preferential binding of RB1 by
MCPyV-LT further expands the list of described
differences such as that i) LT from MCPyV does not
contrast to e.g. SV40 (Shuda et al., 2011) and ii) MCPyV-
LT lacks a CKII consensus sequence at an important
phosphorylation site which is present in SV40 and all
human polyomaviruses harbouring an RB1 binding site
(Schrama et al., 2015). Differences between LT from
assignment to different phylogenetic clades with MCPyV
grouping with polyomaviruses found in chimpanzee,
gorilla and bats [46].
In contrast to the many cellular interaction partners
described for the well-studied SV40-LT [42], the number
RB1, HSC-70, Brd4 and Vam6p, is limited [12, 47-49].
in the natural tumor host cells MCPyV inactivation of
RB1 appears to be the predominant and in some MCC cell
lines the only essential function of MCPyV-LT to support
growth of these cells. Indeed, knockdown of RB1 led in
the tested MCPyV-positive MCC cell lines to a rescue
of LT-knockdown-induced E2F target gene repression
and more importantly, to a reversion of LT-knockdown-
induced cell growth inhibition. The importance of the
RB1-LT interaction is further sustained by a recent report:
revealing that the overwhelming majority of MCPyV-LT
induced gene expression alterations require the intact
LxCxE binding motif [50].
restricted but important interaction of MCPyV-LT with
is up to now the only studied MCPyV-positive MCC cell
line not depending on expression of the viral LT protein
despite the presence of an MCC-typical LT mutation
preserving the RB binding motif. This suggests that LT
and the RB-binding domain were required at some point
during carcinogenesis [21]. The observed homozygous
loss of the RB1 gene in LoKe cells seems to render them
independent of MCPyV-LT expression. The expression
of wild type p107 and p130 in LoKe thus implies that
inactivation of RB1 – but not the two other PPs – is an
essential function of MCPyV-LT in MCC cells. Assuming
equivalent molecular mechanisms in all MCCs, this is in
line with the fact that inactivation of p107 and p130 in
MCPyV-negative MCCs has not been reported [39, 40,
51]. Indeed, neither homozygous deletion/mutation of
p107 and p130 nor mutation/copy number variations of
upstream factors like p16INK4A, CDK4 or Cyclin D – which
are common features of many tumor types [52] – have
been described.
Regarding the molecular history of the MCPyV-LT-
independent MCPyV-positive cell line LoKe co-presence
of RB1 and MCPyV-LT in a portion of the neoplastic
cells of the respective primary MCC tumor suggests that
integration of MCPyV into the genome of the tumor cells
preceded homozygous loss of RB1.
Although being essential for growth of established
RB1 expressing MCC cells the role of MCPyV-LT in
In contrast to SV40-LT, MCPyV-LT is not transforming
been demonstrated only for MCPyV-sT so far, and could
not be enhanced by MCPyV-LT [53]. In accordance,
MCPyV-TA cannot induce a fully malignant phenotype
in mouse models [54]. Fibroblast transformation in
vitro, as well as induction of hyperproliferative lesions
in mouse models by MCPyV-sT has been demonstrated
to be dependent on a region called the LT stabilization
domain, which is mediating the inhibition of different E3
ligases. Inactivation of protein phosphatase A the major
function of SV40-sT seems not to be relevant [53, 55, 56].
Therefore, our observation that MCPyV-LT in contrast
to SV40-LT - besides not binding p53 directly [32, 57] -
discriminates between the different pocket proteins adds
only one more piece to the puzzle of distinct features of
these two oncogenic polyomaviruses.
These differences between SV40-LT and MCPyV-
LT certainly contribute to their transforming capacity. In
97

Oncotarget32964www.impactjournals.com/oncotarget
this regard, in some cellular systems inactivation of all
three PPs is required to allow unrestricted growth [29].
Accordingly, many tumors require a broad disruption of
the PP/E2F pathway by e.g. activation of cyclin-dependent
kinases or inactivation of cyclin dependent kinase
inhibitors [14]. MCC, however, seems to belong to a group
of tumors, like small cell lung cancer and retinoblastoma
tumor formation [52, 58]. The limited ability of MCPyV-
LT to interfere with p107 and p130 may, therefore, account
for a limited subset of cell types being transformable by
MCPyV. Besides other factors (e.g. virus tropism) this
may contribute to the fact that only the rare MCC and
some subsets of chronic lymphocytic leukemia [59, 60]
have been reported to be associated with this omnipresent
virus. Finally, our data suggest that inactivation of RB1 is
the only crucial function of MCPyV-LT to support growth
of MCC cells.
MATERIALS AND METHODS
Ethics statement
This study was conducted according to the principles
of the Declaration of Helsinki and analysis of patient
derived samples was approved by the Institutional Review
Board of Würzburg University Hospital (Ethikkommission
der Medizinischen Fakultät der Universität Würzburg;
sequential study number 124/05).
Cell culture
The cell lines analyzed in this study include the
MCPyV-positive MCC cell lines LoKe [21], PeTa [61],
WaGa, BroLi, MKL-2 (all described in [10]) and MKL-1
[62] as well as the triple PP knock out mouse embryonic
for lentivirus production and for co-immunoprecipitation
assays. All cell lines were grown in RPMI 1640
supplemented with 10% FCS, 100 U/ml penicillin and
0.1 mg/ml streptomycin. MEF-TKO cell were directly
obtained from the lab were the cells were generated and
characterized [29] and were not passaged for more than
6 months. All MCC cell lines as well as the HEK-293T
the MCC cell lines are routinely checked by sequencing
for the presence of the characteristic Large T truncating
mutations, which lead to a distinct molecular weight of the
protein detectable by immune blotting (Figure 1).
Vectors
For inducible knockdown of MCPyV-LT, we
used the lentiviral single vector TA.shRNA.tet allowing
constitutive GFP expression and Doxycycline (Dox)-
inducible expression of an shRNA targeting all transcripts
derived from the MCPyV early region [11]. For constitutive
knockdown shRNA sequences targeting RB1, p107 or p130
(see Supplementary Table S1) were cloned into the lentiviral
vector pGreenPuro. For Dox-inducible LT expression we
used the two vector system Lenti-X Tet-On-3G (Clontech)
with the cloning vector pLVX-Tre3G-IRES allowing
inducible expression of two cDNAs from an internal
ribosomal entry site (IRES)-containing transcript. Truncated
MCPyV-LT278 was cloned into the cloning site preceding the
IRES and GFP was inserted downstream of the IRES.
Lentiviral infection
Lentiviral supernatants were produced in HEK293T
cells using three (pRSV rev, pHCMV-G and pMDLg/
pRRE) helper plasmids. Harvested virus supernatant
cells were washed twice with medium and subjected to
antibiotic selection.
Mixed cell culture assay
Constitutive GFP expression from the TA.shRNA.
tet construct was used to compare the growth behavior of
double-infected and uninfected cells: TA.shRNA.tet cells
were mixed with approximately 20% of untransduced
cells, and changes in the frequency of GFP-positive
time.
Cell cycle analysis
Real time PCR
Total RNA was isolated with peqGOLD Total RNA
Kit (PeqLab) and reverse transcribed using the Superscript
II RT First Strand Kit (Invitrogen). Real time PCR was
conducted in the ABI 7500 Fast Real-Time PCR cycler
(Applied Biosystems) using a SYBR Green I Low Rox
Mastermix (Eurogentec GmbH) and the respective primers
(Supplementary Table S2). Following a 10 min denaturing
are given in Supplementary Table S2.
Comparative genomic hybridization
DNA from MCC cell lines was hybridized to
Affymetrix SNP 6.0 arrays, and data analysis was carried
out with the Bioconductor package “copynumber”.
Microarray data has been deposited at Gene Expression
Omnibus (GSE73879).
98

Oncotarget32965www.impactjournals.com/oncotarget
Immunohistochemistry
previously described [11] with an antibody targeting RB1
(G3-245; BD Pharmingen).
NanoString nCounter™ gene expression analysis
100 ng total RNA were subjected to hybridization
with the Nanostring Cref Kit (Cancer-Kit) containing
probes for 245 cancer related gene products and the
mRNAs of 6 house keeping genes. Following nCounter
digital reading the values were normalized to the mean
value of the house keeping genes.
Immunoblotting
Immunoblotting was performed as previously
described [11] The primary antibodies used in this study
were directed against RB1 (G3-245; BD Pharmingen),
p107 (sc-318; Santa Cruz), p130 (sc-317; Santa Cruz)
MCPyV-LT (CM2B4; Santa Cruz), the V5 tag (SV5-Pk1;
(TUB 2.1; Sigma-Aldrich).
Co-immunoprecipitation
293T cells were co-transfected with expression
constructs coding for 6xHis tagged PPs and V5-
tagged MCPyV-LT278 or V5-tagged SV40-LT. 24 hours
after transfection cell lysates were harvested and Co-
Immunoprecipitation was performed as recently described
[63].
Statistics
Student t test was performed with GraphPad Prism
5.03 software.
ACKNOWLEDGMENTS
We are grateful to Julien Sage for providing the
MEF-TKO cells.
CONFLICTS OF INTEREST
GRANT SUPPORT
The study was supported by the German Research
Foundation (HO5280/2-1). CJS was supported by the
Interdisziplinäres Zentrum für Klinische Forschung
Würzburg (IZKF Z-6).
REFERENCES
1. Stewart SE, Eddy BE and Borgese N. Neoplasms in
mice inoculated with a tumor agent carried in tissue
culture. Journal of the National Cancer Institute. 1958;
20:1223-1243.
2. Eddy BE, Stewart SE, Young R and Mider GB. Neoplasms
in hamsters induced by mouse tumor agent passed in tissue
culture. Journal of the National Cancer Institute. 1958;
20:747-761.
3. Black PH, Rowe WP, Turner HC and Huebner RJ. A
Tumor and Transformed Cells. Proceedings of the National
Academy of Sciences of the United States of America.
1963; 50:1148-1156.
4. Chang Y and Moore PS. Merkel cell carcinoma: a virus-
induced human cancer. Annual review of pathology. 2012;
7:123-144.
5. Feng H, Shuda M, Chang Y and Moore PS. Clonal
integration of a polyomavirus in human Merkel cell
carcinoma. Science. 2008; 319:1096-1100.
6. Fitzgerald TL, Dennis S, Kachare SD, Vohra NA, Wong
JH and Zervos EE. Dramatic Increase in the Incidence and
Mortality from Merkel Cell Carcinoma in the United States.
The American surgeon. 2015; 81:802-806.
7.
E, Werner M and Zur HA. Frequent detection of Merkel
cell polyomavirus in human Merkel cell carcinomas and
Res. 2008; 68:5009-5013.
8. Becker JC, Houben R, Ugurel S, Trefzer U, Pfohler C
and Schrama D. MC polyomavirus is frequently present
in Merkel cell carcinoma of European patients. J Invest
Dermatol. 2009; 129:248-250.
9. Rodig SJ, Cheng J, Wardzala J, Dorosario A, Scanlon JJ,
Laga AC, Martinez-Fernandez A, Barletta JA, Bellizzi
AM, Sadasivam S, Holloway DT, Cooper DJ, Kupper TS,
Wang LC and DeCaprio JA. Improved detection suggests
all Merkel cell carcinomas harbor Merkel polyomavirus.
JClinInvest. 2012; 122:4645-4653.
10. Houben R, Shuda M, Weinkam R, Schrama D, Feng
H, Chang Y, Moore PS and Becker JC. Merkel cell
polyomavirus-infected Merkel cell carcinoma cells
require expression of viral T antigens. J Virol. 2010;
84:7064-7072.
11. Houben R, Adam C, Baeurle A, Hesbacher S, Grimm J,
Angermeyer S, Henzel K, Hauser S, Elling R, Brocker
EB, Gaubatz S, Becker JC and Schrama D. An intact
retinoblastoma protein-binding site in Merkel cell
polyomavirus large T antigen is required for promoting
growth of Merkel cell carcinoma cells. IntJ Cancer. 2012;
130:847-856.
99

Oncotarget32966www.impactjournals.com/oncotarget
12. Shuda M, Feng H, Kwun HJ, Rosen ST, Gjoerup O,
Moore PS and Chang Y. T antigen mutations are a human
ProcNatlAcadSciUSA. 2008; 105:16272-16277.
13. Schmitt M, Wieland U, Kreuter A and Pawlita M.
C-terminal deletions of Merkel cell polyomavirus large
induced malignancy. IntJCancer. 2012; 131:2863-2868.
14. Giacinti C and Giordano A. RB and cell cycle progression.
Oncogene. 2006; 25:5220-5227.
15. Cobrinik D. Pocket proteins and cell cycle control.
Oncogene. 2005; 24:2796-2809.
16. Chen HZ, Tsai SY and Leone G. Emerging roles of E2Fs
in cancer: an exit from cell cycle control. Nat RevCancer.
2009; 9:785-797.
17. Harbour JW and Dean DC. Chromatin remodeling and Rb
activity. Current opinion in cell biology. 2000; 12:685-689.
18. Felsani A, Mileo AM and Paggi MG. Retinoblastoma
family proteins as key targets of the small DNA virus
oncoproteins. Oncogene. 2006; 25:5277-5285.
19. An P, Saenz Robles MT and Pipas JM. Large T antigens
of polyomaviruses: amazing molecular machines. Annual
review of microbiology. 2012; 66:213-236.
20. Houben R, Angermeyer S, Haferkamp S, Aue A, Goebeler
M, Schrama D and Hesbacher S. Characterization of
functional domains in the Merkel cell polyoma virus Large
T antigen. IntJCancer. 2015; 136:E290-E300.
21. Houben R, Grimm J, Willmes C, Weinkam R, Becker JC
and Schrama D. Merkel cell carcinoma and Merkel cell
polyomavirus: evidence for hit-and-run oncogenesis. J
Invest Dermatol. 2012; 132:254-256.
22. Angermeyer S, Hesbacher S, Becker JC, Schrama D and
Houben R. Merkel cell polyomavirus-positive Merkel cell
carcinoma cells do not require expression of the viral small
T antigen. JInvest Dermatol. 2013; 133:2059-2064.
23. Shuda M, Chang Y and Moore PS. Merkel Cell
Polyomavirus Positive Merkel Cell Carcinoma Requires
Viral Small T Antigen For Cell Proliferation. JInvest
Dermatol. 2013:10.
24. Geiss GK, Bumgarner RE, Birditt B, Dahl T, Dowidar
N, Dunaway DL, Fell HP, Ferree S, George RD, Grogan
T, James JJ, Maysuria M, Mitton JD, Oliveri P, Osborn
JL, Peng T, et al. Direct multiplexed measurement of
gene expression with color-coded probe pairs. Nature
biotechnology. 2008; 26:317-325.
25. Sharma A, Yeow WS, Ertel A, Coleman I, Clegg N, Davis
PL, Miron A, Andersen LM, Iglehart JD and Marks JR.
The retinoblastoma tumor suppressor controls androgen
signaling and human prostate cancer progression Isolation
and initial characterization of the BRCA2 promoter.
Oncogene. 1999; 18:6000-6012.
26. Sharma A, Yeow WS, Ertel A, Coleman I, Clegg N,
Thangavel C, Morrissey C, Zhang X, Comstock CE,
Witkiewicz AK, Gomella L, Knudsen ES, Nelson PS and
Knudsen KE. The retinoblastoma tumor suppressor controls
androgen signaling and human prostate cancer progression.
JClinInvest. 2010; 120:4478-4492.
27. Eckerle I, Muth D, Batzler J, Henrich KO, Lutz W, Fischer
M, Witt O, Schwab M and Westermann F. Regulation of
BIRC5 and its isoform BIRC5-2B in neuroblastoma. Cancer
Letters. 2009; 28:99-107.
28. Karstensen B, Poppelreuther S, Bonin M, Walter M, Iftner
upregulation of E2F and downregulation of interferon
targets by HPV18 but no changes between keratinocytes
with integrated or episomal viral genomes. Virology. 2006;
353:200-209.
29. Sage J, Mulligan GJ, Attardi LD, Miller A, Chen S,
Williams B, Theodorou E and Jacks T. Targeted disruption
of the three Rb-related genes leads to loss of G(1) control
and immortalization. Genes Dev. 2000; 14:3037-3050.
30. Stubdal H, Zalvide J, Campbell KS, Schweitzer C, Roberts
TM and DeCaprio JA. Inactivation of pRB-related proteins
p130 and p107 mediated by the J domain of simian virus 40
large T antigen. MolCell Biol. 1997; 17:4979-4990.
31. Zalvide J and DeCaprio JA. Role of pRb-related proteins in
simian virus 40 large-T-antigen-mediated transformation.
MolCell Biol. 1995; 15:5800-5810.
32. Borchert S, Czech-Sioli M, Neumann F, Schmidt C,
Wimmer P, Dobner T, Grundhoff A and Fischer N.
Localization, and Transformation by Wild-Type or Tumor-
Derived Shortened Merkel Cell Polyomavirus Large T
Antigens. JVirol. 2014; 88:3144-3160.
33. Samimi M, Gardair C, Nicol JT, Arnold F, Touze A and
Coursaget P. Merkel cell polyomavirus in merkel cell
carcinoma: clinical and therapeutic perspectives. Seminars
in oncology. 2015; 42:347-358.
34. Bhatia K, Goedert JJ, Modali R, Preiss L and Ayers LW.
a subset of Merkel cell carcinoma tumors with higher viral
abundance and better clinical outcome. IntJ Cancer. 2010;
127:1493-1496.
35. Schrama D, Peitsch WK, Zapatka M, Kneitz H, Houben R,
Eib S, Haferkamp S, Moore PS, Shuda M, Thompson JF,
Trefzer U, Pfohler C, Scolyer RA and Becker JC. Merkel
cell polyomavirus status is not associated with clinical
course of Merkel cell carcinoma. J Invest Dermatol. 2011;
131:1631-1638.
36. Sihto H, Kukko H, Koljonen V, Sankila R, Bohling T
and Joensuu H. Clinical factors associated with Merkel
cell polyomavirus infection in Merkel cell carcinoma. J
NatlCancer Inst. 2009; 101:938-945.
37. Sastre-Garau X, Peter M, Avril MF, Laude H, Couturier J,
Rozenberg F, Almeida A, Boitier F, Carlotti A, Couturaud
B and Dupin N. Merkel cell carcinoma of the skin:
pathological and molecular evidence for a causative role of
MCV in oncogenesis. J Pathol. 2009; 218:48-56.
100

Oncotarget32967www.impactjournals.com/oncotarget
38. Handschel J, Muller D, Depprich RA, Ommerborn MA,
Kubler NR, Naujoks C, Reifenberger J, Schafer KL
and Braunstein S. The new polyomavirus (MCPyV)
does not affect the clinical course in MCCs. IntJ Oral
MaxillofacSurg. 2010; 39:1086-1090.
39. Harms PW, Vats P, Verhaegen ME, Robinson DR, Wu
YM, Dhanasekaran SM, Palanisamy N, Siddiqui J, Cao
X, Su F, Wang R, Xiao H, Kunju LP, Mehra R, Tomlins
SA, Fullen DR, et al. The Distinctive Mutational Spectra
of Polyomavirus-Negative Merkel Cell Carcinoma. Cancer
Res. 2015; 75:3720-3727.
40. Cimino PJ, Robirds DH, Tripp SR, Pfeifer JD, Abel HJ and
Duncavage EJ. Retinoblastoma gene mutations detected by
whole exome sequencing of Merkel cell carcinoma. Modern
pathology. 2014; 27:1073-1087.
41. Sahi H, Savola S, Sihto H, Koljonen V, Bohling T
and Knuutila S. RB1 gene in Merkel cell carcinoma:
hypermethylation in all tumors and concurrent heterozygous
deletions in the polyomavirus-negative subgroup. APMIS.
2014; 122:1157-1166.
42. Ahuja D, Saenz-Robles MT and Pipas JM. SV40 large T
antigen targets multiple cellular pathways to elicit cellular
transformation. Oncogene. 2005; 24:7729-7745.
43. Zalvide J, Stubdal H and DeCaprio JA. The J domain of
simian virus 40 large T antigen is required to functionally
inactivate RB family proteins. Mol Cell Biol. 1998;
18:1408-1415.
44. Harris KF, Christensen JB and Imperiale MJ. BK virus
large T antigen: interactions with the retinoblastoma family
of tumor suppressor proteins and effects on cellular growth
control. J Virol. 1996; 70:2378-2386.
45.
JC virus T and T' proteins differentially interact with
the retinoblastoma family of tumor suppressor proteins.
Virology. 2000; 274:165-178.
46. Carter JJ, Daugherty MD, Qi X, Bheda-Malge A, Wipf
GC, Robinson K, Roman A, Malik HS and Galloway
cell polyomavirus provides evolutionary insight into
the birth of viral genes. ProcNatlAcadSciUSA. 2013;
110:12744-12749.
47.
A, Moore PS and Chang Y. The minimum replication
origin of merkel cell polyomavirus has a unique large
T-antigen loading architecture and requires small
T-antigen expression for optimal replication. JVirol.
2009; 83:12118-12128.
48. Liu X, Hein J, Richardson SC, Basse PH, Toptan T,
Moore PS, Gjoerup OV and Chang Y. Merkel cell
polyomavirus large T antigen disrupts lysosome clustering
by translocating human Vam6p from the cytoplasm to the
nucleus. J Biol Chem. 2011; 286:17079-17090.
49. Wang X, Li J, Schowalter RM, Jiao J, Buck CB and You
J. Bromodomain protein Brd4 plays a key role in Merkel
cell polyomavirus DNA replication. PLoS Pathog. 2012;
8:e1003021.
50.
PS and Chang Y. Merkel Cell Polyomavirus T Antigens
Gene Expression. The Journal of general virology. 2015.
51. Sihto H, Kukko H, Koljonen V, Sankila R, Bohling T and
Joensuu H. Merkel cell polyomavirus infection, large T
antigen, retinoblastoma protein and outcome in Merkel cell
carcinoma. ClinCancer Res. 2011; 17:4806-4813.
52. Wikenheiser-Brokamp KA. Retinoblastoma family
proteins: insights gained through genetic manipulation of
mice. Cell Mol Life Sci. 2006; 63:767-780.
53. Shuda M, Kwun HJ, Feng H, Chang Y and Moore PS.
Human Merkel cell polyomavirus small T antigen is an
oncoprotein targeting the 4E-BP1 translation regulator. J
ClinInvest. 2011; 121:3623-3634.
54. Spurgeon ME, Cheng J, Bronson RT, Lambert PF
and DeCaprio JA. Tumorigenic activity of merkel cell
epithelium of mice. Cancer Res. 2015; 75:1068-1079.
55. Kwun H-J, Shuda M, Feng H, Camacho C-J, Moore P-S
and Chang Y. Merkel Cell Polyomavirus Small T Antigen
Controls Viral Replication and Oncoprotein Expression by
Targeting the Cellular Ubiquitin Ligase SCFFbw7. Cell
Host & Microbe. 2013; 14:125-135.
56. Verhaegen ME, Mangelberger D, Harms PW, Vozheiko
TD, Weick JW, Wilbert DM, Saunders TL, Ermilov AN,
Bichakjian CK, Johnson TM, Imperiale MJ and Dlugosz
AA. Merkel cell polyomavirus small T antigen is oncogenic
in transgenic mice. J Invest Dermatol. 2015; 135:1415-1424.
57. Cheng J, Rozenblatt-Rosen O, Paulson KG, Nghiem P and
DeCaprio JA. Merkel cell polyomavirus large T antigen has
growth-promoting and inhibitory activities. JVirol. 2013;
87:6118-6126.
58. Xu XL, Singh HP, Wang L, Qi DL, Poulos BK, Abramson
DH, Jhanwar SC and Cobrinik D. Rb suppresses human
cone-precursor-derived retinoblastoma tumours. Nature.
2014; 514:385-388.
59. Pantulu ND, Pallasch CP, Kurz AK, Kassem A, Frenzel
L, Sodenkamp S, Kvasnicka HM, Wendtner CM and
Zur Hausen A. Detection of a novel truncating Merkel
cell polyomavirus large T antigen deletion in chronic
lymphocytic leukemia cells. Blood. 2010; 116:5280-5284.
60. Cimino PJ, Jr., Bahler DW and Duncavage EJ. Detection of
Merkel cell polyomavirus in chronic lymphocytic leukemia
T-cells. Experimental and molecular pathology. 2013;
94:40-44.
61. Houben R, Dreher C, Angermeyer S, Borst A, Utikal J,
Haferkamp S, Peitsch WK, Schrama D and Hesbacher S.
Mechanisms of p53 restriction in Merkel cell carcinoma
101

Oncotarget32968www.impactjournals.com/oncotarget
cells are independent of the Merkel cell polyoma virus T
antigens. J Invest Dermatol. 2013:10.
62. Rosen ST, Gould VE, Salwen HR, Herst CV, Le Beau
MM, Lee I, Bauer K, Marder RJ, Andersen R and Kies MS.
Establishment and characterization of a neuroendocrine skin
carcinoma cell line. Lab Invest. 1987; 56:302-312.
63. Schrama D, Hesbacher S, Angermeyer S, Schlosser A,
Haferkamp S, Aue A, Adam C, Weber A, Schmidt M and
Houben R. Serine 220 phosphorylation of the Merkel cell
polyomavirus large T antigen crucially supports growth of
Merkel cell carcinoma cells. International journal of cancer.
2016; 138:1153-1162.
102
Original Article
BIK is involved in BRAF/MEK inhibitor induced apoptosis in melanoma
cell lines
Andreas Borst a, Sebastian Haferkamp b, Johannes Grimm c, Manuel R€osch a,Guannan Zhu d, Sen Guo d, Chunying Li d, Tianwen Gao d, Svenja Meierjohann c,David Schrama a, Roland Houben a, *
a Department of Dermatology, Venereology and Allergology, University Hospital Wuerzburg, Wuerzburg, Germanyb Department of Dermatology, University Hospital Regensburg, Regensburg, Germanyc Department of Physiological Chemistry I, Biocenter, Wuerzburg, Germanyd Department of Dermatology, Xijing Hospital, Fourth Military Medical University, Xi'an, China
a r t i c l e i n f o
Article history:
Received 14 December 2016
Received in revised form
4 July 2017
Accepted 7 July 2017
Keywords:
Melanoma
Vemurafenib
Trametinib
BIK/NBK
Apoptosis
a b s t r a c t
In patients with BRAF-mutated melanoma specific inhibitors of BRAFV600E and MEK1/2 frequently induce
initial tumor reduction, frequently followed by relapse. As demonstrated previously, BRAFV600E-inhibi-
tion induces apoptosis only in a fraction of treated cells, while the remaining arrest and survive providing
a source or a niche for relapse. To identify factors contributing to the differential initial response towards
BRAF/MEK inhibition, we established M14 melanoma cell line-derived single cell clones responding to
treatment with BRAF inhibitor vemurafenib and MEK inhibitor trametinib predominantly with either cell
cycle arrest (CCA-cells) or apoptosis (A-cells). Screening for differentially expressed apoptosis-related
genes revealed loss of BCL2-Interacting Killer (BIK) mRNA in CCA-cells. Importantly, ectopic expression
of BIK in CCA-cells resulted in increased apoptosis rates following vemurafenib/trametinib treatment,
while knockdown/knockout of BIK in A-cells attenuated the apoptotic response. Furthermore, we
demonstrate reversible epigenetic silencing of BIK mRNA expression in CCA-cells. Importantly, HDAC
inhibitor treatment associated with re-expression of BIK augmented sensitivity of CCA-cells towards
vemurafenib/trametinib treatment both in vitro and in vivo. In conclusion, our results suggest that BIK
can be a critical mediator of melanoma cell fate determination in response to MAPK pathway inhibition.
© 2017 Elsevier B.V. All rights reserved.
Introduction
Somatic mutations in the BRAF gene rendering the protein
constitutively active occur in approximately 50% of cutaneous
malignant melanoma [1]. In this regard, targeting mutant BRAF and
the downstream kinase MEK has become one pillar of today's
standard of care for patients with advanced BRAFV600 mutated
melanoma [2]. However, although most patients initially respond
with rapid and significant tumor regression, not all tumor cells are
eliminated and residual tumors frequently relapse [3]. In accor-
dance, preclinical models demonstrated that BRAF inhibition in-
duces cell death in only a subset of tumor cells while others persist
in a growth-arrested state [4,5]. These surviving tumor cells pro-
vide a potential threat for the organism, as they can cause tumor
relapse either by acquiring resistance [6,7] or by contributing to a
pro-tumorigenic milieu through therapy-induced alterations of the
secretome [8]. Therefore, incomplete melanoma cell death in
response to inhibition of BRAF/MEK signaling is a key factor
limiting therapeutic success.
Persistent tumor cell survival is frequently associated with
aberrant apoptosis signaling [9]. In this respect, two major
apoptosis mediating pathways have been described: the extrinsic
death receptor and the intrinsic mitochondria mediated pathway
regulated by members of the B-cell lymphoma (BCL)2 protein
family [10]. The BCL2 family can be subdivided into three groups: i)
the pro-apoptotic “activator or sensitizer” BCL2 homology domain
3-only (BH3-only) proteins (BIM, BIK, BAD, BID, HRK, BMF, NOXA
and PUMA), which interact with and inhibit the ii) anti-apoptotic
family members (BCL2, BCL-xL, BCL-w, BFL-1 and MCL-1) that in
* Corresponding author. Department of Dermatology, Venereology und
Allergology, University Hospital Wuerzburg, Josef-Schneider-Str. 2, 97080
Wuerzburg, Germany.
E-mail address: [email protected] (R. Houben).
Contents lists available at ScienceDirect
Cancer Letters
journal homepage: www.elsevier .com/locate/canlet
http://dx.doi.org/10.1016/j.canlet.2017.07.005
0304-3835/© 2017 Elsevier B.V. All rights reserved.
Cancer Letters 404 (2017) 70e78
103

turn functionally repress the iii) pro-apoptotic effectors BAK and
BAX. The latter initiate apoptosis by mediating cytochrome C
release from the mitochondria [10,11].
For BRAFV600 mutant melanomas it has been proposed that the
intrinsic apoptosis pathway is suppressed by active BRAF signaling,
which inhibits the expression of the BH3-only protein BCL2 inter-
acting mediator of cell death (BIM) [12]. Consequently, inhibition of
BRAFV600 mutant signaling induces upregulation of BIM and
thereby melanoma cell apoptosis [13,14].
The current study addresses the question which factor de-
termines pro-apoptotic cell fate in the melanoma cells upon
BRAFV600 inhibition. To this end, we analyzed single cell clones
responding to BRAF or combined BRAF/MEK inhibition either pre-
dominantly with apoptosis (A-cells/clones) or with cell cycle arrest
(CCA-cells/clones). We identify BCL2 Interacting Killer (BIK) as
differentially expressed in apoptotic versus arresting responders,
and provide evidence that epigenetic silencing of the BIK gene can
contribute to failed cell death induction upon inhibition of BRAF
signaling in BRAFV600 mutant melanoma. Indeed, HDAC inhibition
triggers re-expression of BIK and sensitizes CCA-cells to BRAF/MEK
inhibition in vitro and in vivo.
Material & methods
Cell culture
All cell lines [4,15] used in this study were derived from ATCC and routinely
tested for mycoplasma. Cells were cultivated in RPMI 1640 supplemented with 10%
FCS, 100 U/ml penicillin and 0.1 mg/ml streptomycin. For colony formation analysis
the cells were washed with PBS and fixed using ice-cold methanol for 10 min on ice,
washed again and stained for 10 min with Gram's crystal violet solution (Merck).
Cell cycle analysis
Cells were fixed for 24 h using ice-cold ethanol, treated with a propidium iodide
solution (PBSþ 1% FCSþ 0.1 mg/ml propidium iodideþ 0.1 mg/ml RNAse A) at 37 "C
for 1 h and immediately analyzed by flow cytometry.
MTS assay
The CellTiter 96®Aqueous One Solution Cell Proliferation Assay Kit (Promega)
was used according to manufacturer's instructions.
Real time PCR
Total RNA was isolated using the peqGOLD Total RNA Kit (PeqLab) and reverse
transcribedwith the Superscript II RT First Strand Kit (Invitrogen). Real time PCRwas
performed in the ABI 7500 Fast Real-Time PCR cycler (Applied Biosystems) by using
a SybrGreen I Low Rox Mastermix (Eurogentec GmbH) and the respective primers
for BIK (fw: 5-TCT TGA TGG AGA CCC TCC TGT-3 and rv: 5- CAA GAA CCT CCA TGG
TCG GG-3) and GAPDH (fw: 5-GCC CAA TAC GAC CAA ATC C-3 and rv: 5-AGC CAC ATC
GCT CAG ACA C-3). Relative expression was calculated using the DD-CT method. The
RT2 Profiler PCR-Array (PAHS-012Z, Qiagen) was used according to manufacturer's
instructions.
Immunoblotting
Analysis of protein expression by immunoblots was performed as previously
described [16], and the primary antibodies used in this study are listed in
supplementary table 1.
Ectopic BIK expression
A BIK cDNA amplified from pTRE-Nbk [17] was cloned into the lentiviral pcDH
Vector (SBI) coding also for GFP. Lentiviral infection was carried out as described
previously [16], and stably transduced cell lines were selected by fluorescence
activated cell sorting (FACS).
BIK knockdown/knockout
BIK (s1989) and control siRNA were purchased from Ambion®/Life Technolo-
gies™ and transfected at 50 nM using TurboFect™ Transfection Reagent (Thermo
Fisher). Plasmids sc-401751 (coding for Cas9 and the BIK guide RNA) and sc-401751-
HDR (allowing homology directed repair mediated introduction of a red fluores-
cence protein (RFP) and a puromycin resistance into the BIK gene), were purchased
from Santa Cruz and double transfected with UltraCruz™ Transfection reagent (sc-
395739) according to manufacturer's instructions. Following puromycin selection,
FACS was used additionally to select for RFPhigh cells.
Mixed cell culture assay
GFP or RFP expression in pCDH or sc-401751-HDR-infected cells was used to
determine changes in the ratio of infected and parental uninfected cells inmixed cell
cultures by flow cytometry.
Chromatin-immunoprecipitation (ChIP)
Acetylation of the BIK promoter was analyzed by ChIP followed by real time PCR.
To this end, we used the SimpleChIP Plus Enzymatic Chromatin IP Kit (Cell Signaling)
according to the manufacturer's instructions. The antibodies applied for IP were
targeting Histone H3 (clone D2B12; Rabbit mAb; Cell Signaling) and Histone H3
acetylated on Lysine 9 (H3K9Ac) (clone 1B10; mouse mAB; ActiveMotif). The primer
sets used to quantify the co-precipitated BIK promoter are given in supplementary
figure S5.
Xenotransplantation
For tumor induction, 5 # 106 M14 cells (clone #1 and #4) suspended in PBS
supplemented with 50% BD Matrigel™ Basement Membrane Matrix (BD Bio-
sciences, Heidelberg, Germany) were injected s.c. into each lateral flank of 6 weeks
old Balb/C Nu mice (one clone on the left, one on the right). The size of the tumor
was measured every three days. When the tumors reached a volume of around
100 mm3 (day 30 after cell injection), the mice were randomly divided into two
groups (n¼ 5): Vem/Tra group (mice injected intraperitoneally with Vem/Tra daily),
Vem/Tra/FK228 group (mice injected intraperitoneally with Vem/Tra/FK228 daily).
For further analysis subcutaneously grown tumors were surgically removed. Animal
experiments were performed in compliancewith FourthMilitary Medical University
animal protection guidelines and were approved by local government authorities.
Results
Single cell melanoma sub-lines with differential response to MAPK
pathway targeting
This study was based on the concept that molecular differences
determining the cell death or cell cycle arrest response of
BRAFV600 E/Kmelanoma cells uponMAPK pathway inhibition can be
identified by analyzing differentially responding single cell clones
from a heterogeneously responding cell line. For this approach we
chose M14 as a BRAFV600E mutated melanoma cell line because cell
cycle analysis of 11 different melanoma cell lines revealed both, a
G1 arrest as well as a substantial increase in sub-G1 for M14 cells
after 4 days treatment with the BRAFV600E inhibitor vemurafenib
(Vem) or the MEK inhibitor trametinib (Tra) (supplementary
Fig. S1). Following establishment of M14 single cell sub-lines, two
clones were identified (#2 and #4, marked by red boxes in the
figures) which responded with cell cycle arrest (Fig. 1A) rather than
cell death upon treatment with Vem or combined treatment with
Vem/Tra (Fig. 1B and C). The reduced inhibitor induced cell death of
clones #2 and #4 was further confirmed by lactate dehydrogenase
release assay (supplementary Fig. S2A). In comparison to these
arresting clones, we included in further analyses two single cell
clones (#1 and #3) with relatively high sub-G1 fractions after four
days of Vem or Vem/Tra treatment (Fig. 1AeC). These early differ-
ences between arresting and apoptotic clones were not transient
but translated into increased long term survival of clones #2 and #4
evident in MTS assays performed after 8 weeks of Vem treatment
(Fig. 1D). Moreover, while the surviving cells of the arresting clones
#2 and #4 bore the potential to form colonies after Vem removal,
the surviving cells of the apoptotic clones lacked colony formation
capability (supplementary Fig. S2D).
Drug resistance of melanoma cells can be associated with a slow
cycling phenotype [18,19]. Comparison of the proliferation rates of
the four single cell clones and the parental M14 cells did, however,
not reveal any significant differences (supplementary Fig. S2B). To
evaluate whether lack of cell death following MAPK pathway in-
hibition of the arresting clones is due to a general apoptotic defect,
we determined death rates after puromycin treatment. The
observed similar sensitivity of all clones (supplementary Fig. S2C)
A. Borst et al. / Cancer Letters 404 (2017) 70e78 71
104

indicates that the differential apoptotic response of the M14 sub-
lines upon MAPK pathway inhibition is specific.
Low BIK mRNA expression in M14 sub-lines arresting upon MAPK
pathway inhibition
To identify molecules involved in the hampered cell death
response of the arresting clones, we analyzed gene expression us-
ing a qPCR array covering 84 apoptosis related genes. While most of
the analyzed genes and in particular most BCL2 family members
were equally expressed, BIK/NBK RNA levels in the CCA-clones #2
and #4 were clearly lower than in the A-clones #1 and #3 (Fig. 2A).
This observation was confirmed by quantitative real-time PCR
(Fig. 2B).
The discrepancy of BIK expression translated also to the protein
level: Immunoblot analysis revealed the presence of BIK protein in
the A-clones #1 and #3 and the parental M14 cells, and almost no
expression in the CCA-clones #2 and #4. Surprisingly, however,
long film exposure was necessary to detect BIK expression sug-
gesting low protein levels (Fig. 2C). This may be due to BIK being
downregulated through proteasomal degradation [20,21]. Indeed,
BIK levels were highly elevated in apoptotic clones and the parental
M14 cells by a 24 h treatment with the proteasome inhibitor bor-
tezomib, indicating a fast BIK turnover in these cell lines (Fig. 2D).
In contrast, BIK expression could not be induced by bortezomib in
the CCA-clones #2 and #4, further demonstrating BIK protein
deficiency in these cells (Fig. 2D). Furthermore, immunoblot anal-
ysis revealed that reduced pERK levels upon BRAF/MEK inhibition
were associated with decrease of procaspase 9 levels and subse-
quent cleavage of effector caspase 3 only in the A-clones #1 and #3
and the parental M14 (Fig. 2B). Largely treatment-independent
expression of the anti-apoptotic BIK targets BCL2 and BCL-X(L)
[22] and of the executor Bcl-2 family pro-apoptotic proteins Bax
and Bak was observed in all clones. In contrast, BIMEL and PUMAa/b
which have been demonstrated to be essential for apoptosis upon
MAPK pathway inhibition in melanoma [12,23,24], demonstrated
increased protein expression upon Vem/Tra treatment (Fig. 2C).
However, given the comparable induction of BIMEL and PUMAa/b in
all clones, this mere induction is not sufficient to induce apoptosis
in CCA-clones #2 and #4.
MAPK pathway inhibition selects for BIKlow cells in different
BRAFV600 E/K melanoma cell lines
To explore whether BIK expression contributing to the decision
between arrest and death uponMAPK pathway inhibition is limited
to M14 cells or generally observable in BRAF mutant melanoma cell
lines, we extended our analyses to nine BRAFV600E and one
BRAFV600K (FM88) melanoma cell lines. BIK mRNA expression was
detectable in all ten analyzed melanoma cell lines. BIK protein
Fig. 1. M14 derived single-cell clones preferentially responding with either apoptosis or cell cycle arrest to MAPK-pathway inhibition. A: After four days of treatment with
vemurafenib (5 mM) or trametinib (10 nM) parental M14 cells or selected single-cell clones were subjected to cell cycle analysis. B: Exemplary cell cycle profiles of at least 3 in-
dependent experiments after 72 h of combined Vem/Tra treatment. C: The cells were treated for the indicated time with the Vem/Tra combination and DNA content was determined
by flow cytometry. D: Following eight weeks of Vem-treatment, the relative number of the surviving cells was analyzed in MTS assays after one week of standard cultivation
(normalized to Clone #3; 96-wells with 20.000 cells at start). A, C and D: (n % 3, mean ± SD, Students t-test, unpaired, A and C compared to parental M14, two-tailed, *p < 0.05;
**p < 0.01; ***p < 0.001).
A. Borst et al. / Cancer Letters 404 (2017) 70e7872
105
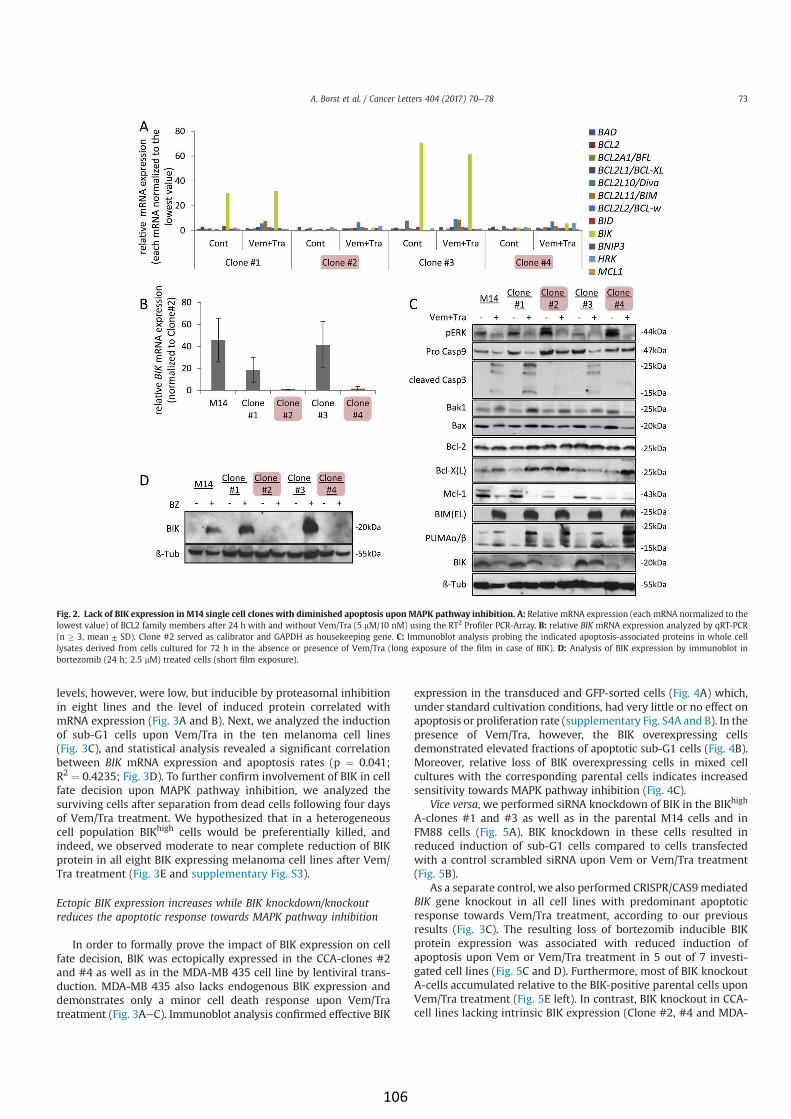
levels, however, were low, but inducible by proteasomal inhibition
in eight lines and the level of induced protein correlated with
mRNA expression (Fig. 3A and B). Next, we analyzed the induction
of sub-G1 cells upon Vem/Tra in the ten melanoma cell lines
(Fig. 3C), and statistical analysis revealed a significant correlation
between BIK mRNA expression and apoptosis rates (p ¼ 0.041;
R2¼ 0.4235; Fig. 3D). To further confirm involvement of BIK in cell
fate decision upon MAPK pathway inhibition, we analyzed the
surviving cells after separation from dead cells following four days
of Vem/Tra treatment. We hypothesized that in a heterogeneous
cell population BIKhigh cells would be preferentially killed, and
indeed, we observed moderate to near complete reduction of BIK
protein in all eight BIK expressing melanoma cell lines after Vem/
Tra treatment (Fig. 3E and supplementary Fig. S3).
Ectopic BIK expression increases while BIK knockdown/knockout
reduces the apoptotic response towards MAPK pathway inhibition
In order to formally prove the impact of BIK expression on cell
fate decision, BIK was ectopically expressed in the CCA-clones #2
and #4 as well as in the MDA-MB 435 cell line by lentiviral trans-
duction. MDA-MB 435 also lacks endogenous BIK expression and
demonstrates only a minor cell death response upon Vem/Tra
treatment (Fig. 3AeC). Immunoblot analysis confirmed effective BIK
expression in the transduced and GFP-sorted cells (Fig. 4A) which,
under standard cultivation conditions, had very little or no effect on
apoptosis or proliferation rate (supplementary Fig. S4A and B). In the
presence of Vem/Tra, however, the BIK overexpressing cells
demonstrated elevated fractions of apoptotic sub-G1 cells (Fig. 4B).
Moreover, relative loss of BIK overexpressing cells in mixed cell
cultures with the corresponding parental cells indicates increased
sensitivity towards MAPK pathway inhibition (Fig. 4C).
Vice versa, we performed siRNA knockdown of BIK in the BIKhigh
A-clones #1 and #3 as well as in the parental M14 cells and in
FM88 cells (Fig. 5A). BIK knockdown in these cells resulted in
reduced induction of sub-G1 cells compared to cells transfected
with a control scrambled siRNA upon Vem or Vem/Tra treatment
(Fig. 5B).
As a separate control, we also performed CRISPR/CAS9mediated
BIK gene knockout in all cell lines with predominant apoptotic
response towards Vem/Tra treatment, according to our previous
results (Fig. 3C). The resulting loss of bortezomib inducible BIK
protein expression was associated with reduced induction of
apoptosis upon Vem or Vem/Tra treatment in 5 out of 7 investi-
gated cell lines (Fig. 5C and D). Furthermore, most of BIK knockout
A-cells accumulated relative to the BIK-positive parental cells upon
Vem/Tra treatment (Fig. 5E left). In contrast, BIK knockout in CCA-
cell lines lacking intrinsic BIK expression (Clone #2, #4 and MDA-
Fig. 2. Lack of BIK expression in M14 single cell clones with diminished apoptosis upon MAPK pathway inhibition. A: Relative mRNA expression (each mRNA normalized to the
lowest value) of BCL2 family members after 24 h with and without Vem/Tra (5 mM/10 nM) using the RT2 Profiler PCR-Array. B: relative BIK mRNA expression analyzed by qRT-PCR
(n % 3, mean ± SD). Clone #2 served as calibrator and GAPDH as housekeeping gene. C: Immunoblot analysis probing the indicated apoptosis-associated proteins in whole cell
lysates derived from cells cultured for 72 h in the absence or presence of Vem/Tra (long exposure of the film in case of BIK). D: Analysis of BIK expression by immunoblot in
bortezomib (24 h; 2.5 mM) treated cells (short film exposure).
A. Borst et al. / Cancer Letters 404 (2017) 70e78 73
106

MB 435) did not affect sensitivity towards MAPK pathway inhibi-
tion (Fig. 5E right). In summary, BIK overexpression and knock-
down/knockout experiments suggest a substantial contribution of
BIK in mediating MAPK pathway inhibition induced cell death in
several BRAF mutated melanoma cell lines with loss of BIK
expression shifting the response towards survival.
De-repression of BIK expression by HDAC inhibition
Since sequencing analysis did not reveal any reason for sup-
pressed BIK expression in M14 Clones #2 and #4 (data not shown),
we hypothesized that this was due to epigenetic modifications. In
this regard, silencing of gene expression can be mediated by
histone deacetylases (HDACs) as acetylation of lysine residues in
histones is an important mechanism stimulating expression of the
respective genes [25]. Hence, we performed experiments applying
the HDAC inhibitor Romidepsin (FK228) to explore whether HDACs
are involved in BIK repression in the BIKlow CCA-cell lines. Chro-
matin Immunoprecipitation followed by real time PCR demon-
strated elevated H3K9 acetylation in the BIK promotor region upon
treatment with FK228 (Fig. 6A and supplementary Fig. 4). In line
with increased promoter acetylation we observed FK228-induced
elevated BIK mRNA levels - in particular in the BIKlow CCA-cell
lines (M14 Clones #2 and #4 as well as MDA-MB 435) (Fig. 6B) -
which resulted in increased BIK protein levels in all analyzed cell
lines (Fig. 6C). Moreover, FK228 was not only cytotoxic as single
Fig. 3. MAPK pathway inhibition of BRAF mutant melanoma cells selects for reduced BIK expression. A: qRT-PCR: relative BIK mRNA expression in the indicated BRAF-mutant
melanoma cell lines with LoxIMV1 as calibrator and GAPDH as housekeeping gene. Mean values (þ/& SD) of six independent experiments. B: Immunoblot analysis of cell lysates
harvested after 24 h in the presence or absence of bortezomib (2.5 mM). C: Following 48 h of Vem/Tra (5 mM/10 nM) treatment the DNA content was measured by flow cytometry.
Depicted is the increase of the sub-G1 population (%sub-G1 Vem/Tra - %sub-G1 control) (n % 3, mean ± SD). D: Linear regression of BIK expression and Vem/Tra induced sub-G1
fraction (based on data presented in A and C) (p ¼ 0.041; R2¼ 0.4235). E: Following four days in the presence or absence of Vem/Tra, the surviving cells were collected and treated
with bortezomib for 24 h and then analyzed by immunoblot for BIK expression.
A. Borst et al. / Cancer Letters 404 (2017) 70e7874
107

agent treatment, but also increased the apoptotic response of CCA-
cells upon Vem/Tra treatment (Fig. 6D), indicating that FK228
sensitized BIK-negative cells for Vem/Tra therapy.
HDAC inhibition increases efficacy of BRAF/MEK inhibition against
BIKlow xeno-transplanted tumors
Next, we performed xeno-transplantation experiments to test if
our in vitro observations can be confirmed in the in vivo setting. To
this end, BIKlow and BIKhigh tumors were induced in nude mice by
simultaneously injecting M14 clone #4 and clone #1 cells, in the
right and left flank, respectively. Upon treatment with Vem/Tra, the
BIKhigh tumor clone #1 shrank significantly faster than the of BIKlow
tumor clone #4 (Fig. 6E).Whenmicewere additionally treated with
the HDAC inhibitor FK228, however, tumor burden of BIKlow tumors
was significantly decreased compared to Vem/Tra only treatment.
Indeed, therapeutic efficacy as determined by tumor volume
decrease of Vem/Tra/FK228-treated BIKlow tumors was in the same
range as for Vem/Tra or Vem/Tra/FK228 treated BIKhigh tumors
(Fig. 6E).
Discussion
The major problem of current targeted therapy for patients with
BRAFV600 mutant melanoma is the occurrence of inhibitor resistant
tumors after an initial, distinct reduction in tumor mass [26,27]. In
this respect, several molecular mechanisms rendering BRAFmutant
melanoma cells insensitive towards BRAF and/or MEK inhibition
have been uncovered [6,7,28]. However, not only acquired or pre-
existing resistance contributes to relapse, but also incomplete
killing of the inhibitor sensitive tumor cells has been demonstrated
to support outgrowth, dissemination and metastasis of drug-
resistant cancer cell clones [8]. Indeed, often a fraction of
inhibitor-sensitive BRAF mutant melanoma cells survive inhibition
of MAPK pathway signaling in a cell cycle-arrested, senescence-like
state, while the remaining cells undergo apoptosis [4,5,8,27]. Here
we identified the pro-apoptotic BCL2 family member BIK as a
protein involved in this cell fate decision with epigenetic silencing
of BIK supporting survival of RAF/MEK inhibitor treated melanoma
cells.
BIK is a protein predominantly found at the ER where it can bind
and inhibit anti-apoptotic BCL2 and BCL-X(L), leading to subse-
quent activation of BAX, triggering Ca2þ release from the ER that
enhances cytochrome c liberation from the mitochondria and
subsequent caspase 9 cleavage [29e33]. Furthermore, inhibition of
anti-apoptotic MCL-1- a protein implicated in apoptosis deficiency
inmelanoma [34] - has been described [35]. A study in IFNg-treated
airway epithelial cells attributed the role of BIK in cell death to its
ability to inhibit nuclear translocation of ERK1/2 through BH3
mediated interaction with the activated ERK proteins [36].
Fig. 4. Ectopic BIK expression increases the apoptotic response upon MAPK pathway inhibition. The indicated cell-lines were stably transduced with a vector coding either for
GFP or for BIK and GFP. A: BIK protein levels analyzed by immunoblot after 24 h with and without bortezomib (2.5 mM). B: Increase in sub-G1 cells following 72 h of Vem/Tra
treatment as determined by flow cytometry of PI-stained cells (%sub-G1 Vem/Tra - %sub-G1 control) (n ¼ 5). C: GFP expression was used to monitor the response to Vem/Tra (5 mM/
10 nM) in mixed cell cultures with parental cells over time. Relative ratios based in each case on the measurement of the first time point were calculated, and mean values (±SD) of
four independent experiments are depicted. (Students t-test, paired, two-tailed, *p < 0.05; **p < 0.01; in C the areas under the curve were compared).
A. Borst et al. / Cancer Letters 404 (2017) 70e78 75
108

Several results obtained in our present study support an impor-
tant function of BIK in cell death induced by ERK1/2 inactivation in
BRAFV600 mutant melanoma cells treated with RAF/MEK inhibitor:
(i) correlation of BIK expressionwith the apoptotic response towards
RAF/MEK inhibition in different BRAFV600 mutant melanoma cell
lines and in particular inM14 derived single cell clones, (ii) preferred
survival of BIKlow melanoma cells upon treatment with RAF/MEK
inhibitors, (iii) increased inhibitor induced apoptosis and reduced
proliferation/cell death rate in cells ectopically expressing BIK and
(iv) reduced apoptotic response and increased proliferation/cell-
death rate of BIK knockdown/knockout melanoma cells. In line
with our findings it has been demonstrated that suppression of BIK
can mediate apoptosis resistance in B-cells, as well as in lympho-
blastoid, renal cell carcinoma and breast cancer cells [37e41].
Although, our data clearly demonstrate a possible role of BIK
loss for reduced apoptotic response upon BRAF/MEK inhibition in
melanoma cells we would like to point out that this does not
exclude that other molecular mechanisms may mediate such an
effect as well. Similarly, several different mechanisms have been
described for adaptive resistance to MAPK pathway inhibition [42].
In contrast to several other cancer cell types where BIK
expression is increased upon death inducing stimuli [43e45], we
did not observe distinct changes of BIKmRNA or protein expression
upon Vem or Vem/Tra treatment in BRAF mutant melanoma cells.
Even flow cytometry analyses of BIK-GFP fusion protein expressing
cells did not reveal an increase in BIK protein expression preceding
inhibitor induced death (data not shown). Therefore, BIK may
either be functionally activated by MAPK pathway inhibition or
basal level expression of BIK is an essential prerequisite for other
induced/repressed factors to trigger apoptosis. Regarding the first
possibility it has been proposed that due to its exposed BH3 domain
BIK is, in contrast to BID, a constitutively active protein [46] while
another study suggested that phosphorylation of BIK is required for
full apoptotic activity, however, without providing evidence that
phosphorylation increases in response to death inducing stimuli
[47]. Furthermore, subcellular localization influencing BIK activity
has been reported [48], and last but not least glucose-regulated
protein 78 (GRP78) has been described to negatively regulate BIK
function through direct interaction [38,49]. Interestingly, GRP78
expression is repressed in BRAFmutantmelanoma cells in response
to vemurafenib [13], which also suggests BIK as a MAPK pathway
inhibition triggered mediator of apoptosis in melanoma.
Regarding the second possibility, i.e. that basal BIK expression is
required for other induced factors to promote apoptosis, the BCL2
family members BIM and PUMA are promising candidates poten-
tially cooperatingwith BIK in cell death induction, similar towhat is
reported for BIK and NOXA [31]. Indeed, BIM and PUMA have been
demonstrated to be both elevated and required for apoptosis upon
MAPK pathway inhibition in melanoma cells [12e14,23,24].
Moreover, we observed induction of BIM and PUMA also in those
Fig. 5. BIK knockdown/knockout reduces the apoptotic response towards MAPK pathway inhibition. A and B: 24 h before subsequent inhibitor treatment the indicated cell
lines were transfected with a BIK or scr siRNA. C and D: BIK knockout in the indicated cell-lines was achieved using CRISPR/CAS9 technology and a selectable donor integrating into
the BIK locus. A and C: BIK knockdown/knockout evaluated by immunoblot analysis of cell lysates harvested following bortezomib treatment (24 h; 2.5 mM). B and D: Reduction of
sub-G1 cells relative to control cells after 48 h Vem (5 mM) or Vem/Tra (5 mM/10 nM) treatment of BIK knockdown (B) or knockout cells (D). Depicted is the mean relative difference
[(Dsub G-1 knockout - Dsub G-1 control)/Dsub G-1 control] of at least three independent experiments. E: RFP expression of the BIK-knockout cells was used to monitor the response
to Vem/Tra in mixed cell cultures with parental cells over time. Relative ratios based in each case on the measurement of the first time point were calculated, and mean values (±SD)
of at least three independent experiments are depicted (n % 3, Students t-test, paired, two-tailed, *p < 0.05; **p < 0.01; ***p < 0.001; in E the areas under the curve were compared).
A. Borst et al. / Cancer Letters 404 (2017) 70e7876
109

cell lines largely lacking inhibitor induced apoptosis as well as BIK
expression (Fig. 2C). Upon ectopic BIK expression, however, Vem/
Tra treatment leads to elevated killing of these cells (Fig. 4) sug-
gesting BIK as a critical co-factor for BIM/PUMAmediated apoptosis
and, vice versa, lack of BIK expression in BRAF mutant melanoma
cells limiting the desired apoptotic response upon MAPK pathway
inhibition (Fig. 5).
De-repression of BIK expression was achievable in our BIKlow
melanoma cell lines by applying an HDAC inhibitor (Fig. 6), sug-
gesting transcriptional repression of BIK due to lack of histone
acetylation. Similarly, epigenetic silencing of BH3-only proteins and
its contribution to acquired resistance has been described for
several tumor entities [50,51] providing part of the rationale for the
potential use of HDAC inhibitors to treat cancer patients. Indeed,
several HDAC inhibitors are tested in clinical trials and some have
already been approved for peripheral and cutaneous lymphoma as
well as for myeloma [52e54]. However, in melanoma, clinical trials
with HDAC inhibitors as monotherapy have failed so far [55,56].
Supporting other pre-clinical studies suggesting combination of
HDAC and MAPK pathway inhibitors for the treatment of BRAF
mutant cancer [57,58] our results presented here suggest that
combination of HDAC inhibitors with MAPK pathway inhibitors
may result in an increased initial apoptosis response possibly
leading to improved long term efficacy.
Acknowledgements
The study was supported by the Interdisziplin€ares Zentrum für
Klinische Forschung Würzburg (IZKF B-193 and B-323) and the
Hiege Foundation against Skin Cancer. We are very thankful to
Jürgen Eberle for providing the BIK expression construct. Further-
more, we thank Lena V€olkert, Kristina Vogtmann, Luis Zanon
Rodriguez and Sarah Schuster for excellent technical assistance.
Conflict of interest
The authors have no conflict of interest to declare.
Appendix A. Supplementary data
Supplementary data related to this article can be found at http://
dx.doi.org/10.1016/j.canlet.2017.07.005.
References
[1] Genomic classification of cutaneous melanoma, Cell 161 (2015) 1681e1696.[2] Z. Eroglu, A. Ribas, Combination therapy with BRAF and MEK inhibitors for
melanoma: latest evidence and place in therapy, Ther. Adv. Med. Oncol. 8(2016) 48e56.
[3] B.P. Singh, A.K. Salama, Updates in therapy for advanced melanoma, Cancers 8(2016).
[4] S. Haferkamp, A. Borst, C. Adam, T.M. Becker, S. Motschenbacher,
S. Windhovel, et al., Vemurafenib induces senescence features in melanomacells, J. Invest Dermatol 133 (2013) 1601e1609.
[5] H. Yang, B. Higgins, K. Kolinsky, K. Packman, Z. Go, R. Iyer, et al., RG7204(PLX4032), a selective BRAFV600E inhibitor, displays potent antitumor ac-
tivity in preclinical melanoma models, Cancer Res. 70 (2010) 5518e5527.
[6] E. Hartsough, Y. Shao, A.E. Aplin, Resistance to RAF inhibitors revisited,J. Invest Dermatol 134 (2014) 319e325.
[7] M. Holderfield, M.M. Deuker, F. McCormick, M. McMahon, Targeting RAF ki-nases for cancer therapy: BRAF-mutated melanoma and beyond, Nat. Rev.
Cancer 14 (2014) 455e467.[8] A.C. Obenauf, Y. Zou, A.L. Ji, S. Vanharanta, W. Shu, H. Shi, et al., Therapy-
induced tumour secretomes promote resistance and tumour progression,
Nature 520 (2015) 368e372.
Fig. 6. HDAC inhibition leads to increased BIK expression and sensitization of BIKlow cells towards MAPK pathway inhibition induced apoptosis. A: Following 24 h of FK228
treatment (100 nM) the indicated cells were fixed, and digested chromatin was pulled down with antibodies targeting Histone H3 and H3K9Ac, respectively. Purified DNA was
analyzed for the presence of the BIK promoter by real-time PCR using primer set A (supplementary figure S5). Values for H3K9Ac relative to H3 are depicted. B: Relative BIK mRNA
induction (treated/untreated) determined by qRT-PCR after 24 h of FK228 treatment. C: Immunoblot of indicated cell lines treated for 24 h with bortezomib (2.5 mM) or FK228
(100 nM). D: The number of sub-G1 cells following 48 h of treatment with the indicated inhibitors was determined by flow cytometry of PI-stained cells (n % 3). E: In 10 nude mice,
two tumors were induced in each flank of the mice by subcutaneous injection of M14 clone#1 or #4 cells. When the tumors reached a volume of around 100 mm3, the animals were
divided into two groups and received intraperitoneal injections of either Vem (25 mg/kg) þ Tra (0.05 mg/kg) or as third component FK228 (0.5 mg/kg). Tumor size was measured in
the course of time and mean values relative to the start of the treatment (±standard error) are displayed. For statistical evaluation the area under the curve (AUC) for each individual
tumor was calculated and then the AUCs of the different groups were compared by one-way-ANOVA followed by Newman-Keuls multiple comparison post hoc testing (*p < 0.05;
***p < 0.001).
A. Borst et al. / Cancer Letters 404 (2017) 70e78 77
110

[9] A.R. Jazirehi, R. Nazarian, A.X. Torres-Collado, J.S. Economou, Aberrant
apoptotic machinery confers melanoma dual resistance to BRAF(V600E) in-hibitor and immune effector cells: immunosensitization by a histone deace-
tylase inhibitor, Am. J. Clin. Exp. Immunol. 3 (2014) 43e56.[10] S. Baig, I. Seevasant, J. Mohamad, A. Mukheem, H.Z. Huri, T. Kamarul, Potential
of apoptotic pathway-targeted cancer therapeutic research: where do we
stand? Cell death Dis. 7 (2016) e2058.[11] A.N. Hata, J.A. Engelman, A.C. Faber, The BCL2 family: key mediators of the
apoptotic response to targeted anticancer therapeutics, Cancer Discov. 5(2015) 475e487.
[12] R.A. Cartlidge, G.R. Thomas, S. Cagnol, K.A. Jong, S.A. Molton, A.J. Finch, et al.,Oncogenic BRAF(V600E) inhibits BIM expression to promote melanoma cell
survival, Pigment. Cell Melanoma Res. 21 (2008) 534e544.
[13] D. Beck, H. Niessner, K.S. Smalley, K. Flaherty, K.H. Paraiso, C. Busch, et al.,Vemurafenib potently induces endoplasmic reticulum stress-mediated
apoptosis in BRAFV600E melanoma cells, Sci. Signal. 6 (2013) ra7.[14] K.H. Paraiso, Y. Xiang, V.W. Rebecca, E.V. Abel, Y.A. Chen, A.C. Munko, et al.,
PTEN loss confers BRAF inhibitor resistance to melanoma cells through the
suppression of BIM expression, Cancer Res. 71 (2011) 2750e2760.[15] O.N. Ikediobi, H. Davies, G. Bignell, S. Edkins, C. Stevens, S. O'Meara, et al.,
Mutation analysis of 24 known cancer genes in the NCI-60 cell line set, Mol.cancer Ther. 5 (2006) 2606e2612.
[16] R. Houben, C. Adam, A. Baeurle, S. Hesbacher, J. Grimm, S. Angermeyer, et al.,
An intact retinoblastoma protein-binding site in Merkel cell polyomaviruslarge T antigen is required for promoting growth of Merkel cell carcinoma
cells, Int.J Cancer 130 (2012) 847e856.[17] M. Oppermann, C.C. Geilen, L.F. Fecker, B. Gillissen, P.T. Daniel, J. Eberle,
Caspase-independent induction of apoptosis in human melanoma cells by theproapoptotic Bcl-2-related protein Nbk/Bik, Oncogene 24 (2005) 7369e7380.
[18] A. Roesch, A. Vultur, I. Bogeski, H. Wang, K.M. Zimmermann, D. Speicher, et al.,
Overcoming intrinsic multidrug resistance in melanoma by blocking themitochondrial respiratory chain of slow-cycling JARID1B(high) cells, Cancer
Cell 23 (2013) 811e825.[19] G. Zhang, M. Herlyn, Linking SOX10 to a slow-growth resistance phenotype,
Cell Res. 24 (2014) 906e907.
[20] M. Nikrad, T. Johnson, H. Puthalalath, L. Coultas, J. Adams, A.S. Kraft, Theproteasome inhibitor bortezomib sensitizes cells to killing by death receptor
ligand TRAIL via BH3-only proteins Bik and Bim, Mol. cancer Ther. 4 (2005)443e449.
[21] H. Zhu, L. Zhang, F. Dong, W. Guo, S. Wu, F. Teraishi, et al., Bik/NBK accu-mulation correlates with apoptosis-induction by bortezomib (PS-341, Vel-
cade) and other proteasome inhibitors, Oncogene 24 (2005) 4993e4999.
[22] J.M. Boyd, G.J. Gallo, B. Elangovan, A.B. Houghton, S. Malstrom, B.J. Avery, et al.,Bik, a novel death-inducing protein shares a distinct sequence motif with Bcl-
2 family proteins and interacts with viral and cellular survival-promotingproteins, Oncogene 11 (1995) 1921e1928.
[23] Y.F. Wang, C.C. Jiang, K.A. Kiejda, S. Gillespie, X.D. Zhang, P. Hersey, Apoptosis
induction in human melanoma cells by inhibition of MEK is caspase-independent and mediated by the Bcl-2 family members PUMA, Bim, and
Mcl-1, Clin. Cancer Res. 13 (2007) 4934e4942.[24] L. Rohrbeck, J.N. Gong, E.F. Lee, A.J. Kueh, A. Behren, L. Tai, et al., Hepatocyte
growth factor renders BRAF mutant human melanoma cell lines resistant toPLX4032 by downregulating the pro-apoptotic BH3-only proteins PUMA and
BIM, Cell Death Differ. 23 (2016) 2054e2062.
[25] M. Yoshida, R. Furumai, M. Nishiyama, Y. Komatsu, N. Nishino, S. Horinouchi,Histone deacetylase as a new target for cancer chemotherapy, Cancer Che-
mother. Pharmacol. 48 (Suppl 1) (2001) S20eS26.[26] R. Fisher, J. Larkin, Vemurafenib: a new treatment for BRAF-V600 mutated
advanced melanoma, Cancer Manag. Res. 4 (2012) 243e252.
[27] A. Swaika, J.A. Crozier, R.W. Joseph, Vemurafenib: an evidence-based reviewof its clinical utility in the treatment of metastatic melanoma, Drug Des. Dev.
Ther. 8 (2014) 775e787.[28] N. Wagle, C. Emery, M.F. Berger, M.J. Davis, A. Sawyer, P. Pochanard, et al.,
Dissecting therapeutic resistance to RAF inhibition in melanoma by tumorgenomic profiling, J. Clin. Oncol. official J. Am. Soc. Clin. Oncol. 29 (2011)
3085e3096.
[29] G. Chinnadurai, S. Vijayalingam, R. Rashmi, BIK, the founding member of theBH3-only family proteins: mechanisms of cell death and role in cancer and
pathogenic processes, Oncogene 27 (Suppl 1) (2008) S20eS29.[30] M. Germain, J.P. Mathai, G.C. Shore, BH-3-only BIK functions at the endo-
plasmic reticulum to stimulate cytochrome c release from mitochondria,
J. Biol. Chem. 277 (2002) 18053e18060.[31] M. Germain, J.P. Mathai, H.M. McBride, G.C. Shore, Endoplasmic reticulum BIK
initiates DRP1-regulated remodelling of mitochondrial cristae duringapoptosis, EMBO J. 24 (2005) 1546e1556.
[32] B. Gillissen, F. Essmann, V. Graupner, L. Starck, S. Radetzki, B. Dorken, et al.,
Induction of cell death by the BH3-only Bcl-2 homolog Nbk/Bik is mediated byan entirely Bax-dependent mitochondrial pathway, EMBO J. 22 (2003)
3580e3590.[33] Y. Tong, Q. Yang, C. Vater, L.K. Venkatesh, D. Custeau, T. Chittenden, et al., The
pro-apoptotic protein, Bik, exhibits potent antitumor activity that is depen-dent on its BH3 domain, Mol. cancer Ther. 1 (2001) 95e102.
[34] D. Senft, C. Berking, S.A. Graf, C. Kammerbauer, T. Ruzicka, R. Besch, Selective
induction of cell death in melanoma cell lines through targeting of Mcl-1 andA1, PLOS one 7 (2012) e30821.
[35] T. Shimazu, K. Degenhardt, E.K.A. Nur, J. Zhang, T. Yoshida, Y. Zhang, et al.,NBK/BIK antagonizes MCL-1 and BCL-XL and activates BAK-mediated
apoptosis in response to protein synthesis inhibition, Genes Dev. 21 (2007)
929e941.[36] Y.A. Mebratu, B.F. Dickey, C. Evans, Y. Tesfaigzi, The BH3-only protein Bik/Blk/
Nbk inhibits nuclear translocation of activated ERK1/2 to mediate IFNgamma-induced cell death, J. Cell Biol. 183 (2008) 429e439.
[37] R. Viedma-Rodriguez, L.A. Baiza-Gutman, A. Garcia-Carranca, L. Moreno-Fierros, F. Salamanca-Gomez, D. Arenas-Aranda, Suppression of the death
gene BIK is a critical factor for resistance to tamoxifen in MCF-7 breast cancer
cells, Int. J. Oncol. 43 (2013) 1777e1786.[38] H. Zhou, Y. Zhang, Y. Fu, L. Chan, A.S. Lee, Novel mechanism of anti-apoptotic
function of 78-kDa glucose-regulated protein (GRP78): endocrine resistancefactor in breast cancer, through release of B-cell lymphoma 2 (BCL-2) from
BCL-2-interacting killer (BIK), J. Biol. Chem. 286 (2011) 25687e25696.
[39] E.M. Campion, R. Hakimjavadi, S.T. Loughran, S. Phelan, S.M. Smith,B.N. D'Souza, et al., Repression of the proapoptotic cellular BIK/NBK gene by
Epstein-Barr virus antagonizes transforming growth factor beta1-induced B-cell apoptosis, J. Virol. 88 (2014) 5001e5013.
[40] I. Prieto-Remon, D. Sanchez-Carrera, M. Lopez-Duarte, C. Richard, C. Pipaon,
BIK (NBK) is a mediator of the sensitivity of Fanconi anaemia group C lym-phoblastoid cell lines to interstrand DNA cross-linking agents, Biochem. J. 448
(2012) 153e163.[41] I. Sturm, C. Stephan, B. Gillissen, R. Siebert, M. Janz, S. Radetzki, et al., Loss of
the tissue-specific proapoptotic BH3-only protein Nbk/Bik is a unifyingfeature of renal cell carcinoma, Cell Death Differ. 13 (2006) 619e627.
[42] S.J. Welsh, H. Rizos, R.A. Scolyer, G.V. Long, Resistance to combination BRAF
and MEK inhibition in metastatic melanoma: where to next? Eur. J. Cancer 62(2016) 76e85.
[43] J. Hur, J. Chesnes, K.R. Coser, R.S. Lee, P. Geck, K.J. Isselbacher, et al., The BikBH3-only protein is induced in estrogen-starved and antiestrogen-exposed
breast cancer cells and provokes apoptosis, Proc. Natl. Acad. Sci. U. S. A. 101
(2004) 2351e2356.[44] J.P. Mathai,M. Germain, G.C. Shore, BH3-only BIK regulates BAX,BAK-dependent
release of Ca2þ fromendoplasmic reticulumstores andmitochondrial apoptosisduring stress-induced cell death, J. Biol. Chem. 280 (2005) 23829e23836.
[45] L.C. Spender, D.I. O'Brien, D. Simpson, D. Dutt, C.D. Gregory, M.J. Allday, et al.,TGF-beta induces apoptosis in human B cells by transcriptional regulation of
BIK and BCL-XL, Cell Death Differ. 16 (2009) 593e602.
[46] J.M. McDonnell, D. Fushman, C.L. Milliman, S.J. Korsmeyer, D. Cowburn, So-lution structure of the proapoptotic molecule BID: a structural basis for
apoptotic agonists and antagonists, Cell 96 (1999) 625e634.[47] S. Verma, L.J. Zhao, G. Chinnadurai, Phosphorylation of the pro-apoptotic
protein BIK: mapping of phosphorylation sites and effect on apoptosis,
J. Biol. Chem. 276 (2001) 4671e4676.[48] C. Paquet, E. Schmitt, M. Beauchemin, R. Bertrand, Activation of multidomain
and BH3-only pro-apoptotic Bcl-2 family members in p53-defective cells,Apoptosis Int. J. Program. cell death 9 (2004) 815e831.
[49] Y. Fu, J. Li, A.S. Lee, GRP78/BiP inhibits endoplasmic reticulum BIK and protectshuman breast cancer cells against estrogen starvation-induced apoptosis,
Cancer Res. 67 (2007) 3734e3740.
[50] Y. Shao, A.E. Aplin, BH3-only protein silencing contributes to acquired resis-tance to PLX4720 in human melanoma, Cell Death Differ. 19 (2012)
2029e2039.[51] C. Pompeia, D.R. Hodge, C. Plass, Y.Z. Wu, V.E. Marquez, J.A. Kelley, et al.,
Microarray analysis of epigenetic silencing of gene expression in the KAS-6/1
multiple myeloma cell line, Cancer Res. 64 (2004) 3465e3473.[52] A.A. Lane, B.A. Chabner, Histone deacetylase inhibitors in cancer therapy,
J. Clin. Oncol. official J. Am. Soc. Clin. Oncol. 27 (2009) 5459e5468.[53] K. Ververis, A. Hiong, T.C. Karagiannis, P.V. Licciardi, Histone deacetylase in-
hibitors (HDACIs): multitargeted anticancer agents, Biol. targets Ther. 7 (2013)47e60.
[54] T. Harada, T. Hideshima, K.C. Anderson, Histone deacetylase inhibitors in
multiple myeloma: from bench to bedside, Int. J. Hematol. 104 (2016)300e309.
[55] N.B. Haas, I. Quirt, S. Hotte, E. McWhirter, R. Polintan, S. Litwin, et al., Phase IItrial of vorinostat in advanced melanoma, Investig. new drugs 32 (2014)
526e534.
[56] A. Hauschild, U. Trefzer, C. Garbe, K.C. Kaehler, S. Ugurel, F. Kiecker, et al.,Multicenter phase II trial of the histone deacetylase inhibitor pyridylmethyl-
N-{4-[(2-aminophenyl)-carbamoyl]-benzyl}-carbamate in pretreated meta-static melanoma, Melanoma Res. 18 (2008) 274e278.
[57] R. Carson, B. Celtikci, C. Fenning, A. Javadi, N. Crawford, L. Perez-Carbonell, et
al., HDAC inhibition overcomes acute resistance to MEK inhibition in BRAF-mutant colorectal cancer by downregulation of c-FLIPL, Clin. Cancer Res. 21
(2015) 3230e3240.[58] F. Lai, S.T. Guo, L. Jin, C.C. Jiang, C.Y. Wang, A. Croft, et al., Cotargeting histone
deacetylases and oncogenic BRAF synergistically kills human melanoma cellsby necrosis independently of RIPK1 and RIPK3, Cell death Dis. 4 (2013) e655.
A. Borst et al. / Cancer Letters 404 (2017) 70e7878
111

Figure S1: Apoptosis and cell cycle arrest induced by Vem or Tra in different melanoma cell
lines. The indicated BRAF mutant cell lines were treated with increasing concentrations of Vem or
Tra. After 4 days, cells were stained with propidium iodide and analysed by flow cytometry.
Decreasing percentages of cells in S and G2 phase relative to (G1+S+G2) indicate a G1 arrest. The
percentage of sub-G1 cells serves as a measure of cell death. Mel Juso was used as BRAF wild-type
control.
% S
+G
2
% s
ub
-G1
Vem Tra
0
20
40
60
80
100
0µM 0,1µM 0,2µM 1µM 2µM 5µM
0
20
40
60
80
100
0nM 1nM 10nM 25nM 100nM 250nM
0
10
20
30
40
50
0µM 0,1µM 0,2µM 1µM 2µM 5µM
0
10
20
30
40
50
0nM 1nM 10nM 25nM 100nM 250nM
Supplemental Material
112

0%
20%
40%
60%
80%
100%
120%
Co
nt
Ve
m
Tra
Co
nt
Ve
m
Tra
Co
nt
Ve
m
Tra
Co
nt
Ve
m
Tra
Co
nt
Ve
m
Tra
M14 Clone #1 Clone #2 Clone #3 Clone #4
LDH
Re
lea
se
A
0.0
0.2
0.4
0.6
0.8
1.0
1.2
Day0 Day4 Day7 Day11
rati
o o
f i
nd
ica
ted
Clo
ne
/M1
4
M14 Clone #1 Clone #2
Clone #3 Clone #4
B
0
20
40
60
80
100
0
0,1
0,5 1 2 5 0
0,1
0,5 1 2 5 0
0,1
0,5 1 2 5 0
0,1
0,5 1 2 5
Clone #1 Clone #2 Clone #3 Clone #4
% P
I p
osi
tive
Puromycin
µg/ml
C
Figure S2: Further characterization of apoptotic and arresting M14 single cell clones. A: Vem or
Tra mediated apoptosis after 4 days measured with the CytoTox 96® Non- radioactive Cytotoxicity
Assay (Promega) according to manufacturers instructions (n=3, mean +/- SD, Students t-test, paired,
two-tailed, *p<0.05; **p<0.01. Each clone compared to correspondingly treated parental M14 cells).
B: Growth rates compared in mixed cell culture assay. Cells were mixed with stably GFP expressing
parental M14 cells and altered growth characteristics of the single cell clones were excluded by
determining the ratio of GFP+/GFP- cells over time. C: Sensitivity to varying concentrations of
puromycin was measured by determining the percentage of propidium-iodide permeable cells after a
72 h treatment by flow cytometry. D: Surviving cells after eight weeks of Vem treatment (from Fig.
1D) of one 96-well were reseeded and cultivated under standard conditions. Crystal Violet staining
was performed after 13 days to analyze the ability to form colonies. Photograph is representative for
three experiments.
** ** ** **
*
Clone #2 Clone #4Clone #4
Clone #2
Clone #2 Clone #4
D
113

Fig. S3: BIK levels in apoptotic and arresting cells in the course of Vemurafenib/Trametinib
treatment. Immunoblot analysis was performed with whole cell lysates derived from the indicated
cell lines or M14 single cell clones treated with Vem/Tra (5 µM/10 nM) for 0, 1, 2 or 3 days. Prior to
harvesting cells were treated with bortezomib (24 h; 2.5 µM).
0 1 2 3 0 1 2 3 0 1 2 3
BIK
tubulin
Vem/Tra (days)
BIK
tubulin
0 1 2 3 0 1 2 3 0 1 2 3
M14 Clone #2Clone #2Clone #1
Clone #3 Clone #4
MDA-
MB-435
MDA-
MB-435
Vem/Tra (days)
- 20 kDa
- 20 kDa
- 55 kDa
- 55 kDa
114

Figure S4: Ectopic BIK expression in the arresting M14 clones and MDA-MB 435 does not affect
growth or background apoptosis under standard conditions: A: The indicated cells either
transduced with empty vector or with a BIK expression vector were fixed and stained by propidium-
iodide and analyzed by flow cytometry for the proportion of sub-G1 cells. B: Ectopically BIK
expressing single cell-lines were mixed with GFP expressing parental cells and altered growth was
excluded by analyzing the ratio of GFP+/GFP- cells over time.
0.0
0.2
0.4
0.6
0.8
1.0
1.2
Day 0 Day 12 Day 15 Day 18
Ra
tio
of
GF
P p
osi
tive
cell
s/p
are
nta
l ce
lls
M14
Clone #1
Clone #2
Clone #3
Clone #4Clone #4
Clone #2
A
B
0
10
20
30
Vector BIK
Clone #2 Clone #2
0
10
20
30
Vector BIK
Clone #4 Clone #4
0
10
20
30
Vector BIK
MDA-MB 435 MDA-MB 435
% S
ub
G-1
115

Figure S5: Chromatin-Immunoprecipitation (ChiP) followed by real-time PCR to demonstrate
that HDAC inhibition leads to increased BIK promoter acetylation. A and B: Sequence of the
different real time PCR primers pairs and their location in the BIK-promoter region C: Following 24 h
of FK228 treatment (100 nM) of the indicated cells, fixed and digested chromatin was pulled down
with antibodies targeting Histone H3 and H3K9Ac, respectively. Purified DNA was analyzed for the
presence of the BIK promoter by real-time PCR using the three different primer sets. Values for
H3K9Ac relative to H3 pull down are depicted.
116

Figure S6: Demonstration that the different M14 single cell clones were directly derived from
M14 and not mixed-up with the M14 derivative MDA-MB-435. First, exon 8 of the p53 gene of
was sequenced and indeed, we could detect in all single cell clones as well as in M14 and MDA-MB-
435 derived DNA the G797A (G266E) mutation (data not shown) which is characteristic for M14 and
MDA-MB-435 (Ikediobi et al., 2006). Since MDA-MB-435 and M14 differ in respect to their STR
profile only in one locus namely D16S539 (Fang et al., 2001; Rae et al., 2007) we amplified this locus
by PCR (primers: 5’-tatgggagcaaacaaaggcagat-3’ rev: 5‘-cagcctacagagtgattccatt-3’)) and sequenced
the product. Thereby, we could confirm that the parental M14 as well as the 4 clones carry the two
different alleles as indicated by double peaks showing up from a distinct position for M14 and the
M14 single cell clones while the MDA-MB-435 sequence is clean until the end of the amplicon. This
is in line with MDA-MB-435 carrying only one allele with 13 4-bp repeats while M14 has two alleles
with either 13 or 9 repeats leading to a 16 nucleotide difference between the two alleles (Fang et al.,
2001; Rae et al., 2007).Fang R, et al. (2001) STR Profiling of Human Cell Lines: Challenges and Possible Solutions to the Growing Problem. J
Forensic Res S2:005.
Ikediobi ON et al. (2006) Mutation analysis of 24 known cancer genes in the NCI-60 cell line set. Molecular cancer
therapeutics 5:2606-12.
Rae JM, Cet al. (2007) MDA-MB-435 cells are derived from M14 melanoma cells--a loss for breast cancer, but a boon for
melanoma research. Breast cancer research and treatment 104:13-9.
117

Supplementary Table 1: Table of primary antibodies used in this study.
Supplementary Materials and Methods
Target Company ID
Bak1 BD Pharmingen #556382
Bax eBioscience #14-6996
Bcl-2 Dako Clone 124
BCL-X(L) BD Pharmingen #556361
BIK/NBK Santa Cruz sc-1710
BIM Sigma Aldrich B7929
Caspase9 Cell Signaling #9502
Cleaved Caspase3 Cell Signaling #9661
Mcl-1 Santa Cruz #sc-12756
Phospho-p44/42 MAPK (Erk1/2) Cell Signaling #9106
PUMA Santa Cruz sc-374223
ß-Tubulin Sigma Aldrich T4026
118

Borst, Andreas Frankenstr. 2 97277 Neubrunn Tel: 0151 68 140 724 E-Mail: [email protected]
Erklärungen nach §4 Abs. 3 Satz 3, 5, 8 der Promotionsordnung der Fakultät für Biologie Affidavit I hereby declare that my thesis entitled: „ Apoptosis & senescence: cell fate determination in inhibitor-treated melanoma cells” is the result of my own work. I did not receive any help or support from commercial consultants. All sources and / or materials applied are listed and specified in the thesis. Furthermore I verify that the thesis has not been submitted as part of another examination process neither in identical nor in similar form. Eidesstattliche Erklärung Hiermit erkläre ich an Eides statt, die Dissertation: „Apoptosis & senescence: cell fate determination in inhibitor-treated melanoma cells“, eigenständig, d. h. insbesondere selbständig und ohne Hilfe eines kommerziellen Promotionsberaters, angefertigt und keine anderen, als die von mir angegebenen Quellen und Hilfsmittel verwendet zu haben. Ich erkläre außerdem, dass die Dissertation weder in gleicher noch in ähnlicher Form bereits in einem anderen Prüfungsverfahren vorgelegen hat. Würzburg_, den_12.10.2017 __
Unterschrift
119

9. Danksagung Als erstes möchte ich Roland dafür danken, mir im Tumorbiologischen Forschungslabor der Hautklinik die Möglichkeit gegeben zu haben, meine Promotion zu machen. Dabei konnte ich immer selbstständig und ohne Druck an meinen Projekten arbeiten; und sollte ich mich mal in eine Sackgasse manövriert haben, immer Rat und Ideen bei dir abholen.
An David Schrama ebenfalls vielen Dank für den Ideeninput, meistens zu Uhrzeiten zu denen kein „normaler“ Mensch mehr im Labor war außer uns beiden. Natürlich auch an die AG Schmidt, von euch habe ich mir öfters dringen benötigte Antikörper “borgen“ können. Ebenfalls ein Danke an Sebastian Haferkamp & Svenja Meierjohann, aufgrund der Finanzierung eures IZKF Projekts hatte ich genügen Geld während meiner Doktorandenzeit, um nicht verhungern zu müssen.
An das ganze Laborteam (Sonja, Claudia, Eva, Lena, Alex), ehemalige Laborteam (Sabrina, Christian, Rainee) und fleißige Praktikanten (Luis, Manu, Sahra, Maria & Antje) ein dickes Dankeschön für durchgeführte Versuche, (vor allem als ich bewegungsunfähig im Krankenhaus lag!), jede Menge Spaß, einen angenehmen, kollegialen und kreativen Laboralltag, Spiele Abende und das wichtigste zuletzt, tonnenweise Kuchen!
Ich denke immer gerne an die schöne Zeit in der Hautklinik zurück!
Zuletzt möchte ich natürlich vor allem meinen Eltern & Bruder, Tanten & Onkels, Oma, dem Rest der Family und allen Freunden für die Unterstützung jedweder Art danken. Sei es finanzieller oder menschlicher Art, vor allem während der schwierigen Zeit nach der Krebsdiagnose, den Operationen und der Genesungsphase! Dank euch konnte ich das vorliegende Werk beenden.
120