Field evaluation of wood bark-based down-flow biofilters for mitigation of odor, ammonia, and...
11
Field evaluation of wood bark-based down-flow biofilters for mitigation of odor, ammonia, and hydrogen sulfide emissions from confined swine nursery barns Gopi Krishna Kafle * , Lide Chen ** , Howard Neibling, B. Brian He Department of Biological and Agricultural Engineering, University of Idaho, Moscow, ID 83844, USA article info Article history: Received 22 May 2014 Received in revised form 30 August 2014 Accepted 4 September 2014 Available online Keywords: Down-flow biofilter Odor Ammonia Hydrogen sulfide Swine Wood barks abstract Two down-flow wood bark-based biofilters were evaluated for their effectiveness in treating odor, NH 3 and H 2 S under actual swine farm conditions. The water requirement for maintaining proper media moisture contents (MC) under different ventilation rates and intervals were determined. The effect of media depth and MC on the biofilters' performance was also evaluated. The aerodynamic resistance on biofilters was studied using computational fluid dynamics (CFD) software. Water requirements for bio- filters were obtained in the range of 3.8e556.0 L/m 3 /d for ventilation duration of 1e24 h/d (depending on the age of the pig and environmental conditions). The highest reductions in odor, NH 3 and H 2 S, obtained in this study at empty bed residence times (EBRT) of 1.6e3.1 s, were 73.5e76.9%, 95.2e97.9% and 95.8e100.0%, respectively. The pressure drop was 28.8e68.8 Pa for a media depth of 381 mm at an EBRT of 1.6e3.1 s and an MC of 64e65%. The pressure drop followed a secondary order polynomial line with both airflow rate and media MC (R 2 ¼ 0.927e0.982). The results of odor, NH 3 and H 2 S reduction efficiency and pressure drop suggest a media depth of 254 mm, MC 35e50% and EBRT of 2e3 s for successful operations of the wood bark-based biofilters. A high correlation was found between the measured and predicted pressured drops obtained using CFD software (R 2 ¼ 0.921, RMSE ¼ 0.145). © 2014 Elsevier Ltd. All rights reserved. 1. Introduction The trend toward high-density, confinement swine operations has increased dramatically in recent years to satisfy higher de- mand for meat products. As the number and size of confinement facilities have increased, air pollution problems due to odors and gas emissions have also increased. Sources of odor and gas emis- sions include land application events, manure storage facilities, and exhaust air from barns. Ventilation air is typically exhausted into the ambient atmosphere without treatment. This exhaust air contains odorous gases and particulate matters that can represent a concentrated odor source (Hoff and Harmon, 2006). Besides the nuisance associated with odors, they have also been shown to have a negative impact on the public health of those living in close proximity to the swine farms, where several studies have sug- gested that odors from intensive swine farms may be the cause for several ailments (Schiffman et al., 1995; Merchant and Ross, 2002). Therefore, effective methods of odor control will have to be put into operation if the swine industry is to coexist with their neighbors. Any technology used to reduce emissions must be able to treat a broad spectrum of airborne compounds. Various air pollution control technologies such as activated carbon adsorp- tion, wet scrubbing, and masking agents have been developed and applied (Ottengraf and Van Den Oever, 1983; Chung et al., 2007). These methods, however, often transfer odor causing materials from the gas phase to scrubbing liquids or solid adsorbents, and their derivatives have resulted in wastewater and solid waste concerns (Lin et al., 2001; Chung et al., 2007). Biofiltration is a green technology that uses no chemicals, thereby creating no is- sues of potentially hazardous media disposal (Singh et al., 2006a, b). Biofiltration has been recognized as the most promising and cost-efficient technology for treating air streams containing odorous compounds and more practical in meeting statutory emission regulations (Estrada et al., 2012; Prado et al., 2009; Wani et al., 1997). Biofilter media selection is critical in biofilter design and performance. Media environmental and nutritional requirements * Corresponding author. Tel.: þ1 208 736 3604; fax: þ1 208 736 0843. ** Corresponding author. Tel.: þ1 208 736 3615; fax: þ1 208 736 0843. E-mail addresses: gopikafl[email protected], gopikafl[email protected], gopik@ uidaho.edu (G.K. Kafle), [email protected] (L. Chen). Contents lists available at ScienceDirect Journal of Environmental Management journal homepage: www.elsevier.com/locate/jenvman http://dx.doi.org/10.1016/j.jenvman.2014.09.004 0301-4797/© 2014 Elsevier Ltd. All rights reserved. Journal of Environmental Management 147 (2015) 164e174
Transcript of Field evaluation of wood bark-based down-flow biofilters for mitigation of odor, ammonia, and...
lable at ScienceDirect
Journal of Environmental Management 147 (2015) 164e174
Contents lists avai
Journal of Environmental Management
journal homepage: www.elsevier .com/locate/ jenvman
Field evaluation of wood bark-based down-flow biofilters formitigation of odor, ammonia, and hydrogen sulfide emissions fromconfined swine nursery barns
Gopi Krishna Kafle*, Lide Chen**, Howard Neibling, B. Brian HeDepartment of Biological and Agricultural Engineering, University of Idaho, Moscow, ID 83844, USA
a r t i c l e i n f o
Article history:Received 22 May 2014Received in revised form30 August 2014Accepted 4 September 2014Available online
Keywords:Down-flow biofilterOdorAmmoniaHydrogen sulfideSwineWood barks
* Corresponding author. Tel.: þ1 208 736 3604; fax** Corresponding author. Tel.: þ1 208 736 3615; fax
E-mail addresses: [email protected], gopikauidaho.edu (G.K. Kafle), [email protected] (L. Chen).
http://dx.doi.org/10.1016/j.jenvman.2014.09.0040301-4797/© 2014 Elsevier Ltd. All rights reserved.
a b s t r a c t
Two down-flow wood bark-based biofilters were evaluated for their effectiveness in treating odor, NH3
and H2S under actual swine farm conditions. The water requirement for maintaining proper mediamoisture contents (MC) under different ventilation rates and intervals were determined. The effect ofmedia depth and MC on the biofilters' performance was also evaluated. The aerodynamic resistance onbiofilters was studied using computational fluid dynamics (CFD) software. Water requirements for bio-filters were obtained in the range of 3.8e556.0 L/m3/d for ventilation duration of 1e24 h/d (dependingon the age of the pig and environmental conditions). The highest reductions in odor, NH3 and H2S,obtained in this study at empty bed residence times (EBRT) of 1.6e3.1 s, were 73.5e76.9%, 95.2e97.9%and 95.8e100.0%, respectively. The pressure drop was 28.8e68.8 Pa for a media depth of 381 mm at anEBRT of 1.6e3.1 s and an MC of 64e65%. The pressure drop followed a secondary order polynomial linewith both airflow rate and media MC (R2 ¼ 0.927e0.982). The results of odor, NH3 and H2S reductionefficiency and pressure drop suggest a media depth of �254 mm, MC � 35e50% and EBRT of 2e3 s forsuccessful operations of the wood bark-based biofilters. A high correlation was found between themeasured and predicted pressured drops obtained using CFD software (R2 ¼ 0.921, RMSE ¼ 0.145).
© 2014 Elsevier Ltd. All rights reserved.
1. Introduction
The trend toward high-density, confinement swine operationshas increased dramatically in recent years to satisfy higher de-mand for meat products. As the number and size of confinementfacilities have increased, air pollution problems due to odors andgas emissions have also increased. Sources of odor and gas emis-sions include land application events, manure storage facilities,and exhaust air from barns. Ventilation air is typically exhaustedinto the ambient atmosphere without treatment. This exhaust aircontains odorous gases and particulate matters that can representa concentrated odor source (Hoff and Harmon, 2006). Besides thenuisance associated with odors, they have also been shown to havea negative impact on the public health of those living in closeproximity to the swine farms, where several studies have sug-gested that odors from intensive swine farms may be the cause for
: þ1 208 736 0843.: þ1 208 736 [email protected], gopik@
several ailments (Schiffman et al., 1995; Merchant and Ross, 2002).Therefore, effective methods of odor control will have to be putinto operation if the swine industry is to coexist with theirneighbors. Any technology used to reduce emissions must be ableto treat a broad spectrum of airborne compounds. Various airpollution control technologies such as activated carbon adsorp-tion, wet scrubbing, and masking agents have been developed andapplied (Ottengraf and Van Den Oever, 1983; Chung et al., 2007).These methods, however, often transfer odor causing materialsfrom the gas phase to scrubbing liquids or solid adsorbents, andtheir derivatives have resulted in wastewater and solid wasteconcerns (Lin et al., 2001; Chung et al., 2007). Biofiltration is agreen technology that uses no chemicals, thereby creating no is-sues of potentially hazardous media disposal (Singh et al., 2006a,b). Biofiltration has been recognized as the most promising andcost-efficient technology for treating air streams containingodorous compounds and more practical in meeting statutoryemission regulations (Estrada et al., 2012; Prado et al., 2009; Waniet al., 1997).
Biofilter media selection is critical in biofilter design andperformance. Media environmental and nutritional requirements
Nomenclature
d deviation between the measured and predictedvalue
F gravity force, NL depth of the media, mm number of data setsp pressure, PaT transposeu velocity in the open channel, m/svs superficial velocity of air, m/sYj predicted jth value
Greek symbolsm dynamic viscosity, Pa sr density, kg/m3
εp porositybF Forchheimer drag coefficient, kg/m4
kbr Permeability of the porous medium, m2
V del operator
G.K. Kafle et al. / Journal of Environmental Management 147 (2015) 164e174 165
for microbial growth, i.e., moisture, temperature, and nutrients,must be considered in both selection and management of thebiofilter media. The media must also have a high porosity forminimizing pressure drop across the biofilter, good moistureholding capacity, and a sufficiently long useful life (Mudliar et al.,2010; Chen and Hoff, 2009). The mixture of wood chips andcompost (70:30 to 50:50 on a mass basis) has been recommendedfor use as biofilter media (Nicolai and Janni, 2001). However,special care is needed to screen fine particles from compost/woodchip mixtures to reduce operating static pressure. To maintainreasonable efficiencies, agricultural ventilation fans should be runat pressure drops of less than 60 Pa (Nicolai and Janni, 1998).Using only wood chips or wood barks as biofilter media canreduce the pressure drop without specialty fans (Phillips et al.,1995; Chen et al., 2008; Chen and Hoff, 2012; Andres et al.,2006; Dumont et al., 2014), which results in fewer constructionand operating costs. However, little is known about the perfor-mance of wood-chip/bark biofilters on reduction of malodor andVOCs emitted from swine facilities. Chen et al. (2008) have shownthat the wood-chip/bark-based biofilter media is feasible inreducing odors from swine operation buildings. Meanwhile,maintaining proper moisture content is also critical to the successof wood-chip/bark-based biofilters. This factor is even moreimportant than media depth and residence time (EBRT) for itsoperation (Chen et al., 2008).
Although a number of laboratory scale studies have shown thatbiofilters could be a promising technology for mitigating aerosolemissions from confined swine production facilities, the use of on-farm biofilters continues to be low in the United States. This is duein part to the lack of information pertaining to on-farm biofilterperformance. Thus, this study aimed to investigate the effects ofbiofilter media and MC on the efficiencies of two on-farm down-flow biofilters: biofilter one (BF1) and biofilter two (BF2). The ob-jectives of this research were: (1) to determine the optimumwatersupply rate at different airflow rate conditions; (2) to evaluate theperformance of the biofilters in odor, ammonia (NH3), andhydrogen sulfide (H2S) reduction; (3) to evaluate the effect of mediaMC and media depth on NH3 and H2S reductions; (4) to investigatethe pressure drop characteristics; and (5) to study aerodynamicresistance on biofilters.
2. Materials and methods
2.1. Description of experimental site
This study was conducted at a commercial swine nursery facility,which consisted of four 4.3 m � 12.8 m, 120-head nursing rooms,near Kimberly, Idaho, USA (Fig. 1). Each room had an independenttunnel ventilation system. Air entered the rooms through an inletlocated on the south wall of each room. There were two variablespeed exhaust fans (primary and secondary) in the north wall ofeach room. During this study, only primary fans were in operations.A shallow pit with a depth of 0.6 m was constructed below theslatted floor to collect manure and washing water. Around 60e70%of total volume in the shallow pit was drained to the lagoons every 5days. Small pigs were moved in at about 5e7 kg and were raised toapproximate 64e68 kg at the nursery facility. After the pigs movingout, the room was completely flushed with well water before newsmall pigs were moved in. The two biofilters were installed in thefront of rooms 7 and 8 (N7 and N8) to treat the exhaust air from thefirst stage fans (Multifan, 4E40Q, Schuyler, NE, USA).
2.2. Biofilter construction details
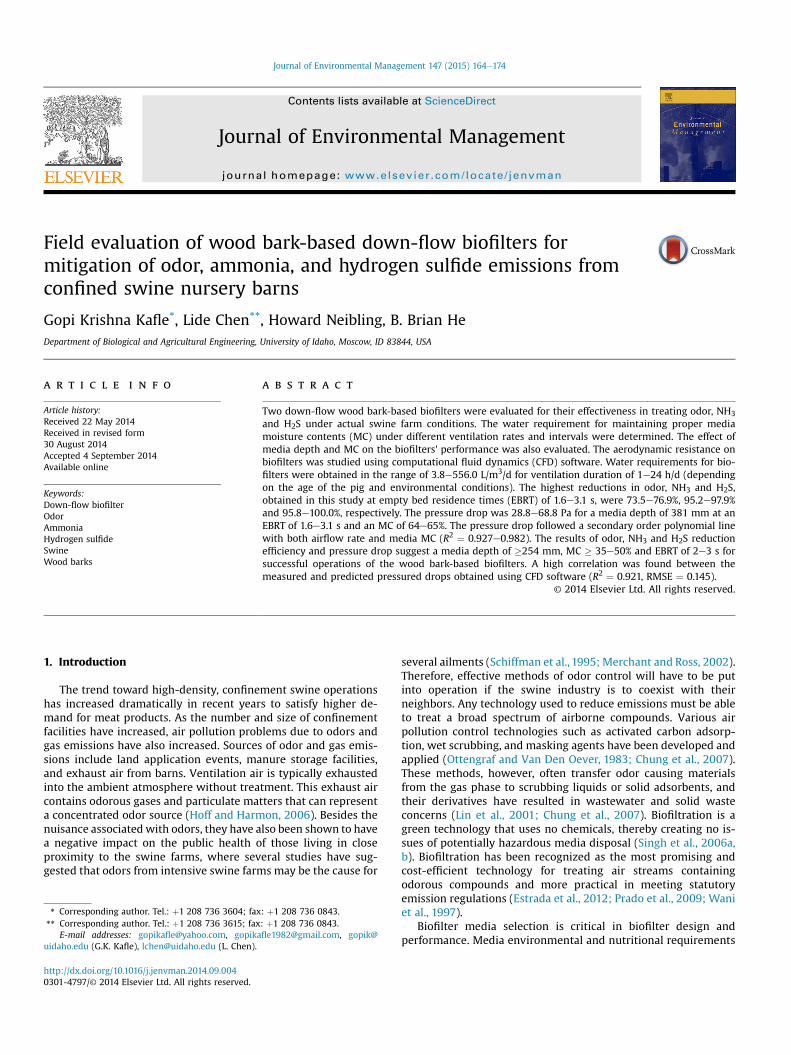
Two vertical down-flow biofilters were designed to treatexhaust air from two of the four nursing rooms in Fig. 1. Thecontaminated air passed through the media in a down-flow di-rection, which allowed easier application of water to the airentrance surface, where dry zones were reported for vertical up-flow biofilters. This arrangement was found to be more efficientthan upward flow in terms of water distribution and filtration ef-ficiency (Arnold et al., 1997).
The biofilters were 2.15 m � 2.26 m in cross-section and 1.22 min height. Both of the biofilters had themedia depth of 381mm. BF1(single stage biofilter) was installed in the front of roomN7 and BF2(two-stage biofilter) was installed in the front of room N8 (Fig. 1).Biofilters were connected to the primary exhaust fan of theirrespective rooms using a rectangular duct made of plywood (Fig. 1).Both biofilters were constructedwith 20mm thick plywood boards.Biofilter plywood room areas were covered with thin metal sheetsto protect them from rainfall (Fig. 1). Metal mesh (10 mm diameterholes) with support on the ground was built to support the biofiltermedia. In BF2, two horizontal metal mesh surfaces were con-structed with a vertical spacing of 381 mm. The interior walls androof of the biofilters were covered with plastic sheets to protect theplywood from sprinkled water. On the bottom of each biofilter, arectangular metal panwas provided to collect the leachate from thebiofilter, which was drained to themanure collecting lagoon by PVCpipes.
Tap water was supplied to the biofilter media via four custom-ized sprinkler heads in each biofilter. Each sprinkler head used adual spray nozzle (Half circle, Model # 12DSH, Rain Bird Corpora-tion, Azusa, CA 91702, USA) to evenly distribute water to the bio-filter media. The water system was controlled using a batteryoperated propagation timer (Model# 6020P/61512, Drip inc. Con-cho, AZ 85924, USA). The water supply pressure was controlledwithin a range of 262e283 kPa by a pressure gauge (Pro Plumber,PP100G, Mansfield, OH 44907, USA). Water was supplied for20e30 s every 15e240 min, depending upon the duration of theexhaust fan operations and environmental conditions. The water-ing time of 20e30 s was based on laboratory tests which showed ittook 20e30 s for water to travel through 381 mm thick wood barkbiofilter media from the top to the bottom. Thus, sprinkling timewas fixed at 20e30 s to minimize biofilter leachate.
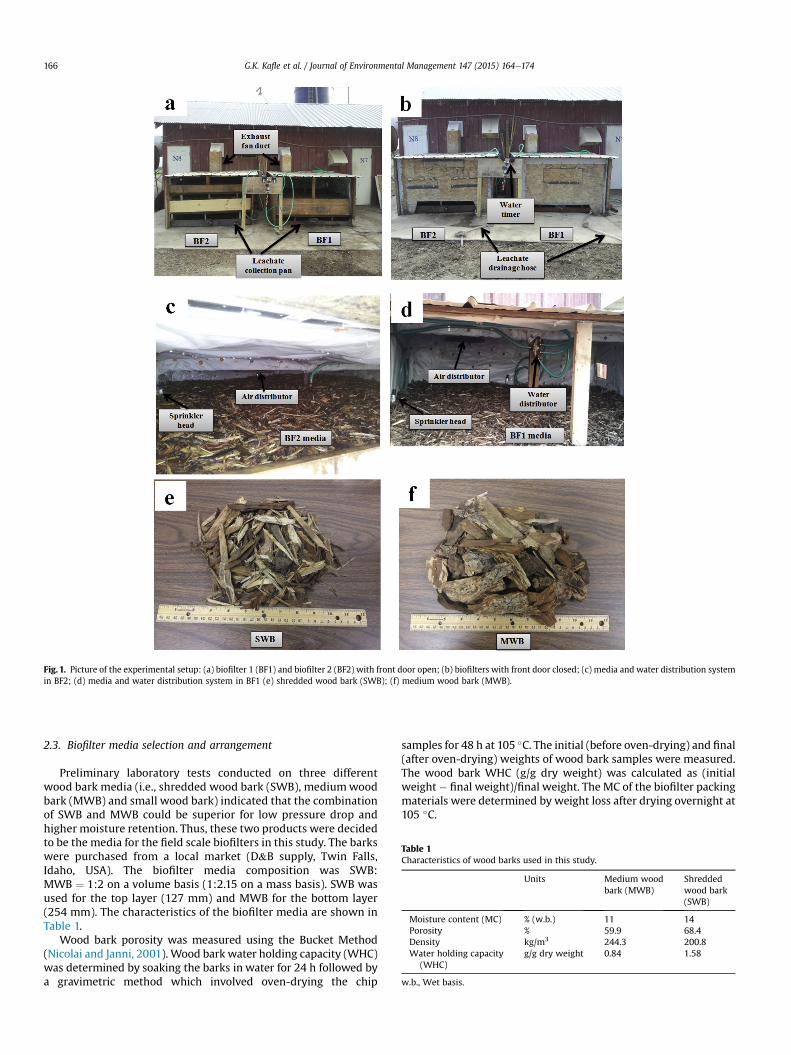
Fig. 1. Picture of the experimental setup: (a) biofilter 1 (BF1) and biofilter 2 (BF2) with front door open; (b) biofilters with front door closed; (c) media and water distribution systemin BF2; (d) media and water distribution system in BF1 (e) shredded wood bark (SWB); (f) medium wood bark (MWB).
Table 1Characteristics of wood barks used in this study.
Units Medium woodbark (MWB)
Shreddedwood bark(SWB)
Moisture content (MC) % (w.b.) 11 14Porosity % 59.9 68.4Density kg/m3 244.3 200.8Water holding capacity
(WHC)g/g dry weight 0.84 1.58
w.b., Wet basis.
G.K. Kafle et al. / Journal of Environmental Management 147 (2015) 164e174166
2.3. Biofilter media selection and arrangement
Preliminary laboratory tests conducted on three differentwood bark media (i.e., shredded wood bark (SWB), mediumwoodbark (MWB) and small wood bark) indicated that the combinationof SWB and MWB could be superior for low pressure drop andhigher moisture retention. Thus, these two products were decidedto be the media for the field scale biofilters in this study. The barkswere purchased from a local market (D&B supply, Twin Falls,Idaho, USA). The biofilter media composition was SWB:MWB ¼ 1:2 on a volume basis (1:2.15 on a mass basis). SWB wasused for the top layer (127 mm) and MWB for the bottom layer(254 mm). The characteristics of the biofilter media are shown inTable 1.
Wood bark porosity was measured using the Bucket Method(Nicolai and Janni, 2001). Wood bark water holding capacity (WHC)was determined by soaking the barks in water for 24 h followed bya gravimetric method which involved oven-drying the chip
samples for 48 h at 105 �C. The initial (before oven-drying) and final(after oven-drying) weights of wood bark samples were measured.The wood bark WHC (g/g dry weight) was calculated as (initialweight � final weight)/final weight. The MC of the biofilter packingmaterials were determined by weight loss after drying overnight at105 �C.
G.K. Kafle et al. / Journal of Environmental Management 147 (2015) 164e174 167
2.4. Gas and odor measurements
Odor samples were collected using 10 L Tedlar bags (SKC Inc.,Eight Four, PA). Two vacuum pumps (224-PCXR3, SKC Inc., EightFour, PA) and vacuum boxes (Vac-U-Chamber, SKC Inc., Eight Four,PA) were used to simultaneously fill the bags from the inlets andoutlets of the biofilter chambers. All samples were analyzed within24 h of collection. A dynamic forced-choice olfactometer (AC'SCENTInternational Olfactometer; St. Croix Sensory, Inc. Stillwater, MN)was used to evaluate odor concentration based on ASTM E679-04(ASTM, 2004). Eight panelists were used for each evaluation. Eachpanelist was screened based on their ability to detect n-butanol inthe 20e80 ppb range as defined by EN13725 (Committee forEuropean Normalization, 2003). Each panelist was given a seriesof presentations at decreasing dilution ratios. At each dilution ratio,a panelist was given one presentation which contains the odor andtwo blank presentations (triangular testing). The panelist mustselect the presentation which is different from the other two anddeclare to the test administrator whether the selection is a “Guess,”“Detection,” or “Recognition,” as defined by ASTM E679-04. TheNH3 and H2S concentrations were measured with detection tubesand a gas sampler (Gastec Co. Ltd.) (Yasuda et al., 2009). Thedetection ranges of the NH3 and H2S gas tubes were0.25e75.00 ppm and 0.05e8.0 ppm, respectively.
2.5. Media sampling and MC analysis
Biofilter media was manually sampled from different depths. InBF1, media samples were collected from depths of 25, 127 and254 mm. In BF2, media samples were collected from 25 to 125 mmin both the first and the second stages. Three replications weretaken from different positions at each collection depth. The mediamoisture content was calculated by taking the average of sampleMC from different depths, and was measured by oven-drying at105 �C for 24 h.
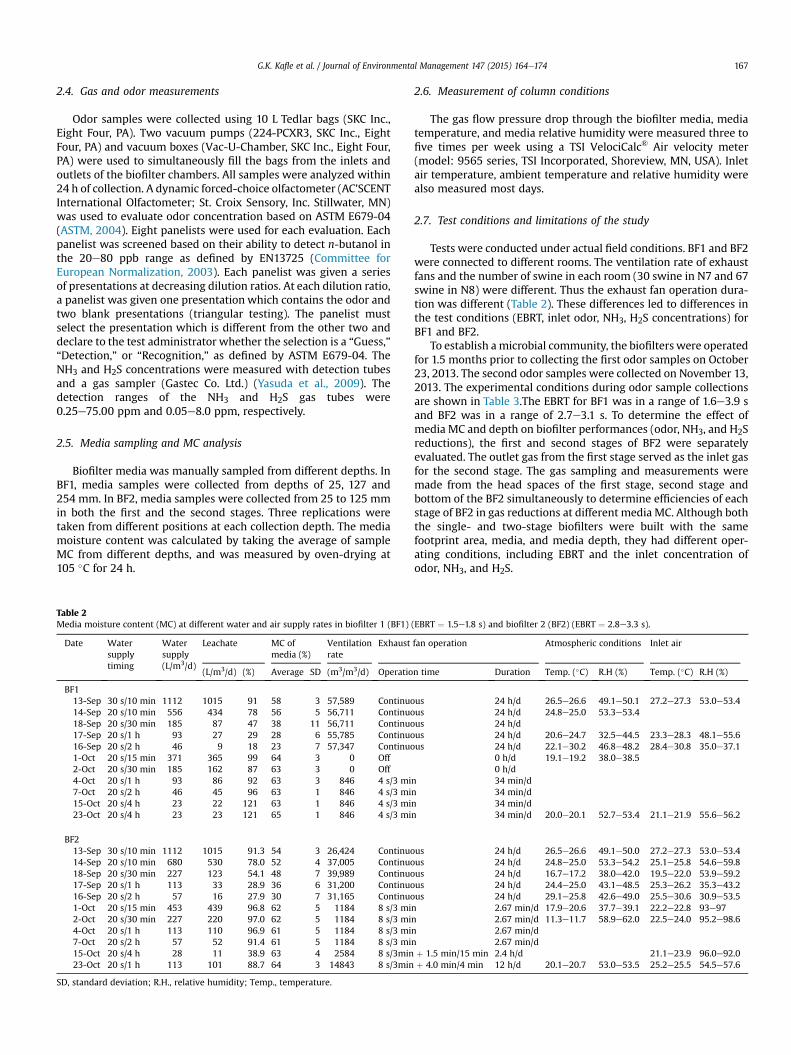
Table 2Media moisture content (MC) at different water and air supply rates in biofilter 1 (BF1)
Date Watersupplytiming
Watersupply(L/m3/d)
Leachate MC ofmedia (%)
Ventilationrate
Exhaust
(L/m3/d) (%) Average SD (m3/m3/d) Operatio
BF113-Sep 30 s/10 min 1112 1015 91 58 3 57,589 Continuo14-Sep 20 s/10 min 556 434 78 56 5 56,711 Continuo18-Sep 20 s/30 min 185 87 47 38 11 56,711 Continuo17-Sep 20 s/1 h 93 27 29 28 6 55,785 Continuo16-Sep 20 s/2 h 46 9 18 23 7 57,347 Continuo1-Oct 20 s/15 min 371 365 99 64 3 0 Off2-Oct 20 s/30 min 185 162 87 63 3 0 Off4-Oct 20 s/1 h 93 86 92 63 3 846 4 s/3 mi7-Oct 20 s/2 h 46 45 96 63 1 846 4 s/3 mi15-Oct 20 s/4 h 23 22 121 63 1 846 4 s/3 mi23-Oct 20 s/4 h 23 23 121 65 1 846 4 s/3 mi
BF213-Sep 30 s/10 min 1112 1015 91.3 54 3 26,424 Continuo14-Sep 20 s/10 min 680 530 78.0 52 4 37,005 Continuo18-Sep 20 s/30 min 227 123 54.1 48 7 39,989 Continuo17-Sep 20 s/1 h 113 33 28.9 36 6 31,200 Continuo16-Sep 20 s/2 h 57 16 27.9 30 7 31,165 Continuo1-Oct 20 s/15 min 453 439 96.8 62 5 1184 8 s/3 mi2-Oct 20 s/30 min 227 220 97.0 62 5 1184 8 s/3 mi4-Oct 20 s/1 h 113 110 96.9 61 5 1184 8 s/3 mi7-Oct 20 s/2 h 57 52 91.4 61 5 1184 8 s/3 mi15-Oct 20 s/4 h 28 11 38.9 63 4 2584 8 s/3min23-Oct 20 s/1 h 113 101 88.7 64 3 14843 8 s/3min
SD, standard deviation; R.H., relative humidity; Temp., temperature.
2.6. Measurement of column conditions
The gas flow pressure drop through the biofilter media, mediatemperature, and media relative humidity were measured three tofive times per week using a TSI VelociCalc® Air velocity meter(model: 9565 series, TSI Incorporated, Shoreview, MN, USA). Inletair temperature, ambient temperature and relative humidity werealso measured most days.
2.7. Test conditions and limitations of the study
Tests were conducted under actual field conditions. BF1 and BF2were connected to different rooms. The ventilation rate of exhaustfans and the number of swine in each room (30 swine in N7 and 67swine in N8) were different. Thus the exhaust fan operation dura-tion was different (Table 2). These differences led to differences inthe test conditions (EBRT, inlet odor, NH3, H2S concentrations) forBF1 and BF2.
To establish amicrobial community, the biofilters were operatedfor 1.5 months prior to collecting the first odor samples on October23, 2013. The second odor samples were collected on November 13,2013. The experimental conditions during odor sample collectionsare shown in Table 3.The EBRT for BF1 was in a range of 1.6e3.9 sand BF2 was in a range of 2.7e3.1 s. To determine the effect ofmedia MC and depth on biofilter performances (odor, NH3, and H2Sreductions), the first and second stages of BF2 were separatelyevaluated. The outlet gas from the first stage served as the inlet gasfor the second stage. The gas sampling and measurements weremade from the head spaces of the first stage, second stage andbottom of the BF2 simultaneously to determine efficiencies of eachstage of BF2 in gas reductions at different media MC. Although boththe single- and two-stage biofilters were built with the samefootprint area, media, and media depth, they had different oper-ating conditions, including EBRT and the inlet concentration ofodor, NH3, and H2S.
(EBRT ¼ 1.5e1.8 s) and biofilter 2 (BF2) (EBRT ¼ 2.8e3.3 s).
fan operation Atmospheric conditions Inlet air
n time Duration Temp. (�C) R.H (%) Temp. (�C) R.H (%)
us 24 h/d 26.5e26.6 49.1e50.1 27.2e27.3 53.0e53.4us 24 h/d 24.8e25.0 53.3e53.4us 24 h/dus 24 h/d 20.6e24.7 32.5e44.5 23.3e28.3 48.1e55.6us 24 h/d 22.1e30.2 46.8e48.2 28.4e30.8 35.0e37.1
0 h/d 19.1e19.2 38.0e38.50 h/d
n 34 min/dn 34 min/dn 34 min/dn 34 min/d 20.0e20.1 52.7e53.4 21.1e21.9 55.6e56.2
us 24 h/d 26.5e26.6 49.1e50.0 27.2e27.3 53.0e53.4us 24 h/d 24.8e25.0 53.3e54.2 25.1e25.8 54.6e59.8us 24 h/d 16.7e17.2 38.0e42.0 19.5e22.0 53.9e59.2us 24 h/d 24.4e25.0 43.1e48.5 25.3e26.2 35.3e43.2us 24 h/d 29.1e25.8 42.6e49.0 25.5e30.6 30.9e53.5n 2.67 min/d 17.9e20.6 37.7e39.1 22.2e22.8 93e97n 2.67 min/d 11.3e11.7 58.9e62.0 22.5e24.0 95.2e98.6n 2.67 min/dn 2.67 min/dþ 1.5 min/15 min 2.4 h/d 21.1e23.9 96.0e92.0þ 4.0 min/4 min 12 h/d 20.1e20.7 53.0e53.5 25.2e25.5 54.5e57.6
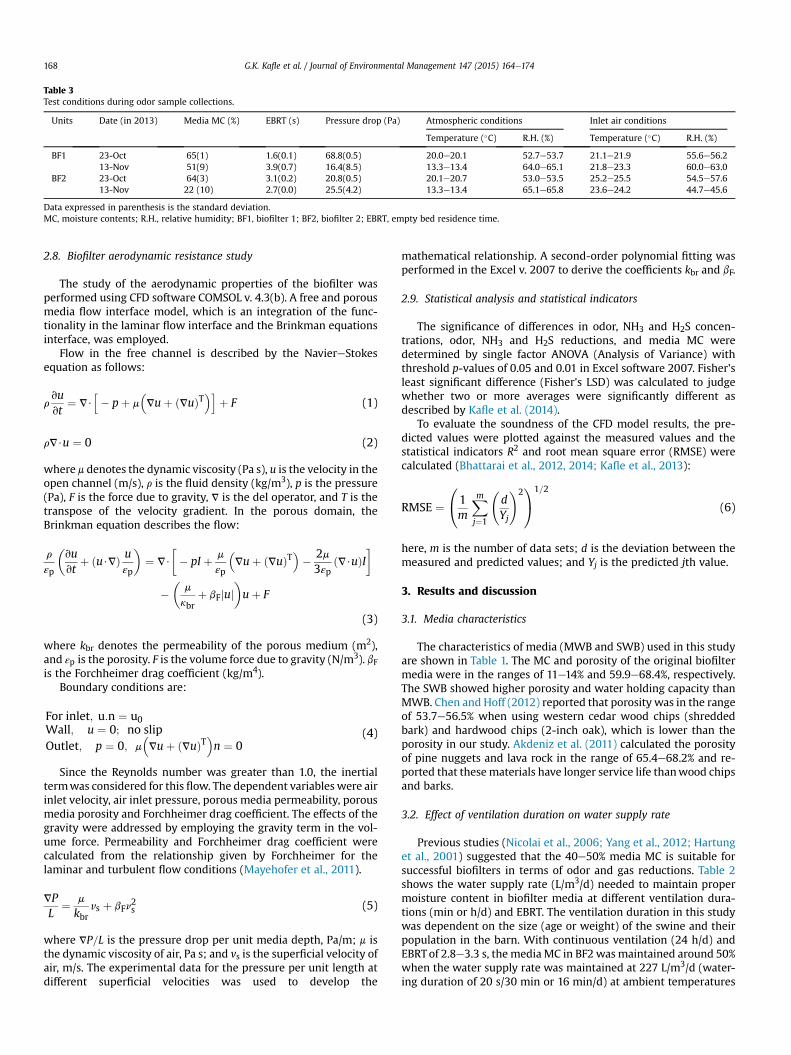
Table 3Test conditions during odor sample collections.
Units Date (in 2013) Media MC (%) EBRT (s) Pressure drop (Pa) Atmospheric conditions Inlet air conditions
Temperature (�C) R.H. (%) Temperature (�C) R.H. (%)
BF1 23-Oct 65(1) 1.6(0.1) 68.8(0.5) 20.0e20.1 52.7e53.7 21.1e21.9 55.6e56.213-Nov 51(9) 3.9(0.7) 16.4(8.5) 13.3e13.4 64.0e65.1 21.8e23.3 60.0e63.0
BF2 23-Oct 64(3) 3.1(0.2) 20.8(0.5) 20.1e20.7 53.0e53.5 25.2e25.5 54.5e57.613-Nov 22 (10) 2.7(0.0) 25.5(4.2) 13.3e13.4 65.1e65.8 23.6e24.2 44.7e45.6
Data expressed in parenthesis is the standard deviation.MC, moisture contents; R.H., relative humidity; BF1, biofilter 1; BF2, biofilter 2; EBRT, empty bed residence time.
G.K. Kafle et al. / Journal of Environmental Management 147 (2015) 164e174168
2.8. Biofilter aerodynamic resistance study
The study of the aerodynamic properties of the biofilter wasperformed using CFD software COMSOL v. 4.3(b). A free and porousmedia flow interface model, which is an integration of the func-tionality in the laminar flow interface and the Brinkman equationsinterface, was employed.
Flow in the free channel is described by the NaviereStokesequation as follows:
rvuvt
¼ V$h� pþ m
�Vuþ ðVuÞT
�iþ F (1)
rV$u ¼ 0 (2)
where m denotes the dynamic viscosity (Pa s), u is the velocity in theopen channel (m/s), r is the fluid density (kg/m3), p is the pressure(Pa), F is the force due to gravity, V is the del operator, and T is thetranspose of the velocity gradient. In the porous domain, theBrinkman equation describes the flow:
r
εp
�vuvt
þ ðu$VÞ uεp
�¼ V$
�� pI þ m
εp
�Vuþ ðVuÞT
�� 2m3εp
ðV$uÞI�
��
m
kbrþ bFjuj
�uþ F
(3)
where kbr denotes the permeability of the porous medium (m2),and εp is the porosity. F is the volume force due to gravity (N/m3). bFis the Forchheimer drag coefficient (kg/m4).
Boundary conditions are:
For inlet; u:n ¼ u0Wall; u ¼ 0; no slipOutlet; p ¼ 0; m
�Vuþ ðVuÞT
�n ¼ 0
(4)
Since the Reynolds number was greater than 1.0, the inertialtermwas considered for this flow. The dependent variables were airinlet velocity, air inlet pressure, porous media permeability, porousmedia porosity and Forchheimer drag coefficient. The effects of thegravity were addressed by employing the gravity term in the vol-ume force. Permeability and Forchheimer drag coefficient werecalculated from the relationship given by Forchheimer for thelaminar and turbulent flow conditions (Mayehofer et al., 2011).
VPL
¼ m
kbrvs þ bFn
2s (5)
where VP=L is the pressure drop per unit media depth, Pa/m; m isthe dynamic viscosity of air, Pa s; and vs is the superficial velocity ofair, m/s. The experimental data for the pressure per unit length atdifferent superficial velocities was used to develop the
mathematical relationship. A second-order polynomial fitting wasperformed in the Excel v. 2007 to derive the coefficients kbr and bF.
2.9. Statistical analysis and statistical indicators
The significance of differences in odor, NH3 and H2S concen-trations, odor, NH3 and H2S reductions, and media MC weredetermined by single factor ANOVA (Analysis of Variance) withthreshold p-values of 0.05 and 0.01 in Excel software 2007. Fisher'sleast significant difference (Fisher's LSD) was calculated to judgewhether two or more averages were significantly different asdescribed by Kafle et al. (2014).
To evaluate the soundness of the CFD model results, the pre-dicted values were plotted against the measured values and thestatistical indicators R2 and root mean square error (RMSE) werecalculated (Bhattarai et al., 2012, 2014; Kafle et al., 2013):
RMSE ¼0@1m
Xmj¼1
dYj
!21A1=2
(6)
here, m is the number of data sets; d is the deviation between themeasured and predicted values; and Yj is the predicted jth value.
3. Results and discussion
3.1. Media characteristics
The characteristics of media (MWB and SWB) used in this studyare shown in Table 1. The MC and porosity of the original biofiltermedia were in the ranges of 11e14% and 59.9e68.4%, respectively.The SWB showed higher porosity and water holding capacity thanMWB. Chen and Hoff (2012) reported that porosity was in the rangeof 53.7e56.5% when using western cedar wood chips (shreddedbark) and hardwood chips (2-inch oak), which is lower than theporosity in our study. Akdeniz et al. (2011) calculated the porosityof pine nuggets and lava rock in the range of 65.4e68.2% and re-ported that thesematerials have longer service life thanwood chipsand barks.
3.2. Effect of ventilation duration on water supply rate
Previous studies (Nicolai et al., 2006; Yang et al., 2012; Hartunget al., 2001) suggested that the 40e50% media MC is suitable forsuccessful biofilters in terms of odor and gas reductions. Table 2shows the water supply rate (L/m3/d) needed to maintain propermoisture content in biofilter media at different ventilation dura-tions (min or h/d) and EBRT. The ventilation duration in this studywas dependent on the size (age or weight) of the swine and theirpopulation in the barn. With continuous ventilation (24 h/d) andEBRTof 2.8e3.3 s, the media MC in BF2 wasmaintained around 50%when the water supply rate was maintained at 227 L/m3/d (water-ing duration of 20 s/30 min or 16 min/d) at ambient temperatures
G.K. Kafle et al. / Journal of Environmental Management 147 (2015) 164e174 169
of 24.8e25.0 �C. At this water supply rate, the leachate from BF2was around 54% of the supply. At ventilation duration of 12 h/d and2.4 h/d, water supply rates of 113 and 28 L/m3/d were found suf-ficient to maintain the media MC above 50%.
With continuous ventilation and EBRT of 1.5e1.8 s, the mediaMC in BF1 was maintained above 50% (i.e., 56%) when the watersupply ratewas maintained at a 556 L/m3/d (water supply timing of20 s/10 min or 48 min/d), at 24.8e25.0 �C. These results showedthat under continuous ventilation (24 h/d) the water supply rateneeds to be doubled to maintain the same media MC when EBRTwas reduced by 50%.When ventilation durationwas less than 1 h/d,the water supply rate of 3.8e4.6 L/m3/d was found sufficient tomaintain media MC > 50e60%. Statistical analysis showed no sig-nificant difference in the averagemediaMCwhenwater supply rateranged from 227 to 556 L/m3/d for continuous ventilation at theEBRT range of 1.5e3.3 s; however, the stepwise reduction in watersupply rate below 227 L/m3/d showed significant decrease in mediaMC for each drop in water supply rate (Tables 2 and 4). When theexhaust fan was operated less than 1 h/d no significant differencewas found in media MC for water supply rate in the range of23e453 L/m3/d at EBRT of 1.5e3.3 s. Thus, results indicate thatmedia moisture removal rate (drying rate) increases with an in-crease in ventilation duration and decrease in EBRT (or increase inairflow rate). Thus, based on the ventilation duration and EBRT,water supply rate needs to be adjusted to meet the required mediaMC. Lim et al. (2012)maintainedMC of thewood chips basedmedia(127e254 mm depth) in the range of 40e64% when using a watersystem with four-nozzles that supplied water for 3e5 min/3e4 h(i.e, 24e30 min/d) at an EBRT of 0.3e0.6 s. Chen and Hoff (2012)recommended a water supply of 85.5 L/m3/d (4.8 min/d, 9 s onand 45 min off) for wood chip media based biofilters (media depth380 mm) to maintain high and stable moisture contents (50e70%)with minimum leachate at EBRT of 3.1e5.5 s.
3.3. Odor and gas reductions
The untreated (inlet) and treated (outlet) odor concentrations,NH3 and H2S concentrations and their removal percent in BF1 andBF2 under the maximum possible average MC (64e65%), averagemedium MC (51%) and average low MC (22%) are shown in Fig. 2aand b, respectively. The average MC at different media depths ofBF1 and BF2 are also shown in Fig. 2. The MC levels were namedbased on the Nicolai and Janni (2001) study, i.e., low MC(10e35% w.b.), medium MC (35e55% w.b.), and high MC(55e65% w.b.). The average inlet odor concentrations from BF1 andBF2 were in the range of 2958e4432 OUE/m3 and 2853e3770 OUE/m3, respectively. The odor concentrations of the treated gas weresignificantly lower (p < 0.01) than untreated gas for both BF1 andBF2 (Table 4). Statistical analysis did not show significant differ-ences in the outlet odor concentrations from BF1 and BF2. Amongthe three levels of MC, the highest odor, NH3 and H2S reductions
Table 4Results of statistical analysis.
Parameter Units LSD p-Value
a ¼ 0.05 a ¼ 0.01
H2S reductions % 3.9 5.2 1.38752E�48NH3 reductions % 8.0 11.0 3.10738E�25Odor reductions % 7.1 10.0 0.000140364Odor concentration OUE/m3 607.0 793.0 3.11516E�06NH3 concentrations ppm 0.65 0.86 4.71E�38H2S concentrations ppm 0.29 0.38 4.9242E�36Media moisture contents % 5 6 4.54994E�65
LSD, least significant difference.
were found with the highest MC (64e65%). The highest odor, NH3and H2S reductions obtained in this study at an EBRT of 1.6e3.1 swere 73.5e76.9%, 95.2e97.9% and 95.8e100.0%, respectively(Fig. 2). Statistically, no significant differences were found in re-ductions of odor, NH3 and H2S from both BF1 and BF2 at the highrange of media MC (Table 4). Similar to this study, Chen et al. (2009)achieved the highest odor removal efficiency of 67.3% at theirhighest MC of 60% when using a hardwood media based biofilter(EBRT¼ 1.6 s). In contrast, Lau and Cheng (2007) reported very highodor removal efficiency (95%) compared to that in our study; thisdifference may be due to higher inlet odor concentration(8553e12,171 OUE/m3). The inlet odor concentration had a bigimpact on odor reduction because the odor concentration after thebiofilter remained constant thus the higher the inlet odor con-centration was, the higher the efficiency of the odor reduction wasachieved. Hartung et al. (2001) reported a higher odor removalefficiency (78e80%) than that in our study; however, NH3 removalefficiency was very low (15e36%) at mediaMC of 40e50%. Sheridanet al. (2002) reported that the odor and ammonia removal effi-ciencies ranged from 77 to 95% and 54e93%, respectively, whenusing wood chips as the media (500 mm depth) at an MC of64e69%. Similar to our study, Morgan-Sagastume et al. (2003a)reported H2S removal in the range of 90e100% for a compost-based biofilter.
The test results for BF1 showed no significant increase in odor,NH3 and H2S reductions with an increase in media MC from themedium range (51%) to the high range (65%). The results from BF1also showed that the reduced EBRT (from 3.9 s to 1.6 s) showed nosignificant differences (p < 0.01) in odor, NH3 and H2S reductions ifMC is maintained in the high range. Similarly, the test results forBF2 showed that at similar EBRTs (2.7e3.1 s), the biofilter perfor-mance on reductions in odor, NH3 and H2S were significantlyreduced (p < 0.01) when average MC changed from high (64%) tolow (22%). Although the BF2 performance was significantlydecreased (p < 0.01) at the low range of media MC, the odor, NH3and H2S reductions in BF2 were >69.0%, which was unexpected.Fig. 2b shows that the MC at different media depths in BF2 was inthe range of 15e23% for depths of 25e152 mm, but the MCwas 37%at a depth of 254 mm and >40% at a depth of 381 mm (bottom ofBF2). These results, show that a media depth of 127e254 mm couldbe adequate to maintain higher reduction efficiencies (>69.0%) ifthe media MC is maintained in the high range (55e65%) for woodbark-based biofilters.
3.4. Effects of media depth and MC on NH3 and H2S reductions
Figs. 3 and 4 show the NH3 and H2S reductions from the firststage of BF2 (SWB-127 mm) with EBRT of 0.9e1.0 s and the secondstage of BF2 (MWB-254 mm) with EBRT of 1.8e2.0s at differentmedia MC, respectively. The first stage of BF2 with 127 mm SWBshowed NH3 and H2S reductions in the range of 56.1e84.2% and65.2e99.0%, respectively, when MC was maintained in the highrange. But decreasing the media MC to the low range resulted inlower reductions or negative reductions for both for both NH3
(�22.4 to 6.7%) and H2S (�13.0 to 14.4%) at EBRTof 0.9e1.0 s (Fig. 3aand b). More research is needed to determine the cause of the lowand negative NH3 and H2S reductions at low moisture contents.Similar to our findings, Nicolai and Janni (2001) and Martinec et al.(2000) also reported negative gas reductions when biofilters wereoperated at low MC. The second stage of BF2 with 254 mm MWBshowed NH3 reductions in the range of 81.5e89.2%, 89.2e96% and53.7e92.8% for the high, medium and low MC ranges, respectively(Fig. 4a and b). Similarly, H2S reductions were in the range of77.5e100%, 79.1e96.7% and 14.2e69.5% for the high, medium andlow MC ranges, respectively. The second stage of BF2 with 254 mm
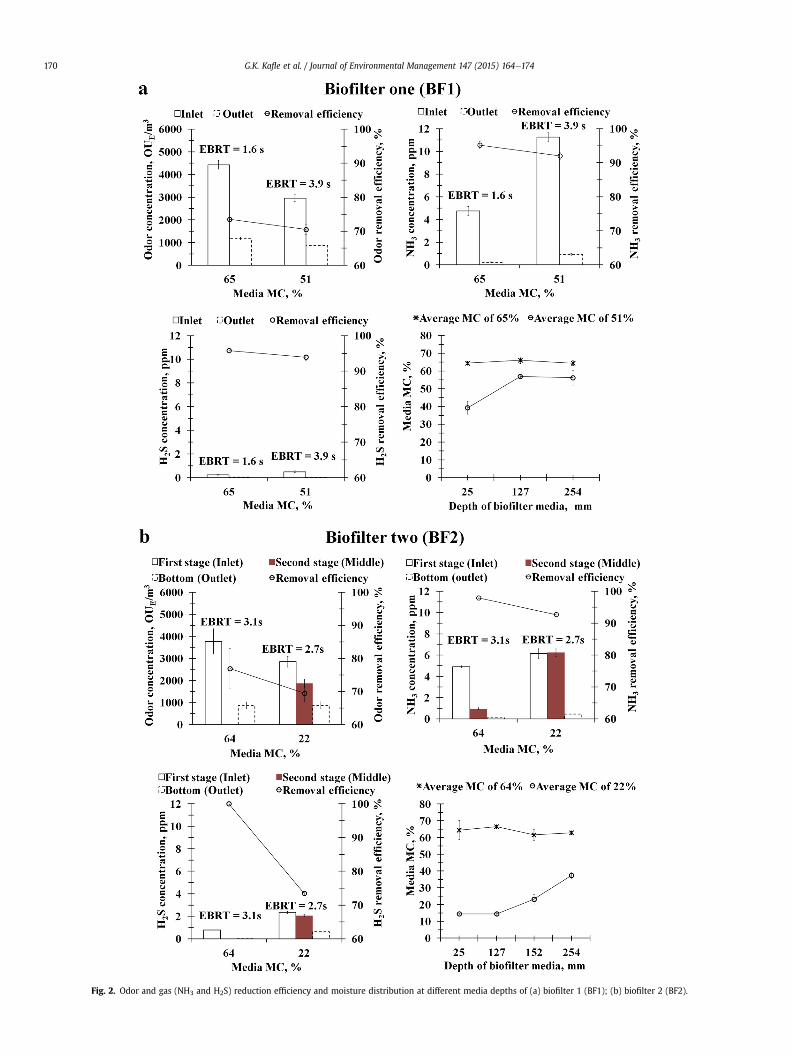
Fig. 2. Odor and gas (NH3 and H2S) reduction efficiency and moisture distribution at different media depths of (a) biofilter 1 (BF1); (b) biofilter 2 (BF2).
G.K. Kafle et al. / Journal of Environmental Management 147 (2015) 164e174170
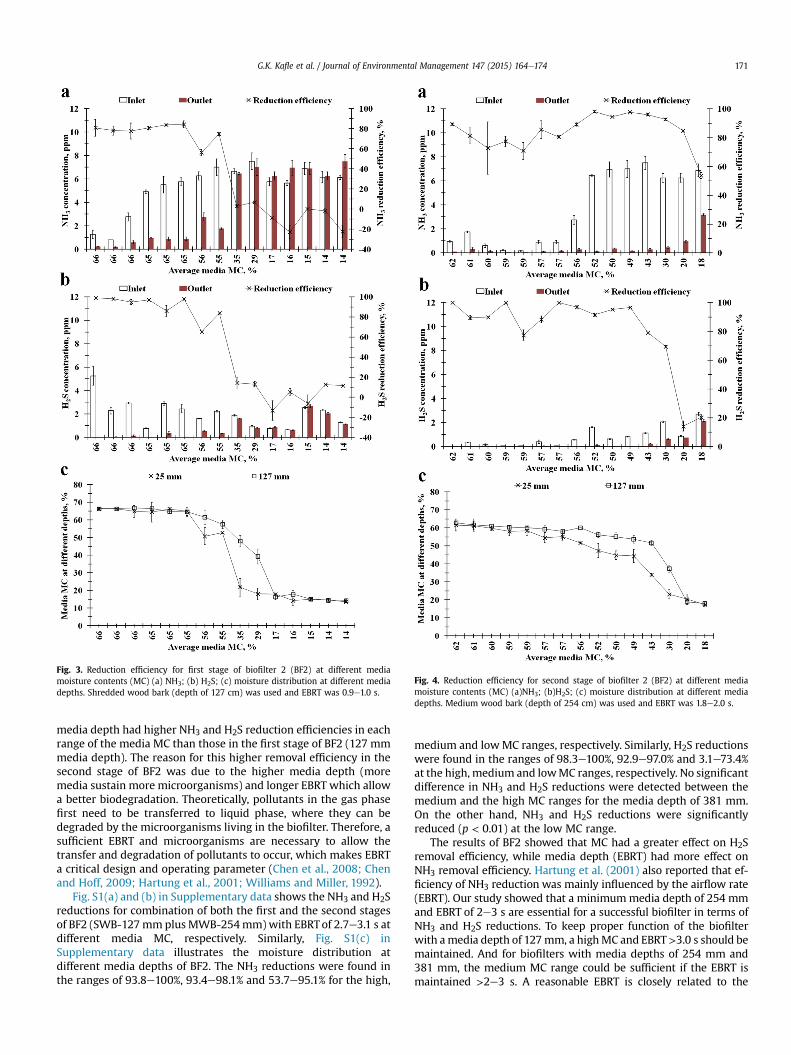
Fig. 3. Reduction efficiency for first stage of biofilter 2 (BF2) at different mediamoisture contents (MC) (a) NH3; (b) H2S; (c) moisture distribution at different mediadepths. Shredded wood bark (depth of 127 cm) was used and EBRT was 0.9e1.0 s.
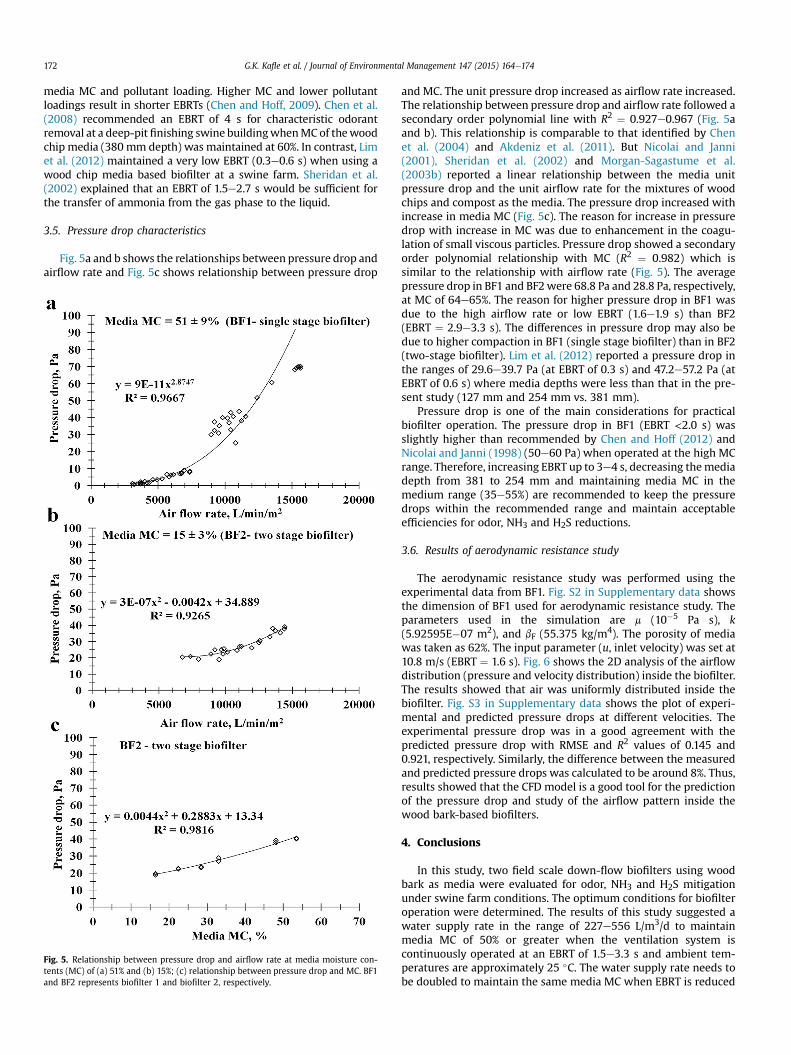
Fig. 4. Reduction efficiency for second stage of biofilter 2 (BF2) at different mediamoisture contents (MC) (a)NH3; (b)H2S; (c) moisture distribution at different mediadepths. Medium wood bark (depth of 254 cm) was used and EBRT was 1.8e2.0 s.
G.K. Kafle et al. / Journal of Environmental Management 147 (2015) 164e174 171
media depth had higher NH3 and H2S reduction efficiencies in eachrange of the media MC than those in the first stage of BF2 (127 mmmedia depth). The reason for this higher removal efficiency in thesecond stage of BF2 was due to the higher media depth (moremedia sustain more microorganisms) and longer EBRT which allowa better biodegradation. Theoretically, pollutants in the gas phasefirst need to be transferred to liquid phase, where they can bedegraded by the microorganisms living in the biofilter. Therefore, asufficient EBRT and microorganisms are necessary to allow thetransfer and degradation of pollutants to occur, which makes EBRTa critical design and operating parameter (Chen et al., 2008; Chenand Hoff, 2009; Hartung et al., 2001; Williams and Miller, 1992).
Fig. S1(a) and (b) in Supplementary data shows the NH3 and H2Sreductions for combination of both the first and the second stagesof BF2 (SWB-127mmplus MWB-254mm)with EBRTof 2.7e3.1 s atdifferent media MC, respectively. Similarly, Fig. S1(c) inSupplementary data illustrates the moisture distribution atdifferent media depths of BF2. The NH3 reductions were found inthe ranges of 93.8e100%, 93.4e98.1% and 53.7e95.1% for the high,
medium and lowMC ranges, respectively. Similarly, H2S reductionswere found in the ranges of 98.3e100%, 92.9e97.0% and 3.1e73.4%at the high, medium and lowMC ranges, respectively. No significantdifference in NH3 and H2S reductions were detected between themedium and the high MC ranges for the media depth of 381 mm.On the other hand, NH3 and H2S reductions were significantlyreduced (p < 0.01) at the low MC range.
The results of BF2 showed that MC had a greater effect on H2Sremoval efficiency, while media depth (EBRT) had more effect onNH3 removal efficiency. Hartung et al. (2001) also reported that ef-ficiency of NH3 reduction was mainly influenced by the airflow rate(EBRT). Our study showed that a minimummedia depth of 254 mmand EBRT of 2e3 s are essential for a successful biofilter in terms ofNH3 and H2S reductions. To keep proper function of the biofilterwith amedia depth of 127mm, a highMC and EBRT>3.0 s should bemaintained. And for biofilters with media depths of 254 mm and381 mm, the medium MC range could be sufficient if the EBRT ismaintained >2e3 s. A reasonable EBRT is closely related to the
G.K. Kafle et al. / Journal of Environmental Management 147 (2015) 164e174172
media MC and pollutant loading. Higher MC and lower pollutantloadings result in shorter EBRTs (Chen and Hoff, 2009). Chen et al.(2008) recommended an EBRT of 4 s for characteristic odorantremoval at a deep-pit finishing swine buildingwhenMCof thewoodchip media (380 mm depth) was maintained at 60%. In contrast, Limet al. (2012) maintained a very low EBRT (0.3e0.6 s) when using awood chip media based biofilter at a swine farm. Sheridan et al.(2002) explained that an EBRT of 1.5e2.7 s would be sufficient forthe transfer of ammonia from the gas phase to the liquid.
3.5. Pressure drop characteristics
Fig. 5a and b shows the relationships between pressure drop andairflow rate and Fig. 5c shows relationship between pressure drop
Fig. 5. Relationship between pressure drop and airflow rate at media moisture con-tents (MC) of (a) 51% and (b) 15%; (c) relationship between pressure drop and MC. BF1and BF2 represents biofilter 1 and biofilter 2, respectively.
and MC. The unit pressure drop increased as airflow rate increased.The relationship between pressure drop and airflow rate followed asecondary order polynomial line with R2 ¼ 0.927e0.967 (Fig. 5aand b). This relationship is comparable to that identified by Chenet al. (2004) and Akdeniz et al. (2011). But Nicolai and Janni(2001), Sheridan et al. (2002) and Morgan-Sagastume et al.(2003b) reported a linear relationship between the media unitpressure drop and the unit airflow rate for the mixtures of woodchips and compost as the media. The pressure drop increased withincrease in media MC (Fig. 5c). The reason for increase in pressuredrop with increase in MC was due to enhancement in the coagu-lation of small viscous particles. Pressure drop showed a secondaryorder polynomial relationship with MC (R2 ¼ 0.982) which issimilar to the relationship with airflow rate (Fig. 5). The averagepressure drop in BF1 and BF2were 68.8 Pa and 28.8 Pa, respectively,at MC of 64e65%. The reason for higher pressure drop in BF1 wasdue to the high airflow rate or low EBRT (1.6e1.9 s) than BF2(EBRT ¼ 2.9e3.3 s). The differences in pressure drop may also bedue to higher compaction in BF1 (single stage biofilter) than in BF2(two-stage biofilter). Lim et al. (2012) reported a pressure drop inthe ranges of 29.6e39.7 Pa (at EBRT of 0.3 s) and 47.2e57.2 Pa (atEBRT of 0.6 s) where media depths were less than that in the pre-sent study (127 mm and 254 mm vs. 381 mm).
Pressure drop is one of the main considerations for practicalbiofilter operation. The pressure drop in BF1 (EBRT <2.0 s) wasslightly higher than recommended by Chen and Hoff (2012) andNicolai and Janni (1998) (50e60 Pa) when operated at the high MCrange. Therefore, increasing EBRT up to 3e4 s, decreasing themediadepth from 381 to 254 mm and maintaining media MC in themedium range (35e55%) are recommended to keep the pressuredrops within the recommended range and maintain acceptableefficiencies for odor, NH3 and H2S reductions.
3.6. Results of aerodynamic resistance study
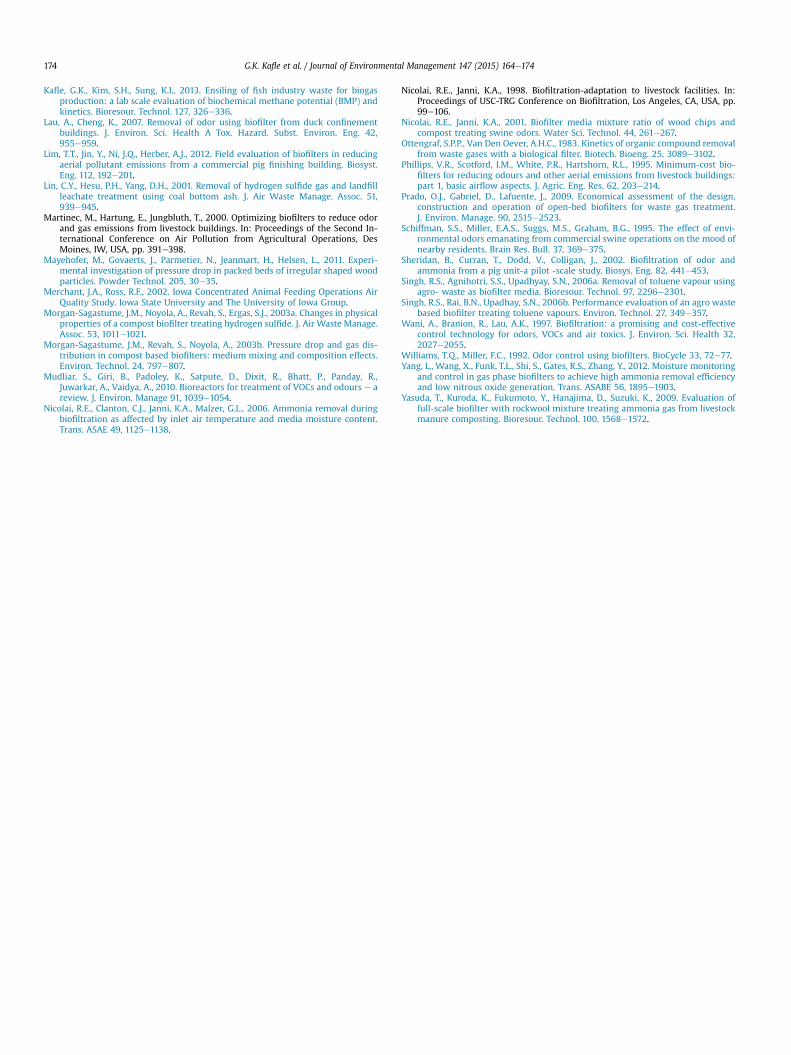
The aerodynamic resistance study was performed using theexperimental data from BF1. Fig. S2 in Supplementary data showsthe dimension of BF1 used for aerodynamic resistance study. Theparameters used in the simulation are m (10�5 Pa s), k(5.92595E�07 m2), and bF (55.375 kg/m4). The porosity of mediawas taken as 62%. The input parameter (u, inlet velocity) was set at10.8 m/s (EBRT ¼ 1.6 s). Fig. 6 shows the 2D analysis of the airflowdistribution (pressure and velocity distribution) inside the biofilter.The results showed that air was uniformly distributed inside thebiofilter. Fig. S3 in Supplementary data shows the plot of experi-mental and predicted pressure drops at different velocities. Theexperimental pressure drop was in a good agreement with thepredicted pressure drop with RMSE and R2 values of 0.145 and0.921, respectively. Similarly, the difference between the measuredand predicted pressure drops was calculated to be around 8%. Thus,results showed that the CFD model is a good tool for the predictionof the pressure drop and study of the airflow pattern inside thewood bark-based biofilters.
4. Conclusions
In this study, two field scale down-flow biofilters using woodbark as media were evaluated for odor, NH3 and H2S mitigationunder swine farm conditions. The optimum conditions for biofilteroperation were determined. The results of this study suggested awater supply rate in the range of 227e556 L/m3/d to maintainmedia MC of 50% or greater when the ventilation system iscontinuously operated at an EBRT of 1.5e3.3 s and ambient tem-peratures are approximately 25 �C. The water supply rate needs tobe doubled to maintain the same media MC when EBRT is reduced
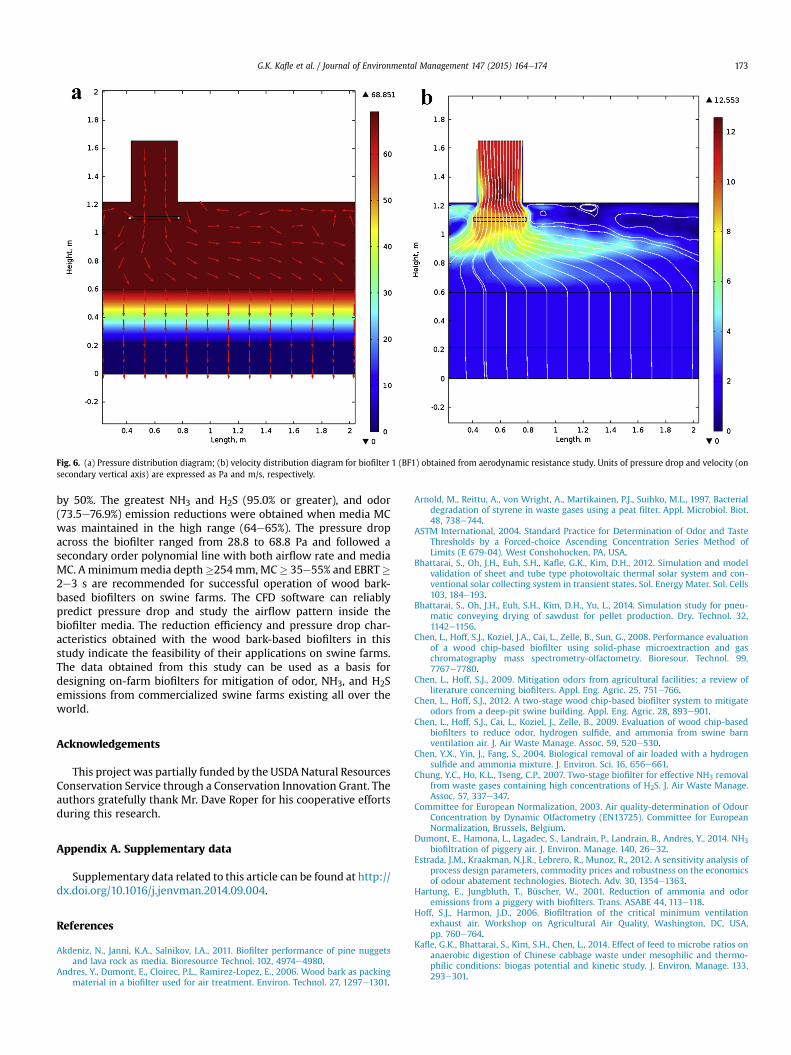
Fig. 6. (a) Pressure distribution diagram; (b) velocity distribution diagram for biofilter 1 (BF1) obtained from aerodynamic resistance study. Units of pressure drop and velocity (onsecondary vertical axis) are expressed as Pa and m/s, respectively.
G.K. Kafle et al. / Journal of Environmental Management 147 (2015) 164e174 173
by 50%. The greatest NH3 and H2S (95.0% or greater), and odor(73.5e76.9%) emission reductions were obtained when media MCwas maintained in the high range (64e65%). The pressure dropacross the biofilter ranged from 28.8 to 68.8 Pa and followed asecondary order polynomial line with both airflow rate and mediaMC. Aminimummedia depth�254mm,MC� 35e55% and EBRT�2e3 s are recommended for successful operation of wood bark-based biofilters on swine farms. The CFD software can reliablypredict pressure drop and study the airflow pattern inside thebiofilter media. The reduction efficiency and pressure drop char-acteristics obtained with the wood bark-based biofilters in thisstudy indicate the feasibility of their applications on swine farms.The data obtained from this study can be used as a basis fordesigning on-farm biofilters for mitigation of odor, NH3, and H2Semissions from commercialized swine farms existing all over theworld.
Acknowledgements
This project was partially funded by the USDANatural ResourcesConservation Service through a Conservation Innovation Grant. Theauthors gratefully thank Mr. Dave Roper for his cooperative effortsduring this research.
Appendix A. Supplementary data
Supplementary data related to this article can be found at http://dx.doi.org/10.1016/j.jenvman.2014.09.004.
References
Akdeniz, N., Janni, K.A., Salnikov, I.A., 2011. Biofilter performance of pine nuggetsand lava rock as media. Bioresource Technol. 102, 4974e4980.
Andres, Y., Dumont, E., Cloirec, P.L., Ramirez-Lopez, E., 2006. Wood bark as packingmaterial in a biofilter used for air treatment. Environ. Technol. 27, 1297e1301.
Arnold, M., Reittu, A., von Wright, A., Martikainen, P.J., Suihko, M.L., 1997. Bacterialdegradation of styrene in waste gases using a peat filter. Appl. Microbiol. Biot.48, 738e744.
ASTM International, 2004. Standard Practice for Determination of Odor and TasteThresholds by a Forced-choice Ascending Concentration Series Method ofLimits (E 679-04). West Conshohocken, PA, USA.
Bhattarai, S., Oh, J.H., Euh, S.H., Kafle, G.K., Kim, D.H., 2012. Simulation and modelvalidation of sheet and tube type photovoltaic thermal solar system and con-ventional solar collecting system in transient states. Sol. Energy Mater. Sol. Cells103, 184e193.
Bhattarai, S., Oh, J.H., Euh, S.H., Kim, D.H., Yu, L., 2014. Simulation study for pneu-matic conveying drying of sawdust for pellet production. Dry. Technol. 32,1142e1156.
Chen, L., Hoff, S.J., Koziel, J.A., Cai, L., Zelle, B., Sun, G., 2008. Performance evaluationof a wood chip-based biofilter using solid-phase microextraction and gaschromatography mass spectrometry-olfactometry. Bioresour. Technol. 99,7767e7780.
Chen, L., Hoff, S.J., 2009. Mitigation odors from agricultural facilities: a review ofliterature concerning biofilters. Appl. Eng. Agric. 25, 751e766.
Chen, L., Hoff, S.J., 2012. A two-stage wood chip-based biofilter system to mitigateodors from a deep-pit swine building. Appl. Eng. Agric. 28, 893e901.
Chen, L., Hoff, S.J., Cai, L., Koziel, J., Zelle, B., 2009. Evaluation of wood chip-basedbiofilters to reduce odor, hydrogen sulfide, and ammonia from swine barnventilation air. J. Air Waste Manage. Assoc. 59, 520e530.
Chen, Y.X., Yin, J., Fang, S., 2004. Biological removal of air loaded with a hydrogensulfide and ammonia mixture. J. Environ. Sci. 16, 656e661.
Chung, Y.C., Ho, K.L., Tseng, C.P., 2007. Two-stage biofilter for effective NH3 removalfrom waste gases containing high concentrations of H2S. J. Air Waste Manage.Assoc. 57, 337e347.
Committee for European Normalization, 2003. Air quality-determination of OdourConcentration by Dynamic Olfactometry (EN13725). Committee for EuropeanNormalization, Brussels, Belgium.
Dumont, E., Hamona, L., Lagadec, S., Landrain, P., Landrain, B., Andr�es, Y., 2014. NH3biofiltration of piggery air. J. Environ. Manage. 140, 26e32.
Estrada, J.M., Kraakman, N.J.R., Lebrero, R., Munoz, R., 2012. A sensitivity analysis ofprocess design parameters, commodity prices and robustness on the economicsof odour abatement technologies. Biotech. Adv. 30, 1354e1363.
Hartung, E., Jungbluth, T., Büscher, W., 2001. Reduction of ammonia and odoremissions from a piggery with biofilters. Trans. ASABE 44, 113e118.
Hoff, S.J., Harmon, J.D., 2006. Biofiltration of the critical minimum ventilationexhaust air. Workshop on Agricultural Air Quality, Washington, DC, USA,pp. 760e764.
Kafle, G.K., Bhattarai, S., Kim, S.H., Chen, L., 2014. Effect of feed to microbe ratios onanaerobic digestion of Chinese cabbage waste under mesophilic and thermo-philic conditions: biogas potential and kinetic study. J. Environ. Manage. 133,293e301.
G.K. Kafle et al. / Journal of Environmental Management 147 (2015) 164e174174
Kafle, G.K., Kim, S.H., Sung, K.I., 2013. Ensiling of fish industry waste for biogasproduction: a lab scale evaluation of biochemical methane potential (BMP) andkinetics. Bioresour. Technol. 127, 326e336.
Lau, A., Cheng, K., 2007. Removal of odor using biofilter from duck confinementbuildings. J. Environ. Sci. Health A Tox. Hazard. Subst. Environ. Eng. 42,955e959.
Lim, T.T., Jin, Y., Ni, J.Q., Herber, A.J., 2012. Field evaluation of biofilters in reducingaerial pollutant emissions from a commercial pig finishing building. Biosyst.Eng. 112, 192e201.
Lin, C.Y., Hesu, P.H., Yang, D.H., 2001. Removal of hydrogen sulfide gas and landfillleachate treatment using coal bottom ash. J. Air Waste Manage. Assoc. 51,939e945.
Martinec, M., Hartung, E., Jungbluth, T., 2000. Optimizing biofilters to reduce odorand gas emissions from livestock buildings. In: Proceedings of the Second In-ternational Conference on Air Pollution from Agricultural Operations, DesMoines, IW, USA, pp. 391e398.
Mayehofer, M., Govaerts, J., Parmetier, N., Jeanmart, H., Helsen, L., 2011. Experi-mental investigation of pressure drop in packed beds of irregular shaped woodparticles. Powder Technol. 205, 30e35.
Merchant, J.A., Ross, R.F., 2002. Iowa Concentrated Animal Feeding Operations AirQuality Study. Iowa State University and The University of Iowa Group.
Morgan-Sagastume, J.M., Noyola, A., Revah, S., Ergas, S.J., 2003a. Changes in physicalproperties of a compost biofilter treating hydrogen sulfide. J. Air Waste Manage.Assoc. 53, 1011e1021.
Morgan-Sagastume, J.M., Revah, S., Noyola, A., 2003b. Pressure drop and gas dis-tribution in compost based biofilters: medium mixing and composition effects.Environ. Technol. 24, 797e807.
Mudliar, S., Giri, B., Padoley, K., Satpute, D., Dixit, R., Bhatt, P., Panday, R.,Juwarkar, A., Vaidya, A., 2010. Bioreactors for treatment of VOCs and odours e areview. J. Environ. Manage 91, 1039e1054.
Nicolai, R.E., Clanton, C.J., Janni, K.A., Malzer, G.L., 2006. Ammonia removal duringbiofiltration as affected by inlet air temperature and media moisture content.Trans. ASAE 49, 1125e1138.
Nicolai, R.E., Janni, K.A., 1998. Biofiltration-adaptation to livestock facilities. In:Proceedings of USC-TRG Conference on Biofiltration, Los Angeles, CA, USA, pp.99e106.
Nicolai, R.E., Janni, K.A., 2001. Biofilter media mixture ratio of wood chips andcompost treating swine odors. Water Sci. Technol. 44, 261e267.
Ottengraf, S.P.P., Van Den Oever, A.H.C., 1983. Kinetics of organic compound removalfrom waste gases with a biological filter. Biotech. Bioeng. 25, 3089e3102.
Phillips, V.R., Scotford, I.M., White, P.R., Hartshorn, R.L., 1995. Minimum-cost bio-filters for reducing odours and other aerial emissions from livestock buildings:part 1, basic airflow aspects. J. Agric. Eng. Res. 62, 203e214.
Prado, O.J., Gabriel, D., Lafuente, J., 2009. Economical assessment of the design,construction and operation of open-bed biofilters for waste gas treatment.J. Environ. Manage. 90, 2515e2523.
Schiffman, S.S., Miller, E.A.S., Suggs, M.S., Graham, B.G., 1995. The effect of envi-ronmental odors emanating from commercial swine operations on the mood ofnearby residents. Brain Res. Bull. 37, 369e375.
Sheridan, B., Curran, T., Dodd, V., Colligan, J., 2002. Biofiltration of odor andammonia from a pig unit-a pilot -scale study. Biosys. Eng. 82, 441e453.
Singh, R.S., Agnihotri, S.S., Upadhyay, S.N., 2006a. Removal of toluene vapour usingagro- waste as biofilter media. Bioresour. Technol. 97, 2296e2301.
Singh, R.S., Rai, B.N., Upadhay, S.N., 2006b. Performance evaluation of an agro wastebased biofilter treating toluene vapours. Environ. Technol. 27, 349e357.
Wani, A., Branion, R., Lau, A.K., 1997. Biofiltration: a promising and cost-effectivecontrol technology for odors, VOCs and air toxics. J. Environ. Sci. Health 32,2027e2055.
Williams, T.Q., Miller, F.C., 1992. Odor control using biofilters. BioCycle 33, 72e77.Yang, L., Wang, X., Funk, T.L., Shi, S., Gates, R.S., Zhang, Y., 2012. Moisture monitoring
and control in gas phase biofilters to achieve high ammonia removal efficiencyand low nitrous oxide generation. Trans. ASABE 56, 1895e1903.
Yasuda, T., Kuroda, K., Fukumoto, Y., Hanajima, D., Suzuki, K., 2009. Evaluation offull-scale biofilter with rockwool mixture treating ammonia gas from livestockmanure composting. Bioresour. Technol. 100, 1568e1572.