
Odor, drug and toxin analysis with neuronal networks in vitro: extracellular array recording of...
21
ELSEVIER Biosensors & Bioelectronics Vol. 12. No. 5, pp. 373-393, 1997 © 1997 Published by Elsevier Science Limited All rights reserved. Printed in Great Britain PII: S0956-5663(9"/)~12-2 0956-5663/97/$17.00 Odor, drug and toxin analysis with neuronal networks in w'tro: extracellular array recording of network responses* Guenter W. Gross, 1,t Annette Harsch, 1,2 Barry K. Rhoades 1,tt & Wolfgang G6pel 2 ~Department of Biological Sciences and Center for Network Neuroscience, University of North Texas, Denton, TX 76203, USA 2Institute for Physical and Theoretical Chemistry, University of Tiibingen, Germany (Received 30 April 1996; accepted 23 January 1997) Abstract: Neurons, by virtue of intrinsic electrophysiological mechanisms, rep- resent transducers that report the dynamics of cell death, receptor-ligand interac- tions, alterations in metabolism, and generic membrane perforation processes. In cell culture, mammalian neurons form fault-tolerant, spontaneously active systems with great sensitivity to their chemical environment and generate response profiles that are often concentration- and substance-specific. Changes in action potential patterns are usually detected before morphological changes and cell damage occur, which provides sensitivity and reversibility. Such biological systems can be used to screen rapidly for novel pharmacological substances, toxic agents, and for the detection of certain odorants. Existing simple culture preparations can already be employed effectively for the detection of chemical compounds. So far, three strategies have been investigated in pilot experiments: (1) Substance-dependent major changes in spontaneous native activity patterns. All synaptically active agents (e.g. glutamate, strychnine, N- methyl D-aspartic acid) as well as metabolic poisons generate such changes. (2) Substance-dependent changes in network oscillations via disinhibition. The regularized, oscillatory activity is altered by synaptically and metabolically active substances, ion channel blockers, and toxins. (3) Detection of paroxysmal responses indicating major, pathological membrane currents in large subpopul- ation of ceils. We have explored these three strategies via 64 channel array recordings using spontaneously active murine spinal cord cultures. The glycine receptor blocker strychnine reliably generated increased multichannel bursting at 5-20 nM and regular, coordinated bursting above 5 p,M. During biculline- induced network oscillations many compounds alter oscillation frequencies or terminate activity in a substance-specific manner. Finally, the gpl20 protein of the AIDS virus (at 1/zg/ml) produces massive, unique paroxysmal discharges that may last as long as 2 min. These results indicate that cultured neuronal networks are practical systems that can be used for the detection and identifi- cation of a great variety of chemical substances. The concept of dynamic fingerprinting to identify specific compounds is discussed. © 1997 Published by Elsevier Science Limited Keywords: cellular biosensors, cell culture, mammalian neuronal networks, array recording, drug identification, network activity changes, toxins 373
Transcript of Odor, drug and toxin analysis with neuronal networks in vitro: extracellular array recording of...

ELSEVIER
Biosensors & Bioelectronics Vol. 12. No. 5, pp. 373-393, 1997 © 1997 Published by Elsevier Science Limited
All rights reserved. Printed in Great Britain
PII: S0956-5663(9" / )~12-2 0956-5663/97/$17.00
Odor, drug and toxin analysis with neuronal networks in w'tro:
extracellular array recording of network responses*
Guenter W. Gross, 1,t Annette Harsch, 1,2 Barry K. Rhoades 1,tt & Wolfgang G6pel 2
~Department of Biological Sciences and Center for Network Neuroscience, University of North Texas, Denton, TX 76203, USA
2Institute for Physical and Theoretical Chemistry, University of Tiibingen, Germany
(Received 30 April 1996; accepted 23 January 1997)
Abstract: Neurons, by virtue of intrinsic electrophysiological mechanisms, rep- resent transducers that report the dynamics of cell death, receptor-ligand interac- tions, alterations in metabolism, and generic membrane perforation processes. In cell culture, mammalian neurons form fault-tolerant, spontaneously active systems with great sensitivity to their chemical environment and generate response profiles that are often concentration- and substance-specific. Changes in action potential patterns are usually detected before morphological changes and cell damage occur, which provides sensitivity and reversibility. Such biological systems can be used to screen rapidly for novel pharmacological substances, toxic agents, and for the detection of certain odorants. Existing simple culture preparations can already be employed effectively for the detection of chemical compounds. So far, three strategies have been investigated in pilot experiments: (1) Substance-dependent major changes in spontaneous native activity patterns. All synaptically active agents (e.g. glutamate, strychnine, N- methyl D-aspartic acid) as well as metabolic poisons generate such changes. (2) Substance-dependent changes in network oscillations via disinhibition. The regularized, oscillatory activity is altered by synaptically and metabolically active substances, ion channel blockers, and toxins. (3) Detection of paroxysmal responses indicating major, pathological membrane currents in large subpopul- ation of ceils. We have explored these three strategies via 64 channel array recordings using spontaneously active murine spinal cord cultures. The glycine receptor blocker strychnine reliably generated increased multichannel bursting at 5-20 nM and regular, coordinated bursting above 5 p,M. During biculline- induced network oscillations many compounds alter oscillation frequencies or terminate activity in a substance-specific manner. Finally, the gpl20 protein of the AIDS virus (at 1/zg/ml) produces massive, unique paroxysmal discharges that may last as long as 2 min. These results indicate that cultured neuronal networks are practical systems that can be used for the detection and identifi- cation of a great variety of chemical substances. The concept of dynamic fingerprinting to identify specific compounds is discussed. © 1997 Published by Elsevier Science Limited
Keywords: cellular biosensors, cell culture, mammalian neuronal networks, array recording, drug identification, network activity changes, toxins
373

G. W. Gross et al. Biosensors & Bioelectronics
INTRODUCTION
The remarkable discrimination capabilities and sensitivities of intact olfactory systems in some animals are well known. However, it is also generally accepted that such olfactory systems cannot be used in practical applications such as in the continual on-line monitoring of chemicals, the quantitative biochemical or odor analysis, or in any hostile environment to monitor toxicity. For practical applications, these conditions are currently met at least in part by 'classical' modu- lar sensor systems (Weimar et al., 1991; Grpel, 1994a,b; Grpel, 1995) which, however, do not show the unique advantages of natural olfactory systems. Consequently there is an increasing interest in the development of concepts that aim at supplementing chemical and classical biosen- sors with 'bionic' biosensors that contain complex functional biomolecular units (GtJpel, 1996). In this context, the reconstruction of biological sen- sory systems in vitro is an attractive concept that has, however, received only marginal research attention so far. In principle, three different in vitro approaches can be taken:
(1) the bionic reconstruction of sensory sys- tems;
(2) the artificial induction of specific sensory functions into non-sensory neural tissue via genetic engineering;
(3) the use of non-sensory neuronal networks in culture.
The first approach requires the co-culture of (at minimum) the olfactory mucosa with the olfactory bulb. The second necessitates the transfection of neurons in order to (a) up-regulate existing recep- tors and induce 'supersensitivities' or (b) express entirely novel receptors for substances to which the nervous system does not normally react (Gross et al., 1995). Both methods have received little experimental attention and will require a lengthy and expensive development phase. The third approach, however, is essentially within reach. This concept will be elaborated in the
*This paper was presented at Biosensors '96, Bangkok, and was an Award Nominee. tTel: [8171565-3615 Fax: [8171565-4136 E-mail: gross @ nervous.cnns.unt.edu #tPresent address: Department of Biology, Wesleyan College, Macon, GA 31297, USA.
374
present paper, which restricts itself to an evalu- ation of 'neuronal network biosensors' (NNBS).
Nerve cell networks grown on microelectrode arrays in culture are very sensitive to a great variety of neuroactive compounds added to the culture medium (Gross & Kowalski, 1991; Gross et al., (1992, 1995); Gross, 1994). They respond to these compounds with changes in their native, spontaneous activity patterns. This altered activity is often substance- and concentration-specific. Given these observations, it is apparent that non- sensory nerve cell networks, grown in culture without the normal homeostatic controls and with- out the protection of the blood-brain barrier, are by default 'sensory' in nature and become sensor systems. As it is now possible to maintain net- works in electrophysiologically active and phar- macologically responsive states for over 9 months in vitro (Gross, 1994), such systems have become realistic candidates for the performance of certain sensory tasks. However, it is not yet clear whether they will ever become practical, cost-effective sensor systems. The first challenge is to determine the sensitivity parameters, response reliability and interculture reproducibility. The second challenge will be primarily technical in nature and will involve miniaturization of recording, data display and life-support equipment, as well as the devel- opment of test substance injection devices. Life- support will include the sterile maintenance and circulation of an appropriate growth medium with accurate control of pH, temperature, and meta- bolic substances such as glucose and ammonium ions. A major aim will be to create portable systems that can maintain stable conditions and sensory responses for several months.
We define 'neuroactive compounds' as water- soluble molecules that can influence the sensitive electrophysiological mechanisms of nerve cells. These influences can be classified as follows:
(1) direct metabolic effects that may increase, decrease, or stop activity (e.g. c-AMP, cyanide);
(2) specific synaptic effects (all neurotransmit- ters and neuromodulators);
(3) transmission effects that stop action poten- tial propagation (tetrodotoxin, which blocks the voltage-gated Na + channel, or ouabain, which blocks the sodium pump, preventing maintenance of the membrane potential);
(4) generic membrane effects mediated through
Biosensors & Bioelectronics
non-synaptic Ca 2÷ or K ÷ channels or by the generation of new channels (ionophores).
In addition, biological systems have highly spe- cialized chemoreceptors and associated data pro- cessing circuitry that respond to airborne sub- stances (e.g. the olfactory system) and water- soluble substances (e.g. the gustatory system). Although there are some similarities between chemosensory mechanisms and the indirectly- gated synaptic mechanisms (i.e. the synaptic receptors that influence the second messenger systems via G-proteins), the many substances that activate the chemosensory systems are generally not considered 'neuroactive compounds'.
Finally, it should be mentioned that any injury to the membrane causes an influx of positive ions, a concomitant membrane depolarization, and extensive electrical activity that stops only when the membrane potential has returned to normal or when it is reduced to a point where the action potential mechanisms are inactivated. The latter case usually leads to an irreversible loss of mem- brane potential and subsequent cell death.
To explore the utility of NNBS systems we have begun to investigate three strategies, the results of which are presented in this paper:
(1) Substance-dependent major changes in spontaneous native activity patterns. All synaptically active agents (e.g. glutamate, strychnine, N-methyl D-aspartic acid (NMDA)) as well as metabolic poisons generate such changes.
(2) Substance-dependent changes in network oscillations induced by networks disinhi- bition. This simplified, regularized, oscillat- ory activity is altered by synaptically and metabolically active substances, ion chan- nel blockers and toxins, and can be evalu- ated quantitatively.
(3) Detection of paroxysmal responses indicat- ing major, pathological membrane currents in a large subpopulation of cells.
METHODS
Experimental setup
Spinal cord monolayer networks were grown on electrode arrays featuring 64 photoetched elec-
Neuronal networks in vitro
trodes in a 1 mm 2 recording area. The techniques used for multimicroelectrode plate (MMEP) fabri- cation and preparation, as well as for dissociated cell seeding and culturing, have been described elsewhere (Gross, 1979; Gross & Lucas, 1982; Gross et al., 1985; Gross & Kowalski, 1991). Briefly, multimicroelectrode plates (5 x 5cm) were prepared from 1.2 mm thick ITO-sputtered barrier glass (soda lime glass with a 100nm quartz layer, Donnelly Corp., Midland, MI). The electrode conductor pattern (see Fig. 1) consisted of a central 0.8 mm 2 recording matrix of 64 microelectrodes (four rows, 16 columns with 200 and 40/~m spacing, respectively) and was photo- etched with standard procedures. The plates were spin-insulated with a 2--4/~m polysiloxane resin (DC 648, Dow Coming). An additional 10-15/~m thick resin layer was hand-painted onto the entire plate except for the 3 mm 2 recording area in the center, and two 5 mm wide contact strips at each edge. This procedure raised the conductor shunt impedance monitored at 1 kHz under saline to about 40 MI) while preserving optical clarity and a thin layer required for electrode deinsulation in the recording area. The matrix microelectrode sites were deinsulated with single pulses from a nitrogen laser firing through a microscope (Gross, 1979). This resulted in a 20/~m diameter crater at the end of each 8 ~m wide ITO conductor. Low recording crater impedances of 0-8-1.5 MII were assured by electroplating a thin layer of gold on each exposed ITO tip (Gross et al,, 1985).
Spinal cord neurons were obtained from fetal mice (E14-15) and cultured under sterile con- ditions (without antibiotics) according to the methods of Ransom et al. (1977) with the addition of an enzymatic dissociation step (15 min in 0.2% papain or trypsin and 0.05% DNAse) and a 10% CO2 atmosphere. Approximately 8 x 10⁵ cells (with an approximate 4:1 ratio of glia:neurons) in a 1 ml aliquot were added to each MMEP with the medium confined to a 4 cm 2 area by a silicone gasket. This ultimately produces a monolayer neuronal network overlying a flat, fairly continuous carpet of non-neuronal cells. Flaming through masks allowed the gener- ation of adhesion patterns on the normally hydro- phobic DC648 surface. Two areas, a centrally located recording island (typically 1-8 mm in diameter) and a separate, off center 'medium conditioning area' measuring approximately I x 2 cm were always formed before seeding of cells. Polylysine and laminin, used to enhance cell
375

G. W. Gross et al. Biosensors & Bioelectronics
Fig. 1. Neuronal networks on multimicroelectrode arrays. (a) Glass electrode plates (5 m x 5 cm x 1.1 mm) with polysiloxane insulation. The array at left is in routine use and features 64 microelectrodes in a central 0.8 × 0.8 mm recording area from which thin film conductors fan out to form 32 contact pads at either side of the plate. (b) Assembled recording and culture life-support chamber with medium supply flask and tubing as well as four power resistors for heating. A required peristaltic pump is not shown. (c) Chamber on microscope stage with 32 preamplifiers attached to either side. (d) Fixed and stained network (Bodian) centered on recording matrix. The transparent indium-tin oxide conductors are 8 lain wide and terminate in four rows and 16 columns at oxide- insulation craters produced with single laser shots, lnserts show higher magnification of a neuron and axons passing over three craters. (e) Living neurons photographed in chamber. The lower two panels show high power
micrographs o f the same electrode with Hoffman modulation optics (left) and phase contrast (right).
376

Biosensors & Bioelectronics Neuronal networks in vitro
attachment and growth, adhere only to the flamed regions. The growth of neurons and glia on a microelectrode surface creates a remarkably stable recording environment, primarily because elec- trodes do not have to invade the tissue and do not vibrate or slip relative to the neural components.
Fig. 1 depicts the electrode array plates, the monolayer networks that grow over the recording area, the recording and culture life-support chamber and typical results. The optical appear- ance of living tissue in the chamber is shown in Fig. l(e). The array plate forms the base of the chamber on which a stainless steel cover is pressed with two thumb screws and a 33 mm 'O' ring. A matched glass or quartz cover slip forms a 24 mm microscope port for high power light microscopy with upright microscopes. The use of lower power inverted microscopes is also poss- ible. The chamber volume is 0-3 ml. The optical working distance for upright microscopes is 300 ~m with a 170/xm thick cover glass.
Data analysis
Individual action potentials were monitored at each electrode with analog amplifiers. Typical results for a closed chamber environment recorded from a single electrode unit over a 7- day period have been published earlier (Gross, 1994). Typical spike amplitudes were in the order of 300/~V, spike durations around 500 ~s (Fig. 2(A)). The output of the electrode array showed excellent characteristics with average signal-to- noise ratios and electrode yield (number of elec- trodes active) remaining stable for over 150 days in vitro. The ratio of active to total number of electrodes was in the order of 50-60%, inde- pendent of the lifetime. Larger signal amplitudes (500-1000/xV) were often observed, although the details of the concomitant cell-electrode coupling are not well understood. Glia cells play a major role in this coupling and can be controlled in number by the addition of antimitotics. Typically, electrodes record an average of three different neurons with spike amplitudes exceeding the sig- nal-to-noise ratios of 2:1. Single large action potentials are seen on only 10% of the electrodes. Other neural activity contributes to the noise line and cannot be extracted conveniently. The larger signals can often be separated via a variety of spike separation methods. Under those conditions, one electrode can provide two or three data chan- nels. However, multichannel spike separation is
not yet coupled to continuous burst analysis in our laboratory. Therefore, the data presented are based on the response of many electrodes where the 'total integrated activity' (see below) obtained from each electrode is plotted on a chart recorder.
The extracellular spike activity was recorded with a 64-channel multiamplifier system con- structed by Spectrum Scientific (Dallas). Pre- amplifiers were positioned on the microscope stage to either side of the recording chamber and connected to the MMEP with zebra strips (carbon-filled silicone elastomere, Fujipoly, Cran- ford, NJ) pressed against the ITO pattern. The amplifier bandwidth was usually set at 500 Hz- 6 kHz. Activity was displayed on oscilloscopes and recorded on a 14-channel Racal direct tape recorder. Spike data from active channels were 'integrated' either via analog RC circuits or by rectification followed by an RC integration with typical resulting time constants of 300 ms. The results were displayed on a 12-channel Graphtek strip chart recorder. Phase contrast and inter- ference contrast microscopy were used to observe cultures during recording. A Loots modified Bod- ian stain (Loots et al., 1979) was used for sub- sequent histological staining.
The large amount of data obtained with array recording methods requires simplification of the data acquisition and processing procedures. Because spike clusters or 'bursts' are a ubiquitous and prominent feature of network activity, the description of network activity on the burst level provides a vast amount of information about net- work behavior without having to deal with the complexities of spike analysis. Our primary method of data simplification is 'integration', which is widely used in physiology and represents the summation of action potentials in RC-circuits, usually with time constants ranging from 100 to 500 ms (Fig. 2). Originally implemented in analog circuits (Droge et al., 1986; Gross & Kowalski, 1991), the method provides long chart recordings of multichannel burst activity in which back- ground spiking is de-emphasized. The more recent digital processing has been designed to mimic earlier analog data to allow convenient compari- sons of all data sets. For digital data acquisition, channels are each scanned at 33 kHz with a Mas- scomp 5700 platform and spikes are identified when the amplitude exceeds four times the stan- dard deviation of the noise. The maximum value of an identified spike is converted to a 'time of occurrence'. The resulting time series represents
377

G. W. Gross et al. Biosensors & Bioelectronics
A
C
l-qx- i
500p, sec
I t
lOOmsec
~ #~ fast integration .7
T
I~ ~urat,on --d
D
378

Biosensors & Bioelectronics Neuronal networks in vitro
a greatly simplified data stream, but at the expense of giving equal weight to all spikes seen by one electrode. Spike separation from different nerve cell components on one electrode is not possible with this method. Bursts are then ident- ified in real time by using a novel double-inte- gration method with time constants of 50 ms (fast integration) and 700 ms (slow integration, Fig. 2(C)). When a preselected difference threshold (DT in Fig. 2(C)) is reached, the program accepts the threshold (T) crossing as the beginning of a burst and the downcrossing (with a delay of at least lOOms) as the end of the burst. Burst duration, amplitude, area and period can then be easily determined. Analog data for strip charts are also integrated by a low-pass RC filter (after rectification) with variable time constants ranging from 100 to 500 ms (Fig. 2(E)).
Burst patterns represent a simplified level of activity that often reveals major states or modes of the network activity without massive statistical calculations on virtually unmanageable spike data sets. Integration represents a simple method of feature extraction because of the emphasis on high frequency, tetanic events in the spike train. The summation of all spikes recorded by one electrode obscures fine details of the individual spike patterns, but it does not necessarily obscure major features of the burst patterns because of the strong tendency for units to show coordinated activity often described as 'coarse-grain synchron- ization' (Gross & Kowalski, 1991; Gross, 1994).
Fig. 2. (opposite) Action potentials and transformation into integrated profiles. (A) Typical action potential. Multiple superimposed action potentials recorded from the same electrode. (B) Digitized spike traces monitored with a rate of 33 kHz. (C) Identification of bursts after integrating spike activity from digitized traces. This digital burst identification uses a rapid and a slow integration in real time with typical time constants of 40 and 700 ms, respectively. DT is the adjustable differ- ence threshold for acceptance of profile as a burst; T is the threshold used for identification of the beginning of a burst and its termination. A delay time (not shown) prevents segmentation of bursts by short (lOOms) returns to threshold. (D) Burst train with concomitant integrated profiles used for the determination of burst variables. (E) Spike activity processed for analogue (stripchart) data is rectified and passed through an RC circuit with a time constant of approximately 500 ms. Note the loss of spike details and extraction of burst
events.
Clearly, future analyses of more subtle aspects of network dynamics must emphasize spike separ- ation.
It must be noted that the integrated profile is in both cases affected by three variables: the number of active units (i.e. electrically active components from different nerve cells seen by each channel); the size of the action potentials generated by each active unit; and the firing frequency of each unit. Although the dominant variable is clearly firing frequency, conclusions based on shape details of the profile generated by specific electrodes require a more detailed analysis of the spike contributions made by the different units recorded by those electrodes. For a simple assessment of burst rate and detecting major changes in integrated burst profile variables such as duration, area, period and amplitude, integration is useful and adequate.
RESULTS
Substance-dependent changes in activity patterns
General aspects All synaptically active agents (e.g. glutamate, strychnine, NMDA), as well as metabolic poisons, generate activity changes. So far spinal cultures have shown histiotypic responses to a great var- iety of substances (Gross, 1994). The same appears to be true of cortical cultures (Gopal & Gross, (1996a, b)). Most experiments carried out so far were conducted to characterize changes in network dynamics and to investigate burst mechanisms (Rhoades & Gross, 1994). Only recently has attention been focused on changes in network dynamics as an identifier of neuro- active substances.
Sensitivity to strychnine and reproducibility of responses
It has already been reported that mouse spinal cord networks in culture were highly sensitive to strychnine, with increases in spontaneous bursting activity already seen at 1-5 nM (Gross et al., 1992). We have expanded these early obser- vations to investigate the repeatability of the effect within the same culture and the reproduci-
379

G. W. Gross et al. Biosensors & Bioelectronics
bility between cultures. These data are summar- ized in Figs 3-6 and in Table 1.
Fig. 3 shows typical network activity changes to increasing strychnine concentrations as seen after analog RC integration and display on a chart recorder. It demonstrates a transition between native activity and the effect of 10 nM strychnine exposure. Thereafter the network shows an irregu- lar increase in burst activity which 'regularizes' in terms of integrated burst amplitude, duration and period after 2/xM and enters a remarkably stable oscillatory pattern at about 20/xM.
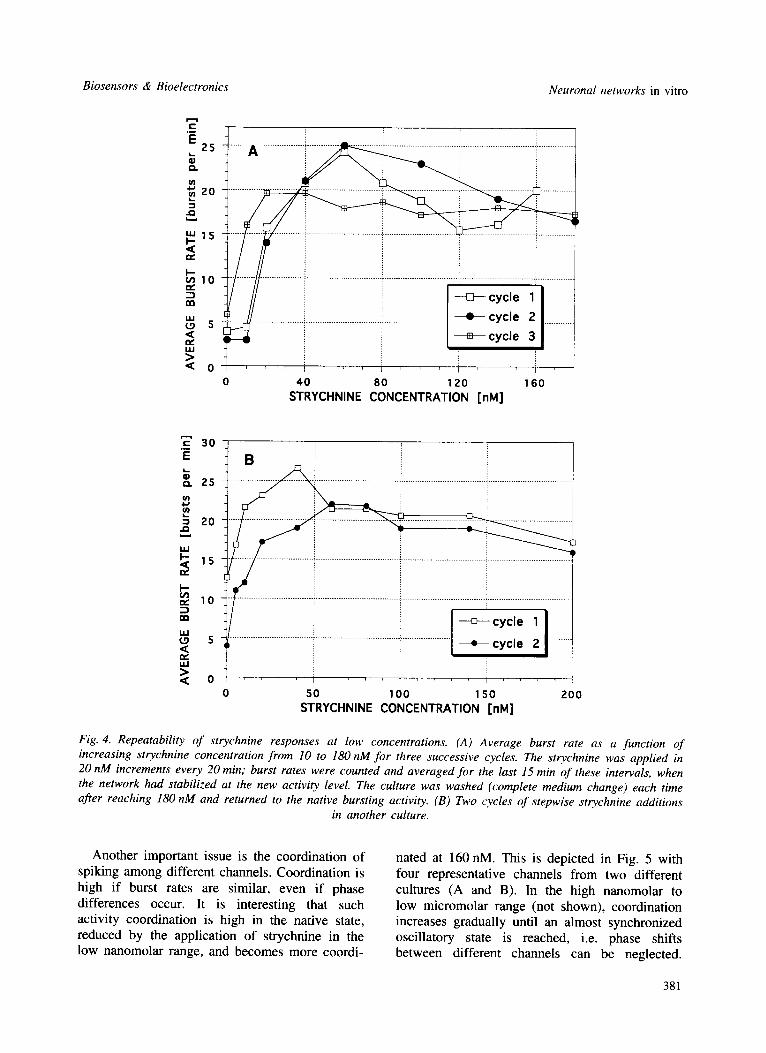
The strychnine repeatability at low concen- trations is shown in Fig. 4 with responses from two different networks (i.e. cultures) shown in (A) and (B), respectively. The average burst rates (normalized to 1 min) are plotted as functions of increasing strychnine concentration from (A) 10 to 180nM and (B) 5 to 200nM. In Fig. 4(A), three successive cycles are shown. The strychnine was applied in 10 or 20/xM increments every
20 min. Burst rates were counted and averaged for the last 15 min of these intervals, when the network had stabilized at the new activity level. The culture was washed (complete medium change) each time after reaching 180 nM and returned to the native bursting activity. Although the repeatability was good during the first two cycles, the third cycle reveals a sensitization at 10 nM and reduced maximum burst rates. Further cycles generally produce highly active cultures that are difficult to return to the native state. This is also true for single applications in the high nanomolar to low micromolar range where net- works tend to enter oscillatory states that display considerable inertia. This sensitization and 'pat- tern stabilization' is assumed to result from a strong binding of strychnine to some glycine receptors. Synaptic changes, produced by the pharmacologically-induced reverberating oscillat- ory patterns, must also be considered as reasons for this pattern intertia.
] 20nM
native activity + lOnM strychnine
2t.tM
1 rain lOI.tM
I l l l i l ~ r l l T I l l ] lq l l l r - ~ l i I l r l w M w : ~ l l l n , . . = I
1 61.tM
I 221.tM
I I Fig. 3. Typical network activity changes in response to increasing strychnine concentrations. Single channel chart recordings after integration with an overall integration constant of approximately 300 ms. The transition between native activity and 10 nM strychnine (top trace) is followed by a series of traces at the concentrations indicated. Irregular increases in burst activity 'regularize' in terms of integrated burst amplitude, duration and period after
2 ladl4. This network entered a stable oscillatory pattern at about 22 laA4 (bottom trace).
380
Biosensors & Bioelectronics Neuronal networks in vitro
"•-c25
~is
/ / / '1 ,= i-- -cycle a I !
0 40 80 120 160 STRYCHNINE CONCENTRATION [nM]
~. z s
2o
U J ~
0 50 1 O0 150 ZOO STRYCHNINE CONCENTRATION [nM]
Fig. 4. Repeatability of strychnine responses at low concentrations. (A) Average burst rate as a function of increasing strychnine concentration from 10 to 180 nM for three successive cycles. The strychnine was applied in 20 nM increments every 20 min; burst rates were counted and averaged for the last 15 min of these intervals, when the network had stabilized at the new activity level. The culture was washed (complete medium change) each time after reaching 180 nM and returned to the native bursting activity. (B) Two (~vcles o f stepwise strychnine additions
in another culture.
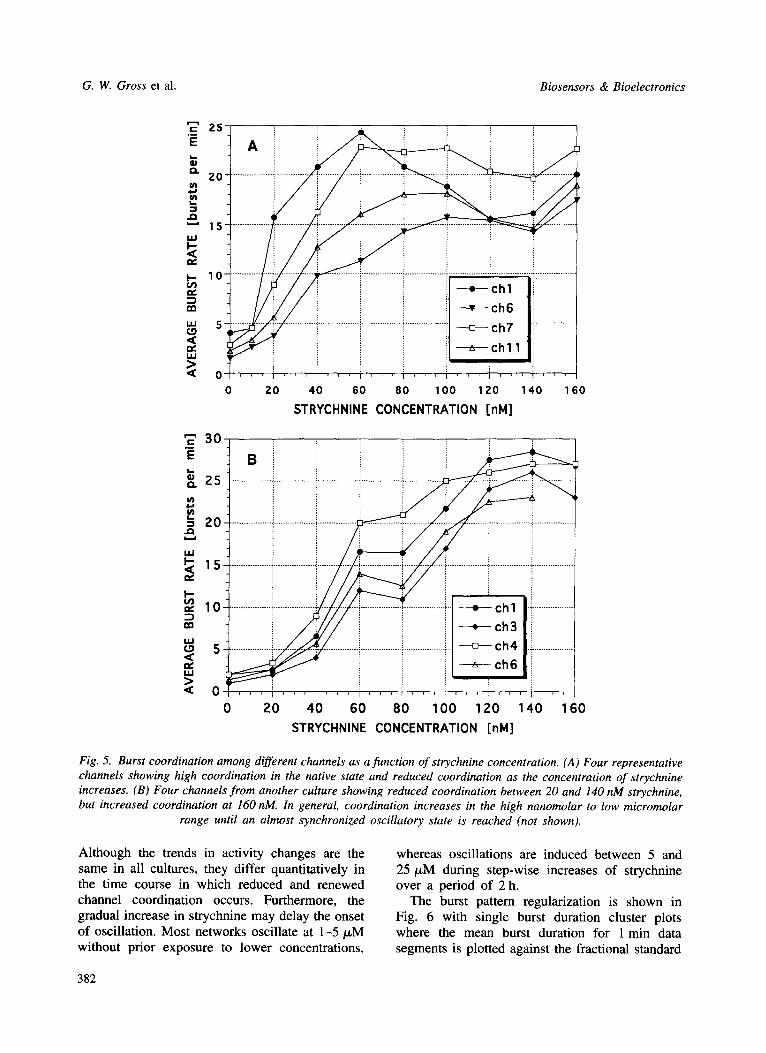
Another important issue is the coordination of spiking among different channels. Coordination is high if burst rates are similar, even if phase differences occur. It is interesting that such activity coordination is high in the native state, reduced by the application of strychnine in the low nanomolar range, and becomes more coordi-
nated at 160 nM. This is depicted in Fig. 5 with four representative channels from two different cultures (A and B). In the high nanomolar to low micromolar range (not shown), coordination increases gradually until an almost synchronized oscillatory state is reached, i.e. phase shifts between different channels can be neglected.
381
G. W. Gross et al. Biosensors & Bioelectronics
25 ,, ,, :
X 2 o . . . . . . . . . . . . . . . . . i . . . . . . . . . . . . . . . . . . . . . - . . . . . . . . . . . .
" " 1 5 . . . . . . . . . . . . . . . . . . . ,, :
10 .............. : ..................................................................................... " ................
gfl
=i 0 20 40 60 80 100 120 140 160
STRYCHNINE CONCENTRATION [nM]
.~ 20., . . . . . . . . . . . . . . . . . . . . . . . . . . . . . . . . . . . . . . . . . .
i 1 5 - . . . . . . . . . . . . . . . . . . ~ ~ i i , - i ~ . . . . . . . . . . . . . . . . . . . . . . . . . . . . . . . . . . . . . . . . . . . . . . . . . . . . . . . . . . . . . . . . . . . . . . . . . . . . . . . . . . . . . . . . . . . . . . . . . . . . . . . . . . . . . . .
io: .................. ............. ii iiiiili :i;ijliiiiiii " i . / S / , i < i = = .................................................................. A - I I ; I .................. =< : i i 11 = c ~ l i < 0
0 20 40 60 80 100 120 140 160
STRYCHNINE CONCENTRATION [nM]
Fig. 5. Burst coordination among different channels as a function o f strychnine concentration. (A) Four representative channels showing high coordination in the native state and reduced coordination as the concentration of strychnine increases. (B) Four channels from another culture showing reduced coordination between 20 and 140 nM strychnine, but increased coordination at 160 nM. In general, coordination increases in the high nanomolar to low micromolar
range until an almost synchronized oscillatory state is reached (not shown).
Although the trends in activity changes are the same in all cultures, they differ quantitatively in the time course in which reduced and renewed channel coordination occurs. Furthermore, the gradual increase in strychnine may delay the onset of oscillation. Most networks oscillate at 1-5/~M without prior exposure to lower concentrations,
whereas oscillations are induced between 5 and 25/~M during step-wise increases of strychnine over a period of 2 h.
The burst pattern regularization is shown in Fig. 6 with single burst duration cluster plots where the mean burst duration for 1 min data segments is plotted against the fractional standard
382

Biosensors & Bioelectronics Neuronal networks in vitro
Z Z o_
£3
~ 1 . 5 n~ ==
5 , E~ X
~ O . 5 LU
LU O
O
A [] ~t~
D U
I I I J
S T R Y C H N I N E
O O •
N A T I V E
1 0 n M
• 1 0 0 n M - 7 / ~ M
<> t O p M - 1 6 / J M
• 2 2 / J M o a % .~ 'ooo . . . "
[] _ • I ° o • • o • Do 1"oo o • • o 0 • :
I~m D ° l e ~ O 0 D e • e ° qt, o • • •
% ~ e " • •
~ ¢ , ~ .~: . ' . . . . . :o . . . . L,r . : . . " ° e o o - I • • • ~ % . - . - . s
A H 1 0 . 1 •
2 4 6 8 10
M E A N BURST DURATION [sec]
1Z
2
z O
c ~ 1 . 5 .
z _0 1
n,"
~ - 0 . 5
uJ 0
~ 0
0
B [] B I C U C U L L I N E [ ] O p M [ ] S p M • 1 S - 7 0 p M
.................. [ ] .......... O 9 0 - 1 3 0 g M E~ • a f t e r di lut ion
[ ] [ ] •
i .............................................................. . . . . . . . . . . . . . . . . . . . . . . . . . . . . . . . . ;...........~....... ~:...i . . . . . . . . [] i i ° •
[ ] i i • • • e • _ ~ ! i ' ~ I l i . . . , L ? ~ i e i
[] i ~ q ' o ~ . ~ i . ................................. i . . . . . . . . . . . . . . . . ~ ................ t - . ~ ¢ ~ t l k ~ " ~ ~ • ~ . . . . . . . . . . . . . . ~ ...................................
d i m <> •
• i A H 1 9 . 2 . . . . . . . . ; i . . . . i . . . . . . . . . . . .
1 2 3 4 5
M E A N BURST DURATION [sec]
Fig. 6. Single channel burst duration cluster plots. (A) Responses to strychnine concentrations ranging up to 22 txM. One minute data segments were used to generate mean burst duration values and concomitant standard deviations. The coefficient of variation, i.e. the standard deviation of the burst duration divided by the mean burst duration, is plotted against the mean burst duration for each data segment. This depiction shows a wide range of burst duration patterns, from short but variable bursts in the native state, to highly variable, long bursts between 0.1 and 7 IaA4, to highly regular clusters at 22 IzM. (B) Similar plot for bicuculline in the concentration range from 5
to 130 IxM. The most regular pattern (solid squares) was obtained after a dilution of the bicuculline to 35 txM.
deviation of each segment, i.e. the standard devi- ation of the burst duration divided by the mean burst duration. Fig. 6(A) depicts a strychnine response on a single channel. Starting out in the native state with very short bursts of considerable variability, the channel shows burst stretching at 10 nM, remarkably long bursts between 100 nM and 7/xM, a return to short bursts with low variability at 10-16/xM, and a tight cluster of highly regular bursting at 22/xM. All cultures
exposed to strychnine follow this trend, albeit with some variation in the concentrations at which the state changes occur. Nevertheless, the plot appears to be a 'fingerprint' for strychnine. We have not yet seen any other substance show a similar pattern of sensitivity and concentration- dependent pattern changes. For comparison, a similar plot for bicuculline, which blocks the inhibitory GABAA receptors, is shown in Fig. 6(B). Although a similar trend of burst stretching
383

G. W. Gross et al. Biosensors & Bioelectronics
TABLE 1 Reproducibility of strychnine responses
Experiment Electrode Culture age Culture* Highest Plateau Regularized array sensitivity at (beginning) pattern at
Area Cells
AH3 L248 119 180 27 k 100 nM 200 nM 100 nM AH4a L240 90 200 36 k 140 nM 200 nM - - AH5 L337 105 6 1 k 20 nM 100 nM 1 /xM AH6 C86 102 8 1.4k 20 nM 1 /zM 3/zM AH7 C158 31 9 1.5k 10 nM 150 nM 300 nM AH8 L272 43 50 9 k 40 nM 140 nM - - AH9/10 L280 47 12 1.2k 10 nM 80 nM 18/zM AH13 L293 58 21 3.8k 20 nM 100 nM - - AH18 P17 56 3 0.5k 10 nM 40 nM - - Average values: 72.3 (54) (9 k) 40 nM 223 nM
*Areas in square millimeters; cells: total number of neurons (estimated from mean cell densities of 100- 180 neurons/mm2).
and subsequent regularization is seen, the maximum burst durations are shorter and the concentrations at which tight clusters form differ from strychnine by a factor of 1000. It should be noted from (A) and (B) that the two cultures had similar native spontaneous activity, with most burst durations falling below 1 s.
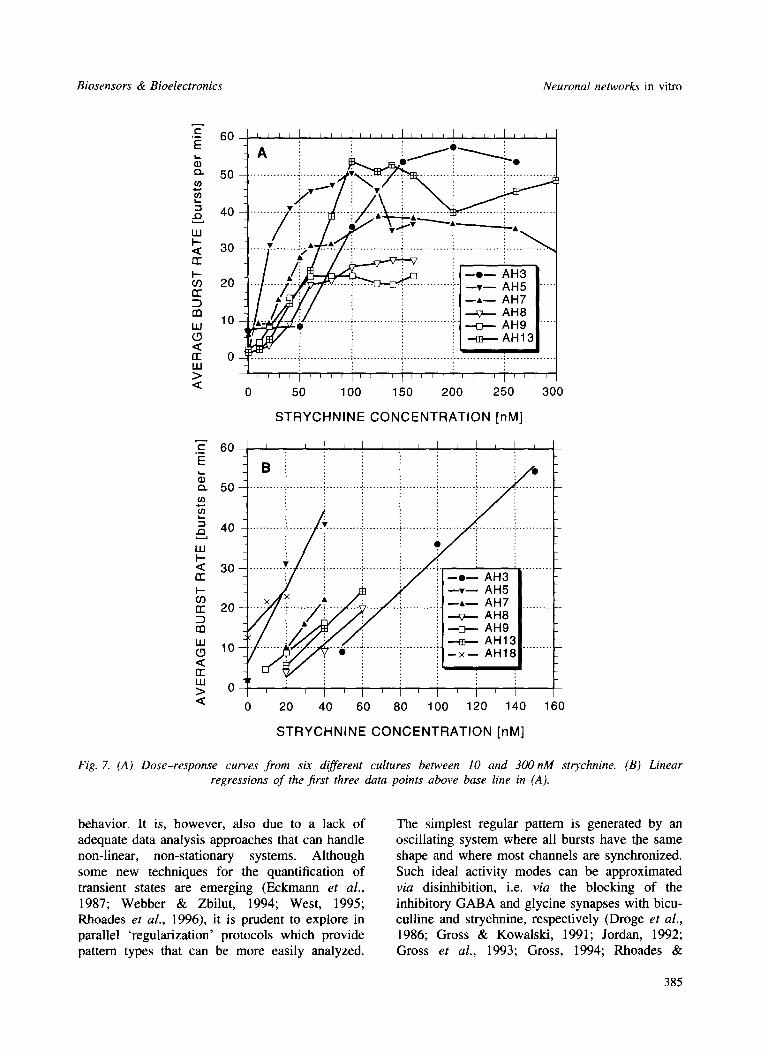
The strychnine sensitivity appears reproducible among different cultures. In Fig. 7(A), strychnine reliably increases activity at concentrations between 10 and 50 nM in the six different cul- tures shown. The initial rise in burst rate is sharp but reaches a plateau in a range of 50-150 nM. In the plateau phase, further burst pattern changes occur that were mentioned above: (1) the activity becomes first less and then more coordinated among channels; and (2) a remarkable 'regulariza- tion' of all burst variables occurs as the system enters an oscillatory state. Initiation of network oscillations has been observed in a range from 100nM to 22/xM. Fig. 7(B) shows linear regressions of the first three data points above baseline. The slopes range from 3.9 to 9-7 bursts per min (bpm) per 10nM strychnine (average 5.5 bpm per 10 nM).
Table 1 summarizes the parameters and responses from nine recent strychnine experiments from which the data represented in Figs. 4-7 were obtained. The networks ranged in age from 31 to 119 days in vitro (d.i.v.) and in size from 3 to 200 m m 2. Because cell densities can vary from region to region in a network, the concomi- tant total cell number listed is only a rough approximation. No accurate counts have been
made and histological records are available for only four out of the nine experiments. Never- theless, it is clear that the number of neurons comprising the networks varied greatly (from approximately 500 to 36 000). Under these cir- cumstances, we can only focus on major trends which may be characterized by the following three observations:
(1) Very large networks have lower sensititiv- ies in terms of higher concentrations of strychnine required to induce a noticeable change in the native activity.
(2) Culture age cannot be correlated with any response change.
(3) Neither the beginning of the burst rate plateau nor the pattern regularization shows any clear correlation with any culture stat- istic.
SUBSTANCE-DEPENDENT CHANGES IN NETWORK OSCILLATIONS
General aspects of network oscillations
The spatio-temporal complexity of the native activity patterns often makes a quantitative evalu- ation of substance-induced changes very difficult. This is partially a consequence of our still quite limited knowledge about the correlation between elementary steps of signal generation and the resulting very complex neuronal network
384
Biosensors & Bioelectronics Neuronal networks in vitro
50
40
~ 2o g
0 50 100 150 200 250 300
S T R Y C H N I N E C O N C E N T R A T I O N [nM]
t- 60 . m
E $ '~ 50
~ 40 ..Q
uJ I-- < 30 rr
rr 20
m w < rr uJ > 0 <
I I I I I I J I I
B i i •
i/t :: i i J ~, - - e - - AH3 ,/~ ! , ~ , J i - - ' - - AN5
...x./Z.. ~ . . . . z? / i ~ ....... i. ~A--- AH7 .... -;- xh8 . . . . . . .
/I i i i + AH9 / . . . . . . . . ~ " / " ~ . . . . / . . - - . . ... . . . . . . . . . . . . . ...... ...:;. + AH13 .........
7 ...... ~ ' ~ t . - i ...... - - x - - AH18
, 1 i . . . . 1 , , 0 20 40 60 80 100 120 140 160
S T R Y C H N I N E C O N C E N T R A T I O N [nM]
Fig. 7. (A) Dose-response curves from six different cultures between 10 and 300nM strychnine. (B) Linear regressions of the first three data points above base line in (A).
behavior. It is, however, also due to a lack of adequate data analysis approaches that can handle non-linear, non-stationary systems. Although some new techniques for the quantification of transient states are emerging (Eckmann et al., 1987; Webber & Zbilut, 1994; West, 1995; Rhoades et al., 1996), it is prudent to explore in parallel 'regularization' protocols which provide pattern types that can be more easily analyzed.
The simplest regular pattern is generated by an oscillating system where all bursts have the same shape and where most channels are synchronized. Such ideal activity modes can be approximated via disinhibition, i.e. via the blocking of the inhibitory GABA and glycine synapses with bicu- culline and strychnine, respectively (Droge et al., 1986; Gross & Kowalski, 1991; Jordan, 1992; Gross et al., 1993; Gross, 1994; Rhoades &
385
G. W. Gross et al. Biosensors & Bioelectronics
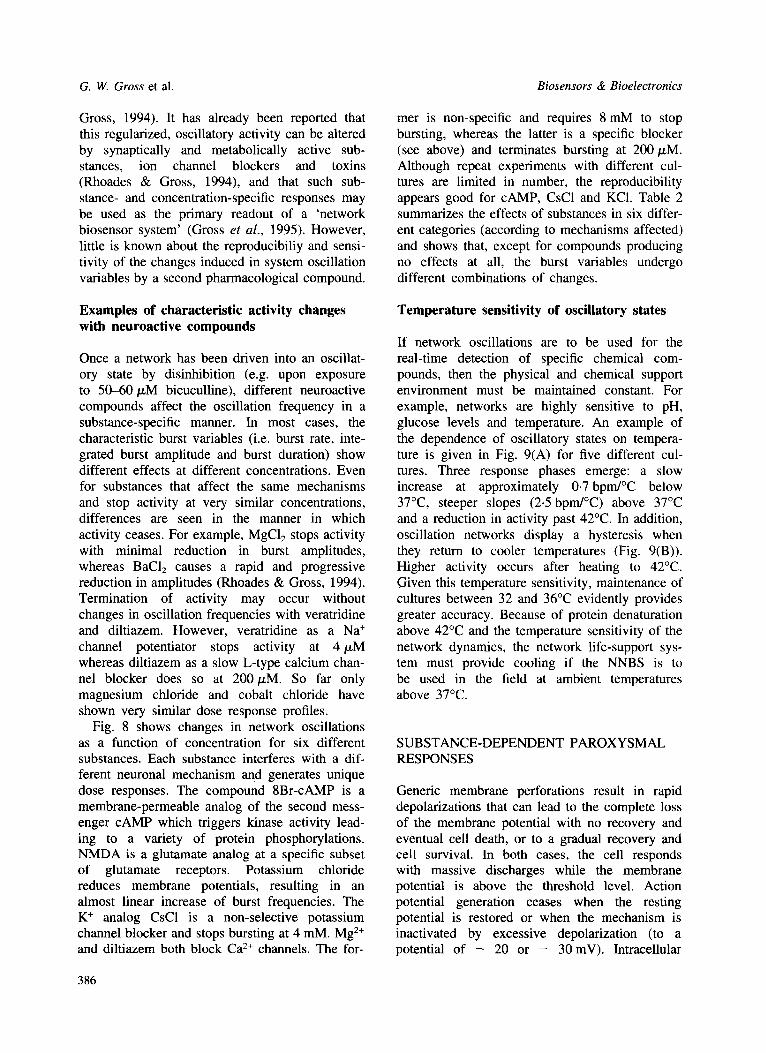
Gross, 1994). It has already been reported that this regularized, oscillatory activity can be altered by synaptically and metabolically active sub- stances, ion channel blockers and toxins (Rhoades & Gross, 1994), and that such sub- stance- and concentration-specific responses may be used as the primary readout of a 'network biosensor system' (Gross et al., 1995). However, little is known about the reproducibiliy and sensi- tivity of the changes induced in system oscillation variables by a second pharmacological compound.
Examples of characteristic activity changes with neuroactive compounds
Once a network has been driven into an oscillat- ory state by disinhibition (e.g. upon exposure to 50--60/zM bicuculline), different neuroactive compounds affect the oscillation frequency in a substance-specific manner. In most cases, the characteristic burst variables (i.e. burst rate, inte- grated burst amplitude and burst duration) show different effects at different concentrations. Even for substances that affect the same mechanisms and stop activity at very similar concentrations, differences are seen in the manner in which activity ceases. For example, MgC12 stops activity with minimal reduction in burst amplitudes, whereas BaC12 causes a rapid and progressive reduction in amplitudes (Rhoades & Gross, 1994). Termination of activity may occur without changes in oscillation frequencies with veratridine and diltiazem. However, veratridine as a Na ÷ channel potentiator stops activity at 4/~M whereas diltiazem as a slow L-type calcium chan- nel blocker does so at 200/~M. So far only magnesium chloride and cobalt chloride have shown very similar dose response profiles.
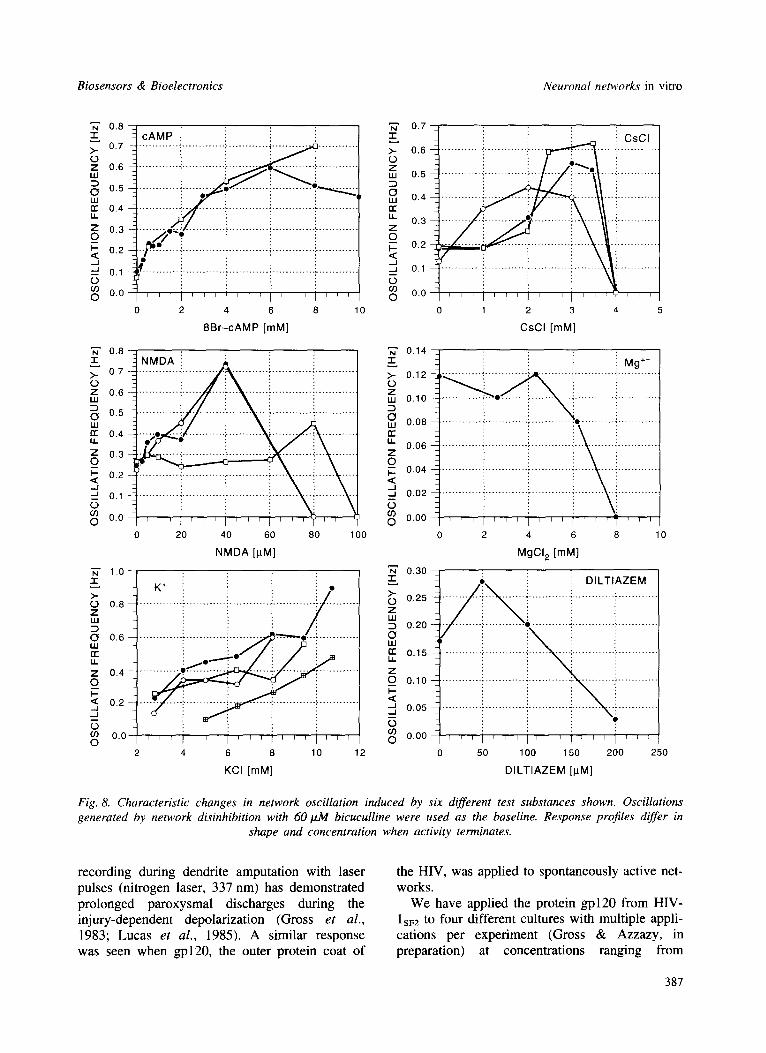
Fig. 8 shows changes in network oscillations as a function of concentration for six different substances. Each substance interferes with a dif- ferent neuronal mechanism and generates unique dose responses. The compound 8Br-cAMP is a membrane-permeable analog of the second mess- enger cAMP which triggers kinase activity lead- ing to a variety of protein phosphorylations. NMDA is a glutamate analog at a specific subset of glutamate receptors. Potassium chloride reduces membrane potentials, resulting in an almost linear increase of burst frequencies. The K ÷ analog CsC1 is a non-selective potassium channel blocker and stops bursting at 4 mM. Mg 2+ and diltiazem both block Ca 2+ channels. The for-
386
mer is non-specific and requires 8 mM to stop bursting, whereas the latter is a specific blocker (see above) and terminates bursting at 200/zM. Although repeat experiments with different cul- tures are limited in number, the reproducibility appears good for cAMP, CsC1 and KC1. Table 2 summarizes the effects of substances in six differ- ent categories (according to mechanisms affected) and shows that, except for compounds producing no effects at all, the burst variables undergo different combinations of changes.
Temperature sensitivity of oscillatory states
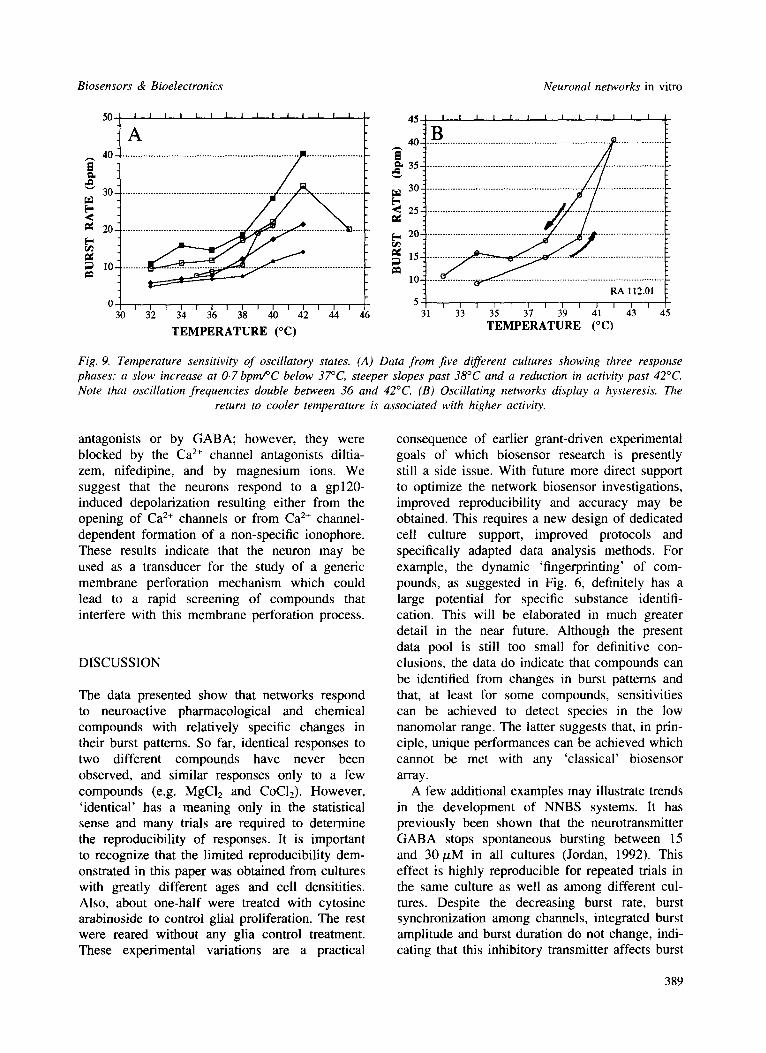
If network oscillations are to be used for the real-time detection of specific chemical com- pounds, then the physical and chemical support environment must be maintained constant. For example, networks are highly sensitive to pH, glucose levels and temperature. An example of the dependence of oscillatory states on tempera- ture is given in Fig. 9(A) for five different cul- tures. Three response phases emerge: a slow increase at approximately 0.7bpm/°C below 37°C, steeper slopes (2.5 bpm/°C) above 37°C and a reduction in activity past 42°C. In addition, oscillation networks display a hysteresis when they return to cooler temperatures (Fig. 9(B)). Higher activity occurs after heating to 42°C. Given this temperature sensitivity, maintenance of cultures between 32 and 36°C evidently provides greater accuracy. Because of protein denaturation above 42°C and the temperature sensitivity of the network dynamics, the network life-support sys- tem must provide cooling if the NNBS is to be used in the field at ambient temperatures above 37°C.
SUBSTANCE-DEPENDENT PAROXYSMAL RESPONSES
Generic membrane perforations result in rapid depolarizations that can lead to the complete loss of the membrane potential with no recovery and eventual cell death, or to a gradual recovery and cell survival. In both cases, the cell responds with massive discharges while the membrane potential is above the threshold level. Action potential generation ceases when the resting potential is restored or when the mechanism is inactivated by excessive depolarization (to a potential of - 20 or - 30 mV). Intracellular
Biosensors & Bioelectronics Neuronal networks in vitro
'-~ 0.8 - c A M P i i ::
0.7 ............ . . . . . . . . . . . . . . . . . . . . . . . . . ! . . . . . . . . . . . . . . . . . . . . . . .
o z
~ 0.4
g o,3 ~ ~ . . . . . . . . . . . . . . i. . . . . . . . . . . . . . . . . . . . . . . . . . i . . . . . . . . . . . . .
~ 0 . 1 - , , . . . . . . . . . . . i . . . . . . . . . . . . . i . . . . . . . . . . . . i . . . . . . . . . . . . . L .. . . . . . . . . . . o co . . . . . . i , , i , ' , i , , , O 0.0
0 2 4 8
~" 0.8 -1- >. 0.7 O Z 0.6
O 0.5
O.4 U_
z 0.3 0 I-- 0.2 .,.J J 0.1
co O 0.o
~" 1.0 "1-
>- 0 0.8 Z LU
O 0,6 uJ n- il z 0.4 o_ I--
< 0.2 . .J ._1 o co 0.0 O
8 B r - c A M P [mM]
i iii!iiiiiill ........ iiiiiiiiiiiiiiiiiiiiiiiiiill
0 20 40 60 80 100
N M D A [I.t M]
1 i i i i i i i i i i r i I I I
2 4 6 8 10 12
~ ' 0.7
~z~ 0,6
.~ 0.5
wO 0.4
0.3
0.2
o.1
~ 0,0 0
~ ' 0.14 "1-
>- 0,12 O z 0.10
O 0,08 n,- ii z O c--
d o
z
i i
I - <
d G
2 3
CsCI [ raM]
4 5
- : M g ++
0 . 0 6
0 . 0 0 I I I I ] I [ I I r I I ~ r I I
0 2 6 8 10
MgCI 2 [mM]
0.30 El $ D I L T I A Z E M o oO OO ol i 0.05
, , , I , , I I , ~ , r [ I i i 0.00
0 50 100 150 200 250
KCl [mM] D I L T I A Z E M [t.tM]
Fig. 8. Characteristic changes in network oscillation induced by six different test substances shown. Oscillations generated by network disinhibition with 60 tzM bicuculline were used as the baseline. Response profiles differ in
shape and concentration when activity terminates.
recording during dendrite amputation with laser pulses (nitrogen laser, 337 nm) has demonstrated prolonged paroxysmal discharges during the injury-dependent depolarization (Gross et al., 1983; Lucas et al., 1985). A similar response was seen when gpl20, the outer protein coat of
the HIV, was applied to spontaneously active net- works.
We have applied the protein gpl20 from HIV- lsF2 to four different cultures with multiple appli- cations per experiment (Gross & Azzazy, in preparation) at concentrations ranging from
387

G. W. Gross et al. Biosensors & Bioelectronics
TABLE 2 Substance-dependent changes of oscillatory states
Substance
Changes in burst variables*
Conc. range BRate BAmp BDur Comments
Membrane depolarizers Veratridinet l~i/.LM
Ouabain 5-10 p,M 0
Potassium 5-11/xM + + + chloride Calcium analogs and calcium channel blockers Magnesium 1-8 mM 0 chloride Cobalt chloride 1-10 mM 0
Barium chloridet 1-6 mM 0 DiltiazemHC1 10-500/zM 0 Calcium channel activators NMDA 1-80/xM + + + Potassium analogs or channel blockers Cesium chloride 1-4 mM + + +
4 amino pyridine 10-160/xM + + +
Calcium-dependent potassium channel blockers Tetraethyl 1-50 mM 0 ammonium Charybdotoxin 50-200 nM + Apamin 1-40/xM 0 Acetylcholine 0.2-3.5 mM +
0 0
+
+
+ +
0 0 0 0 0
Muscarine 10-100 p,M 0 0 0 Others 8Br-c-AMP 0.1-8 mM + + + Choline chloride 5-25 mM 0 0 0
Sudden loss of BA at 4/xM Activity lost at 5/zM Activity loss in 10 min Linear inc. in BR
Sudden loss at 7 mM Activity lost at 10 mM Loss at 5 mM Loss at 200 p~M
Sudden loss at 4mM Lengthens action potential duration
BR inc. after 20 mM
Increases native activity
Analog of cAMP Sodium substitution
*BRate: bursts per minute; BAmp: integrated burst amplitude (arbitrary units); BDur: burst duration (seconds). tSubstances for which original activity could not be reestablished after several washes.
1 ~g/100/zl to 1 p~g/10/xl in a special carder medium (Dulbecco's Modified Eagle Medium with 0.5 mg BSA/ml). In all cases the additions were made to a constant volume medium bath of 1 ml. We have observed massive, prolonged, high frequency spike discharges immediately after the application of 1/xg gpl20. The onset of these paroxysmal discharges was generally coordinated among the active units, but the response varied in length and pattern of activity among different cells. All responses were self-terminating after a
variable time with a maximum tonic activity per- iod of 2 min. Network activity resumed spon- taneously after a variable quiet period during which no spiking or bursting was observed on any of the 64 electrodes. The recovery was more rapid after a medium change. Repeated appli- cation did not result in cell death or in the diminution of the subsequent response.
The responses are shown with integrated data from a 10-channel chart recording in Fig. 10. The discharges were not blocked by NMDA
388
Biosensors & Bioelectronics Neuronal networks in vitro
50
4 0
" ~ 3 0
20 b-
10-
0 30 312
I I I I I I I I I I I I I I I
A
I ' ' 314 I 316 ' 318 ' 410 ' 412 ' 44 46
TEMPERATURE (°C)
45 I I 1 I I I I I I I I I 1
4oB 35- .........................................................................................
30-: ......................................................................................
"~ 25-~ . . . . . . . . . . . . . . . . . . . . . . . . . . . . . . . . . . . . . . . . . . . . . . . . . . . . . . . . . . . . . . . . . . . . . . . . . . . . . . . . .
5 ] I I I I i I I I r J I I I 31 33 35 37 39 41 43 45
TEMPERATURE (°C)
Fig. 9. Temperature sensitivity of oscillatory states. (A) Data from five different cultures showing three response phases: a slow increase at 0.7 bpmPC below 37°C, steeper slopes past 38°C and a reduction in activity past 42°C. Note that oscillation frequencies double between 36 and 42°C. (B) Oscillating networks display a hysteresis. The
return to cooler temperature is associated with higher activity.
antagonists or by GABA; however, they were blocked by the Ca 2÷ channel antagonists diltia- zem, nifedipine, and by magnesium ions. We suggest that the neurons respond to a gpl20- induced depolarization resulting either from the opening of Ca 2+ channels or from Ca 2+ channel- dependent formation of a non-specific ionophore. These results indicate that the neuron may be used as a transducer for the study of a generic membrane perforation mechanism which could lead to a rapid screening of compounds that interfere with this membrane perforation process.
DISCUSSION
The data presented show that networks respond to neuroactive pharmacological and chemical compounds with relatively specific changes in their burst patterns. So far, identical responses to two different compounds have never been observed, and similar responses only to a few compounds (e.g. MgC12 and COC12). However, 'identical' has a meaning only in the statistical sense and many trials are required to determine the reproducibility of responses. It is important to recognize that the limited reproducibility dem- onstrated in this paper was obtained from cultures with greatly different ages and cell densitities. Also, about one-half were treated with cytosine arabinoside to control glial proliferation. The rest were reared without any glia control treatment. These experimental variations are a practical
consequence of earlier grant-driven experimental goals of which biosensor research is presently still a side issue. With future more direct support to optimize the network biosensor investigations, improved reproducibility and accuracy may be obtained. This requires a new design of dedicated cell culture support, improved protocols and specifically adapted data analysis methods. For example, the dynamic 'fingerprinting' of com- pounds, as suggested in Fig. 6, definitely has a large potential for specific substance identifi- cation. This will be elaborated in much greater detail in the near future. Although the present data pool is still too small for definitive con- clusions, the data do indicate that compounds can be identified from changes in burst patterns and that, at least for some compounds, sensitivities can be achieved to detect species in the low nanomolar range. The latter suggests that, in prin- ciple, unique performances can be achieved which cannot be met with any 'classical' biosensor array.
A few additional examples may illustrate trends in the development of NNBS systems. It has previously been shown that the neurotransmitter GABA stops spontaneous bursting between 15 and 30/xM in all cultures (Jordan, 1992). This effect is highly reproducible for repeated trials in the same culture as well as among different cul- tures. Despite the decreasing burst rate, burst synchronization among channels, integrated burst amplitude and burst duration do not change, indi- cating that this inhibitory transmitter affects burst
389

G. W. Gross et al. Biosensors & Bioelectronics
"I rain
2
A a t
~ w
$
I 1,1. lk ILllkL tltd %, . . . . . . . . . . . .
i• I | . . . . . , , L h , " I , . U , _ ~ . . ~ I L ' L ~ L k . L .
Fig. 10. Network response (12 channels) to gpl20 from HIV-lsv2 at a concentration of 1 tzg/lO0 Ixl applied to a 1 ml medium bath (final concentration 1 Ixg/1.1 ml) in a special carrier medium (Dulbecco's Modified Eagle Medium with 0.5 mg BSA/ml). The application time is indicated by an arrow. The network responded immediately with highly unusual, massive paroxysmal discharges that lasted as long as 2 min (channels 3 and 4). Responses terminated spontaneously but with variability among channels. Discharges were followed by variable quiet periods
with spontaneous recovery of bursting.
initiation but not burst synchronization, mainte- nance and termination. Glycine responses are more complex and bursting stops at approxi- mately 60--100 txM, with some random spiking remaining under these conditions. These results, together with the strychnine data presented in this paper, suggest that network biosensors, at least initially, will perform well with certain com- pounds and less well with others. Their utility will be determined by possible applications to a group of crucial compounds and toxins that evade
rapid sensing by conventional means. Hence, the NNBS systems do not represent a general pana- cea. They will supplement existing sensing approaches in very specific areas. In this context, the use of oscillatory states and screening of pathological agents will play a major role.
The utility of oscillatory states
Oscillatory states are simpler to quantify because they stabilize the network activity in a regularized
390

Biosensors & Bioelectronics Neuronal networks in vitro
pattem. Under this condition, a test substance effect may appear more reproducible because the baseline activity is more stable. However, the regular oscillations also seem to give the system activity more 'inertia' so that improved reproduci- bility may be achieved at the expense of decreased sensitivity. Another problem may be the length of time a stable oscillation can be maintained. Although strychnine- or bicuculline- induced oscillations have been maintained for over 2 days (Gross, unpublished observations), the burst frequency decreases with time and the culture appears stressed. It is not yet known whether sensitivities and substance profiles change under such conditions. If oscillating net- works demonstrate clear advantages over native networks for the analysis of specific compounds, it should be possible to cycle the system and induce oscillations only a short time prior to a sensing task. When not used for a sensory task, the system can be returned to the native state by washing out the disinhibiting agent.
It is interesting to note that cultured networks respond differently to different strychnine appli- cation protocols. A gradual increase in this subst- ance in steps of 20 or 50 nM over a time period of 2 h will not lead to coordinated oscillatory bursting at 5/zM, whereas the sudden application of 5/xM strychnine always leads to an oscillatory activity characterized by highly regular burst vari- ables. This observation implies that the network is adjusting to the slow increase in strychnine. It is possible that the gradual blocking of glycine receptors leads to a compensatory, gradual upreg- ulation by the neurons. Hence, any utilization of neuronal networks for biosensor functions must be cognizant of homeostatic cellular changes and must use protocols that take into consideration this flexibility of living systems.
Sreening for pathological agents
The massive paroxysmal response recorded after application of the recombinant viral HIV envelope protein gpl20 suggests a rapid, substantial depol- arization of network neurons. The intensity of the responses, length of the high frequency spiking and individuality of activity profiles on different channels are all highly unusual observations. The coordination of short duration bursts (before the application of gpl20) and the breakdown of coor- dination during the gpl20-induced massive dis- charges has never been observed, either in the
native state or under the influence of any other pharmacological compound. This response dem- onstrates a cellular-driven dynamics in addition to network effects. It appears that different neu- rons are affected differently by the gpl20 protein. Although these effects can be caused by non- uniform mixing of the test substance, the fact that similar responses were obtained during six successive applications in the same culture (Gross & Azzazy, in preparation) suggests mem- brane-specific events.
The gpl20 protein has been available to inves- tigators for some time and has been shown to be neurotoxic to cultured hippocampal and retinal ganglion neurons (Brennemann et al., 1988; Dreyer et al., 1990). Mechanisms proposed so far range from antagonism of vasoactive intestinal peptide to excessive accumulation of intracellular free calcium. In addition, HIV-mediated cyto- pathic effects have been reported for microglia, oligodendrocytes and astrocytes, and it is likely that gpl20 plays a major role in these pathologies (Rice, 1992). We have not yet investigated the long-term effects of this protein but have obtained preliminary evidence that calcium currents are involved. Excessive cytoplasmic Ca 2+ accumu- lation usually leads to cell death. The short-term effects seen here demonstrate that the sensitive electrophysiological responses of neurons can be used to detect the initial stages of pathological events. This, in turn, provides an effective test platform for the rapid screening of compounds designed to prevent the interaction of gpl20 with nerve cell membranes. The same system can also be used to establish the neurotoxicity of the test substances.
OUTLOOK
Neurons are homeostatic systems which con- stantly regenerate biomolecules or structures and are therefore renewable 'receptor platforms'. Con- ditions under which networks of such neurons provide high sensitivity, reliability and reproduci- bility in identifying substances have to be optim- ized in order to apply these networks for analyti- cal or diagnostic purposes in the biosensor domain. In this context, the complexity of grow- ing high quality cultures with minimum varia- bility in cell density and cell type distribution should, however, not be underestimated. In addition, the maintenance of such systems is not
391
G. W. Gross et al. Biosensors & Bioelectronics
a simple matter. The data obtained so far suggest that NNBS are limited by both neurobiological constraints and by the resolution of various tech- nical challenges.
Clearly, substances that are not neuroactive cannot be used unless specific, novel receptors can be expressed in neurons by genetic engineer- ing approaches (Gross et al., (1992, 1995)). For neuroactive substances, challenging technical problems remain:
(1) Introduction of the test substance into the medium must occur without generating rapid osmolarity or pH changes.
(2) Sterilizing the test substance must be per- formed without destroying the activity of pertinent molecules.
(3) Portable reliable life-support systems have to be developed that ensure a constant temperature, pH and nutrient environment.
(4) Economical data processing and display methods must be selected and developed.
(5) The effects of multivariate inputs (such as unexpected ligands) and unexpected net- work responses have to be understood.
(6) Toxic levels of substances have to be recognized and allowed to trigger protective life-support adjustments.
(7) Sampling techniques must be developed to provide optimal use of network responses.
None of these problems seems insurmountable. The associated technical complexity and develop- mental expense necessitates that a clear appli- cation domain has to be identified where the NNBS system outperforms any alternative exist- ing or proposed chemical or biochemical sensor. The identification of strychnine effects in the present paper may be considered as the first example. Other substances such as nerve gases and biochemical hazards need similar (or better) scrutiny. Thereafter, a successful double blind identification of substances may suffice to trigger a more formal exploration of the huge potential of neuronal network biosensors.
ACKNOWLEDGEMENTS
This research was supported by the Hillcrest Foundation, founded by Mrs W. W. Caruth Sr, and the 'Founds der Chemischen Industrie' (D) as well as the 'Ministry of Baden-Wtirttemberg' (D) with support of a graduate student (A.H.)
392
through the Institute for Physical and Theoretical Chemistry at the University of Tiibingen. The excellent technical support of Lynn Gargan (cell culture) and Todd Hall (photolithography) is gratefully acknowledged as is the critical reading of the manuscript by Dr Christiane Ziegler.
REFERENCES
Brennemann, D. E., Westbrook, G. L., Fitzgerald, S. P., Ennist, D. L., Elkins, K. L., Ruff, M. R. and Pert, C. B. (1988) Neuronal cell killing by the envelope protein of HIV and its prevention by vasoactive intestinal peptide. Nature 335, 639-642.
Dreyer, E. B., Kaiser, P. K., Offermann, J. T. and Lipton, S. A. (1990) HIV-1 coat protein neurotox- icity prevented by calcium channel antogonists. Science 248, 364-367.
Droge, M. H., Gross, G. W., Hightower, M. H. and Czisny, L. E. (1986) Multielectrode analysis of coordinated, rhythmic bursting in cultured CNS monolayer networks. J. Neurosci. 6, 1583-1592.
Eckmann, J. P., Kamphorst, S. and Ruelle, D. (1987) Recurrence plots of dynamical systems. Europhys. Lett. 4, 973-977.
Gtipel, W. (1994a). New materials and transducers for chemical sensors. Conf. Proc. Eurosensors VII, Budapest, 9/1993; Sensors & Actuators B, 18119, 1-21.
Gtipel, W. (1994b). Interface analysis in biosensor design. Conf. Proc. Biosensors 94, New Orleans, 6/1994; Conf. Proc. Artificial Biosensing Inter- faces, Athens, 12/1994; Biosensors & Bioelectron- ics, 10, 853-883.
G6pel, W. (1995). Sensors and "smart" molecular nano- structures: components for future information tech- nologies. In Sensors: A Comprehensive Survey, ed. W. G6pel, J. Hesse & J. N. Zemel. VCH, Weinheim, Vol. 8: Trends in Sensor Technology~Sensor Markets. ISBN: 3-527-26774-3, pp. 295-336.
GOpel, W. (1996). Ultimate limits in the minaturization of chemical sensors. Sensors & Actuators (in press).
Gopal, K. V. & Gross, G. W. (1996a). Auditory cortical neurons in vitro: cell culture and multichannel extracellular recording. Acta Otolaryngologica 116, 690-696.
Gopal, K. V. & Gross, G. W. (1996b). Auditory cortical neurons in vitro: initial pharmacological studies. Acta Otolaryngologica 116, 697-704.
Gross, G. W. (1979) Simultaneous single unit recording in vitro with a photoetched, laser-deinsulated, gold multimicroelectrode surface. IEEE Trans. Biomed. Eng. BME 26, 273-279.
Gross, G. W. and Lucas, J. H. (1982) Long-term
Biosensors & Bioelectronics Neuronal networks in vitro
monitoring of spontaneous single unit activity from neuronal monolayer networks cultured on photo- etched multielectrode surfaces. J. Electrophys. Tech. 9, 55-67.
Gross, G. W., Lucas, J. H. and Higgins, L. M. (1983) Laser microbeam surgery: ultra-structural changes associated with neurite transection in culture. J. Neurosci. 3, 1979.
Gross, G. W., Wen, W. and Lin, J. (1985) Transparent indium-tin oxide patterns for extra-cellular, multi- site recording in neuronal culture. J. Neurosci. Meth. 15, 243-252.
Gross, G. W. & Kowalski, J. M. (1991). Experimental and theoretical analysis of random nerve cell net- work dynamics. In Neural Network: Concepts, Applications, and Implementations, ed. P. Antog- netti & V. Milutinovic. Prentice Hall, Englewood, New Jersey, Vol. 4, pp. 47-110.
Gross, G. W., Rhoades, B. K. and Jordan, R. J. (1992) Neuronal networks for biochemical sensing. Sen- sors & Actuators 6, 1-8.
Gross, G. W., Rhoades, B. K., Reust, D. L. and Schwalm, F. U. (1993) Stimulation of monolayer networks in culture through thin film indium-tin oxide recording electrodes. J. Neurosci. Meth. 50, 131-143.
Gross, G. W. and Schwalm, F. U. (1994) A closed chamber for long-term electrophysiological and microscopical monitoring of monolayer neuronal networks. J. Neurosci. Meth. 52, 73-85.
Gross, G. W. and Rhoades, B. K. (1994). Internal dynamics of randomized mammalian neuronal net- works in culture. In Enabling Technologies for Cultured Neural Networks, ed. D. A. Stenger & T. M. McKenna. Academic Press, New York, pp. 277-317.
Gross, G. W., Azzazy, H. M. E., Wu, M. -C. and Rhoades, B. K. (1995) The use of neuronal net- works on multielectrode arrays as biosensors. Biosensors & Bioelectronics 10, 553-567.
Jordan, R., (1992) Investigations of inhibitory synaptic influences in neuronal monolayer networks cultured from mouse spinal cord, M.S. thesis, University of North Texas, Denton, 1992.
Loots, G. P., Loots, J. M., Brown, J. M. M. and Schoeman, J. L. (1979) A rapid silver impregnation method for nervous tissue: a modified protargol- peroxide technique. Stain TechnoL 54, 97-101.
Lucas, J. H., Gross, G. W., Emery, D. G. and Gardner, C. R. (1985) Neuronal survival after dendrite tran- section close to the perikaryon. Central Nervous System Trauma 2, 231-255.
Ransom, B. K. and Gross, G. W. (1994) Potassium and calcium channel dependence of bursting in cultured neuronal networks. Brain Res. 643, 310- 318.
Ransom, B. R., Neile, E., Henkart, M., Bullock, P. N. and Nelson, P. G. (1977) Mouse spinal cord in cell culture. J. NeurophysioL 40, 1132-1150.
Rhoades, B. K. and Gross, G. W. (1994) Potassium and calcium channel dependence of bursting in cultured neuronal networks. Brain Res. 643, 310- 318.
Rhoades, B. K., Weil, J. C., Kowalski, J. M. and Gross, G. W. (1996) Distribution-free graphical and stat- istical analysis of serial dependence in neuronal spike trains. J. Neurosci. Meth. 64, 25-37.
Rice, G. P. A. (1992) Virus-induced demyelination in man: models for multiple sclerosis. Curr. Opin. Neurol. Neurosurg. 5, 188-194.
Sparks, C. A. & Gross, G. W. (1995). Reversible network responses to electrical stimulation: post- stimulation changes in spontaneous activity in cul- tured mammalian spinal networks. Soc. Neurosci. Abst. 21: Abst. No. 74.3.
Webber, C. L. and Zbilut, J. P. (1994) Dynamical assessment of physiological systems and states using recurrence plot strategies. J. Appl. Physiol. 76, 965-973.
Weimar, U., Vaihinger, S., Schierbaum, K.-D. & G~3pel, W. (1991). Multicomponent analysis in chemical sensing. In Chemical Sensor Technology, ed. N. Yamazoe. Kodansha, Tokyo, Vol. III, pp. 51-88.
West, B. J. (1990). Fractal Physiology and Chaos in Medicine. World Science, Singapore.
West, B. J. (1995) Fractal statistics in biology. Physica D 86, 12-18.
393