Odor quality coding and categorization in human posterior piriform cortex
9
Odor quality coding and categorization in human posterior piriform cortex James D Howard 1 , Jane Plailly 2 , Marcus Grueschow 3–5 , John-Dylan Haynes 3,4 & Jay A Gottfried 1,6,7 Efficient recognition of odorous objects universally shapes animal behavior and is crucial for survival. To distinguish kin from nonkin, mate from nonmate and food from nonfood, organisms must be able to create meaningful perceptual representations of odor qualities and categories. It is currently unknown where and in what form the brain encodes information about odor quality. By combining functional magnetic resonance imaging (fMRI) with multivariate (pattern-based) techniques, we found that spatially distributed ensemble activity in human posterior piriform cortex (PPC) coincides with perceptual ratings of odor quality, such that odorants with more (or less) similar fMRI patterns were perceived as more (or less) alike. We did not observe these effects in anterior piriform cortex, amygdala or orbitofrontal cortex, indicating that ensemble coding of odor categorical perception is regionally specific for PPC. These findings substantiate theoretical models emphasizing the importance of distributed piriform templates for the perceptual reconstruction of odor object quality. An important property of the brain is its ability to create coherent, meaningful perceptual constructs from the complexity of the outside world. These internalized representations of the external environ- ment provide a neural basis for object recognition, identification and categorization, enabling organisms to focus cognitive resources, optimize behavioral responses and generalize past experiences to novel events 1,2 . Research on object processing has traditionally focused on visual object processing 2,3 , which tends to overshadow the critical ecological role of ‘odor objects’, which we define as the perceptual quality or character of a smell emitted from an odorous substance. Efficient recognition of odor objects universally shapes animal behavior and is crucial for survival. Indeed, the ubiquity of olfactory-guided adaptive behaviors across vertebrate and invertebrate species, including mater- nal bonding 4 , kinship recognition 5 , mate selection 6 and territorial defense 7 , makes it clear that olfactory systems are important for recording and classifying odor objects. Where and in what form does the brain encode the perceptual quality of an odor object? Several elegant studies have demonstrated that odor-evoked spatial activity in the rodent olfactory bulb correlates with behavioral measures of odor similarity 8–11 , as shown by habitua- tion or reinforcement learning procedures, leading to the suggestion that neural representations of odor quality are reflected in ensemble bulbar activity. However, the obligatory use of indirect perceptual assays in animal models hampers efforts to establish an explicit link between neural response patterns and odor quality perception. Such limitations accentuate the unique advantages of studying human subjects, whose ability to verbalize their percepts 12 and use perceptual rating scales offers an ideal research alternative for clarifying the neuroscientific underpinnings of odor quality perception. One plausible location for the encoding and classification of odor quality information is primary olfactory (piriform) cortex, which receives direct input from the olfactory bulb and has extensive inter- connections with intrinsic and extrinsic fiber systems, including amygdala, hypothalamus, entorhinal cortex and orbitofrontal cortex (OFC) 13,14 . The privileged access that the piriform cortex has to sensory, affective, physiological and motivational features of an olfac- tory stimulus perfectly endows it with the capacity for weaving together odor representations with direct relevance for perception and behavior. This hypothesis receives support from both anatomical 15,16 and com- putational 14,17,18 models, which predict that odor percepts are embo- died in spatially distributed patterns of piriform activity, providing a robust neural substrate for odor coding, memory and recall. However, direct neurobiological evidence for this idea is currently not available and the functional architecture of odor object qualities in the olfactory brain remains unknown. We combined high-resolution fMRI with olfactory multivariate analysis techniques 19 (Fig. 1) to investigate spatial ensemble coding of odor qualities and categories in human PPC. Multivariate fMRI methods 20–22 differ from conventional (univariate) fMRI analyses, in which data are averaged over space (voxels), time (scans) and subjects, obscuring potentially important information that may be contained at the level of individual voxels, scans and subjects. These pattern-based approaches provide a robust new method for Received 24 February; accepted 27 March; published online 31 May 2009; doi:10.1038/nn.2324 1 Cognitive Neurology & Alzheimer’s Disease Center, Northwestern University Feinberg School of Medicine, Chicago, Illinois, USA. 2 Laboratoire de Neurosciences et Syste `mes Sensoriels, Universite ´ Claude-Bernard Lyon, Lyon, France. 3 Bernstein Center for Computational Neuroscience, Charite ´–Universita ¨tsmedizin, Berlin, Germany. 4 Max Planck Institute for Human Cognitive and Brain Sciences, Leipzig, Germany. 5 Department of Neurology, Otto von Guericke University, Magdeburg, Germany. 6 Department of Neurology, Northwestern University Feinberg School of Medicine, Chicago, Illinois, USA. 7 Department of Psychology, Northwestern University Weinberg College of Arts and Sciences, Evanston, Illinois, USA. Correspondence should be addressed to J.A.G. ([email protected]). 932 VOLUME 12 [ NUMBER 7 [ JULY 2009 NATURE NEUROSCIENCE ARTICLES © 2009 Nature America, Inc. All rights reserved.
Transcript of Odor quality coding and categorization in human posterior piriform cortex
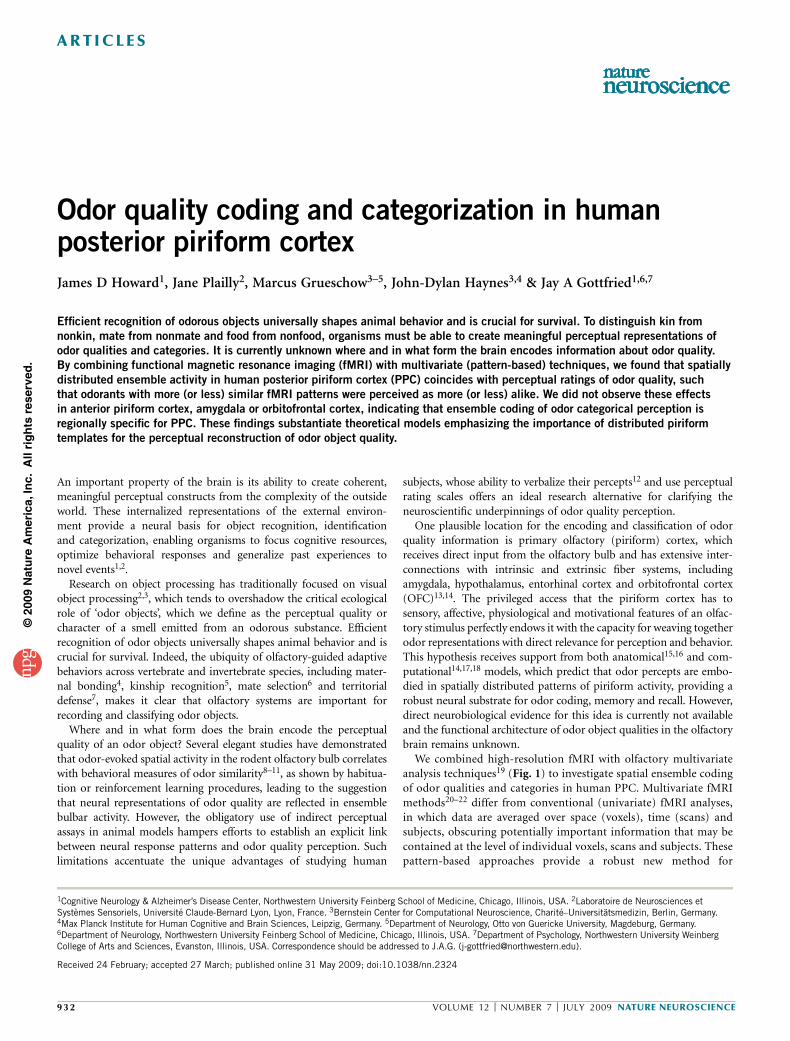
Odor quality coding and categorization in humanposterior piriform cortex
James D Howard1, Jane Plailly2, Marcus Grueschow3–5, John-Dylan Haynes3,4 & Jay A Gottfried1,6,7
Efficient recognition of odorous objects universally shapes animal behavior and is crucial for survival. To distinguish kin from
nonkin, mate from nonmate and food from nonfood, organisms must be able to create meaningful perceptual representations of
odor qualities and categories. It is currently unknown where and in what form the brain encodes information about odor quality.
By combining functional magnetic resonance imaging (fMRI) with multivariate (pattern-based) techniques, we found that spatially
distributed ensemble activity in human posterior piriform cortex (PPC) coincides with perceptual ratings of odor quality, such
that odorants with more (or less) similar fMRI patterns were perceived as more (or less) alike. We did not observe these effects
in anterior piriform cortex, amygdala or orbitofrontal cortex, indicating that ensemble coding of odor categorical perception is
regionally specific for PPC. These findings substantiate theoretical models emphasizing the importance of distributed piriform
templates for the perceptual reconstruction of odor object quality.
An important property of the brain is its ability to create coherent,meaningful perceptual constructs from the complexity of the outsideworld. These internalized representations of the external environ-ment provide a neural basis for object recognition, identificationand categorization, enabling organisms to focus cognitive resources,optimize behavioral responses and generalize past experiences tonovel events1,2.
Research on object processing has traditionally focused on visualobject processing2,3, which tends to overshadow the critical ecologicalrole of ‘odor objects’, which we define as the perceptual quality orcharacter of a smell emitted from an odorous substance. Efficientrecognition of odor objects universally shapes animal behavior and iscrucial for survival. Indeed, the ubiquity of olfactory-guided adaptivebehaviors across vertebrate and invertebrate species, including mater-nal bonding4, kinship recognition5, mate selection6 and territorialdefense7, makes it clear that olfactory systems are important forrecording and classifying odor objects.
Where and in what form does the brain encode the perceptualquality of an odor object? Several elegant studies have demonstratedthat odor-evoked spatial activity in the rodent olfactory bulb correlateswith behavioral measures of odor similarity8–11, as shown by habitua-tion or reinforcement learning procedures, leading to the suggestionthat neural representations of odor quality are reflected in ensemblebulbar activity. However, the obligatory use of indirect perceptualassays in animal models hampers efforts to establish an explicit linkbetween neural response patterns and odor quality perception. Suchlimitations accentuate the unique advantages of studying human
subjects, whose ability to verbalize their percepts12 and use perceptualrating scales offers an ideal research alternative for clarifying theneuroscientific underpinnings of odor quality perception.
One plausible location for the encoding and classification of odorquality information is primary olfactory (piriform) cortex, whichreceives direct input from the olfactory bulb and has extensive inter-connections with intrinsic and extrinsic fiber systems, includingamygdala, hypothalamus, entorhinal cortex and orbitofrontal cortex(OFC)13,14. The privileged access that the piriform cortex has tosensory, affective, physiological and motivational features of an olfac-tory stimulus perfectly endows it with the capacity for weaving togetherodor representations with direct relevance for perception and behavior.This hypothesis receives support from both anatomical15,16 and com-putational14,17,18 models, which predict that odor percepts are embo-died in spatially distributed patterns of piriform activity, providing arobust neural substrate for odor coding, memory and recall. However,direct neurobiological evidence for this idea is currently not availableand the functional architecture of odor object qualities in the olfactorybrain remains unknown.
We combined high-resolution fMRI with olfactory multivariateanalysis techniques19 (Fig. 1) to investigate spatial ensemble codingof odor qualities and categories in human PPC. Multivariate fMRImethods20–22 differ from conventional (univariate) fMRI analyses,in which data are averaged over space (voxels), time (scans) andsubjects, obscuring potentially important information that may becontained at the level of individual voxels, scans and subjects. Thesepattern-based approaches provide a robust new method for
Received 24 February; accepted 27 March; published online 31 May 2009; doi:10.1038/nn.2324
1Cognitive Neurology & Alzheimer’s Disease Center, Northwestern University Feinberg School of Medicine, Chicago, Illinois, USA. 2Laboratoire de Neurosciences etSystemes Sensoriels, Universite Claude-Bernard Lyon, Lyon, France. 3Bernstein Center for Computational Neuroscience, Charite–Universitatsmedizin, Berlin, Germany.4Max Planck Institute for Human Cognitive and Brain Sciences, Leipzig, Germany. 5Department of Neurology, Otto von Guericke University, Magdeburg, Germany.6Department of Neurology, Northwestern University Feinberg School of Medicine, Chicago, Illinois, USA. 7Department of Psychology, Northwestern University WeinbergCollege of Arts and Sciences, Evanston, Illinois, USA. Correspondence should be addressed to J.A.G. ([email protected]).
932 VOLUME 12 [ NUMBER 7 [ JULY 2009 NATURE NEUROSCIENCE
ART ICLES
©20
09 N
atu
re A
mer
ica,
Inc.
All
rig
hts
res
erve
d.
characterizing how (rather than just where) perceptual infor-mation is represented in the human brain23.
Our study consists of two independent experiments centered on thehypothesis that odor qualities and categories are encoded as distributedspatial ensembles in human PPC. In Experiment 1, we combinedmultivariate and cortical flattening techniques to test whether qualita-tively distinct odorants are associated with unique multi-voxel fMRIpatterns in PPC in the absence of mean activation differences, odor-evoked fMRI representations in PPC are distributed and overlapping,without evidence for topographical clustering; and olfactory ensemblecodes of odor quality are regionally specific for PPC. In Experiment 2,we extended these hypotheses to a wider set of odorants, which, incombination with multidimensional scaling techniques, enabled us toexamine whether fMRI ensemble patterns in PPC constitute anolfactory code that aligns with categorical perception of odor quality.
RESULTS
Experiment 1: odor-specific ensemble codes in PPC and OFC
We set out to test the hypothesis that neural codes of odor quality takethe form of ensemble fMRI activity in PPC. We decided to target PPCas a primary region of interest because recent animal and humanstudies have suggested that neural representations of odor quality arestored in this brain region24,25. During fMRI scanning, six subjectssniffed four easily distinguishable odorants (R-(�)-carvone (mint),phenethyl alcohol (rose), amyl acetate (banana) and citronellol(lemon)) across a total of 24 imaging runs. On each odorant presenta-tion, subjects were visually cued to make a sniff and to tacitly identifythe quality of the odor.
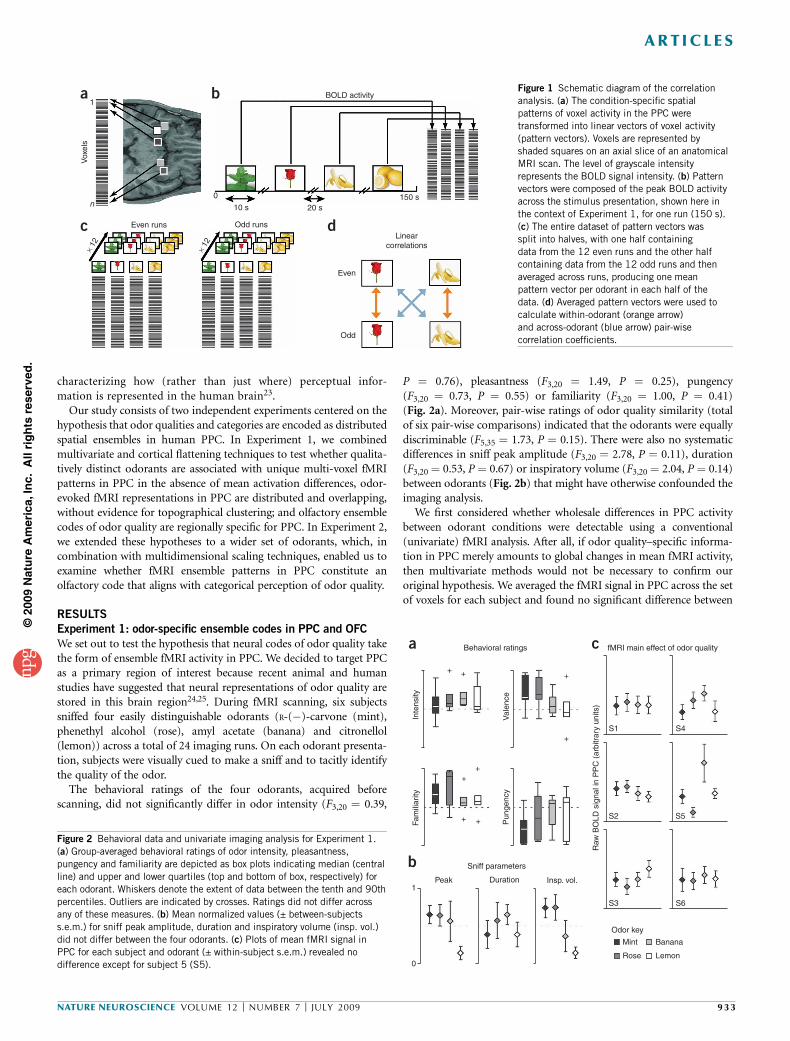
The behavioral ratings of the four odorants, acquired beforescanning, did not significantly differ in odor intensity (F3,20 ¼ 0.39,
P ¼ 0.76), pleasantness (F3,20 ¼ 1.49, P ¼ 0.25), pungency(F3,20 ¼ 0.73, P ¼ 0.55) or familiarity (F3,20 ¼ 1.00, P ¼ 0.41)(Fig. 2a). Moreover, pair-wise ratings of odor quality similarity (totalof six pair-wise comparisons) indicated that the odorants were equallydiscriminable (F5,35 ¼ 1.73, P ¼ 0.15). There were also no systematicdifferences in sniff peak amplitude (F3,20 ¼ 2.78, P ¼ 0.11), duration(F3,20 ¼ 0.53, P ¼ 0.67) or inspiratory volume (F3,20 ¼ 2.04, P ¼ 0.14)between odorants (Fig. 2b) that might have otherwise confounded theimaging analysis.
We first considered whether wholesale differences in PPC activitybetween odorant conditions were detectable using a conventional(univariate) fMRI analysis. After all, if odor quality–specific informa-tion in PPC merely amounts to global changes in mean fMRI activity,then multivariate methods would not be necessary to confirm ouroriginal hypothesis. We averaged the fMRI signal in PPC across the setof voxels for each subject and found no significant difference between
1
Vox
els
n0
Even runs Odd runs
Even
Linearcorrelations
Odd
× 12
× 12
10 s 20 s150 s
BOLD activitya
c d
b
Behavioral ratings
S1 S4
S2
Sniff parameters
Peak1
0
Duration Insp. vol.
Odor key
Mint
Rose
Banana
Lemon
S5
S3 S6
fMRI main effect of odor quality
Inte
nsity
Fam
iliar
ity
Pun
genc
y
Raw
BO
LD s
igna
l in
PP
C (
arbi
trar
y un
its)
Val
ence
+ + +
+
++
+ +
a
b
c
Figure 2 Behavioral data and univariate imaging analysis for Experiment 1.
(a) Group-averaged behavioral ratings of odor intensity, pleasantness,
pungency and familiarity are depicted as box plots indicating median (central
line) and upper and lower quartiles (top and bottom of box, respectively) for
each odorant. Whiskers denote the extent of data between the tenth and 90th
percentiles. Outliers are indicated by crosses. Ratings did not differ acrossany of these measures. (b) Mean normalized values (± between-subjects
s.e.m.) for sniff peak amplitude, duration and inspiratory volume (insp. vol.)
did not differ between the four odorants. (c) Plots of mean fMRI signal in
PPC for each subject and odorant (± within-subject s.e.m.) revealed no
difference except for subject 5 (S5).
Figure 1 Schematic diagram of the correlation
analysis. (a) The condition-specific spatial
patterns of voxel activity in the PPC were
transformed into linear vectors of voxel activity
(pattern vectors). Voxels are represented by
shaded squares on an axial slice of an anatomical
MRI scan. The level of grayscale intensity
represents the BOLD signal intensity. (b) Patternvectors were composed of the peak BOLD activity
across the stimulus presentation, shown here in
the context of Experiment 1, for one run (150 s).
(c) The entire dataset of pattern vectors was
split into halves, with one half containing
data from the 12 even runs and the other half
containing data from the 12 odd runs and then
averaged across runs, producing one mean
pattern vector per odorant in each half of the
data. (d) Averaged pattern vectors were used to
calculate within-odorant (orange arrow)
and across-odorant (blue arrow) pair-wise
correlation coefficients.
NATURE NEUROSCIENCE VOLUME 12 [ NUMBER 7 [ JULY 2009 933
ART ICLES
©20
09 N
atu
re A
mer
ica,
Inc.
All
rig
hts
res
erve
d.
odorants for five out of six subjects (P4 0.05, one-way ANOVAs, fourlevels (odorants), one ANOVA per subject; Fig. 2c). The mean fMRIsignal significantly differed between odorants only in subject 5(F3,92 ¼ 3.71, P¼ 0.014), although follow-up pair-wise t tests indicatedthat not all odorants could be significantly discriminated from theothers (for example, mint versus rose, T23 ¼ 1.86, P ¼ 0.076; mintversus lemon, T23 ¼ 0.28, P ¼ 0.76; banana versus lemon, T23 ¼ 1.67,P ¼ 0.11). These results indicate that if a neural code for odor qualityexists in PPC, it might be contained in a more fine-grained pattern ofvoxel activity that cannot be seen using standard imaging techniques.
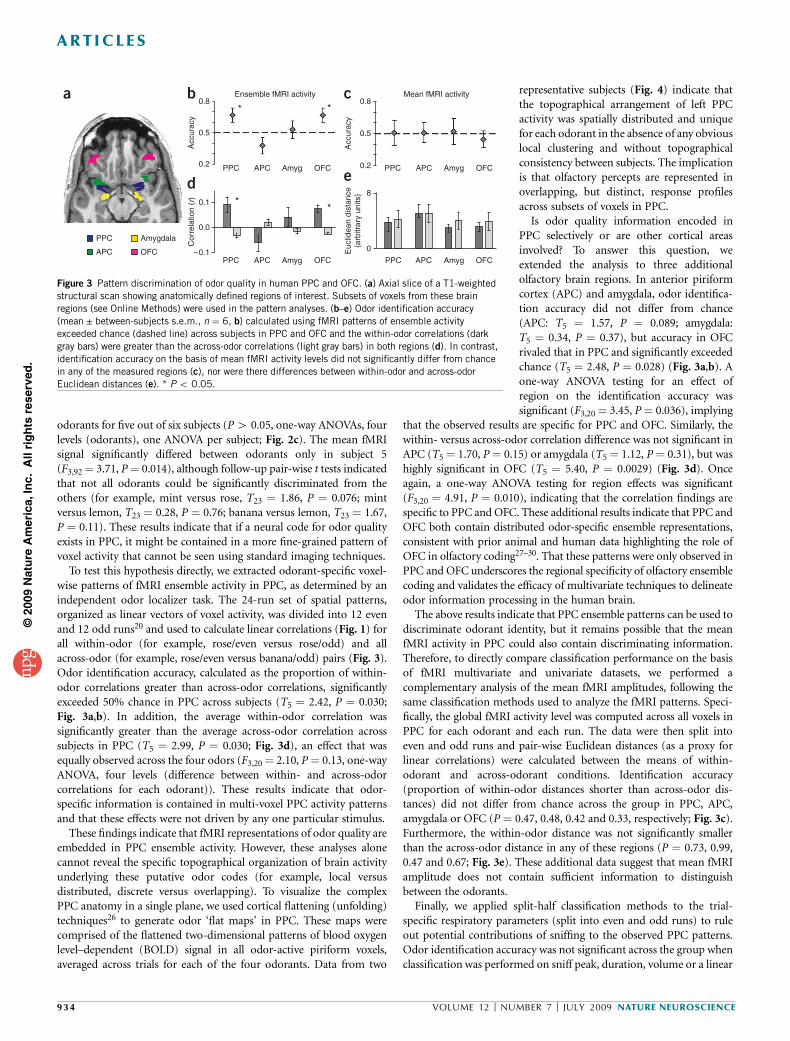
To test this hypothesis directly, we extracted odorant-specific voxel-wise patterns of fMRI ensemble activity in PPC, as determined by anindependent odor localizer task. The 24-run set of spatial patterns,organized as linear vectors of voxel activity, was divided into 12 evenand 12 odd runs20 and used to calculate linear correlations (Fig. 1) forall within-odor (for example, rose/even versus rose/odd) and allacross-odor (for example, rose/even versus banana/odd) pairs (Fig. 3).Odor identification accuracy, calculated as the proportion of within-odor correlations greater than across-odor correlations, significantlyexceeded 50% chance in PPC across subjects (T5 ¼ 2.42, P ¼ 0.030;Fig. 3a,b). In addition, the average within-odor correlation wassignificantly greater than the average across-odor correlation acrosssubjects in PPC (T5 ¼ 2.99, P ¼ 0.030; Fig. 3d), an effect that wasequally observed across the four odors (F3,20 ¼ 2.10, P¼ 0.13, one-wayANOVA, four levels (difference between within- and across-odorcorrelations for each odorant)). These results indicate that odor-specific information is contained in multi-voxel PPC activity patternsand that these effects were not driven by any one particular stimulus.
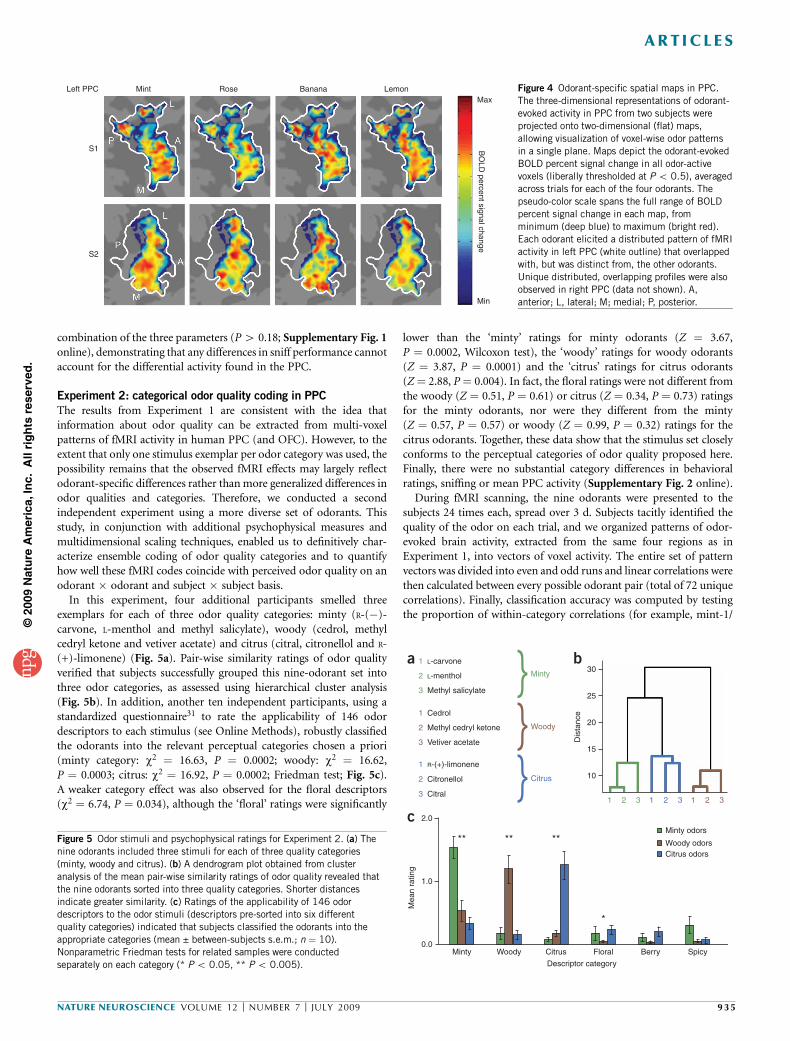
These findings indicate that fMRI representations of odor quality areembedded in PPC ensemble activity. However, these analyses alonecannot reveal the specific topographical organization of brain activityunderlying these putative odor codes (for example, local versusdistributed, discrete versus overlapping). To visualize the complexPPC anatomy in a single plane, we used cortical flattening (unfolding)techniques26 to generate odor ‘flat maps’ in PPC. These maps werecomprised of the flattened two-dimensional patterns of blood oxygenlevel–dependent (BOLD) signal in all odor-active piriform voxels,averaged across trials for each of the four odorants. Data from two
representative subjects (Fig. 4) indicate thatthe topographical arrangement of left PPCactivity was spatially distributed and uniquefor each odorant in the absence of any obviouslocal clustering and without topographicalconsistency between subjects. The implicationis that olfactory percepts are represented inoverlapping, but distinct, response profilesacross subsets of voxels in PPC.
Is odor quality information encoded inPPC selectively or are other cortical areasinvolved? To answer this question, weextended the analysis to three additionalolfactory brain regions. In anterior piriformcortex (APC) and amygdala, odor identifica-tion accuracy did not differ from chance(APC: T5 ¼ 1.57, P ¼ 0.089; amygdala:T5 ¼ 0.34, P ¼ 0.37), but accuracy in OFCrivaled that in PPC and significantly exceededchance (T5 ¼ 2.48, P ¼ 0.028) (Fig. 3a,b). Aone-way ANOVA testing for an effect ofregion on the identification accuracy wassignificant (F3,20 ¼ 3.45, P¼ 0.036), implying
that the observed results are specific for PPC and OFC. Similarly, thewithin- versus across-odor correlation difference was not significant inAPC (T5 ¼ 1.70, P¼ 0.15) or amygdala (T5 ¼ 1.12, P¼ 0.31), but washighly significant in OFC (T5 ¼ 5.40, P ¼ 0.0029) (Fig. 3d). Onceagain, a one-way ANOVA testing for region effects was significant(F3,20 ¼ 4.91, P ¼ 0.010), indicating that the correlation findings arespecific to PPC and OFC. These additional results indicate that PPC andOFC both contain distributed odor-specific ensemble representations,consistent with prior animal and human data highlighting the role ofOFC in olfactory coding27–30. That these patterns were only observed inPPC and OFC underscores the regional specificity of olfactory ensemblecoding and validates the efficacy of multivariate techniques to delineateodor information processing in the human brain.
The above results indicate that PPC ensemble patterns can be used todiscriminate odorant identity, but it remains possible that the meanfMRI activity in PPC could also contain discriminating information.Therefore, to directly compare classification performance on the basisof fMRI multivariate and univariate datasets, we performed acomplementary analysis of the mean fMRI amplitudes, following thesame classification methods used to analyze the fMRI patterns. Speci-fically, the global fMRI activity level was computed across all voxels inPPC for each odorant and each run. The data were then split intoeven and odd runs and pair-wise Euclidean distances (as a proxy forlinear correlations) were calculated between the means of within-odorant and across-odorant conditions. Identification accuracy(proportion of within-odor distances shorter than across-odor dis-tances) did not differ from chance across the group in PPC, APC,amygdala or OFC (P ¼ 0.47, 0.48, 0.42 and 0.33, respectively; Fig. 3c).Furthermore, the within-odor distance was not significantly smallerthan the across-odor distance in any of these regions (P ¼ 0.73, 0.99,0.47 and 0.67; Fig. 3e). These additional data suggest that mean fMRIamplitude does not contain sufficient information to distinguishbetween the odorants.
Finally, we applied split-half classification methods to the trial-specific respiratory parameters (split into even and odd runs) to ruleout potential contributions of sniffing to the observed PPC patterns.Odor identification accuracy was not significant across the group whenclassification was performed on sniff peak, duration, volume or a linear
Mean fMRI activity
* *
PPC
Ensemble fMRI activity
PPC APC
APC
Amygdala
Amyg
0.8
0.18
0
0.0
–0.1
0.5
Acc
urac
y
Acc
urac
yE
uclid
ean
dist
ance
(arb
itrar
y un
its)
Cor
rela
tion
(r)
0.2
0.8
0.5
0.2
OFC
OFC PPC APC Amyg OFC
PPC APC Amyg OFCPPC
**
APC Amyg OFC
a b c
ed
Figure 3 Pattern discrimination of odor quality in human PPC and OFC. (a) Axial slice of a T1-weightedstructural scan showing anatomically defined regions of interest. Subsets of voxels from these brain
regions (see Online Methods) were used in the pattern analyses. (b–e) Odor identification accuracy
(mean ± between-subjects s.e.m., n ¼ 6, b) calculated using fMRI patterns of ensemble activity
exceeded chance (dashed line) across subjects in PPC and OFC and the within-odor correlations (dark
gray bars) were greater than the across-odor correlations (light gray bars) in both regions (d). In contrast,
identification accuracy on the basis of mean fMRI activity levels did not significantly differ from chance
in any of the measured regions (c), nor were there differences between within-odor and across-odor
Euclidean distances (e). * P o 0.05.
934 VOLUME 12 [ NUMBER 7 [ JULY 2009 NATURE NEUROSCIENCE
ART ICLES
©20
09 N
atu
re A
mer
ica,
Inc.
All
rig
hts
res
erve
d.
combination of the three parameters (P4 0.18; Supplementary Fig. 1online), demonstrating that any differences in sniff performance cannotaccount for the differential activity found in the PPC.
Experiment 2: categorical odor quality coding in PPC
The results from Experiment 1 are consistent with the idea thatinformation about odor quality can be extracted from multi-voxelpatterns of fMRI activity in human PPC (and OFC). However, to theextent that only one stimulus exemplar per odor category was used, thepossibility remains that the observed fMRI effects may largely reflectodorant-specific differences rather than more generalized differences inodor qualities and categories. Therefore, we conducted a secondindependent experiment using a more diverse set of odorants. Thisstudy, in conjunction with additional psychophysical measures andmultidimensional scaling techniques, enabled us to definitively char-acterize ensemble coding of odor quality categories and to quantifyhow well these fMRI codes coincide with perceived odor quality on anodorant � odorant and subject � subject basis.
In this experiment, four additional participants smelled threeexemplars for each of three odor quality categories: minty (R-(�)-carvone, L-menthol and methyl salicylate), woody (cedrol, methylcedryl ketone and vetiver acetate) and citrus (citral, citronellol and R-(+)-limonene) (Fig. 5a). Pair-wise similarity ratings of odor qualityverified that subjects successfully grouped this nine-odorant set intothree odor categories, as assessed using hierarchical cluster analysis(Fig. 5b). In addition, another ten independent participants, using astandardized questionnaire31 to rate the applicability of 146 odordescriptors to each stimulus (see Online Methods), robustly classifiedthe odorants into the relevant perceptual categories chosen a priori(minty category: w2 ¼ 16.63, P ¼ 0.0002; woody: w2 ¼ 16.62,P ¼ 0.0003; citrus: w2 ¼ 16.92, P ¼ 0.0002; Friedman test; Fig. 5c).A weaker category effect was also observed for the floral descriptors(w2 ¼ 6.74, P ¼ 0.034), although the ‘floral’ ratings were significantly
lower than the ‘minty’ ratings for minty odorants (Z ¼ 3.67,P ¼ 0.0002, Wilcoxon test), the ‘woody’ ratings for woody odorants(Z ¼ 3.87, P ¼ 0.0001) and the ‘citrus’ ratings for citrus odorants(Z¼ 2.88, P¼ 0.004). In fact, the floral ratings were not different fromthe woody (Z ¼ 0.51, P ¼ 0.61) or citrus (Z ¼ 0.34, P ¼ 0.73) ratingsfor the minty odorants, nor were they different from the minty(Z ¼ 0.57, P ¼ 0.57) or woody (Z ¼ 0.99, P ¼ 0.32) ratings for thecitrus odorants. Together, these data show that the stimulus set closelyconforms to the perceptual categories of odor quality proposed here.Finally, there were no substantial category differences in behavioralratings, sniffing or mean PPC activity (Supplementary Fig. 2 online).
During fMRI scanning, the nine odorants were presented to thesubjects 24 times each, spread over 3 d. Subjects tacitly identified thequality of the odor on each trial, and we organized patterns of odor-evoked brain activity, extracted from the same four regions as inExperiment 1, into vectors of voxel activity. The entire set of patternvectors was divided into even and odd runs and linear correlations werethen calculated between every possible odorant pair (total of 72 uniquecorrelations). Finally, classification accuracy was computed by testingthe proportion of within-category correlations (for example, mint-1/
Left PPC Mint Rose Banana LemonMax
MinB
OLD
percent signal change
S1
S2
Figure 4 Odorant-specific spatial maps in PPC.
The three-dimensional representations of odorant-
evoked activity in PPC from two subjects were
projected onto two-dimensional (flat) maps,
allowing visualization of voxel-wise odor patterns
in a single plane. Maps depict the odorant-evoked
BOLD percent signal change in all odor-active
voxels (liberally thresholded at P o 0.5), averagedacross trials for each of the four odorants. The
pseudo-color scale spans the full range of BOLD
percent signal change in each map, from
minimum (deep blue) to maximum (bright red).
Each odorant elicited a distributed pattern of fMRI
activity in left PPC (white outline) that overlapped
with, but was distinct from, the other odorants.
Unique distributed, overlapping profiles were also
observed in right PPC (data not shown). A,
anterior; L, lateral; M; medial; P, posterior.
1 L-carvone
Cedrol
R-(+)-limonene
Methyl cedryl ketone
Vetiver acetate
Citronellol
Citral
L-menthol
Methyl salicylate
30
25
2.0
1.0
Mea
n ra
ting
0.0
20
15
10
Minty odors
Minty Woody
** ** **
*
Citrus
Descriptor category
Floral Berry Spicy
Woody odorsCitrus odors
Dis
tanc
e
2 Minty
3
1 2 3 1 2 3 1 2 3
1
2 Woody
3
1
Citrus2
3
a
c
b
Figure 5 Odor stimuli and psychophysical ratings for Experiment 2. (a) The
nine odorants included three stimuli for each of three quality categories
(minty, woody and citrus). (b) A dendrogram plot obtained from cluster
analysis of the mean pair-wise similarity ratings of odor quality revealed that
the nine odorants sorted into three quality categories. Shorter distances
indicate greater similarity. (c) Ratings of the applicability of 146 odordescriptors to the odor stimuli (descriptors pre-sorted into six different
quality categories) indicated that subjects classified the odorants into the
appropriate categories (mean ± between-subjects s.e.m.; n ¼ 10).
Nonparametric Friedman tests for related samples were conducted
separately on each category (* P o 0.05, ** P o 0.005).
NATURE NEUROSCIENCE VOLUME 12 [ NUMBER 7 [ JULY 2009 935
ART ICLES
©20
09 N
atu
re A
mer
ica,
Inc.
All
rig
hts
res
erve
d.
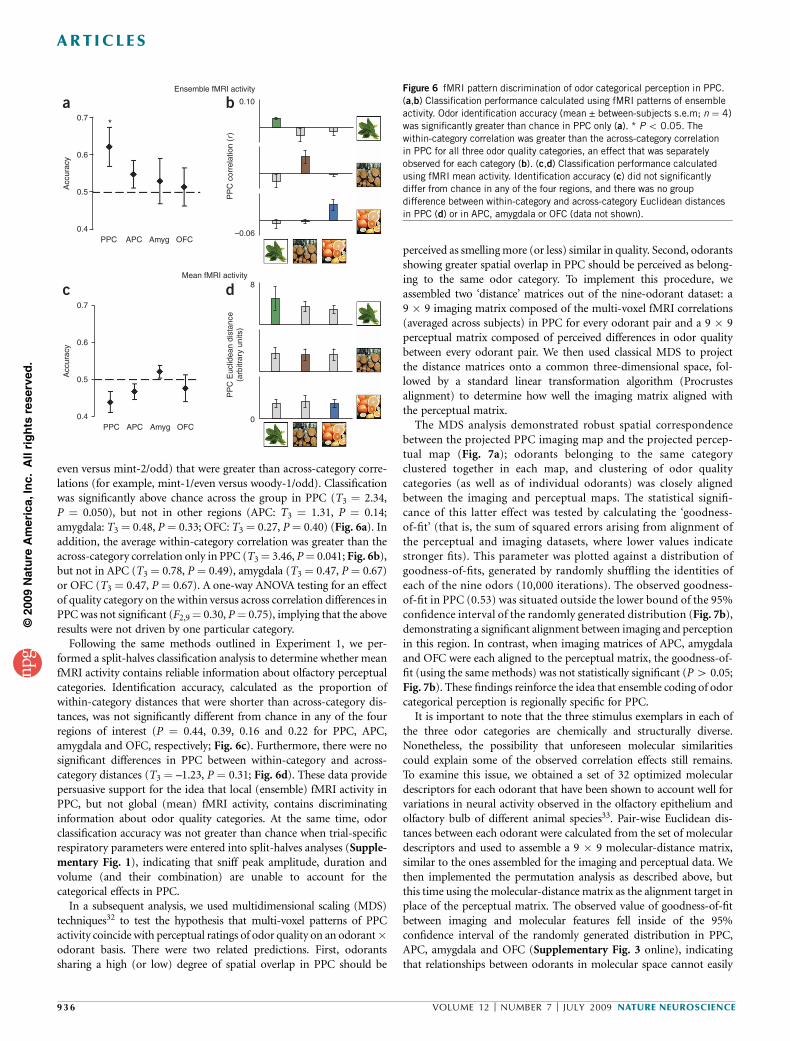
even versus mint-2/odd) that were greater than across-category corre-lations (for example, mint-1/even versus woody-1/odd). Classificationwas significantly above chance across the group in PPC (T3 ¼ 2.34,P ¼ 0.050), but not in other regions (APC: T3 ¼ 1.31, P ¼ 0.14;amygdala: T3 ¼ 0.48, P¼ 0.33; OFC: T3 ¼ 0.27, P¼ 0.40) (Fig. 6a). Inaddition, the average within-category correlation was greater than theacross-category correlation only in PPC (T3 ¼ 3.46, P¼ 0.041; Fig. 6b),but not in APC (T3 ¼ 0.78, P ¼ 0.49), amygdala (T3 ¼ 0.47, P¼ 0.67)or OFC (T3 ¼ 0.47, P ¼ 0.67). A one-way ANOVA testing for an effectof quality category on the within versus across correlation differences inPPC was not significant (F2,9 ¼ 0.30, P¼ 0.75), implying that the aboveresults were not driven by one particular category.
Following the same methods outlined in Experiment 1, we per-formed a split-halves classification analysis to determine whether meanfMRI activity contains reliable information about olfactory perceptualcategories. Identification accuracy, calculated as the proportion ofwithin-category distances that were shorter than across-category dis-tances, was not significantly different from chance in any of the fourregions of interest (P ¼ 0.44, 0.39, 0.16 and 0.22 for PPC, APC,amygdala and OFC, respectively; Fig. 6c). Furthermore, there were nosignificant differences in PPC between within-category and across-category distances (T3 ¼ –1.23, P ¼ 0.31; Fig. 6d). These data providepersuasive support for the idea that local (ensemble) fMRI activity inPPC, but not global (mean) fMRI activity, contains discriminatinginformation about odor quality categories. At the same time, odorclassification accuracy was not greater than chance when trial-specificrespiratory parameters were entered into split-halves analyses (Supple-mentary Fig. 1), indicating that sniff peak amplitude, duration andvolume (and their combination) are unable to account for thecategorical effects in PPC.
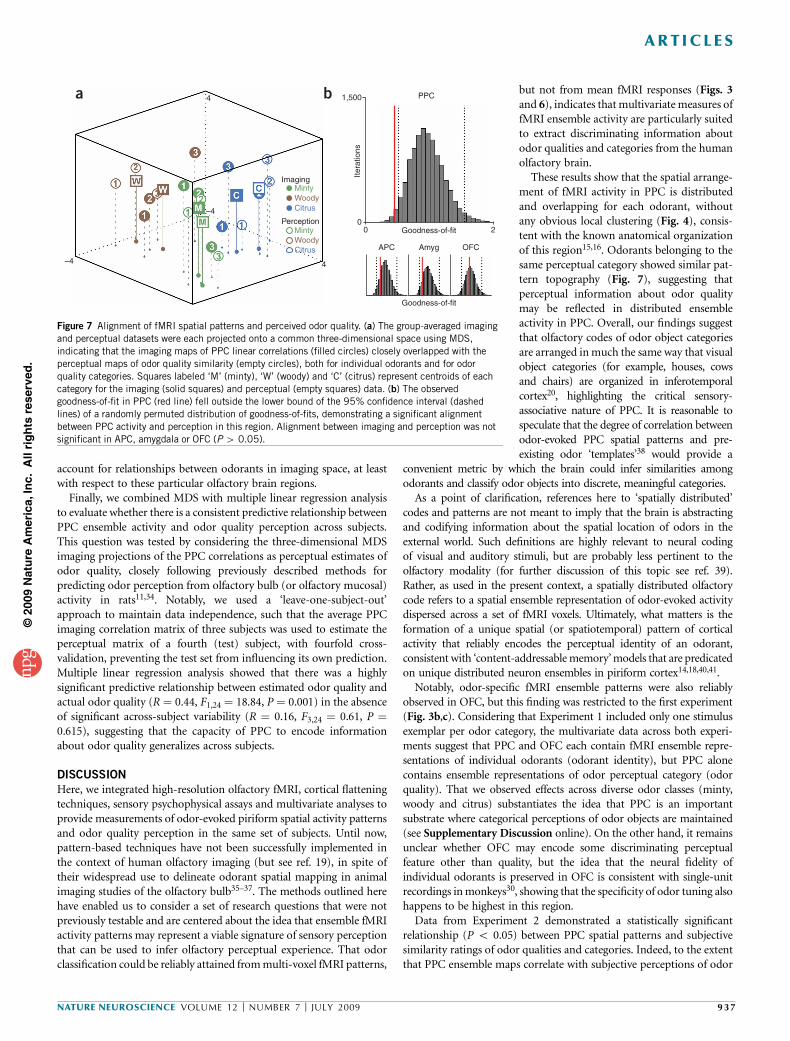
In a subsequent analysis, we used multidimensional scaling (MDS)techniques32 to test the hypothesis that multi-voxel patterns of PPCactivity coincide with perceptual ratings of odor quality on an odorant�odorant basis. There were two related predictions. First, odorantssharing a high (or low) degree of spatial overlap in PPC should be
perceived as smelling more (or less) similar in quality. Second, odorantsshowing greater spatial overlap in PPC should be perceived as belong-ing to the same odor category. To implement this procedure, weassembled two ‘distance’ matrices out of the nine-odorant dataset: a9 � 9 imaging matrix composed of the multi-voxel fMRI correlations(averaged across subjects) in PPC for every odorant pair and a 9 � 9perceptual matrix composed of perceived differences in odor qualitybetween every odorant pair. We then used classical MDS to projectthe distance matrices onto a common three-dimensional space, fol-lowed by a standard linear transformation algorithm (Procrustesalignment) to determine how well the imaging matrix aligned withthe perceptual matrix.
The MDS analysis demonstrated robust spatial correspondencebetween the projected PPC imaging map and the projected percep-tual map (Fig. 7a); odorants belonging to the same categoryclustered together in each map, and clustering of odor qualitycategories (as well as of individual odorants) was closely alignedbetween the imaging and perceptual maps. The statistical signifi-cance of this latter effect was tested by calculating the ‘goodness-of-fit’ (that is, the sum of squared errors arising from alignment ofthe perceptual and imaging datasets, where lower values indicatestronger fits). This parameter was plotted against a distribution ofgoodness-of-fits, generated by randomly shuffling the identities ofeach of the nine odors (10,000 iterations). The observed goodness-of-fit in PPC (0.53) was situated outside the lower bound of the 95%confidence interval of the randomly generated distribution (Fig. 7b),demonstrating a significant alignment between imaging and perceptionin this region. In contrast, when imaging matrices of APC, amygdalaand OFC were each aligned to the perceptual matrix, the goodness-of-fit (using the same methods) was not statistically significant (P4 0.05;Fig. 7b). These findings reinforce the idea that ensemble coding of odorcategorical perception is regionally specific for PPC.
It is important to note that the three stimulus exemplars in each ofthe three odor categories are chemically and structurally diverse.Nonetheless, the possibility that unforeseen molecular similaritiescould explain some of the observed correlation effects still remains.To examine this issue, we obtained a set of 32 optimized moleculardescriptors for each odorant that have been shown to account well forvariations in neural activity observed in the olfactory epithelium andolfactory bulb of different animal species33. Pair-wise Euclidean dis-tances between each odorant were calculated from the set of moleculardescriptors and used to assemble a 9 � 9 molecular-distance matrix,similar to the ones assembled for the imaging and perceptual data. Wethen implemented the permutation analysis as described above, butthis time using the molecular-distance matrix as the alignment target inplace of the perceptual matrix. The observed value of goodness-of-fitbetween imaging and molecular features fell inside of the 95%confidence interval of the randomly generated distribution in PPC,APC, amygdala and OFC (Supplementary Fig. 3 online), indicatingthat relationships between odorants in molecular space cannot easily
0.7
0.10
8
0
–0.06
Ensemble fMRI activity
Mean fMRI activity
PP
C c
orre
latio
n (r
)
0.6
Acc
urac
y
0.5
0.4
0.7
0.6
Acc
urac
y
PP
C E
uclid
ean
dist
ance
(arb
itrar
y un
its)
0.5
0.4
PPC APC Amyg OFC
PPC APC Amyg OFC
a
c d
b*
Figure 6 fMRI pattern discrimination of odor categorical perception in PPC.
(a,b) Classification performance calculated using fMRI patterns of ensemble
activity. Odor identification accuracy (mean ± between-subjects s.e.m; n ¼ 4)
was significantly greater than chance in PPC only (a). * P o 0.05. The
within-category correlation was greater than the across-category correlation
in PPC for all three odor quality categories, an effect that was separately
observed for each category (b). (c,d) Classification performance calculated
using fMRI mean activity. Identification accuracy (c) did not significantlydiffer from chance in any of the four regions, and there was no group
difference between within-category and across-category Euclidean distances
in PPC (d) or in APC, amygdala or OFC (data not shown).
936 VOLUME 12 [ NUMBER 7 [ JULY 2009 NATURE NEUROSCIENCE
ART ICLES
©20
09 N
atu
re A
mer
ica,
Inc.
All
rig
hts
res
erve
d.
account for relationships between odorants in imaging space, at leastwith respect to these particular olfactory brain regions.
Finally, we combined MDS with multiple linear regression analysisto evaluate whether there is a consistent predictive relationship betweenPPC ensemble activity and odor quality perception across subjects.This question was tested by considering the three-dimensional MDSimaging projections of the PPC correlations as perceptual estimates ofodor quality, closely following previously described methods forpredicting odor perception from olfactory bulb (or olfactory mucosal)activity in rats11,34. Notably, we used a ‘leave-one-subject-out’approach to maintain data independence, such that the average PPCimaging correlation matrix of three subjects was used to estimate theperceptual matrix of a fourth (test) subject, with fourfold cross-validation, preventing the test set from influencing its own prediction.Multiple linear regression analysis showed that there was a highlysignificant predictive relationship between estimated odor quality andactual odor quality (R ¼ 0.44, F1,24 ¼ 18.84, P ¼ 0.001) in the absenceof significant across-subject variability (R ¼ 0.16, F3,24 ¼ 0.61, P ¼0.615), suggesting that the capacity of PPC to encode informationabout odor quality generalizes across subjects.
DISCUSSION
Here, we integrated high-resolution olfactory fMRI, cortical flatteningtechniques, sensory psychophysical assays and multivariate analyses toprovide measurements of odor-evoked piriform spatial activity patternsand odor quality perception in the same set of subjects. Until now,pattern-based techniques have not been successfully implemented inthe context of human olfactory imaging (but see ref. 19), in spite oftheir widespread use to delineate odorant spatial mapping in animalimaging studies of the olfactory bulb35–37. The methods outlined herehave enabled us to consider a set of research questions that were notpreviously testable and are centered about the idea that ensemble fMRIactivity patterns may represent a viable signature of sensory perceptionthat can be used to infer olfactory perceptual experience. That odorclassification could be reliably attained from multi-voxel fMRI patterns,
but not from mean fMRI responses (Figs. 3and 6), indicates that multivariate measures offMRI ensemble activity are particularly suitedto extract discriminating information aboutodor qualities and categories from the humanolfactory brain.
These results show that the spatial arrange-ment of fMRI activity in PPC is distributedand overlapping for each odorant, withoutany obvious local clustering (Fig. 4), consis-tent with the known anatomical organizationof this region15,16. Odorants belonging to thesame perceptual category showed similar pat-tern topography (Fig. 7), suggesting thatperceptual information about odor qualitymay be reflected in distributed ensembleactivity in PPC. Overall, our findings suggestthat olfactory codes of odor object categoriesare arranged in much the same way that visualobject categories (for example, houses, cowsand chairs) are organized in inferotemporalcortex20, highlighting the critical sensory-associative nature of PPC. It is reasonable tospeculate that the degree of correlation betweenodor-evoked PPC spatial patterns and pre-existing odor ‘templates’38 would provide a
convenient metric by which the brain could infer similarities amongodorants and classify odor objects into discrete, meaningful categories.
As a point of clarification, references here to ‘spatially distributed’codes and patterns are not meant to imply that the brain is abstractingand codifying information about the spatial location of odors in theexternal world. Such definitions are highly relevant to neural codingof visual and auditory stimuli, but are probably less pertinent to theolfactory modality (for further discussion of this topic see ref. 39).Rather, as used in the present context, a spatially distributed olfactorycode refers to a spatial ensemble representation of odor-evoked activitydispersed across a set of fMRI voxels. Ultimately, what matters is theformation of a unique spatial (or spatiotemporal) pattern of corticalactivity that reliably encodes the perceptual identity of an odorant,consistent with ‘content-addressable memory’ models that are predicatedon unique distributed neuron ensembles in piriform cortex14,18,40,41.
Notably, odor-specific fMRI ensemble patterns were also reliablyobserved in OFC, but this finding was restricted to the first experiment(Fig. 3b,c). Considering that Experiment 1 included only one stimulusexemplar per odor category, the multivariate data across both experi-ments suggest that PPC and OFC each contain fMRI ensemble repre-sentations of individual odorants (odorant identity), but PPC alonecontains ensemble representations of odor perceptual category (odorquality). That we observed effects across diverse odor classes (minty,woody and citrus) substantiates the idea that PPC is an importantsubstrate where categorical perceptions of odor objects are maintained(see Supplementary Discussion online). On the other hand, it remainsunclear whether OFC may encode some discriminating perceptualfeature other than quality, but the idea that the neural fidelity ofindividual odorants is preserved in OFC is consistent with single-unitrecordings in monkeys30, showing that the specificity of odor tuning alsohappens to be highest in this region.
Data from Experiment 2 demonstrated a statistically significantrelationship (P o 0.05) between PPC spatial patterns and subjectivesimilarity ratings of odor qualities and categories. Indeed, to the extentthat PPC ensemble maps correlate with subjective perceptions of odor
a b
Imaging
Perception
4–4
–4
4 1,500 PPC
0 Goodness-of-fit
Goodness-of-fit
APC Amyg OFC
2
Itera
tions
0
MintyWoodyCitrus
MintyWoodyCitrus
Figure 7 Alignment of fMRI spatial patterns and perceived odor quality. (a) The group-averaged imaging
and perceptual datasets were each projected onto a common three-dimensional space using MDS,
indicating that the imaging maps of PPC linear correlations (filled circles) closely overlapped with the
perceptual maps of odor quality similarity (empty circles), both for individual odorants and for odor
quality categories. Squares labeled ‘M’ (minty), ‘W’ (woody) and ‘C’ (citrus) represent centroids of each
category for the imaging (solid squares) and perceptual (empty squares) data. (b) The observedgoodness-of-fit in PPC (red line) fell outside the lower bound of the 95% confidence interval (dashed
lines) of a randomly permuted distribution of goodness-of-fits, demonstrating a significant alignment
between PPC activity and perception in this region. Alignment between imaging and perception was not
significant in APC, amygdala or OFC (P 4 0.05).
NATURE NEUROSCIENCE VOLUME 12 [ NUMBER 7 [ JULY 2009 937
ART ICLES
©20
09 N
atu
re A
mer
ica,
Inc.
All
rig
hts
res
erve
d.
quality, these results suggest that it might be possible to read outolfactory percepts from spatially distributed fMRI activity in PPC. Thepattern regression analysis further extended these findings by showingthat perceptual estimates of odor quality can be inferred from group-based three-dimensional MDS projections of PPC imaging correla-tions. That the perception of odor object categories can be estimatedfrom group-averaged PPC correlations would fulfill an importantcriterion42 for establishing an olfactory code with direct relevance forodor quality perception. The ability of multivariate techniques to drawout these predictive relationships highlights a previously unknown androbust method for characterizing the direct links between olfactorycodes and odor percepts, and perhaps for assessing (or predicting)individual human variability in how an odorant’s quality is perceived.
Several influential models of olfactory perception14,17,18,38,40 positthat a spatially (or spatiotemporally) distributed pattern of brainactivity satisfies the requirements of an odor detection system facedwith the challenge of extracting perceptual constancy from environ-mental inconstancy. Ecological variations in odor background, winddirection and sniff sampling phase, as well as physical alterations in theodor source itself, can all degrade the stimulus fidelity of the originalinput. The prevailing idea that pattern-completion mechanisms andcontent-addressable memory systems14,18 can resolve corrupted odorinputs hinges on the presence of ensemble activity patterns in olfactorycortical structures, but these theories are principally derived fromanatomical data and network simulations, in the absence of confirma-tory functional data. Our findings are among the first to verify thepresence of pattern-based perceptual representations of odor qualitiesand categories in human PPC, which would be indispensable for thereconstruction of odor objects, ensuring perceptual invariance in thewake of fragmentary inputs.
METHODS
Methods and any associated references are available in the onlineversion of the paper at http://www.nature.com/natureneuroscience/.
Note: Supplementary information is available on the Nature Neuroscience website.
ACKNOWLEDGMENTSWe would like to thank T. Egner, W. Li, J.-P. Mague and T. Parrish for helpfulsuggestions. This work was supported by grants from the National Institute onDeafness and Other Communication Disorders to J.A.G. (K08-DC007653 andR01-DC010014).
AUTHOR CONTRIBUTIONSJ.A.G. conceived the experiment, with contributions and methodologicalsuggestions from J.-D. Haynes. J.D. Howard and J.P. collected the imaging andbehavioral data. J.D. Howard, J.P. and J.A.G. analyzed the data. M.G., J.-D.Haynes and J.D. Howard implemented the flat map analysis. J.A.G., J.D. Howardand J.P. wrote the manuscript.
Published online at http://www.nature.com/natureneuroscience/
Reprints and permissions information is available online at http://www.nature.com/
reprintsandpermissions/
1. Rosch, E.H. Principles of categorization. in Cognition and Categorization (eds.Rosch, E.H. & Lloyd, B.) 27–48 (Erlbaum Associates, Hillsdale, New Jersey, 1978).
2. Miller, E.K., Nieder, A., Freedman, D.J. & Wallis, J.D. Neural correlates of categories andconcepts. Curr. Opin. Neurobiol. 13, 198–203 (2003).
3. Reddy, L. & Kanwisher, N. Coding of visual objects in the ventral stream. Curr. Opin.Neurobiol. 16, 408–414 (2006).
4. Kendrick, K.M. et al. Neural control of maternal behavior and olfactory recognition ofoffspring. Brain Res. Bull. 44, 383–395 (1997).
5. Todrank, J., Heth, G. & Johnston, R.E. Kin recognition in golden hamsters: evidence forkinship odors. Anim. Behav. 55, 377–386 (1998).
6. Jacob, S., McClintock, M.K., Zelano, B. & Ober, C. Paternally inherited HLA alleles areassociated with women’s choice of male odor. Nat. Genet. 30, 175–179 (2002).
7. Guerrieri, F.J. & d’Ettorre, P. The mandible opening response: quantifying aggressionelicited by chemical cues in ants. J. Exp. Biol. 211, 1109–1113 (2008).
8. Cleland, T.A., Morse, A., Yue, E.L. & Linster, C. Behavioral models of odor similarity.Behav. Neurosci. 116, 222–231 (2002).
9. Linster, C., Johnson, B.A., Morse, A., Yue, E. & Leon, M. Spontaneous versus reinforcedolfactory discriminations. J. Neurosci. 22, 6842–6845 (2002).
10. Linster, C. et al. Perceptual correlates of neural representations evoked by odorantenantiomers. J. Neurosci. 21, 9837–9843 (2001).
11. Youngentob, S.L., Johnson, B.A., Leon, M., Sheehe, P.R. & Kent, P.F. Predicting odorantquality perceptions from multidimensional scaling of olfactory bulb glomerular activitypatterns. Behav. Neurosci. 120, 1337–1345 (2006).
12. Zelano, C. & Sobel, N. Humans as an animal model for systems-level organization ofolfaction. Neuron 48, 431–454 (2005).
13. Carmichael, S.T., Clugnet, M.C. & Price, J.L. Central olfactory connections in themacaque monkey. J. Comp. Neurol. 346, 403–434 (1994).
14. Haberly, L.B. Neuronal circuitry in olfactory cortex: anatomy and functional implica-tions. Chem. Senses 10, 219–238 (1985).
15. Illig, K.R. & Haberly, L.B. Odor-evoked activity is spatially distributed in piriform cortex.J. Comp. Neurol. 457, 361–373 (2003).
16. Sharp, F.R., Kauer, J.S. & Shepherd, G.M. Laminar analysis of 2-deoxyglucose uptake inolfactory bulb and olfactory cortex of rabbit and rat. J. Neurophysiol. 40, 800–813(1977).
17. Barkai, E., Bergman, R.E., Horwitz, G. & Hasselmo, M.E. Modulation of associativememory function in a biophysical simulation of rat piriform cortex. J. Neurophysiol. 72,659–677 (1994).
18. Hasselmo, M.E., Wilson, M.A., Anderson, B.P. & Bower, J.M. Associative memoryfunction in piriform (olfactory) cortex: computational modeling and neuropharmacology.Cold Spring Harb. Symp. Quant. Biol. 55, 599–610 (1990).
19. Li, W., Howard, J.D., Parrish, T.B. & Gottfried, J.A. Aversive learning enhancesperceptual and cortical discrimination of indiscriminable odor cues. Science 319,1842–1845 (2008).
20. Haxby, J.V. et al. Distributed and overlapping representations of faces and objects inventral temporal cortex. Science 293, 2425–2430 (2001).
21. Kamitani, Y. & Tong, F. Decoding the visual and subjective contents of the human brain.Nat. Neurosci. 8, 679–685 (2005).
22. Haynes, J.D. & Rees, G. Decoding mental states from brain activity in humans.Nat. Rev.Neurosci. 7, 523–534 (2006).
23. Kriegeskorte, N. & Bandettini, P. Analyzing for information, not activation, to exploithigh-resolution fMRI. Neuroimage 38, 649–662 (2007).
24. Gottfried, J.A., Winston, J.S. & Dolan, R.J. Dissociable codes of odor quality and odorantstructure in human piriform cortex. Neuron 49, 467–479 (2006).
25. Kadohisa, M. & Wilson, D.A. Separate encoding of identity and similarity of complexfamiliar odors in piriform cortex. Proc. Natl. Acad. Sci. USA 103, 15206–15211(2006).
26. Tootell, R.B. et al. Functional analysis of V3A and related areas in human visual cortex.J. Neurosci. 17, 7060–7078 (1997).
27. Gottfried, J.A. & Zald, D.H. On the scent of human olfactory orbitofrontal cortex: meta-analysis and comparison to nonhuman primates. Brain Res. Brain Res. Rev. 50,287–304 (2005).
28. Rolls, E.T., Critchley, H.D. & Treves, A. Representation of olfactory information in theprimate orbitofrontal cortex. J. Neurophysiol. 75, 1982–1996 (1996).
29. Schoenbaum, G. & Eichenbaum, H. Information coding in the rodent prefrontal cortex. I.Single-neuron activity in orbitofrontal cortex compared with that in pyriform cortex.J. Neurophysiol. 74, 733–750 (1995).
30. Tanabe, T., Iino, M. & Takagi, S.F. Discrimination of odors in olfactory bulb, pyriform-amygdaloid areas and orbitofrontal cortex of the monkey. J. Neurophysiol. 38,1284–1296 (1975).
31. Dravnieks, A. Atlas of Odor Character Profiles (ASTM International, Philadelphia,1985).
32. Borg, I. & Groenen, P.J.F. Modern Multidimensional Scaling: Theory and Applications,2nd edn (Springer, New York, 2005).
33. Haddad, R. et al. A metric for odorant comparison. Nat. Methods 5, 425–429 (2008).34. Kent, P.F., Youngentob, S.L. & Sheehe, P.R. Odorant-specific spatial patterns in mucosal
activity predict perceptual differences among odorants. J. Neurophysiol. 74,1777–1781 (1995).
35. Johnson, B.A. & Leon, M. Chemotopic odorant coding in a mammalian olfactory system.J. Comp. Neurol. 503, 1–34 (2007).
36. Mori, K., Takahashi, Y.K., Igarashi, K.M. & Yamaguchi, M. Maps of odorant molecularfeatures in the mammalian olfactory bulb. Physiol. Rev. 86, 409–433 (2006).
37. Soucy, E.R., Albeanu, D.F., Fantana, A.L., Murthy, V.N. & Meister, M. Precision anddiversity in an odor map on the olfactory bulb. Nat. Neurosci. 12, 210–220 (2009).
38. Freeman, W.J. EEG analysis gives model of neuronal template-matching mechanism forsensory search with olfactory bulb. Biol. Cybern. 35, 221–234 (1979).
39. Stevenson, R.J. & Wilson, D.A. Odour perception: an object-recognition approach.Perception 36, 1821–1833 (2007).
40. Haberly, L.B. & Bower, J.M. Olfactory cortex: model circuit for study of associativememory? Trends Neurosci. 12, 258–264 (1989).
41. Wilson, M. & Bower, J.M. Cortical oscillations and temporal interactions in a computersimulation of piriform cortex. J. Neurophysiol. 67, 981–995 (1992).
42. Laurent, G. A systems perspective on early olfactory coding. Science 286, 723–728(1999).
938 VOLUME 12 [ NUMBER 7 [ JULY 2009 NATURE NEUROSCIENCE
ART ICLES
©20
09 N
atu
re A
mer
ica,
Inc.
All
rig
hts
res
erve
d.
ONLINE METHODSSubjects. We obtained informed consent from 20 subjects (age range, 22–35
years) to participate in this study, which was approved by the Northwestern
University Institutional Review Board. Six subjects (four women) participated
in Experiment 1, four subjects (three women) participated in Experiment 2 and
ten subjects (eight women) completed odor questionnaires for Experiment 2.
Behavioral ratings. Prior to the first scanning day, subjects rated odor intensity,
valence, pungency and familiarity using visual analog scales43,44. Ratings were
analyzed in Matlab (Mathworks) using one-way ANOVAs. Subjects also rated
odor quality similarity between all possible odorant pairs on a visual analog
scale (anchored by ‘not alike at all’ and ‘identical’). In Experiment 2, the 36
pair-wise similarity ratings, averaged across subjects, were transformed into a
hierarchical cluster tree using a single-linkage algorithm in Matlab and plotted
as a dendrogram, with linkage distances (reflecting degree of quality similarity
between odorants) indicated on the y axis.
Ten independent participants completed a 146-item Odor Quality Evalua-
tion questionnaire31 for each odorant in Experiment 2. Ratings of the appli-
cability of odor descriptors on the questionnaire ranged from 0 (‘absent’) to
5 (‘extremely’). Before acquiring ratings, and following prior techniques24,45, we
identified the descriptors best fitting the three perceptual categories (minty,
woody and citrus) and three control categories (floral, berry and spicy)
(Supplementary Table 1 online). For each descriptor category, odorant-specific
ratings were averaged across descriptors belonging to that category and were
then averaged across the three odorants pre-assigned to each perceptual group.
For example, all of the minty descriptor ratings were averaged together for each
odorant and were then averaged across the three putative minty odorants, the
three putative woody odorants and the three putative citrus odorants to form
mean ratings for each odorant perceptual category. The applicability of each
descriptor rating to each perceptual category was tested (Friedman tests for
related samples and Wilcoxon sign-rank tests for paired samples).
The citronellol odorant used in both Experiments 1 and 2 was a racemic
mixture of the (R)-(+)-b-citronellol isomer, which is reportedly ‘citrus like’ in
quality, and the (S)-(�)-b-citronellol isomer, which is reportedly ‘geranium
like’. We acquired additional behavioral ratings from these same ten indepen-
dent participants to confirm that the odor quality of this racemic mixture most
closely resembled the citrus character (Supplementary Fig. 4 and Supplemen-
tary Data online).
Respiratory monitoring and analysis. Subjects were affixed with breathing
belts to monitor respirations during scanning43. Sniff peak amplitude, duration
and inspiratory volume were computed for each trial, averaged across condi-
tions and runs, normalized within subjects by subtracting the mean parameter
value (across conditions) from each condition-specific value, and then entered
into individual one-way ANOVAs for statistical analysis.
fMRI data acquisition. Gradient-echo T2-weighted echoplanar images were
acquired with a Siemens Trio 3T scanner using parallel imaging19 and an
eight-channel head-coil (repetition time, 2 s; echo time, 20 ms; matrix size,
128 � 120 voxels; field-of-view, 220 � 206 mm; in-plane resolution,
1.72 � 1.72 mm; slice thickness, 2 mm; gap, 1 mm; acquisition angle, 301
rostral to the intercommissural line). A 1-mm3 T1-weighted MRI scan was
obtained to define anatomical regions of interest (ROIs).
Multivariate fMRI procedure. In both experiments, there were eight fMRI
runs on each of 3 consecutive d (total of 24 runs). In Experiment 1, each
odorant was presented once per run for 10 s, with a 20-s rest between odorants
(Fig. 1). In Experiment 2, each odorant was presented once per run for 6 s with
a 12-s rest. Odorants were presented using an MRI-compatible olfactometer
(airflow, 2.5 l min�1)24. On odorant presentation, subjects were visually cued to
sniff and to identify the odor quality covertly. Each run was separated by
approximately 180 s to minimize olfactory fatigue. Odorant presentation was
counterbalanced across runs such that each possible stimulus order was used
once in Experiment 1, and each odorant appeared only once per run and a
different stimulus order was used for each run in Experiment 2.
Odor localizer scan. We used an independent ‘odor localizer’ fMRI scan (using
the same imaging parameters as the main experiment) as an unbiased way to
identify odor-active voxels44. In Experiment 1, subjects undertook an odor
detection task on each scanning day consisting of 12 odor and 12 no odor (air
only) trials using four odorants (butanol, anisole, heptanol and a-ionone). In
Experiment 2, two odor localizer runs were performed on a fourth day of
scanning. Odor and no odor trials were presented for 2 s (stimulus-onset
asynchrony, 12 s), followed by a button press to indicate whether an odor was
present or absent. Images were spatially realigned, smoothed (6-mm full-width
half-maximum) and then analyzed using the general linear model (GLM) in
SPM2 (http://www.fil.ion.ucl.ac.uk/spm/). After model estimation, we con-
trasted odor versus no odor conditions, collapsed across runs, to generate
subject-specific statistical parametric maps of odor-active cortex.
Voxel selection procedure. Voxels included in the multivariate analyses were
selected from anatomically defined ROIs, manually drawn on each subject’s
structural MRI scan using MRIcroN software (http://www.mricro.com/) (Sup-
plementary Fig. 5 online). Anatomical definition of PPC, APC and amygdala
was guided by a human brain atlas46. Delineation of OFC was based on an
olfactory fMRI meta-analysis27. Subsequently, the voxels in each subject’s ROI
were functionally ranked according to their T values (obtained from the
independent odor localizer scans), specifically without reference to the pat-
tern-based fMRI data or to odor classification performance. For each ROI, we
considered the N-most odor-active voxels for which anatomical data were
maximally available from all subjects, such that N was set on the basis of the
subject with the smallest anatomical ROI. Thus, if the PPC of subjects 1, 2 and
3 contained 200, 150 and 300 voxels, respectively, then N ¼ 150 voxels. In this
manner, the size of each ROI was different across regions, but the same across
subjects for a given ROI. The respective voxel numbers used for analysis of
PPC, APC, amygdala and OFC were 186, 138, 312 and 195 (Experiment 1), and
228, 155, 339 and 239 (Experiment 2).
Multivariate fMRI data pre-processing. After discarding the first six ‘dummy’
volumes of each run, we spatially realigned all functional images to the first
volume of the first run using SPM2. Subsequent steps, including extraction of
fMRI signal intensity from each voxel in an ROI for each run, temporal
detrending with a second-order polynomial47 and assembly into linear vectors
of odor-specific voxel activity, were carried out outside of SPM2, using
customized scripts in Matlab. To preserve the native spatial fidelity of the
fMRI signal, we did not perform image normalization and smoothing. Control
analyses indicated that spatial realignment across the three scanning days was
robust (Supplementary Fig. 6 and Supplementary Data online).
Multivariate fMRI analysis. We extracted 96 pattern vectors (Fig. 1) for
Experiment 1 (one vector for each of the four odorants across 24 runs) and
216 pattern vectors for Experiment 2 (nine odorants, 24 runs). In both
experiments, pattern vectors were split into even and odd halves and the mean
activity across all conditions was subtracted from each vector in that half20.
These mean-corrected vectors were averaged across runs in each half, produ-
cing one pattern vector per condition per half, which were then used to
calculate pair-wise correlation coefficients within and between odorants
(Experiment 1) and odor quality categories (Experiment 2).
Within-odor and across-odor correlations were compared directly and were
also used to estimate identification accuracy20. In Experiment 1, identification
accuracy was calculated such that, for odor A, if (Aeven versus Aodd) was greater
than (Aeven versus Bodd), it was counted as a correct identification. There were
six such comparisons for each odor (given four unique odor types), resulting in
24 comparisons. In Experiment 2, identification accuracy was calculated such
that if a within-category correlation (for example, mintyeven versus mintyodd)
was greater than an across-category correlation (for example, mintyeven versus
woodyodd), it was counted as a correct identification. Thus, for each of the three
odor quality categories, there were three within-category correlations and 18
across-category correlations, resulting in 54 comparisons per quality category.
The pair-wise correlations (total of 72 correlations, excluding on-diagonal
correlations to prevent estimation bias of the within-category correlations)
were calculated before mean within- and across-category correlation coeffi-
cients were computed. Chance identification accuracy was 50%.
Piriform flat maps. In the first step, we specified a GLM using SPM2 software
that included odor onset times from Experiment 1 as regressors of interest
doi:10.1038/nn.2324 NATURE NEUROSCIENCE
©20
09 N
atu
re A
mer
ica,
Inc.
All
rig
hts
res
erve
d.
(collapsed across runs). Percent signal change was then estimated for each
condition. Flattened cortical maps were made using mrVista software (http://
white.stanford.edu/software/). In this process, each subject’s T1-weighted
anatomical image was segmented to isolate gray matter in PPC, followed by
spatial flattening into a two-dimensional map. The functional volumes contain-
ing voxel-wise percent signal change information from the GLM were then co-
registered to the T1 volume and flattened to two dimensions using the same
transformation parameters.
MDS. MDS is commonly employed to measure similarities among complex,
high-dimensional datasets containing non-independent elements32. We used it
to facilitate comparisons and statistical analysis between fMRI and perceptual
data acquired in Experiment 2. First, a 9 � 9 imaging dissimilarity (distance)
matrix for each ROI was created for each subject by subtracting the pair-wise
linear correlation coefficients from a value of 1 and scaling from 0 to 10.
Second, a 9 � 9 perceptual dissimilarity (distance) matrix was created using
each subject’s similarity ratings of perceived odor quality for every odorant pair.
These distance matrices were each averaged across subjects and entered into
classical MDS analyses (Matlab). This generated three-dimensional maps (one
for the imaging data, one for the perceptual data), with each odorant being
represented by a unique coordinate in xyz space. Finally, the three-dimensional
map of imaging coordinates was aligned to the perceptual map using
Procrustes analysis, which provides a quantitative measure of similarity (good-
ness-of-fit) between two sets of coordinates (ranging between 0 and 1, where
lower values indicate better alignment). Selection of a three-dimensional MDS
space was based on a ‘scree plot’ of the perceptual dataset indicating that a
three-dimensional projection best captured the variance in the nine-dimen-
sional matrix.
To estimate the significance of goodness-of-fit, we implemented a random
permutation (Monte Carlo) procedure, whereby the actual (measured) fit was
compared with a distribution of fits generated by randomizing the odor
condition assignments before MDS analysis and Procrustes alignment
(10,000 iterations). This procedure scrambles the assignment of odorant
condition (and category) in advance of MDS, preserving the values of all
pair-wise distances and minimizing overfitting of the data. Randomization
statistics have been applied to studies comparing multivariate response profiles
between different brain regions or between neural and perceptual datasets48–50.
An observed fit between imaging and perception was considered to be
significant at P o 0.05, indicating that the observed fit was smaller (better
fit) than 95% of randomly generated fits.
For presentation, the goodness-of-fits, d, were transformed to normal values
using Fisher z transformation:
z ¼ 1
2ln
ð1 + dÞð1 � dÞ
Odor classification: mean fMRI activity. To test whether odor-specific infor-
mation is reliably contained in the mean fMRI signal amplitude, we performed a
split-halves classification analysis that closely paralleled the methods employed
to analyze fMRI ensemble activity. First, the raw BOLD signal elicited by each
odorant presentation was averaged across all voxels from each ROI for each trial,
resulting in 24 values per condition (corresponding to the 24 data acquisition
runs). Mean signal across conditions in each run was subtracted from the
condition-specific values in that run for normalization. Normalized signals were
split into halves, one containing values from even runs and one from odd runs.
Data in each condition and half were averaged across runs and pair-wise
Euclidean distances were calculated within and between conditions.
Odor classification: sniff parameters. To test whether trial-specific sniff
parameters could be used to successfully classify the odors, a split-halves
analysis was performed on sniff peak, duration and inspiratory volume. In
addition, the three sniff parameters were combined into one three-component
vector (analogous to vectors of voxel activity used in the pattern-based fMRI
analyses) to test whether the combination of these parameters might contain
odor-specific information. Data were normalized by subtracting the mean
parameter value across conditions in each run from the condition-specific
values. Data were then split into halves according to even and odd runs and
averaged across runs in each half. Pair-wise Euclidean distances were calculated
within and across conditions.
Statistical analyses. Results are shown as mean ± s.e.m. for participants or
conditions. Unless otherwise indicated, statistical significance was determined
using one-tailed t tests (when comparing identification accuracy to chance),
two-tailed t tests (when comparing two conditions) or ANOVAs (when
comparing more than two conditions). Results were considered to be sig-
nificant at P o 0.05.
43. Li, W., Luxenberg, E., Parrish, T. & Gottfried, J.A. Learning to smell the roses:experience-dependent neural plasticity in human piriform and orbitofrontal cortices.Neuron 52, 1097–1108 (2006).
44. Plailly, J., Howard, J.D., Gitelman, D.R. & Gottfried, J.A. Attention to odor modulatesthalamocortical connectivity in the human brain. J. Neurosci. 28, 5257–5267 (2008).
45. Stevenson, R.J. Associative learning and odor quality perception: how sniffing an odormixture can alter the smell of its parts. Learn. Motiv. 32, 154–177 (2001).
46. Mai, J.K., Assheuer, J. & Paxinos, G.Atlas of theHumanBrain (Elsevier Academic Press,San Diego, 2004).
47. Haynes, J.D. & Rees, G. Predicting the orientation of invisible stimuli from activity inhuman primary visual cortex. Nat. Neurosci. 8, 686–691 (2005).
48. Kayaert, G., Biederman, I. & Vogels, R. Representation of regular and irregular shapes inmacaque inferotemporal cortex. Cereb. Cortex 15, 1308–1321 (2005).
49. Op de Beeck, H., Wagemans, J. & Vogels, R. Inferotemporal neurons represent low-dimensional configurations of parameterized shapes. Nat. Neurosci. 4, 1244–1252(2001).
50. Young, M.P. & Yamane, S. Sparse population coding of faces in the inferotemporalcortex. Science 256, 1327–1331 (1992).
NATURE NEUROSCIENCE doi:10.1038/nn.2324
©20
09 N
atu
re A
mer
ica,
Inc.
All
rig
hts
res
erve
d.