Genetic Variability and Association Among Bulb Yield and ...
Upload
independentCategory
view
1download
0


Recordings from the MOEElectrophysiology—Recordings from OSNs were carried out in an intact epithelialpreparation following previously published procedures (Grosmaitre et al., 2006). Briefly,mI7→M71-GFP mice were deeply anesthetized with ketamine and then decapitated. Followinga brief immersion of the head in icy Ringer's solution (containing in mM: 124 NaCl, 3 KCl,1.3 MgSO4, 2 CaCl2, 26 NaHCO3, 1.25 NaH2PO4, 5.5 glucose, and 4.47 sucrose; 305 mOsmand pH = 7.4 bubbled with 95% O2 and 5% CO2), the nose was dissected out en bloc and theolfactory mucosa was peeled off and kept in oxygenated Ringer's solution. Before recording,the tissue was transferred to a recording chamber with the mucus layer facing up and thencontinuously perfused with oxygenated Ringer's solution at 25°C±2°C. The dendritic knobsof I7 OSNs were identified by green fluorescence in both knob and cilia and then furthervisualized through an upright differential interference contrast (DIC) microscope (OlympusBX51WI), which was equipped with a 40× water-immersion objective and an accessory lensfor an additional 4× magnification. Cell-attached recordings were performed on the dendriticknobs with a glass recording pipette, which was filled with the following solution (in mM): 70KCl, 53 KOH, 30 methanesulfonic acid, 5 EGTA, 10 HEPES, and 70 sucrose, pH 7.2 (310mOsm). We started recordings only after the glass-pipette formed a Giga-seal with the dendriticknob membrane. Recordings were controlled by an EPC-10 amplifier combined with the Pulsesoftware (Heka Electronik). Odorant stimuli were delivered by Picospritzer (Pressure SystemIIe, Toohey Company)-controlled pressure ejection from a seven-barrel pipette that was placed~50 μm downstream from the recording site. All odorants (Sigma) were diluted with Ringer'ssolution from a 0.5 M stock solution in dimethyl sulfoxide (DMSO).
Data Analysis—The details of quantifying the odorant responses of OSNs are describedelsewhere (Rospars et al., 2003). Odorant responses of OSNs usually consisted of a burst ofmultiple action potentials. For odorants at high concentrations, this burst was typically followedby a period of silence and then a secondary increase in spiking activity. Because odorantproperties are better encoded by the initial response (Rospars et al., 2003), we focused onanalyzing this initial response of the poststimulus activity against a background of spontaneousfiring properties. The basal firing frequency of OSNs (Fθ) was calculated by analyzing themedian instantaneous firing frequency of the spontaneous activity recorded for at least 60 sbefore odorant delivery. The response of a cell to an odorant was defined as firing of actionpotentials with instantaneous firing frequency higher than the threshold value (Fθ + 1.5 spikes/s) within the time window of 2 s after stimulus onset. The bursting response typically occursimmediately after the application of an effective odorant, resulting in a time window less than500 ms for most responses. The amplitude of the odorant responses (Fi) was quantified as themedian value of the instantaneous frequencies of the initial burst that exhibited a sufficientincrease in firing frequency as compared to the threshold value. An OSN was considerednonresponsive to an odorant (Fi = 0) if the number of action potentials within the initial burstwas less than four or the overall mean firing rate following odorant application was less thanthe mean basal rate.
Recordings from the MOBFor anesthesia, mice were injected with atropine (0.05 mg/kg) and then urethane i.p. (1.64 g/kg, 20%). Animals were then mounted in a stereotaxic apparatus and kept warm (39° C) withan electric heating pad (BrainKing Biotech, Beijing, China). The respiratory cycles of theanimals were monitored with a strain gauge affixed to chest skin. Signals were amplified by acustom-made strain gauge amplifier and further band-pass (0.1~20 Hz) filtered by a Brownlee440 amplifier.
In Vivo Electrophysiology and Two-Photon Imaging—The skull above the dorsalsurface of the olfactory bulb was thinned, and the GFP+ glomerulus was identified under a
Tan et al. Page 11
Neuron. Author manuscript; available in PMC 2011 March 25.
NIH
-PA Author Manuscript
NIH
-PA Author Manuscript
NIH
-PA Author Manuscript
fluorescent stereo zoom microscope (Olympus SZX12) (Figure S1A). A small hole was openedabove the green glomerulus with the dura mater remaining intact. Mice were then transferredonto a custom-made 2D stage under a two-photon microscope (Olympus FV1000). I7glomeruli were visualized with two-photon microscopy using a 40× water-immersion objective(N.A. = 0.8). Fluorescence was generated using two-photon excitation by a mode-locked Ti-sapphire laser (Chameleon Ultra, Coherent) operating at 140 fs pulse width and 910–1040 nmwavelength. Images were acquired using the Olympus Fluoview software.
For recordings of I7 M/T cells and PG cells, borosilicate microelectrodes (resistance 10~20MΩ) were pulled on a Sutter horizontal puller (P-97, Sutter Instrument) and filled with 1 Msodium chloride and 4% neurobiotin (Vector Laboratories). A fluorescent marker (1% Luciferyellow from Sigma-Aldrich or 3KD tetramethylrhodamine dextran amines from Invitrogen)was added into the intrapipette solution to visualize the pipette tip. Under the guidance of two-photon imaging, a recording pipette was targeted toward an I7 glomerulus with an angle of 30°to the pial surface (Figure 3C). We started the search for extracellular single units when the tipof the recording pipette reached the I7 glomerulus. After we isolated a single-unit with signal/noise ratio >10, electrophysiological signals were amplified (Axoclamp 2B, AxonInstruments), band-pass filtered at 0.5–3 KHz (Brownlee Amplifier model 440), and thendigitized at 8 kHz. Respiratory rhythms and field potentials were simultaneously acquired foroffline analysis. The recording depths suggest that a majority of I7 M/T cells were recordedextracellularly from their primary dendritic trunks. However, some I7 external tufted cells andPG cells might have been recorded from their somata that surrounded the I7 glomerulus.Randomly sampled M/T cells and granule cells were recorded extracellularly by lowering therecording electrodes into specific layers where their corresponding somata were located. Dataacquisition and experimental control were implemented by custom-written software usingdriver programs provided by National Instruments. (−)-Bicuculline methiodide (Sigma) wasapplied by superfusion through a custom-built chamber that was sealed to the cranium.
Odorant Delivery—Room air was filtered with active charcoal and then presentedcontinuously in front of mouse nostrils at a constant flow rate of 4 l/min. Odorants weredelivered with a robotic arm or a custom-made seven-channel olfactometer (Figure 3B).Odorants were stored in headspace vials with different dilutions in mineral oil. For roboticdelivery, a 3D robotic arm (I&J7200C) was used to access odorants from an 8 × 8 odorantpanel, which included odorants of diverse functional groups and carbon-chain lengths. A seven-channel olfactometer was used to deliver highly volatile aldehydes in order to reduce cross-contamination between odorants. In total, 69 odorants plus two controls were used to map theolfactory tuning curve. A complete list of test odorants and their molar concentrations at 1%dilutions can be found in Table S1. Odorized air was delivered with adjustable flow rates intothe continuous air stream for further dilution. Flow rates were controlled by flowmeters (BotionLZB-2) and monitored digitally (FMA 1700/1800 series, Omega). To ensure accuracy in thetiming of odorant delivery, odorants were diverted into the vacuum for the first 1 s and thendelivered to the mouse nostril by switching open a three-way solenoid valve (Parker) for 2 s.An additional stream of clean air (200 ml/min) was injected into the solenoid valve 3 s afterthe termination of odorant pulses to minimize residual odorant from previous trials. Intertrialintervals were at least 15 s to reduce habituation. Teflon tubing was used to reduce cross-contamination.
The molar concentration of an odorant was calculated based on the ideal gas law n = pV/RT,in which p is the saturated vapor pressure at room temperature, V is the volume, R is the gasconstant, and T is the absolute temperature.
Histology—After recordings, neurons were labeled using a juxtacellular labeling techniquethat has been described in detail elsewhere (Pinault, 1996). Briefly, neurobiotin in a recording
Tan et al. Page 12
Neuron. Author manuscript; available in PMC 2011 March 25.
NIH
-PA Author Manuscript
NIH
-PA Author Manuscript
NIH
-PA Author Manuscript
pipette (4%) was electrophoresized into neurons with small positive currents (<10 nA; 0.2 son/0.2 s off) for a maximum of 10 min. The amplitudes of the injected currents were adjustedso that the evoked firing of action potentials was tightly synchronized with current injection.After recovery of at least 1 hr, mice were sacrificed with an overdose of pentobarbiturate,perfused by 4% paraformaldehyde in phosphate-buffered saline with 0.2% picric acid and thenpostfixed for at least 4 hr at room temperature. After cryoprotection in 30% sucrose, coronalsections (40–60 μm) were prepared with a freezing cryostat (Leica CR 1900). Sections werevisualized with Cy3-streptavidin (1:500, Jackson Immunoresearch) and then mounted with50% glycerol containing DAPI to counterstain cell nuclei. Fluorescent images were collectedby a laser-scanning confocal microscope (Zeiss LSM 510 Meta) with a 20× or 40× air objective.Images were reconstructed using Adobe Photoshop. Glomeruli and layers were delineated byDAPI staining.
Occasionally (<10% of cases), two or a few cells were dye labeled after juxtacellular labeling.For M/T cells and PG cells, only data from single-cell labeling were accepted for furtheranalysis. In a few cases, multiple labeling of granule cells were used (for example, Figure 7B)because our sole purpose for granule cells was to identify the cell type.
Data Analysis—Data analysis was carried out using custom-written programs in Matlab(Math-works). Recordings were confirmed to be from single units by clean refractory periodswithin the autocorrelograms of recorded spiking trains (Figures S1C and S1D). PSTHs werecomputed by counting the number of action potentials within sequential time bins (300–500ms duration). To calculate the breathing-triggered PSTH during odorant application (FigureS1E), electrophysiological traces were divided in segments based on respiratory cycles, andall segments were normalized to the same length. The PSTH was calculated individually foreach segment and then averaged across segments.
The response strength of a cell to an odorant was first calculated by subtracting the spontaneousrate (2 s preceding odorant initiation) from the firing rate during the odorant application withineach trial and then averaging across trials. Because control stimuli (pure air or air from themineral oil) occasionally elicited weak responses from some cells (Grosmaitre et al., 2007),we further subtracted the value of response strength to controls from that of the cell to odorants.Thus, positive values of response strength indicate excitation and negative ones representinhibition. After analyzing the olfactory response of M/T cells by incorporating their temporalfeatures, a recent study showed that the mean firing rate in each respiratory cycle can robustlyencode information of odor identity and concentration (Bathellier et al., 2008). Because theodor pulse duration was fixed and each animal exhibited a rather stable respiratory rhythmduring recordings in this study, the analyses by Bathellier et al. support the validity ofmeasuring response strength using the difference in firing rates (Bathellier et al., 2008).
To plot the dose-response curves, normalized response strength was first calculated as “theresponse strength at a specific concentration/maximum response strength across allconcentrations” and then averaged across cells from different groups. Dose-response curveswere fit to a sigmoid function: f(x) = 1/(1+exp(−a × (x − b))), where x represents the meannormalized response strength of the cells at a specific concentration, a, slope, and b, EC50. Toplot the mean tuning curves, the response strengths of the cell to all odorants were firstnormalized to the maximal response of this cell and the tuning curves of all cells from a specificexperimental group were averaged. We arranged the values of response strengths against allodorants along the x axis so that the strongest excitatory response was in the middle of thecurve and weak or inhibitory responses were at both ends. The alignments of the odorantidentities for I7 M/T cells and PG cells are listed in Table S2.
Tan et al. Page 13
Neuron. Author manuscript; available in PMC 2011 March 25.
NIH
-PA Author Manuscript
NIH
-PA Author Manuscript
NIH
-PA Author Manuscript
The response selectivity to a set of odorants was quantified by calculating the lifetimesparseness using nonparametric statistics (Vinje and Gallant, 2000). Lifetime sparseness
, where ri is the response strength to odor i and N isthe total number of the stimuli. Any negative values of ri were set to zero before computinglifetime sparseness. S measures the peakedness of a response distribution. Values of S near 0indicate a flat distribution of the responses to various odorants, and values near 1 indicate asparse distribution of responses to the stimulus set. The similarity between the tuning curvesof two cells was calculated using Pearson's correlation coefficient for their tuning curves. Thecorrelation matrices shown in Figures 4E and 6G represent the color-coded coefficientsbetween any two cells tested with the same concentrations.
Supplementary MaterialRefer to Web version on PubMed Central for supplementary material.
AcknowledgmentsWe thank Peter Mombaerts (MPI, Frankfurt, Germany) and Thomas Bozza (NWU, Evanston, IL, USA) for mI7→/M71-IRES-tauGFP mice and C. Zhan at NIBS imaging facility for technical assistance. M.L. is supported by ChinaMinistry of Science and Technology 863 and 973 Grants, a China NSFC Young Investigator Grant and a HumanFrontier Science Program grant. M.M. is supported by NIDCD, NIH.
REFERENCESAraneda RC, Kini AD, Firestein S. The molecular receptive range of an odorant receptor. Nat. Neurosci
2000;3:1248–1255. [PubMed: 11100145]Arenkiel BR, Peca J, Davison IG, Feliciano C, Deisseroth K, Augustine GJ, Ehlers MD, Feng G. In
vivo light-induced activation of neural circuitry in transgenic mice expressing channelrhodopsin-2.Neuron 2007;54:205–218. [PubMed: 17442243]
Arevian AC, Kapoor V, Urban NN. Activity-dependent gating of lateral inhibition in the mouse olfactorybulb. Nat. Neurosci 2008;11:80–87. [PubMed: 18084286]
Aungst JL, Heyward PM, Puche AC, Karnup SV, Hayar A, Szabo G, Shipley MT. Centre-surroundinhibition among olfactory bulb glomeruli. Nature 2003;426:623–629. [PubMed: 14668854]
Bathellier B, Buhl DL, Accolla R, Carleton A. Dynamic ensemble odor coding in the mammalianolfactory bulb: sensory information at different timescales. Neuron 2008;57:586–598. [PubMed:18304487]
Belluscio L, Lodovichi C, Feinstein P, Mombaerts P, Katz LC. Odorant receptors instruct functionalcircuitry in the mouse olfactory bulb. Nature 2002;419:296–300. [PubMed: 12239567]
Bhandawat V, Olsen SR, Gouwens NW, Schlief ML, Wilson RI. Sensory processing in the Drosophilaantennal lobe increases reliability and separability of ensemble odor representations. Nat. Neurosci2007;10:1474–1482. [PubMed: 17922008]
Bozza T, Feinstein P, Zheng C, Mombaerts P. Odorant receptor expression defines functional units inthe mouse olfactory system. J. Neurosci 2002;22:3033–3043. [PubMed: 11943806]
Buck L, Axel R. A novel multigene family may encode odorant receptors: a molecular basis for odorrecognition. Cell 1991;65:175–187. [PubMed: 1840504]
Chen WR, Midtgaard J, Shepherd GM. Forward and backward propagation of dendritic impulses andtheir synaptic control in mitral cells. Science 1997;278:463–467. [PubMed: 9334305]
Chen WR, Xiong W, Shepherd GM. Analysis of relations between NMDA receptors and GABA releaseat olfactory bulb reciprocal synapses. Neuron 2000;25:625–633. [PubMed: 10774730]
Chen WR, Shen GY, Shepherd GM, Hines ML, Midtgaard J. Multiple modes of action potential initiationand propagation in mitral cell primary dendrite. J. Neurophysiol 2002;88:2755–2764. [PubMed:12424310]
Davison IG, Katz LC. Sparse and selective odor coding by mitral/tufted neurons in the main olfactorybulb. J. Neurosci 2007;27:2091–2101. [PubMed: 17314304]
Tan et al. Page 14
Neuron. Author manuscript; available in PMC 2011 March 25.
NIH
-PA Author Manuscript
NIH
-PA Author Manuscript
NIH
-PA Author Manuscript
Duchamp-Viret P, Chaput MA, Duchamp A. Odor response properties of rat olfactory receptor neurons.Science 1999;284:2171–2174. [PubMed: 10381881]
Egger V, Urban NN. Dynamic connectivity in the mitral cell-granule cell microcircuit. Semin. Cell Dev.Biol 2006;17:424–432. [PubMed: 16889994]
Fantana AL, Soucy ER, Meister M. Rat olfactory bulb mitral cells receive sparse glomerular inputs.Neuron 2008;59:802–814. [PubMed: 18786363]
Friedrich RW, Laurent G. Dynamic optimization of odor representations by slow temporal patterning ofmitral cell activity. Science 2001;291:889–894. [PubMed: 11157170]
Grosmaitre X, Vassalli A, Mombaerts P, Shepherd GM, Ma M. Odorant responses of olfactory sensoryneurons expressing the odorant receptor MOR23: a patch clamp analysis in gene-targeted mice. Proc.Natl. Acad. Sci. USA 2006;103:1970–1975. [PubMed: 16446455]
Grosmaitre X, Santarelli LC, Tan J, Luo M, Ma M. Dual functions of mammalian olfactory sensoryneurons as odor detectors and mechanical sensors. Nat. Neurosci 2007;10:348–354. [PubMed:17310245]
Gross-Isseroff R, Lancet D. Concentration-dependent changes of perceived odor quality. Chem. Senses1988;13:191–204.
Isaacson JS, Strowbridge BW. Olfactory reciprocal synapses: dendritic signaling in the CNS. Neuron1998;20:749–761. [PubMed: 9581766]
Jahr CE, Nicoll RA. An intracellular analysis of dendrodendritic inhibition in the turtle in vitro olfactorybulb. J. Physiol 1982;326:213–234. [PubMed: 7108788]
Kay LM, Laurent G. Odor- and context-dependent modulation of mitral cell activity in behaving rats.Nat. Neurosci 1999;2:1003–1009. [PubMed: 10526340]
Krautwurst D, Yau KW, Reed RR. Identification of ligands for olfactory receptors by functionalexpression of a receptor library. Cell 1998;95:917–926. [PubMed: 9875846]
Laurent G. A systems perspective on early olfactory coding. Science 1999;286:723–728. [PubMed:10531051]
Laurie DJ, Seeburg PH, Wisden W. The distribution of 13 GABAA receptor subunit mRNAs in the ratbrain. II. Olfactory bulb and cerebellum. J. Neurosci 1992;12:1063–1076. [PubMed: 1312132]
Luo M, Katz LC. Response correlation maps of neurons in the mammalian olfactory bulb. Neuron2001;32:1165–1179. [PubMed: 11754845]
Maher BJ, Westbrook GL. Co-transmission of dopamine and GABA in periglomerular cells. J.Neurophysiol 2008;99:1559–1564. [PubMed: 18216231]
Malnic B, Hirono J, Sato T, Buck LB. Combinatorial receptor codes for odors. Cell 1999;96:713–723.[PubMed: 10089886]
Margrie TW, Sakmann B, Urban NN. Action potential propagation in mitral cell lateral dendrites isdecremental and controls recurrent and lateral inhibition in the mammalian olfactory bulb. Proc. Natl.Acad. Sci. USA 2001;98:319–324. [PubMed: 11120888]
Meredith M. Patterned response to odor in mammalian olfactory bulb: the influence of intensity. J.Neurophysiol 1986;56:572–597. [PubMed: 3537224]
Mombaerts P, Wang F, Dulac C, Chao SK, Nemes A, Mendelsohn M, Edmondson J, Axel R. Visualizingan olfactory sensory map. Cell 1996;87:675–686. [PubMed: 8929536]
Mori K, Nagao H, Yoshihara Y. The olfactory bulb: coding and processing of odor molecule information.Science 1999;286:711–715. [PubMed: 10531048]
Murakami M, Kashiwadani H, Kirino Y, Mori K. State-dependent sensory gating in olfactory cortex.Neuron 2005;46:285–296. [PubMed: 15848806]
Ng M, Roorda RD, Lima SQ, Zemelman BV, Morcillo P, Miesenböck G. Transmission of olfactoryinformation between three populations of neurons in the antennal lobe of the fly. Neuron2002;36:463–474. [PubMed: 12408848]
Nusser Z, Sieghart W, Mody I. Differential regulation of synaptic GABAA receptors by cAMP-dependentprotein kinase in mouse cerebellar and olfactory bulb neurones. J. Physiol 1999;521:421–435.[PubMed: 10581313]
Tan et al. Page 15
Neuron. Author manuscript; available in PMC 2011 March 25.
NIH
-PA Author Manuscript
NIH
-PA Author Manuscript
NIH
-PA Author Manuscript

Oka Y, Katada S, Omura M, Suwa M, Yoshihara Y, Touhara K. Odorant receptor map in the mouseolfactory bulb: in vivo sensitivity and specificity of receptor-defined glomeruli. Neuron 2006;52:857–869. [PubMed: 17145506]
Olsen SR, Wilson RI. Lateral presynaptic inhibition mediates gain control in an olfactory circuit. Nature2008;452:956–960. [PubMed: 18344978]
Olsen SR, Bhandawat V, Wilson RI. Excitatory interactions between olfactory processing channels inthe Drosophila antennal lobe. Neuron 2007;54:89–103. [PubMed: 17408580]
Peterlin Z, Ishizawa Y, Araneda R, Eckenhoff R, Firestein S. Selective activation of G-protein coupledreceptors by volatile anesthetics. Mol. Cell. Neurosci 2005;30:506–512. [PubMed: 16185894]
Pinault D. A novel single-cell staining procedure performed in vivo under electrophysiological control:morpho-functional features of juxtacellularly labeled thalamic cells and other central neurons withbiocytin or Neurobiotin. J. Neurosci. Methods 1996;65:113–136. [PubMed: 8740589]
Poo C, Isaacson JS. Odor representations in olfactory cortex: “sparse” coding, global inhibition, andoscillations. Neuron 2009;62:850–861. [PubMed: 19555653]
Rall W, Shepherd GM, Reese TS, Brightman MW. Dendrodendritic synaptic pathway for inhibition inthe olfactory bulb. Exp. Neurol 1966;14:44–56. [PubMed: 5900523]
Ressler KJ, Sullivan SL, Buck LB. Information coding in the olfactory system: evidence for a stereotypedand highly organized epitope map in the olfactory bulb. Cell 1994;79:1245–1255. [PubMed:7528109]
Rinberg D, Koulakov A, Gelperin A. Sparse odor coding in awake behaving mice. J. Neurosci2006;26:8857–8865. [PubMed: 16928875]
Root CM, Semmelhack JL, Wong AM, Flores J, Wang JW. Propagation of olfactory information inDrosophila. Proc. Natl. Acad. Sci. USA 2007;104:11826–11831. [PubMed: 17596338]
Rospars JP, Lánský P, Duchamp A, Duchamp-Viret P. Relation between stimulus and response in frogolfactory receptor neurons in vivo. Eur. J. Neurosci 2003;18:1135–1154. [PubMed: 12956713]
Rubin BD, Katz LC. Optical imaging of odorant representations in the mammalian olfactory bulb. Neuron1999;23:499–511. [PubMed: 10433262]
Schlief ML, Wilson RI. Olfactory processing and behavior downstream from highly selective receptorneurons. Nat. Neurosci 2007;10:623–630. [PubMed: 17417635]
Schoppa NE. Inhibition acts globally to shape olfactory cortical tuning. Neuron 2009;62:750–752.[PubMed: 19555643]
Schoppa NE, Kinzie JM, Sahara Y, Segerson TP, Westbrook GL. Dendrodendritic inhibition in theolfactory bulb is driven by NMDA receptors. J. Neurosci 1998;18:6790–6802. [PubMed: 9712650]
Shang Y, Claridge-Chang A, Sjulson L, Pypaert M, Miesenböck G. Excitatory local circuits and theirimplications for olfactory processing in the fly antennal lobe. Cell 2007;128:601–612. [PubMed:17289577]
Shen GY, Chen WR, Midtgaard J, Shepherd GM, Hines ML. Computational analysis of action potentialinitiation in mitral cell soma and dendrites based on dual patch recordings. J. Neurophysiol1999;82:3006–3020. [PubMed: 10601436]
Shepherd, GM.; Chen, WR.; Greer, CA. Olfactory Bulb. In: Shepherd, GM., editor. The SynapticOrganization of the Brain. Oxford University Press; New York: 2004. p. 165-217.
Shipley MT, Ennis M. Functional organization of olfactory system. J. Neurobiol 1996;30:123–176.[PubMed: 8727988]
Soucy ER, Albeanu DF, Fantana AL, Murthy VN, Meister M. Precision and diversity in an odor map onthe olfactory bulb. Nat. Neurosci 2009;12:210–220. [PubMed: 19151709]
Stettler DD, Axel R. Representations of odor in the piriform cortex. Neuron 2009;63:854–864. [PubMed:19778513]
Tsuno Y, Kashiwadani H, Mori K. Behavioral state regulation of dendrodendritic synaptic inhibition inthe olfactory bulb. J. Neurosci 2008;28:9227–9238. [PubMed: 18784303]
Uchida N, Takahashi YK, Tanifuji M, Mori K. Odor maps in the mammalian olfactory bulb: domainorganization and odorant structural features. Nat. Neurosci 2000;3:1035–1043. [PubMed: 11017177]
Valley MT, Firestein S. A lateral look at olfactory bulb lateral inhibition. Neuron 2008;59:682–684.[PubMed: 18786352]
Tan et al. Page 16
Neuron. Author manuscript; available in PMC 2011 March 25.
NIH
-PA Author Manuscript
NIH
-PA Author Manuscript
NIH
-PA Author Manuscript
Vassar R, Chao SK, Sitcheran R, Nuñez JM, Vosshall LB, Axel R. Topographic organization of sensoryprojections to the olfactory bulb. Cell 1994;79:981–991. [PubMed: 8001145]
Vinje WE, Gallant JL. Sparse coding and decorrelation in primary visual cortex during natural vision.Science 2000;287:1273–1276. [PubMed: 10678835]
Vosshall LB, Stocker RF. Molecular architecture of smell and taste in Drosophila. Annu. Rev. Neurosci2007;30:505–533. [PubMed: 17506643]
Wachowiak M, Cohen LB. Representation of odorants by receptor neuron input to the mouse olfactorybulb. Neuron 2001;32:723–735. [PubMed: 11719211]
Wachowiak M, Shipley MT. Coding and synaptic processing of sensory information in the glomerularlayer of the olfactory bulb. Semin. Cell Dev. Biol 2006;17:411–423. [PubMed: 16765614]
Wang JW, Wong AM, Flores J, Vosshall LB, Axel R. Two-photon calcium imaging reveals an odor-evoked map of activity in the fly brain. Cell 2003;112:271–282. [PubMed: 12553914]
Wellis DP, Scott JW, Harrison TA. Discrimination among odorants by single neurons of the rat olfactorybulb. J. Neurophysiol 1989;61:1161–1177. [PubMed: 2746317]
Willhite DC, Nguyen KT, Masurkar AV, Greer CA, Shepherd GM, Chen WR. Viral tracing identifiesdistributed columnar organization in the olfactory bulb. Proc. Natl. Acad. Sci. USA 2006;103:12592–12597. [PubMed: 16895993]
Wilson RI, Mainen ZF. Early events in olfactory processing. Annu. Rev. Neurosci 2006;29:163–201.[PubMed: 16776583]
Wilson RI, Turner GC, Laurent G. Transformation of olfactory representations in the Drosophila antennallobe. Science 2004;303:366–370. [PubMed: 14684826]
Yokoi M, Mori K, Nakanishi S. Refinement of odor molecule tuning by dendrodendritic synapticinhibition in the olfactory bulb. Proc. Natl. Acad. Sci. USA 1995;92:3371–3375. [PubMed: 7724568]
Yoshihara Y, Nagao H, Mori K. Neurobiology. Sniffing out odors with multiple dendrites. Science2001;291:835–837. [PubMed: 11225631]
Zhang X, Zhang X, Firestein S. Comparative genomics of odorant and pheromone receptor genes inrodents. Genomics 2007;89:441–450. [PubMed: 17303377]
Zhao H, Ivic L, Otaki JM, Hashimoto M, Mikoshiba K, Firestein S. Functional expression of a mammalianodorant receptor. Science 1998;279:237–242. [PubMed: 9422698]
Tan et al. Page 17
Neuron. Author manuscript; available in PMC 2011 March 25.
NIH
-PA Author Manuscript
NIH
-PA Author Manuscript
NIH
-PA Author Manuscript

Figure 1. I7 OSNs Respond ~10 Times More Sensitively to Heptanal than to Octanal(A) Schematic representation of experimental strategy. I7 OSNs (green) were identified bygreen fluorescence in an intact epithelial preparation. Their firing of action potentials wasrecorded extracellularly from dendritic knobs in cell-attached mode. Odorants were applied bypressure through a seven-barrel pipette.(B) Strong green fluorescence in the dendritic knob and cilia of a GFP+ I7 OSN.(C) Traces showing the responses evoked by heptanal at different concentrations as indicatedby the numbers to the left (in μM). Horizontal bars indicate the timing of odorant application(300 ms). In this and the following figures, heptanal is abbreviated as 7al and octanal as 8al.(D) Reponses of another I7 OSN to octanal at different concentrations.(E) Dose-response plots and fitted sigmoid functions of I7 OSNs to heptanal (n = 10 cells) andoctanal (n = 10 cells). The response strength was normalized to the mean saturated firingfrequency to heptanal. Error bars indicate SEM in this and the following figures.(F) Mean and individual EC50 values of different I7 OSNs to heptanal and octanal. ***p <0.001 (between-group t test).
Tan et al. Page 18
Neuron. Author manuscript; available in PMC 2011 March 25.
NIH
-PA Author Manuscript
NIH
-PA Author Manuscript
NIH
-PA Author Manuscript
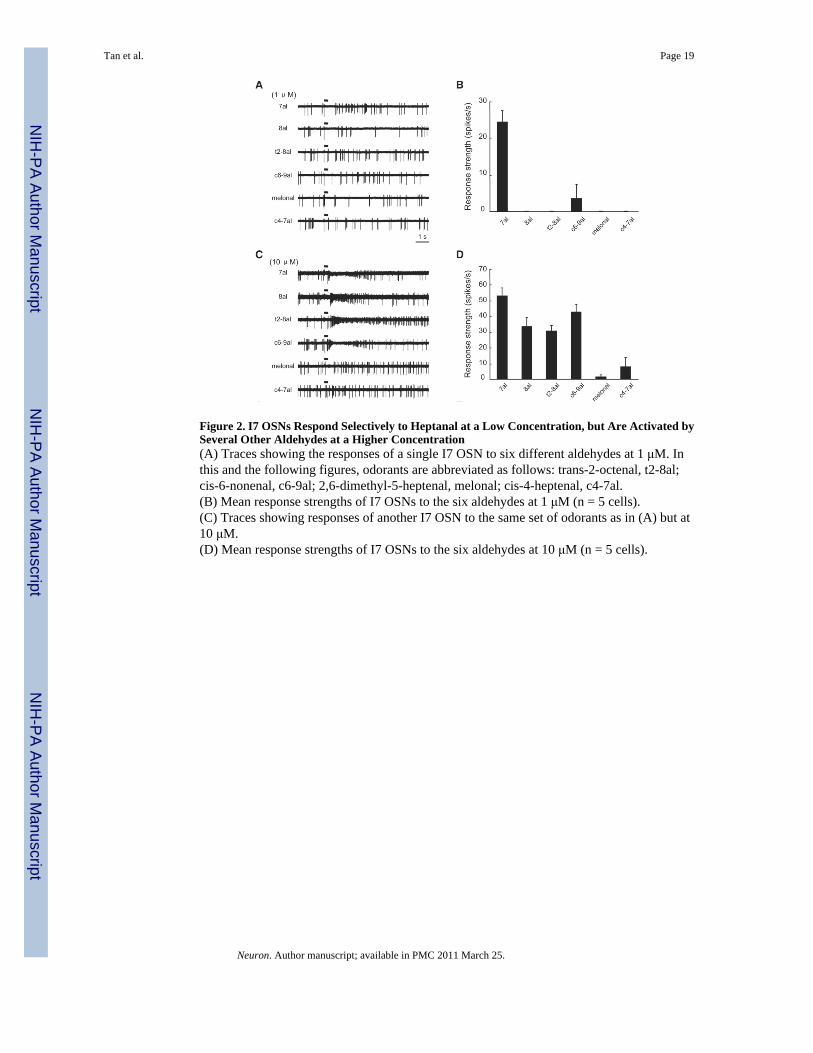
Figure 2. I7 OSNs Respond Selectively to Heptanal at a Low Concentration, but Are Activated bySeveral Other Aldehydes at a Higher Concentration(A) Traces showing the responses of a single I7 OSN to six different aldehydes at 1 μM. Inthis and the following figures, odorants are abbreviated as follows: trans-2-octenal, t2-8al;cis-6-nonenal, c6-9al; 2,6-dimethyl-5-heptenal, melonal; cis-4-heptenal, c4-7al.(B) Mean response strengths of I7 OSNs to the six aldehydes at 1 μM (n = 5 cells).(C) Traces showing responses of another I7 OSN to the same set of odorants as in (A) but at10 μM.(D) Mean response strengths of I7 OSNs to the six aldehydes at 10 μM (n = 5 cells).
Tan et al. Page 19
Neuron. Author manuscript; available in PMC 2011 March 25.
NIH
-PA Author Manuscript
NIH
-PA Author Manuscript
NIH
-PA Author Manuscript

Figure 3. I7 M/T Cells Respond Sensitively to Heptanal, whereas Sensitivity to Octanal IsSignificantly Lower(A) Schematic representation of simplified circuitry in the MOB and our experimental strategy.A dye- and neurobiotin-filled glass electrode (red pipette) was targeted to a GFP+ I7 glomerulusto search for I7 M/T cells. Their firing of action potentials was extracellularly recorded, likelyfrom the primary dendritic trunks of M/T cells. The recorded neurons were then juxtacellularlylabeled (red), and their relationship with the I7 glomerulus was confirmed by the presence ofdye-filled primary dendritic tufts exclusively in GFP+ glomerulus. G, glomerulus; Gr, granulecells. In this and the following figures, short axon cells are not shown for simplicity.(B) Schematic representation of the experimental setup. GFP+ glomeruli were visualized bytwo-photon microscopic imaging. Odorants were stored in headspace vials on an 8 × 8 paneland delivered with a custom-made robotic olfactometer. Two headspace vials in the panelcontaining pure air or air with mineral oil were used as controls. An additional set of sevenaldehydes was delivered by a custom-made seven-channel olfactometer.(C) A two-photon microscopic image shows the targeting of tetramethylrhodamine dextranamine-filled recording pipette (red) into the I7 glomerulus (green).(D) During juxtacellular labeling, the firing of the recorded cell was tightly synchronized withcurrent injection.(E–G) Three examples showing heptanal-evoked responses from different subtypes of I7 M/T cells (a mitral cell in E, a middle tufted cell in F, and an external tufted cell in G). (Toppanels) Juxtacellular labeling revealed that the recorded cells (red) extended their primarydendritic tufts into dorsal I7 glomeruli labeled with GFP (green). Blue, DAPI labeling todelineate glomeruli. Below the images are physiological traces, respiratory rhythms, and meanperistimulus time histogram (PSTH) plots showing that heptanal evoked strong firing of actionpotentials from these cells. In all three examples, heptanal was diluted as 1% saturated vapor.In this and the following figures, horizontal bars above physiological traces represent 2 sodorant pulses and serve as timescale as well. Scale bars, 20 μm.
Tan et al. Page 20
Neuron. Author manuscript; available in PMC 2011 March 25.
NIH
-PA Author Manuscript
NIH
-PA Author Manuscript
NIH
-PA Author Manuscript

(H) Physiological traces showing the response intensities of a mitral cell to heptanal and octanalat different concentrations. The concentrations shown on the left (in μM) were calculated fromthe dilutions of saturated vapor pressure of heptanal and octanal. For heptanal, 1% dilution ofsaturated vapor corresponds to 1.9 μM.(I) Dose-response curves of I7 M/T cells to heptanal (n = 8 cells) and octanal (n = 7 cells). Theresponse strengths were normalized to the saturated response strength of I7 M/T cells toheptanal.(J) Mean EC50 values of I7 M/T cells to heptanal were significantly lower than those to octanal(**p < 0.01; t test). The colors of circles code for different cell subtypes in this figure andFigure 4D. Red, mitral cells; blue, middle tufted cells; black, external tufted cells.See also Figure S1 and Table S1.
Tan et al. Page 21
Neuron. Author manuscript; available in PMC 2011 March 25.
NIH
-PA Author Manuscript
NIH
-PA Author Manuscript
NIH
-PA Author Manuscript

Figure 4. I7 M/T Cells Exhibit Sharp Tuning Curves, with Heptanal Being the Most EffectiveStimulus(A) Tuning curves of three I7 M/T cells in response to a diverse set of odorants, all at 0.1%dilutions of saturated vapor. Mean response strength to each odorant is plotted against odorantidentity (Table S2). Arrow points to the strength of response to heptanal.(B) Tuning curves of three additional I7 M/T cells in response to the same set of odorants at1% dilution.(C) Comparison of the mean tuning curves of I7 M/T cells at 0.1% and 1% dilutions (n = 9and 10 cells, respectively). Response intensities were normalized to the maximum responsesof the cells to heptanal. Odorant identities are aligned to produce a smooth tuning curve forresponses to odorants at 1% dilution, with a maximum response in the middle. The alignmentof odorant identities is identical for horizontal axes in (A)–(C) and is listed in Table S2.(D) The lifetime sparseness (S) value of I7 M/T cells to odorants at 0.1% dilution is significantlyhigher than that at 1% (*p < 0.05; t test between concentrations). Circles indicate S values ofindividual M/T cells.(E) The matrices of Pearson's correlation coefficients for the tuning curves across individualI7 M/T cells at concentrations of 0.1% (left-hand panel, mean coefficient = 0.72 ± 0.06, mean± STD) and 1% (right-hand panel, 0.44 ± 0.016). Color bar indicates the range of correlationcoefficients. M, mitral cells; T, middle tufted cells; E, external tufted cells.See also Figure S2 and Table S2.
Tan et al. Page 22
Neuron. Author manuscript; available in PMC 2011 March 25.
NIH
-PA Author Manuscript
NIH
-PA Author Manuscript
NIH
-PA Author Manuscript
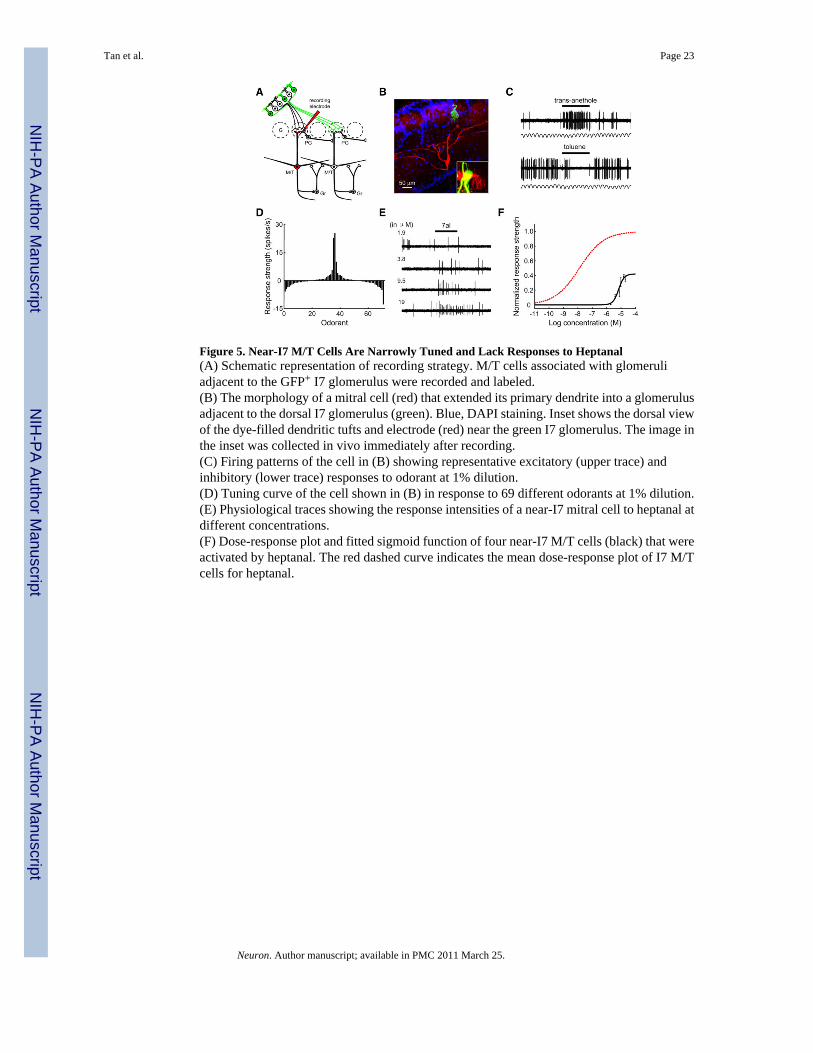
Figure 5. Near-I7 M/T Cells Are Narrowly Tuned and Lack Responses to Heptanal(A) Schematic representation of recording strategy. M/T cells associated with glomeruliadjacent to the GFP+ I7 glomerulus were recorded and labeled.(B) The morphology of a mitral cell (red) that extended its primary dendrite into a glomerulusadjacent to the dorsal I7 glomerulus (green). Blue, DAPI staining. Inset shows the dorsal viewof the dye-filled dendritic tufts and electrode (red) near the green I7 glomerulus. The image inthe inset was collected in vivo immediately after recording.(C) Firing patterns of the cell in (B) showing representative excitatory (upper trace) andinhibitory (lower trace) responses to odorant at 1% dilution.(D) Tuning curve of the cell shown in (B) in response to 69 different odorants at 1% dilution.(E) Physiological traces showing the response intensities of a near-I7 mitral cell to heptanal atdifferent concentrations.(F) Dose-response plot and fitted sigmoid function of four near-I7 M/T cells (black) that wereactivated by heptanal. The red dashed curve indicates the mean dose-response plot of I7 M/Tcells for heptanal.
Tan et al. Page 23
Neuron. Author manuscript; available in PMC 2011 March 25.
NIH
-PA Author Manuscript
NIH
-PA Author Manuscript
NIH
-PA Author Manuscript
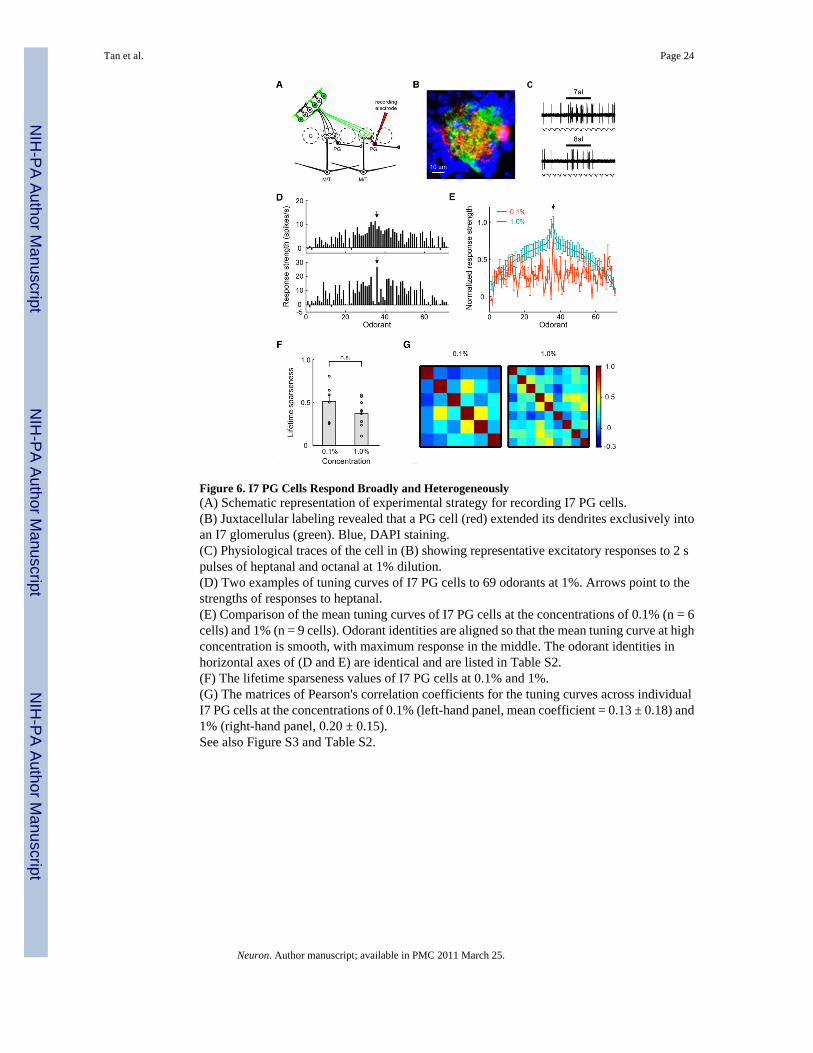
Figure 6. I7 PG Cells Respond Broadly and Heterogeneously(A) Schematic representation of experimental strategy for recording I7 PG cells.(B) Juxtacellular labeling revealed that a PG cell (red) extended its dendrites exclusively intoan I7 glomerulus (green). Blue, DAPI staining.(C) Physiological traces of the cell in (B) showing representative excitatory responses to 2 spulses of heptanal and octanal at 1% dilution.(D) Two examples of tuning curves of I7 PG cells to 69 odorants at 1%. Arrows point to thestrengths of responses to heptanal.(E) Comparison of the mean tuning curves of I7 PG cells at the concentrations of 0.1% (n = 6cells) and 1% (n = 9 cells). Odorant identities are aligned so that the mean tuning curve at highconcentration is smooth, with maximum response in the middle. The odorant identities inhorizontal axes of (D and E) are identical and are listed in Table S2.(F) The lifetime sparseness values of I7 PG cells at 0.1% and 1%.(G) The matrices of Pearson's correlation coefficients for the tuning curves across individualI7 PG cells at the concentrations of 0.1% (left-hand panel, mean coefficient = 0.13 ± 0.18) and1% (right-hand panel, 0.20 ± 0.15).See also Figure S3 and Table S2.
Tan et al. Page 24
Neuron. Author manuscript; available in PMC 2011 March 25.
NIH
-PA Author Manuscript
NIH
-PA Author Manuscript
NIH
-PA Author Manuscript

Figure 7. Granule Cells in the MOB Are Broadly Tuned(A) Schematic representation of recording strategy. Granule cells were randomly recorded andlabeled by lowering electrodes into the granule cell layer.(B) The morphology of a granule cell, which belongs to the most abundant neuron type in thebulb.(C) The granule cell in (B) shows both excitatory and inhibitory responses to odorants at 1%dilution.(D) Two examples of tuning curves of granule cells to 64 odorants at 1% dilution. (Upperpanel) The tuning curve of the granule cell shown in (B) at 1% dilution. (Lower panel) Thetuning curve of another granule cell illustrating the lack of inhibition.(E) Mean tuning curves of granule cells to 64 odorants at 0.1% and 1% dilutions (n = 5 and 8cells, respectively). The response strengths of granule cells to odorants at 0.1% dilutions arenormalized to the mean peak responses of granule cells to odorants at 1% dilutions.See also Figure S4.
Tan et al. Page 25
Neuron. Author manuscript; available in PMC 2011 March 25.
NIH
-PA Author Manuscript
NIH
-PA Author Manuscript
NIH
-PA Author Manuscript
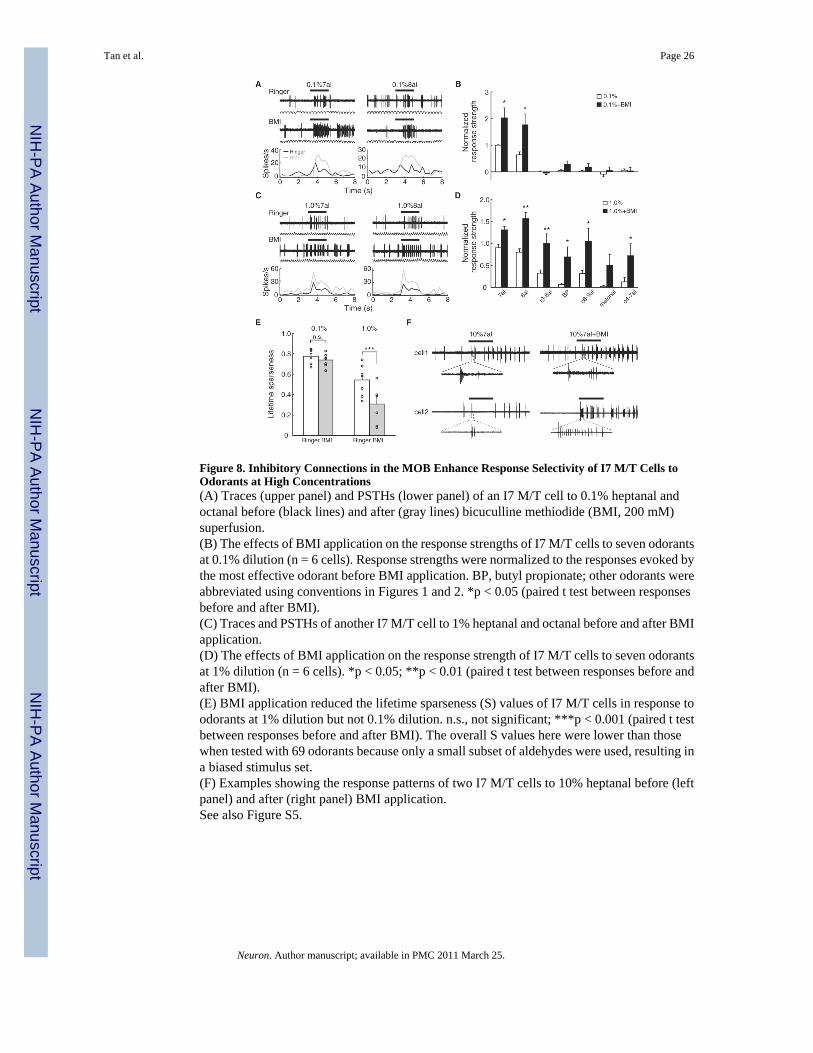
Figure 8. Inhibitory Connections in the MOB Enhance Response Selectivity of I7 M/T Cells toOdorants at High Concentrations(A) Traces (upper panel) and PSTHs (lower panel) of an I7 M/T cell to 0.1% heptanal andoctanal before (black lines) and after (gray lines) bicuculline methiodide (BMI, 200 mM)superfusion.(B) The effects of BMI application on the response strengths of I7 M/T cells to seven odorantsat 0.1% dilution (n = 6 cells). Response strengths were normalized to the responses evoked bythe most effective odorant before BMI application. BP, butyl propionate; other odorants wereabbreviated using conventions in Figures 1 and 2. *p < 0.05 (paired t test between responsesbefore and after BMI).(C) Traces and PSTHs of another I7 M/T cell to 1% heptanal and octanal before and after BMIapplication.(D) The effects of BMI application on the response strength of I7 M/T cells to seven odorantsat 1% dilution (n = 6 cells). *p < 0.05; **p < 0.01 (paired t test between responses before andafter BMI).(E) BMI application reduced the lifetime sparseness (S) values of I7 M/T cells in response toodorants at 1% dilution but not 0.1% dilution. n.s., not significant; ***p < 0.001 (paired t testbetween responses before and after BMI). The overall S values here were lower than thosewhen tested with 69 odorants because only a small subset of aldehydes were used, resulting ina biased stimulus set.(F) Examples showing the response patterns of two I7 M/T cells to 10% heptanal before (leftpanel) and after (right panel) BMI application.See also Figure S5.
Tan et al. Page 26
Neuron. Author manuscript; available in PMC 2011 March 25.
NIH
-PA Author Manuscript
NIH
-PA Author Manuscript
NIH
-PA Author Manuscript
Copyright © 2022 FDOKUMEN