Understanding the impacts of India's LED bulb programme
70
Understanding the impacts of India’s LED bulb programme, “UJALA”
-
Upload
khangminh22 -
Category
Documents
-
view
6 -
download
0
Transcript of Understanding the impacts of India's LED bulb programme
Understanding the impacts of India’s LED bulb programme, “UJALA”
Understanding the impacts of India’s LED bulb programme, “UJALA”
Aditya Chunekar | Sanjana Mulay | Mrudula Kelkar
August 2017
About Prayas
Prayas (Initiatives in Health, Energy, Learning and Parenthood) is a non Governmental, non-profit organization based in Pune, India. Members of Prayas are professionals working to protect and promote the public interest in general, and interests of the disadvantaged sections of the society, in particular. Prayas (Energy Group) works on theoretical, conceptual regulatory and policy issues in the energy and electricity sectors. Our activities cover research and intervention in policy and regulatory areas, as well as training, awareness, and support to civil society groups. Prayas (Energy Group) has contributed in the energy sector policy development as part of several official committees constituted by Ministries and Planning Commission. Prayas is registered as SIRO (Scientific and Industrial Research Organization) with Department of Scientific and Industrial Research, Ministry of Science and Technology, Government of India.
Prayas (Energy Group)
Unit III A & III B, Devgiri,Kothrud Industrial Area,Joshi Railway Museum Lane, KothrudPune 411 038. Maharashtra Phone: 020 - 2542 0720E-mail: [email protected]; http://www.prayaspune.org/peg
Acknowledgements:
This report has greatly benefited from interactions with officials of Energy Efficiency Services Ltd. (EESL), Bureau of Energy Efficiency (BEE), Maharashtra State Electricity Distribution Company Ltd. (MSEDCL), Uttar Pradesh Electricity Regulatory Commission (UPERC), Madhyanchal Vidyut Vitaran Nigam Ltd. (MVVNL), and Puducherry Electricity Department (PED). We thank Adwait Pednekar for his valuable assistance in the lighting market analysis. We also thank Prof. Suryanarayana Doolla and Prof. Rangan Banerjee from Indian Institute of Technology (IIT), Bombay for their insights and feedback throughout the study. We also thank the Electric Lamps and Component Manufacturers’ Association of India (ELCOMA) and company officials from Havells India Ltd., Surya Roshni Ltd., Philips India Ltd., Crompton Greaves Ltd., and Wipro India Ltd. for their inputs on the lighting industry. Mr. Chaitanya Sthalekar, Mr. Makrand Joshi, Mr. Bhagwan Shirsekar, and Mr. Chandrahas Shetty provided further insights as experts from the lighting industry. We also interacted with Mr. H. Wadhwa to understand the testing methodology for LED bulbs. Our analysis is based on inputs from the above stakeholders but our inferences from the analysis should not be attributed to these individuals and organizations.
We thank Mr. Daljit Singh and Mr. S. Padmanabhan for reviewing the report and providing valuable comments. We would also like to thank our colleagues Shantanu Dixit and Ashwin Gambhir for their review comments, Shirish Darak and Ritu Parchure for their assistance in developing the sampling strategy and survey questionnaire, and Shilpa Kelkar and Manabika Mandal for editing and cover design. Ms. Neeta Deshpande copy-edited the report and the team at Mudra assisted in publication. The surveys were conducted by Anthropos consultants in Pune, Citizen consumer and civic action Group (CAG) in Puducherry, and MORSEL in Lucknow. Naveen Allaparthi, Gautam Havaldar, and Akshay Deshmukh provided research assistance on some sections of the report.
We are grateful to Shakti Sustainable Energy Foundation for its support. The Shakti Sustainable Energy Foundation works to strengthen the energy security of India by aiding the design and implementation of policies that support energy efficiency and renewable energy. The views/analysis expressed in this report/document do not necessarily reflect the views of Shakti Sustainable Energy Foundation. The foundation also does not guarantee the accuracy of any data included in this publication nor does it accept responsibility for the consequences of its use.
August 2017For Private Circulation only
Copyright: Any part of this report can be reproduced for non-commercial use without prior permission, provided that Prayas is clearly acknowledged, and a copy of the published document is sent to Prayas.
Design and Printed by:Mudra383, Narayan Peth, [email protected]

iii
Contents
Executive summary vi
1 Introduction 1
2 Background 3
2.1 Lighting in India’s residential sector 3
2.2 Energy efficiency programmes for lighting in India 4
2.3 DELP and UJALA 6
3 Methodology 9
4 Understanding the impacts of the UJALA programme 11
4.1 How has India’s lighting market changed? 11
4.2 How have consumers responded? 18
4.3 How effective are the various processes of the programme? 23
5 Lessons and recommendations 33
5.1 UJALA programme 33
5.2 Future programmes 34
6 Conclusion 36
References 37
Annexure 1: Consumer surveys 39
Annexure 2: Retailer surveys 47
Annexure 3: Bidding requirements for manufacturers of LED bulbs 50
Annexure 4: UJALA distribution agencies 52
iv
List of figures
Figure 1 : (a) Estimated residential lighting stock in India (about a billion points) in 2011 (b) Share of annual sales of different lighting devices in India in 2011 3
Figure 2 : Procurement data for the UJALA programme 7
Figure 3 : Indian lighting industry growth by value 11
Figure 4 : Sales trends of CFLs, tube lights, incandescent bulbs, and LED bulbs 12
Figure 5 : Reason for purchase of UJALA bulbs given by surveyed households 19
Figure 6 : Current status of LED bulbs bought through the UJALA programme (for surveyed households) 20
Figure 7 : Future replacement of LED bulbs by surveyed households 20
Figure 8 : Lighting stock for surveyed consumers 21
Figure 9 : Lighting options replaced by LED bulbs for surveyed households 22
Figure 10 : UJALA programme processes 24
Figure 11 : UJALA dashboard 27
Figure 12 : Failure rate and exchange rate of UJALA bulbs (for surveyed consumers) 31
List of tables
Table 1 : Comparison of key features of LED bulbs, CFLs, and incandescent bulbs 4
Table 2 : Comparison of features of different energy efficiency lighting programmes in India 8
Table 3 : Ratings for LED bulbs according to BEE 17
Table 4 : Details of consumer surveys 18
Table 5 : Comparison between low, medium, and high income households surveyed, Pune 23
Table 6 : Comparison of usage hours 32
v
List of abbreviations
ATO : Average Annual Turnover
BEE : Bureau of Energy Efficiency
BIS : Bureau of Indian Standards
BLY : Bachat Lamp Yojana
CDM : Clean Development Mechanism
CEA : Central Electricity Authority
CFL : Compact Fluorescent Light
CRS : Compulsory Registration Scheme
DELP : DSM-based Efficient Lighting Programme
DISCOM : (Electricity) Distribution Company
DSM : Demand Side Management
EDP : Electricity Department of the Government of Puducherry
EESL : Energy Efficiency Services Ltd.
ELCOMA : Electric Lamps and Component Manufacturers’ Association of India
ESCO : Energy Service Company
HH : Household
ICB : Incandescent Bulb
LED : Light Emitting Diode
Lm/W : lumens/watt
MeitY : Ministry of Electronics and Information Technology
MERC : Maharashtra Electricity Regulatory Commission
MSEDCL : Maharashtra State Electricity Distribution Company Ltd.
MSMEs : Micro, Small and Medium Enterprises
NABL : National Accreditation Board for Testing and Calibration Laboratories
NSIC : National Small Industries Corporation
NTPC : National Thermal Power Corporation
PAT : Perform, Achieve and Trade
PFC : Power Finance Corporation
REC : Rural Electrification Corporation
S&L : Standards and Labeling
SDA : State Designated Agency
SERC : State Electricity Regulatory Commission
SMEs : Small and Medium Enterprises
SOP : Standard Offer Programme
UJALA : Unnat Jyoti by Affordable LEDs for ALL
vi
Unnat Jyoti by Affordable LEDs for All (UJALA) is arguably the world’s largest zero-subsidy LED bulb programme for households. The UJALA programme has sold more than 230 million LED bulbs (and counting) to Indian households in just the three years since its launch in 2014. These bulbs are claimed to be saving more than 30 billion units (kWh) of electricity annually, which is about 13% of the residential electricity consumption in India in 2016. The avoided peak demand is claimed to be about 6000 MW, which is about the amount of solar capacity added in India in 2016. UJALA’s popularity has spurred Energy Efficiency Services Ltd. (EESL), its implementing agency, to use the programme model to sell energy efficient ceiling fans and air-conditioners. EESL also plans to implement the UJALA model in other countries like the United Kingdom, Canada, Nepal, and Bangladesh.
In this report, we systematically studied the varied impacts of the UJALA programme and effectiveness of the processes employed. The primary objective is to draw lessons to increase effectiveness of the existing UJALA programme, and to aid the design of similar future programmes in India and abroad. A secondary objective of this study is to highlight the importance of the comprehensive evaluation of energy efficiency policies and programmes. Such evaluations can increase their credibility and their effectiveness in achieving savings. We hope that this study will make a strong case to evaluate other energy efficiency programmes in India as well.
Three key questions are considered to understand the impacts of the UJALA programme:
i. How has India’s lighting market changed?
ii. How have consumers responded?
iii. How effective are the various processes of the programme?
A methodology combining desk and field research was adopted. The field research included:
• Surveysof1029householdswhoboughtLEDbulbsundertheprogrammeinthe cities of Pune, Lucknow, and Puducherry
• Surveysof150retailerssellingLEDbulbsintheabovecities
• Surveyof7distributionkiosksinPunecurrentlysellingLEDbulbsundertheprogramme
• Interviewswithmanufacturers,representativesfromELCOMA(ElectricLampand Component Manufacturers’ Association of India) and with independent market and technical consultants from the lighting industry
• InterviewswithrepresentativesfromEESLandtheBureauofEnergyEfficiency,the statutory nodal agency responsible for energy efficiency programmes in India
Executive Summary
vii
• Interviewswithrepresentativesfrom9electricitydistributioncompanies(DISCOMs)
The study is not intended to be a comprehensive evaluation of the UJALA programme. Our household surveys include only three cities and hence do not statistically represent the entire country. Our assessment is based on limited public data and interactions with selected stakeholders. Our intention is to provide an indicative assessment of the UJALA programme.
Key impacts, causes, and sustainability
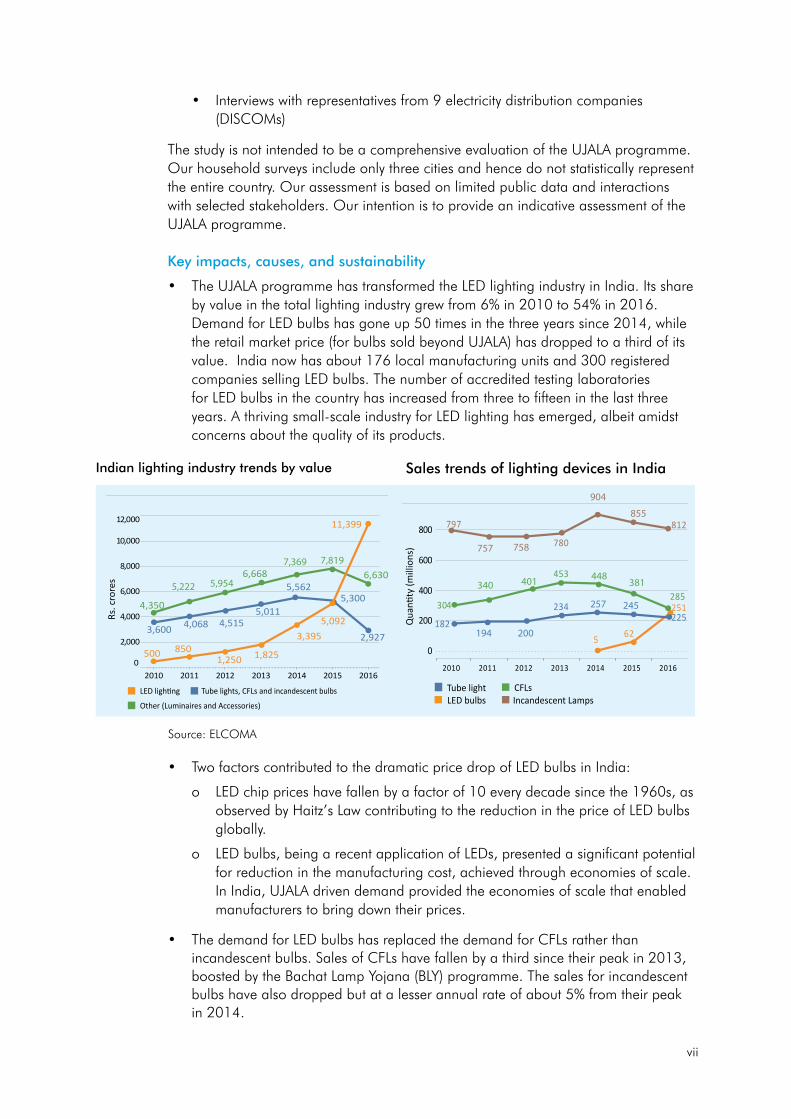
• TheUJALAprogrammehastransformedtheLEDlightingindustryinIndia.Itsshareby value in the total lighting industry grew from 6% in 2010 to 54% in 2016. Demand for LED bulbs has gone up 50 times in the three years since 2014, while the retail market price (for bulbs sold beyond UJALA) has dropped to a third of its value. India now has about 176 local manufacturing units and 300 registered companies selling LED bulbs. The number of accredited testing laboratories for LED bulbs in the country has increased from three to fifteen in the last three years. A thriving small-scale industry for LED lighting has emerged, albeit amidst concerns about the quality of its products.
Sales trends of lighting devices in IndiaIndian lighting industry trends by value
Source: ELCOMA
• TwofactorscontributedtothedramaticpricedropofLEDbulbsinIndia:
o LED chip prices have fallen by a factor of 10 every decade since the 1960s, as observed by Haitz’s Law contributing to the reduction in the price of LED bulbs globally.
o LED bulbs, being a recent application of LEDs, presented a significant potential for reduction in the manufacturing cost, achieved through economies of scale. In India, UJALA driven demand provided the economies of scale that enabled manufacturers to bring down their prices.
• ThedemandforLEDbulbshasreplacedthedemandforCFLsratherthanincandescent bulbs. Sales of CFLs have fallen by a third since their peak in 2013, boosted by the Bachat Lamp Yojana (BLY) programme. The sales for incandescent bulbs have also dropped but at a lesser annual rate of about 5% from their peak in 2014.
Rs. c
rore
s
Qua
ntity
(mill
ions
)
2010 2011 2012 2013 2014 2015 20160
2,000
4,000
6,000
8,000
10,000
12,000
2,927
5,011
5,5625,300
3,600 4,068 4,515
500 1,8251,250850
3,3955,092
11,399
4,350
6,668 6,630
2010 2011 2012 2013 2014 2015 2016
0
200
400
600
800780
453
285
5 62
251234
797 812
304
182225
LED lightingTube lightLED bulbs Incandescent Lamps
CFLs
Other (Luminaires and Accessories)
Tube lights, CFLs and incandescent bulbs
757 758
194 200
257 245
904
855
340
7,8197,369
5,9545,222401 448
381
viii
• TheincreaseddemandforLEDbulbs,increasedmanufacturingcapacity,development of efficiency standards, and the growth in the number of testing laboratories are expected to sustain over time. The shift from CFLs to LEDs is also likely to be permanent, as LED bulbs provide better light, consume less electricity, and can be disposed of safely, while costing the same as CFLs.
• ThepriceofLEDbulbssoldundertheUJALAprogrammeisalmosthalfofthepriceof LED bulbs sold in retail outlets in India. This price difference is due to aggressive bidding by manufacturers and the exclusion of regular dealers and retailers from the programme. However, both are not sustainable in the long term. Interviews with industry stakeholders reveal that the retail market prices, after falling to a third of its value in 2014, have stabilised and may not go down further.
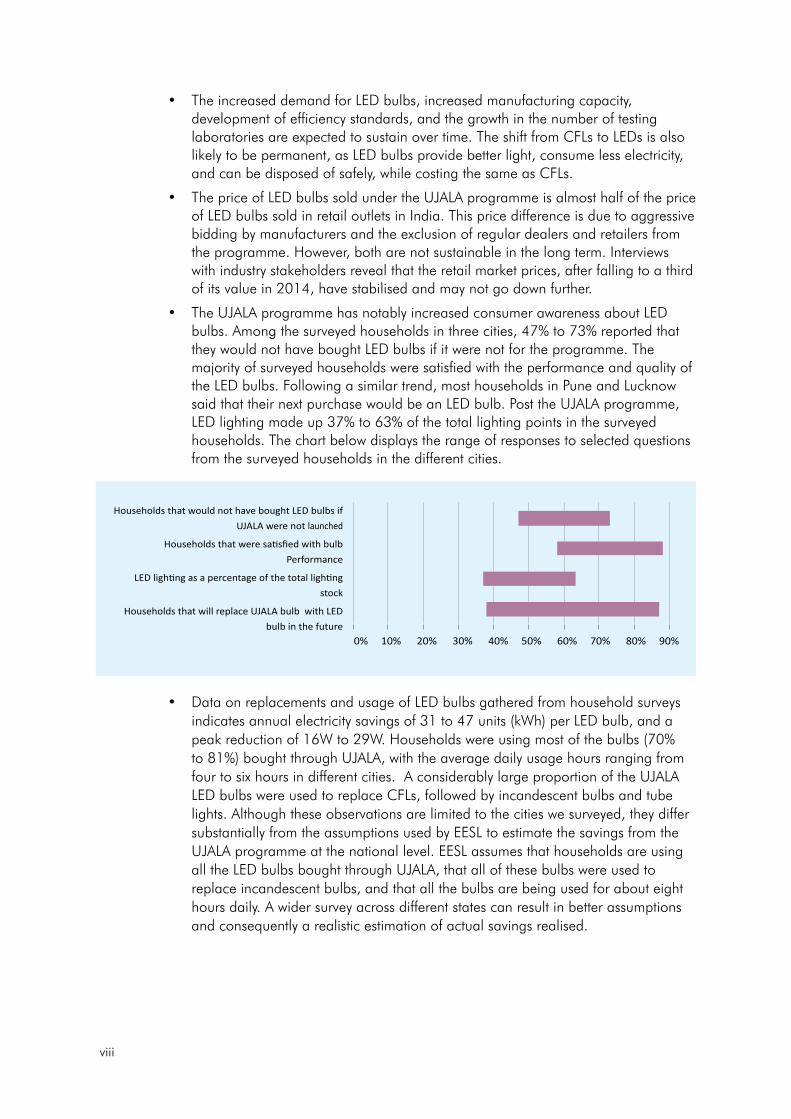
• TheUJALAprogrammehasnotablyincreasedconsumerawarenessaboutLEDbulbs. Among the surveyed households in three cities, 47% to 73% reported that they would not have bought LED bulbs if it were not for the programme. The majority of surveyed households were satisfied with the performance and quality of the LED bulbs. Following a similar trend, most households in Pune and Lucknow said that their next purchase would be an LED bulb. Post the UJALA programme, LED lighting made up 37% to 63% of the total lighting points in the surveyed households. The chart below displays the range of responses to selected questions from the surveyed households in the different cities.
• DataonreplacementsandusageofLEDbulbsgatheredfromhouseholdsurveysindicates annual electricity savings of 31 to 47 units (kWh) per LED bulb, and a peak reduction of 16W to 29W. Households were using most of the bulbs (70% to 81%) bought through UJALA, with the average daily usage hours ranging from four to six hours in different cities. A considerably large proportion of the UJALA LED bulbs were used to replace CFLs, followed by incandescent bulbs and tube lights. Although these observations are limited to the cities we surveyed, they differ substantially from the assumptions used by EESL to estimate the savings from the UJALA programme at the national level. EESL assumes that households are using all the LED bulbs bought through UJALA, that all of these bulbs were used to replace incandescent bulbs, and that all the bulbs are being used for about eight hours daily. A wider survey across different states can result in better assumptions and consequently a realistic estimation of actual savings realised.
0% 10% 20% 30% 40% 50% 60% 70% 80% 90%
Households that would not have bought LED bulbs ifUJALA were not launched
Households that were satisfied with bulbPerformance
LED lighting as a percentage of the total lightingstock
Households that will replace UJALA bulb with LEDbulb in the future
ix
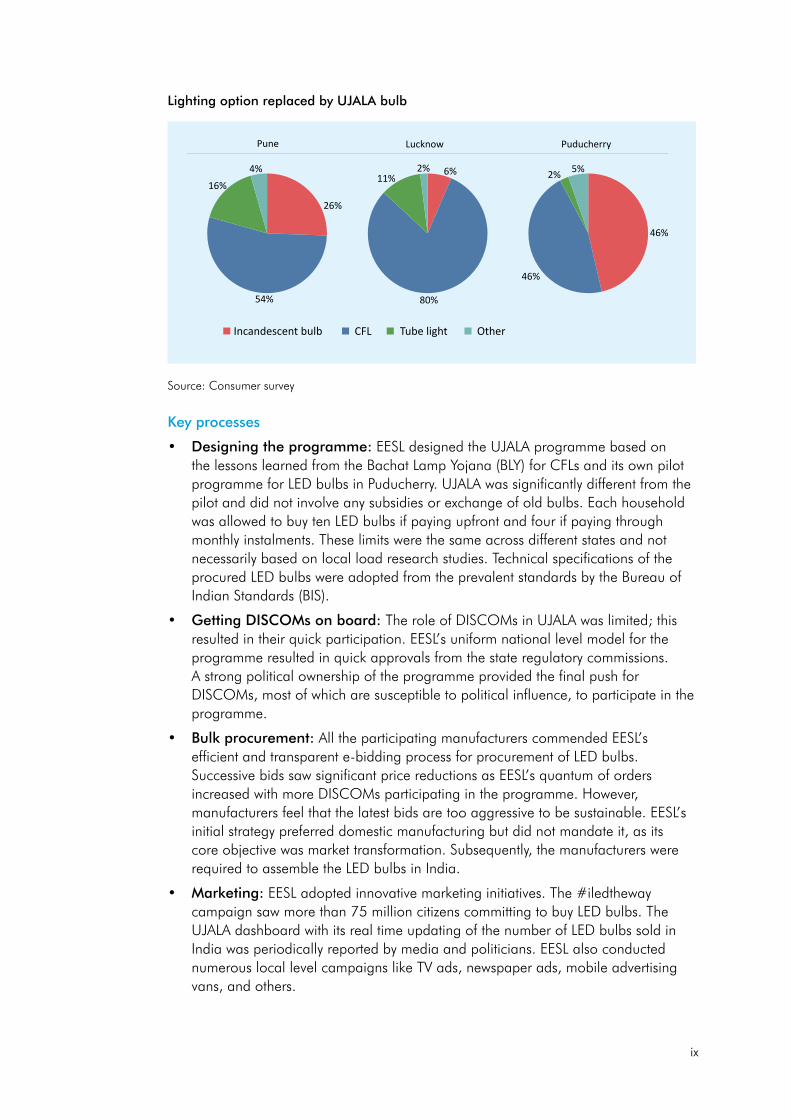
Source: Consumer survey
Key processes
• Designing the programme: EESL designed the UJALA programme based on the lessons learned from the Bachat Lamp Yojana (BLY) for CFLs and its own pilot programme for LED bulbs in Puducherry. UJALA was significantly different from the pilot and did not involve any subsidies or exchange of old bulbs. Each household was allowed to buy ten LED bulbs if paying upfront and four if paying through monthly instalments. These limits were the same across different states and not necessarily based on local load research studies. Technical specifications of the procured LED bulbs were adopted from the prevalent standards by the Bureau of Indian Standards (BIS).
• Getting DISCOMs on board: The role of DISCOMs in UJALA was limited; this resulted in their quick participation. EESL’s uniform national level model for the programme resulted in quick approvals from the state regulatory commissions. A strong political ownership of the programme provided the final push for DISCOMs, most of which are susceptible to political influence, to participate in the programme.
• Bulk procurement: All the participating manufacturers commended EESL’s efficient and transparent e-bidding process for procurement of LED bulbs. Successive bids saw significant price reductions as EESL’s quantum of orders increased with more DISCOMs participating in the programme. However, manufacturers feel that the latest bids are too aggressive to be sustainable. EESL’s initial strategy preferred domestic manufacturing but did not mandate it, as its core objective was market transformation. Subsequently, the manufacturers were required to assemble the LED bulbs in India.
• Marketing: EESL adopted innovative marketing initiatives. The #iledtheway campaign saw more than 75 million citizens committing to buy LED bulbs. The UJALA dashboard with its real time updating of the number of LED bulbs sold in India was periodically reported by media and politicians. EESL also conducted numerous local level campaigns like TV ads, newspaper ads, mobile advertising vans, and others.
Lighting option replaced by UJALA bulb
54%
16%
4%
26%
11%
80%
46%
46%
5%2%2% 6%
Incandescent bulb CFL Tube light Other
Pune Lucknow Puducherry
x
• Distribution: EESL hired vendors in each state to distribute the LED bulbs, record consumer data, collect defective bulbs for warranty, and advertise locally. EESL’s small team effectively coordinated the supply chain with the vendors across the country, which at the peak of the programme sold six lakh LED bulbs per day. However, our surveys show that the processes on the consumer end lacked compliance. Consumer data was not entirely recorded, the limit of ten LED bulbs per household was not strictly followed, and defective bulbs were not collected at all the centres, to be replaced under warranty.
• Monitoring and evaluation: EESL has a three-tier approach to ensure that procured LED bulbs comply with the BIS standards for safety and performance. This approach includes compliance reports from certified laboratories submitted by manufacturers, testing of a random sample by EESL, and a call centre to receive complaints from consumers. Our surveys found that about 2%, 6% and 14% of the total bulbs bought failed in Pune, Lucknow, and Puducherry respectively. Most of the households preferred not to replace these bulbs under warranty due to procedural and perceptual reasons. A comprehensive evaluation to assess the national and local level impacts of UJALA has not been conducted. EESL’s estimation of savings realised from UJALA needs to be justified by wider surveys collecting data on the actual use of LED Bulbs.
Key lessons and recommendations
Following are two sets of lessons and recommendations: one for the UJALA programme and the other for future programmes to be designed based on UJALA.
UJALA programme
• Focus on incandescent bulbs: Industry data and consumer surveys indicate that LED bulbs are mainly replacing CFLs. Going ahead, the programme needs to focus on lower income households and small commercial establishments who buy incandescent bulbs to phase out their use. One way to do this is to reemphasise the on-bill financing mechanism.
• Plan for systematic withdrawal: EESL cannot expect to continue selling LED bulbs perpetually and replace the vast network of dealers and retailers across India. Half of the demand for LED bulbs in India is still generated through the UJALA programme. A sudden withdrawal may result in a sharp drop in demand with a possible rise in price. A gradual withdrawal combined with shifted focus to low income households can be a good exit strategy.
• Ensure a smooth process for warranty settlement: Household surveys reveal that buyers are not keen on exchanging the faulty LED bulbs under warranty because they are either unaware of the option or have difficulty with the exchange process. EESL can make it convenient for consumers to return the faulty bulbs by conducting periodic collection drives or collaborating with local retail shops.
• Conduct awareness campaigns on the latest prices: UJALA prices for LED bulbs are half of the market price. Our kiosk surveys in Pune have revealed that distribution vendors can take advantage of this by charging a premium, while still keeping the final price below the market price. Consumers unaware of the latest prices still buy them and vendors pocket the premium. EESL and the local DISCOM can conduct awareness campaigns to avoid this.
xi
• Monitoring and evaluation: A stricter monitoring of the distribution of UJALA bulbs is required to ensure that they do not end up in retail shops. Also, data should be collected on participating households to facilitate systematic evaluation of the actual savings realised either through bill analysis or randomised consumer surveys. Periodic evaluation of the savings and processes should be conducted to increase their effectiveness.
• Disposal of CFLs: People are mostly replacing CFLs with LEDs under the UJALA programme. CFLs, with their mercury content, pose serious problems if they are discarded without care. EESL can collaborate with an e-waste company to set up collection kiosks for old CFLs along with the LED kiosks. Buyers should not be mandated to submit CFLs but could use the facility if they want to discard their used CFLs. This can ensure their proper disposal.
Future programmes
• The case of LED bulbs was an exception: The dramatic price drop in LED bulbs was a result of a global price reduction and the significant potential of economies of scale. The large scale uptake was also possible as LED bulbs are relatively cheaper than other appliances, as well as easy to buy and store. Although the bulk procurement model has the potential of transforming the market, programmes for other appliances should not be burdened with expectations of a speed and scale similar to that of the UJALA programme.
• Market transformation may be better if gradual and predictable: A gradual and predictable increase in demand for energy efficient technology is better for the creation of a market and its supporting eco-system such as testing laboratories and standards. A gradual transformation also prevents a mass lock-in to a particular technology given the rapid pace of technology change. Also, a proper withdrawal plan must be in place so that the market is not disturbed when the programme is withdrawn.
• Limited role of DISCOMs may work but not recommended for the long term: The EESL limited the role of DISCOMs in the programme to ensure faster and higher levels of participation. However, DISCOMs should not completely withdraw from the Demand Side Management (DSM) programmes. Effective DSM programmes can significantly impact the demand and load profiles which in turn can impact planning for the purchase of power by DISCOMs. They should actively engage with EESL to design specific programmes according to their needs. EESL and BEE should continue their efforts to build the capacity of DISCOMs with regard to DSM programmes.
• Comprehensive and periodic evaluation is necessary: A comprehensive evaluation of the varied impacts of the programme and the effectiveness of the processes is crucial. The BEE can commission these studies at the national level while regulatory commissions or DISCOMs can commission evaluation studies at the local level. A realistic estimate of achieved savings can reliably inform the planning process and also increase the credibility of the programmes.
• Transparency and accountability is important: A programme design document delineating all the features and processes along with their rationale can be useful as a reference for all the stakeholders, a guide for future programmes, and a tool to hold all the actors accountable. Similarly, during the course of the programme, reports on testing, evaluation, and warranty claims should be made public on a regular basis. This will help identify any major issues during the implementation and also increase the public credibility of the programme.
xii
To conclude, UJALA has succeeded in creating a large and sustainable market for LED bulbs in India using the no-subsidy, bulk procurement model. Demand for LED bulbs has increased manifold and the retail market price (for the LED bulbs sold beyond UJALA) has dropped by a third. Domestic manufacture of LED bulbs has increased, efficiency standards are being implemented, and the number of accredited testing laboratories has grown, all pointing to sustainability of the LED lighting market. It has also created a significant awareness about LED bulbs in India, further contributing to their increasing demand. Going ahead, EESL should target low income households and small commercial establishments who are still buying incandescent bulbs. It can conduct special campaigns and also focus more on the on-bill financing mechanism that reduces the upfront cost of the LED bulbs. The streamlined procurement processes and innovative marketing campaigns from the UJALA model can be used for other appliances as well. However, stricter monitoring and evaluation should be incorporated in the programme design to ensure the quality of the appliances, compliance of various processes, proper disposal of old appliances, and realistic calculation of achieved savings. Although the bulk procurement model does not involve subsidy, it is important to quantify the savings realistically to factor them into planning optimised capacity addition and adequate climate change mitigation actions.
1
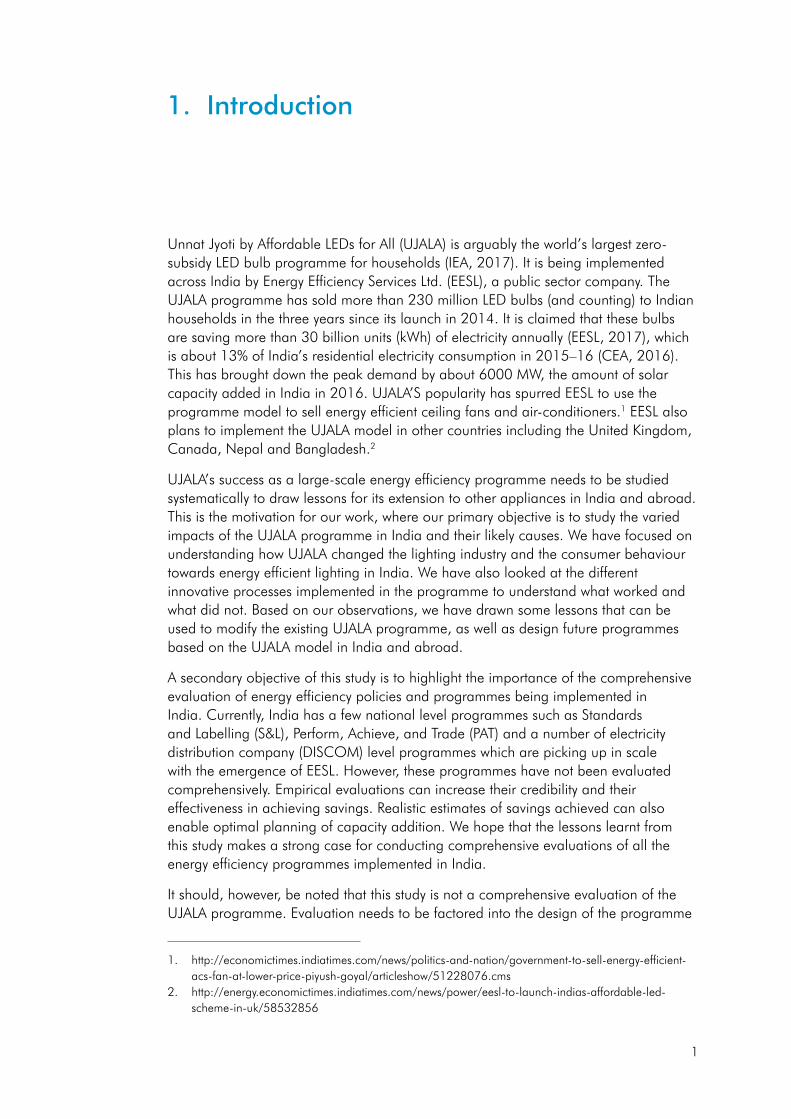
Unnat Jyoti by Affordable LEDs for All (UJALA) is arguably the world’s largest zero-subsidy LED bulb programme for households (IEA, 2017). It is being implemented across India by Energy Efficiency Services Ltd. (EESL), a public sector company. The UJALA programme has sold more than 230 million LED bulbs (and counting) to Indian households in the three years since its launch in 2014. It is claimed that these bulbs are saving more than 30 billion units (kWh) of electricity annually (EESL, 2017), which is about 13% of India’s residential electricity consumption in 2015–16 (CEA, 2016). This has brought down the peak demand by about 6000 MW, the amount of solar capacity added in India in 2016. UJALA’S popularity has spurred EESL to use the programme model to sell energy efficient ceiling fans and air-conditioners.1 EESL also plans to implement the UJALA model in other countries including the United Kingdom, Canada, Nepal and Bangladesh.2
UJALA’s success as a large-scale energy efficiency programme needs to be studied systematically to draw lessons for its extension to other appliances in India and abroad. This is the motivation for our work, where our primary objective is to study the varied impacts of the UJALA programme in India and their likely causes. We have focused on understanding how UJALA changed the lighting industry and the consumer behaviour towards energy efficient lighting in India. We have also looked at the different innovative processes implemented in the programme to understand what worked and what did not. Based on our observations, we have drawn some lessons that can be used to modify the existing UJALA programme, as well as design future programmes based on the UJALA model in India and abroad.
A secondary objective of this study is to highlight the importance of the comprehensive evaluation of energy efficiency policies and programmes being implemented in India. Currently, India has a few national level programmes such as Standards and Labelling (S&L), Perform, Achieve, and Trade (PAT) and a number of electricity distribution company (DISCOM) level programmes which are picking up in scale with the emergence of EESL. However, these programmes have not been evaluated comprehensively. Empirical evaluations can increase their credibility and their effectiveness in achieving savings. Realistic estimates of savings achieved can also enable optimal planning of capacity addition. We hope that the lessons learnt from this study makes a strong case for conducting comprehensive evaluations of all the energy efficiency programmes implemented in India.
It should, however, be noted that this study is not a comprehensive evaluation of the UJALA programme. Evaluation needs to be factored into the design of the programme
1. http://economictimes.indiatimes.com/news/politics-and-nation/government-to-sell-energy-efficient-acs-fan-at-lower-price-piyush-goyal/articleshow/51228076.cms
2. http://energy.economictimes.indiatimes.com/news/power/eesl-to-launch-indias-affordable-led-scheme-in-uk/58532856
1. Introduction

2
itself, and periodic data for pre-determined parameters should be collected during programme implementation in order to study its impacts. Also, a thorough process evaluation requires working closely with the implementation agency and monitoring each process separately. Our study is an independent analysis of the impacts and processes of the UJALA programme based on limited publicly available data, surveys and interviews with selected stakeholders. Our household surveys include only three cities and hence do not statistically represent the entire country. The observations are meant to be indicative and there is a scope for further broad and detailed evaluation.
In the next section, we briefly discuss lighting as an end-use in India’s residential sector and previous programmes implemented in India to promote energy efficient lighting. We also briefly discuss the features of UJALA and its predecessor DSM-based Efficient Lighting Programme (DELP). In Section 3, we describe our methodology for assessing the impacts of UJALA. Our findings are discussed in Section 4. In Section 5, we discuss lessons based on our observations and provide some recommendations that can be of use for the existing UJALA programme as well as future programmes.
3
2.1 Lighting in India’s residential sector
The UJALA programme is targeted at the residential sector which accounted for 23% of the total electricity consumption in India in 2015–16 (CEA, 2016). Lighting’s share in the total residential electricity consumption is estimated to be in the range of 18% to 27% (ELCOMA, 2013; NITI Aayog, 2012; PwC, 2011). The actual electricity consumed by lighting depends on the type of lighting devices (incandescent bulbs, CFLs, tube lights, etc.) and their hours of use by households. Data on ownership and usage of lighting devices is limited in India.
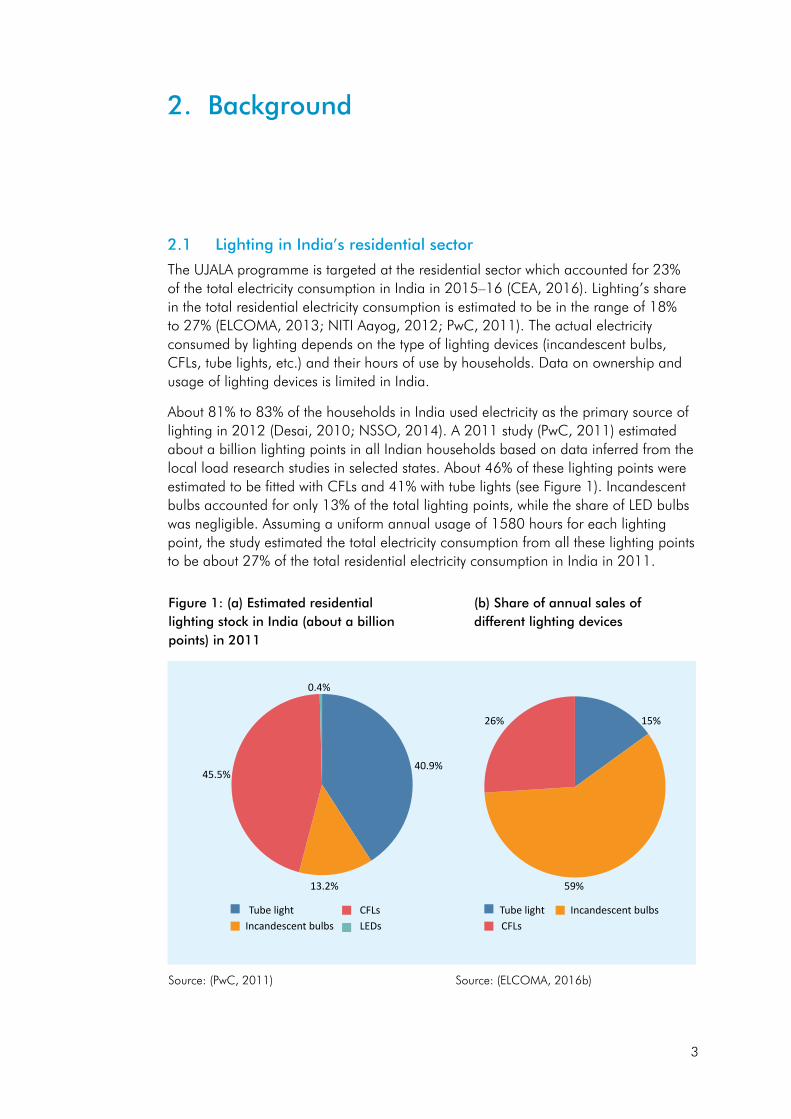
About 81% to 83% of the households in India used electricity as the primary source of lighting in 2012 (Desai, 2010; NSSO, 2014). A 2011 study (PwC, 2011) estimated about a billion lighting points in all Indian households based on data inferred from the local load research studies in selected states. About 46% of these lighting points were estimated to be fitted with CFLs and 41% with tube lights (see Figure 1). Incandescent bulbs accounted for only 13% of the total lighting points, while the share of LED bulbs was negligible. Assuming a uniform annual usage of 1580 hours for each lighting point, the study estimated the total electricity consumption from all these lighting points to be about 27% of the total residential electricity consumption in India in 2011.
2. Background
(b) Share of annual sales of different lighting devices
Figure 1: (a) Estimated residential lighting stock in India (about a billion points) in 2011
Source: (PwC, 2011) Source: (ELCOMA, 2016b)
Tube light CFLsCFLsIncandescent bulbs LEDs
45.5%
13.2%
0.4%
40.9%
Incandescent bulbsTube light
26% 15%
59%
4
In the same year, about 1.2 billion bulbs and tube-lights were sold in India (ELCOMA, 2016b) to all the sectors including the residential sector. Incandescent bulbs accounted for about 60% of these sales, while CFLs made up about 25%. A significant difference can be seen between the sales mix and the stock mix (see Figure 1). One reason is that the sales figure also includes small commercial establishments which may have a different stock mix. The other reason may be the uncertainty in the estimation of the national level lighting stock based on local level surveys. However, the characteristics of incandescent bulbs and CFLs also contribute significantly to the variation. Incandescent bulbs have an average life of less than a year and break easily. It is possible that more than one incandescent bulb may be bought for the same lighting point in a year. CFLs on the other hand, have an average life of three years and hence are bought less frequently. Thus the number of actual lighting points fitted with incandescent bulbs would be much lower than their annual sales.
EESL’s target for UJALA to replace 770 million incandescent bulbs in India is based on the sales in 20133, and not on actual lighting points. Much fewer LED bulbs are required to replace the actual lighting points fitted with incandescent bulbs in India. The lack of reliable and periodic data on the ownership of lighting devices precludes a comparison between the ‘before’ and ‘after’ scenarios of the UJALA programme. The available data, with all its uncertainties, can be only used to estimate indicative changes in ownership of different types of lighting devices.
2.2 Energy efficiency programmes for lighting in India
India has come a long way since the first unsuccessful attempt to launch a programme to promote CFLs in 1991 in Mumbai, then Bombay (Gadgil, 2008). A number of DISCOMs have implemented small-scale lighting replacement programmes since then (PEG, 2014). Most of these programmes aimed to replace incandescent bulbs with CFLs. Table 1 shows the difference in the features of these light bulbs. Two notable programmes are a pilot CFL programme conducted in Nashik, Maharashtra in 2005 and the pan-India Bachat Lamp Yojana (BLY) for CFLs in 2009.
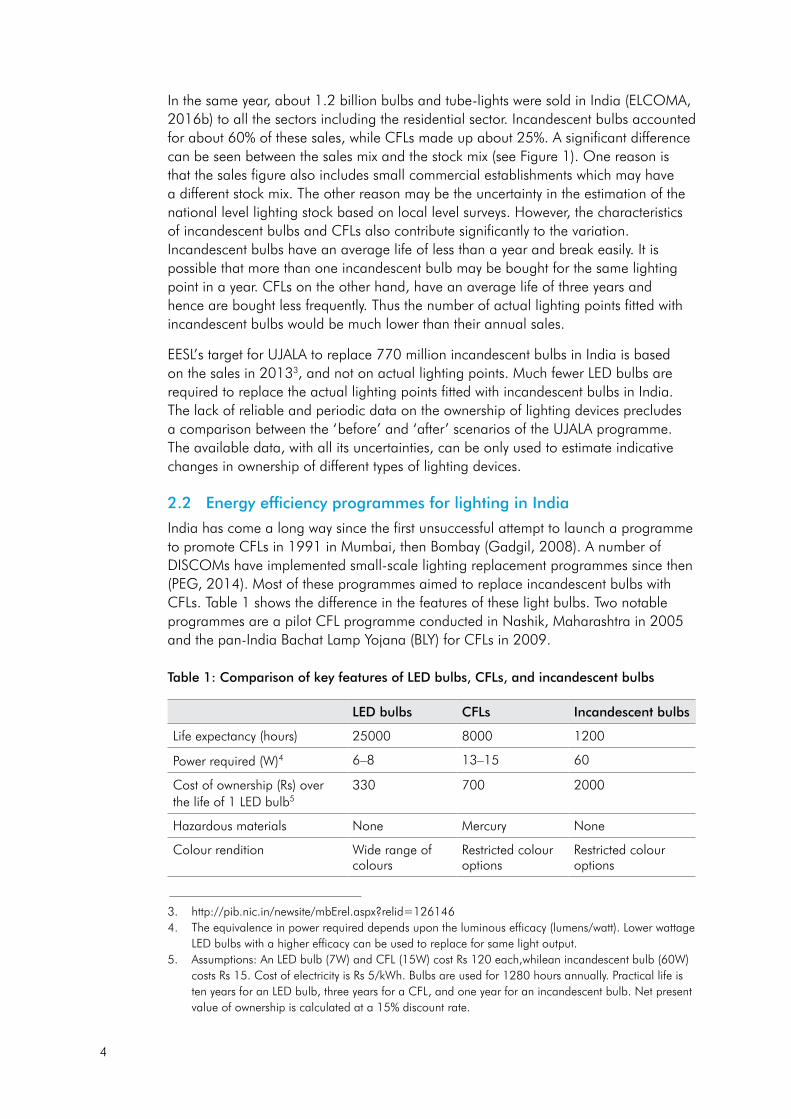
Table 1: Comparison of key features of LED bulbs, CFLs, and incandescent bulbs
LED bulbs CFLs Incandescent bulbs
Life expectancy (hours) 25000 8000 1200
Power required (W)4 6–8 13–15 60
Cost of ownership (Rs) over the life of 1 LED bulb5
330 700 2000
Hazardous materials None Mercury None
Colour rendition Wide range of colours
Restricted colour options
Restricted colour options
3. http://pib.nic.in/newsite/mbErel.aspx?relid=1261464. The equivalence in power required depends upon the luminous efficacy (lumens/watt). Lower wattage
LED bulbs with a higher efficacy can be used to replace for same light output. 5. Assumptions: An LED bulb (7W) and CFL (15W) cost Rs 120 each,whilean incandescent bulb (60W)
costs Rs 15. Cost of electricity is Rs 5/kWh. Bulbs are used for 1280 hours annually. Practical life is ten years for an LED bulb, three years for a CFL, and one year for an incandescent bulb. Net present value of ownership is calculated at a 15% discount rate.
5
In 2005, the Maharashtra State Electricity Distribution Company Ltd. (MSEDCL), the largest electricity distribution company in Maharashtra, distributed 3 lakh CFLs in Nashik as a pilot Demand Side Management (DSM) programme, with an objective to reduce the peak system demand. Consumers had two options: they could pay the entire price of Rs 100 for a CFL upfront, or pay Rs 10 (comparable to the price of an incandescent bulb) and submit the balance in instalments through their monthly electricity bills. MSEDCL did not provide any financial support to the programme. It procured the CFLs in bulk and passed on the resulting discount in price to the consumers. A comprehensive evaluation (Singh, Sant, & Kadam, 2007) brought out lessons for scaling up the programme. Consumers were found to be keen to participate in the programme because they considered the distribution company’s credibility high as a third party selling CFLs. MSEDCL adopted innovative methods for distribution and awareness creation, such as using women’s self-help groups for distribution of CFLs. However, it fell short of various other responsibilities as an implementing agency. It did not conduct adequate awareness campaigns on the use of CFLs, as a result of which a majority of the consumers replaced tube-lights or used CFLs in places with lower usage. MSEDCL was also unable to monitor the quality of the bulbs, which led to high failure rates and with few replacements made under warranty, even though a one-year warranty was provided by the manufacturers. Although the programme had a substantial savings potential, the Maharashtra Electricity Regulatory Commission (MERC) discontinued it due to several implementation issues.
The Bachat Lamp Yojana (BLY) was launched by the Indian government in 2009 with an aim to replace 400 million incandescent bulbs and reduce peak demand by 6000 to 10,000 MW. The programme was implemented in different states through an agreement between the Bureau of Energy Efficiency (BEE), the local electricity distribution company, and empanelled programme implementing agencies. As in the case of the Nashik programme, a CFL was available at the price of an incandescent bulb. However, the balance amount of the bulb’s actual price was recovered through the Clean Development Mechanism (CDM), a carbon trading scheme established under the Kyoto Protocol. Also, unlike the Nashik programme, specialised agencies implemented the programme instead of electricity distribution companies. Strict monitoring mechanisms were in place, with the actual measurement of electricity savings being carried out using meters installed inside a sample of CFLs. About 29 million CFLs were sold under the scheme,6 but it failed to scale up primarily due to the crash in carbon prices under the CDM. The investors, i.e. the programme implementing agencies, found it too risky to make the initial investment, given the volatility of the carbon prices which determined their returns. They were also reluctant to invest in projects from states with poor supply quality, which affected the life of the CFLs and thereby increased the warranty costs. To make matters worse, the manufacturing costs of CFLs increased as China increased its control over a rare earth material used in the CFL coating.7
6. http://164.100.47.194/Loksabha/Questions/QResult15.aspx?qref=16799&lsno=16 7. http://www.downtoearth.org.in/coverage/losing-light-35852
6
2.3 DELP and UJALA
The stalling of the Bachat Lamp Yojana (BLY) prompted Energy Efficiency Services Ltd. (EESL), a public sector company (see box on EESL below), to develop the DSM-based Efficient Lighting Programme (DELP) in 2014. DELP’s target was to replace about 770 million incandescent bulbs sold annually in India in 2012 with the highly efficient LED bulbs (EESL, 2014). The core idea was to bring down the price of LED bulbs (available at about Rs 400 in 2014) using the architecture and best practices of the BLY scheme while avoiding the pitfalls of linking the model to the volatile international carbon market. The proposed model was the Standard Offer Programme (SOP) model, where a DISCOM treats energy efficiency as a resource. Under the SOP model, an Energy Service Company (ESCO) proposes an energy efficiency programme with a well-defined methodology to calculate savings. The DISCOM ‘purchases’ these savings from the ESCO as it would purchase power from other sources like thermal, solar, or wind generators. The purchase price, called the SOP rate, is pre-determined based on the initial investment required for the energy efficiency measure, the monetary savings gained from the implementation, and a benefit (and risk) sharing mechanism between the ESCO and the DISCOM. A rigorous monitoring and evaluation approach is employed to ensure that the savings estimated by the programme are actually achieved.
EESL launched DELP with the SOP model in Puducherry in April 2014. A load research survey (IIEC, 2014) estimated the number of incandescent bulbs in a typical household and their usage pattern in order to calculate the savings possible from their replacement with LED bulbs. Based on this survey, it was proposed to distribute about 7.5 lakh LED bulbs to about 2.5 lakh households at a price of Rs 10 per bulb. EESL procured these bulbs from LED manufacturers through competitive bidding and discovered the price of Rs 310 per bulb. It was estimated that the replacements would save about 50 million units of electricity per year for the Electricity Department of the Government of Puducherry (EDP) (EDP, 2014). As most of the residential consumers in Puducherry pay a subsidised tariff, the EDP would gain by not having to supply the electricity saved from the use of LED bulbs at subsidised rates. The SOP rate was decided on the basis of the savings accrued to the EDP. The EDP was to pay EESL over the entire duration of the project. EESL would recover the price of the LED bulbs, the financing cost, and its return on equity from this amount. EESL undertook the responsibility for distributing the bulbs through kiosks set up at the EDP offices. Consumers were asked to submit old incandescent bulbs in exchange for the new LED bulbs. The bulbs carried an eight year warranty. After implementation, a survey of 153 households found that 89% of the LED bulbs were in use (ENVIS, 2015). The survey did not collect any data on actual replacement patterns and the usage of LED bulbs. It assumed that all the distributed LED bulbs replaced incandescent bulbs and estimated annual savings of 40 million units based on certain assumptions for usage hours.
In January 2015, the prime minister launched the UJALA programme across the country. The programme incorporated the lessons learnt from the DELP programme in Puducherry. Under UJALA, EESL is the only implementing agency and procures the LED bulbs on a national level through competitive bidding. This demand aggregation has enabled it to bargain for and obtain significant discounts from manufacturers. There is no subsidy from the government. EESL signs agreements with DISCOMs to distribute the LED bulbs in their territories. Like the Nashik programme, consumers can either buy the bulbs upfront or through monthly instalments via electricity bills. They are not

7
required to submit their old incandescent bulbs. The distribution is handled by local agencies hired and supervised by EESL. DISCOMs have a limited role to play. Neither do they invest in the programme8, nor are they responsible for its administration. Their role is limited to providing space for the kiosks set up by the local distribution agencies, providing consumer details to EESL for those consumers who want to buy the LED bulbs through monthly instalments, and in some cases creating awareness about the programme.
EESL has sold about 230 million LED bulbs in more than three years since the launch of DELP. The bidding price of the LED bulbs has come down from Rs 310 in January 2014 to Rs 38 in the latest round of bidding conducted in September 2016 (see Figure 2). The warranty of the LED bulbs has come down from eight years to three years, however. After accounting for EESL’s returns, distribution costs, and taxes, the price for the consumer is about Rs 65, which is substantially less than the price of the LED bulbs available in shops (which is about Rs 120 – 150). As neither the government nor the DISCOM is subsidising the LED bulbs, EESL does not get paid for the savings realised from the programme. The evaluation (PwC, 2015) of the programme is similar to the one carried out for DELP in Puducherry. The savings claimed from the programme are based on certain assumptions for usage and replacement patterns.
Figure 2: Procurement data for the UJALA programme
8. Except in Andhra Pradesh and Mizoram, where LED bulbs are sold at Rs 10 with the balance paid by the DISCOMs similar to the DELP model. In Gujarat, the DISCOMs have offered an additional discount of Rs 10 per LED bulb for residential consumers.
Source: EESL. Retrieved from http://eeslindia.org/User_Panel/UserView.aspx?TypeID=1170
Initially 7W bulbs were procured. In the later rounds of bidding 9W bulbs were bid for.
0
50
100
150
200
250
300
Jan2014
Aug2014
Nov2014
Jan2015
Mar2015
Jun2015
Nov2015
Jan2016
Apr2016
Sep2016
Price Quantity
200
150
100
50
0 Cum
ulati
ve q
uanti
ty p
urch
ased
(mill
ions
)
Pric
e (R
s.)
310
204
149104
8270
72.4
0.75 3.756.75
14.75 22.75
72.75105.75
132.75
182.75
232.75
6555
38
8 yearwarranty
5 yearwarranty
January 2015onwards: 3 year
warranty
8
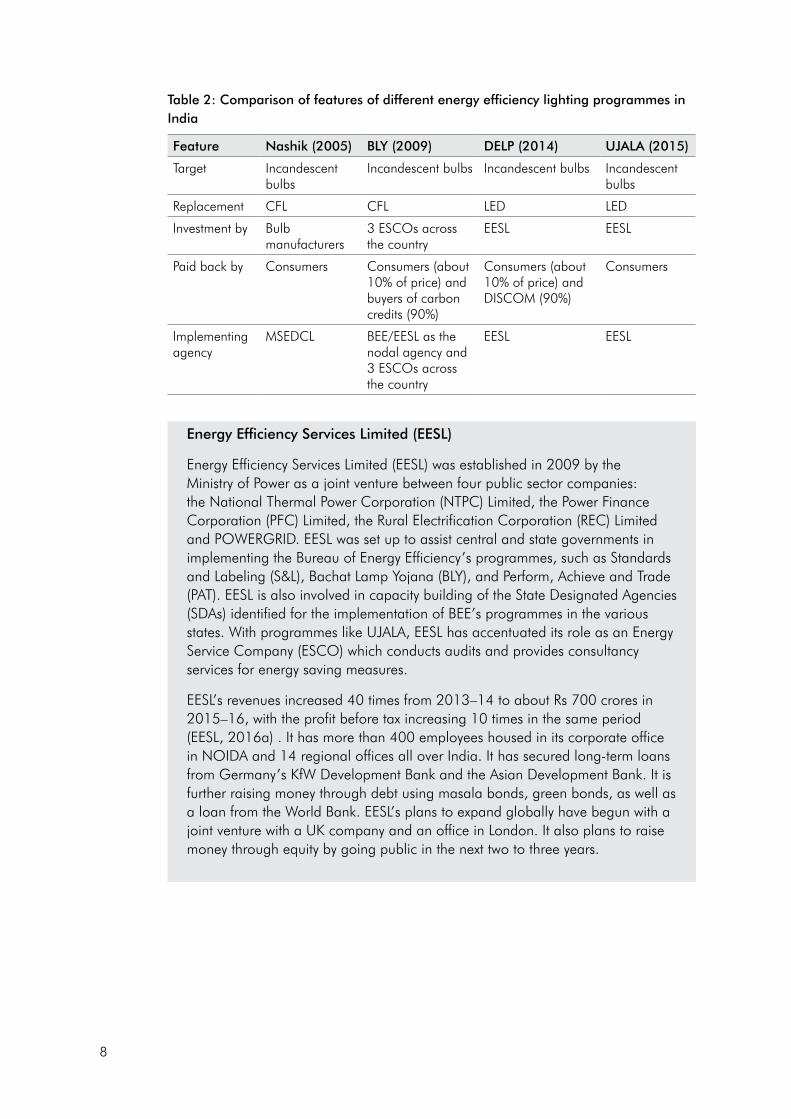
Table 2: Comparison of features of different energy efficiency lighting programmes in India
Feature Nashik (2005) BLY (2009) DELP (2014) UJALA (2015)
Target Incandescent bulbs
Incandescent bulbs Incandescent bulbs Incandescent bulbs
Replacement CFL CFL LED LED
Investment by Bulb manufacturers
3 ESCOs across the country
EESL EESL
Paid back by Consumers Consumers (about 10% of price) and buyers of carbon credits (90%)
Consumers (about 10% of price) and DISCOM (90%)
Consumers
Implementing agency
MSEDCL BEE/EESL as the nodal agency and 3 ESCOs across the country
EESL EESL
Energy Efficiency Services Limited (EESL)
Energy Efficiency Services Limited (EESL) was established in 2009 by the Ministry of Power as a joint venture between four public sector companies: the National Thermal Power Corporation (NTPC) Limited, the Power Finance Corporation (PFC) Limited, the Rural Electrification Corporation (REC) Limited and POWERGRID. EESL was set up to assist central and state governments in implementing the Bureau of Energy Efficiency’s programmes, such as Standards and Labeling (S&L), Bachat Lamp Yojana (BLY), and Perform, Achieve and Trade (PAT). EESL is also involved in capacity building of the State Designated Agencies (SDAs) identified for the implementation of BEE’s programmes in the various states. With programmes like UJALA, EESL has accentuated its role as an Energy Service Company (ESCO) which conducts audits and provides consultancy services for energy saving measures.
EESL’s revenues increased 40 times from 2013–14 to about Rs 700 crores in 2015–16, with the profit before tax increasing 10 times in the same period (EESL, 2016a) . It has more than 400 employees housed in its corporate office in NOIDA and 14 regional offices all over India. It has secured long-term loans from Germany’s KfW Development Bank and the Asian Development Bank. It is further raising money through debt using masala bonds, green bonds, as well as a loan from the World Bank. EESL’s plans to expand globally have begun with a joint venture with a UK company and an office in London. It also plans to raise money through equity by going public in the next two to three years.
9
A comprehensive evaluation of an energy efficiency programme covers three aspects (NAPEE, 2007):
• Directimpacts(suchasenergysavings,emissions,jobscreated)
• Marketeffects(suchaspricereduction,markettransformation)
• Processevaluation(howwelltheprocessesworked)
These aspects can be measured using different methods with varying levels of cost and accuracy. A choice of type of evaluation depends upon the objective of the programme, the energy efficiency measure, and the resources available for the evaluation. The UJALA programme’s objective is to transform the Indian lighting market from an incandescent bulb market into an LED bulb market and consequently save a significant amount of electricity from their use. UJALA has employed a number of innovative processes to achieve this objective. As it is predominantly a market transformation programme that utilises a number of innovative processes, we have looked at all the three aspects of the evaluation. Specifically, we considered the following questions:
• How has India’s lighting market changed?
o What was the impact on the lighting industry in India?
o How did the manufacturers respond?
o How did retailers perceive the programme?
o What caused these changes and how sustainable are they?
• How have consumers responded?
o Why did consumers buy the LED bulbs?
o How did they use the new LED bulbs and what were the actual savings achieved?
o What was their experience with the programme?
o How did the programme change their behaviour?
• How effective are the various processes of the programme?
o How did EESL conduct different aspects of the programme such as bidding, marketing, and distribution?
o What worked, what did not, and what can be improved?
Our approach to answer these questions included desk research, field surveys, and stakeholder interviews. The field research included:
• Surveysof1029householdswhoboughtLEDbulbsundertheprogrammeinthecities of Pune, Lucknow, and Puducherry
3. Methodology
10
• Surveysof150retailerssellingLEDbulbsinLucknowandPuducherry
• SurveyofsevendistributionkiosksinPunecurrentlysellingLEDbulbsundertheprogramme
• Interviewswithmanufacturers,representativesfromELCOMA(ElectricLampandComponent Manufacturers’ Association of India) and with independent market and technical consultants from the lighting industry
• InterviewswithrepresentativesfromEESLandtheBureauofEnergyEfficiency,thestatutory nodal agency responsible for energy efficiency programmes in India
• InterviewswiththerepresentativesofnineDISCOMs
Annexure 1: Consumer surveys provides the details of the surveys. We would like to restate that this exercise is not a comprehensive evaluation of the UJALA programme. Evaluation needs to be factored into the design of the programme itself, and periodic data on pre-determined parameters should be collected to study the impacts. Additionally, data required to evaluate a national level market transformation programme is not available in India (as seen in Section 2.1). Our household surveys include only three cities and hence do not statistically represent the entire country. Finally, a thorough process evaluation requires working closely with the implementation agency. Although EESL has been supportive of the exercise, we have not closely scrutinised all the processes of the UJALA programme. The observations from the study are meant to be indicative and there is scope for further broad and detailed evaluation.

11
In this section, we discuss the overall impacts of the UJALA programme along with their probable causes and their likely sustainability in the long term. The analysis focuses on the change in India’s lighting market, consumers’ response to the programme, and the effectiveness of the processes employed.
4.1 How has India’s lighting market changed?
We looked at four distinct but related aspects of the lighting market in India to understand the programme’s impact: sales trends of LED bulbs vis-à-vis other lighting options, price trends for LED bulbs, industry response, and development of the facilities and efficiency standards.
Figure 3: Indian lighting industry growth by value
4. Understanding the impacts of the UJALA programme
9. http://sari-energy.org/oldsite/PageFiles/What_We_Do/activities/RCEEL/presentations/India-CaseStudiesonEnergyEfficientLighting.pdf
Source: ELCOMA
4.1.1 Sales trends of LED bulbs vis-à-vis other lighting options
India’s lighting industry grew about 16% annually over the last six years and stands at about Rs 21,000 crore at the end of 2016 (see Figure 3). The growth up to 2013 was dominated by CFLs. CFL sales had doubled in four years since the launch of the Bachat Lamp Yojana (BLY) in 2009 (see Figure 4). As CFLs got popular, it was expected that demand would grow to a billion lamps in 2016.9 Accordingly,
2 0 1 0 2 0 1 1 2 0 1 2 2 0 1 3 2 0 1 4 2 0 1 5 2 0 1 6
0
2 ,0 0 0
4 ,0 0 0
6 ,0 0 0
8 ,0 0 0
1 0 ,0 0 0
1 2 ,0 0 0
Rs. c
rore
s
2,927
5,011
3,6004,068 4,515
5,5625,300
500 8501,250
3,395
5,092
1,825
11,399
4,3505,222
5,954
7,3697,819
6,668 6,630
LED lighting
Other (luminaires and accessories)
Tube lights, CFLs and incandescent bulbs
12
Source: ELCOMA
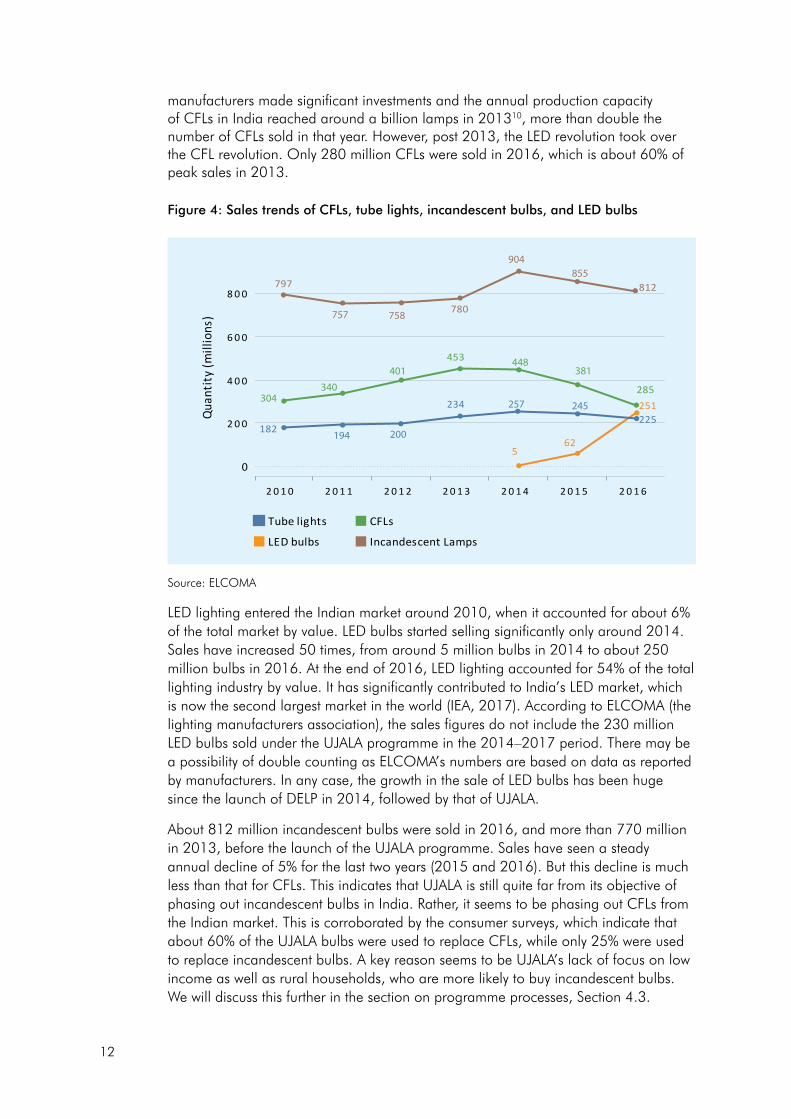
LED lighting entered the Indian market around 2010, when it accounted for about 6% of the total market by value. LED bulbs started selling significantly only around 2014. Sales have increased 50 times, from around 5 million bulbs in 2014 to about 250 million bulbs in 2016. At the end of 2016, LED lighting accounted for 54% of the total lighting industry by value. It has significantly contributed to India’s LED market, which is now the second largest market in the world (IEA, 2017). According to ELCOMA (the lighting manufacturers association), the sales figures do not include the 230 million LED bulbs sold under the UJALA programme in the 2014–2017 period. There may be a possibility of double counting as ELCOMA’s numbers are based on data as reported by manufacturers. In any case, the growth in the sale of LED bulbs has been huge since the launch of DELP in 2014, followed by that of UJALA.
About 812 million incandescent bulbs were sold in 2016, and more than 770 million in 2013, before the launch of the UJALA programme. Sales have seen a steady annual decline of 5% for the last two years (2015 and 2016). But this decline is much less than that for CFLs. This indicates that UJALA is still quite far from its objective of phasing out incandescent bulbs in India. Rather, it seems to be phasing out CFLs from the Indian market. This is corroborated by the consumer surveys, which indicate that about 60% of the UJALA bulbs were used to replace CFLs, while only 25% were used to replace incandescent bulbs. A key reason seems to be UJALA’s lack of focus on low income as well as rural households, who are more likely to buy incandescent bulbs. We will discuss this further in the section on programme processes, Section 4.3.
manufacturers made significant investments and the annual production capacity of CFLs in India reached around a billion lamps in 201310, more than double the number of CFLs sold in that year. However, post 2013, the LED revolution took over the CFL revolution. Only 280 million CFLs were sold in 2016, which is about 60% of peak sales in 2013.
Figure 4: Sales trends of CFLs, tube lights, incandescent bulbs, and LED bulbs
2 0 1 0 2 0 1 1 2 0 1 2 2 0 1 3 2 0 1 4 2 0 1 5 2 0 1 6
0
2 0 0
4 0 0
6 0 0
8 0 0
Quan
tity
(mill
ions
) 780
453
285
562
251234
797 812
182225
Tube lights
LED bulbs
CFLs
Incandescent Lamps
757 758
340304
194 200
257 245
401448
381
904855
13
4.1.2 Price trends for LED bulbs
In 2014, a 7W LED bulb carried a maximum retail price of Rs 650 – Rs 700, which shopkeepers sold for about Rs 400 – Rs 450.11 Our in-person survey of about 150 retailers and our online survey on three leading commerce websites revealed that a 7W LED bulb was available in the price range of Rs 100 – Rs 150, while a 9W LED bulb was available at Rs 140 – Rs 200. The actual price of the bulbs may be lower as the retailers often offer discounts on actual purchase. There are also expensive bulbs available for more than Rs 150 (7W) and Rs 200 (9W), as well as cheaper bulbs that are available for Rs 40 and Rs 50. Most of the bulbs come with a warranty of two years. There is no significant difference between the market prices of LED bulbs sold by participating and non-participating manufacturers.
A similar trend of price reduction has been observed in other countries. Gerke, Ngo, and Fisseha (Gerke, Ngo, & Fisseha, 2015) conducted a regression analysis of the weekly prices of LED A-shaped bulbs (the most common variety of LED bulbs) sold in the USA between 2011 and 2015. They found that the prices reduced by about 28% per year after controlling for the effects of light output (lumens), retailers, and brands. A recent study (Scholand, 2016) compared the historical retail prices of mainstream LED bulbs in major European countries between 2011 and 2016. They observed that the prices reduced 32% annually in France, 28% in Germany, 33% in Italy, 32% in Spain, and 27% in the UK. Thus, the market price reduction in India is comparable to the price reduction observed in other parts of the world.
So does that mean that the market prices of LED bulbs in India would have reduced even without the UJALA programme? The answer is most probably negative. The reduction in prices of LED bulbs worldwide can be attributed to two key factors. The first is Haitz’s Law, which is an observation that the per-lumen price of LEDs has fallen by a factor of 10 in each decade since their invention in the 1960s, and will continue to do so in the future (Haitz & Tsao, 2011). However, LED bulbs contain components other than individual LEDs.
The second reason for the reduction in prices of LED bulbs is the general observation that the cost of production for new technologies tends to fall as their production increases. The LED bulb is quite a recent application of LEDs. Gerke et al. (Gerke et al., 2015) compared the price decline in the USA to the domestic LED bulb production and estimated that LED bulb prices have fallen by 18% for each doubling in cumulative production. In India, the UJALA driven demand for LED bulbs significantly increased LED bulb production. It can be postulated that this increased production has resulted in a significant reduction in prices. Hence, although the fall in prices of LEDs as predicted by Haitz’s Law contributed to the reduction in LED bulb prices in India, so did the huge market created by the UJALA programme.
The price of an LED bulb sold through the UJALA programme is much lower than its market price. A 9W LED bulb sold through UJALA is available at Rs 65 compared to Rs 140 – Rs 200 in the retail market. This difference can be attributed to two factors. The first is the exclusion of dealers and retailers from the programme, thereby excluding their commissions from the final price. The second factor is the aggressive bidding by manufacturers to date due to the various perceived incentives offered by
11. According to interactions with industry consultants and anecdotal evidence
14
the programme (we explore this aspect further in the next sub-section 4.1.3). Our interactions with manufacturers, industry consultants, and experts suggest that there is no possibility of the market price matching the UJALA price. UJALA prices did act as an external pressure point for a reduction in market prices, but this reduction seems to have reached its limit now. The significant difference in the UJALA price and the market price is also increasing the incentives for malpractices in the distribution of bulbs through UJALA (as discussed in the section on programme processes, Section 4.3).
4.1.3 Industry response
How did manufacturers and retailers respond to the programme? We answer this question by first discussing how manufacturers perceived the programme, and then moving on to their different responses that have resulted in the present structure of the LED lighting industry in India. We also discuss retailers’ perceptions of the programme based on surveys of about 150 retailers.
There were many incentives for the manufacturers to participate in the programme. The first and foremost was the significant bulk demand for LED bulbs. A study in 2011 (PwC, 2011) estimated a cost reduction of 30% on the order of 5 million or more pieces in India. As the demand for LED bulbs increased, manufacturers found it economical to invest more in local assembly lines rather than import the bulbs. The manufactures also preferred dealing with one consumer, EESL, rather than dealing with thousands of distributors and retailers across the country. This also brought down their transportation costs, as they could pack a larger quantity of bulbs in a single shipment to the EESL warehouses. EESL also paid upfront and fast, unlike retailers and dealers who preferred credit lines that resulted in recovery issues in some cases. One more contributing factor was that EESL took responsibility for the nation-wide advertising of LED bulbs. Although EESL did not advertise specific brands, the box of the LED bulb carried the brand name, giving the manufacturers much valued brand-recognition. Finally, most of the participating manufacturers cited the transparent, simple, and fast processes of the UJALA programme as one of the key reasons for their participation.
Although the incentives were the same, different manufacturers responded differently to the UJALA programme, with some not participating at all. We interviewed a few manufacturers and were able to categorise their responses into three types: enthusiastic, cautious, and non-participating. It has to be noted that this analysis is based purely on manufacturers’ responses and not backed by their financial data, as it was not available. However, registered manufacturers’ data from the Bureau of Indian Standards (BIS) (discussed later) and the interactions with independent industry consultants broadly confirm these responses.
Enthusiastic: A number of manufacturers participated enthusiastically in the programme in order to benefit from all the advantages described above. This is also evident from the bidding data from EESL, which shows that the number of bidders in the initial phases was high. Some of these installed large assembly lines for LED bulbs or converted their existing and idle CFL assembly lines into LED bulb assembly lines. Some also imported bulbs from China or bought them from other Indian manufacturers (those who only manufacture LED bulbs and do not sell them in the retail market). These intermediate manufacturers in turn made significant investments in LED assembly lines. As the price went down with successive bids, cautious manufacturers opted out, but enthusiastic ones continued to participate. The price of
15
an LED bulb in the latest bidding round was slightly higher (Rs 41) than the previous bid (Rs 38), most probably as a correction for aggressive bidding. Aggressive bidding has affected the profitability of enthusiastic players with the impact seen more on the intermediate manufacturers. EESL is also slowing down its procurement of LED bulbs, adding to the woes. However, some enthusiastic global players with a strong financial position are probably using this opportunity to increase their market share in the Indian LED market, even if it means low or no profits today.
Cautious: Some manufacturers were cautious about their participation in the programme. They adopted a mixed approach towards meeting the demand for LED bulbs from UJALA. They invested in building capacity to meet some of the demand from UJALA and bought the rest from intermediate suppliers. As the bid prices went down, these manufacturers stopped participating in the programme and consequently stopped buying from the intermediate suppliers. This probably added to the financial woes of the intermediate suppliers. The cautious manufacturers were still able to sell their in-house manufactured LED bulbs in the retail market because of the awareness created by the UJALA programme.
Non-participants (big): The non-participants were a few big companies and thousands of small-scale companies. The big companies adopted a different business model. They decided to grow organically and increase their production capacity as per the market demand and not based on UJALA’s demand. They also spent significantly on establishing their brand as a quality product and distinguishing themselves from the brands being sold under the UJALA programme. They benefitted from the rise in market demand for LED bulbs caused by increased awareness through UJALA. As discussed in Section 4.1.2, the prices of the branded LED bulbs offered by non-participating manufacturers are not very high compared to those offered by participating companies. The brand establishment may help these companies in the long term.
Non-participants (small): The other non-participants were the small-scale manufacturers that have entered the market in significant numbers in the last two years. They benefitted significantly from the consumer awareness created by the UJALA programme. They had an opportunity to participate in the UJALA programme by creating a consortium (this is discussed further in the section on bulk procurement, Section 4.3.3). Most of them did not participate, however. A number of small-scale LED manufacturing hubs have come up in Maharashtra, Delhi, Uttar Pradesh and Haryana. Our retailer survey revealed that some 7W/9W LED bulbs are available for as low as Rs 50 without any warranty. These may either be low quality bulbs imported from China or assembled by small-scale manufacturers in India.
The present structure of the LED lighting industry has evolved as a combination of all the above responses. There are about 300 registered companies selling LED bulbs in India.12 However, only 10 to 11 of the companies own about 70% of the LED lighting market share (HDFC, 2016). ELCOMA, the manufacturing association, has about 60 registered members (ELCOMA, 2016a). All the others operate on a small scale. There are about 176 different assembly units in India, a third of them in the Delhi National Capital Region (NCR). The industry also imports LED bulbs from about 50 units located in China. Data on the share of imports in the total sale of LED bulbs in India is not available.
12. MeitY data is available at http://crsbis.in/BIS/listregmfr.do (last accessed on 30th March, 2017).
16
Distributors and retailers (both large and small shops) are important players in the lighting industry. They act as marketing and distribution agents, as well as collection agents in the warranty process. They have been kept out of the UJALA programme. One of the reasons for the low price of LED bulbs offered under the programme is that it does not include commission paid to dealers and retailers. So how do they feel about the programme? Around 88% to 99% of the surveyed retailers said that they sold more LED bulbs than in the previous year, whereas 12% to 66% reported a decline in sales of CFLs. About 10% to 11% of the retailers reported no change in the sales of incandescent bulbs. Interestingly, 42% to 91% of retailers felt that UJALA should be continued, whereas 3% to 46% said the programme did not impact them. This contradicts the recent claims by the lighting industry that the government should withdraw the programme, as retailers are complaining about it and are refusing to stock LED bulbs.13 Discussions with some retailers revealed that they sell LED bulbs by providing two reasons to buyers: (a) the quality of their bulbs is better than the ‘government’ bulbs, and (b) claiming warranty for the ‘government’ bulbs is tedious. The first claim has no justification but probably operates on the general Indian perception that anything provided by the government is of inferior quality. The second claim may have merit as the consumer surveys indicate that very few consumers have claimed warranty.
4.1.4 Development of testing facilities and efficiency standards
UJALA’s goals did not explicitly include development of testing facilities and efficiency standards for LED bulbs. It was assumed that these would evolve as the demand increased and the market picked up. EESL did require manufacturers to have an in-house testing facility, and its three-tier quality check involved the checking of random samples in the National Accreditation Board for Testing and Calibration Laboratories (NABL) accredited testing laboratories. In 2012, there were three NABL accredited testing laboratories for LED bulbs in India (ELCOMA, 2013). In 2017, the number has gone up to fifteen, according to data on the NABL website.14 This can be attributed indirectly to the UJALA programme.
The increase in the demand for LED bulbs and the consequent increase in the number of manufacturers prompted the Ministry of Electronics and Information Technology (MeitY) to include LED bulbs in the Compulsory Registration Scheme (CRS). The MeitY notified the CRS in 2012 in order to ensure mandatory compliance of selected electronics products with the relevant performance and safety standards from the BIS.15 The CRS requires sellers of LED bulbs in India to register their manufacturing facilities with BIS and self-certify that they comply with the BIS standards, and allows BIS to regularly monitor them. The CRS can ensure that only good quality LED bulbs are sold, provided compliance is strictly monitored by BIS.
BEE did not have efficiency standards for LED bulbs when UJALA was launched. The technical specifications for the bulbs procured in initial bidding rounds were based on BIS standards for performance and safety. EESL’s requirement for the efficacy of the
13. http://economictimes.indiatimes.com/industry/cons-products/durables/withdraw-led-bulb-distribution-scheme-industry-to-government/articleshow/57781946.cms (accessed 31st March, 2017)
14. http://www.nabl-india.org/nabl/index.php?c=search&m=index&Itemid=177 15. http://crsbis.in/BIS/app_srv/tdc/gl/docs/gazette_notification_2012_10_03.pdf
17
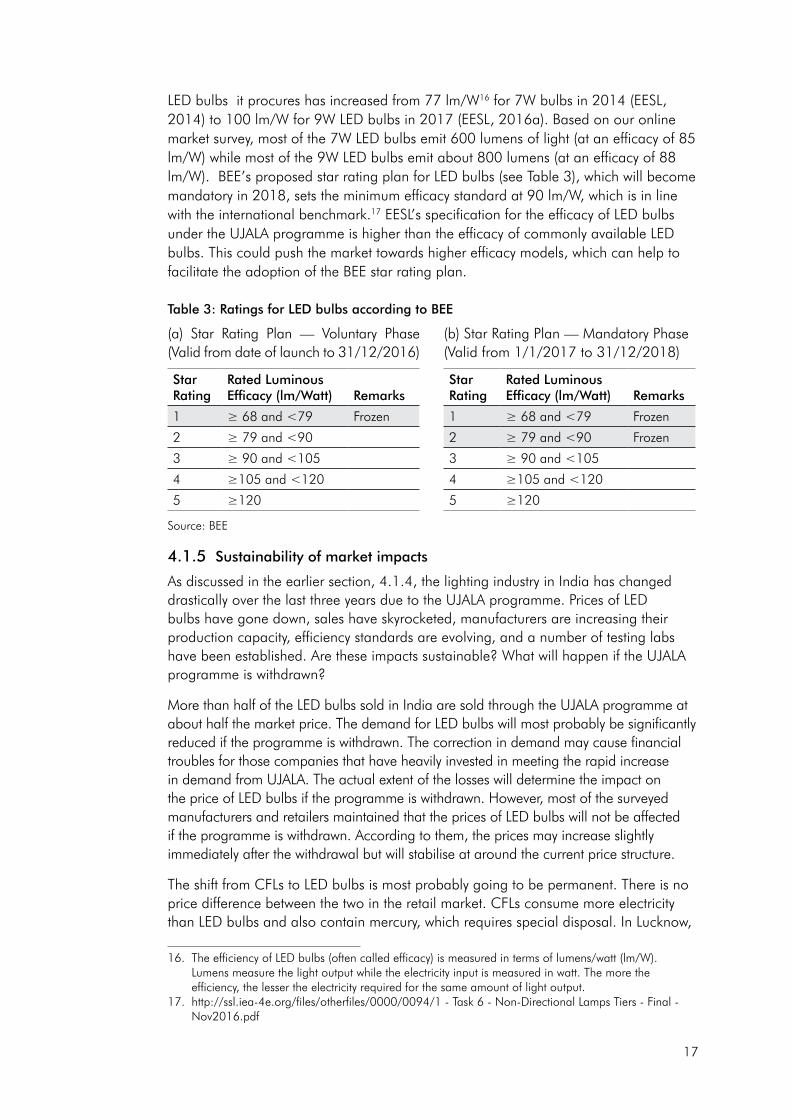
LED bulbs it procures has increased from 77 lm/W16 for 7W bulbs in 2014 (EESL, 2014) to 100 lm/W for 9W LED bulbs in 2017 (EESL, 2016a). Based on our online market survey, most of the 7W LED bulbs emit 600 lumens of light (at an efficacy of 85 lm/W) while most of the 9W LED bulbs emit about 800 lumens (at an efficacy of 88 lm/W). BEE’s proposed star rating plan for LED bulbs (see Table 3), which will become mandatory in 2018, sets the minimum efficacy standard at 90 lm/W, which is in line with the international benchmark.17 EESL’s specification for the efficacy of LED bulbs under the UJALA programme is higher than the efficacy of commonly available LED bulbs. This could push the market towards higher efficacy models, which can help to facilitate the adoption of the BEE star rating plan.
Table 3: Ratings for LED bulbs according to BEE
16. The efficiency of LED bulbs (often called efficacy) is measured in terms of lumens/watt (lm/W). Lumens measure the light output while the electricity input is measured in watt. The more the efficiency, the lesser the electricity required for the same amount of light output.
17. http://ssl.iea-4e.org/files/otherfiles/0000/0094/1 - Task 6 - Non-Directional Lamps Tiers - Final - Nov2016.pdf
(a) Star Rating Plan — Voluntary Phase (Valid from date of launch to 31/12/2016)
Star Rating
Rated Luminous Efficacy (lm/Watt) Remarks
1 ≥68and<79 Frozen
2 ≥79and<90
3 ≥90and<105
4 ≥105and<120
5 ≥120
Source: BEE
(b) Star Rating Plan — Mandatory Phase (Valid from 1/1/2017 to 31/12/2018)
Star Rating
Rated Luminous Efficacy (lm/Watt) Remarks
1 ≥68and<79 Frozen
2 ≥79and<90 Frozen
3 ≥90and<105
4 ≥105and<120
5 ≥120
4.1.5 Sustainability of market impacts
As discussed in the earlier section, 4.1.4, the lighting industry in India has changed drastically over the last three years due to the UJALA programme. Prices of LED bulbs have gone down, sales have skyrocketed, manufacturers are increasing their production capacity, efficiency standards are evolving, and a number of testing labs have been established. Are these impacts sustainable? What will happen if the UJALA programme is withdrawn?
More than half of the LED bulbs sold in India are sold through the UJALA programme at about half the market price. The demand for LED bulbs will most probably be significantly reduced if the programme is withdrawn. The correction in demand may cause financial troubles for those companies that have heavily invested in meeting the rapid increase in demand from UJALA. The actual extent of the losses will determine the impact on the price of LED bulbs if the programme is withdrawn. However, most of the surveyed manufacturers and retailers maintained that the prices of LED bulbs will not be affected if the programme is withdrawn. According to them, the prices may increase slightly immediately after the withdrawal but will stabilise at around the current price structure.
The shift from CFLs to LED bulbs is most probably going to be permanent. There is no price difference between the two in the retail market. CFLs consume more electricity than LED bulbs and also contain mercury, which requires special disposal. In Lucknow,
18
88% of surveyed households, and 82% of households in Pune, mentioned that they were satisfied with the UJALA LED bulbs, while the percentage for Puducherry was 58%. In Pune and Lucknow, 81% to 87% of surveyed households said they would buy a new LED bulb if the current one were to stop working, while 38% of households in Puducherry reported that they would do so. This shift from CFLs to LED bulbs is also evident from the sharply falling sales of CFLs and the trend of manufacturers converting their CFL assembly lines into LED lines.
UJALA has also indirectly resulted in the growth of a small-scale industry for assembling LED bulbs, which in turn can provide a source of income for a number of low income households. We expect that this industry will continue to thrive. Although this means benefits in the short term, the long-term impacts may be detrimental if the quality of the LED lights produced from this industry is inferior. The compulsory registration scheme, BEE’s upcoming efficiency standards, and the increased number of testing laboratories can ensure that good quality LED bulbs are produced. However, the effectiveness of these measures will depend on the level of compliance.
4.2 How have consumers responded?
UJALA has seen a massive response from the people of India. They have bought more than 230 million LED bulbs in the three years since the launch of the programme. In this section we try to understand this response better. We first explore the overall participation of consumers in the programme, their experience, and the change in their attitude towards energy efficiency, if any, due to the programme. Some aspects of consumer response which are associated with the various processes of the programme, such as warranty and handling of the older, more inefficient lighting options replaced by LED bulbs, are discussed briefly here and explored further in the section on programme processes, Section 4.3. We then look more closely at their specific behavior regarding the use of the purchased LED bulbs in their homes. The usage data can help to get a better idea of the actual electricity saved from the use of these bulbs.
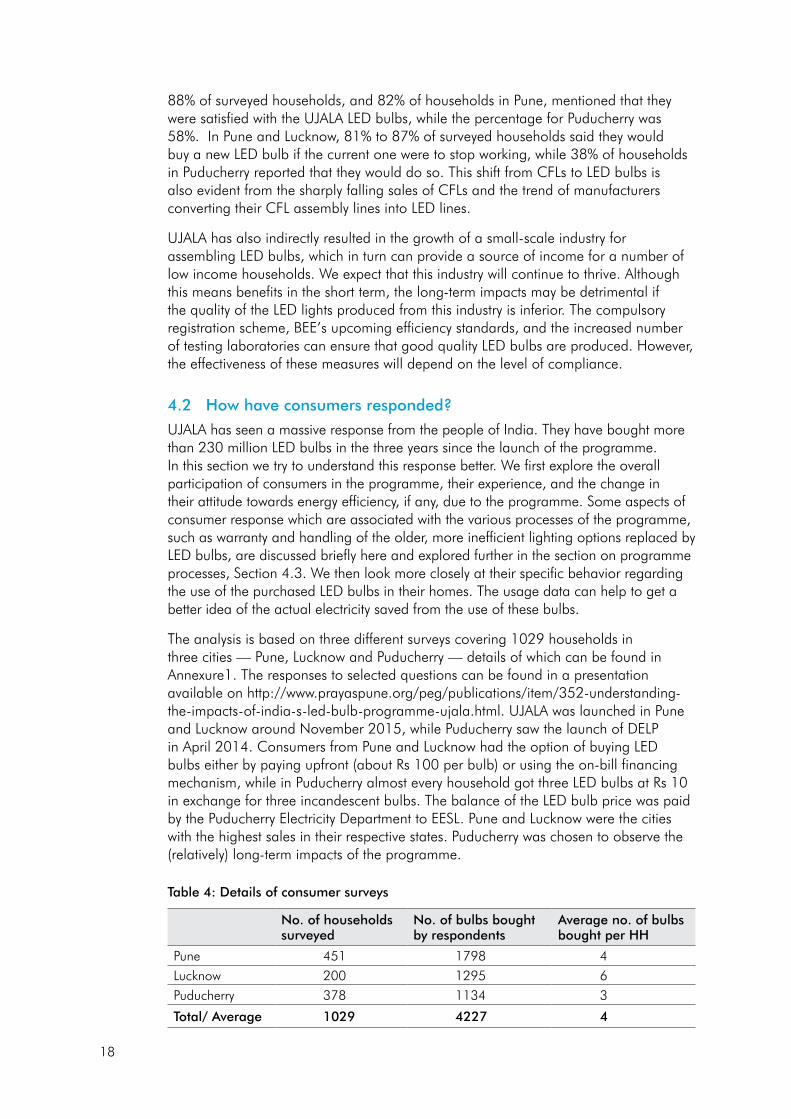
The analysis is based on three different surveys covering 1029 households in three cities — Pune, Lucknow and Puducherry — details of which can be found in Annexure1. The responses to selected questions can be found in a presentation available on http://www.prayaspune.org/peg/publications/item/352-understanding-the-impacts-of-india-s-led-bulb-programme-ujala.html. UJALA was launched in Pune and Lucknow around November 2015, while Puducherry saw the launch of DELP in April 2014. Consumers from Pune and Lucknow had the option of buying LED bulbs either by paying upfront (about Rs 100 per bulb) or using the on-bill financing mechanism, while in Puducherry almost every household got three LED bulbs at Rs 10 in exchange for three incandescent bulbs. The balance of the LED bulb price was paid by the Puducherry Electricity Department to EESL. Pune and Lucknow were the cities with the highest sales in their respective states. Puducherry was chosen to observe the (relatively) long-term impacts of the programme.
Table 4: Details of consumer surveys
No. of households surveyed
No. of bulbs bought by respondents
Average no. of bulbs bought per HH
Pune 451 1798 4Lucknow 200 1295 6Puducherry 378 1134 3
Total/ Average 1029 4227 4
19
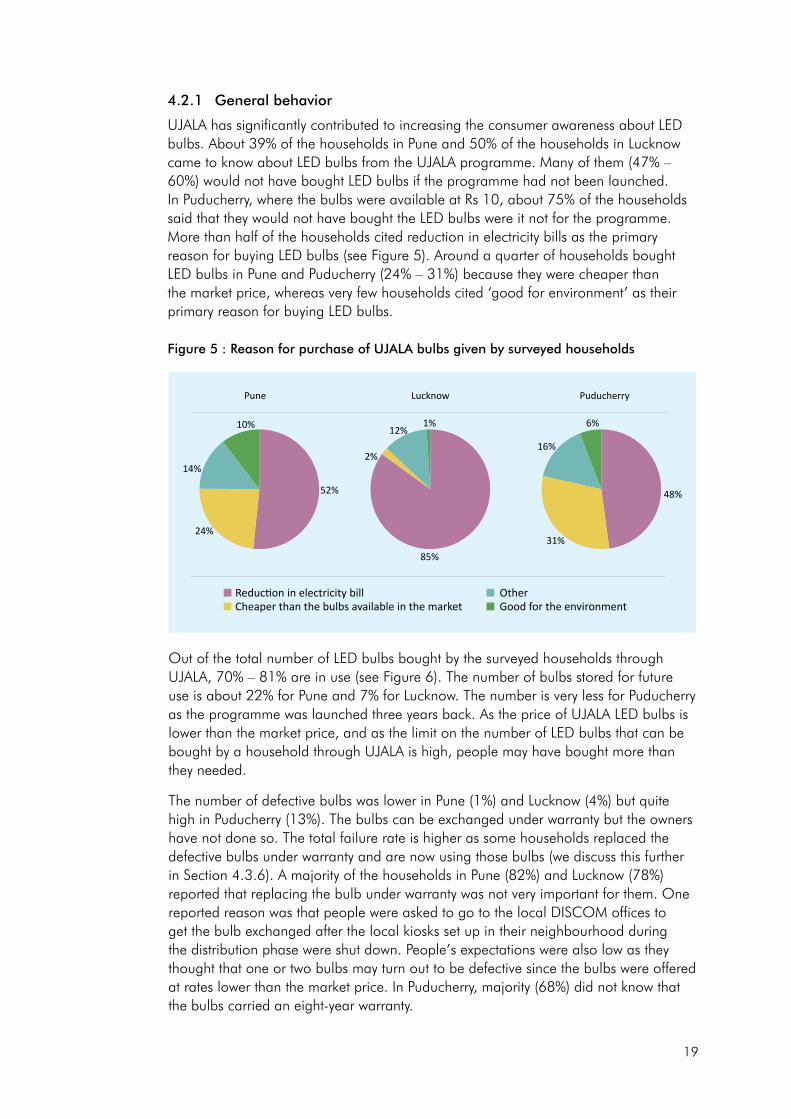
4.2.1 General behavior
UJALA has significantly contributed to increasing the consumer awareness about LED bulbs. About 39% of the households in Pune and 50% of the households in Lucknow came to know about LED bulbs from the UJALA programme. Many of them (47% – 60%) would not have bought LED bulbs if the programme had not been launched. In Puducherry, where the bulbs were available at Rs 10, about 75% of the households said that they would not have bought the LED bulbs were it not for the programme. More than half of the households cited reduction in electricity bills as the primary reason for buying LED bulbs (see Figure 5). Around a quarter of households bought LED bulbs in Pune and Puducherry (24% – 31%) because they were cheaper than the market price, whereas very few households cited ‘good for environment’ as their primary reason for buying LED bulbs.
Figure 5 : Reason for purchase of UJALA bulbs given by surveyed households
Out of the total number of LED bulbs bought by the surveyed households through UJALA, 70% – 81% are in use (see Figure 6). The number of bulbs stored for future use is about 22% for Pune and 7% for Lucknow. The number is very less for Puducherry as the programme was launched three years back. As the price of UJALA LED bulbs is lower than the market price, and as the limit on the number of LED bulbs that can be bought by a household through UJALA is high, people may have bought more than they needed.
The number of defective bulbs was lower in Pune (1%) and Lucknow (4%) but quite high in Puducherry (13%). The bulbs can be exchanged under warranty but the owners have not done so. The total failure rate is higher as some households replaced the defective bulbs under warranty and are now using those bulbs (we discuss this further in Section 4.3.6). A majority of the households in Pune (82%) and Lucknow (78%) reported that replacing the bulb under warranty was not very important for them. One reported reason was that people were asked to go to the local DISCOM offices to get the bulb exchanged after the local kiosks set up in their neighbourhood during the distribution phase were shut down. People’s expectations were also low as they thought that one or two bulbs may turn out to be defective since the bulbs were offered at rates lower than the market price. In Puducherry, majority (68%) did not know that the bulbs carried an eight-year warranty.
10% 1% 6%
16%
31%
48%
85%
2%
12%
14%
24%
52%
Reduction in electricity billCheaper than the bulbs available in the market
OtherGood for the environment
Pune Lucknow Puducherry
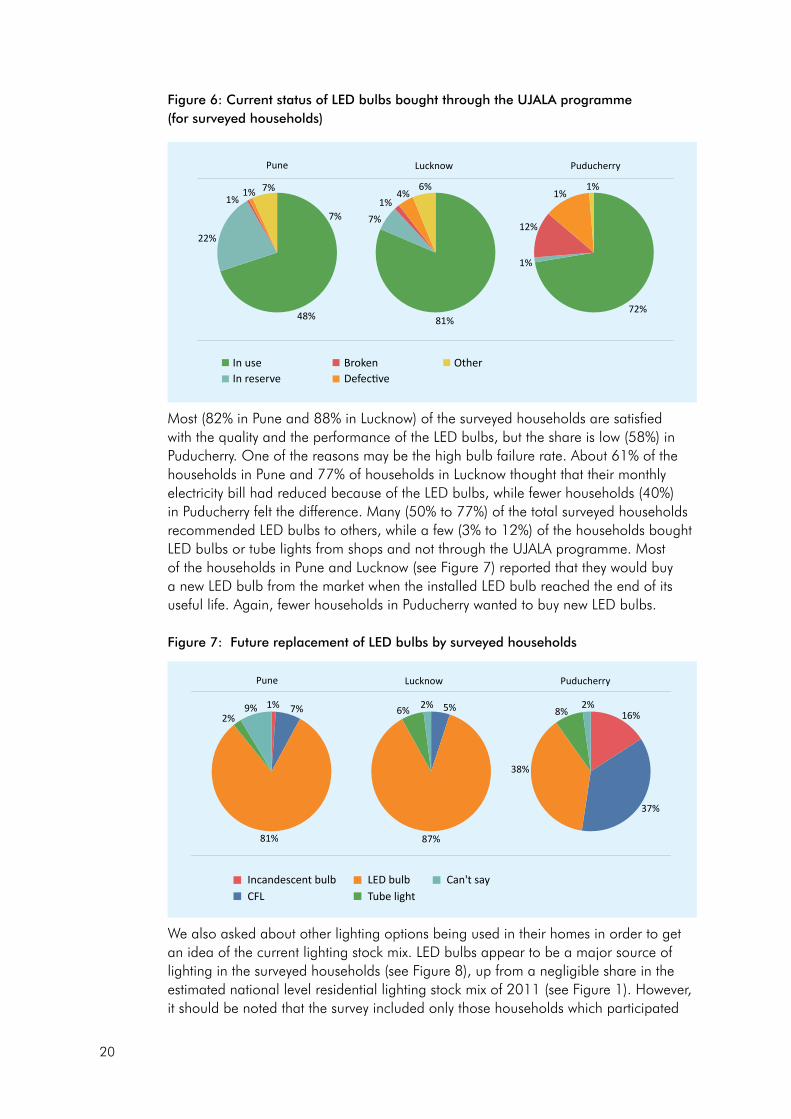
20
Figure 6: Current status of LED bulbs bought through the UJALA programme (for surveyed households)
Most (82% in Pune and 88% in Lucknow) of the surveyed households are satisfied with the quality and the performance of the LED bulbs, but the share is low (58%) in Puducherry. One of the reasons may be the high bulb failure rate. About 61% of the households in Pune and 77% of households in Lucknow thought that their monthly electricity bill had reduced because of the LED bulbs, while fewer households (40%) in Puducherry felt the difference. Many (50% to 77%) of the total surveyed households recommended LED bulbs to others, while a few (3% to 12%) of the households bought LED bulbs or tube lights from shops and not through the UJALA programme. Most of the households in Pune and Lucknow (see Figure 7) reported that they would buy a new LED bulb from the market when the installed LED bulb reached the end of its useful life. Again, fewer households in Puducherry wanted to buy new LED bulbs.
Figure 7: Future replacement of LED bulbs by surveyed households
48%
22%
1%1% 7%
7%
6%4%
1%7%
81%72%
12%
1%1%
1%
OtherBrokenIn useIn reserve Defective
Pune Lucknow Puducherry
1%9%2%
81%
7% 5% 2%8% 16%
37%
38%
87%
2%6%
Can't sayLED bulbIncandescent bulbTube lightCFL
Pune Lucknow Puducherry
We also asked about other lighting options being used in their homes in order to get an idea of the current lighting stock mix. LED bulbs appear to be a major source of lighting in the surveyed households (see Figure 8), up from a negligible share in the estimated national level residential lighting stock mix of 2011 (see Figure 1). However, it should be noted that the survey included only those households which participated
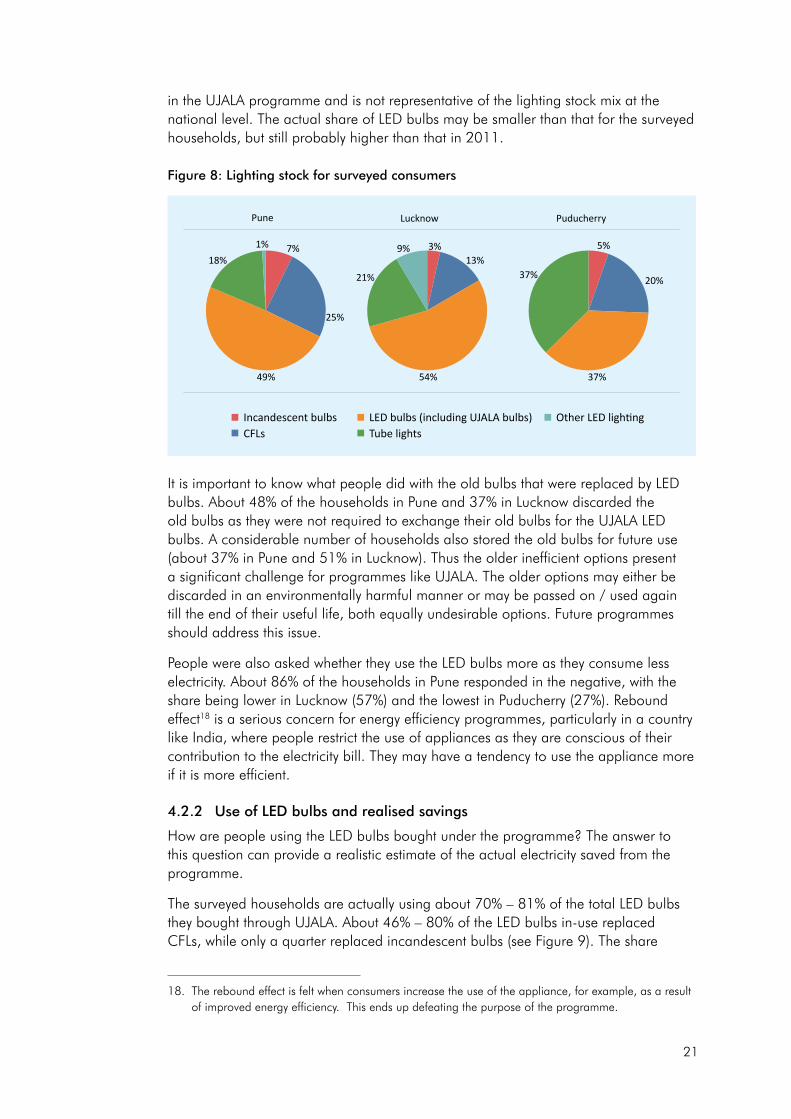
21
It is important to know what people did with the old bulbs that were replaced by LED bulbs. About 48% of the households in Pune and 37% in Lucknow discarded the old bulbs as they were not required to exchange their old bulbs for the UJALA LED bulbs. A considerable number of households also stored the old bulbs for future use (about 37% in Pune and 51% in Lucknow). Thus the older inefficient options present a significant challenge for programmes like UJALA. The older options may either be discarded in an environmentally harmful manner or may be passed on / used again till the end of their useful life, both equally undesirable options. Future programmes should address this issue.
People were also asked whether they use the LED bulbs more as they consume less electricity. About 86% of the households in Pune responded in the negative, with the share being lower in Lucknow (57%) and the lowest in Puducherry (27%). Rebound effect18 is a serious concern for energy efficiency programmes, particularly in a country like India, where people restrict the use of appliances as they are conscious of their contribution to the electricity bill. They may have a tendency to use the appliance more if it is more efficient.
4.2.2 Use of LED bulbs and realised savings
How are people using the LED bulbs bought under the programme? The answer to this question can provide a realistic estimate of the actual electricity saved from the programme.
The surveyed households are actually using about 70% – 81% of the total LED bulbs they bought through UJALA. About 46% – 80% of the LED bulbs in-use replaced CFLs, while only a quarter replaced incandescent bulbs (see Figure 9). The share
in the UJALA programme and is not representative of the lighting stock mix at the national level. The actual share of LED bulbs may be smaller than that for the surveyed households, but still probably higher than that in 2011.
Figure 8: Lighting stock for surveyed consumers
7%
25%
21%
9% 3%13%
5%
20%
37%
37%
54%49%
18%1%
Incandescent bulbs LED bulbs (including UJALA bulbs)CFLs Tube lights
Other LED lighting
Pune Lucknow Puducherry
18. The rebound effect is felt when consumers increase the use of the appliance, for example, as a result of improved energy efficiency. This ends up defeating the purpose of the programme.
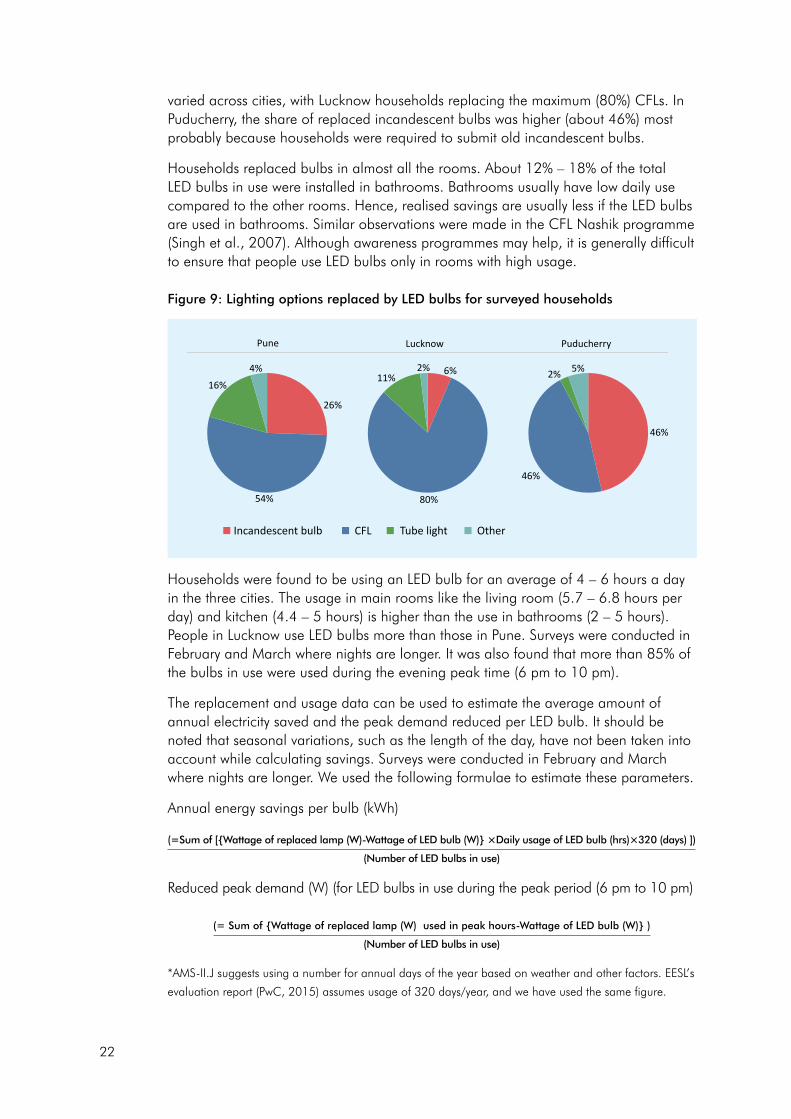
22
varied across cities, with Lucknow households replacing the maximum (80%) CFLs. In Puducherry, the share of replaced incandescent bulbs was higher (about 46%) most probably because households were required to submit old incandescent bulbs.
Households replaced bulbs in almost all the rooms. About 12% – 18% of the total LED bulbs in use were installed in bathrooms. Bathrooms usually have low daily use compared to the other rooms. Hence, realised savings are usually less if the LED bulbs are used in bathrooms. Similar observations were made in the CFL Nashik programme (Singh et al., 2007). Although awareness programmes may help, it is generally difficult to ensure that people use LED bulbs only in rooms with high usage.
Figure 9: Lighting options replaced by LED bulbs for surveyed households
Households were found to be using an LED bulb for an average of 4 – 6 hours a day in the three cities. The usage in main rooms like the living room (5.7 – 6.8 hours per day) and kitchen (4.4 – 5 hours) is higher than the use in bathrooms (2 – 5 hours). People in Lucknow use LED bulbs more than those in Pune. Surveys were conducted in February and March where nights are longer. It was also found that more than 85% of the bulbs in use were used during the evening peak time (6 pm to 10 pm).
The replacement and usage data can be used to estimate the average amount of annual electricity saved and the peak demand reduced per LED bulb. It should be noted that seasonal variations, such as the length of the day, have not been taken into account while calculating savings. Surveys were conducted in February and March where nights are longer. We used the following formulae to estimate these parameters.
Annual energy savings per bulb (kWh)
(=Sum of [{Wattage of replaced lamp (W)-Wattage of LED bulb (W)} ×Daily usage of LED bulb (hrs)×320 (days) ])
(Number of LED bulbs in use)
Reduced peak demand (W) (for LED bulbs in use during the peak period (6 pm to 10 pm)
(= Sum of {Wattage of replaced lamp (W) used in peak hours-Wattage of LED bulb (W)} )
(Number of LED bulbs in use)
*AMS-II.J suggests using a number for annual days of the year based on weather and other factors. EESL’s
evaluation report (PwC, 2015) assumes usage of 320 days/year, and we have used the same figure.
54%
16%
4%
26%
11%
80%
46%
46%
5%2%2% 6%
Incandescent bulb CFL Tube light Other
Pune Lucknow Puducherry
23
The annual savings per bulb in use calculated using the above formulae vary across the cities, with Puducherry recording the highest savings (47 kWh) and Lucknow the lowest (31 kWh). In Pune the savings per bulb are estimated to be about 34 kWh. This is expected, since Puducherry saw the highest replacements of incandescent bulbs (46% compared to 26% in Pune and 6% in Lucknow). Our sample of households in Pune was distributed across different income classes (see Annexure 1 for details). A typical LED bulb saved 2.5 times more in a low income household compared to a high income household (See Table 5). This can be attributed to two factors. First, low income households used 45% of LED bulbs bought to replace incandescent bulbs, compared to 18% for medium and high income households. Second, low income households have a limited number of lighting points in their homes and hence use each lighting point more than the medium and high income households do. The combination of more incandescent bulb replacements and higher usage makes the savings high in low income households. However, a typical high income household bought six LED bulbs compared to three for a low income household. The UJALA programme needs to focus on low income households if it wants to phase out the use of incandescent bulbs.
Table 5: Comparison between low, medium, and high income households surveyed, Pune
% ICBs replaced Average usage (hrs)
Annual savings (kWh)/LED bulb
No. of LED bulbs bought per HH
Low 45% 5.5 56 3
Medium 18% 3.6 27 5
High 18% 3.2 22 6
As more than 85% of the LED bulbs are used during the peak hours (6 pm – 10 pm), the estimated peak demand reduction is significant. The avoided peak demand per LED bulb in use is about 20 W for Pune, 16 W for Lucknow and 29 W for Puducherry.
We have inferred this data to the total number of LED bulbs sold in the respective cities to calculate the total savings and total avoided peak demand. We cannot extrapolate this data to the national level as the data set is not representative. For Pune, the total peak demand reduction comes to about 46 MW, while the total annual savings are around 78 million kWh. For Lucknow, the total peak demand reduction comes to about 25 MW, while the total annual savings are around 50 million kWh. For Puducherry district, the corresponding figures are 8 MW and 14 million kWh respectively.
4.3 How effective are the various processes of the programme?
A number of innovative processes were developed and implemented in the UJALA programme. Understanding what worked and what did not can provide valuable lessons for the future. A comprehensive process evaluation looks at each and every process and is conducted in co-ordination with the implementing agency. We have focused only on the major processes of the programme (see Figure 10). Our observations are based on surveys and interviews with the consumers and stakeholders, including EESL.
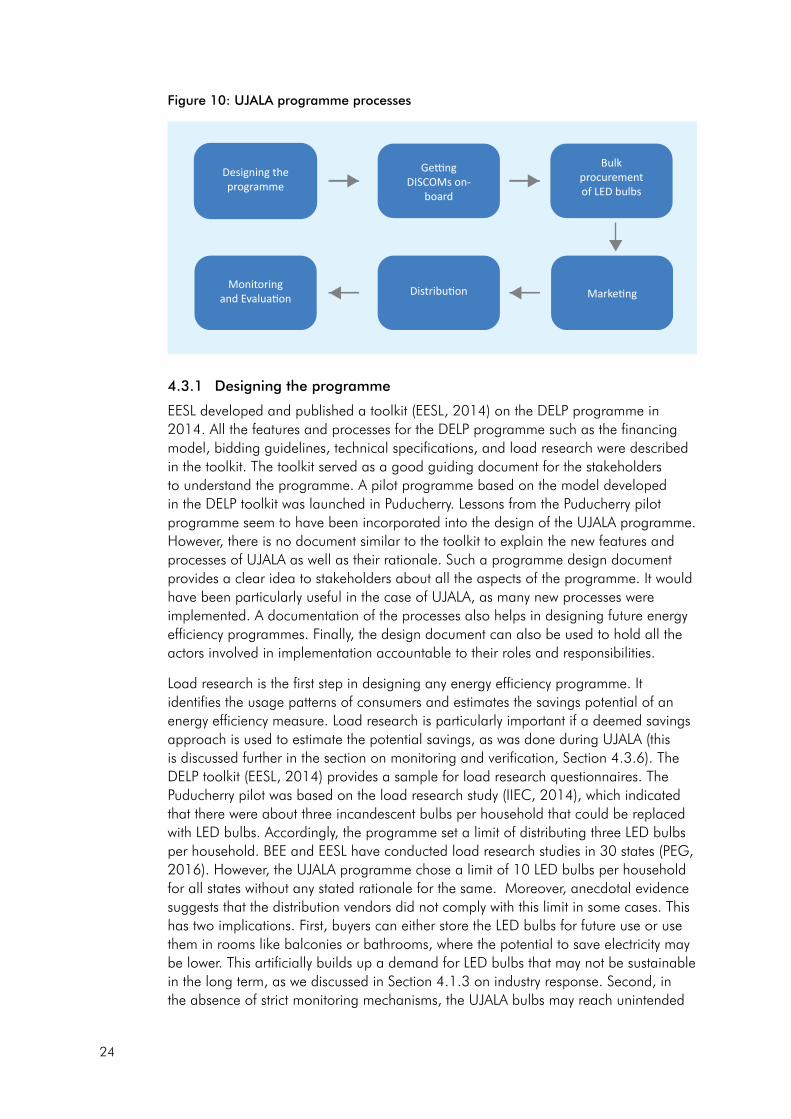
24
4.3.1 Designing the programme
EESL developed and published a toolkit (EESL, 2014) on the DELP programme in 2014. All the features and processes for the DELP programme such as the financing model, bidding guidelines, technical specifications, and load research were described in the toolkit. The toolkit served as a good guiding document for the stakeholders to understand the programme. A pilot programme based on the model developed in the DELP toolkit was launched in Puducherry. Lessons from the Puducherry pilot programme seem to have been incorporated into the design of the UJALA programme. However, there is no document similar to the toolkit to explain the new features and processes of UJALA as well as their rationale. Such a programme design document provides a clear idea to stakeholders about all the aspects of the programme. It would have been particularly useful in the case of UJALA, as many new processes were implemented. A documentation of the processes also helps in designing future energy efficiency programmes. Finally, the design document can also be used to hold all the actors involved in implementation accountable to their roles and responsibilities.
Load research is the first step in designing any energy efficiency programme. It identifies the usage patterns of consumers and estimates the savings potential of an energy efficiency measure. Load research is particularly important if a deemed savings approach is used to estimate the potential savings, as was done during UJALA (this is discussed further in the section on monitoring and verification, Section 4.3.6). The DELP toolkit (EESL, 2014) provides a sample for load research questionnaires. The Puducherry pilot was based on the load research study (IIEC, 2014), which indicated that there were about three incandescent bulbs per household that could be replaced with LED bulbs. Accordingly, the programme set a limit of distributing three LED bulbs per household. BEE and EESL have conducted load research studies in 30 states (PEG, 2016). However, the UJALA programme chose a limit of 10 LED bulbs per household for all states without any stated rationale for the same. Moreover, anecdotal evidence suggests that the distribution vendors did not comply with this limit in some cases. This has two implications. First, buyers can either store the LED bulbs for future use or use them in rooms like balconies or bathrooms, where the potential to save electricity may be lower. This artificially builds up a demand for LED bulbs that may not be sustainable in the long term, as we discussed in Section 4.1.3 on industry response. Second, in the absence of strict monitoring mechanisms, the UJALA bulbs may reach unintended
Figure 10: UJALA programme processes
Designing the programme
GettingDISCOMs on-
board
Bulkprocurementof LED bulbs
Monitoringand Evaluation
Distribution Marketing
25
consumers such as commercial establishments. These buyers do not need a low price incentive to buy LED bulbs as the paybacks for them are quicker due to high tariffs for electricity and long usage hours.
Finally, identifying the technical specifications of LED bulbs to be procured is an important step in designing the programme. EESL decided to adopt the existing BIS standards for performance and safety of LED bulbs. This ensured the quality of the bulbs and enabled EESL to move faster. However, a key task was to identify the light output of the proposed LED bulb. EESL assumed that the LED bulb could replace a 60W incandescent bulb or a 15W CFL. In the DELP toolkit, it was assumed that these two bulbs would have a light output of about 620 lumens, which would be equivalent to an 8W LED bulb. However, the AMS-II.J methodology (CDM, 2010), which EESL used to estimate the savings, states that the equivalent light output of a 60W incandescent bulb has to be about 715 lumens. The Puducherry petition (EDP, 2014) mentioned that a bulb wattage of 7W was chosen to save more electricity, without any comment on the light output. During the course of the programme, it was decided to change the bulb wattage from 7W (with 620 lumens) to 9W (with 900 lumens). It is important to choose technology wisely for a massive market transformation programme like UJALA. People may become dissatisfied with the product, thus delaying the market transformation instead of aiding it. This may not be the case with LED bulbs. Our surveys indicate that about 74% of the consumers are satisfied with the UJALA bulbs. However, for bigger appliances like ceiling fans or air-conditioners, people may have lower tolerance levels and hence more caution is required.
4.3.2 Getting DISCOMs on board
Getting DISCOMs to participate in energy efficiency (EE) programmes is a significantly challenging task in India. EE programmes are not prioritised by DISCOMs as well as state regulatory commissions, primarily due to their apparent lack of credibility (PEG, 2014). DISCOMs lack the skills and resources to implement an EE programme, as was evident from the CFL programme in Nashik (Singh et al., 2007). Finally, they are also wary of getting approval from the state regulatory commissions for the design as well as financing of the programme.
EESL addressed this challenge in several ways. First, it significantly reduced the role of DISCOMs in the programme. For the implementation of the UJALA programme, DISCOMs are only responsible for providing office space, marketing, and recovering the money from people who bought LED bulbs through the on-bill financing mechanism (this number in turn was very small). DISCOMs are not responsible for crucial tasks like bidding, distribution of LED bulbs, data collection, and warranty. This made it very convenient for the DISCOMs to participate in the programme. Also, EESL came up with a standard template for the agreement to be signed with a DISCOM on implementation of the UJALA programme in its territory. This resulted in faster approval of the programme by the state regulatory commissions. A final contributor to getting the DISCOMs on board was the ownership of the programme by the prime minister and the minister for power. This provided the final push to DISCOMs, most of which are susceptible to political influence in India, to participate in the programme. EESL acted fast and took advantage of the momentum to disseminate the programme all over India.
A couple of points should be noted about EESL’s approach to getting DISCOMs to participate in the UJALA programme. Our interviews with DISCOMs indicate that
26
they have completely washed their hands of UJALA. Most of the questions related to programmes were directed to EESL. Although the DISCOMs reported significant savings from the programme, they have not conducted any systematic studies to determine the impact on the peak demand and energy reduction. As more and bigger energy efficiency programmes are designed and implemented, it is necessary for DISCOMs to play a prominent role. The savings from energy efficiency programmes should be factored into the power planning exercise. EESL and BEE can continue their capacity building programmes for DISCOMs. The state regulatory commissions can also ensure a more serious engagement from DISCOMs in energy efficiency programmes.
Political ownership is one of the most important driving factors for the UJALA programme. However, it has a flip side as well. Our interactions with DISCOMs indicate that UJALA may have hit a wall in states not ruled by the political party at the centre. Political parties in the state governments may not be enthusiastic about the programme if the success of the programme is attributed to only one party. A second issue about the political ownership is the inertia that may affect a programme after its initial success. Market transformation programmes should come with a sunset clause. They should be withdrawn once the objective is achieved. However, political ownership may result in hesitation to withdraw a very successful programme. The programme may be yielding political dividends, although it may have already achieved its goals. This can result in the programme actually hampering the sustainability of market transformation.
4.3.3 Bulk procurement
The procurement of LED bulbs was done over successive rounds of competitive bidding. EESL issued e-tenders as and when it signed agreements with the DISCOMS. Manufacturers were required to submit technical and price bids. Manufacturers whose technical bids met the requirements set by EESL competed on price bids. In each round, multiple bidders were selected and all of them were asked to match the price of the lowest bidder. The volume of the bid was then allocated to all the manufacturers who agreed to match the lowest price in the bid. EESL had evolved a set of qualifying criteria for the participating manufacturers in order to ensure participation from serious and capable contenders, as well as the simultaneous promotion of domestic as well as small-scale manufacturers. Details of the bidding process are provided in Annexure 3.
All the participating manufacturers commended EESL on the speed and transparency of its bidding process. EESL could bargain effectively as it could aggregate the demand on a national scale. Every successive bid saw a higher number of bidders and a reduced purchase price per LED bulb for EESL. However, recent bids indicate a dip in the number of participating manufacturers. This can be due to a combination of two reasons. The first is that UJALA driven consumer awareness has pushed sales of LED bulbs in the retail market. The LED industry claims to have sold more LED bulbs in shops than through UJALA. The second is that the bidding price of LED bulbs under the UJALA programme may have reached a level where manufacturers’ profitability is getting affected. Hence, manufacturers prefer to sell the LED bulbs through shops rather than the UJALA kiosks.
EESL’s core objective was to achieve market transformation in favour of LED bulbs. Promoting domestic manufacturing and small-scale industry were secondary objectives. EESL’s initial bidding requirements (EESL, 2014) required participants
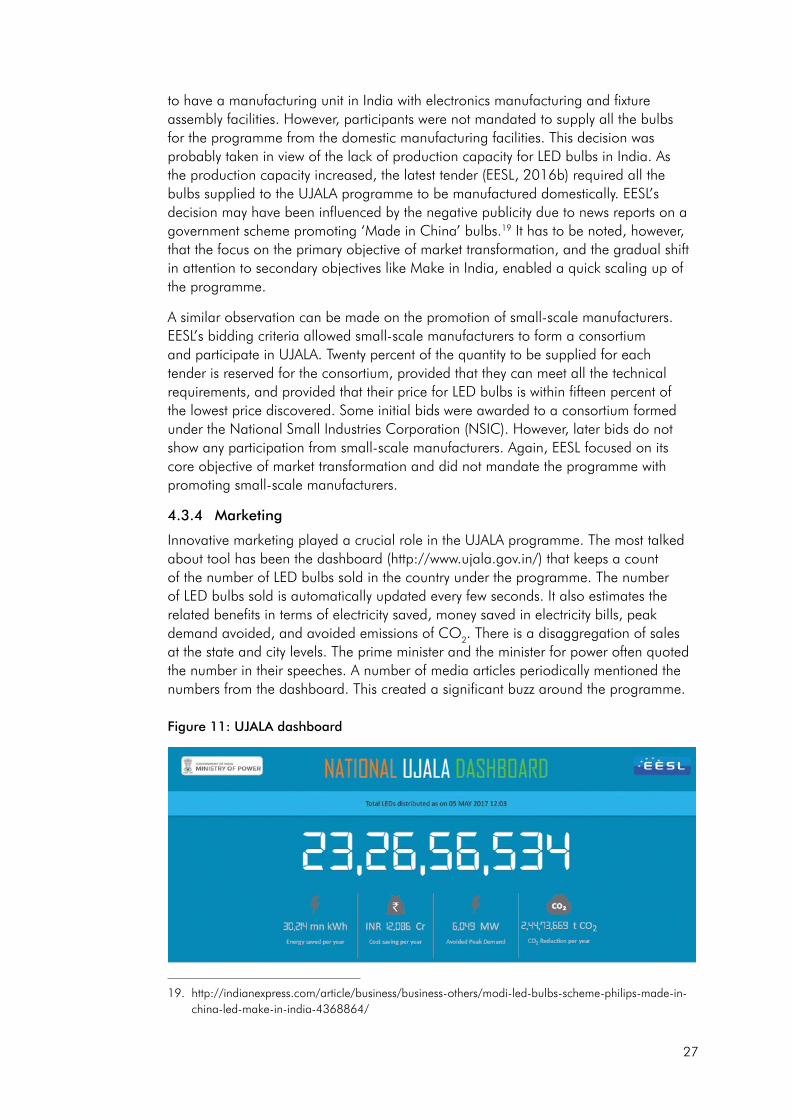
27
to have a manufacturing unit in India with electronics manufacturing and fixture assembly facilities. However, participants were not mandated to supply all the bulbs for the programme from the domestic manufacturing facilities. This decision was probably taken in view of the lack of production capacity for LED bulbs in India. As the production capacity increased, the latest tender (EESL, 2016b) required all the bulbs supplied to the UJALA programme to be manufactured domestically. EESL’s decision may have been influenced by the negative publicity due to news reports on a government scheme promoting ‘Made in China’ bulbs.19 It has to be noted, however, that the focus on the primary objective of market transformation, and the gradual shift in attention to secondary objectives like Make in India, enabled a quick scaling up of the programme.
A similar observation can be made on the promotion of small-scale manufacturers. EESL’s bidding criteria allowed small-scale manufacturers to form a consortium and participate in UJALA. Twenty percent of the quantity to be supplied for each tender is reserved for the consortium, provided that they can meet all the technical requirements, and provided that their price for LED bulbs is within fifteen percent of the lowest price discovered. Some initial bids were awarded to a consortium formed under the National Small Industries Corporation (NSIC). However, later bids do not show any participation from small-scale manufacturers. Again, EESL focused on its core objective of market transformation and did not mandate the programme with promoting small-scale manufacturers.
4.3.4 Marketing
Innovative marketing played a crucial role in the UJALA programme. The most talked about tool has been the dashboard (http://www.ujala.gov.in/) that keeps a count of the number of LED bulbs sold in the country under the programme. The number of LED bulbs sold is automatically updated every few seconds. It also estimates the related benefits in terms of electricity saved, money saved in electricity bills, peak demand avoided, and avoided emissions of CO2. There is a disaggregation of sales at the state and city levels. The prime minister and the minister for power often quoted the number in their speeches. A number of media articles periodically mentioned the numbers from the dashboard. This created a significant buzz around the programme.
Figure 11: UJALA dashboard
19. http://indianexpress.com/article/business/business-others/modi-led-bulbs-scheme-philips-made-in-china-led-make-in-india-4368864/
28
A second innovative campaign is the #iledtheway campaign. On its portal (http://www.iledtheway.in/), consumers can take a ‘pledge’ to adopt LED lighting technology. According to the website, more than 75 million have taken pledge to date. The website has informational videos on the UJALA programme. It also allows users to pre-register for the programme if it is not launched in their states. There is also an energy calculator which calculates the savings that can be realised from the use of LED bulbs. It also shows the life-time savings in terms such as the amount of coal required for generating the electricity saved, or the number of trees required to avoid the CO2
emissions.
In addition to these national level campaigns, a number of local level awareness campaigns were implemented. Local cable TV advertisements, newspapers and mobile advertising vans (World Bank, 2016) contributed to the increase in awareness. In one state, an EESL employee demonstrated the performance of three different type of bulbs (incandescent, CFL, and LED) with low voltages and proved that LED bulbs work even on the low voltages.
A couple of points should be noted about the marketing campaign. The first point is with regard to the data on the UJALA dashboard. The real-time updating of the sale of LED bulbs made a good talking point but it is not really clear how it was achieved. Anecdotal evidence and our survey of UJALA kiosks indicate that the sale of LED bulbs was not recorded in any online system in real time at the kiosk. A more serious concern is the calculation of the actual benefits realised from the use of LED bulbs. As we saw from the consumer survey, the actual savings may be less than the savings claimed by EESL. Although the measurement of actual savings is difficult, it can be a good idea to be conservative and also clearly mention the assumptions used to estimate the savings on the dashboard.
A second point is related to the sustainability of the marketing. In Pune, bulbs were distributed in two phases. In the first phase, 7W bulbs were available at Rs 100, while in the second phase 9W bulbs were available at Rs 65. There was a significant amount of marketing done in the first phase, leading to increased consumer awareness. EESL probably assumed that consumers were now sufficiently aware of the benefits of LED bulbs and hence did not conduct any marketing campaigns in the second phase. However, our survey of UJALA kiosks showed that the distribution vendors sold the Rs 65 priced 9W LED bulbs at Rs 90 – 100, pocketing the balance. They took advantage of the lack of consumer awareness on the significant price drop of LED bulbs since the first phase. A sustained marketing campaign is required to take care of such issues.
4.3.5 Distribution
At the programme’s peak, EESL’s small team was coordinating sales of six lakh LED bulbs per day across the country. EESL achieved this by hiring local vendors in different states and large cities. These vendors were given targets of selling a stipulated number of LED bulbs in a short amount of time (EESL, 2015b). Penalties could be levied if the targets were not met. The vendors were required to create a detailed distribution plan along with a weekly forecast of their requirements of LED bulbs. They were supposed to report with daily sales to an EESL supervisor. They were also required to manage the inventories of LED bulbs. Although there are no public records of whether these processes were followed, EESL’s record sale of 230 million LED bulbs in three years is a testimony to their effectiveness.
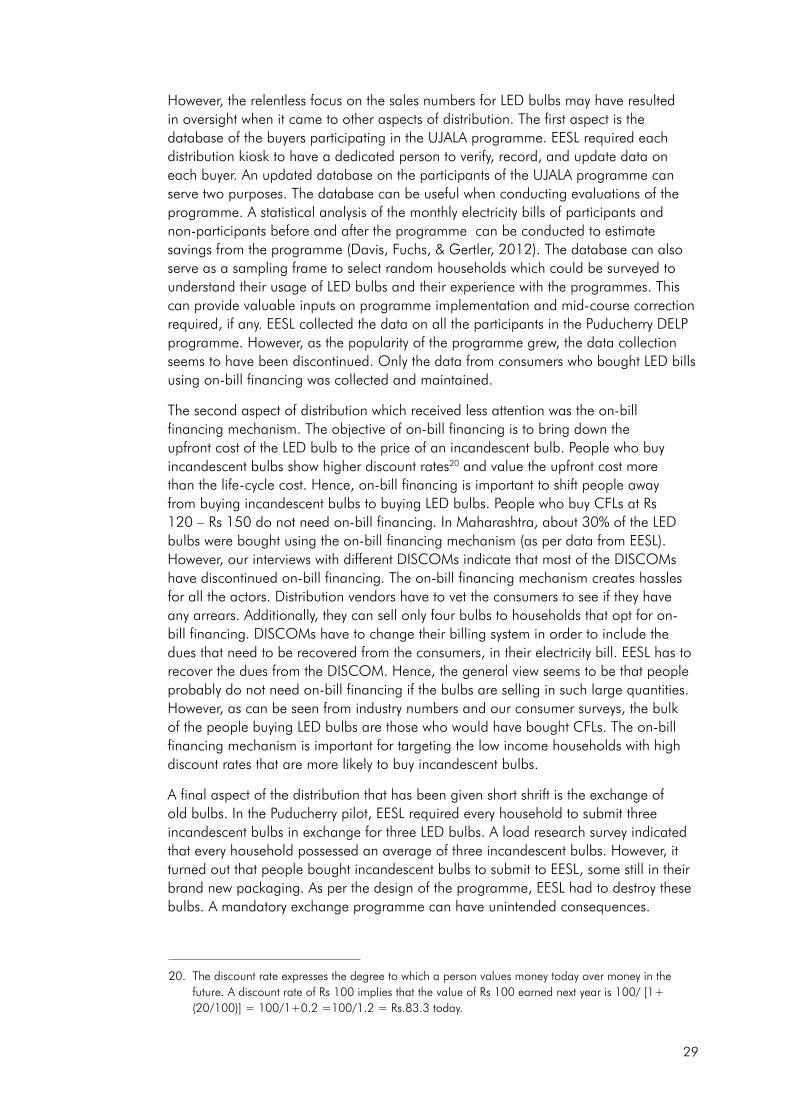
29
However, the relentless focus on the sales numbers for LED bulbs may have resulted in oversight when it came to other aspects of distribution. The first aspect is the database of the buyers participating in the UJALA programme. EESL required each distribution kiosk to have a dedicated person to verify, record, and update data on each buyer. An updated database on the participants of the UJALA programme can serve two purposes. The database can be useful when conducting evaluations of the programme. A statistical analysis of the monthly electricity bills of participants and non-participants before and after the programme can be conducted to estimate savings from the programme (Davis, Fuchs, & Gertler, 2012). The database can also serve as a sampling frame to select random households which could be surveyed to understand their usage of LED bulbs and their experience with the programmes. This can provide valuable inputs on programme implementation and mid-course correction required, if any. EESL collected the data on all the participants in the Puducherry DELP programme. However, as the popularity of the programme grew, the data collection seems to have been discontinued. Only the data from consumers who bought LED bills using on-bill financing was collected and maintained.
The second aspect of distribution which received less attention was the on-bill financing mechanism. The objective of on-bill financing is to bring down the upfront cost of the LED bulb to the price of an incandescent bulb. People who buy incandescent bulbs show higher discount rates20 and value the upfront cost more than the life-cycle cost. Hence, on-bill financing is important to shift people away from buying incandescent bulbs to buying LED bulbs. People who buy CFLs at Rs 120 – Rs 150 do not need on-bill financing. In Maharashtra, about 30% of the LED bulbs were bought using the on-bill financing mechanism (as per data from EESL). However, our interviews with different DISCOMs indicate that most of the DISCOMs have discontinued on-bill financing. The on-bill financing mechanism creates hassles for all the actors. Distribution vendors have to vet the consumers to see if they have any arrears. Additionally, they can sell only four bulbs to households that opt for on-bill financing. DISCOMs have to change their billing system in order to include the dues that need to be recovered from the consumers, in their electricity bill. EESL has to recover the dues from the DISCOM. Hence, the general view seems to be that people probably do not need on-bill financing if the bulbs are selling in such large quantities. However, as can be seen from industry numbers and our consumer surveys, the bulk of the people buying LED bulbs are those who would have bought CFLs. The on-bill financing mechanism is important for targeting the low income households with high discount rates that are more likely to buy incandescent bulbs.
A final aspect of the distribution that has been given short shrift is the exchange of old bulbs. In the Puducherry pilot, EESL required every household to submit three incandescent bulbs in exchange for three LED bulbs. A load research survey indicated that every household possessed an average of three incandescent bulbs. However, it turned out that people bought incandescent bulbs to submit to EESL, some still in their brand new packaging. As per the design of the programme, EESL had to destroy these bulbs. A mandatory exchange programme can have unintended consequences.
20. The discount rate expresses the degree to which a person values money today over money in the future. A discount rate of Rs 100 implies that the value of Rs 100 earned next year is 100/ [1+ (20/100)] = 100/1+0.2 =100/1.2 = Rs.83.3 today.
30
However, ignoring the replaced appliance can have serious impacts as well. There are two main concerns: disposal of the replaced appliance and its storage for future use. Our survey shows that 44% of the households discarded their old bulbs, a majority of them being CFLs containing mercury. Indian cities do not have good disposal mechanisms for CFLs and most of them would have found their way to landfills, where they would be leaching mercury into the soil. EESL could have collaborated with e-waste manufacturers and opened up e-waste collection centres for CFLs along with the LED distribution kiosks. This could have relieved the burden on EESL as well as prevented all the CFLs from being dumped in landfills or being improperly discarded. About 40% of the surveyed households said that they stored the old bulbs for future use, thus leading to high energy consumption in the future. In case of bigger appliances like ceiling fans and air-conditioners, the replaced appliances may find their way to second-hand markets. This would negate the savings achieved by the energy efficient replacement. A good exchange policy is necessary for an effective energy efficiency programme.
4.3.6 Monitoring and evaluation
The effective implementation of a programme like UJALA should include monitoring of the quantity and quality of the LED bulbs as well as evaluation of the savings achieved from the use of these bulbs. As discussed in the previous sub-section, 4.3.5, EESL had a detailed process for distributing the bulbs. An internal audit or process evaluation would be required to assess the effectiveness of these processes and validity of the number of bulbs sold, their leakage to non-target consumers, instances of counterfeit bulbs, etc. We focus on the quality of LED bulbs and estimation of savings.
Bulb quality
EESL has a three-tier approach to ensuring the quality of LED bulbs (EESL, 2015a). The procured LED bulbs are required to conform to the BIS standards for safety and performance, in addition to international standards on the performance of LED chips. They are also required to undergo photo-biological tests to ensure that no health hazard occurs from their use. Manufacturers are required to submit copies of compliance with these tests from NABL accredited testing laboratories. In the second stage, EESL is supposed to conduct tests on samples of LED bulbs picked up from manufacturers’ facilities and field locations. Finally, EESL has a 24x7 call centre which records the data on the failure of the LED bulbs. Manufacturers are required to provide a three-year warranty and deal with any warranty issues in 72 hours. EESL is also supposed to retain 30% of the contract value over the contract duration to ensure that manufacturers take care of warranty issues.
There is no data in the public domain on random tests carried out by EESL on the samples picked up from manufacturing facilities. EESL has published the data from its call centre during the January to October 2015 period (PwC, 2015). According to this data, the failure rate is less than 0.1 % of the total bulbs sold. Monthly publication of the data on the number of calls received about failures would be useful to keep track of warranty issues. EESL also conducted a survey of households in Puducherry and Andhra Pradesh and less than 1% of the LED bulbs sold were found to be defective. Our surveys found that only 2% of LED bulbs have failed to date in Pune, while 14% of the LED bulbs have failed in Puducherry. DELP was launched three years ago in Puducherry and the LED bulbs were provided with an eight year warranty (see Figure 12).
31
Lower expectations from a government programme and higher tolerance levels for faults in low cost LED bulbs, combined with some process related issues, have resulted in lower replacements under warranty. People bought the LED bulbs at the kiosks set up in their locality during the distribution phase. However, they have to go to the DISCOM office to get the faulty bulbs replaced under warranty. They are also expected to retain the bill of purchase. These processes can be made easier. EESL can conduct widely advertised, periodic drives for collecting failed bulbs. It can also collaborate with local retail shops, which could act as collection points for defective bulbs. Additionally, the bulbs can be marked with their date of sale, a practice followed by local shop vendors, so that people do not have to retain their purchase bills. In absence of a proper warranty process, people may be disappointed with the product as well as the programme. This can affect future uptake of LED bulbs as well as consumer participation in UJALA -like programmes targeting other appliances. In the case of Puducherry, where the default rate is the highest, our surveys indicate that only 58% of the households are satisfied with LED bulbs (compared to more than 80% in other cities), and 37% of the households reported that they would buy a CFL in future (compared to less than 10% in other cities).
Evaluation of realised savings
EESL adopted a deemed savings approach to estimate the potential and realised savings from the UJALA programme. In this approach, savings from the energy efficiency programme are estimated using assumptions for the various parameters that contribute to energy consumption. These assumptions are normally based on well-documented historical data on actual measurement and analysis of the savings achieved from the implemented energy efficiency measure. There is limited data on ownership and usage of lighting points in India.
EESL’s deemed savings approach assumes that all the LED bulbs replace incandescent bulbs. It is extremely difficult to ensure that all the sold LED bulbs will replace incandescent bulbs. EESL did not specifically target low income households, which would have increased the chances of replacement of incandescent bulbs. Even in Puducherry, where households were required to submit old incandescent bulbs, our survey found that less than half the LED bulbs were used to replace incandescent bulbs. Across the three cities, only a quarter of all the LED bulbs were used by households to replace incandescent bulbs. EESL could have taken a more conservative estimate for replacement, which would have made the savings estimate more realistic.
Figure 12: Failure rate and exchange rate of UJALA bulbs (for surveyed consumers)
2%
6%
14%
0%2%4%6%8%
10%12%14%16%
Pune Lucknow Puducherry
30%
24%
10%
0%5%
10%15%20%25%30%35%
Pune Lucknow Puducherry
Exchange rate of failed bulbsBulb Failure Rate
2%
6%
14%
0%2%4%6%8%
10%12%14%16%
Pune Lucknow Puducherry
30%
24%
10%
0%5%
10%15%20%25%30%35%
Pune Lucknow Puducherry
Exchange rate of failed bulbsBulb Failure Rate

32
EESL’s demand savings approach also assumes higher usage periods for the replaced LED bulbs (see Table 6). It initially proposed adopting the AMS-II.J methodology developed by the UN’s Clean Development Mechanism (CDM) and used for the Bachat Lamp Yojana (BLY). According to the AMS-II.J methodology, a typical lighting point is used for 3.5 hours a day for 300 days in a year. It requires continuous measurement for 90 days if different values for usage are to be used for estimating savings. EESL installed data loggers in a sample of households in Puducherry to measure the actual usage of LED bulbs. However, during a later visit, their team found that either the data loggers were missing or that the bulbs had been moved to different locations, making the actual measurement of usage difficult. As an independent evaluation, PricewaterhouseCoopers (PwC) surveyed about 600 households in Puducherry and Andhra Pradesh(PwC, 2015). The survey was limited to questions on the current status of LED bulbs. Information was not gathered on what lighting sources the LED bulbs replaced or on the usage hours for the LED bulbs. The report assumes that the LED bulbs are being used for eight hours in a day for 320 days of the year. It says that these figures are based on load research surveys, the details of which are not mentioned. Our surveys show an average daily usage of five hours per LED bulb with some variations across the cities.
Table 6: Comparison of usage hours
From Prayas survey
AMS-II.J methodology
EESL evaluation
Daily usage hours 4-6 3.5 8
Days per year 320* 300 320
Total usage hours 1600 1050 2560
*Assumption by Prayas
Finally, EESL also assumes that most of the LED bulbs sold under UJALA are operational. According to the PwC report, about 99% of the LED bulbs sold are operational. However, our surveys found that households are using 74% of the LED bulbs they bought while others are stored, defective or given to others. This further reduces the electricity savings per LED bulb sold.
All these factors indicate that EESL’s claimed savings are unrealistic. A better estimate of these savings can be achieved by conducting consumer surveys to gather data on usage and replacement. DISCOMs can commission surveys in their territories to estimate the actual savings from the LED bulbs sold under the UJALA programme. The Bureau of Energy Efficiency (BEE) can provide the financial support. A realistic estimate of savings can build the credibility of energy efficiency programmes and also help DISCOMs to plan their power purchase better.
33
In this section, we discuss lessons learnt from understanding the impacts of UJALA and provide our recommendations. There are two sets of lessons — one for the existing UJALA programme, and the other for future programmes to be designed based on the UJALA model.
5.1 UJALA programme
• Focus on incandescent bulbs: Industry data and consumer surveys indicate that LED bulbs sold under the UJALA programme have mostly replaced CFLs. The sale of incandescent bulbs has declined but at a much lower rate than that of CFLs. The programme needs to focus on lower income households and small commercial establishments, which are more likely to buy incandescent bulbs. One way to do this is to emphasise the on-bill financing mechanism which has been hitherto side-lined.
• Plan for systematic withdrawal: EESL cannot expect to continue selling LED bulbs and replace the vast network of dealers and retailers across India. The reduction in the prices of LED bulbs has been achieved through economies of scale. The LED industry is now selling more LED bulbs than those sold through UJALA. However, half of the demand for LED bulbs is still met through UJALA. Hence, EESL should be careful when withdrawing the programme. A sudden withdrawal may result in a sudden drop in demand with a consequential rise in price. A gradual withdrawal combined with shifted focus to low income households can be a good strategy for withdrawal.
• Ensure the bulbs are exchanged under warranty: A good warranty process is crucial for long-term consumer satisfaction and consequently a sustained market transformation. EESL can conduct periodic drives in different cities to collect failed LED bulbs and replace them with new ones. It can also make the process easier by marking the LED bulbs rather than asking consumers to retain copies of the bill of purchase. Finally, EESL can collaborate with manufacturers and ask them to use their local channels for the collection and replacement of failed bulbs.
• Conduct awareness campaigns on the latest prices: The price of an LED bulb sold through UJALA has fallen sharply and is less than half of the market price. Distribution vendors can take unfair advantage of the lack of consumer awareness by selling the bulbs at a price higher than the latest UJALA price, but still lower than the market price, and pocketing the difference. Vendors are also responsible for local awareness campaigns, which they may not conduct given the disincentives. EESL and the local DISCOM can conduct awareness campaigns to ensure that consumers are aware of the latest UJALA price.
• Monitoring and evaluation: The significant price difference between UJALA and the retail market can also lead to leakage of UJALA bulbs into the market. EESL needs to ensure strict monitoring to ensure that UJALA bulbs are not sold in the
5. Lessons and recommendations
34
market at a premium. The processes delineated in the bidding document for the distribution vendors can ensure this, if followed strictly. BEE or the DISCOMs can conduct evaluation surveys in different states to estimate the savings realised from the UJALA programme as well as the effectiveness of the processes employed. EESL should mandate the collection of data on all the participants in order to facilitate the evaluation surveys.
• Disposal of CFLs: People are mostly replacing CFLs with LEDs through the UJALA programme. CFLs, with their mercury content, pose serious problems if they are disposed without care. EESL can collaborate with an e-waste company to set up a collection kiosk for old CFLs along with the LED kiosks. Buyers will not be mandated to submit CFLs but can use the facility if they want to discard their own CFLs. This can ensure the proper disposal of CFLs.
5.2 Future programmes
• The case of LED bulbs was an exception: Innovative processes and efficient implementation definitely contributed to UJALA’s success in creating the LED market in India. However, the choice of LED bulbs as the energy efficiency measure also played a major part. They are easy to store and cheaper than other appliances. The declining cost of LEDs and the significant potential for achieving economies of scale made them a good candidate for the programme. Such a large-scale market shift and a dramatic drop in prices should not be expected from a programme for other appliances. The design and execution of other programmes should not be burdened with expectations of achieving UJALA’s scale.
• Market transformation may be better if slow and predictable: EESL’s approach towards transforming the lighting market was to sell as many LED bulbs as possible in the shortest amount of time. There has been a spurt in the manufacturing capacity for LED bulbs in India to meet the demand. The expectation is that this demand will be sustained. If the programme is withdrawn and demand falls, the manufacturers may find themselves in financial trouble. A slower-moving and predictable demand trajectory is better for the creation of a market and its supporting ecosystem, such as testing laboratories and standards. A slower transformation also accommodates a rapid change in technology. For instance, the demand for CFLs increased rapidly following the Bachat Lamp Yojana (BLY), resulting in the development of significant production capacity for CFLs in India. This capacity is now redundant as the LED bulbs have replaced CFLs, following the UJALA programme. Also, a proper withdrawal plan must be in place so that the market is not disturbed when the programme is withdrawn. As of now, UJALA accounts for half of the demand and the bulb prices are half the market prices. A withdrawal of the programme now may result in a significant reduction of demand for LED bulbs in India.
• Limited role of DISCOMs may work but not recommended for the long term: DISCOMs have limited capacity for designing and conducting energy efficiency programmes in India. EESL limited their role in UJALA to ensure faster and higher levels of participation. This may have worked for UJALA but it may result in DISCOMs completely outsourcing all their Demand Side Management (DSM) programmes to EESL in the future. Effective DSM programmes can significantly impact the demand and load profiles, which in turn can impact DISCOMs’ planning for power purchase. The effective designing of DSM
35
programmes may therefore help DISCOMs to optimise their power purchase. However, neglecting the large-scale DSM programmes may result in a negative impact on their revenues. Hence, DISCOMs should participate actively in the design of DSM programmes, leaving the implementation to EESL. EESL and BEE should continue their efforts of building the capacity of DISCOMs to design DSM programmes.
• Comprehensive and periodic evaluation is necessary: A comprehensive evaluation of the varied impacts of the programme and the effectiveness of the processes is crucial. The evaluation plan should be a part of the programme design with a separate budget allocated for it. The plan should identify the parameters for the success of the programme, with proper baselines, followed by continuous monitoring during programme implementation. BEE can commission these studies at the national level. DISCOMs can commission evaluation at the local level. DISCOMs can use the funds reserved for their DSM activities for the purpose of evaluation.
• Transparency and accountability is important: Every programme should have a programme design document which clearly delineates all the features and processes along with their rationale. This document can be useful for getting all the stakeholders on board. It can also be used to hold all the actors in programme implementation accountable. Similarly, during the course of the programme, reports on testing, evaluation, and warranty claims should be made public on a regular basis. This will help to identify any major issues during implementation and also increase the public credibility of the programme.
36
We assessed the various impacts of the UJALA programme by analysing publicly available data and interviewing stakeholders including consumers, manufacturers, retailers, distribution companies, and industry experts. The exercise is an indicative assessment of the programme and not a comprehensive evaluation. We found that UJALA has succeeded in creating a large and sustainable market for LED bulbs in India using the no-subsidy, bulk procurement model. Demand for LED bulbs has increased manifold and the retail market price (for the LED bulbs sold outside UJALA) has dropped by a third. Domestic manufacturing of LED bulbs has increased, efficiency standards are being implemented, and the number of accredited testing laboratories has increased, all pointing to sustainability of the LED lighting market. It has also created significant awareness about LED bulbs in India, further contributing to their increasing demand.
Such a demand for LED bulbs has replaced the demand for CFLs rather than that for incandescent bulbs. Going ahead, EESL should target low income households and small commercial establishments who are still buying incandescent bulbs. EESL can conduct special campaigns and also focus more on the on-bill financing mechanism which reduces the upfront cost of the LED bulbs. The streamlined procurement processes and innovative marketing campaigns from the UJALA model have a significant market transformation potential in the case of other appliances such as ceiling fans and agricultural pumps. However, the speed and scale of the success of the UJALA programme for LED bulbs was partly because of the particular characteristics of the LED bulbs, and hence the programmes for other appliances should not be burdened with similar expectations. A strict monitoring mechanism should ensure a good quality of appliances and compliance of various processes. If consumers experience quality issues and are not able to replace the appliances under warranty, it could result in dissatisfaction, which in turn could push back transformation. The issue of older inefficient appliances must be addressed so that they are not passed on to other consumers and are properly discarded. A comprehensive evaluation should be conducted to understand the impacts of the programmes and effectiveness of the processes. Although the bulk procurement model does not involve subsidy, it is important to quantify the savings realistically in order to factor them in planning optimised capacity addition and adequate climate change mitigation actions.
6. Conclusion
37
CDM. (2010). Indicative simplified baseline and monitoring methodologies for selected small-scale CDM project activity categories. Retrieved from https://cdm.unfccc.int/filestorage/9/J/A/9JASTI0QYD24GWVZLRF16UK7HOX8B3/EB54_repan06_AMS-II.J_ver04_0406.pdf?t=Mk58b211bGt5fDBqEwBNP2e7AKCTv6gII6nq
CEA. (2016). Growth of Electricity Sector In India from 1947-2016. Central Electricity Authority, Ministry of Power, Government of India.
Davis, L., Fuchs, A., & Gertler, P. (2012). The Economics of Household Energy Efficiency: Evidence from Mexico’s Cash for Coolers Program. Unpublished Manuscript. Retrieved from http://citeseerx.ist.psu.edu/viewdoc/download?doi=10.1.1.252.7446&rep=rep1&type=pdf
Desai, S. (Ed.). (2010). Human development in India: Challenges for a society in transition. Oxford : Oxford University Press.
EDP. (2014). Puducherry Petition. Electricity Department Puducherry. Retrieved from http://www.jercuts.gov.in/writereaddata/UploadFile/delp2_1841.pdf
EESL. (2014). EESL Toolkit for DSM based Efficient Lighting Programme. Energy Efficiency Services Ltd. Retrieved from http://www.eeslindia.org/writereaddata/DELP%20Toolkit%20final.pdf
EESL. (2015a). Quality Control Measures of EESL for LED Programmes. Energy Efficiency Services Ltd. Retrieved from http://www.ujala.gov.in/documents/Quality_Control_in_LED_Programme_EESL.pdf
EESL. (2015b). Request for proposal for hiring of agency in Nagpur and Allahabad. Retrieved from http://www.eeslindia.org/writereaddata/TenderforNagpurandAlahaba.pdf
EESL. (2016a). Annual Report (2015–16). Energy Efficiency Services Ltd. Retrieved from http://www.eeslindia.org/writereaddata/EESL%20Annual%20Report%202015-16.pdf
EESL. (2016b). EESL Tender for 9W bulbs. Energy Efficiency Services Ltd.
EESL. (2017). UJALA Dashboard. Retrieved June 1, 2017, from http://www.ujala.gov.in/
ELCOMA. (2013). ELCOMA Vision 2020: Vision Document. Electric Lamps and Component Manufacturers’ Association of India. Retrieved from http://www.elcomaindia.com/wp-content/uploads/ELCOMA-Vision-2020.pdf
ELCOMA. (2016a). Members’ Directory 2016–18. Electric Lamps and Component Manufacturers’ Association of India. Retrieved from http://www.elcomaindia.com/wp-content/uploads/elcoma-directory-2016.pdf
ELCOMA. (2016b). ELCOMA Lighting Data. Electric Lamps and Component Manufacturers’ Association of India.
ENVIS. (2015). A Success Story – LED replacement program and its impact on GHG emission in union territory of Puducherry. ENVIS Center Puducherry. Retrieved from http://dste.puducherry.gov.in/envisnew/LED%20replacement%20program-%20VOLUME%20VI-I.pdf
References
38
Gadgil, A. J., & Sastry, M. A. (2008). Stalled on the Road to the Market: Analysis of Field Experience with a Project to Promote Lighting Efficiency in India. Lawrence Berkeley National Laboratory. Retrieved from http://escholarship.org/uc/item/2420d21k.pdf
Gerke, B., Ngo, A. T., & Fisseha, K. (2015). Recent price trends and learning curves for household LED lamps from a regression analysis of Internet retail data. Ernest Orlando Lawrence Berkeley National Laboratory. Retrieved from https://eaei.lbl.gov/sites/all/files/lbnl-184075.pdf
Haitz, R., & Tsao, J. Y. (2011). Solid-state lighting. Optik & Photonik, 6(2), 26–30.
HDFC. (2016). HDFC Securities Insights on Electrical Equipment & Appliances. HDFC Securities. Retrieved from http://www.hdfcsec.com/Research/ResearchDetails.aspx?report_id=3017763
IEA. (2017). India’s UJALA Story: Energy Efficient Prosperity. International Energy Agency (IEA). Retrieved from http://www.eeslindia.org/writereaddata/Ujala%20Case%20study.pdf
IIEC. (2014). Sample Survey Report on Lighting Usage in Puducherry. International Institute for Energy Conservation.
NAPEE. (2007). Model Energy Efficiency Program Impact Evaluation Guide. National Action Plan for Energy Efficiency. Prepared by Steven R. Schiller, Schiller Consulting, Inc. Retrieved from https://www.epa.gov/sites/production/files/2017-06/documents/evaluation_guide.pdf
NITI Aayog. (2016). India Energy Security Scenarios, 2047 User Guide: Residential Lighting and Appliances. Retrieved from http://www.indiaenergy.gov.in/iess/docs/Residential-Lighting_Appliances-documentation.pdf
NSSO. (2014). Household Consumption of Various Goods and Services in India 2011-2012 (NSS 68th Round). National Sample Survey Office, Government of India. Retrieved from http://mospi.nic.in/sites/default/files/publication_reports/Report_no558_rou68_30june14.pdf
PEG. (2014). Demand Side Management in India: An Overview of State Level Initiatives. Prayas (Energy Group). Retrieved from http://www.prayaspune.org/peg/publications/item/281-demand-side-management-in-india-an-overview-of-state-level-initiatives.html
PEG. (2016). Residential Electricity Consumption in India. Prayas (Energy Group). Retrieved from http://www.prayaspune.org/peg/publications/item/331-residential-electricity-consumption-in-india-what-do-we-know.html
PwC. (2013). Roadmap for demand aggregation of LED lighting. Retrieved from http://shaktifoundation.in/wp-content/uploads/2014/02/LED-Demand-Aggregation-Roadmap.pdf
PwC. (2015). Monitoring and Verification Report: Street Lighting and DELP Project. PwC. Retrieved from http://www.ujala.gov.in/documents/Final_Monitoring_and_Verificatio_Report_EESL.pdf
Scholand, M. (2016). Fast Learning Curves – LED Lighting’s Rapid Reduction in Price. CLASP. Retrieved from http://clasp.ngo/~/media/Files/LEDs/CLASP-LED-Lamp-Pricing%20Memo-Global-and-five-EU-countries.pdf
Singh, D., Sant, G., & Kadam, R. (2007). Review of Nashik Pilot CFL DSM program of MSEDCL. Prayas (Energy Group). Retrieved from http://prayaspune.org/peg/publications/item/65-review-of-nashik-pilot-cfl-dsm-program-of-msedcl.html
World Bank. (2016). Communication Research on Energy Efficiency in India. The World Bank.

39
It was decided to conduct the consumer surveys in Pune, Lucknow and Puducherry for a number of reasons. Firstly, by virtue of their location, we would be obtaining information about the UJALA programme from the western, northern and southern regions of the country. Puducherry was chosen as the programme was first launched there, and it is the only project where all the households in the service area of the DISCOM have been covered. Also, as the programme had been launched in April 2014, it would provide an opportunity to study impacts almost three years after its implementation. Pune and Lucknow were the cities with the highest sales in their respective states. The rural areas of Pune district were covered as well.
A questionnaire was formulated and a pilot survey of 21 households was conducted in Pune to test it. Questionnaires similar to the ones used for the Pune survey were used in Lucknow and Pondicherry, with a few modifications made to suit local scenarios. In addition, enumerators carried pictures of CFLs and tube lights to assist respondents in their identification of lighting options. The surveys were conducted during the months of December 2016 and January, February and March 2017.
Pune
A sample size of 500 households was decided upon for the survey conducted in Pune district. The sample was divided between the urban and rural areas of the district according to the proportion of LED bulbs sold between the urban and rural areas of the district. Information on bulb sales was obtained from the programme website, http://www.ujala.gov.in. As of 25th November, 2016, 84% of bulbs (4, 17,012 out of a total of 2,180,202 for the district) had been sold in urban Pune. The sample was consequently divided in the ratio 80:20 into 420 urban households and 80 rural households.
The urban sample was taken from eight wards randomly selected from the 15 administrative wards in the Pune Municipal Corporation. Around 52 households were surveyed from each ward. In order for the sample to be representative of all the economic classes, it was decided to divide the sample equally into low, medium and high income households. As we were not able to obtain information from EESL or MSEDCL about which households in these wards had bought bulbs under the programme, it was not possible to use random sampling to select households. Households were therefore selected using the snowballing method. Snowballing is a non-random sampling method used in situations where it is difficult to identify sampling units before the conducting of a survey. In this technique, a few respondents are initially identified and are asked to identify more potential respondents. After these potential respondents are surveyed, they too are asked to recommend other respondents, and so on, until a sample of the required size has been obtained.
Annexure 1: Consumer surveys
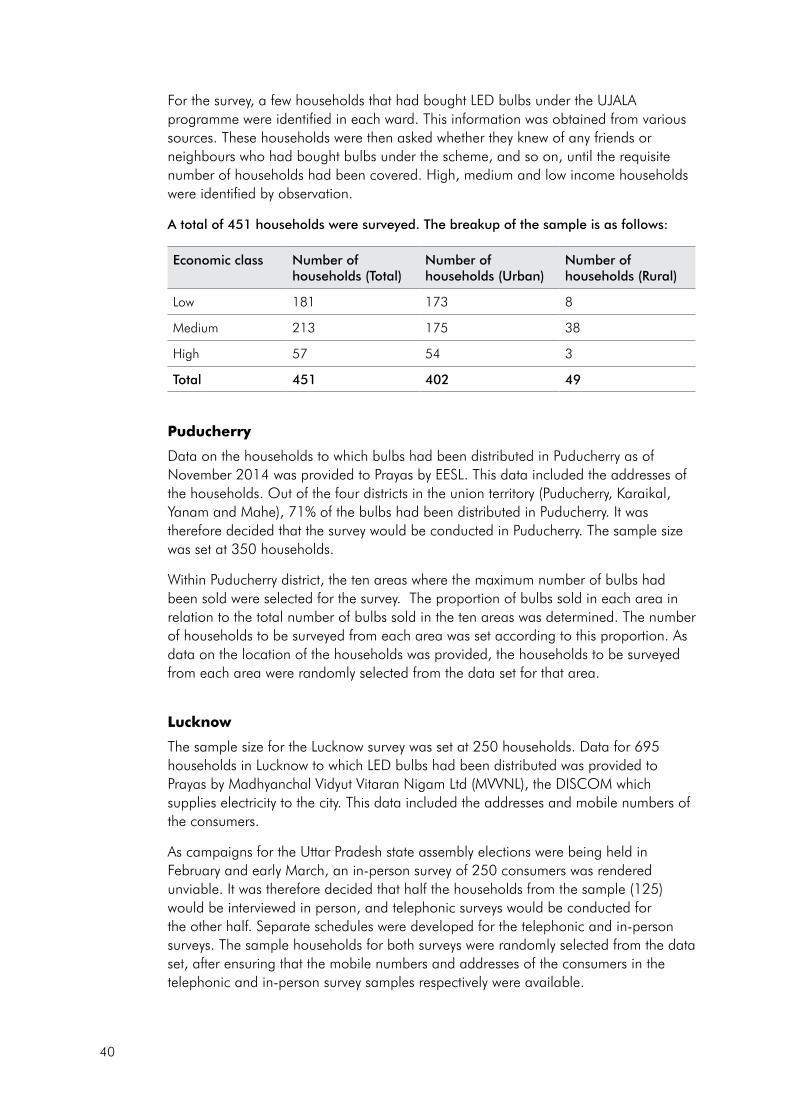
40
For the survey, a few households that had bought LED bulbs under the UJALA programme were identified in each ward. This information was obtained from various sources. These households were then asked whether they knew of any friends or neighbours who had bought bulbs under the scheme, and so on, until the requisite number of households had been covered. High, medium and low income households were identified by observation.
A total of 451 households were surveyed. The breakup of the sample is as follows:
Economic class Number of households (Total)
Number of households (Urban)
Number of households (Rural)
Low 181 173 8
Medium 213 175 38
High 57 54 3
Total 451 402 49
Puducherry
Data on the households to which bulbs had been distributed in Puducherry as of November 2014 was provided to Prayas by EESL. This data included the addresses of the households. Out of the four districts in the union territory (Puducherry, Karaikal, Yanam and Mahe), 71% of the bulbs had been distributed in Puducherry. It was therefore decided that the survey would be conducted in Puducherry. The sample size was set at 350 households.
Within Puducherry district, the ten areas where the maximum number of bulbs had been sold were selected for the survey. The proportion of bulbs sold in each area in relation to the total number of bulbs sold in the ten areas was determined. The number of households to be surveyed from each area was set according to this proportion. As data on the location of the households was provided, the households to be surveyed from each area were randomly selected from the data set for that area.
Lucknow
The sample size for the Lucknow survey was set at 250 households. Data for 695 households in Lucknow to which LED bulbs had been distributed was provided to Prayas by Madhyanchal Vidyut Vitaran Nigam Ltd (MVVNL), the DISCOM which supplies electricity to the city. This data included the addresses and mobile numbers of the consumers.
As campaigns for the Uttar Pradesh state assembly elections were being held in February and early March, an in-person survey of 250 consumers was rendered unviable. It was therefore decided that half the households from the sample (125) would be interviewed in person, and telephonic surveys would be conducted for the other half. Separate schedules were developed for the telephonic and in-person surveys. The sample households for both surveys were randomly selected from the data set, after ensuring that the mobile numbers and addresses of the consumers in the telephonic and in-person survey samples respectively were available.
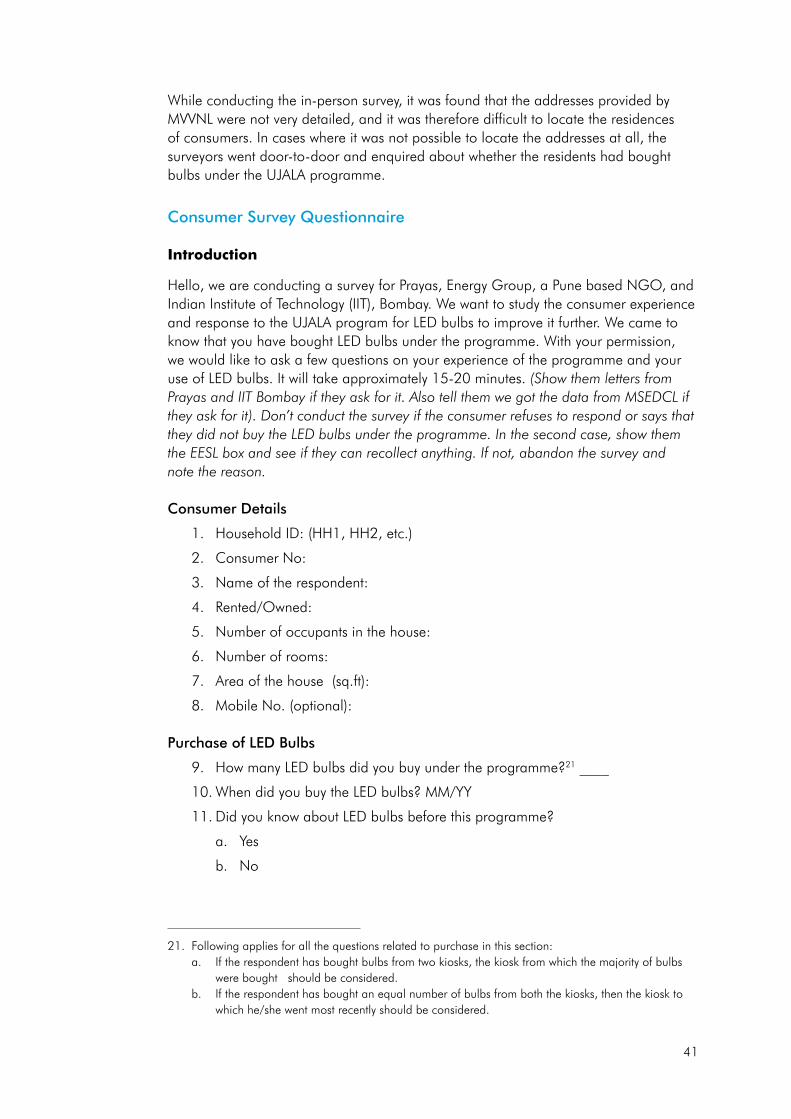
41
While conducting the in-person survey, it was found that the addresses provided by MVVNL were not very detailed, and it was therefore difficult to locate the residences of consumers. In cases where it was not possible to locate the addresses at all, the surveyors went door-to-door and enquired about whether the residents had bought bulbs under the UJALA programme.
Consumer Survey Questionnaire
Introduction
Hello, we are conducting a survey for Prayas, Energy Group, a Pune based NGO, and Indian Institute of Technology (IIT), Bombay. We want to study the consumer experience and response to the UJALA program for LED bulbs to improve it further. We came to know that you have bought LED bulbs under the programme. With your permission, we would like to ask a few questions on your experience of the programme and your use of LED bulbs. It will take approximately 15-20 minutes. (Show them letters from Prayas and IIT Bombay if they ask for it. Also tell them we got the data from MSEDCL if they ask for it). Don’t conduct the survey if the consumer refuses to respond or says that they did not buy the LED bulbs under the programme. In the second case, show them the EESL box and see if they can recollect anything. If not, abandon the survey and note the reason.
Consumer Details
1. Household ID: (HH1, HH2, etc.)
2. Consumer No:
3. Name of the respondent:
4. Rented/Owned:
5. Number of occupants in the house:
6. Number of rooms:
7. Area of the house (sq.ft):
8. Mobile No. (optional):
Purchase of LED Bulbs
9. How many LED bulbs did you buy under the programme?21 ____
10. When did you buy the LED bulbs? MM/YY
11. Did you know about LED bulbs before this programme?
a. Yes
b. No
21. Following applies for all the questions related to purchase in this section: a. If the respondent has bought bulbs from two kiosks, the kiosk from which the majority of bulbs
were bought should be considered.b. If the respondent has bought an equal number of bulbs from both the kiosks, then the kiosk to
which he/she went most recently should be considered.
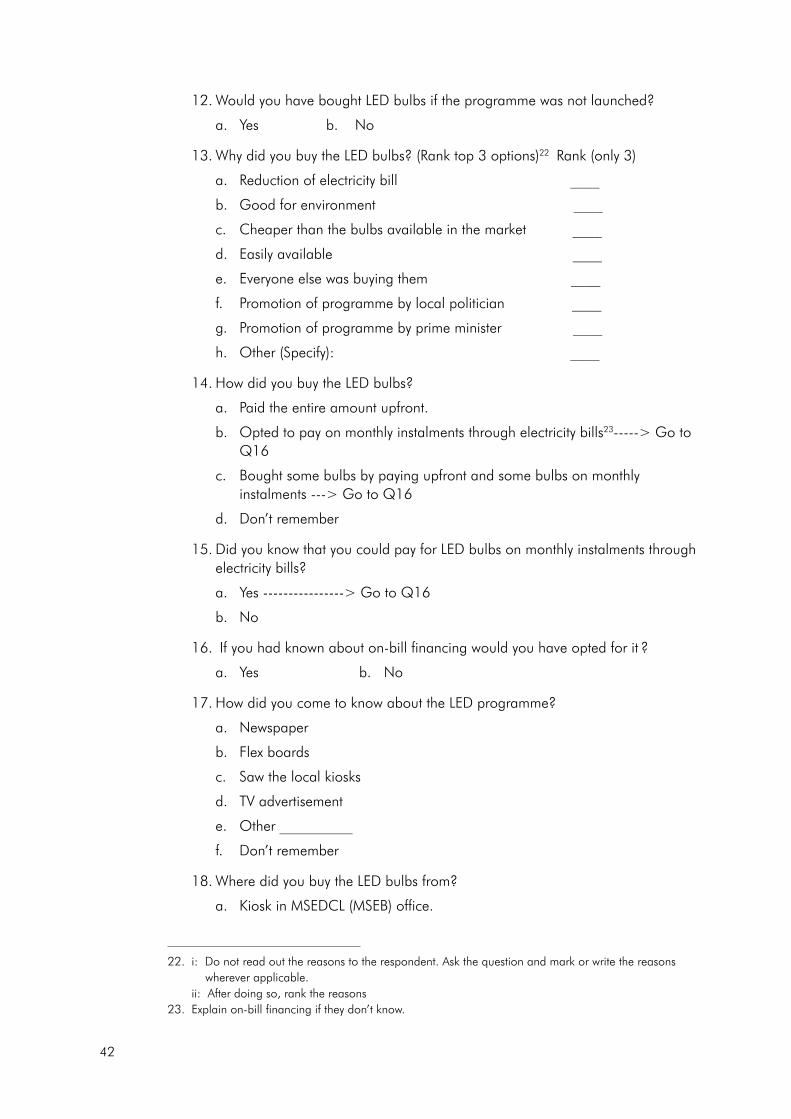
42
12. Would you have bought LED bulbs if the programme was not launched?
a. Yes b. No
13. Why did you buy the LED bulbs? (Rank top 3 options)22 Rank (only 3)
a. Reduction of electricity bill ____
b. Good for environment ____
c. Cheaper than the bulbs available in the market ____
d. Easily available ____
e. Everyone else was buying them ____
f. Promotion of programme by local politician ____
g. Promotion of programme by prime minister ____
h. Other (Specify): ____
14. How did you buy the LED bulbs?
a. Paid the entire amount upfront.
b. Opted to pay on monthly instalments through electricity bills23-----> Go to Q16
c. Bought some bulbs by paying upfront and some bulbs on monthly instalments ---> Go to Q16
d. Don’t remember
15. Did you know that you could pay for LED bulbs on monthly instalments through electricity bills?
a. Yes ----------------> Go to Q16
b. No
16. If you had known about on-bill financing would you have opted for it ?
a. Yes b. No
17. How did you come to know about the LED programme?
a. Newspaper
b. Flex boards
c. Saw the local kiosks
d. TV advertisement
e. Other __________
f. Don’t remember
18. Where did you buy the LED bulbs from?
a. Kiosk in MSEDCL (MSEB) office.
22. i: Do not read out the reasons to the respondent. Ask the question and mark or write the reasons wherever applicable.
ii: After doing so, rank the reasons23. Explain on-bill financing if they don’t know.
43
b. Local kiosks in neighbourhood
c. Don’t remember
19. What documents did you submit to buy the LED bulbs?
a. Only electricity bill
b. Only identity proof
c. Both
d. No documents
e. Don’t remember
20. Did you get a bill for your purchase?
a. Yes
b. No
c. Don’t remember
21. Were you given information on the installation or warranty of the bulbs?
a. Yes
b. No
c. Don’t remember
Usage of LED bulbs
22. What is the current status of LED bulbs bought under UJALA?
a. In use ___
b. In reserve ___ --------> Ask Q23 if non-zero
c. Broken ___
d. Defective ______ ---------->Ask Q24 if non-zero
e. Gave to others/disposed _____
23. Why did you store the bulbs?
a. Waiting for the existing bulbs to burn out.
b. Dissatisfied with the performance of the LED bulbs
c. Unsure of how to use the bulbs
24. Why didn’t you replace the bulbs? (In case of currently defective bulbs)
a. It was not that important to me
b. Tried to, but was unsuccessful. Reasons:
i. Not satisfied with helpline
ii. Not satisfied with local kiosk
iii. Not satisfied with MSEDCL office
25. How many bulbs did you replace? _______
a. What did you do?

44
i. Called the helpline on the LED bulb box
ii. Went to the local kiosk from where we bought the bulb
iii. Went to the MSEDCL (MSEB) office
b. Were you satisfied with the response?
i. Yes
ii. No
26. Please fill in the table for the bulbs in use. (For up to 10 LED bulbs).24
LED bulb No.
Company Lighting Option Replaced25 Details Room
Average daily usage in evening peak (6-10 pm) (hrs)26
Average Daily Usage27 (hrs)
1
2
3
4
5
6
7
8
9
10
27. What did you do with the old bulbs/tube-lights?
a. Stored them
b. Discarded them
c. Gave them to someone
d. Used them in some other socket
24. Ask these questions only if the household has used LED bulbs bought under the programme.25. Surveyor will carry a picture of all the replacements so that people can identify the replacements26. Usage for a typical day27. Total usage including the peak time usage

45
Consumer perception of performance of bulbs28
28. Are you satisfied with the LED bulbs?
a. Yes
b. Neutral
c. No -----------------> Go to Q.29
29. Justify your response
30. Why are you not satisfied with the LED bulbs?
a. The light is too bright
b. The light is not bright enough
c. Aesthetic reasons
d. Other (Specify):
31. Do you think that your electricity bill has reduced with the use of LED bulbs29?
a. Yes b. No c. Can’t say
32. If one of the installed LED bulbs stops working what will you replace it with?
a. Incandescent bulb
b. CFL bulb
c. LED bulb
d. Ordinary tube light
e. LED tube light
f. Can’t say
Programme’s impact on the consumer behaviour
33. Do you keep the LED bulbs on for longer than usual because they are LEDs?
a. Yes b. No c. Maybe
34. Have you done any of the below after you bought LED bulbs (check all that apply)
a. We recommended others to buy LED bulbs.
b. We bought LED bulbs and LED tube-lights from market
c. We replaced an old appliance with an energy efficient appliance
d. None of the above
28. Ask these questions only if the household has used LED bulbs bought under the programme.29. In case the consumer says that the bill has not been reduced but units have reduced, mark ‘Yes’.30. Number in blanks
46
Impact of LED bulbs usage on monthly bills
35. What are the other lighting options used in the house30?
a. Incandescent bulbs ___
b. CFLs ___
c. Tube-lights (T5, 2ft) ___
d. Tube-lights (T5, 4ft) ___
e. Tube-lights (T8, 2ft) ___
f. Tube-lights (T8, 4ft) ___
g. Tube-lights (T12, 2ft) ___
h. Tube-lights (T12, 4ft) ___
i. LED tube-lights ___
j. LED bulbs ___
k. LED lighting strips ___
Consumer perception of performance of programme:
36. How would you rate this programme?
a. Good
b. Satisfactory
c. Bad
37. Justify your response
38. Would you be ready to replace your existing fan with a new fan under such a programme?
i. Yes
ii. No
39. Justify your response
47
Surveys of retail outlets selling electrical goods were conducted in Lucknow and Puducherry. In each city the central areas were identified and electrical goods shops were chosen in those areas. In Lucknow 100 retailers were surveyed, while 50 retailers were surveyed in Puducherry.
Retailer Survey Questionnaire
1. Name of the shop
2. Type of shop:
a. Small shop (less than 5 people working)
b. Big shop (more than 5 people working)
c. Electronics shop in Mall
3. Area name:
4. Area category: Urban/rural
5. Has there been a change in number of consumers enquiring about LED bulbs in last year?
a. Significantly increased
b. Somewhat increased
c. No change
d. Somewhat decreased
e. Significantly decreased
6. Has there been a change in number of consumers buying LED bulbs in last year?
a. Significantly increased
b. Somewhat increased
i. No change
c. Somewhat decreased
d. Significantly decreased
7. What is the most common wattage of the LED bulbs sold? (Rank them)
a. Less than 5W -----
b. 7W -----
c. 9W -----
d. More than 10W -----
8. What is the range of price and warranty of LED bulbs available in following wattages?
Annexure 2 : Retailer surveys
48
Watts Min (Rs.) Max (Rs.) Average warranty (years)
7W
9W
9. How much money does an LED bulb save in a year if used instead of a 60W incandescent bulb31?
a. About Rs. ___
b. Don’t know
10. Has there been a change in number of consumers buying LED tube-lights in last year?
a. Significantly increased
b. Somewhat increased
c. No change
d. Somewhat decreased
e. Significantly decreased
11. Has there been a change in number of consumers buying CFL bulbs in last year?
a. Significantly increased
b. Somewhat increased
c. No change
d. Somewhat decreased
e. Significantly decreased
12. Has there been a change in number of consumers buying incandescent bulbs in last year?
a. Significantly increased
b. Somewhat increased
c. No change
d. Somewhat decreased
e. Significantly decreased
13. Why should a consumer buy from a shop rather than the government programme? (Qualitative)
14. Do you think the government should continue the LED programme?
a. Yes
b. No
31. If asked, tell them to assume the tariff of Rs. 5/unit

49
c. Does not matter
15. Justification of the above response (Qualitative)
Kiosk survey
In addition to the retailer survey, eleven UJALA bulb distribution kiosks were surveyed in Pune to assess whether bulbs were being distributed in accordance to programme guidelines. The operators of the kiosks were not formally interviewed - instead, surveyors posed as customers. The questionnaire acted more as a checklist than an interview questionnaire.
1. Area:
2. Number of people at the kiosk: ___
3. What documents are asked for?
a. Identity proof
b. Electricity bill
c. Both
d. None
4. How many can I buy by paying upfront?
a. Less than 10
b. As many as I want.
5. Is anyone recording the consumer number?
6. Does anyone tell you about how it should be used? i.e. instructions should be given to replace ICBs which are used for long periods of time.
7. Do they know about savings from the LED bulbs?
8. Are you given a bill?
9. Do they take back defective LED bulbs?
10. Are they selling anything other than LED bulbs?
50
Where otherwise not mentioned, these process details are as per the tender for the pan-India supply of 9W LED bulbs, issued on Nov 28th, 2016,32 and the EESL website33.
EESL issues online tenders requesting proposals from LED bulb manufacturers to supply bulbs for UJALA. The suppliers are selected through online reverse auctions. Up to five bidders are selected (though this quantity could vary with each tender). The bidder offering the lowest price is assured of a contract for at least 30% of the total quantity of bulbs to be supplied, provided that the supplier’s bid is for 30% of the total quantity of bulbs or more. The bidder offering the second lowest price is assured of a contract for at least 25% of the total quantity of bulbs to be supplied, the bidder offering the third lowest price is assured of a contract for at least 20% of the total quantity of bulbs, and so on until the bidder offering the fifth lowest price is assured of a contract for at least 10% of the total quantity of bulbs. 20% of the total quantity of bulbs to be supplied is reserved for a consortium of Micro, Small and Medium Enterprises (MSMEs) registered with the National Small Industries Corporation (NSIC), provided that the consortium’s quoted price is within the price band of the lowest bidder’s price plus 15%, and that the offer meets all the terms and conditions of the tender. Small and medium enterprises (SMEs) are also allowed to participate directly in the bidding process without having to be part of a consortium.
Bidders are required to submit a techno-commercial as well as a price bid. The techno-commercial bid consists of documentary evidence of the bidder’s qualifications to perform the contract as specified in the tender. Only the price bids of those bidders who satisfy the techno-commercial requirements are considered.
Preference is given to domestically manufactured LED bulbs, in keeping with the Policy for Preference to Domestically Manufactured Electronic Products in Government Procurement, issued by the Ministry of Electronics and Information Technology in 2013. The policy specifies that for LED products procured by the government, including products for government schemes, 50% of the component parts of the goods must be manufactured domestically.34
Annexure 3 : Bidding requirements for manufacturers of LED bulbs
32. Energy Efficiency Services Limited. (2016a). Detailed Invitation for Bids (IFB) for Design, Manufacture & Supply of Self-ballasted 9 Watt LED Bulbs on Pan- India basis, with 3 Years’ Warranty & Other Related Works. NIT/Bid Document No.: EESL/06/2016-17/Supply-9W LED Bulbs/1617039. Retrieved from https://eesl.eproc.in/ProductEESL/publicDash
33. Energy Efficiency Services Limited. (2016). E-Tendering. Retrieved December 16, 2016, from http://www.eeslindia.org/User_Panel/UserView.aspx?TypeID=1168
34. Ministry of Electronics and Information Technology, India. Policy for Preference to Domestically Manufactured Electronic Products in Government Procurement. Notification No. 33 (3)/2013-IPHW) (2013). Retrieved from http://www.keralapost.gov.in/Downloads/DMEPS.pdf
51
Successful bidders are required to submit an ‘interchangeability certificate’ for the bulbs supplied by them for UJALA as well as in the open market. This certificate states that if, due to a change in technology, the supplied bulb(s) is not available during the warranty period, the improved bulb can be provided as a replacement.
Qualifying requirements for suppliers:
1. The bidder is required to have an ISO certified manufacturing facility in India.
2. The bidder should either have a presence in the lighting industry for a minimum period of five years or in LED light/luminaire manufacturing for the last two years before the release of the tender.
3. The bidder should have experience of having manufactured and supplied a minimum quantity of 33 lakh electric lamps within the last 5 years, or 6.7 lakh LED bulbs either in India or through exports within the last two years.
4. The bidder is required to have their own brand of street lights / LED bulbs in the national or global market. The brand certificate should be at least one year old, considering the date of bid submission as a reference date. In case of a non-NSIC consortium, only the lead bidder’s logo will be considered. In case of an NSIC consortium, the members need to agree and accept one common brand, or provide individual logos with the NSIC logo.
5. The bulbs should be certified with a rating of at least three stars from BEE, or higher.
6. The bidder is required to provide a three-year replacement warranty for the bulbs. This warranty only covers technical damages and does not cover physical damages.
7. The bidder should have an average annual turnover (ATO) of more than 57 crores in the lighting industry in the last three financial years (2013–14 to 2015–16). In case of a consortium, the combined ATO of all the members shall be considered. However, each partner must meet a minimum of 25% of the ATO requirements, and at least one of the partners must meet a minimum of 40% of these requirements.
8. The bidder should also have been profitable in at least two of the last three financial years. One of the profitable years should have been the last financial year. For a consortium, each partner is required to fulfill the above condition individually.
9. The net worth of a consortium as on the last day of the preceding financial year (2015–16) must not be less than 100% of the paid-up share capital. For a consortium, each partner must fulfil the above condition individually.
10. The net worth of a consortium as on the last day of the preceding financial year cannot be less than 100% of the paid-up share capital. Each partner is required to fulfil the above condition individually.
11. In case of an NSIC-led Consortium, the primary responsibility of supply, quality of LED bulbs and all other conditions of the contract rests with the NSIC, and EESL will coordinate only with the NSIC. A consortium of a maximum of three members, including NSIC, is allowed.
52
UJALA bulbs are distributed through a network of distribution agencies hired by EESL. These agencies are responsible for creating awareness as well as distribution. As per the Standard Operating Procedures for Awareness & Distribution Agency in DELP, a document issued by EESL that specifies the appointment process of distribution agencies and provides guidelines for implementation, distribution vendors are to be selected through a competitive bidding process.35
After the bidding process is over and an agency has been selected, EESL, in consultation with the DISCOMs and the agency, is to chart out a distribution plan. The distribution agency is responsible for locating warehousing facilities for the storage of the bulbs. Distributors may hire sub-distributors to supply bulbs in areas where the former do not operate. The Standard Operating Procedures state that door-to-door delivery may also be provided for customers who have paid for the bulbs upfront. However, no instance of any agency distributing bulbs in this manner has been encountered in the study so far. The sole responsibility for any issue that arises during distribution lies with the primary distribution agency.
EESL is to then conduct a meeting with the division heads of the DISCOMs to brief them on the distribution processes and the scheme. The role of DISCOMS is limited to granting permission for the temporary usage of their premises to set up distribution kiosks, if feasible, and granting assistance for coordinating distribution activities as well as providing temporary electricity connections.
Distribution counters may be set up at local DISCOM offices, retail outlets, resident association offices, schools, or at any other suitable locations. Every distribution counter is to be run by a four-member team of functionaries headed by a Kiosk Supervisor. A Distribution Team Supervisor is put in charge of a fixed number of kiosks. Distribution Team Supervisors report to a coordinator from EESL who is in charge of distribution.
The roles and responsibilities of the various functionaries are as follows:
1. Storage Supervisor: Responsible for all functions related to the storage of bulbs as well as their dispatch to distribution counters. Also responsible for inventory control, storage of receipts and other documents collected from consumers, and the record of defective LEDs. The storage supervisor is to ensure that the LED stock is kept ready a day in advance of allocation. Reports to the EESL Coordinator.
2. Distribution Team Supervisor: Responsible for ensuring that the teams operating the various distribution kiosks are performing the functions allocated to them. He/she is to coordinate with the EESL coordinator on a daily basis. The
Annexure 4 : UJALA distribution agencies
35. Energy Efficiency Services Limited. (2016). Standard Operating Procedures for Awareness & Distribution Agency in DELP. Retrieved from http://www.eeslindia.org/User_Panel/News.aspx?Value=urVp696b1L6i81zvCtLY916NDHqdE%2BuwirQeNpLF7Ky9htDI11%2FTCHBs9J5zkR9L

53
supervisor’s duties include the allocation of a stock of LED bulbs to each counter, the forecasting of demand for bulbs and intimation of the stock required to the Storage Supervisor, and the submission of a summary of daily distribution reports to the EESL. The supervisor’s duties also include drawing up the tally of the number of bulbs distributed, money collected and filled forms at the end of the day, and taking action regarding any discrepancies.
Members of teams at distribution counters:
1. Kiosk Supervisor: Responsible for the overall management and accounting of the distribution counter, and for ensuring that the counter effectively meets its daily target. Reports to the Distribution Team Supervisor.
2. Data Operator: Responsible for maintaining electronic records of the sale of LEDs and the return or bulbs that are defective or replaced. Also required to prepare a daily distribution report and submit a summary to the Kiosk Supervisor.
3. Accountant: Responsible for collecting payment for the bulbs.
4. Deed Agent and Bulb Giver: Responsible for providing hard copies of the receipts for the bulbs. The terms and conditions of the programme that every consumer has to give consent to when he/she purchases the bulbs are printed on the receipt.
Each distribution counter is required to have facilities to test whether a bulb is in working condition or not, in case a consumer specifically requests that this be done. The website for the programme (http://www.ujala.gov.in) is updated with data on the sale of bulbs every 30 seconds.
According to a tender issued in 2015 for distribution vendors in Nagpur and Allahabad36, the distribution agency is responsible for the following outputs to be submitted to EESL:
1. Registration and Distribution Allocation Chart to be submitted five days before the start dates for registration and distribution
2. A consolidated report of distribution operations on a daily basis
3. Daily SMSs to be sent to the local EESL/DISCOM representative at the end of the day stating the total number of participating households and LEDs distributed during the day. The agency is also required to send a daily SMS on the number and locations of counters being set up for the day’s distribution.
4. Storage of receipts and documents collected from consumers. These are to be stored serial wise / area wise / kiosk wise.
5. Within three days of the completion of distribution, the agency is to provide an updated electronic distribution database.
6. A record of all faulty LEDs collected from the consumers or from the field during the distribution period.
36. Energy Efficiency Services Limited. (2015). NIT/Bid Document No.: EESL/06/2015-16/DELP-NGP & ALD/. New Delhi. Retrieved from http://www.eeslindia.org/writereaddata/TenderforNagpurandAlahaba.pdf
54
7. The amount collected from consumers is to be deposited into a bank account in the EESL’s name and the bank challan / receipts are to be furnished as a proof of deposit.
8. The agency is required to submit an LED Distribution Summary Report whenever requested to do so by EESL.
9. An attendance sheet of employees to be submitted on a daily basis
10. An Inventory Management Report
11. A Fortnightly Status Report of awareness and outreach activity
As an incentive to agencies to meet their distribution targets, EESL pays the agency for 10% of the registration, awareness and distribution cost per LED for the LED bulbs registered / distributed in that particular area, if the agency completes the city / district wide target within 80% of the target time.
1. Submission to Andhra Pradesh Electricity Regulatory Commission (APERC) on the Agricultural DSM Projects (2017) http://www.prayaspune.org/peg/publications/item/350.html
2. Residential Electricity Consumption in India: What do we know? (2016) http://www.prayaspune.org/peg/publications/item/331.html
3. How Much Energy Do We Need: Towards End-Use Based Estimation For Decent Living (2015) http://www.prayaspune.org/peg/publications/item/298
4. Data Gaps in India’s Energy Sector (2015) http://www.prayaspune.org/peg/publications/item/313
5. An Assessment of Energy Data Management in India (2014) http://www.prayaspune.org/peg/publications/item/280
6. SEEP Guidebook (2013) http://www.prayaspune.org/peg/publications/item/241
7. To Buy or Not to Buy or Can be ‘Nudged’ to Buy (2012 ) http://www.prayaspune.org/peg/publications/item/180
8. Appliance Ownership in India: Evidence from NSSO Household Expenditure Surveys 2004-05 and 2009-10 (2012)
http://www.prayaspune.org/peg/publications/item/183
9. Improving Energy Efficiency In India: Need For A Targeted And Tailored Strategy (2012) http://www.prayaspune.org/peg/publications/item/268
10. Discount Rates and Energy Efficiency (2012) http://www.prayaspune.org/peg/publications/item/181.html
Related Publications of Prayas (Energy Group)

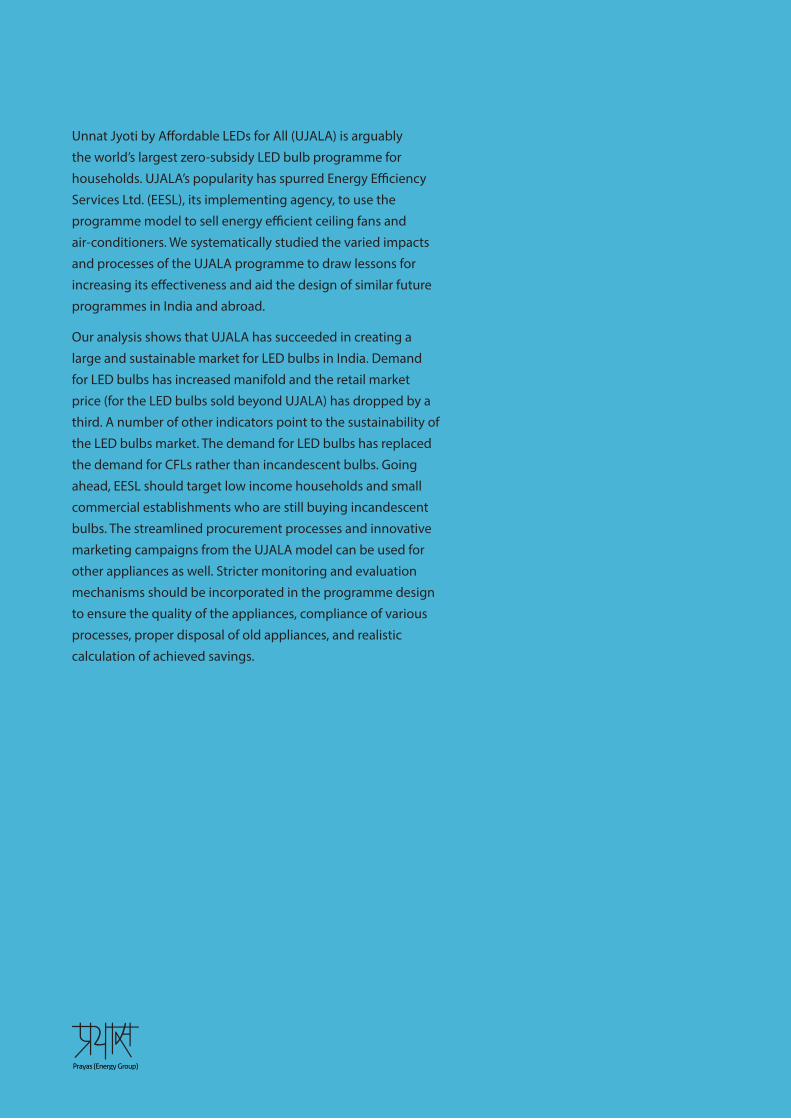
Unnat Jyoti by Affordable LEDs for All (UJALA) is arguably
the world’s largest zero-subsidy LED bulb programme for
households. UJALA’s popularity has spurred Energy Efficiency
Services Ltd. (EESL), its implementing agency, to use the
programme model to sell energy efficient ceiling fans and
air-conditioners. We systematically studied the varied impacts
and processes of the UJALA programme to draw lessons for
increasing its effectiveness and aid the design of similar future
programmes in India and abroad.
Our analysis shows that UJALA has succeeded in creating a
large and sustainable market for LED bulbs in India. Demand
for LED bulbs has increased manifold and the retail market
price (for the LED bulbs sold beyond UJALA) has dropped by a
third. A number of other indicators point to the sustainability of
the LED bulbs market. The demand for LED bulbs has replaced
the demand for CFLs rather than incandescent bulbs. Going
ahead, EESL should target low income households and small
commercial establishments who are still buying incandescent
bulbs. The streamlined procurement processes and innovative
marketing campaigns from the UJALA model can be used for
other appliances as well. Stricter monitoring and evaluation
mechanisms should be incorporated in the programme design
to ensure the quality of the appliances, compliance of various
processes, proper disposal of old appliances, and realistic
calculation of achieved savings.