Odor Representations in Olfactory Cortex: Distributed Rate ...
38
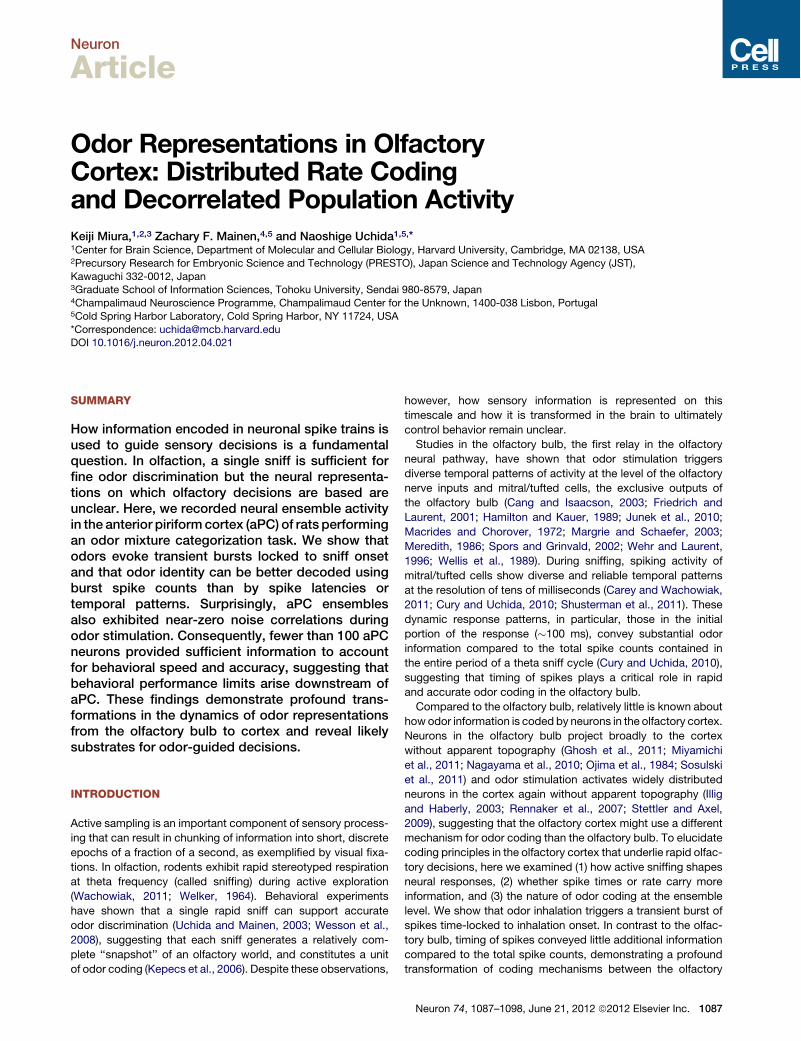
Neuron Article Odor Representations in Olfactory Cortex: Distributed Rate Coding and Decorrelated Population Activity Keiji Miura, 1,2,3 Zachary F. Mainen, 4,5 and Naoshige Uchida 1,5, * 1 Center for Brain Science, Department of Molecular and Cellular Biology, Harvard University, Cambridge, MA 02138, USA 2 Precursory Research for Embryonic Science and Technology (PRESTO), Japan Science and Technology Agency (JST), Kawaguchi 332-0012, Japan 3 Graduate School of Information Sciences, Tohoku University, Sendai 980-8579, Japan 4 Champalimaud Neuroscience Programme, Champalimaud Center for the Unknown, 1400-038 Lisbon, Portugal 5 Cold Spring Harbor Laboratory, Cold Spring Harbor, NY 11724, USA *Correspondence: [email protected] DOI 10.1016/j.neuron.2012.04.021 SUMMARY How information encoded in neuronal spike trains is used to guide sensory decisions is a fundamental question. In olfaction, a single sniff is sufficient for fine odor discrimination but the neural representa- tions on which olfactory decisions are based are unclear. Here, we recorded neural ensemble activity in the anterior piriform cortex (aPC) of rats performing an odor mixture categorization task. We show that odors evoke transient bursts locked to sniff onset and that odor identity can be better decoded using burst spike counts than by spike latencies or temporal patterns. Surprisingly, aPC ensembles also exhibited near-zero noise correlations during odor stimulation. Consequently, fewer than 100 aPC neurons provided sufficient information to account for behavioral speed and accuracy, suggesting that behavioral performance limits arise downstream of aPC. These findings demonstrate profound trans- formations in the dynamics of odor representations from the olfactory bulb to cortex and reveal likely substrates for odor-guided decisions. INTRODUCTION Active sampling is an important component of sensory process- ing that can result in chunking of information into short, discrete epochs of a fraction of a second, as exemplified by visual fixa- tions. In olfaction, rodents exhibit rapid stereotyped respiration at theta frequency (called sniffing) during active exploration (Wachowiak, 2011; Welker, 1964). Behavioral experiments have shown that a single rapid sniff can support accurate odor discrimination (Uchida and Mainen, 2003; Wesson et al., 2008), suggesting that each sniff generates a relatively com- plete ‘‘snapshot’’ of an olfactory world, and constitutes a unit of odor coding (Kepecs et al., 2006). Despite these observations, however, how sensory information is represented on this timescale and how it is transformed in the brain to ultimately control behavior remain unclear. Studies in the olfactory bulb, the first relay in the olfactory neural pathway, have shown that odor stimulation triggers diverse temporal patterns of activity at the level of the olfactory nerve inputs and mitral/tufted cells, the exclusive outputs of the olfactory bulb (Cang and Isaacson, 2003; Friedrich and Laurent, 2001; Hamilton and Kauer, 1989; Junek et al., 2010; Macrides and Chorover, 1972; Margrie and Schaefer, 2003; Meredith, 1986; Spors and Grinvald, 2002; Wehr and Laurent, 1996; Wellis et al., 1989). During sniffing, spiking activity of mitral/tufted cells show diverse and reliable temporal patterns at the resolution of tens of milliseconds (Carey and Wachowiak, 2011; Cury and Uchida, 2010; Shusterman et al., 2011). These dynamic response patterns, in particular, those in the initial portion of the response (100 ms), convey substantial odor information compared to the total spike counts contained in the entire period of a theta sniff cycle (Cury and Uchida, 2010), suggesting that timing of spikes plays a critical role in rapid and accurate odor coding in the olfactory bulb. Compared to the olfactory bulb, relatively little is known about how odor information is coded by neurons in the olfactory cortex. Neurons in the olfactory bulb project broadly to the cortex without apparent topography (Ghosh et al., 2011; Miyamichi et al., 2011; Nagayama et al., 2010; Ojima et al., 1984; Sosulski et al., 2011) and odor stimulation activates widely distributed neurons in the cortex again without apparent topography (Illig and Haberly, 2003; Rennaker et al., 2007; Stettler and Axel, 2009), suggesting that the olfactory cortex might use a different mechanism for odor coding than the olfactory bulb. To elucidate coding principles in the olfactory cortex that underlie rapid olfac- tory decisions, here we examined (1) how active sniffing shapes neural responses, (2) whether spike times or rate carry more information, and (3) the nature of odor coding at the ensemble level. We show that odor inhalation triggers a transient burst of spikes time-locked to inhalation onset. In contrast to the olfac- tory bulb, timing of spikes conveyed little additional information compared to the total spike counts, demonstrating a profound transformation of coding mechanisms between the olfactory Neuron 74, 1087–1098, June 21, 2012 ª2012 Elsevier Inc. 1087
-
Upload
khangminh22 -
Category
Documents
-
view
0 -
download
0
Transcript of Odor Representations in Olfactory Cortex: Distributed Rate ...
Neuron
Article
Odor Representations in OlfactoryCortex: Distributed Rate Codingand Decorrelated Population ActivityKeiji Miura,1,2,3 Zachary F. Mainen,4,5 and Naoshige Uchida1,5,*1Center for Brain Science, Department of Molecular and Cellular Biology, Harvard University, Cambridge, MA 02138, USA2Precursory Research for Embryonic Science and Technology (PRESTO), Japan Science and Technology Agency (JST),Kawaguchi 332-0012, Japan3Graduate School of Information Sciences, Tohoku University, Sendai 980-8579, Japan4Champalimaud Neuroscience Programme, Champalimaud Center for the Unknown, 1400-038 Lisbon, Portugal5Cold Spring Harbor Laboratory, Cold Spring Harbor, NY 11724, USA*Correspondence: [email protected] 10.1016/j.neuron.2012.04.021
SUMMARY
How information encoded in neuronal spike trains isused to guide sensory decisions is a fundamentalquestion. In olfaction, a single sniff is sufficient forfine odor discrimination but the neural representa-tions on which olfactory decisions are based areunclear. Here, we recorded neural ensemble activityin the anterior piriformcortex (aPC) of rats performingan odor mixture categorization task. We show thatodors evoke transient bursts locked to sniff onsetand that odor identity can be better decoded usingburst spike counts than by spike latencies ortemporal patterns. Surprisingly, aPC ensemblesalso exhibited near-zero noise correlations duringodor stimulation. Consequently, fewer than 100 aPCneurons provided sufficient information to accountfor behavioral speed and accuracy, suggesting thatbehavioral performance limits arise downstream ofaPC. These findings demonstrate profound trans-formations in the dynamics of odor representationsfrom the olfactory bulb to cortex and reveal likelysubstrates for odor-guided decisions.
INTRODUCTION
Active sampling is an important component of sensory process-ing that can result in chunking of information into short, discreteepochs of a fraction of a second, as exemplified by visual fixa-tions. In olfaction, rodents exhibit rapid stereotyped respirationat theta frequency (called sniffing) during active exploration(Wachowiak, 2011; Welker, 1964). Behavioral experimentshave shown that a single rapid sniff can support accurateodor discrimination (Uchida and Mainen, 2003; Wesson et al.,2008), suggesting that each sniff generates a relatively com-plete ‘‘snapshot’’ of an olfactory world, and constitutes a unitof odor coding (Kepecs et al., 2006). Despite these observations,
however, how sensory information is represented on thistimescale and how it is transformed in the brain to ultimatelycontrol behavior remain unclear.Studies in the olfactory bulb, the first relay in the olfactory
neural pathway, have shown that odor stimulation triggersdiverse temporal patterns of activity at the level of the olfactorynerve inputs and mitral/tufted cells, the exclusive outputs ofthe olfactory bulb (Cang and Isaacson, 2003; Friedrich andLaurent, 2001; Hamilton and Kauer, 1989; Junek et al., 2010;Macrides and Chorover, 1972; Margrie and Schaefer, 2003;Meredith, 1986; Spors and Grinvald, 2002; Wehr and Laurent,1996; Wellis et al., 1989). During sniffing, spiking activity ofmitral/tufted cells show diverse and reliable temporal patternsat the resolution of tens of milliseconds (Carey and Wachowiak,2011; Cury and Uchida, 2010; Shusterman et al., 2011). Thesedynamic response patterns, in particular, those in the initialportion of the response (!100 ms), convey substantial odorinformation compared to the total spike counts contained inthe entire period of a theta sniff cycle (Cury and Uchida, 2010),suggesting that timing of spikes plays a critical role in rapidand accurate odor coding in the olfactory bulb.Compared to the olfactory bulb, relatively little is known about
how odor information is coded by neurons in the olfactory cortex.Neurons in the olfactory bulb project broadly to the cortexwithout apparent topography (Ghosh et al., 2011; Miyamichiet al., 2011; Nagayama et al., 2010; Ojima et al., 1984; Sosulskiet al., 2011) and odor stimulation activates widely distributedneurons in the cortex again without apparent topography (Illigand Haberly, 2003; Rennaker et al., 2007; Stettler and Axel,2009), suggesting that the olfactory cortex might use a differentmechanism for odor coding than the olfactory bulb. To elucidatecoding principles in the olfactory cortex that underlie rapid olfac-tory decisions, here we examined (1) how active sniffing shapesneural responses, (2) whether spike times or rate carry moreinformation, and (3) the nature of odor coding at the ensemblelevel. We show that odor inhalation triggers a transient burst ofspikes time-locked to inhalation onset. In contrast to the olfac-tory bulb, timing of spikes conveyed little additional informationcompared to the total spike counts, demonstrating a profoundtransformation of coding mechanisms between the olfactory
Neuron 74, 1087–1098, June 21, 2012 ª2012 Elsevier Inc. 1087
bulb and cortex. Furthermore, odor stimulation reduced corre-lated noise among neurons, which facilitated the efficiency ofpopulation coding in the olfactory cortex.
RESULTS
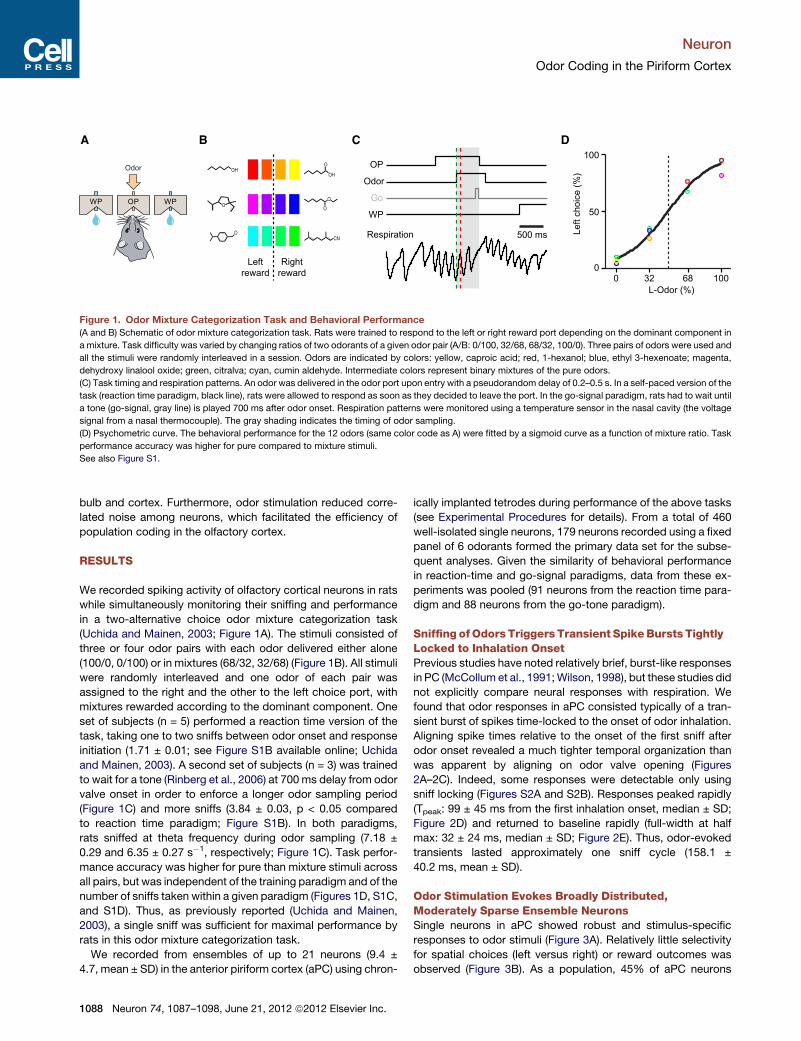
We recorded spiking activity of olfactory cortical neurons in ratswhile simultaneously monitoring their sniffing and performancein a two-alternative choice odor mixture categorization task(Uchida and Mainen, 2003; Figure 1A). The stimuli consisted ofthree or four odor pairs with each odor delivered either alone(100/0, 0/100) or in mixtures (68/32, 32/68) (Figure 1B). All stimuliwere randomly interleaved and one odor of each pair wasassigned to the right and the other to the left choice port, withmixtures rewarded according to the dominant component. Oneset of subjects (n = 5) performed a reaction time version of thetask, taking one to two sniffs between odor onset and responseinitiation (1.71 ± 0.01; see Figure S1B available online; Uchidaand Mainen, 2003). A second set of subjects (n = 3) was trainedto wait for a tone (Rinberg et al., 2006) at 700 ms delay from odorvalve onset in order to enforce a longer odor sampling period(Figure 1C) and more sniffs (3.84 ± 0.03, p < 0.05 comparedto reaction time paradigm; Figure S1B). In both paradigms,rats sniffed at theta frequency during odor sampling (7.18 ±0.29 and 6.35 ± 0.27 s"1, respectively; Figure 1C). Task perfor-mance accuracy was higher for pure than mixture stimuli acrossall pairs, but was independent of the training paradigm and of thenumber of sniffs taken within a given paradigm (Figures 1D, S1C,and S1D). Thus, as previously reported (Uchida and Mainen,2003), a single sniff was sufficient for maximal performance byrats in this odor mixture categorization task.
We recorded from ensembles of up to 21 neurons (9.4 ±4.7, mean ± SD) in the anterior piriform cortex (aPC) using chron-
ically implanted tetrodes during performance of the above tasks(see Experimental Procedures for details). From a total of 460well-isolated single neurons, 179 neurons recorded using a fixedpanel of 6 odorants formed the primary data set for the subse-quent analyses. Given the similarity of behavioral performancein reaction-time and go-signal paradigms, data from these ex-periments was pooled (91 neurons from the reaction time para-digm and 88 neurons from the go-tone paradigm).
Sniffing ofOdors Triggers Transient SpikeBursts TightlyLocked to Inhalation OnsetPrevious studies have noted relatively brief, burst-like responsesin PC (McCollum et al., 1991;Wilson, 1998), but these studies didnot explicitly compare neural responses with respiration. Wefound that odor responses in aPC consisted typically of a tran-sient burst of spikes time-locked to the onset of odor inhalation.Aligning spike times relative to the onset of the first sniff afterodor onset revealed a much tighter temporal organization thanwas apparent by aligning on odor valve opening (Figures2A–2C). Indeed, some responses were detectable only usingsniff locking (Figures S2A and S2B). Responses peaked rapidly(Tpeak: 99 ± 45 ms from the first inhalation onset, median ± SD;Figure 2D) and returned to baseline rapidly (full-width at halfmax: 32 ± 24 ms, median ± SD; Figure 2E). Thus, odor-evokedtransients lasted approximately one sniff cycle (158.1 ±40.2 ms, mean ± SD).
Odor Stimulation Evokes Broadly Distributed,Moderately Sparse Ensemble NeuronsSingle neurons in aPC showed robust and stimulus-specificresponses to odor stimuli (Figure 3A). Relatively little selectivityfor spatial choices (left versus right) or reward outcomes wasobserved (Figure 3B). As a population, 45% of aPC neurons
500 ms
OP
Odor
Go
WP
Respiration
Leftreward
Rightreward
Left
choi
ce (%
)
100
50
0
L-Odor (%)0 32 68 100
OHO
OH
OO
O
OCN
OP WPWP
Odor
A B C D
Figure 1. Odor Mixture Categorization Task and Behavioral Performance(A and B) Schematic of odor mixture categorization task. Rats were trained to respond to the left or right reward port depending on the dominant component in
a mixture. Task difficulty was varied by changing ratios of two odorants of a given odor pair (A/B: 0/100, 32/68, 68/32, 100/0). Three pairs of odors were used and
all the stimuli were randomly interleaved in a session. Odors are indicated by colors: yellow, caproic acid; red, 1-hexanol; blue, ethyl 3-hexenoate; magenta,
dehydroxy linalool oxide; green, citralva; cyan, cumin aldehyde. Intermediate colors represent binary mixtures of the pure odors.
(C) Task timing and respiration patterns. An odor was delivered in the odor port upon entry with a pseudorandom delay of 0.2–0.5 s. In a self-paced version of the
task (reaction time paradigm, black line), rats were allowed to respond as soon as they decided to leave the port. In the go-signal paradigm, rats had to wait until
a tone (go-signal, gray line) is played 700 ms after odor onset. Respiration patterns were monitored using a temperature sensor in the nasal cavity (the voltage
signal from a nasal thermocouple). The gray shading indicates the timing of odor sampling.
(D) Psychometric curve. The behavioral performance for the 12 odors (same color code as A) were fitted by a sigmoid curve as a function of mixture ratio. Task
performance accuracy was higher for pure compared to mixture stimuli.
See also Figure S1.
Neuron
Odor Coding in the Piriform Cortex
1088 Neuron 74, 1087–1098, June 21, 2012 ª2012 Elsevier Inc.

were activated by at least one of the six odors tested while 28%were activated by two or more (Figures 3C, 3D, and S3; p < 0.05,Wilcoxon rank-sum test). Conversely, each odor caused signifi-cant responses in 16.5% ± 3.1% of aPC neurons (mean ± SD,n = 6 odors, 10.3% excitatory, 6.2% inhibitory). The probabilityof response of a piriform neuron to an odor was well-fit bya binomial distribution with an extra allowance for nonrespond-ing neurons (Figure 3D). We calculated a population sparsenessof 0.41 and a lifetime sparseness of 0.61 (see ExperimentalProcedures), somewhat lower than previously observed in aPCof anesthetized rats (Poo and Isaacson, 2009). Therefore, aPCresponses were observed in broadly distributed, moderatelysparse neural populations, largely consistent with previousstudies (Poo and Isaacson, 2009; Rennaker et al., 2007; Stettlerand Axel, 2009; Zhan and Luo, 2010).
Spike Counts Carried More Reliable and RapidInformation Than Temporal PatternsThe latency and peak timing of aPC responses varied acrossneurons and odors, raising the possibility that these parametersmay carry odor information (Cury and Uchida, 2010; Figures 4Aand 4B). However, both of these timing parameters were anti-correlated with spike counts (Figures 4C and 4D), suggestingthat the information conveyed by these variables might beredundant. In order to quantify the amount of information carriedby different response variables (i.e., latency, peak timing and
spike counts), we performed a decoding analysis to ask howaccurately an ideal observer could classify each individual trialas belonging to one of six odor stimuli. By comparing decodingaccuracy using vectors consisting of different variables derivedfrom aPC responses, we compared the relative importance ofeach coding strategy. As decoders (ideal observers), we usedlinear classifiers including perceptrons and support vectormachines with linear kernels. These decoders essentially calcu-late a weighted sum of inputs followed by a threshold and there-fore resemble a biophysical decoding of aPC information thatmight actually be implemented in downstream areas.Input codes based on the total number or rate of spikes in a
sniff cycle provided the most reliable performance in odorclassification, whereas codes based on first spike latency orpeak timing performed significantly worse (Figure 4E). Further-more, combining latency or peak timing with rate failed toimprove decoding accuracy. Although it has been postulatedthat spike times may provide a more rapid coding mechanism(Cury and Uchida, 2010; Gollisch and Meister, 2008; Thorpeet al., 2001), we found that decoders using spike count actuallyperformed faster than those based on spike latency or peaktiming (Figure 4F), demonstrating that spike counts can conveyinformation both more quickly and in a more reliable manner.Furthermore, decoding based on complete temporal patternsof activity in a sniff cycle did little to improve decoding accuracy(Figure 4G). Finally, using phase of spike occurrence with
200
100
0
200
100
0
Firin
g ra
te (s
pike
s/s)
Firin
g ra
te (s
pike
s/s)
-200 0 200 400
-200 0 200 400
Time - odor valve on (ms)
Time - 1st sniff onset (ms)
A
B
0 100
200
100
0
Aligned by odor valve on
Alig
ned
by 1
st s
niff
onse
t
CPeak firing rate (spikes/s)
0 50 1000
20
Neu
ron-
odor
pai
rs (%
)
50 100 150 2000
10
Neu
ron-
odor
pai
rs (%
)
Half width (ms)
Peak time (ms)
D
E
Figure 2. Sniffing of Odors Triggers Transient Spike Bursts Tightly Locked to Inhalation Onset(A and B) Activity of an example aPC neuron. Raster plots represent neural activity with each row corresponding to a single trial (n = 37 trials) and each tickmark to
a spike. Peri-event histograms are overlaid (green and red, smoothed with a Gaussian filter with the standard deviation of 7.5 ms). Trials are aligned to onset of
odor valve opening (A) or first sniff after odor valve opening (B). In (B), periodic spontaneous activity before t = 0 that reflects sniffing is evident.
(C) Comparison of peak firing rates between the two alignment conditions (odor valve opening versus first sniff onset). Instantaneous firing rates were calculated
after smoothing the peri-event histogram using a Gaussian filter (SD: 7.5 ms). The arrow denotes the example in this figure (A and B). A baseline firing rate (0 to
0.5 s before odor valve onset) was subtracted for each neuron-odor pair. The peak firing rates are higher when triggered by the first inhalation onset (p < 10"10,
Wilcoxon signed-rank test).
(D) Histogram of peak timing. Data from 243 odor-responsive neurons.
(E) Histogram of temporal half width of peak firing. Same data as in (D).
See also Figure S2.
Neuron
Odor Coding in the Piriform Cortex
Neuron 74, 1087–1098, June 21, 2012 ª2012 Elsevier Inc. 1089

respect to sniffing cycle instead of absolute time did not improvethe decoding accuracy (Figure 4H). Together, these resultssuggest that spike rates or counts are the predominant carrierof olfactory information in the aPC, and that the dependence of
odor coding on spike timing is greatly reduced compared tothe olfactory bulb (Cury and Uchida, 2010).
Information Conveyed by the Spike Counts Providedin Burst Activity Can Account for the Speedand Accuracy of Odor DiscriminationWe next compared the performance of aPC populationsdecoded using linear classifiers to the performance of theanimal. Decoding based on total spike counts in the first sniffusing the entire 179 neurons gave nearly perfect performanceon pure odors (Figures 5A and 5B). For both pure and mixturestimuli, the accuracy of the classifier reached a level compa-rable to that of the animal using only about 70 neurons (Fig-ure 5A). Analysis of the time course of decoding using a shortsliding time window showed that the maximum informationcould be read out from the initial burst of activity within100 ms after the first inhalation onset and that the rate of infor-mation dropped thereafter (Figures 5B and 5C). Comparing thefirst and second sniff separately, spikes in the first sniff gavesignificantly higher accuracy than those in the second sniffor the last sniff before odor port exit (Figure 5D; p < 0.05,c2 test), and using both the first and second sniff cycles resultedin only a small increase in accuracy (Figure 5D). Therefore, spikecounts in ensembles of aPC neurons appear to be sufficient toexplain both the speed and accuracy of decisions in an odormixture discrimination task.
Spike Counts in Ensemble Activity Correlate withBehavioral ChoicesIf firing rates across ensembles of aPC neurons are used by thebrain to form behavioral responses, and if sensory uncertaintyreduces performance accuracy, as in the mixture trials, thenwe might be able to observe trial-by-trial correlations betweendecoding based on these neural representations and theanimals’ choices. To test this idea, we first compared neuronalfiring rates on correct and error choices for a given stimulus,a measure analogous to ‘‘choice probability,’’ a measure thathas been used previously to test the role of a neural representa-tion in behavior (Britten et al., 1996; Cury and Uchida, 2010;Parker andNewsome, 1998).We found a low average correlationbetween the firing rates of individual neurons and subjects’choices (avg. choice prob. = 0.51 ± 0.011; Figures 5E and 5F).This correlation was somewhat smaller than those found inprevious observations in visual cortex (0.53–0.7; Britten et al.,1996; Cohen and Newsome, 2009; Dodd et al., 2001; Uka andDeAngelis, 2004). However, if the information for choices isdistributed across a large number of uncorrelated aPC neuronssuch that the contribution of single neurons is diluted (Cohenand Newsome, 2009), then we reasoned that the accuracy ofdecoding based on simultaneously recorded ensembles maybe correlated on a trial-by-trial basis with behavioral choices.Indeed, we found that patterns of spike counts across aPCneurons in correct trials provided significantly higher decodingaccuracy than patterns in error trials (Figure 5G; p = 0.030,Wilcoxon test). In contrast, decoding using peak timing orlatency did not show a significant difference between correctand error trials (Figures 5H and 5I; p > 0.05, Wilcoxon test).Therefore, spike rates in aPC not only carry substantial stimulus
50
100
150
0
20
Neu
ron
1
0
25
50
Sele
ctiv
e ne
uron
s (%
)
Silent neurons + BinomialBinomial
0 1 2 3 4 5 60
20
40
60
Neu
rons
(%)
Odors activated
B
D
A
C
auROC(vs. Blank)
1
0.5
0
Firin
g ra
te (s
pike
s/s)
Figure 3. Moderately Sparse, Distributed Population OdorResponses in aPC(A) Odor-evoked responses of an example neuron during first sniff cycle after
odor onset. The bottom colors indicate odors tested (same colors as in Fig-
ure 1B). The middle plot shows the firing rates in first sniff after odor valve
opening (40–160 ms from inhalation onset) as a function of odor stimuli. The
dashed line indicates the firing rate at the preodor sniff. The top colors indicate
the magnitude of odor response to each stimulus. The response magnitudes
were calculated as a comparison with blank (no odor) trials using signal
detection analysis (area under the receiver operating characteristics curve,
auROC; see Experimental Procedures). Scale is shown in (C) (red: excitatory
response with perfect discriminability, black: no discriminability [no response],
blue: inhibitory response with perfect discriminability).
(B) Statistical analysis of neural activity during first sniff (40–160 ms window
from sniff onset) (three-way ANOVA performed for each neuron with factors of
stimulus identity, choice direction and reward outcome, p < 0.05). Neural
responses during this period mostly reflect odor stimuli but not behavioral
choice or reward outcomes.
(C) Summary of odor responses (179 neurons). Odor response magnitudes
were indicated as in (A), top (also see color scale). Nonsignificant responses
(p > 0.05, Wilcoxon rank-sum test) are shown in black. The example neuron in
(A) is indicated by the arrow. Neurons are sorted by preodor firing rates in an
increasing order.
(D) Histogram of number of pure odorants that activated a given neuron
(p < 0.05, Wilcoxon rank-sum test). Two lines represent binomial fits with
(purple; nonresponsive p0 = 0.50, the other neuron respond with p = 0.16/
(1-p0) = 0.33) or without allowance of extra nonresponsive neurons (orange; p =
0.16). As a population, 45% of aPC neurons were activated by at least one of
the six odors testedwhile 28%were activated by two ormore (<0.05,Wilcoxon
rank-sum test).
See also Figure S3.
Neuron
Odor Coding in the Piriform Cortex
1090 Neuron 74, 1087–1098, June 21, 2012 ª2012 Elsevier Inc.

information, they are also correlated at an ensemble level withthe behavioral choices of the animal.
Near-Zero Noise Correlations during Odor InhalationThe above results indicate that odor information is coded bya large number of neurons in aPC. A critical feature of informationcoding in neuronal ensembles is the structure and magnitudeof correlated fluctuations in firing, which can affect the abilityof downstream neurons to decode the information. A simpleexample of ensemble decoding is population averaging or pool-ing. By this strategy, neuronal noise can, in principle, be elimi-nated by averaging the activity of a large number of neurons.However, if noise is not random across neurons, that is, ifneural activity cofluctuates across neurons, the benefit of pool-ing can be significantly curtailed (Cohen and Kohn, 2011; Zoharyet al., 1994). The choice probability analysis suggested that aPC
neurons are actually veryweakly correlated. To testmore directlywhether such correlations affect representations of odors in theolfactory cortex, we analyzed the ‘‘noise correlations’’ betweenpairs of simultaneously recorded aPC neurons (see ExperimentalProcedures). Noise was defined as the trial-to-trial variability ofspike counts in a sniff cycle (40–160 ms after the first sniff onset)around the mean response under a given stimulus condition.Noise correlation was defined as the correlation coefficientbetween the noise of two neurons to multiple presentations ofa given odor stimulus. We found surprisingly low noise correla-tions among aPC neurons (0.0046 ± 0.0988; mean ± SD; n =936 pairs; Figures 6A and S5). In fact, both the mean and thestandard deviation of noise correlations of the aPC data weresimilar to trial-shuffled data in which all correlations are removed(0.00011 ± 0.0870; Figures S5C–S5F), suggesting that deviationsfrom zero were mostly due to the effect of finite sample size
80
60
40
20
0-200 0 200 400
cumincitralva
200
100
00 5 10
Spike countTime - 1st sniff onset (ms)
0 50 100 150 200 0 80 160Bin size (ms)
250
Neu
ron-
odor
pai
r (%
)
Neu
ron-
odor
pai
r (%
)
15
10
5
0
15
10
5
0-1 0 1 -1 0 1
Peak
tim
e (m
s)
Firin
g ra
te (s
pike
s/s)
Dec
odin
g ac
cura
cy (%
)
Latency Peak Count L&C P&CDecoding method Window length (ms)
LatencyPeakCount
L&CP&C
100
80
60
40
20
0
Dec
odin
g ac
cura
cy (%
)
100
80
60
40
20
0D
ecod
ing
accu
racy
(%)
100
80
60
40
20
0
Dec
odin
g ac
cura
cy (%
)
100
80
60
40
20
0
Spike count - Peak timecorr. coeff.
Spike count - Latencycorr. coeff.
A B C D
E F G HPure
Mix
Decoding methodPureMix
PureMix
Spike timeSpike phase
Number of spikes0 100 200
Decodingmethod
Pure
P<0.05
Figure 4. Rapid and Accurate Readout of Odor Information Based on Spike Counts in First Sniff(A) Activity of an example neuron in response to two different odors. This neuron responded to the two odors with different temporal profiles.
(B) Trial-to-trial relationship of peak timing and total spike counts (same neuron and odors as in A). Each dot corresponds to one trial. Peak time is defined as the
time when the smoothed firing rate profile reaches the maximum firing rate within the first sniff cycle.
(C and D) Correlation coefficients between spike counts and peak timing (C) and latency (D) for 908 neuron-odor pairs. Black bars indicate significant correlations
(p < 0.05).
(E) Odor decoding accuracy of a linear decoder based on different firing features. Information contained in ensemble neural activity (179 neurons) in one sniff
(40–160 ms from inhalation onset) was quantified by the accuracy with which a linear classifier (support vector machine with a linear kernel) can correctly identify
one out of six odors on a trial-by-trial basis (see Experimental Procedures). Decoding accuracy for six pure odors (black) and six odor mixtures (gray) are plotted
separately. Latency: time of first spike. Peak: time of peak firing rate. Count: total spike count. L&C: latency and spike count. P&C: peak time and spike count.
(F) Odor decoding accuracy with increasing window lengths. Decoding using peak timing does not result in any faster performance than that using only spike
counts. A total of 179 neurons are used. The decoding is based on trials with pure odors. Chance performance level is 16.67% (=1/6, horizontal thin line). Black
horizontal dashed line indicates the behavioral performance level for pure odors. Three curves (L&C, P&C, and Count) are highly overlapping.
(G) Odor decoding accuracy of a linear classifier, plotted as a function of bin size (10 ms to 160 ms, i.e., temporal resolution). A 160ms time window after the first
sniff was first equipartitioned into smaller sized bins (80, 40, 20, or 10ms, respectively) and then the spike counts in all the bins were used for classification. Black,
pure; gray, mixture stimuli. Black and gray horizontal dashed lines indicate the behavioral performance levels for pure and mix odors, respectively.
(H) Odor decoding accuracy based on spike counts and phases for pure and mixture trials. Spike time: spike counts in 160 ms 3 1 bin. Phase: spike counts in
eight bins equipartitioning the first sniff cycle. Note that bin widths vary by trials in Phase. For fair comparisons, decoding accuracy was plotted against the mean
number of spikes per trial instead of the number of neurons.
Neuron
Odor Coding in the Piriform Cortex
Neuron 74, 1087–1098, June 21, 2012 ª2012 Elsevier Inc. 1091

(Ecker et al., 2010). Moreover, we observed no dependence ofthe magnitude of noise correlations on the number of evokedspikes over a range of rates <5 to >100 spikes , s"1 (FiguresS5A and S5B). Therefore, near-zero noise correlations in aPC
were not a consequence of low firing rates (Cohen and Kohn,2011; de la Rocha et al., 2007; Kohn and Smith, 2005).In the neocortex, neighboring neurons with similar stimulus
tuning tend to exhibit correlated trial-by-trial fluctuations in firing
0 20 40 60 80 100Correct trials
Pure Mix
1 2 L & + 1 2 L & +
PureMix
0 50 100 150 0 200 400Number of neurons
PureMix
Dec
odin
g ac
cura
cy (%
)
100
80
60
40
20
0
Dec
odin
g ac
cura
cy (%
)
100
80
60
40
20
0
Dec
odin
g ac
cura
cy (%
)
100
80
60
40
20
0
Sniff cycle
Time - 1st sniff onset (ms)
Spik
es/s 40
20
0Sp
ikes
/s 40
20
0
Neu
ron-
odor
pai
rs (%
)
Choice probability
P<0.05
Mix20
10
0
Mean: 0.51 ± 0.011
-200 0 200 400 0 0.5 1Time - 1st sniff onset (ms)
Correct trials
Error trials
0
20
40
60
80
100
slairt rorrE
0
20
40
60
80
100
slairt rorrE
0
20
40
60
80
100
slairt rorrE
0 20 40 60 80 100Correct trials
0 20 40 60 80 100Correct trials
Input: Spike count Input: Peak time Input: Latency
Mix
Decoding accuracy (%)
A B
D E F
G H IDecoding accuracy (%) Decoding accuracy (%)
Mix
P<0.05 P>0.05 P>0.05
MixMix
0 200 400Time - 2nd sniff onset (ms)
Dec
odin
g ac
cura
cy (%
)
100
80
60
40
20
0
C
Figure 5. Information Conveyed by the Spike Counts in the Burst Activity Can Account for the Speed and Accuracy of Odor Discrimination(A) Decoding accuracy as a function of the number of neurons. Total spike counts within 40–160ms after the first sniff onset were used. Black: pure; gray: mixture
stimuli. Dashed lines indicate behavioral performance levels.
(B) Time course of odor decoding accuracy. A vector consisting of instantaneous spike counts of 179 neurons in a sliding window (width, 50 ms; step, 5 ms) was
used for the input to a classifier. Training of the classifier and testing were done at every time point.
(C) Time course of odor decoding accuracy after the second sniff onset.
(D) Odor decoding accuracy at different sniff cycles. 1, first sniff; 2, second sniff; L, last sniff before odor port exit. +, sum of the spike counts from first and second
sniffs. &, spike counts from the first and second sniffs are treated as independent inputs to a classifier. Note that the last sniffs contain first or second sniff
depending on how many sniff the animal took in a given trial. The neural response at the first sniff is more informative than the second and the last sniffs.
Combining first and second sniffs improved decoding accuracy only a little (statistically not significant either for pure or mixture odors, p > 0.05, c2 test).
(E) Comparison of the responses of an example neuron to the same odor on correct trials and error trials.
(F) Choice probabilities: correlations between a trial-to-trial variability in neural activity and a choice toward neuron’s preferred direction. Only mixture odor trials
were used to obtain a larger number of error trials. The fraction of neurons with significant choice probabilities >0.5 is significantly larger than the fraction with
significant choice probabilities <0.5 (p < 0.05, c2 test) although the mean choice probability was not significantly larger than 0.5 (Wilcoxon sign-rank test, p > 0.5).
A neuron’s preferred choice direction was determined as a direction for a pure odor with significantly higher firing rate than the paired pure odor. Only neuron-
mixture odor pairs where two pure odors showed significantly different responses (area under receiver operating characteristic curve >0.7 or <0.3) and with
numbers of trials for each choice more than five were used for the analysis.
(G–I) Odor decoding accuracy for correct and error trials using simultaneously recorded ensemble neurons (n = 19 sessions). Total spike counts within 40–160ms
(G), Peak time (H) and latency (I) from the first sniff onset were used. Only trials with mixture odors, where most of error trials are available, were used. A classifier
was first trained using correct trials, and decoding accuracy was obtained using test trials that are composed of correct or error trials. p < 0.05 for spike counts
(Wilcoxon test).
See also Figure S4.
Neuron
Odor Coding in the Piriform Cortex
1092 Neuron 74, 1087–1098, June 21, 2012 ª2012 Elsevier Inc.
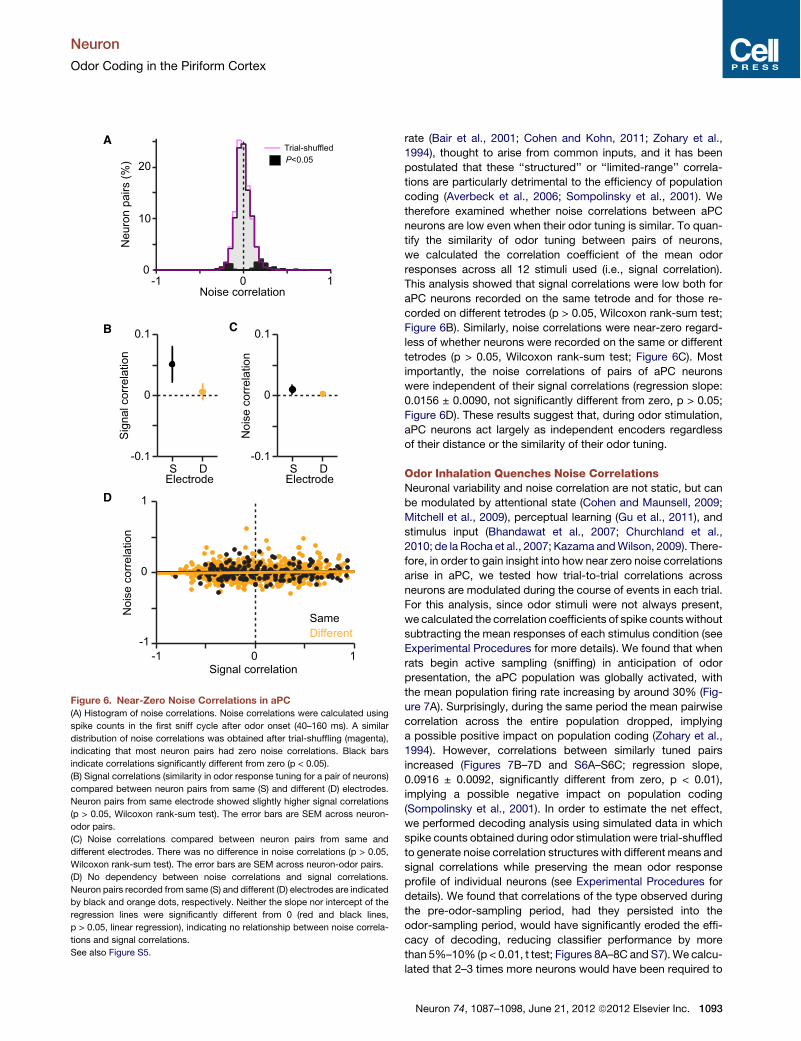
rate (Bair et al., 2001; Cohen and Kohn, 2011; Zohary et al.,1994), thought to arise from common inputs, and it has beenpostulated that these ‘‘structured’’ or ‘‘limited-range’’ correla-tions are particularly detrimental to the efficiency of populationcoding (Averbeck et al., 2006; Sompolinsky et al., 2001). Wetherefore examined whether noise correlations between aPCneurons are low even when their odor tuning is similar. To quan-tify the similarity of odor tuning between pairs of neurons,we calculated the correlation coefficient of the mean odorresponses across all 12 stimuli used (i.e., signal correlation).This analysis showed that signal correlations were low both foraPC neurons recorded on the same tetrode and for those re-corded on different tetrodes (p > 0.05, Wilcoxon rank-sum test;Figure 6B). Similarly, noise correlations were near-zero regard-less of whether neurons were recorded on the same or differenttetrodes (p > 0.05, Wilcoxon rank-sum test; Figure 6C). Mostimportantly, the noise correlations of pairs of aPC neuronswere independent of their signal correlations (regression slope:0.0156 ± 0.0090, not significantly different from zero, p > 0.05;Figure 6D). These results suggest that, during odor stimulation,aPC neurons act largely as independent encoders regardlessof their distance or the similarity of their odor tuning.
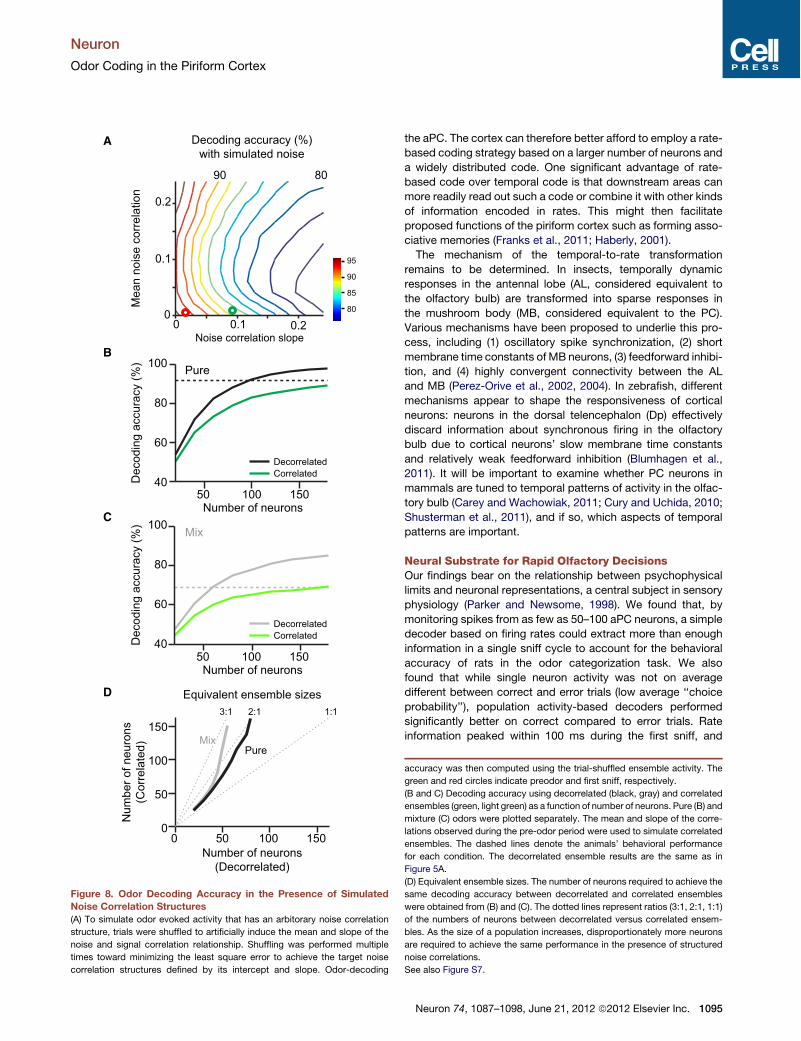
Odor Inhalation Quenches Noise CorrelationsNeuronal variability and noise correlation are not static, but canbe modulated by attentional state (Cohen and Maunsell, 2009;Mitchell et al., 2009), perceptual learning (Gu et al., 2011), andstimulus input (Bhandawat et al., 2007; Churchland et al.,2010; de la Rocha et al., 2007; Kazama andWilson, 2009). There-fore, in order to gain insight into how near zero noise correlationsarise in aPC, we tested how trial-to-trial correlations acrossneurons are modulated during the course of events in each trial.For this analysis, since odor stimuli were not always present,we calculated the correlation coefficients of spike counts withoutsubtracting the mean responses of each stimulus condition (seeExperimental Procedures for more details). We found that whenrats begin active sampling (sniffing) in anticipation of odorpresentation, the aPC population was globally activated, withthe mean population firing rate increasing by around 30% (Fig-ure 7A). Surprisingly, during the same period the mean pairwisecorrelation across the entire population dropped, implyinga possible positive impact on population coding (Zohary et al.,1994). However, correlations between similarly tuned pairsincreased (Figures 7B–7D and S6A–S6C; regression slope,0.0916 ± 0.0092, significantly different from zero, p < 0.01),implying a possible negative impact on population coding(Sompolinsky et al., 2001). In order to estimate the net effect,we performed decoding analysis using simulated data in whichspike counts obtained during odor stimulation were trial-shuffledto generate noise correlation structures with different means andsignal correlations while preserving the mean odor responseprofile of individual neurons (see Experimental Procedures fordetails). We found that correlations of the type observed duringthe pre-odor-sampling period, had they persisted into theodor-sampling period, would have significantly eroded the effi-cacy of decoding, reducing classifier performance by morethan 5%–10% (p < 0.01, t test; Figures 8A–8C and S7).We calcu-lated that 2–3 times more neurons would have been required to
A
B
D
)%( sriap norue
N
20
10
0
Noise correlation-1 0 1
noitalerroc langiS
0.1
0
-0.1
0.1
0
-0.1
noitalerroc esioN
noitalerroc esioN
S D S DElectrode Electrode
1
0
-1-1 0 1
Signal correlation
SameDifferent
C
P<0.05Trial-shuffled
Figure 6. Near-Zero Noise Correlations in aPC(A) Histogram of noise correlations. Noise correlations were calculated using
spike counts in the first sniff cycle after odor onset (40–160 ms). A similar
distribution of noise correlations was obtained after trial-shuffling (magenta),
indicating that most neuron pairs had zero noise correlations. Black bars
indicate correlations significantly different from zero (p < 0.05).
(B) Signal correlations (similarity in odor response tuning for a pair of neurons)
compared between neuron pairs from same (S) and different (D) electrodes.
Neuron pairs from same electrode showed slightly higher signal correlations
(p > 0.05, Wilcoxon rank-sum test). The error bars are SEM across neuron-
odor pairs.
(C) Noise correlations compared between neuron pairs from same and
different electrodes. There was no difference in noise correlations (p > 0.05,
Wilcoxon rank-sum test). The error bars are SEM across neuron-odor pairs.
(D) No dependency between noise correlations and signal correlations.
Neuron pairs recorded from same (S) and different (D) electrodes are indicated
by black and orange dots, respectively. Neither the slope nor intercept of the
regression lines were significantly different from 0 (red and black lines,
p > 0.05, linear regression), indicating no relationship between noise correla-
tions and signal correlations.
See also Figure S5.
Neuron
Odor Coding in the Piriform Cortex
Neuron 74, 1087–1098, June 21, 2012 ª2012 Elsevier Inc. 1093

achieve the same level of decoding performance had pre-odorcorrelation levels been maintained (Figure 8D). The simulationalso indicated that the effects would be even larger with largerensembles. We also found that trial-to-trial variability in spikecount, as measured by the Fano factor and the coefficient ofvariation, was significantly reduced by odor onset (Figures S6Dand S6E). Thus, potentially deleterious population correlationsare increased during the period of high sniffing preceding odoronset but these correlations are quenched during the arrival ofthe stimulus (Churchland et al., 2010).
DISCUSSION
Transformation of Odor Representation between theOlfactory Bulb and Piriform CortexTogether with recent studies of neural coding in the olfactorybulb (Carey and Wachowiak, 2011; Cury and Uchida, 2010;Shusterman et al., 2011), this study demonstrates that odorrepresentations are profoundly transformed between the bulband the aPC. While these studies show that odor responses inthe olfactory bulb exhibit complex temporal patterns carryingstimulus information, here, we show that those in the aPC consistprimarily of a simple burst of firing, locked to respiration. Further-more, the baseline firing rates are higher in the olfactory bulbcompared to the piriform cortex (12.9 ± 6.4 Hz in the olfactorybulb; 6.15 ± 9.01 Hz in the aPC; mean ± SD; Cury and Uchida,2010, and the present study). As a consequence, whereas inthe olfactory bulb extracting information from mitral/tufted cellsrequires decoding of temporal patterns (Cury and Uchida,2010), in the aPC most odor information can be read out usingonly spike counts of neurons.Why might the olfactory bulb and cortex areas use different
strategies for odor coding? One important consideration is thesubstantial anatomical differences between the two areas: whilea relatively small number of neurons (20–50 mitral cells) transmitodor information from each of the approximately 1000 inputchannels (glomeruli) in the olfactory bulb, this information isbroadcast to an olfactory cortex that contains an estimatedtwo orders of magnitude more neurons (Shepherd, 2004).Because of this expansion in coding space the necessity tomaximize the rate of information transmitted per neuron andper unit time in the olfactory bulb will be much greater than in
A
B
C
noitalerrocesio
N
0
0.1
-0.1
Signal correlation at 1st sniff
-1 -0.5 0.5 10
pre-odor1st sniff
D
troprodo-erP
nitroprodO
ffinsrodo-erP
ffinsts1
ffinsdn2
tuotroprodO
nitropeciohC
10
9
8
7
0.02
0.01
0
noitalerrocesio
Nnae
mnoitalerroc
esioN
epols
0.1
0.05
0
odor
)s/sekips( etar gniriF
Figure 7. Odor Stimulation Quenches Structured Trial-to-TrialCorrelations that Emerge during Preodor Sniffing(A) Mean firing rate over the population as a function of task epochs. Spikes in
the first sniff after each task event were used. Preodor port: 500 ms before
odor port in. A bar with a star indicates significance between two epochs
and a star without a horizontal bar indicates the significance against all the
other epochs (the error bars are across neuron-odor pairs, ANOVA with LSD
method).
(B) Mean correlation as a function of task epochs. The error bars are for
neuron-odor pairs.
(C) Regression slopes for the trial-to-trial correlation and signal correlation
relationship as a function of task epochs. Trial-to-trial correlations were
computed at each epoch while signal correlations were computed at the first
sniff (generalized linear model with Holm method). The error bars are SEM
across neuron-odor pairs.
(D) Trial-to-trial correlations as a function of signal correlations. Two task
epochs, preodor (green) and first sniff (red), are plotted separately (p < 0.05 for
slopes, generalized linear model). The error bars are SEM across neuron-odor
pairs.
See also Figure S6.
Neuron
Odor Coding in the Piriform Cortex
1094 Neuron 74, 1087–1098, June 21, 2012 ª2012 Elsevier Inc.
the aPC. The cortex can therefore better afford to employ a rate-based coding strategy based on a larger number of neurons anda widely distributed code. One significant advantage of rate-based code over temporal code is that downstream areas canmore readily read out such a code or combine it with other kindsof information encoded in rates. This might then facilitateproposed functions of the piriform cortex such as forming asso-ciative memories (Franks et al., 2011; Haberly, 2001).The mechanism of the temporal-to-rate transformation
remains to be determined. In insects, temporally dynamicresponses in the antennal lobe (AL, considered equivalent tothe olfactory bulb) are transformed into sparse responses inthe mushroom body (MB, considered equivalent to the PC).Various mechanisms have been proposed to underlie this pro-cess, including (1) oscillatory spike synchronization, (2) shortmembrane time constants of MB neurons, (3) feedforward inhibi-tion, and (4) highly convergent connectivity between the ALand MB (Perez-Orive et al., 2002, 2004). In zebrafish, differentmechanisms appear to shape the responsiveness of corticalneurons: neurons in the dorsal telencephalon (Dp) effectivelydiscard information about synchronous firing in the olfactorybulb due to cortical neurons’ slow membrane time constantsand relatively weak feedforward inhibition (Blumhagen et al.,2011). It will be important to examine whether PC neurons inmammals are tuned to temporal patterns of activity in the olfac-tory bulb (Carey and Wachowiak, 2011; Cury and Uchida, 2010;Shusterman et al., 2011), and if so, which aspects of temporalpatterns are important.
Neural Substrate for Rapid Olfactory DecisionsOur findings bear on the relationship between psychophysicallimits and neuronal representations, a central subject in sensoryphysiology (Parker and Newsome, 1998). We found that, bymonitoring spikes from as few as 50–100 aPC neurons, a simpledecoder based on firing rates could extract more than enoughinformation in a single sniff cycle to account for the behavioralaccuracy of rats in the odor categorization task. We alsofound that while single neuron activity was not on averagedifferent between correct and error trials (low average ‘‘choiceprobability’’), population activity-based decoders performedsignificantly better on correct compared to error trials. Rateinformation peaked within 100 ms during the first sniff, and
noitalerroc esion naeM
Decoding accuracy (%)with simulated noise
95
90
85
80
A
0.2
0.1
0
Noise correlation slope0 0.1 0.2
90 80
Number of neurons(Decorrelated)
snoruen fo rebmu
N)detalerro
C(
150
100
50
0150100500
)%( ycarucca gnidoce
D)
%( ycarucca gnidoceD
100
80
60
40
100
80
60
40
Number of neurons15010050
Number of neurons15010050
Pure
Mix
DecorrelatedCorrelated
DecorrelatedCorrelated
PureMix
B
C
D3:1 2:1 1:1
Equivalent ensemble sizes
Figure 8. Odor Decoding Accuracy in the Presence of SimulatedNoise Correlation Structures(A) To simulate odor evoked activity that has an arbitorary noise correlation
structure, trials were shuffled to artificially induce the mean and slope of the
noise and signal correlation relationship. Shuffling was performed multiple
times toward minimizing the least square error to achieve the target noise
correlation structures defined by its intercept and slope. Odor-decoding
accuracy was then computed using the trial-shuffled ensemble activity. The
green and red circles indicate preodor and first sniff, respectively.
(B and C) Decoding accuracy using decorrelated (black, gray) and correlated
ensembles (green, light green) as a function of number of neurons. Pure (B) and
mixture (C) odors were plotted separately. The mean and slope of the corre-
lations observed during the pre-odor period were used to simulate correlated
ensembles. The dashed lines denote the animals’ behavioral performance
for each condition. The decorrelated ensemble results are the same as in
Figure 5A.
(D) Equivalent ensemble sizes. The number of neurons required to achieve the
same decoding accuracy between decorrelated and correlated ensembles
were obtained from (B) and (C). The dotted lines represent ratios (3:1, 2:1, 1:1)
of the numbers of neurons between decorrelated versus correlated ensem-
bles. As the size of a population increases, disproportionately more neurons
are required to achieve the same performance in the presence of structured
noise correlations.
See also Figure S7.
Neuron
Odor Coding in the Piriform Cortex
Neuron 74, 1087–1098, June 21, 2012 ª2012 Elsevier Inc. 1095
aggregating information over longer periods in multiple sniffcycles failed to significantly augment decoding performance,providing an explanation for the rapid speed of olfactory discrim-ination performance and the lack of speed-accuracy tradeoffover longer periods (Uchida andMainen, 2003). Therefore, theseobservations provide substantial evidence linking a rate-basedpopulation code to behavioral performance.
Near-Zero Noise Correlations Facilitate Odor CodingWe found that an optimal linear decoder of aPC neurons canreach levels of performance superior to the animal itself using<100 neurons out of the estimated population of around 106
neurons (Shepherd, 2004). The aPC clearly contains anextremely robust representation of odor identity. What then ulti-mately limits behavioral accuracy? While similar observations inthe visual system have attributed behavioral performance limitsto the reduced efficiency of pooling in the actual network ofneurons due to ensemble correlations (Shadlen et al., 1996;Zohary et al., 1994), this appears not to be the case in theaPC. During odor stimulation, aPC networks have near zeromean noise correlation, more than one order of magnitude lowerthan that generally reported in the neocortex (0.05–0.2; Cohenand Kohn, 2011; Gawne and Richmond, 1993; Lee et al., 1998;Zohary et al., 1994; Figure 6A), similar to that reported in theprimary auditory cortex of anesthetized rats (Renart et al.,2010) and area V1 of awake monkeys (Ecker et al., 2010).More importantly, aPC neurons also lack the positive relation-ships between signal and noise correlations that are typicallyobserved (Bair et al., 2001; Gu et al., 2011; Zohary et al.,1994). However, the absence of such correlations is not simplydue to the distributed connectivity of the olfactory cortex: Suchstructured correlated activity can and does emerge prior toodor onset and simulations demonstrated that such correlationswould have substantially reduced the efficiency of populationcoding. However, we found when driven by odor stimulation,these prestimulus correlations are quenched. While we cannotrule out the possibility that additional correlations that we wereunable to measure with this data set might affect decoding,behavioral performance in the odor mixture categorization taskappears to be limited neither by the level of noise of the sensoryrepresentation nor by correlated fluctuations among the popula-tion of neurons. We therefore conclude that the limits of perfor-mance must be set either by the ability of downstream circuitsto accurately read out of these representations or by othernon-sensory sources of variability.
Whether prolonged odor sampling can improve the accuracyof odor discrimination has been controversial. Some studieshave suggested that the accuracy of odor discrimination canbe improved with longer odor sampling over 500 ms (Rinberget al., 2006) or more (Friedrich and Laurent, 2001). It has beensuggested that the accuracy of discrimination of highly similarodor pairs might depend on the refinement of odor representa-tions through temporal evolution of neural activity (Friedrichand Laurent, 2001) or through temporal integration of sensoryevidence. However, the result of the present study suggeststhat these processes are unnecessary. These findings indicate,instead, that performance accuracy is affected not only by stim-ulus information but additionally by other task parameters that
may affect the ability of the animal to choose accuratelybased on olfactory stimulus representations (H. Zariwala et al.,2005, Soc. Neurosci., abstract). It remains to be seen whethersimilar conclusions can be drawn in different olfactory taskssuch as odor detection, discrimination at low concentrations, ormore complex tasks. The present study indicates that neuronalrecording in animals performing these behavioral tasks will bea critical step toward addressing these fundamental questions.
EXPERIMENTAL PROCEDURES
All procedures involving animals were carried out in accordance with NIH
standards and approved by the Cold Spring Harbor Laboratory and Harvard
University Institutional Animal Care and Use Committee (IACUC). All values
were represented by mean ± SEM unless otherwise noted.
BehaviorRats were trained and tested on a two-alternative choice odor mixture
categorization task where water was used as a reward as described pre-
viously (Cury and Uchida, 2010; Uchida and Mainen, 2003). Odor delivery
was controlled by a custom-made olfactometer (Cury and Uchida, 2010;
Uchida andMainen, 2003). In total, eight rats were used. Five rats were trained
to perform in a reaction time version of the task (Uchida and Mainen, 2003),
and the other three rats in a go-signal paradigm (Rinberg et al., 2006) (see
Supplemental Experimental Procedures). Three rats (two of them trained
with go-signals) were tested on a standardized stimulus set of three odor pairs:
(1) caproic acid and citralva, (2) ethyl 3-hexenoate and 1-hexanol, and (3) dihy-
droxy linalool oxide versus cumin aldehyde (Figure 1B). Each of these odors
was diluted 1:10 in mineral oil, and further diluted by filtered air by 1:20
(1:200 total).
Neural RecordingAfter reaching asymptotic performance in behavioral training, each rat was
implanted with a custom-made multielectrode drive (Cury and Uchida, 2010)
in the left hemisphere in the aPC (3.5 mm anterior to bregma, 2.5 mm lateral
to midline) and a bipolar stimulating electrode in the olfactory bulb (Kashiwa-
dani et al., 1999; Schoenbaum and Eichenbaum, 1995) under anesthesia.
Extracellular recordings were obtained using six independently adjustable
tetrodes. To monitor sniffing, during drive implantation, a temperature sensor
(thermocouple) was implanted in one nostril (Cury and Uchida, 2010; Uchida
and Mainen, 2003).
SUPPLEMENTAL INFORMATION
Supplemental Information includes eight figures and Supplemental Experi-
mental Procedures and can be found with this article online at doi:10.1016/
j.neuron.2012.04.021.
ACKNOWLEDGMENTS
Weare grateful to HaimSompolinsky for stimulating discussions on population
coding. We thank John Maunsell, Markus Meister, Alex Pouget and Rachel
Wilson for their valuable comments on the manuscript. We also thank Kevin
Cury, Rafi Haddad, Gabriel Kreiman, Eran Mukamel, Alice Wang, and other
members of the Uchida lab for discussions. This work was supported by
National Institutes of Health Grant DC006104, Cold Spring Harbor Laboratory
and Champlimaud Foundation (Z.F.M.); Swartz Foundation, Smith Family New
Investigator Award, Alfred Sloan Foundation, Milton Fund and start-up funding
from Harvard University (N.U.). N.U. and Z.F.M. designed the experiments and
wrote the paper. N.U. performed the experiments. K.M. performed the data
analysis and helped writing the paper. N.U. and Z.F.M. helped with the data
analysis.
Accepted: April 11, 2012
Published: June 20, 2012
Neuron
Odor Coding in the Piriform Cortex
1096 Neuron 74, 1087–1098, June 21, 2012 ª2012 Elsevier Inc.
REFERENCES
Averbeck, B.B., Latham, P.E., and Pouget, A. (2006). Neural correlations,
population coding and computation. Nat. Rev. Neurosci. 7, 358–366.
Bair, W., Zohary, E., and Newsome, W.T. (2001). Correlated firing in macaque
visual areaMT: time scales and relationship to behavior. J. Neurosci. 21, 1676–
1697.
Bhandawat, V., Olsen, S.R., Gouwens, N.W., Schlief, M.L., and Wilson, R.I.
(2007). Sensory processing in the Drosophila antennal lobe increases reliability
and separability of ensemble odor representations. Nat. Neurosci. 10, 1474–
1482.
Blumhagen, F., Zhu, P., Shum, J., Scharer, Y.P., Yaksi, E., Deisseroth, K., and
Friedrich, R.W. (2011). Neuronal filtering of multiplexed odour representations.
Nature 479, 493–498.
Britten, K.H., Newsome, W.T., Shadlen, M.N., Celebrini, S., andMovshon, J.A.
(1996). A relationship between behavioral choice and the visual responses of
neurons in macaque MT. Vis. Neurosci. 13, 87–100.
Cang, J., and Isaacson, J.S. (2003). In vivo whole-cell recording of odor-
evoked synaptic transmission in the rat olfactory bulb. J. Neurosci. 23,
4108–4116.
Carey, R.M., and Wachowiak, M. (2011). Effect of sniffing on the temporal
structure of mitral/tufted cell output from the olfactory bulb. J. Neurosci. 31,
10615–10626.
Churchland, M.M., Yu, B.M., Cunningham, J.P., Sugrue, L.P., Cohen, M.R.,
Corrado, G.S., Newsome, W.T., Clark, A.M., Hosseini, P., Scott, B.B., et al.
(2010). Stimulus onset quenches neural variability: a widespread cortical
phenomenon. Nat. Neurosci. 13, 369–378.
Cohen, M.R., and Kohn, A. (2011). Measuring and interpreting neuronal corre-
lations. Nat. Neurosci. 14, 811–819.
Cohen, M.R., and Maunsell, J.H. (2009). Attention improves performance
primarily by reducing interneuronal correlations. Nat. Neurosci. 12, 1594–
1600.
Cohen, M.R., and Newsome, W.T. (2009). Estimates of the contribution of
single neurons to perception depend on timescale and noise correlation.
J. Neurosci. 29, 6635–6648.
Cury, K.M., and Uchida, N. (2010). Robust odor coding via inhalation-coupled
transient activity in the mammalian olfactory bulb. Neuron 68, 570–585.
de la Rocha, J., Doiron, B., Shea-Brown, E., Josi!c, K., and Reyes, A. (2007).
Correlation between neural spike trains increases with firing rate. Nature
448, 802–806.
Dodd, J.V., Krug, K., Cumming, B.G., and Parker, A.J. (2001). Perceptually
bistable three-dimensional figures evoke high choice probabilities in cortical
area MT. J. Neurosci. 21, 4809–4821.
Ecker, A.S., Berens, P., Keliris, G.A., Bethge, M., Logothetis, N.K., and Tolias,
A.S. (2010). Decorrelated neuronal firing in cortical microcircuits. Science 327,
584–587.
Franks, K.M., Russo, M.J., Sosulski, D.L., Mulligan, A.A., Siegelbaum, S.A.,
and Axel, R. (2011). Recurrent circuitry dynamically shapes the activation of
piriform cortex. Neuron 72, 49–56.
Friedrich, R.W., and Laurent, G. (2001). Dynamic optimization of odor repre-
sentations by slow temporal patterning of mitral cell activity. Science 291,
889–894.
Gawne, T.J., and Richmond, B.J. (1993). How independent are the messages
carried by adjacent inferior temporal cortical neurons? J. Neurosci. 13, 2758–
2771.
Ghosh, S., Larson, S.D., Hefzi, H., Marnoy, Z., Cutforth, T., Dokka, K., and
Baldwin, K.K. (2011). Sensory maps in the olfactory cortex defined by long-
range viral tracing of single neurons. Nature 472, 217–220.
Gollisch, T., and Meister, M. (2008). Rapid neural coding in the retina with
relative spike latencies. Science 319, 1108–1111.
Gu, Y., Liu, S., Fetsch, C.R., Yang, Y., Fok, S., Sunkara, A., DeAngelis, G.C.,
and Angelaki, D.E. (2011). Perceptual learning reduces interneuronal correla-
tions in macaque visual cortex. Neuron 71, 750–761.
Haberly, L.B. (2001). Parallel-distributed processing in olfactory cortex: new
insights from morphological and physiological analysis of neuronal circuitry.
Chem. Senses 26, 551–576.
Hamilton, K.A., and Kauer, J.S. (1989). Patterns of intracellular potentials
in salamander mitral/tufted cells in response to odor stimulation.
J. Neurophysiol. 62, 609–625.
Illig, K.R., and Haberly, L.B. (2003). Odor-evoked activity is spatially distributed
in piriform cortex. J. Comp. Neurol. 457, 361–373.
Junek, S., Kludt, E., Wolf, F., and Schild, D. (2010). Olfactory coding with
patterns of response latencies. Neuron 67, 872–884.
Kashiwadani, H., Sasaki, Y.F., Uchida, N., and Mori, K. (1999). Synchronized
oscillatory discharges of mitral/tufted cells with different molecular receptive
ranges in the rabbit olfactory bulb. J. Neurophysiol. 82, 1786–1792.
Kazama, H., and Wilson, R.I. (2009). Origins of correlated activity in an olfac-
tory circuit. Nat. Neurosci. 12, 1136–1144.
Kepecs, A., Uchida, N., and Mainen, Z.F. (2006). The sniff as a unit of olfactory
processing. Chem. Senses 31, 167–179.
Kohn, A., and Smith, M.A. (2005). Stimulus dependence of neuronal correlation
in primary visual cortex of the macaque. J. Neurosci. 25, 3661–3673.
Lee, D., Port, N.L., Kruse, W., and Georgopoulos, A.P. (1998). Variability and
correlated noise in the discharge of neurons in motor and parietal areas of
the primate cortex. J. Neurosci. 18, 1161–1170.
Macrides, F., and Chorover, S.L. (1972). Olfactory bulb units: activity corre-
lated with inhalation cycles and odor quality. Science 175, 84–87.
Margrie, T.W., and Schaefer, A.T. (2003). Theta oscillation coupled spike laten-
cies yield computational vigour in a mammalian sensory system. J. Physiol.
546, 363–374.
McCollum, J., Larson, J., Otto, T., Schottler, F., Granger, R., and Lynch, G.
(1991). Short-latency single unit processing in olfatory cortex. J. Cogn.
Neurosci. 3, 293–299.
Meredith, M. (1986). Patterned response to odor in mammalian olfactory bulb:
the influence of intensity. J. Neurophysiol. 56, 572–597.
Mitchell, J.F., Sundberg, K.A., and Reynolds, J.H. (2009). Spatial attention
decorrelates intrinsic activity fluctuations in macaque area V4. Neuron 63,
879–888.
Miyamichi, K., Amat, F., Moussavi, F., Wang, C., Wickersham, I., Wall, N.R.,
Taniguchi, H., Tasic, B., Huang, Z.J., He, Z., et al. (2011). Cortical representa-
tions of olfactory input by trans-synaptic tracing. Nature 472, 191–196.
Published online December 22, 2010. 10.1038/nature09714.
Nagayama, S., Enerva, A., Fletcher, M.L., Masurkar, A.V., Igarashi, K.M., Mori,
K., and Chen, W.R. (2010). Differential axonal projection of mitral and tufted
cells in the mouse main olfactory system. Front. Neural Circuits 4. Published
online September 23, 2010. 10.3389/fncir.2010.00120.
Ojima, H., Mori, K., and Kishi, K. (1984). The trajectory of mitral cell axons in the
rabbit olfactory cortex revealed by intracellular HRP injection. J. Comp.
Neurol. 230, 77–87.
Parker, A.J., and Newsome,W.T. (1998). Sense and the single neuron: probing
the physiology of perception. Annu. Rev. Neurosci. 21, 227–277.
Perez-Orive, J., Mazor, O., Turner, G.C., Cassenaer, S., Wilson, R.I., and
Laurent, G. (2002). Oscillations and sparsening of odor representations in
the mushroom body. Science 297, 359–365.
Perez-Orive, J., Bazhenov, M., and Laurent, G. (2004). Intrinsic and circuit
properties favor coincidence detection for decoding oscillatory input.
J. Neurosci. 24, 6037–6047.
Poo, C., and Isaacson, J.S. (2009). Odor representations in olfactory cortex:
‘‘sparse’’ coding, global inhibition, and oscillations. Neuron 62, 850–861.
Renart, A., de la Rocha, J., Bartho, P., Hollender, L., Parga, N., Reyes, A., and
Harris, K.D. (2010). The asynchronous state in cortical circuits. Science 327,
587–590.
Neuron
Odor Coding in the Piriform Cortex
Neuron 74, 1087–1098, June 21, 2012 ª2012 Elsevier Inc. 1097

Rennaker, R.L., Chen, C.F., Ruyle, A.M., Sloan, A.M., and Wilson, D.A. (2007).
Spatial and temporal distribution of odorant-evoked activity in the piriform
cortex. J. Neurosci. 27, 1534–1542.
Rinberg, D., Koulakov, A., and Gelperin, A. (2006). Speed-accuracy tradeoff in
olfaction. Neuron 51, 351–358.
Schoenbaum, G., and Eichenbaum, H. (1995). Information coding in the rodent
prefrontal cortex. I. Single-neuron activity in orbitofrontal cortex compared
with that in pyriform cortex. J. Neurophysiol. 74, 733–750.
Shadlen, M.N., Britten, K.H., Newsome, W.T., and Movshon, J.A. (1996). A
computational analysis of the relationship between neuronal and behavioral
responses to visual motion. J. Neurosci. 16, 1486–1510.
Shepherd, G.M. (2004). The Synaptic Organization of the Brain (Oxford: Oxford
University Press).
Shusterman, R., Smear, M.C., Koulakov, A.A., and Rinberg, D. (2011). Precise
olfactory responses tile the sniff cycle. Nat. Neurosci. 14, 1039–1044.
Sompolinsky, H., Yoon, H., Kang, K., and Shamir, M. (2001). Population coding
in neuronal systems with correlated noise. Phys. Rev. E Stat. Nonlin. Soft
Matter Phys. 64, 051904.
Sosulski, D.L., Bloom, M.L., Cutforth, T., Axel, R., and Datta, S.R. (2011).
Distinct representations of olfactory information in different cortical centres.
Nature 472, 213–216.
Spors, H., and Grinvald, A. (2002). Spatio-temporal dynamics of odor repre-
sentations in the mammalian olfactory bulb. Neuron 34, 301–315.
Stettler, D.D., and Axel, R. (2009). Representations of odor in the piriform
cortex. Neuron 63, 854–864.
Thorpe, S., Delorme, A., and Van Rullen, R. (2001). Spike-based strategies for
rapid processing. Neural Netw. 14, 715–725.
Uchida, N., and Mainen, Z.F. (2003). Speed and accuracy of olfactory discrim-
ination in the rat. Nat. Neurosci. 6, 1224–1229.
Uka, T., and DeAngelis, G.C. (2004). Contribution of area MT to stereoscopic
depth perception: choice-related response modulations reflect task strategy.
Neuron 42, 297–310.
Wachowiak, M. (2011). All in a sniff: olfaction as a model for active sensing.
Neuron 71, 962–973.
Wehr, M., and Laurent, G. (1996). Odour encoding by temporal sequences of
firing in oscillating neural assemblies. Nature 384, 162–166.
Welker, W.I. (1964). Analysis of sniffing of the albino rat. Behavior 22, 223–244.
Wellis, D.P., Scott, J.W., and Harrison, T.A. (1989). Discrimination among
odorants by single neurons of the rat olfactory bulb. J. Neurophysiol. 61,
1161–1177.
Wesson, D.W., Carey, R.M., Verhagen, J.V., andWachowiak, M. (2008). Rapid
encoding and perception of novel odors in the rat. PLoS Biol. 6, e82.
Wilson, D.A. (1998). Habituation of odor responses in the rat anterior piriform
cortex. J. Neurophysiol. 79, 1425–1440.
Zhan, C., and Luo, M. (2010). Diverse patterns of odor representation by
neurons in the anterior piriform cortex of awake mice. J. Neurosci. 30,
16662–16672.
Zohary, E., Shadlen, M.N., and Newsome, W.T. (1994). Correlated neuronal
discharge rate and its implications for psychophysical performance. Nature
370, 140–143.
Neuron
Odor Coding in the Piriform Cortex
1098 Neuron 74, 1087–1098, June 21, 2012 ª2012 Elsevier Inc.

1
Neuron, Volume 74
Supplemental Information Odor Representations in Olfactory Cortex: Distributed Rate Coding and Decorrelated Population Activity
Keiji Miura, Zachary F. Mainen and Naoshige Uchida
Page
• Supplemental Figures 2
Figure S1 (related to Figure 1). Behavioral performance Figure S2 (related to Figure 2). Tight locking to inhalation onset and transient responses are
common features of aPC neurons Figure S3 (related to Figure 3). Robust odor responses in aPC Figure S4 (related to Figure 5). Odor decoding accuracy using different sets of correct and error
trials for training a classifier Figure S5 (related to Figure 6). Small noise correlations regardless of firing rates of neurons and
distribution of noise correlations after trial shuffling Figure S6 (related to Figure 7). Structured noise correlations during pre-odor and decorrelations
during 1st sniff are observed regardless of the firing rates Figure S7 (related to Figure 8). Decoding accuracy with induced noise correlation structures
observed in different task epochs
• Supplemental Experimental Procedures 10 • Supplemental Analysis 21 • Supplemental References 23
2
SUPPLEMENTAL FIGURES
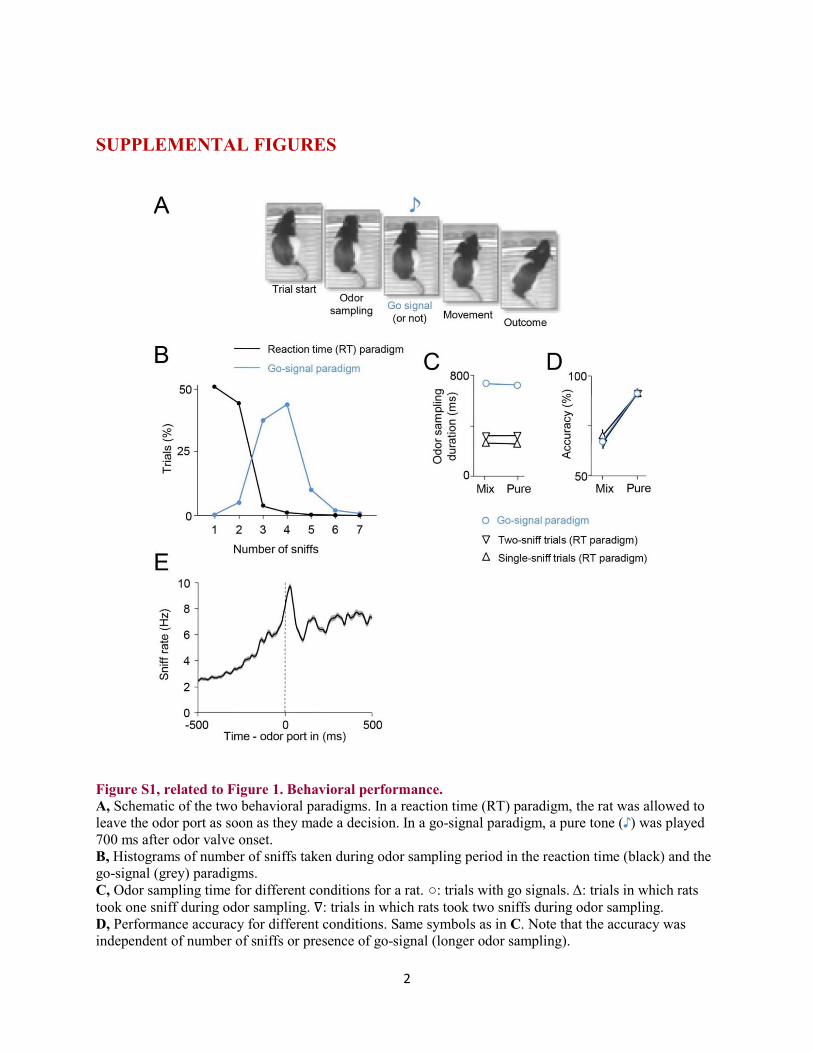
Figure S1, related to Figure 1. Behavioral performance. A, Schematic of the two behavioral paradigms. In a reaction time (RT) paradigm, the rat was allowed to leave the odor port as soon as they made a decision. In a go-signal paradigm, a pure tone ( ) was played 700 ms after odor valve onset. B, Histograms of number of sniffs taken during odor sampling period in the reaction time (black) and the go-signal (grey) paradigms. C, Odor sampling time for different conditions for a rat. : trials in which rats took one sniff during odor sampling. : trials in which rats took two sniffs during odor sampling. D, Performance accuracy for different conditions. Same symbols as in C. Note that the accuracy was independent of number of sniffs or presence of go-signal (longer odor sampling).

3
E, Sniff rate as a function of time from the odor port entry for a rat trained in a reaction time paradigm.
Figure S2, related to Figure 2. Tight locking to inhalation onset and transient responses are common features of aPC neurons. A & B, Activity of an example neuron in the same format as Figures 2A, B (N = 47 trials). This neuron responded with the occurrence of 1-2 spikes at the precise latency from sniff onset. This response is only evident when trials were aligned to sniff onset (B) but not when aligned to odor valve onset (A). C, Examples of transient odor responses. Peri-event time histograms (PETHs) of spikes for different neurons showing odor responses. Randomly chosen odor responsive neurons are shown. The mean peak

4
time for these examples is 90.8 ± 34.1(ms) and the mean half width is 33.2 ± 11.2 (ms).
5
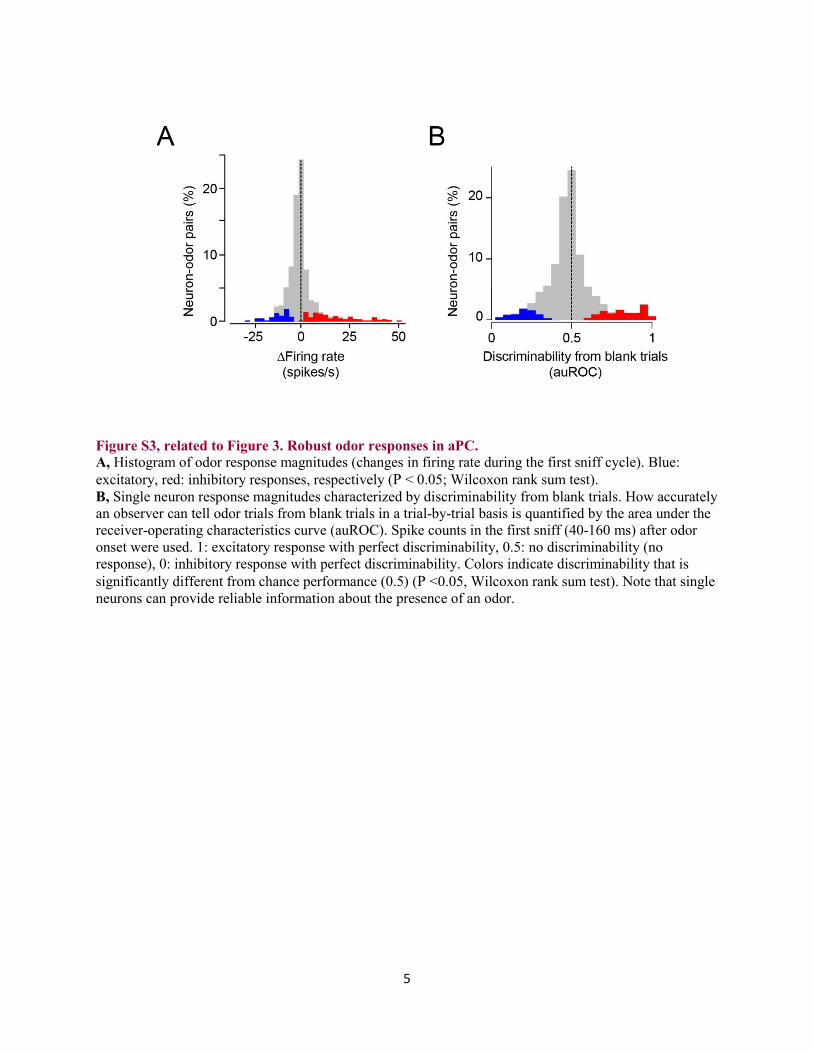
Figure S3, related to Figure 3. Robust odor responses in aPC. A, Histogram of odor response magnitudes (changes in firing rate during the first sniff cycle). Blue: excitatory, red: inhibitory responses, respectively (P < 0.05; Wilcoxon rank sum test). B, Single neuron response magnitudes characterized by discriminability from blank trials. How accurately an observer can tell odor trials from blank trials in a trial-by-trial basis is quantified by the area under the receiver-operating characteristics curve (auROC). Spike counts in the first sniff (40-160 ms) after odor onset were used. 1: excitatory response with perfect discriminability, 0.5: no discriminability (no response), 0: inhibitory response with perfect discriminability. Colors indicate discriminability that is significantly different from chance performance (0.5) (P <0.05, Wilcoxon rank sum test). Note that single neurons can provide reliable information about the presence of an odor.

6
Figure S4, related to Figure 5. Odor decoding accuracy using different sets of correct and error trials for training a classifier. A, A mixture of all correct and error trials excluding test trials. B, A mixture of equal number of correct and error trials excluding test trials. C, Correct trials only (excluding test trials). Decoding accuracy is higher for correct trials when a classifier was trained by all trials or correct trials only. When the same number of correct and error trials were used for training a classifier, the decoding accuracy matched between correct and error trial. These results suggest that odor responses in correct and error trials are systematically shifted.
7
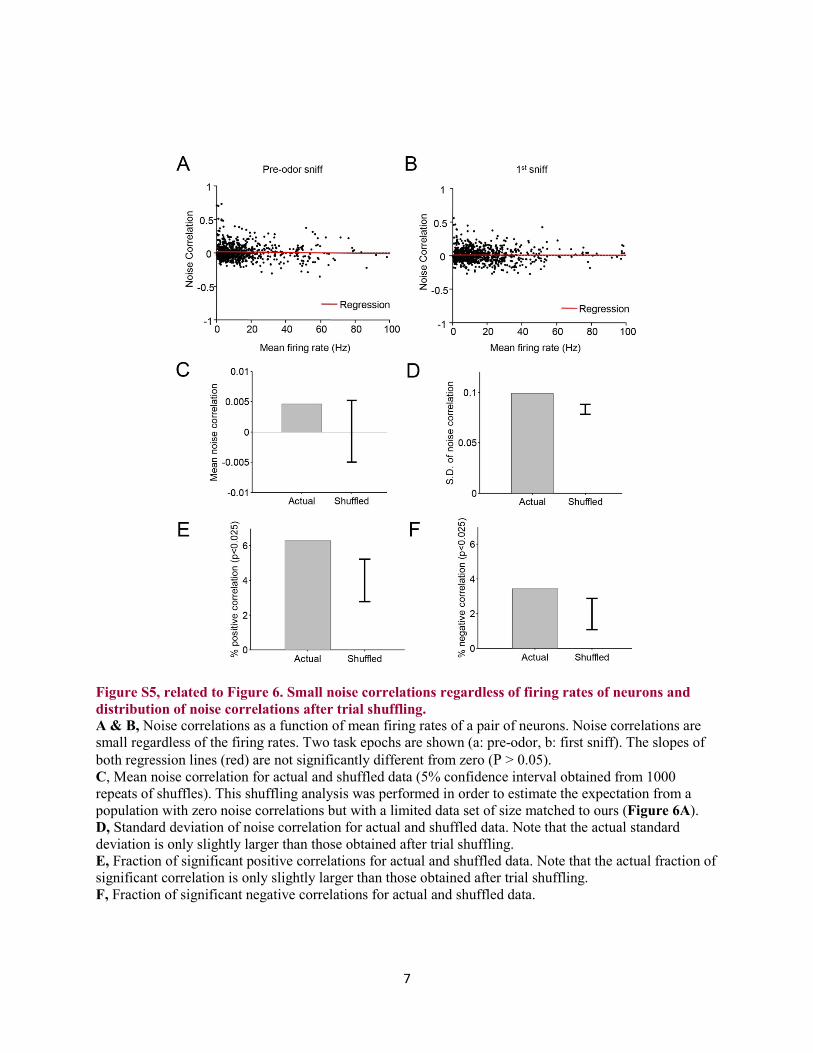
Figure S5, related to Figure 6. Small noise correlations regardless of firing rates of neurons and distribution of noise correlations after trial shuffling. A & B, Noise correlations as a function of mean firing rates of a pair of neurons. Noise correlations are small regardless of the firing rates. Two task epochs are shown (a: pre-odor, b: first sniff). The slopes of both regression lines (red) are not significantly different from zero (P > 0.05). C, Mean noise correlation for actual and shuffled data (5% confidence interval obtained from 1000 repeats of shuffles). This shuffling analysis was performed in order to estimate the expectation from a population with zero noise correlations but with a limited data set of size matched to ours (Figure 6A). D, Standard deviation of noise correlation for actual and shuffled data. Note that the actual standard deviation is only slightly larger than those obtained after trial shuffling. E, Fraction of significant positive correlations for actual and shuffled data. Note that the actual fraction of significant correlation is only slightly larger than those obtained after trial shuffling. F, Fraction of significant negative correlations for actual and shuffled data.
8
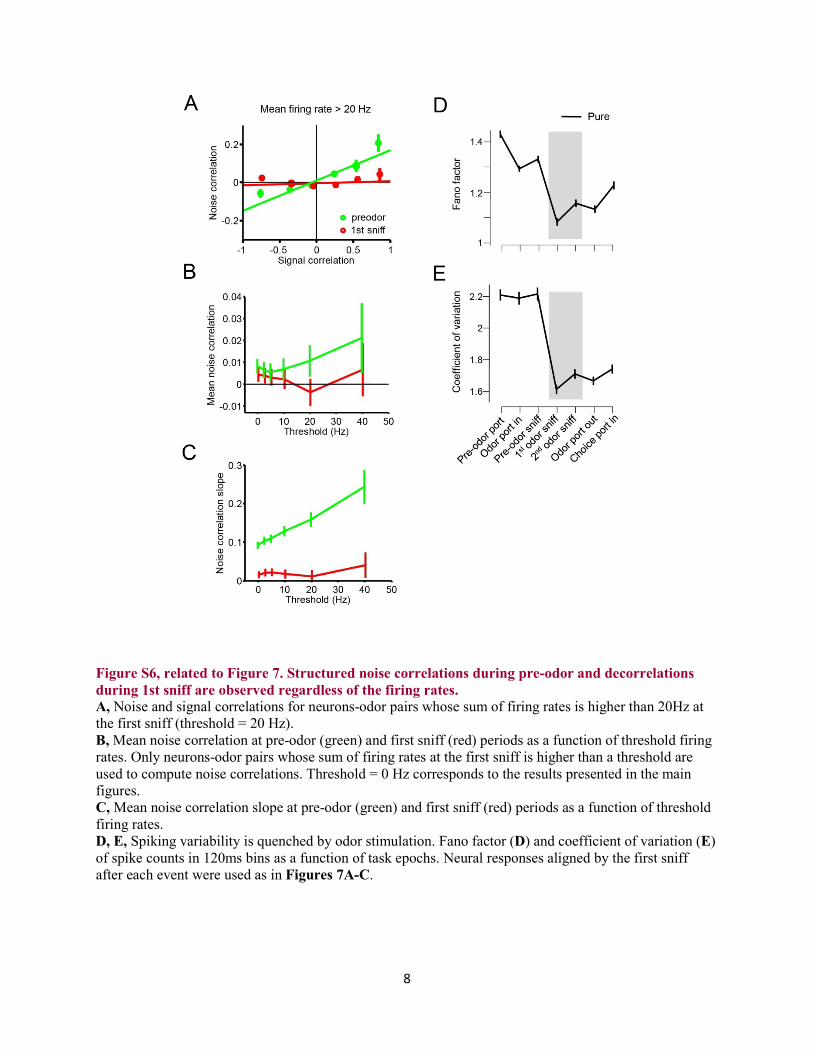
Figure S6, related to Figure 7. Structured noise correlations during pre-odor and decorrelations during 1st sniff are observed regardless of the firing rates. A, Noise and signal correlations for neurons-odor pairs whose sum of firing rates is higher than 20Hz at the first sniff (threshold = 20 Hz). B, Mean noise correlation at pre-odor (green) and first sniff (red) periods as a function of threshold firing rates. Only neurons-odor pairs whose sum of firing rates at the first sniff is higher than a threshold are used to compute noise correlations. Threshold = 0 Hz corresponds to the results presented in the main figures. C, Mean noise correlation slope at pre-odor (green) and first sniff (red) periods as a function of threshold firing rates. D, E, Spiking variability is quenched by odor stimulation. Fano factor (D) and coefficient of variation (E) of spike counts in 120ms bins as a function of task epochs. Neural responses aligned by the first sniff after each event were used as in Figures 7A-C.

9
Figure S7, related to Figure 8. Decoding accuracy with induced noise correlation structures observed in different task epochs. A, Odor decoding accuracy in the presence of simulated noise correlation structures for mixture odor trials. Same format as Figure 8A . B, The decoding accuracy was computed for shuffled data which imitated the mean and slope of noise correlation structures at each task epoch. First, the noise structures were computed at each epoch while the signal correlations were taken from the first sniff period. Then, the decoding accuracy was computed by looking up Figure 8A as a table using the linear interpolation.
10
SUPPLEMENTAL EXPERIMENTAL PROCEDURES
All procedures involving animals were carried out in accordance with NIH standards and
approved by the Cold Spring Harbor Laboratory and Harvard University Institutional Animal
Care and Use Committee (IACUC). All values were represented by mean ± S.E.M unless
otherwise noted. Unless otherwise noted, a nonparametric statistical test, the Wilcoxon rank sum
test and a significance level of P < 0.05 was used and values are uncorrected for multiple
comparisons.
Behavioral task
Eight Long Evans rats (250 g at the start of training) were used. Rats were trained and tested on a
two-alternative choice odor mixture categorization task where water was used as a reward as
described previously (Uchida and Mainen, 2003). The animals were maintained on a reverse 12
hr light/dark cycle and tested during their dark period. They were allowed free access to food but
were restricted to water available during the behavioral session and for 30 minutes after the
session. The behavioral setup consisted of a box with a panel containing three ports: a central
port for odor delivery and two lateral ports for water delivery.
Rats initiated a trial by entering the central odor-sampling port, which triggered the delivery of
an odor with a (uniform) random delay of 0.2–0.5 s (Figures 1C, S1A). The odor was available
for up to 1 s. In a reaction time version of the task (N = 5 rats), rats could exit from the odor port
at any time, and make a movement to either of the two reward ports. Odor delivery was
terminated as soon as the rat exited the odor port. Reward was available for correct choices for
up to 2 s after the rat left the odor sampling port. Water was delivered with a random delay from
entry into the goal port drawn from a uniform distribution [1.0-1.5] s. Rats were first trained with
a pair of pure odors and binary odor mixtures in different proportions (68/32, 32/68) where rats
were rewarded for choosing the side determined by the dominant odorant. After reaching an
asymptotic performance with the first odor pair, rats were trained with the next odor pairs. In
addition we used a go signal paradigm (Rinberg et al., 2006b) (N = 3 rats), where rats were
further trained to stay in the odor sampling port until an auditory “go” signal delivered 700 ms
11
after odor port entry. If the subject left the odor sampling port before the go signal, reward was
omitted. On average, a behavioral session consisted of 561 valid trials (about 98 minutes).
Behavioral accuracy was defined as the percent correct choices (over the total number of correct
and error trials; error trials were defined as trials in which an incorrect response was made,
excluding trials in which the rats made no choice). The timings when rats entered or left the ports
were signaled by the interruption of the infrared beam caused by the rats’ snout into ports. We
used port beam break signals to determine the position of the animal during the task with high
temporal precision.
Odor stimuli
Odor delivery was controlled by a custom made olfactometer (Uchida and Mainen, 2003). We
used relatively low concentration of odorants (dilution factor: 0.05-0.005 achieved by diluting 50
ml/min odorized air in a total of 1000 ml/min clean air stream with further dilution of up to 1:10
in mineral oil for some odorants). All stimuli were randomly interleaved during a session. As a
control, we also included “blank” trials in some sessions in which air stream through a filter
containing no odorants was activated. Rats were rewarded randomly (P = 0.5) at either side of
reward ports. After some training, rats made choice movements consistently after hearing a valve
click sound with slightly longer reaction times (587 ± 21 ms, 2.59 ± 0.12 sniffs) than odor trials
(372 ± 3 ms, 1.25 ± 0.02 sniffs).
Three rats (two of them trained with go-signals) were tested on a standardized stimulus set of
three odor pairs: (1) caproic acid and citralva, (2) ethyl 3-hexenoate and 1-hexanol, and (3)
dihydroxy linalool oxide vs. cumin aldehyde (Figure 1B). Each of these odors was diluted 1:10
in mineral oil. For each pair, we used four complementary mixture ratios (100/0, 68/32, 32/68,
0/100). The data set with this condition consisted of 36 experimental conditions (3 rats x 3
odorant pairs x 4 mixture ratios). Each of the three rats was tested in four to nine sessions (one
session per day), yielding a total of 10,668 trials during recording. This data set contained 179
neurons and was used for the classification success analysis. An additional five rats were tested
using different combinations of odors (three to four mixture pairs per session) to examine the
basic response properties can be generalized to more odors. The odors used in these experiments

12
are 5-methyl-3-hexen-2-one, meta-, para-cresol, pentyl acetate, benzaldehyde, anisole, (S)-(+)-
carvone, acetophenone, alpha-farnesene and the above six odorants. This data set contained 281
neurons and was used for other analyses that did not require a fixed set of odors in combination
with neurons with a fixed odor panel (Figures 2C, 3B). The total data set contained 460 neurons
from 48 sessions (8 rats).
Analysis of respiration pattern
To monitor sniffing, during drive implantation, a temperature sensor (0.005” Teflon-coated
thermocouple, Omega) was implanted in one nostril (Uchida and Mainen, 2003). Respiration
patterns were monitored as a temperature change in the nasal cavity as described previously
(Kepecs et al., 2007; Uchida and Mainen, 2003). Signals from nasal thermocouple were
amplified, filtered between 0.1 and 475 Hz and digitized at 2,000 Hz. For analysis, voltage
signals were further low-pass filtered (< 50 Hz). Onset of inhalations and exhalations were
identified as local maxima and minima of the signals semi-automatically using custom software.
We excluded the trials with partial inhalations where odorants were delivered in the middle of
the inhalation cycle. A criterion “pre-odor exhalation onset < odor onset + 50ms < first
inhalation onset” was used to identify full sniff trials. Odor latency of 50 ms was used based on
measurements of odor delivery timing using photoiodization detector (PID). The results
presented in this paper are not sensitive to this value but the chance-level hit rate in the
classification analysis before odor onset supports this estimate (Figures 5B).
Neural recordings
After each animal reached an asymptotic performance in behavioral training (3-4 weeks), each
rat was implanted with a custom-made multielectrode drive (Cury and Uchida, 2010; Feierstein
et al., 2006) in the left hemisphere in the aPC (3.5 mm anterior to bregma, 2.5 mm lateral to
midline) under anesthesia (ketamine/medetomidine, 60/0.5 mg/kg, i.p.). A stimulation electrode
(a pair of tungsten elec
recoding site (1.5 mm in depth). Rats were allowed to recover for 5 to 7 days before resuming

13
water restriction and starting the recordings. Extracellular recordings were obtained using six
independently adjustable tetrodes (impedance: 300- . Before starting recordings, animals
were retrained to reach similar accuracy levels as those achieved before surgery (>90% correct
for pure odors). During this period, electrodes were advanced ventrally to the aPC over 4-7 days.
Recordings were obtained for 1–2 weeks with electrode depths adjusted on each recording day so
as to sample an independent population of cells across sessions. Neural and behavioural data
were synchronized by acquiring time-stamps from the behavioural system along with the
electrophysiological signals. Data acquisition was performed using the Cheetah system
(Neuralynx, Tucson AZ). Electrode placements were estimated by depth and local field
potentials evoked by OB electrical stimulation (Haberly, 1973).
Recording location was further confirmed by post-hoc histological examination.
Spike sorting and neuron types
Spike waveforms were collected by filtering between 600 and 6,000 Hz and saving 1 ms
waveforms triggered by a simple threshold. Single units were isolated offline by manually
clustering spike features (peak amplitude, energy and principle components) derived from the
sampled waveforms using MClust software (written by A.D. Redish). Although we attempted to
sample independent populations of units each session, putatively identical units (based on the
similarity of the waveforms) were sometimes encountered. Duplicate units were excluded from
the population analysis, but the results were not affected by the inclusion of all units. As in other
cortical areas, neurons could be classified into two categories: wide-spiking (width > 0.2 ms) and
narrow-spiking neurons (width < 0.2 ms). The width was determined as the time between a peak
and a trough of the mean spike waveform. About 6 % (29) of recorded neurons fell into the
category of narrow-spiking neurons. Overall, aPC neurons had spontaneous firing rates of 6.15 ±
9.01 Hz (mean ± S.D.). Spontaneous firing rates of wide-spiking neurons were significantly
lower than those of narrow-spiking neurons (4.95 ± 6.32 Hz; 24.8 ± 20.1 Hz; mean ± S.D.,
respectively). Both categories of cells were included in the analyses but exclusion of narrow
spike neurons did not affect the main conclusions.
14
Single neuron analysis
In order to obtain instantaneous firing rates (e.g. for Peri-event time histograms, PETHs), spike
events were convolved with a Gaussian filter (S.D.: 7.5 ms) (Figures 2A-B, 4A, 5E, S2). To
obtain peak timing of odor responses (Figure 2D), the PETHs of 243 neuron-odor pairs that
showed peak responses > 15 Hz and > 5 S.D. above baseline firing (blank trials) were analyzed.
To quantify transience of odor responses, we also obtained the temporal half width from the
same neuron-odor pair (Figure 2E). The temporal half width was defined as the duration of the
time window at which the firing rate was above the half of maximum firing rate from the
baseline firing rates.
Because previous studies in the olfactory system suggested that neural responses can be
modulated by behavioral context (Cury and Uchida, 2010; Kay and Laurent, 1999; Rinberg et al.,
2006a), comparisons were made against “blank” trials (see above). For example, to obtain the
number of odor-responsive neurons, comparisons were made using spike counts in a sniff cycle
in odor trials against that in a corresponding sniff cycle in blank trials (Figures 3A, C, D, S3).
We also used pre-odor sniffs (a full sniff cycle immediately before odor onset) as a reference in
some cases. These two methods produced essentially similar results. The time window for a sniff
cycle was defined as 40–160 ms from inhalation onset (a 120 ms window with 40 ms delay)
unless noted otherwise. A 40 ms delay was used because obvious neural responses typically did
not occur before 40 ms from inhalation onset although the results did not depend critically on the
length of the delay. A 120 ms window was used because the duration of most sniffs are longer
than 120 ms (< 8.3 Hz) (Kepecs et al., 2007). For example, odor tunings at the first sniffs were
computed based on the numbers of spikes between 40 ms and 160 ms after the inhalation onsets
(Figures 3, S3). The same window for corresponding sniff periods was used for the classification
analysis (Figures 5A, D, G, 8, S4), signal and noise correlations (Figures 6, 7, S5, S6A-C),
Fano factors (Figures S6D, E) and sparseness (see Supplementary Experimental Procedures).
Classification success (decoding) analysis
To examine information contents in ensemble activity, we applied a decoding approach (Cury
and Uchida, 2010; Hung et al., 2005; Quian Quiroga and Panzeri, 2009). We quantified how
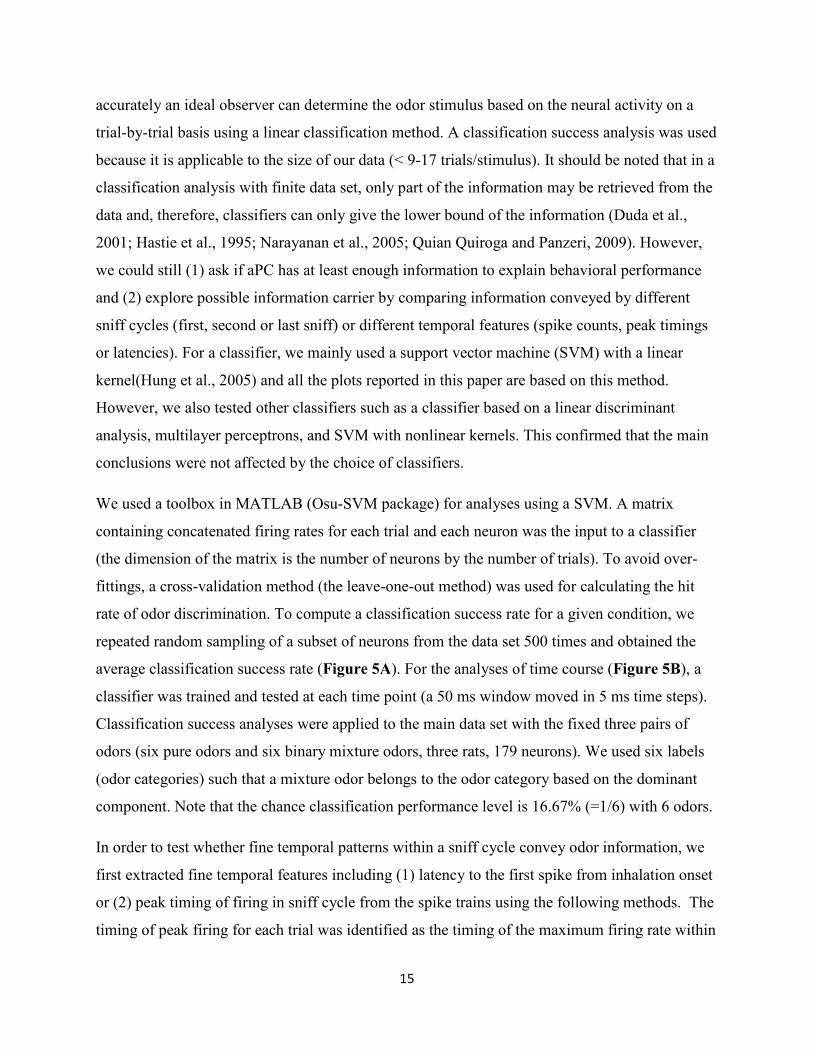
15
accurately an ideal observer can determine the odor stimulus based on the neural activity on a
trial-by-trial basis using a linear classification method. A classification success analysis was used
because it is applicable to the size of our data (< 9-17 trials/stimulus). It should be noted that in a
classification analysis with finite data set, only part of the information may be retrieved from the
data and, therefore, classifiers can only give the lower bound of the information (Duda et al.,
2001; Hastie et al., 1995; Narayanan et al., 2005; Quian Quiroga and Panzeri, 2009). However,
we could still (1) ask if aPC has at least enough information to explain behavioral performance
and (2) explore possible information carrier by comparing information conveyed by different
sniff cycles (first, second or last sniff) or different temporal features (spike counts, peak timings
or latencies). For a classifier, we mainly used a support vector machine (SVM) with a linear
kernel(Hung et al., 2005) and all the plots reported in this paper are based on this method.
However, we also tested other classifiers such as a classifier based on a linear discriminant
analysis, multilayer perceptrons, and SVM with nonlinear kernels. This confirmed that the main
conclusions were not affected by the choice of classifiers.
We used a toolbox in MATLAB (Osu-SVM package) for analyses using a SVM. A matrix
containing concatenated firing rates for each trial and each neuron was the input to a classifier
(the dimension of the matrix is the number of neurons by the number of trials). To avoid over-
fittings, a cross-validation method (the leave-one-out method) was used for calculating the hit
rate of odor discrimination. To compute a classification success rate for a given condition, we
repeated random sampling of a subset of neurons from the data set 500 times and obtained the
average classification success rate (Figure 5A). For the analyses of time course (Figure 5B), a
classifier was trained and tested at each time point (a 50 ms window moved in 5 ms time steps).
Classification success analyses were applied to the main data set with the fixed three pairs of
odors (six pure odors and six binary mixture odors, three rats, 179 neurons). We used six labels
(odor categories) such that a mixture odor belongs to the odor category based on the dominant
component. Note that the chance classification performance level is 16.67% (=1/6) with 6 odors.
In order to test whether fine temporal patterns within a sniff cycle convey odor information, we
first extracted fine temporal features including (1) latency to the first spike from inhalation onset
or (2) peak timing of firing in sniff cycle from the spike trains using the following methods. The
timing of peak firing for each trial was identified as the timing of the maximum firing rate within

16
a window [40-240 ms] in the PETH calculated as above (using a Gaussian filter of 7.5 ms S.D.).
The latency of responses was defined as the timing of the first spike within a window [40-240
ms] for each trial. When there is no spike, a random number was assigned to the peak time and
latency from a uniform distribution over [40-240 ms] to ensure that the peak time and latency are
as independent from spike counts as possible. A matrix containing these temporal firing features
was used as an input to a linear classifier and information contents were estimated from
classification success rates as described above. The speed with which spike trains convey odor
information using different coding schemes was compared as follows (Figures 4F). For a given
coding scheme (rate, latency, peak or their combinations), classification success rates were
calculated using a gradually increasing window (40-50, 40-60, 40-80, 40-120, 40-280 ms, etc).
To compare the first, second and last sniffs in a fair manner, the same number of trials was used
for the three epochs (Figure 5D). The last sniff taken in the odor sampling port can be the
second sniff or later. The number of trials per odor was restricted by the minimum number per
session (3~11 trials per odor) because we pooled neurons from different sessions.
In order to examine correlations between behavior and neural activity (Figure 5G-I), we
performed a classification analysis. A classifier was first trained using a mixture of correct and
error trials. Classification success rate was then obtained using test trials that are entirely
composed of correct or error trials.
All classification analyses except Figure 5G-I were performed after pooling neurons across
animals. The basic observations were preserved across neurons although the absolute
classification performance differed across animals.
Noise correlations
Noise is defined as the trial-to-trial variability around the mean response under a given stimulus
condition. Noise correlation is defined as the correlation coefficient between the noise of two
neurons to multiple presentations of a given odor stimulus. To calculate the correlation
coefficient, firing rates were transformed into z-scores (mean subtracted and normalized by the
standard deviation of responses) for a given odor (Cohen and Newsome, 2008; Huang and

17
Lisberger, 2009; Zohary et al., 1994). This guarantees that a noise correlation measures only
correlations between noises, independently of neurons’ mean responses to odors. We applied this
analysis to spike counts from a 120 ms window (40-160 ms from inhalation onset).
For pre-odor epochs, we simply calculated the correlation coefficient between pairs of neurons
using spike counts without subtracting the mean responses of each stimulus condition. However,
we confirmed that subtracting the mean spike count for each stimulus condition produced similar
results.
A chi square test of homogeneity showed that the noise correlation computed for a pair of
neurons were independent of stimulus condition in 89.3% of the experiments (P>0.05;
correlation coefficients were first transformed to Fisher's z to conform normality assumptions).
We therefore combined z-scores from different stimulus conditions to calculate a single value of
correlation coefficient for each pair of neurons in Figures 6-8, S5-7, using the same format as in
the previous study(Zohary et al., 1994). Note that the influence of confounding variables such as
stimulus strength was removed by converting spike counts to z-scores using the mean and
standard deviation for repetitions of each stimulus type.
Noise in the above analyses was estimated as fluctuation around the mean odor responses but
such variations in firing may still include systematic fluctuations due to other parameters such as
changes in sniffing patterns and animals’ states. In this sense, our definition of noise correlations
can be regarded as an operational one.
To control for this effect on our estimate of noise correlations, we first used the following
regression model for each odor,
where r is the firing rate, xfreq is the sniff frequency and xamp is the amplitude of sniffing for a
given trial. This model allows us to estimate the “mean” response for a given trial taking into
account sniff parameters in addition to odors. We then computed noise correlations after
subtracting this estimate (r) from the firing rate in each trial. Using this method, we obtained
essentially the same results both in terms of the mean and slope of the noise correlations (mean
ampfreq xbxbbr 210

18
noise correlation at first sniff: -0.0003 ± 0.0040, noise correlation slope at pre-odor sniff: 0.1125
± 0.0225).
Other variables that we did not directly measure or control may also systematically affect the
neural activity. This includes (1) lingering odors from the previous trials and (2) imagery of
particular odors. The first possibility is unlikely because even if we subtracted the mean firing
rates conditioned for previous odors, we obtained similar correlations before odor stimulation (as
in Figures 7B, C). The second possibility is harder to exclude as it is not possible to measure
rat’s imagery. Thus we cannot exclude the possibility that structured correlations we observed
are due to rats’ imagery of particular odors on a trial-to-trial basis. Although such correlated
firing should not be regarded as noise correlations, this type of activity can have an impact on
decoding in a very similar way as structured noise correlations as they can systematically bias
animals’ estimate of a presented odor.
Although low firing rates may contribute to low noise correlations, we observed no dependence
of the magnitude of noise correlations and the number of evoked spikes over a range of rates < 5
to > 100 spikes·s-1 (Figures S5A, B)(de la Rocha et al., 2007; Kohn and Smith, 2005) and the
absence of relationship between signal and noise correlation remained true even when the
analysis was restricted to pairs with firing rates > 20 spikes·s-1 (Figures S6A-C).
Signal correlations
Signal correlation is defined as the correlation coefficient between the mean firing rates of odor
response profiles of two neurons. Signal correlation is calculated only for the odor response
period (first sniff after odor onset). We estimated signal correlations using 6 pure and 6 mixture
stimuli (12 conditions). Given the large dimensionality of potential odor space (Soucy et al.,
2009; Wilson and Mainen, 2006), the values of signal correlations may be underestimated. Thus,
the positive relation between noise correlations and signal correlations (Figures 6D, 7C, D)
could be larger. However, the odors used in the present study drive responses over a wide area of
the olfactory bulb (Soucy et al., 2009; Uchida et al., 2000) and we speculate that these odors can
indicate connectivity to an extent. Our ability to detect the positive relationship between signal
and noise correlations during pre-odor period supports the validity of our method.

19
Effect of noise correlation structures on population coding efficiency
Most of the previous empirical studies that examined the effect of noise correlations on
population coding have mainly focused on the mean correlation (Averbeck and Lee, 2003; Bair
et al., 2001; Cohen and Maunsell, 2009; Cohen and Newsome, 2008; Constantinidis and
Goldman-Rakic, 2002; Gawne et al., 1996; Gawne and Richmond, 1993; Gu et al., 2011;
Gutnisky and Dragoi, 2008; Huang and Lisberger, 2009; Lee et al., 1998; Mitchell et al., 2009;
Reich et al., 2001; Zohary et al., 1994). However, theoretical studies indicate that it is not the
mean correlation but rather the exact structure of noise correlations that is critical in determining
the impact of these correlations on the efficiency of population coding (Abbott and Dayan, 1999;
Josic et al., 2009; Sompolinsky et al., 2001; Wilke and Eurich, 2002). First, noise correlations are
particularly detrimental to population coding when they are higher in neuron pairs with similar
stimulus tuning (“structured” or “limited-range” noise correlations)(Sompolinsky et al., 2001;
Wilke and Eurich, 2002). Second, when the noise correlations are uniform across the population,
they can be beneficial for population coding (Abbott and Dayan, 1999; Sompolinsky et al., 2001).
Because these theoretical studies have made a variety of assumptions on the spiking statistics
(e.g. Gaussian noise), it is not completely clear how these theories can be mapped onto empirical
data. In order to understand how these theoretical predictions can be mapped onto our data, we
performed a simulation-based analysis. Specifically, we introduced arbitrary noise correlation
structures on the empirical data and tested how they affect the accuracy of decoding using a
linear decoder. To do so, odor response data obtained during the first sniff period was trial-
shuffled to generate an arbitrary structure of noise correlations (Figures 8, S7). First, a target
noise correlation function (NCtarget) was defined by a linear regression line as a function of signal
correlations (SCobserved):
,
where a and b denote a slope and an intercept, respectively. We randomly chose two trials for a
given odor and neuron, and swapped the spike counts from the two trials. If this swap decreased
the mean square error between the data and the target regression line, it was accepted. We
baSCNC observedett arg
20
repeated the swap 100 times per neuron-odor pair. After 100 shuffling per neuron-odor pair,
simulated data reached an asymptote: most swaps are not accepted any more. Note that this swap
procedure changes the noise correlations but not the signal correlation or mean odor response
profile of any neuron.
Using this trial-shuffled ensemble activity data, we estimated decoding accuracy using the SVM
as described above. Note that this method creates only pair-wise correlations and will not
generate higher order correlations. The color map in Figure 8A was made by smoothing the
decoding accuracy obtained for a given slope and mean of noise correlations achieved after trial-
shuffling.
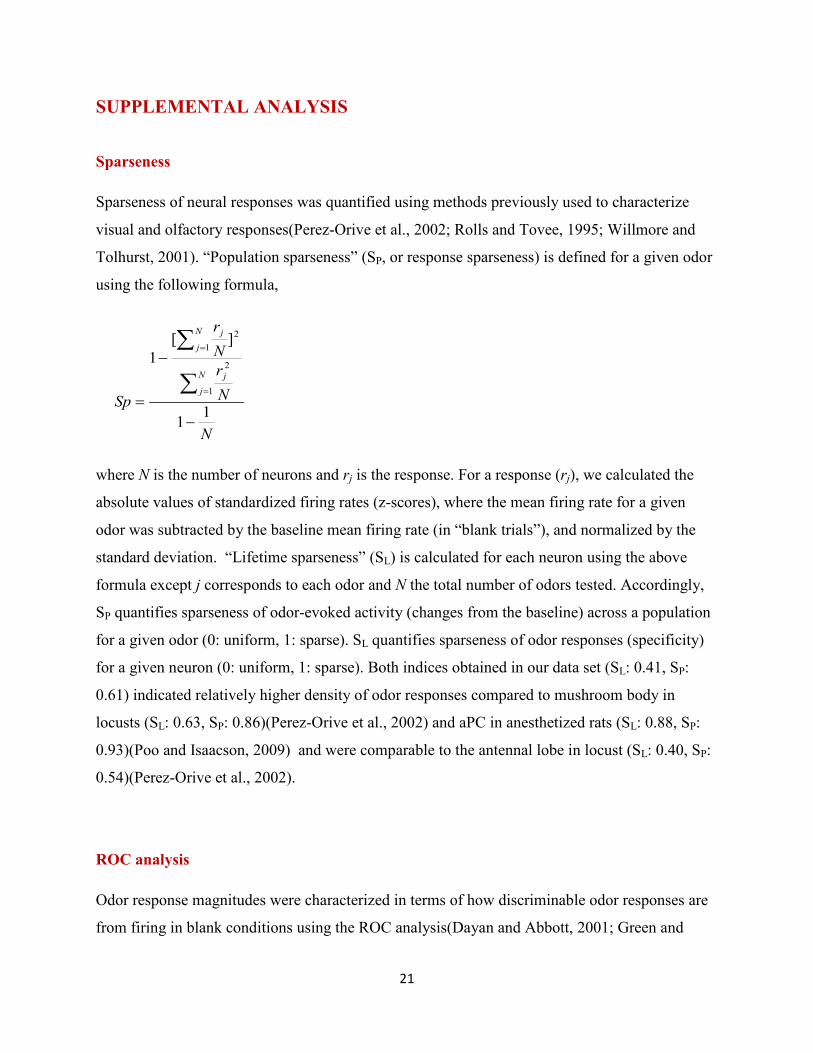
21
SUPPLEMENTAL ANALYSIS
Sparseness
Sparseness of neural responses was quantified using methods previously used to characterize
visual and olfactory responses(Perez-Orive et al., 2002; Rolls and Tovee, 1995; Willmore and
Tolhurst, 2001). “Population sparseness” (SP, or response sparseness) is defined for a given odor
using the following formula,
N
NrNr
Sp
N
jj
N
jj
11
][1
1
2
12
where N is the number of neurons and rj is the response. For a response (rj), we calculated the
absolute values of standardized firing rates (z-scores), where the mean firing rate for a given
odor was subtracted by the baseline mean firing rate (in “blank trials”), and normalized by the
standard deviation. “Lifetime sparseness” (SL) is calculated for each neuron using the above
formula except j corresponds to each odor and N the total number of odors tested. Accordingly,
SP quantifies sparseness of odor-evoked activity (changes from the baseline) across a population
for a given odor (0: uniform, 1: sparse). SL quantifies sparseness of odor responses (specificity)
for a given neuron (0: uniform, 1: sparse). Both indices obtained in our data set (SL: 0.41, SP:
0.61) indicated relatively higher density of odor responses compared to mushroom body in
locusts (SL: 0.63, SP: 0.86)(Perez-Orive et al., 2002) and aPC in anesthetized rats (SL: 0.88, SP:
0.93)(Poo and Isaacson, 2009) and were comparable to the antennal lobe in locust (SL: 0.40, SP:
0.54)(Perez-Orive et al., 2002).
ROC analysis
Odor response magnitudes were characterized in terms of how discriminable odor responses are
from firing in blank conditions using the ROC analysis(Dayan and Abbott, 2001; Green and
22
Swets, 1966). The area under the ROC curve (auROC) characterizes the discriminability of odor
trials from blank trials using the activity of a single neuron (Figures 3A, C, S3B). We used the
spike counts within a 40 - 160 ms window after first sniff onset following odor valve opening as
a neural response. The value of 0.5 indicates no response (chance discrimination). Values larger
than 0.5 represent excitatory responses (increase in firing), and those smaller than 0.5 inhibitory
responses (decrease in firing). One and zero represent perfect discriminability.
Correlations between single neuron activity and behavioral choice
We examined correlation between single neuron activity and behavioral choice using choice
probabilities of individual neurons (Figures 5F)(Britten et al., 1996). Choice probabilities were
computed for each neuron-odor pair. Only mixture trials were used to obtain greater numbers of
error trials. Only neuron- odor pairs that met the following two criteria were used: (1) one of the
odors activated strongly compared to another odor (responses of a given pair of odors differed by
auROC>0.7 or auROC<0.3) and (2) the numbers of correct and error trials were both greater
than five. aROC > 0.5 indicates that the animal made choices to the direction associated with the
neuron’s “preferred odor” more often when the neural response was greater (positive correlation
between activity and choice).
Fano factors
To characterize the variability of a spike count to multiple presentations of a given odor stimulus
in a manner which is relatively robust against the firing rate change, we used Fano factor
(Churchland et al., 2010; Koch, 1999) as a metric. The Fano factor was defined as the variance
over the mean of responses to the given odor stimulus and was computed for each neuron-odor
pair (Figures S6D).

23
SUPPLEMENTAL REFERENCES
Abbott, L.F., and Dayan, P. (1999). The effect of correlated variability on the accuracy of a
population code. Neural Comput 11, 91-101.
Averbeck, B.B., and Lee, D. (2003). Neural noise and movement-related codes in the macaque
supplementary motor area. J Neurosci 23, 7630-7641.
Bair, W., Zohary, E., and Newsome, W.T. (2001). Correlated firing in macaque visual area MT:
time scales and relationship to behavior. J Neurosci 21, 1676-1697.
Britten, K.H., Newsome, W.T., Shadlen, M.N., Celebrini, S., and Movshon, J.A. (1996). A
relationship between behavioral choice and the visual responses of neurons in macaque MT.
Vis Neurosci 13, 87-100.
Churchland, M.M., Yu, B.M., Cunningham, J.P., Sugrue, L.P., Cohen, M.R., Corrado, G.S.,
Newsome, W.T., Clark, A.M., Hosseini, P., Scott, B.B., et al. (2010). Stimulus onset
quenches neural variability: a widespread cortical phenomenon. Nat Neurosci 13, 369-378.
Cohen, M.R., and Maunsell, J.H. (2009). Attention improves performance primarily by reducing
interneuronal correlations. Nat Neurosci.
Cohen, M.R., and Newsome, W.T. (2008). Context-dependent changes in functional circuitry in
visual area MT. Neuron 60, 162-173.
Constantinidis, C., and Goldman-Rakic, P.S. (2002). Correlated discharges among putative
pyramidal neurons and interneurons in the primate prefrontal cortex. J Neurophysiol 88,
3487-3497.
Cury, K.M., and Uchida, N. (2010). Robust odor coding via inhalation-coupled transient activity
in the mammalian olfactory bulb. Neuron 68, 570-585.
Dayan, P., and Abbott, L.F. (2001). Theoretical neuroscience : computational and mathematical
modeling of neural systems (Cambridge, Mass., Massachusetts Institute of Technology
Press).
de la Rocha, J., Doiron, B., Shea-Brown, E., Josic, K., and Reyes, A. (2007). Correlation
between neural spike trains increases with firing rate. Nature 448, 802-806.
Duda, R.O., Hart, P.E., and Stock, D.G. (2001). Pattern Classification, 2nd edn (New York, A
Wiley-International Publication).
24
Feierstein, C.E., Quirk, M.C., Uchida, N., Sosulski, D.L., and Mainen, Z.F. (2006).
Representation of spatial goals in rat orbitofrontal cortex. Neuron 51, 495-507.
Gawne, T.J., Kjaer, T.W., Hertz, J.A., and Richmond, B.J. (1996). Adjacent visual cortical
complex cells share about 20% of their stimulus-related information. Cereb Cortex 6, 482-
489.
Gawne, T.J., and Richmond, B.J. (1993). How independent are the messages carried by adjacent
inferior temporal cortical neurons? J Neurosci 13, 2758-2771.
Green, D.M., and Swets, J.A. (1966). Signal detection theory and psychophysics (New York,
Wiley).
Gu, Y., Liu, S., Fetsch, C.R., Yang, Y., Fok, S., Sunkara, A., DeAngelis, G.C., and Angelaki,
D.E. (2011). Perceptual learning reduces interneuronal correlations in macaque visual cortex.
Neuron 71, 750-761.
Gutnisky, D.A., and Dragoi, V. (2008). Adaptive coding of visual information in neural
populations. Nature 452, 220-224.
Haberly, L.B. (1973). Summed potentials evoked in opossum prepyriform cortex. J Neurophysiol
36, 775-788.
Hastie, T., Tibshirani, R., and Friedman, J. (1995). The elements of statistical learning (New
York, Springer).
Huang, X., and Lisberger, S.G. (2009). Noise correlations in cortical area MT and their potential
impact on trial-by-trial variation in the direction and speed of smooth-pursuit eye movements.
J Neurophysiol 101, 3012-3030.
Hung, C.P., Kreiman, G., Poggio, T., and DiCarlo, J.J. (2005). Fast readout of object identity
from macaque inferior temporal cortex. Science 310, 863-866.
Josic, K., Shea-Brown, E., Doiron, B., and de la Rocha, J. (2009). Stimulus-dependent
correlations and population codes. Neural Comput 21, 2774-2804.
Kay, L.M., and Laurent, G. (1999). Odor- and context-dependent modulation of mitral cell
activity in behaving rats. Nat Neurosci 2, 1003-1009.
Kepecs, A., Uchida, N., and Mainen, Z.F. (2007). Rapid and precise control of sniffing during
olfactory discrimination in rats. J Neurophysiol 98, 205-213.
Koch, C. (1999). Biophysics of Computation (Oxford, Oxford University Press).

25
Kohn, A., and Smith, M.A. (2005). Stimulus dependence of neuronal correlation in primary
visual cortex of the macaque. J Neurosci 25, 3661-3673.
Lee, D., Port, N.L., Kruse, W., and Georgopoulos, A.P. (1998). Variability and correlated noise
in the discharge of neurons in motor and parietal areas of the primate cortex. J Neurosci 18,
1161-1170.
Mitchell, J.F., Sundberg, K.A., and Reynolds, J.H. (2009). Spatial attention decorrelates intrinsic
activity fluctuations in macaque area V4. Neuron 63, 879-888.
Narayanan, N.S., Kimchi, E.Y., and Laubach, M. (2005). Redundancy and synergy of neuronal
ensembles in motor cortex. J Neurosci 25, 4207-4216.
Perez-Orive, J., Mazor, O., Turner, G.C., Cassenaer, S., Wilson, R.I., and Laurent, G. (2002).
Oscillations and sparsening of odor representations in the mushroom body. Science 297, 359-
365.
Poo, C., and Isaacson, J.S. (2009). Odor representations in olfactory cortex: "sparse" coding,
global inhibition, and oscillations. Neuron 62, 850-861.
Quian Quiroga, R., and Panzeri, S. (2009). Extracting information from neuronal populations:
information theory and decoding approaches. Nat Rev Neurosci 10, 173-185.
Reich, D.S., Mechler, F., and Victor, J.D. (2001). Independent and redundant information in
nearby cortical neurons. Science 294, 2566-2568.
Rinberg, D., Koulakov, A., and Gelperin, A. (2006a). Sparse odor coding in awake behaving
mice. J Neurosci 26, 8857-8865.
Rinberg, D., Koulakov, A., and Gelperin, A. (2006b). Speed-accuracy tradeoff in olfaction.
Neuron 51, 351-358.
Rolls, E.T., and Tovee, M.J. (1995). Sparseness of the neuronal representation of stimuli in the
primate temporal visual cortex. J Neurophysiol 73, 713-726.
Sompolinsky, H., Yoon, H., Kang, K., and Shamir, M. (2001). Population coding in neuronal
systems with correlated noise. Phys Rev E Stat Nonlin Soft Matter Phys 64, 051904.
Soucy, E.R., Albeanu, D.F., Fantana, A.L., Murthy, V.N., and Meister, M. (2009). Precision and
diversity in an odor map on the olfactory bulb. Nat Neurosci 12, 210-220.
Uchida, N., and Mainen, Z.F. (2003). Speed and accuracy of olfactory discrimination in the rat.
Nat Neurosci 6, 1224-1229.

26
Uchida, N., Takahashi, Y.K., Tanifuji, M., and Mori, K. (2000). Odor maps in the mammalian
olfactory bulb: domain organization and odorant structural features. Nat Neurosci 3, 1035-
1043.
Wilke, S.D., and Eurich, C.W. (2002). Representational accuracy of stochastic neural
populations. Neural Comput 14, 155-189.
Willmore, B., and Tolhurst, D.J. (2001). Characterizing the sparseness of neural codes. Network
12, 255-270.
Wilson, R.I., and Mainen, Z.F. (2006). Early events in olfactory processing. Annu Rev Neurosci
29, 163-201.
Zohary, E., Shadlen, M.N., and Newsome, W.T. (1994). Correlated neuronal discharge rate and
its implications for psychophysical performance. Nature 370, 140-143.