Organisation and chemical neuroanatomy of the African elephant (Loxodonta africana) olfactory bulb
Analysis of Training-Induced Changes in Ethyl Acetate Odor MapsUsing a New Computational Tool to Map the Glomerular Layerof the Olfactory Bulb
Ernesto Salcedo1,2,3, Chunbo Zhang4,5, Eugene Kronberg1,2,3 and Diego Restrepo1,2,3
1Department of Cell and Developmental Biology, University of Colorado School of Medicine,Mail Stop 8108 PO Box 6511, Aurora, CO 80045, USA, 2Neuroscience Program, University ofColorado School of Medicine, Mail Stop 8108 PO Box 6511, Aurora, CO 80045, USA, 3RockyMountain Taste and Smell Center, University of Colorado School of Medicine, Mail Stop 8108PO Box 6511, Aurora, CO 80045, USA, 4Biology Division, BCPS, Illinois Institute of Technology,Chicago, IL 60616, USA and 5Center for Integrative Neuroscience and Neuroengineering,Illinois Institute of Technology, Chicago, IL 60616, USA
Correspondence to be sent to: Ernesto Salcedo, Department of Cell and Developmental Biology, University of Colorado at Denver and HealthSciences Center at Fitzsimons, Mail Stop 8108 PO Box 6511, Aurora, CO 80045, USA. e-mail: [email protected]
Abstract
Odor quality is thought to be encoded by the activation of partially overlapping subsets of glomeruli in the olfactory bulb (odormaps). Mouse genetic studies have demonstrated that olfactory sensory neurons (OSNs) expressing a particular olfactoryreceptor target their axons to a few individual glomeruli in the bulb. While the specific targeting of OSN axons provides amolecular underpinning for the odor maps, much remains to be understood about the relationship between the functionaland molecular maps. In this article, we ask the question whether intensive training of mice in a go/no-go operant conditioningodor discrimination task affects odor maps measured by determining c-fos up-regulation in periglomerular cells. Data analysis isperformed using a newly developed suite of computational tools designed to systematically map functional and molecularfeatures of glomeruli in the adult mouse olfactory bulb. This suite provides the necessary tools to process high-resolution digitalimages, map labeled glomeruli, visualize odor maps, and facilitate statistical analysis of patterns of identified glomeruli in theolfactory bulb. The software generates odor maps (density plots) based on glomerular activity, density, or area. We find thattraining up-regulates the number of glomeruli that become c-fos positive after stimulation with ethyl acetate.
Key words: c-fos, glomerulus, go/no-go operant conditioning, neuroinformatics, odor map, olfactory bulb
Introduction
At the cellular and molecular level, the sense of smell is
a complex task of odorant detection and signal processing
that entails the discrimination of thousands of volatile mol-ecules with diverse chemical structures. The mammalian ol-
factory system has evolved to handle this complex problem
by expressing in the olfactory epithelium a large array of
olfactory sensory neurons (OSNs), each tuned to a subset of
odorants with shared structural features (Buck, 2000). OSNs
with identical chemical sensitivities are distributed quasiran-
domly within circumscribed expression zones in the olfactory
epithelium. These OSNs extend their single axon into a fewdiscrete, spherical neuropil structures (glomeruli) in the glo-
merular layer of the main olfactory bulb (MOB) (Shepherd
et al., 2004). Thus, each glomerulus contains the axons from
several thousand OSNs, which, regardless of the location in
the soma of the epithelium, all express the same odorant
receptor (OR) (Vassar et al., 1993; Ressler et al., 1994;
Mombaerts et al., 1996). OSNs expressing the same ORtypically target two symmetric mirror areas in each olfactory
bulb. In this fashion, the responses of OSNs distributed
throughout the olfactory epithelium are organized into a
spatiotemporal pattern of glomerular activation at the first
synaptic neuropil in the MOB.
Many studies have shown region-specific increases in activ-
ity in the glomerular layer of the bulb in response to odor
exposure (Sharp et al., 1977; Royet et al., 1987; Friedrichand Korsching, 1998; Rubin and Katz, 1999; Nagao et al.,
2000; Johnson and Leon, 2000b; Wachowiak and Cohen,
2001; Schaefer et al., 2001b). Moreover, the response of glo-
meruli in the MOB appears to be arranged chemotopically
Chem. Senses 30: 615–626, 2005 doi:10.1093/chemse/bji055Advance Access publication September 1, 2005
ª The Author 2005. Published by Oxford University Press. All rights reserved.For permissions, please e-mail: [email protected]
by guest on Novem
ber 21, 2014http://chem
se.oxfordjournals.org/D
ownloaded from
(Johnson et al., 1999; Uchida et al., 2000; Johnson and Leon,
2000a). These independent lines of evidence support the
hypothesis that the glomerular arrangement in the olfactory
bulb provides an anatomical foundation for the encoding of
odorant quality and intensity. Indeed, the position of individ-ual glomeruli, while not invariant (Strotmann et al., 2000;
Schaefer et al., 2001a), can be determined within a 95% con-
fidence interval (Schaefer et al., 2001a). Thus, the position of
individual glomeruli and the overall glomerular synaptic ac-
tivity in theMOB serve as important metrics in the investiga-
tion of olfactory function and odor coding.
Methods used to detect glomerular activity throughout the
olfactory bulb include functional magnetic resonance imag-ing (fMRI), 2-deoxyglucose (2-DG) autoradiography, and
the in situ detection of immediate early genes (IEG) expression
such as Fos or Zif268. fMRI, which is performed in anesthe-
tized animals, tracks changes in spin relaxation properties
of water molecules thought to reflect activity-dependent
changes in blood flow (Xu et al., 2000b, Xu et al., 2005).
The other two methods require the sectioning of harvested
olfactory bulbs from sacrificed animals and thus lack a tem-poral aspect to the pattern. 2-DG autoradiography, which
tracks changes in cellular metabolism, labels the intensity
of cellular metabolism markers. The in situ detection of
IEG expression, which tracks odor-induced changes in the
expression pattern for mRNA or protein in juxtaglomerular
cells, can be used to label the individual locations of activated
glomeruli at the resolution of a single glomerulus (Sharp et al.,
1977; Guthrie et al., 1993; Sallaz and Jourdan, 1993; Johnsonet al., 1999; Johnson and Leon, 2000b; Inaki et al., 2002). Ul-
timately, all these methods generate a comprehensive spatial
pattern of glomerular activity elicited from a particular odor
that is typically referred to as an odor map (Xu et al., 2000a).
In this article, we study the effect of intensive training of
mice in a go/no-go operant conditioning odor detection task
on ethyl acetate (EA)–elicited odor maps measured through
the increased transcription of the IEG c-fos in periglomeru-lar cells. Go/no-go operant conditioning has been used
extensively to study the detection and discrimination of
odors by adult rodents (Slotnick and Bodyak, 2002). This
olfactory learning paradigm is particularly useful in the
study of olfactory deficits in mice (Munger et al., 2001;
Lin et al., 2004; Vedin et al., 2004) and has the advantage
that it can be used in a computer-controlled olfactometer
that can accurately deliver the stimulus and reinforcement(Bodyak and Slotnick, 1999). While operant conditioning
is increasingly being used in various studies, little is known
about the plastic changes that presumably take place in the
olfactory bulb during operant conditioning in adult mice. To
better understand these mechanisms, we examined the
changes in odor-induced c-fos expression patterns elicited
by operant conditioning training in the mouse MOB.
Changes in the induction of c-fos in the juxtaglomerularand granule cells of the MOB have been observed in early
preference learning in rats (Johnson et al., 1995). In addition,
familiarization with an odor has been shown to change the
extent of odor-elicited c-fos induction in granule cells in adult
rats (Montag-Sallaz and Buonviso, 2002). For our study, we
examined the distribution of odor-induced c-fos mRNA
up-regulation in juxtaglomerular cells throughout the entireMOB after operant conditioning and compared them to
odor maps in naı̈ve, mice.
To accurately compare the odor maps between animals, we
used a new suite of computational tools developed to map
activity patterns detected by markers such as 2-DG or IEGs.
Our software can also map the location of individual glomer-
uli labeled by a genetic marker such as b-galactosidase or
green fluorescent protein (GFP) (Mombaerts et al., 1996)to within biological variation.We designed this software suite
not only to implement our mapping technique (Schaefer
et al., 2001a), but also to be flexible enough to accommodate
othermappingmethods. Odormaps can be displayed individ-
ually as a two-dimensional (2-D) or three-dimensional (3-D)
representation, or in the case of the (3-D) representations, as
a combined odor map. In a combined representation, molec-
ularly tagged glomeruli can serve as fiduciary points relatingodor activity maps to the underlying probabilistic anatomical
map of OSN axon targeting the glomerular layer of the bulb.
Materials and methods
Operant conditioning
FVB mice approximately 3 months of age were water re-
stricted and divided into two groups, EA trained (trained)
and naı̈ve. Mice were trained using an operant conditioning
go/no-go paradigm in a Bodyak–Slotnick olfactometer as
described in Bodyak and Slotnick (1999). Briefly, water-
deprived mice were trained using water reinforcement to
sample a 2.0-s stimulus presentation. The mice were trained
to respond to the presence of an odor (S+ stimulus) by lickinga water delivery tube and refrained from responding in the
presence of no odor (S� stimulus). Trained mice were given
intensive operant conditioning training by taking them
through a training schedule designed to allow determination
of detection thresholds by the descending method of limits.
The S+ stimulus was EA diluted in mineral oil, and the S�stimulus was mineral oil. Subsequently, lower EA odor con-
centrations (a 1/40 dilution of air equilibrated with 10�2,10�2.3, 10�3, 10�4, 10�5, and 10�6% EA in mineral oil) were
tested in each of the go/no-go sessions. Each session was ter-
minated when a mouse reached criterion (when it responded
85% correct or better on three consecutive blocks of 20 trials).
Whenever possible, two sessions were run in each day.
Attempts to run more than two sessions per day were unsuc-
cessful because themicewould not behave in the olfactometer
in the third session. Testing was stopped when the mouserespondedbelow85%insixblocks.Asessionwhere themouse
was asked to detect the difference between two vials contain-
ingmineral oil (no EA added) was run to ensure that the mice
616 E. Salcedo et al.
by guest on Novem
ber 21, 2014http://chem
se.oxfordjournals.org/D
ownloaded from
were not cueing on nonchemosensory stimuli. During this
period, naı̈ve mice underwent water restriction by receiving
the same amount of water as the trained mice (1 ml daily).
Both groups of mice then received free access to water for a
week before assessment of odor-induced c-fos up-regulation.
Detection of c-fos–positive glomeruli
One week after training, mice were exposed to either air
(control) or amoderately strong concentrationofEA (greater
than 99% purity, Aldrich Chemical Company, St. Louis,
MO) mixed in mineral oil to a 0.01% concentration. Notice
that, in contrast to the behavioral experiments above, wherethere is a further 1/40 dilution with air, there is no further di-
lution in this experiment. After odor exposure, the mice were
immediately sacrificed and perfused with 4% paraformalde-
hyde. The olfactory bulbs were then harvested and cryopre-
served. Transverse serial sections (18 lm) of the olfactory
bulbs were cut in a plane perpendicular to the olfactory tract.
Antisense cRNA transcribed from a mouse recombinant
cDNA clone corresponding to positions 1842–1944 and2061–2493 of the mouse c-fos gene (MUSFOS) was used to
determine the expression of c-fosmRNA in the juxtaglomer-
ular cells (periglomerular and external tufted cells) surround-
ing glomeruli. In situ hybridizationwas performed as detailed
in Schaefer et al. (2001b). Glomeruli were scored as positive
when an arc of labeled juxtaglomerular cells spanning either
180� in any orientation or two 90� arcs spanning any region
were identified.
Mapping technique
Our mapping technique implements the coordinate system
and mapping procedure introduced in our previous studies
(Schaefer et al., 2001a,b). Using this technique, we map the
cylindrical coordinates of glomeruli onto the digital imagesof transverse cryosections of murine olfactory bulbs, which
must be sectioned perpendicular to the lateral olfactory tract
(Figure 1A, line L). The cylindrical coordinates are the
rostro–caudal distances measured from the anterior to the
posterior region of the bulb (Figure 1B), the angle around
a section (Figure 1C, angle between dashed line and origin
line), and the radius (Figure 1C, dashed line) from the origin
within each section. We use anatomical landmarks withinthebulb todetermine theorigins fromwhich these coordinates
are measured. The rostral landmark, which defines the ori-
gin of the rostro–caudal axis, contains the first clear mitral
cell and external plexiform layers (Johnson et al., 1999)
(Figure 1B, i). Distances posterior to this landmark are
indexed as positive numbers. The accessory olfactory bulb
(AOB) landmark contains the first, clear accessory bulb
(AOB) granule and glomerular layer (Figure 1B, iii). Thedistance from the origin landmark to the AOB landmark is
used to determine consistency in the cutting angle between
mice. Deviation from cuts perpendicular to the L plane (e.g.,
cutting perpendicular to the dorsal surface of the brain—the
C plane in Figure 1A) results in a variation in this distance.
To determine the rostro–caudal distance for a glomerulus,
we record the distance caudal to the rostral landmark for each
transverse section of interest by counting the number of sec-tions fromthe rostral origin landmark to the transverse section
containing the glomerulus. We then multiply that number by
the thickness of a section (typically 18 lm). At that point, for
the section containing the glomerulus, we determine the origin
and orientation of the 0�–180� axis for the cylindrical coordi-nate system by drawing a straight line from the dorsal to the
ventral mitral cell layers (Figure 1B, i–iv—black lines). The
definition of this origin line differs depending on the rostro–caudal location of the section as the anatomical landmarks
used to determine the origin and its orientation change along
this dimension.For each section rostral to theAOB landmark,
we draw a straight line that bisects the lower two-thirds of the
subependymalzone (SEZ),orienting the0�–180�axisalong thedorsoventral axis of the section (Figure 1B, i and ii). We set
the point of origin at one-third the distance from the dorsal
to the ventralmitral cell layers.Thus, inour coordinate system,0� corresponds approximately to the dorsal region of the bulb,
while 90�, 180�, and270� correspond to the lateral, ventral, andmedial regions of the bulb, respectively (Figure 1C). For sec-
tions cut at or caudal to the AOB landmark, we draw a line
from the granular cusp of the AOB to the ventral mitral cell
layer,maintaining anorientation that bisects the SEZ. In these
sections, we set the origin immediately dorsal to the granule
cusp of the MOB (Figure 1B, iii and iv). Once we have set apoint oforigin,we trace theperimeter at theboundarybetween
the external plexiform layer and the glomerular layer (Figure
1C), which allows us to convert angle coordinates to perimeter
measurements and vice versa.Next, we trace the outline of any
glomeruli of interest and record the coordinates. For example,
the small circle drawn on the cryosection in Figure 1C is a glo-
merulusmeasured to be at 58�using our coordinate system.As
this section is the 35th section from the rostral landmark ina bulb sectioned at 36lm,we record its rostro–caudal distance
as 1,260 lm. The location of the glomerulus in a map of angle
versus rostro–caudal distance is shown in Figure 1D. In this
plot, the index for the rostral landmark is set to one.
Mapping software
Our mapping software includes two programs for mapping
glomerular location: (1) a Java plugin (Glomerular Analysis)
for the open-source image processing program, ImageJ
(http://rsb.info.nih.gov/ij/) and (2) a more comprehensive
and flexible toolbox (GLOMdMAP OBS) for the cross-
platform MATLAB environment (The MathWorks, Inc.,
Natick, MA). Using either of these two software packages,
a user can open high-resolution digital images of olfactorybulbs and map the location of glomeruli across multiple sec-
tions. These maps can then be loaded into our MATLAB
statistical analysis toolbox, GLOMdMAP GDB, which is
Training-Induced Changes in Ethyl Acetate Odor Maps 617
by guest on Novem
ber 21, 2014http://chem
se.oxfordjournals.org/D
ownloaded from

capable of transforming the data into a 2-D density map or a
3-D surface representation of the 2-D density map. The soft-ware includes several algorithms to compare multiple 2-D
maps. While our mapping technique was developed for
the murine bulb sectioned perpendicular to the L plane
(see Figure 1A), our software can easily handle images cut
in other planes or from other species. In fact, the software
has been used to map glomeruli in such species as the sea
lamprey (B. Zielinkski, personal communication) and ferret
(Woodley et al., 2004). For bulbs sectioned in alternate planes,
the user will have to establish reliable anatomical landmarks
to orient the cylindrical coordinate axis in each section. To
map a single bulb using our software typically requires several
hours. Our software is available for download on theRestrepo
laboratory Web site (http://www.uchsc.edu/rmtsc/restrepo/,
under ‘‘Biomedical Info and TOOLS’’).
Glomerular analysis
Glomerular Analysis 2.0 (GlomA), a plugin for ImageJ, pro-
vides all the functionality of Glomerular Analysis 1.0, which
we first introduced in 2001 (Schaefer et al., 2001a). This
plugin includes the basic tools necessary to map glomeruliin the olfactory bulb as described in Mapping Technique.
GlomA allows users to open a digital image of an olfactory
bulb section, enter the rostro–caudal position of the section,
Figure 1 Mapping Method. (A) Lateral view of the mouse brain. Line L labels the plane parallel to the lateral olfactory tract along which the rostral–caudaldistance is measured, whereas lines V and C label the planes parallel to ventral and dorsal surfaces of brain, respectively. Line Ia labels an approximation of theinteraural line, as defined by Franklin and Paxinos (1997). The ilustration depicts an enlarged sagittal view of the olfactory bulb. The four labeled lines on thecartoon (i–iv) indicate the approximate rostro–caudal location of the sections shown in B. (B) Sequential transverse sections from an olfactory bulb cut per-pendicular to the lateral olfactory tract as depicted in the cartoon in A. The black line on each section indicates the orientation of the 0�–180� axis, and the doton the line indicates the location of the origin. (i) Rostral landmark. (iii) AOB landmark. (C, D) Screen shots fromGLOMdMAPOBS. (C) A digital image loaded intoOBS, with origin, perimeter, and glomerulus in black. (D) Scatterplot of the mapping information acquired in C. The cylindrical coordinates of the stampedglomerulus is approximately 58� and 789� lm. Panel A was reproduced with permission from Schaefer et al. (2001a).
618 E. Salcedo et al.
by guest on Novem
ber 21, 2014http://chem
se.oxfordjournals.org/D
ownloaded from
and draw a dorsoventral axis line. Once this axis is set, a user
then traces the glomerulus of interest on the digital image
using the built-in drawing tools of ImageJ. The software
records the cylindrical coordinates of the glomerulus along
with such information as the cross-sectional area of the glo-merulus and mean intensity of the pixels inside the selection.
The plugin provides immediate visual feedback for the user
by plotting the cylindrical coordinates of stamped glomeruli
on a 2-D scatterplot. Mapped data are saved as a text file.
GlomAoffers the following improvements over its previous
version. (1)Multiple methods to set the origin, accommodat-
ing the technique detailed in Mapping Technique and an
alternate technique detailed by the Johnson et al. method(Johnson et al., 1999). (2) The ability to draw and calibrate
aglomerularperimeter.Onceaglomerularperimeterhasbeen
manually traced and calibrated, our software records both
geometricandcylindrical coordinatesofaglomerulus. (3)Ad-
ditional information recorded when a glomerulus is stamped,
including the distance of the stamped glomeruli along the glo-
merular perimeter and RGB pixel intensity information. (4)
More flexible 2-D map display options. (5) ‘‘Group ID’’ des-ignation (an integer number), facilitating the statistical com-
parisonof different data sets using our data analysis software,
GLOMdMAPGDB. (6)An ‘‘UNDO’’button,which removes
the recorded information from the last glomerular stamp. (7)
The ability to mark damaged areas in a particular section
(‘‘Stamp Gap’’), which is important for statistical analysis
of the data (see Transformation and Analysis Software).
GLOMdMAP OBS
We have recently transferred the capabilities of GlomA into
the MATLAB development environment. MathWorks
products have been widely adopted in the academic commu-
nity for teaching and research in a broad range of technicaldisciplines (The MathWorks, Inc.). By rewriting the GlomA
code into the MATLAB programming language, we have
accelerated our developmental cycle, facilitated customiza-
tion, improved the mapping capabilities, and increased the
user-friendliness of the software. We call this new software
module GLOMdMAP OBS (OBS) (Figure 1C,D).
In addition to the capabilities provided by GlomA, OBS
allows for text designation of Group ID (e.g., ‘‘control’’),making database management less confusing and more
user-friendly (see Transformation and Analysis Software).
Users can also indicate the sex of the animal being mapped.
The index of a section can easily be changed, or all indices
can be offset if further analysis indicates that the anatomical
landmarks were initially set incorrectly. Moreover, the map-
ping tools have been vastly improved. The origin can now be
set anywhere along the axis line, allowing a user to customizethe location of the origin. There is a ‘‘multi-stamp’’ tool,which allows a user to quickly and repeatedly stamp glomer-
uli of a predesignated size with a click of the mouse. Marking
damaged areas of a tissue section is simpler and more intu-
itive. A user can now set the color of each mapping object to
better contrast the tissue labeling method employed or to
color-label objects for more complex data sets. Also, any
mapping object (e.g., axis line or glomerular trace) placed
on a digitized section can be moved or deleted at any time,and the changes will be reflected immediately in the data file.
In addition, OBS includes a navigable scatterplot (Figure
1D): a simple click on a data point brings up the digital image
of the referenced section and the associated mapping objects.
The program also includes export capabilities that allow
a user to save scatterplots as images in industry standard for-
mats such as Encapsulated PostScript, Adobe Illustrator,
Tagged image file format, and Portable document format.
Transformation and analysis software
The new GLOMdMAP GDB (GDB) module combines the
functionality of our discontinued transformation and anal-
ysis software, TodMatrix (Schaefer et al., 2001b), with a graph-
ical user interface (GUI). GDB also adds plotting capabilitiesand new statistical functions. GDB has two windows: a data
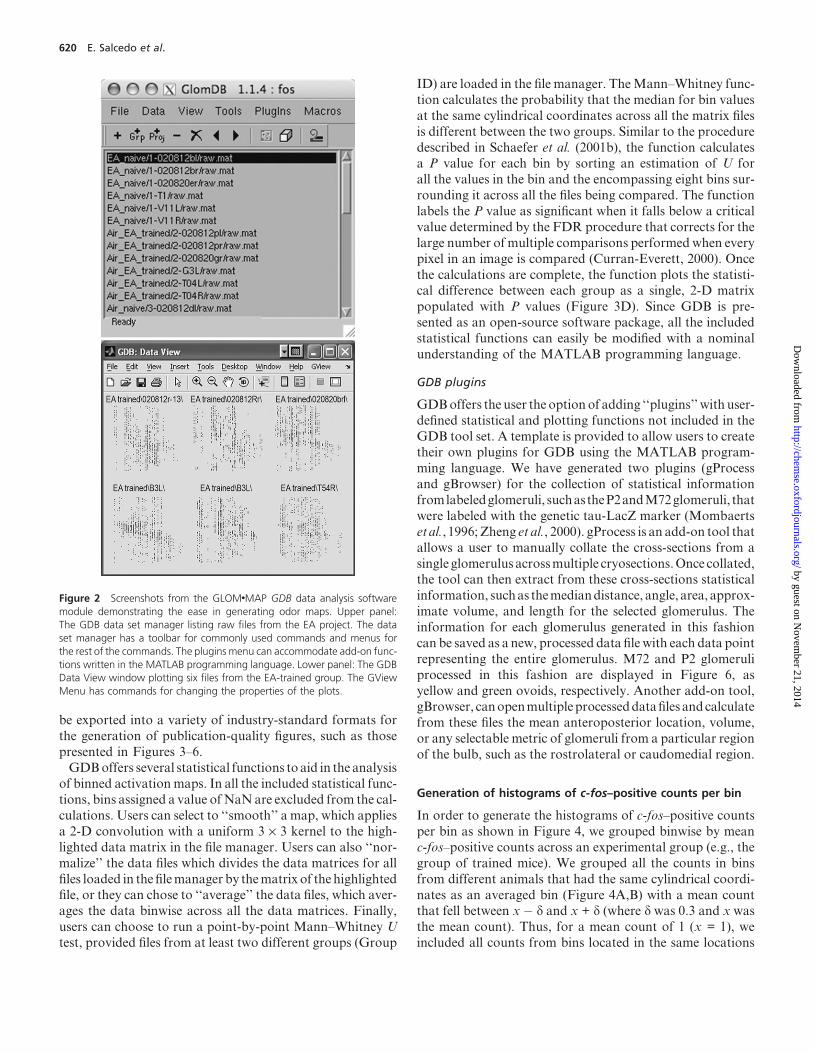
set manager window and a data viewer window (Figure 2).
Using thedata setmanager, auser can rapidly importmultiple
raw data files generated in eitherGlomAorOBS (Figure 2B).
These files are converted into a raw data set file that can be
read by GDB and then sorted, based on Group ID (see map-
ping software), into a directory-based database that draws on
the strength and flexibility of the host operating system. Afterimport, each data set file can be added to the data setmanager
either individually or enmasse based on theGroup IDof each
data set.Once added to the data setmanager,GDB functions,
such as generating a binned activationmap, can be run simul-
taneously, greatly accelerating the work flow. Alternatively,
a user can export the data to an Excel (Microsoft, Inc.,
Redmond,WA) spreadsheet and analyze the data from there.
To generate each activation map, the software performsa histogram count on the raw data, grouping the positive glo-
merular counts into bins of 10� (or 1/36 the maximum perim-
eter length) and 72 lm. Bins that do not have a value—e.g.,
bins in areas of the sample where the tissue was marked
‘‘damaged’’ (and subsequently not mapped)—are assigned the
value ‘‘NaN’’ (not-a-number). Once the data files are trans-
formed, the activation maps are plotted as 2-D density plots
(Figure 3A–C). For each plot, the cylindrical coordinates ofeach bin are plotted along the x and y axes, while the color
of the bin represents the bin value. GDB provides many con-
trolstodisplaythedata, includingastandardized2-Dplotview
or a statistical log view. NaN and false discovery rate (FDR)
outlines can be added or removed, as required. GDB can also
plot activity maps in 3-D and can add glomeruli to this 3-D
view as shown in Figure 6. Note that while these 3-D plots
are useful, they should be used for visualization purposes onlyandshouldnotbeusedtoinferanystatisticalconclusions.Also
note that the anterior portion of the bulb will be added in a
future version of the software. Once displayed, all plots can
Training-Induced Changes in Ethyl Acetate Odor Maps 619
by guest on Novem
ber 21, 2014http://chem
se.oxfordjournals.org/D
ownloaded from
be exported into a variety of industry-standard formats for
the generation of publication-quality figures, such as those
presented in Figures 3–6.GDBoffers several statistical functions to aid in the analysis
of binned activationmaps. In all the included statistical func-
tions, bins assigned a value ofNaN are excluded from the cal-
culations. Users can select to ‘‘smooth’’ a map, which applies
a 2-D convolution with a uniform 3 · 3 kernel to the high-
lighted data matrix in the file manager. Users can also ‘‘nor-malize’’ the data files which divides the data matrices for all
files loaded in the filemanager by thematrix of the highlightedfile, or they can chose to ‘‘average’’ the data files, which aver-
ages the data binwise across all the data matrices. Finally,
users can choose to run a point-by-point Mann–Whitney U
test, provided files from at least two different groups (Group
ID) are loaded in the file manager. TheMann–Whitney func-
tion calculates the probability that the median for bin values
at the same cylindrical coordinates across all the matrix files
is different between the two groups. Similar to the procedure
described in Schaefer et al. (2001b), the function calculatesa P value for each bin by sorting an estimation of U for
all the values in the bin and the encompassing eight bins sur-
rounding it across all the files being compared. The function
labels the P value as significant when it falls below a critical
value determined by the FDR procedure that corrects for the
large number ofmultiple comparisons performedwhen every
pixel in an image is compared (Curran-Everett, 2000). Once
the calculations are complete, the function plots the statisti-cal difference between each group as a single, 2-D matrix
populated with P values (Figure 3D). Since GDB is pre-
sented as an open-source software package, all the included
statistical functions can easily be modified with a nominal
understanding of the MATLAB programming language.
GDB plugins
GDBoffers the user the optionof adding ‘‘plugins’’with user-defined statistical and plotting functions not included in the
GDB tool set. A template is provided to allow users to createtheir own plugins for GDB using the MATLAB program-
ming language. We have generated two plugins (gProcess
and gBrowser) for the collection of statistical information
fromlabeledglomeruli, suchastheP2andM72glomeruli, that
were labeled with the genetic tau-LacZ marker (Mombaerts
etal., 1996; Zheng et al., 2000). gProcess is an add-on tool that
allows a user to manually collate the cross-sections from a
single glomerulus acrossmultiple cryosections.Once collated,the tool can then extract from these cross-sections statistical
information, suchas themediandistance, angle, area, approx-
imate volume, and length for the selected glomerulus. The
information for each glomerulus generated in this fashion
can be saved as a new, processed data filewith each data point
representing the entire glomerulus. M72 and P2 glomeruli
processed in this fashion are displayed in Figure 6, as
yellow and green ovoids, respectively. Another add-on tool,gBrowser, canopenmultipleprocesseddatafiles andcalculate
from these files the mean anteroposterior location, volume,
or any selectable metric of glomeruli from a particular region
of the bulb, such as the rostrolateral or caudomedial region.
Generation of histograms of c-fos–positive counts per bin
In order to generate the histograms of c-fos–positive counts
per bin as shown in Figure 4, we grouped binwise by mean
c-fos–positive counts across an experimental group (e.g., the
group of trained mice). We grouped all the counts in bins
from different animals that had the same cylindrical coordi-
nates as an averaged bin (Figure 4A,B) with a mean countthat fell between x � d and x + d (where d was 0.3 and x was
the mean count). Thus, for a mean count of 1 (x = 1), we
included all counts from bins located in the same locations
Figure 2 Screenshots from the GLOMdMAP GDB data analysis softwaremodule demonstrating the ease in generating odor maps. Upper panel:The GDB data set manager listing raw files from the EA project. The dataset manager has a toolbar for commonly used commands and menus forthe rest of the commands. The plugins menu can accommodate add-on func-tions written in the MATLAB programming language. Lower panel: The GDBData View window plotting six files from the EA-trained group. The GViewMenu has commands for changing the properties of the plots.
620 E. Salcedo et al.
by guest on Novem
ber 21, 2014http://chem
se.oxfordjournals.org/D
ownloaded from
as the averaged bins that had a mean between 0.7 and 1.3
(Figure 4A, blue squares). In order to generate the histogramfor Figure 4C, a bin of 10 · 72 lm was used, while for the
histogram in Figure 4D, larger bins of 30 · 72 · 3 lm were
used. The histograms were fit with a Poisson distribution
using the nonlinear least squares fit function of MATLAB.
Results
The number of EA-induced c-fos–positive glomeruli is
larger in trained mice compared to naı̈ve mice
We used GlomA to map c-fos activity in response to EA ex-
posure in the olfactory bulbs of two groups of animals
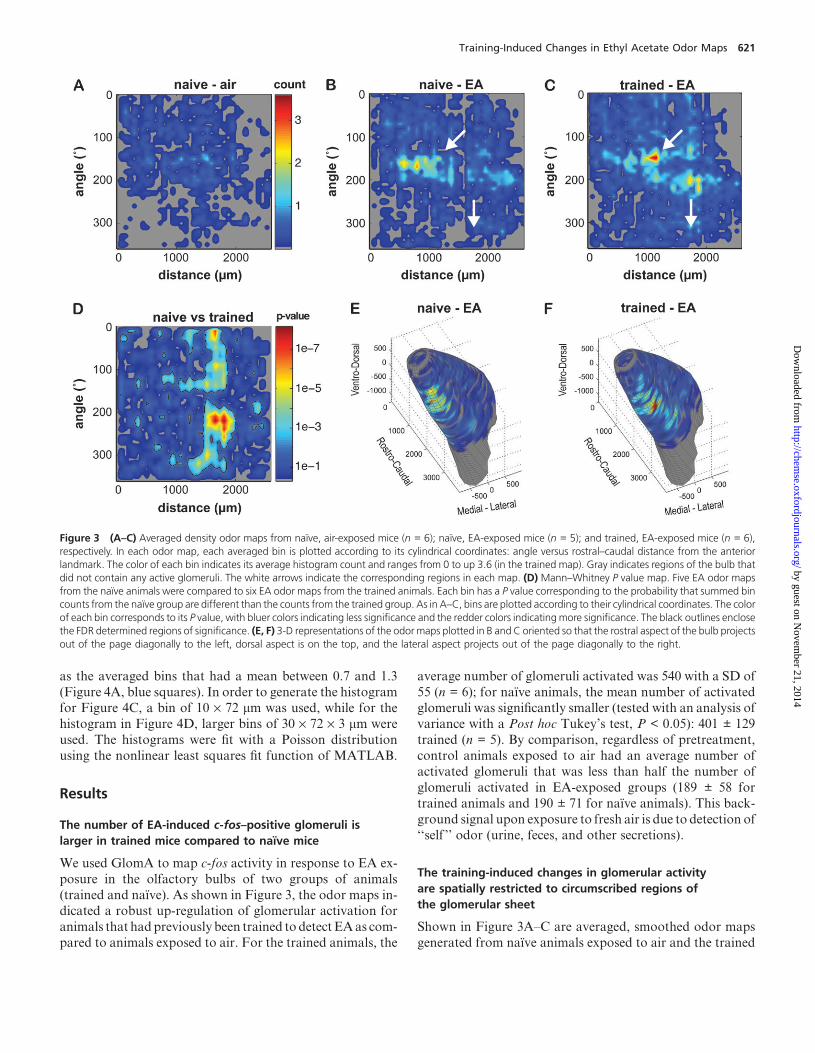
(trained and naı̈ve). As shown in Figure 3, the odor maps in-dicated a robust up-regulation of glomerular activation for
animals that hadpreviously been trained to detectEAas com-
pared to animals exposed to air. For the trained animals, the
average number of glomeruli activated was 540 with a SD of
55 (n = 6); for naı̈ve animals, the mean number of activatedglomeruli was significantly smaller (tested with an analysis of
variance with a Post hoc Tukey’s test, P < 0.05): 401 ± 129
trained (n = 5). By comparison, regardless of pretreatment,
control animals exposed to air had an average number of
activated glomeruli that was less than half the number of
glomeruli activated in EA-exposed groups (189 ± 58 for
trained animals and 190 ± 71 for naı̈ve animals). This back-
ground signal upon exposure to fresh air is due to detection of‘‘self ’’ odor (urine, feces, and other secretions).
The training-induced changes in glomerular activity
are spatially restricted to circumscribed regions of
the glomerular sheet
Shown in Figure 3A–C are averaged, smoothed odor maps
generated from naı̈ve animals exposed to air and the trained
Figure 3 (A–C) Averaged density odor maps from naı̈ve, air-exposed mice (n = 6); naı̈ve, EA-exposed mice (n = 5); and trained, EA-exposed mice (n = 6),respectively. In each odor map, each averaged bin is plotted according to its cylindrical coordinates: angle versus rostral–caudal distance from the anteriorlandmark. The color of each bin indicates its average histogram count and ranges from 0 to up 3.6 (in the trained map). Gray indicates regions of the bulb thatdid not contain any active glomeruli. The white arrows indicate the corresponding regions in each map. (D) Mann–Whitney P value map. Five EA odor mapsfrom the naı̈ve animals were compared to six EA odor maps from the trained animals. Each bin has a P value corresponding to the probability that summed bincounts from the naı̈ve group are different than the counts from the trained group. As in A–C, bins are plotted according to their cylindrical coordinates. The colorof each bin corresponds to its P value, with bluer colors indicating less significance and the redder colors indicatingmore significance. The black outlines enclosethe FDR determined regions of significance. (E, F) 3-D representations of the odor maps plotted in B and C oriented so that the rostral aspect of the bulb projectsout of the page diagonally to the left, dorsal aspect is on the top, and the lateral aspect projects out of the page diagonally to the right.
Training-Induced Changes in Ethyl Acetate Odor Maps 621
by guest on Novem
ber 21, 2014http://chem
se.oxfordjournals.org/D
ownloaded from

and naı̈ve animals exposed to EA. Although plotted using
different coordinates, the EA activity map in the naı̈ve ani-
mals appears to correlate well with the EA activity maps
detected in mice using fMRI (Xu et al., 2003). At a glance,
the map from the naı̈ve animals displays some dissimilarity
to the map from the trained animals. The trained animals
appear to have a pair of intense activation peaks and an area
of medial activity (Figure 3C and F, white arrows), whereasthe corresponding peak in the naı̈ve animals is less intense
and more diffuse and the medial activity is less extensive
(Figure 3B and E: see arrows). To determine the statistical
significance of this dissimilarity, we ran a point-by-point
Mann–Whitney test with false discovery correction on the
density files from the two groups. As shown in Figure 3D,
there is a significant region of dissimilarity in the caudal
region of the bulb, particularly between 1,200 and 2,000 lm.
Counts of c-fos–positive glomeruli within each bin
in the odor map follow Poisson statistics
In order to better understand the nature of the variance
within c-fos odor maps, we sought to understand the statis-tical distribution of counts of c-fos–positive glomeruli within
each bin of the odor map. Shown in Figure 4 are the histo-
grams (bar graphs) of c-fos–positive glomeruli within bins
across trained group activity maps that had a mean countof either 1 (Figure 4A) or 5 (Figure 4B) (see Methods for
details on how these histograms were generated). As depicted
by the dashed line and yellow diamonds, these counts are
proportional to a Poisson probability distribution
P = e�llk=k!;
where P is the probability for a given k, l is the mean count,
and k is the number of counts per bin. We found a similar
distribution for other values of mean count (l) as well as inthe activity maps from the naı̈ve animals and in odor maps ofa previously published study of urine-elicited odor activity
maps (Schaefer et al., 2001b) (data not shown), indicating
that activation of c-fos in the glomerular layer of the olfac-
tory bulb follows a Poisson distribution.
Figure 4 Histograms of c-fos–positive counts have a Poisson distribution.Details for generating these histograms can be found in Methods. (A) Aver-age of all c-fos density plots from EA-trained animals. Blue squares indicatebins that had an average c-fos–positive count falling between 0.7 and 1.3.(B) Smoothed average of c-fos density plots from all EA-trained animals.Red squares indicate bins with an average count of between 4.7 and 5.3.(C) A histogram of the counts from the bins in each individual density plotcorresponding to the blue bins in the averaged plot. (D) A histogram of thecounts from the bins in each individual density plot corresponding to thered bins in the smoothed, averaged plot. Yellow diamonds: least squaresfit of the Poisson distribution.
Figure 5 Simulated activity maps. (A) A flat map populated with Poisson-distributed random numbers across both rows and columns with a samplemean l of 5. The color bar is mapped to the range of counts found acrossbins in (A) and (B), with 1 count mapped to blue and >14 counts mapped tored. (B) A ramp map populated with Poisson-distributed random numberswhere the sample means l increase incrementally across columns from 1to 10. (C) Mann–Whitney P value map from a comparison of six ramp mapswith six flat maps that have a sample mean l of 5 (as shown in A). The solidblack outlines enclose regions of significance determined by the FDR. (D) Pvalues as a function of the difference between mean counts (D). Because Pvalues change by orders of magnitude, the negative of the logarithm of theP value is shown in the vertical axis. D = the difference between the meancount per bin (l) used in the generation of Poisson-distributed numbers in thecolumns of the ramps (‘‘columnmeans’’) minus themean of counts per bin (l)in the flat map (varied from 1 to 5). Red = ramp maps compared to flat mapswith a count per bin mean of 1. Blue = ramp maps versus flat maps witha mean of 2. Green = ramp map versus flat maps with a mean of 5. Thedashed horizontal lines are the FDR cut-off values. Negative log P valuesabove the FDR cut-off line are considered significant. Inset: expandedhorizontal axis.
622 E. Salcedo et al.
by guest on Novem
ber 21, 2014http://chem
se.oxfordjournals.org/D
ownloaded from
Validation of the Mann–Whitney statistical test used to
determine significance of differences between odor maps
To validate the Mann–Whitney test for determining the sta-
tistical significance of differences in odor maps, we generated
multiple, simulated activity maps, exploiting the fact that
counts of c-fos–positive glomeruli vary according to Poissonstatistics (see Figure 5). We generated two types of 37 · 37
simulated map matrices: a ‘‘flat’’ map and a ‘‘ramp’’ map.
Each flat matrix was filled with random Poisson-distributed
numbers with sample means of 1, 2, or 5 across the entire
matrix (in concordance with typical per bin values found
in our measured odor maps). Figure 5A shows a flat matrix
with a mean value of 5. Each ramp matrix (Figure 5B) was
filled with random Poisson-distributed numbers distributedacross the matrix rows with sample means that incrementally
increased across the matrix columns from 1 to 10. We used
the GDB Mann–Whitney function to compare six indepen-
dently generated flat matrices with six ramp matrices. The
Mann–Whitney calculated two large regions of significance
between column means 1–4 and 6–10 in the ramp matrix,
with a single large region lacking statistical significance
centered around ramp column means 4–6 (Figure 5C). Asexpected, the region with amean between 4 and 6 in the ramp
matrix is not significantly different because it is being com-
pared with a flat matrix with amean of 5. Similar results were
seen in the comparison of the ramp maps to flat maps with
sample means of 1 and 2 (not shown). For each Mann–
Whitney P value matrix, we calculated an average P value
for the replicates across rows in the same column. Figure
5D shows the negative logarithm of these P values plottedas a function of the difference (D) between the column mean
of the ramp matrices (1–10) and the mean value for the flat
matrices (1, 2, or 5). The horizontal dotted lines indicate the
FDR cut-off for significance. P values that fall below these
lines are not considered significantly different from control,while values above the lines are considered to be significantly
different. Importantly, the P value fell substantially below
FDR when the mean value for the counts were both 5,
ensuring that our statistical test rarely rejects a true null
hypothesis (i.e., finds that the two samples have different
means when in fact they have the same mean; also known
as a Type I or false alarm error).
Discussion
In this article, we have demonstrated the effects that inten-sive behavioral training can have on odorant-induced activ-
ity in the glomerular layer of the olfactory bulb. Using c-fos
up-regulation as a marker of glomerular activity, we tracked
the responsiveness of the glomerular layer to EA in mice
trained by go/no-go operant conditioning task of Bodyak
and Slotnick (1999) and in naı̈ve mice. We analyzed the data
using a new suite of computational tools suitable for map-
ping and performing statistical comparisons of odor-inducedactivity in the glomerular layer of the olfactory bulb. We
showed that the EA odor maps of the trained and naı̈ve ani-
mals have differences that are statistically significant. In ad-
dition, we showed that counts of c-fos–positive glomeruli per
bin in our odor maps follow Poisson statistics. This allowed
us to perform a validation of the Mann–Whitney statistical
test of differences among c-fos odor maps used in our com-
putational suite.
Methods for mapping activity in the olfactory bulb
Amore comprehensive understanding of the molecular basisof odor activity maps requires the reproducible mapping of
functional and molecular features in the glomerular layer of
the olfactory bulb. Our software facilitates mapping using
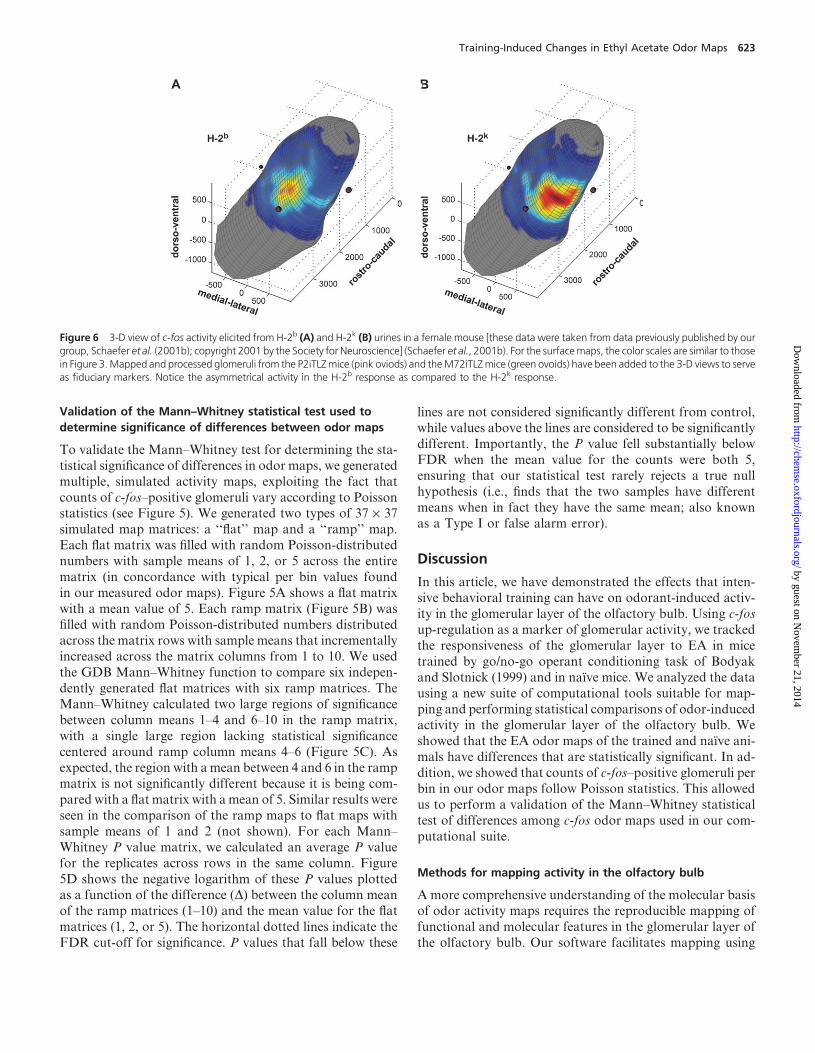
Figure 6 3-D view of c-fos activity elicited from H-2b (A) and H-2k (B) urines in a female mouse [these data were taken from data previously published by ourgroup, Schaefer et al. (2001b); copyright 2001 by the Society for Neuroscience] (Schaefer et al., 2001b). For the surfacemaps, the color scales are similar to thosein Figure 3.Mapped and processed glomeruli from the P2iTLZmice (pink oviods) and theM72iTLZmice (green ovoids) have been added to the 3-D views to serveas fiduciary markers. Notice the asymmetrical activity in the H-2b response as compared to the H-2k response.
Training-Induced Changes in Ethyl Acetate Odor Maps 623
by guest on Novem
ber 21, 2014http://chem
se.oxfordjournals.org/D
ownloaded from
the method developed by our group for the mouse olfactory
bulb (Schaeffer et al., 2001a,b) based on the method formu-
lated by Johnson et al. (1999) to map 2-DG activity maps in
rats (Johnson and Leon, 1996). A related mapping tool
(OdorMapBuilder) was recently generated by Liu and co-workers to allow mapping of odor maps measured in fMRI
studies (Liu et al., 2004). The open-source software presented
here allows reproducible mapping of molecularly tagged glo-
meruli or glomerular activity. Because our method yields
maps that can be compared from animal to animal, the maps
can be stored in a database and incrementally added to
a global functional–molecular odor map. This powerful
computational tool will facilitate a thorough understandingof the molecular basis for information content in odor maps.
Our software consists of GlomA and GLOMdMAP. GlomA
is an updated plugin (Schaefer et al., 2001a) for the National
Institutes of Health–sponsored image-processing program
(ImageJ) that can be used to map glomeruli. GLOMdMAP
is a self-contained mapping and analysis tool that includes
two toolboxes written in the MATLAB development envi-
ronment. The GLOMdMAP OBS toolbox includes the func-tionality of GlomA plus many improvements, whereas
GLOMdMAP GDB is our new data analysis toolbox, which
overhauls the functionality of TodMatrix (Schaefer et al.,
2001b) and provides some new GUI elements that greatly
simplify and accelerate the work flow.
Comparison with published EA odor maps
We used our software to determine potential differences be-
tween odor maps for two groups of mice: mice trained to dis-
criminate EA in an olfactometer and mice that were not.
After the training period, we exposed both groups of mice
to EA and then recorded the glomerular activity pattern
using GlomA. Using GDB to generate 2-D odor maps, we
compared our maps to EA maps generated in other labora-tories using different techniques and different species of ani-
mals. Interestingly, the EA activity maps detected by c-fos in
naı̈ve mice appear to correspond nicely with the EA activity
maps detected in anesthetized mice by fMRI (Xu et al.,
2005), but appear to differ from the EA maps detected by
2-DG in rats (http://leonlab.bio.uci.edu/), which lack signifi-
cant activity in the ventral region of the bulb.While it may be
argued that the different detectionmethodologies could haveintroduced conflicting mapping artifacts, the odor maps
from odorants such as aliphatic alcohols, acids, and ketones
appear to have good agreement between mice and rat as
found in a comparison of fMRI and IEG expression odor
maps in mouse (Inaki et al., 2002; Xu et al., 2005) with those
of Michael Leon and Bret Johnson in rat (http://leonlab.
bio.uci.edu/). Thus, the fact that the EA odor maps from
mice and rats appear to differ suggests a species-specific dif-ference in the distribution of odorant-induced activity in the
ventral areas of the glomerular layer of the olfactory bulb.
Clearly, further work is necessary to investigate this potential
difference between species. A particularly intriguing possibil-
ity is that in mice the ventral area of the olfactory bulb
might be specialized in responding to socially relevant odors.
In support of this contention, we have found that putative
pheromones elicit activity in the ventral area of the olfactorybulb in mice defective for subunit A2 of the cyclic nucleotide-
gated channel (Lin et al., 2004). We also have evidence show-
ing that the population of OSNs targeting the ventral region
of murine bulb expresses unique transduction components
such as the transient receptor potential m5 ion channel
(Lin et al., 2005).
c-fos–positive counts follow Poisson statistics
To study the nature of the variability in our odor maps, we
calculated the distribution of c-fos–positive counts per bin
and discovered that they follow a Poisson distribution
(Figure 4A,B). The Poisson distribution has been used to
describe a wide range of biological phenomena and may
have important implications for our data. For example, these
data support the contention that from mouse to mouse, glo-
meruli become c-fos–positive in a probabilistic all or nonefashion, providing further evidence that the glomeruli them-
selves are activated in an all or none fashion (Xu et al.,
2000a). The fact that histograms of c-fos–positive counts
had a distribution proportional to the Poisson distribution
allowed us to validate the use of the Mann–Whitney U sta-
tistical test for comparing odor maps. Our results indicate
that this test is suitable for determining the statistical signifi-
cance of differences in c-fos–positive counts throughout theglomerular layer.
Training induces changes in EA odor maps
We analyzed the EA odor maps using a point-by-point
Mann–Whitney U test statistical function. From this analy-
sis, we discovered several statistically significant regions of
variability in the odor maps between the two groups, sug-gesting a change at the cellular level that coincides with ol-
factometer training. In these experiments, we are measuring
c-fos expression in juxtaglomerular cells. Because activity in
these cells is affected not only by input from the OSNs, but
also by feedback from other juxtaglomerular cells as well
as mitral cells (Wilson et al., 1996; Schoppa et al., 1998;
Shepherd et al., 2004), this change in the c-fos activity maps
likely reflect a change in signal processing elicited in theolfactory bulb by training in the Bodyak and Slotnick
olfactometer. However, the changes could also reflect pe-
ripheral changes in OSN populations (Watt et al., 2004).
Further experiments are necessary to determine the causes
of training-induced changes in odor signal processing.
Our computational tools allow relating odor maps to
molecular maps in the glomerular layer
Perhaps the most significant contribution of our software
will be to facilitate the systematic development of a database
624 E. Salcedo et al.
by guest on Novem
ber 21, 2014http://chem
se.oxfordjournals.org/D
ownloaded from

that relates functional to molecular features. We demon-
strate this potential by relating urine odor activity maps
to the location of molecularly tagged glomeruli (Figure 6).
While it is clear that molecularly identified glomeruli are
arranged in twomirror maps in the glomerular layer, the axis
of symmetry of this arrangement is not related in a simple
manner to anatomical features in the bulb. However, the axisof symmetry can be revealed by relating functional maps to
molecular maps. Indeed, Inaki and coworkers have studied
odor maps in mouse and related them to molecular feature
maps set by patterns of expression of the Rb8 neural cell ad-
hesion molecule (RNCAM/OCAM) and neuropilin-1, which
are preferentially expressed in circumscribed areas in the glo-
merular layer in the olfactory bulb (Inaki et al., 2002). In this
study, we illustrate the usefulness of our software by relating
urine odor activitymaps to identified glomeruli. In a previous
study, we compared c-fos activation in a female olfactory
bulb elicited by urine obtained from two different haplotypesof mice (Schaefer et al., 2001b). The 2-D odor maps gener-
ated with GDB were identical to the maps we reported in
Schaefer et al. (2001b, data not shown). Furthermore, a
3-D examination of these maps plotted withM72 and P2 glo-
meruli (Figure 6) highlights a curious feature of the maps:
whereas the H-2k map is fairly symmetrical along the ventral
surface of the bulb, the H-2b map is shifted asymmetrically
towards the ventro-medial surface. This shift is surprising
considering that the typical response to a single chemical fea-
ture has been demonstrated to be symmetrical (Johnsonet al., 1999; Inaki et al., 2002) and suggests that the response
elicited from a complex odor may be more complicated than
a simple summation of its individual components. Because
these odor maps were determined by c-fos up-regulation,
which is a measure that could be influenced by interglomer-
ular as well as intraglomerular processing, the asymmetry in
the odor maps may be due to mirror differences in local pro-
cessing of the signal. Alternatively, the asymmetry may be due
to differences in accessibility of the odorants to the OSNs in-
nervating the two mirror glomerular maps. The asymmetry of
the H-2b map becomes evident when related to the molecu-larly labeled glomeruli in the 3-D view, highlighting the im-
portance of visualizing the data in both 2-D and 3-D.
Our software provides a comprehensive means to map and
examine, at a single glomerular resolution, odor-induced
glomerular activity and molecular features of glomeruli
throughout the olfactory bulb. We have added tools to
greatly simplify and accelerate the work flow. While our cur-
rent mapping software can be used to consistently map glo-
meruli from a bulb cut in a specific plane, it is limited by theneed to have well-defined anatomical landmarks for the ori-
entation of each section. To overcome this obstacle, we in-
tend to develop amore universal mapping technique that will
allow a user to fit sections cut from any plane of the bulb into
a standard bulb and thus eliminate the need for any one spe-
cific mapping technique. We hope to release in a future ver-
sion of our software such a standard bulb, which would serve
as a model onto which various molecular or functional
features could be mapped. The overlay of such features
on a model bulb could provide further insights into the
underlying molecular basis of odor maps and could serve
as a reference point for future investigation. Additionally,the comparison of these odor maps with the maps generated
using alternative techniques should further enrich our
understanding of odorant coding in general.
Acknowledgements
We would like to thank Robin L. Michaels for her insightful review
of the manuscript and anonymous reviewers for thoughtful criti-
cisms that motivated the Poisson distribution analysis. This project
was supported by National Institutes of Health grants DC00566,
DC04657, DC006070, and MH068582.
References
Bodyak, N. and Slotnick, B. (1999) Performance of mice in an automatedolfactometer: odor detection, discrimination and odor memory. Chem.Senses, 24, 637–645.
Buck, L.B. (2000) Themolecular architecture of odor and pheromone sensingin mammals. Cell, 100, 611–618.
Curran-Everett, D. (2000) Multiple comparisons: philosophies and illustra-tions. Am. J. Physiol. Regul. Integr. Comp. Physiol., 279, R1–R8.
Franklin, K.B.J. and Paxinos, G. (1997) The Mouse Brain in StereotaxicCoordinates. Academic Press, San Diego, CA.
Friedrich, R.W. and Korsching, S.I. (1998) Chemotopic, combinatorial, andnoncombinatorial odorant representations in the olfactory bulb revealedusing a voltage-sensitive axon tracer. J. Neurosci., 18, 9977–9988.
Guthrie, K.M., Anderson, A.J., Leon, M. and Gall, C. (1993) Odor-inducedincreases in c-fos mRNA expression reveal an anatomical ‘‘unit’’ for odorprocessing in olfactory bulb. Proc. Natl Acad. Sci. USA, 90, 3329–3333.
Inaki, K., Takahashi, Y.K., Nagayama, S. and Mori, K. (2002) Molecular-feature domains with posterodorsal-anteroventral polarity in thesymmetrical sensory maps of the mouse olfactory bulb: mapping ofodourant-induced Zif268 expression. Eur. J. Neurosci., 15, 1563–1574.
Johnson, B.A. and Leon, M. (1996) Spatial distribution of [14C]2-deoxyglucose uptake in the glomerular layer of the rat olfactorybulb following early odor preference learning. J. Comp. Neurol., 376,557–566.
Johnson, B.A. and Leon, M. (2000a)Modular representations of odorants inthe glomerular layer of the rat olfactory bulb and the effects of stimulusconcentration. J. Comp. Neurol., 422, 496–509.
Johnson, B.A. and Leon, M. (2000b) Odorant molecular length: one aspectof the olfactory code. J. Comp. Neurol., 426, 330–338.
Johnson, B.A., Woo, C.C., Duong, H., Nguyen, V. and Leon, M. (1995)A learned odor evokes an enhanced Fos-like glomerular response in theolfactory bulb of young rats. Brain Res., 699, 192–200.
Johnson, B.A., Woo, C.C., Hingco, E.E., Pham, K.L. and Leon, M. (1999)Multidimensional chemotopic responses to n-aliphatic acid odorants inthe rat olfactory bulb. J. Comp. Neurol., 409, 529–548.
Lin, W., Arellano, J., Slotnick, B. and Restrepo, D. (2004) Odors detectedby mice deficient in cyclic nucleotide-gated channel subunit A2 stimulatethe main olfactory system. J. Neurosci., 24, 3703–3710.
Training-Induced Changes in Ethyl Acetate Odor Maps 625
by guest on Novem
ber 21, 2014http://chem
se.oxfordjournals.org/D
ownloaded from

Lin, W., Margolskee, R.F., Zhao, Z., Liman, E.R. and Restrepo, D. (2005)Expression of TRPM5 in the main olfactory epithelium [abstract]. Chem.Senses, 30, A127.
Liu, N., Xu, F., Marenco, L., Hyder, F., Miller, P. and Shepherd, G.M.(2004) Informatics approaches to functional MRI odor mapping of therodent olfactory bulb: OdorMapBuilder and OdorMapDB. Neuroinfor-matics, 2, 3–18.
Mombaerts, P., Wang, F., Dulac, C., Chao, S.K., Nemes, A.,Mendelsohn, M., Edmondson, J. and Axel, R. (1996) Visualizing anolfactory sensory map. Cell, 87, 675–686.
Montag-Sallaz, M. and Buonviso, N. (2002) Altered odor-induced expres-sion of c-fos and arg 3.1 immediate early genes in the olfactory systemafter familiarization with an odor. J. Neurobiol., 52, 61–72.
Munger, S.D., Lane, A.P., Zhong, H., Leinders-Zufall, T., Yau, K.-W.,Zufall, F. and Reed, R.R. (2001) Central role of the CNGA4 channelsubunit in Ca2+-calmodulin-dependent odor adaptation. Science, 294,2172–2175.
Nagao, H., Yoshihara, Y., Mitsui, S., Fujisawa, H. and Mori, K. (2000)Two mirror-image sensory maps with domain organization in the mousemain olfactory bulb. Neuroreport, 11, 3023–3027.
Ressler, K.J., Sullivan, S.L. and Buck, L.B. (1994) Information coding in theolfactory system: evidence for a stereotyped and highly organized epitopemap in the olfactory bulb. Cell, 79, 1245–1255.
Royet, J.P., Sicard, G., Souchier, C. and Jourdan, F. (1987) Specificityof spatial patterns of glomerular activation in the mouse olfactory bulb:computer-assisted image analysis of 2-deoxyglucose autoradiograms.Brain Res., 417, 1–11.
Rubin, B.D. and Katz, L.C. (1999) Optical imaging of odorant representa-tions in the mammalian olfactory bulb. Neuron, 23, 499–511.
Sallaz, M. and Jourdan, F. (1993) C-fos expression and 2-deoxyglucose up-take in the olfactory bulb of odour-stimulated awake rats. Neuroreport, 4,55–58.
Schaefer, M.L., Finger, T.E. and Restrepo, D. (2001a) Variability of positionof the P2 glomerulus within a map of the mouse olfactory bulb. J. Comp.Neurol., 436, 351–362.
Schaefer, M.L., Young, D.A. and Restrepo, D. (2001b) Olfactory finger-prints for major histocompatibility complex-determined body odors. J.Neurosci., 21, 2481–2487.
Schoppa, N.E., Kinzie, J.M., Sahara, Y., Segerson, T.P. and Westbrook,G.L. (1998) Dendrodendritic inhibition in the olfactory bulb is driven byNMDA receptors. J. Neurosci., 18, 6790–6802.
Sharp, F.R., Kauer, J.S. and Shepherd, G.M. (1977) Laminar analysis of2-deoxyglucose uptake in olfactory bulb and olfactory cortex of rabbitand rat. J. Neurophysiol., 40, 800–813.
Shepherd, G.M., Chen, W.R. and Greer, C.A. (2004) Olfactory bulb. InShepherd, G.M. (ed.), The Synaptic Organization of the Brain. OxfordUniversity Press, New York, pp. 159–204.
Slotnick, B. and Bodyak, N. (2002) Odor discrimination and odor qualityperception in rats with disruption of connections between the olfactoryepithelium and olfactory bulbs. J. Neurosci., 22, 4205–4216.
Strotmann, J., Conzelmann, S., Beck, A., Feinstein, P., Breer, H. andMombaerts, P. (2000) Local permutations in the glomerular array ofthe mouse olfactory bulb. J. Neurosci., 20, 6927–6938.
Uchida, N., Takahashi, Y.K., Tanifuji, M. and Mori, K. (2000) Odor mapsin the mammalian olfactory bulb: domain organization and odorantstructural features. Nat. Neurosci., 3, 1035–1043.
Vassar, R., Ngai, J. andAxel, R. (1993) Spatial segregation of odorant recep-tor expression in the mammalian olfactory epithelium. Cell, 74, 309–318.
Vedin, V., Slotnick, B. and Berghard, A. (2004) Zonal ablation of theolfactory sensory neuroepithelium of the mouse: effects on odorantdetection. Eur. J. Neurosci., 20, 1858–1864.
Wachowiak, M. and Cohen, L.B. (2001) Representation of odorants by re-ceptor neuron input to the mouse olfactory bulb. Neuron, 32, 723–735.
Watt, W.C., Sakano, H., Lee, Z.Y., Reusch, J.E., Trinh, K. and Storm, D.R.(2004) Odorant stimulation enhances survival of olfactory sensory neu-rons via MAPK and CREB. Neuron, 41, 955–967.
Wilson, D.A., Sullivan, R.M., Gall, C.M. and Guthrie, K.M. (1996) NMDA-receptor modulation of lateral inhibition and c-fos expression in olfactorybulb. Brain Res., 719, 62–71.
Woodley, S.K., Cloe, A.L., Waters, P. and Baum, M.J. (2004) Effectsof vomeronasal organ removal on olfactory sex discrimination and odorpreferences of female ferrets. Chem. Senses, 29, 659–669.
Xu, F., Greer, C.A. and Shepherd, G.M. (2000a) Odor maps in the olfactorybulb. J. Comp. Neurol., 422, 489–495.
Xu, F., Kida, I., Hyder, F. and Shulman, R.G. (2000b) Assessment and dis-crimination of odor stimuli in rat olfactory bulb by dynamic functionalMRI. Proc. Natl Acad. Sci. USA, 97, 10601–10606.
Xu, F., Liu, N., Kida, I., Rothman, D.L., Hyder, F. and Shepherd, G.M.(2003) Odor maps of aldehydes and esters revealed by functional MRIin the glomerular layer of the mouse olfactory bulb. Proc. Natl. Acad.Sci. USA, 100, 11029–11034.
Xu, F., Schaefer, M., Kida, I., Schafer, J., Liu, N., Rothman, D.L., Hyder,F., Restrepo, D. and Shepherd, G.M. (2005) Simultaneous activationof mouse main and accessory olfactory bulbs by odors or pheromones.J. Comp. Neurol., 489, 491–500.
Zheng, C., Feinstein, P., Bozza, T., Rodriguez, I. and Mombaerts, P.(2000) Peripheral olfactory projections are differentially affected in micedeficient in a cyclic nucleotide-gated channel subunit. Neuron, 26, 81–91.
Accepted August 5, 2005
626 E. Salcedo et al.
by guest on Novem
ber 21, 2014http://chem
se.oxfordjournals.org/D
ownloaded from
Copyright © 2022 FDOKUMEN