Odor Annoyance Assessment by Using Logistic Regression ...
19
sustainability Article Odor Annoyance Assessment by Using Logistic Regression on an Example of the Municipal Sector Alicja Wroniszewska 1, * and Jerzy Zwo ´ zdziak 2 1 Department of Environment Protection Engineering, Wroclaw University of Science and Technology, 50-370 Wroclaw, Poland 2 Faculty of Safety Science, General Tadeusz Kosciuszko Military University of Land Forces, 51-147 Wroclaw, Poland; [email protected] * Correspondence: [email protected] Received: 22 June 2020; Accepted: 26 July 2020; Published: 29 July 2020 Abstract: Around the sewage treatment plant, in the area affected by a large number of complaints about odor annoyance, field measurements of odor properties and questionnaires were carried out. It was confirmed that the inhabitants of the zone closest to the plant are most exposed to the smell, the most intense smell comes from the sludge dryer building, and smells from primary settling tanks and sediment plots are perceived as unpleasant. The analysis of surveys confirmed the problem of odor nuisance, especially in the immediate vicinity, where over 50% of respondents considered odor annoyance as extreme. A division of respondents was introduced into those experiencing severe nuisance and those for whom the smell was not annoying. Then, to relate the probability of occurrence of odor nuisance with a group of independent variables, logistic regression was used to describe the impact of independent variables on the dichotomous dependent variable. It has been shown that the likelihood of experiencing odor nuisance increases with the increase in the intensity of current odors, the parallel noise, and in people who focus on the existing smell, and decreases with increasing satisfaction with their health and in the case of regularly occurring odor. Keywords: odor annoyance; field measurements; logistic regression 1. Introduction For several years, the number of complaints about the odor nuisance around plants from the municipal and household sector has been growing. In many cases, unfortunately, odorous gases come from facilities that are aimed at improving the natural environment and the quality of people’s life. These are mainly municipal facilities, such as sewage treatment plants, waste disposal or storage plants, or biogas plants. Often, their poor location and unfavorable meteorological conditions, as well as the terrain contributing to the good spread of odors, mean that instead of improving the state of the environment and people’s feelings, they further aggravate the impressions of residents living nearby. Data on the state of the environment are today publicly available. This influences the growing interest of people in environmental protection. Public consultations are also becoming widespread, enabling citizens to feel their contribution to sustainable development. It also causes, along with the growth of economic development, an increasing number of complaints related to environmental pollution from year to year, also in terms of odor annoyance. The lack of uniform legal regulations regarding this issue in the European Union countries has additionally slowed down the introduction of the act on odor nuisance in Poland. In most cases, complaints about unpleasant odors are directed to Sanitary Inspectorates, which indicates that people identify the smell problem as threatening their health and life. Sustainability 2020, 12, 6102; doi:10.3390/su12156102 www.mdpi.com/journal/sustainability
-
Upload
khangminh22 -
Category
Documents
-
view
5 -
download
0
Transcript of Odor Annoyance Assessment by Using Logistic Regression ...

sustainability
Article
Odor Annoyance Assessment by Using LogisticRegression on an Example of the Municipal Sector
Alicja Wroniszewska 1,* and Jerzy Zwozdziak 2
1 Department of Environment Protection Engineering, Wroclaw University of Science and Technology,50-370 Wroclaw, Poland
2 Faculty of Safety Science, General Tadeusz Kosciuszko Military University of Land Forces,51-147 Wroclaw, Poland; [email protected]
* Correspondence: [email protected]
Received: 22 June 2020; Accepted: 26 July 2020; Published: 29 July 2020�����������������
Abstract: Around the sewage treatment plant, in the area affected by a large number of complaintsabout odor annoyance, field measurements of odor properties and questionnaires were carried out.It was confirmed that the inhabitants of the zone closest to the plant are most exposed to the smell,the most intense smell comes from the sludge dryer building, and smells from primary settling tanksand sediment plots are perceived as unpleasant. The analysis of surveys confirmed the problemof odor nuisance, especially in the immediate vicinity, where over 50% of respondents consideredodor annoyance as extreme. A division of respondents was introduced into those experiencingsevere nuisance and those for whom the smell was not annoying. Then, to relate the probability ofoccurrence of odor nuisance with a group of independent variables, logistic regression was used todescribe the impact of independent variables on the dichotomous dependent variable. It has beenshown that the likelihood of experiencing odor nuisance increases with the increase in the intensity ofcurrent odors, the parallel noise, and in people who focus on the existing smell, and decreases withincreasing satisfaction with their health and in the case of regularly occurring odor.
Keywords: odor annoyance; field measurements; logistic regression
1. Introduction
For several years, the number of complaints about the odor nuisance around plants from themunicipal and household sector has been growing. In many cases, unfortunately, odorous gases comefrom facilities that are aimed at improving the natural environment and the quality of people’s life.These are mainly municipal facilities, such as sewage treatment plants, waste disposal or storage plants,or biogas plants. Often, their poor location and unfavorable meteorological conditions, as well asthe terrain contributing to the good spread of odors, mean that instead of improving the state of theenvironment and people’s feelings, they further aggravate the impressions of residents living nearby.
Data on the state of the environment are today publicly available. This influences the growinginterest of people in environmental protection. Public consultations are also becoming widespread,enabling citizens to feel their contribution to sustainable development. It also causes, along withthe growth of economic development, an increasing number of complaints related to environmentalpollution from year to year, also in terms of odor annoyance. The lack of uniform legal regulationsregarding this issue in the European Union countries has additionally slowed down the introductionof the act on odor nuisance in Poland. In most cases, complaints about unpleasant odors are directedto Sanitary Inspectorates, which indicates that people identify the smell problem as threatening theirhealth and life.
Sustainability 2020, 12, 6102; doi:10.3390/su12156102 www.mdpi.com/journal/sustainability
Sustainability 2020, 12, 6102 2 of 19
According to studies on the nuisance caused by, among others, smell [1–3], adverse reactionsof people to the smell that appears in their environment is a very complex problem. It consists ofmany factors, not only related to the scent itself, but also the so-called nonolfactory factors that canstrengthen or weaken these reactions, such as age or health problems, but also our commitment toenvironmental protection or inclination to social activity.
In order to assess the impact of a smell on the health and well-being of the inhabitants of areasadjacent to the source of odors, two types of research can be conducted: survey [4–7] and fieldresearch [7–13]. The aim of the questionnaires is to identify the reactions of people living in areasexposed to the presence of unwanted odors and to designate an area where the problem can be observed.On this basis, it can be assessed whether there is any odor nuisance in a given area. On the other hand,field studies are carried out to assess the properties of fragrances, i.e., their frequency, intensity andhedonic tone. Field measurements are designed to determine how much the inhabitants of the studiedarea are exposed to the presence of odors from nearby sources, how much the present smell is intense,and whether it is perceived as pleasant, unpleasant, or neutral. The field measurements, moreover,are carried out by a selected panel of experts who can assess the surrounding smell without negativeassociations. Each of these tests individually helps to assess the current state of a given area in terms ofodorous air quality. However, none of them separately is sufficient for a comprehensive assessment.Therefore, this study combined both types of research.
In studies of odor nuisance, we often deal with a dependent variable of the dichotomous type [14];for example, 1—we feel a given smell negatively, 0—we do not feel it; 1—headache occurs, 0—does notoccur. Then, one can ask the question which of many considered independent variables (age, gender,distance from the plant, and others) significantly affects the occurrence of the symptom? In suchsituations, we can use logistic regression. In the construction of the model to assess odor nuisance,therefore, the combined results of field measurements (odor properties and surveys) carried out inand around a large sewage treatment plant were used, and logistic regression was used to interpretthe data.
Therefore, the main goal of the work was to build a model for assessing the impact of externalfactors on the perception of odor nuisance based on logistic regression. The scope of work included:
- Estimation of the frequency, intensity, and hedonic tone of odors occurring in the studied area;- Assessment of perceived odor annoyance by residents living in areas adjacent to the source
of odors.
2. Materials and Methods
The investigations were carried out around the sewage treatment plant, which is located in theWielkopolska Voivodship, in rural areas, at the city border. The plant is located west of the residentialbuildings at a distance of about 200 m. The housing estates in the village adjacent to the sewagetreatment plant are mostly situated in hilly areas. West and southwest winds prevail.
It is a mechanical–biological sewage treatment plant with increased biogenic removal and fulltreatment of sewage sludge. The facilities of this sewage treatment plant enable the reception ofwastewater in an average amount of 200,000 m3/day (in the rainy season up to 260,000 m3/day).The treated sewage receiver is the river located west of the plant. The sewage treatment plant ischarged with PE = approx. 1,000,000.
According to the field research methodology used in European countries (VDI 3940) [15], the firststage of the measurements was to determine the area of research (Figure 1).

Sustainability 2020, 12, 6102 3 of 19
Figure 1. (a) Measuring grid designated for field measurements of odor properties and assessment ofannoyance with the plant marked (based on [16]); (b) annual wind rose for the nearest city.
For this purpose, the dispersion of odor was calculated first [17]. Odor concentration calculatedusing the reference model at receptor points initially indicated the possibility of occurrence of odorconcentration levels above 1 ouE/m3 in the analyzed area. However, due to model assumptions that donot include, among others, changes in weather conditions, terrain, or variable emission of pollutants,the model turned out to be not very reliable at determining the area exposed to the effects of odors inthe plant. According to the results of the model, it should cover areas where the smell should no longerbe felt due to the terrain and naturally occurring barriers (wide green belt, river, and floodplains).It was, therefore, necessary to carry out field reconnaissance and thorough examination of the areapotentially exposed to the smell emission. The results of the inspection showed that the referencemodel incorrectly determined the area potentially exposed to odors. Therefore, eventually, the researcharea covered the area marked in Figure 1 (p. 3).
On this basis, the boundaries of the “measuring area”, i.e., the measuring grid, were indicated,which was then divided into 94 “measuring squares”. Each measuring square consists of “measuringpoints” (104), in which the frequency, intensity, and hedonic tone were measured. The entire researcharea was then divided into three zones. Zone 1 was located near the plant, zone 2 was about 500 m tothe east, and zone 3 was furthest from the plant (about 1 km to the northeast).
During the entire study period (summer and autumn–winter season 2011), 520 individualmeasurements were carried out, based on which the frequency of the most characteristic odors,their intensity, and hedonic tone were assessed.
A 16-person, adequately, according to [18], trained group of testers took part in the fieldmeasurements. To guarantee the highest reliability of measurements, during the entire study period,5 measurements were made at each point at different times of the day (morning, daytime, evening,night), by various evaluators, and the points were randomly assigned to an expert and measurementday and time. The time of a single measurement was about 10 min. At that time, each person (a memberof the expert group), facing the wind, breathed in the surrounding air every 10 s, and marked on theprotocol whether they sensed any odor and gave its type (e.g., preliminary settling tanks, sludge dryer)using the appropriate code. Then, based on measurements, it was possible to determine the frequencyof occurrence of a given type of fragrance in the so-called odor hours. One “odor hour” meant that thesmell was felt over 10% of the time of one measurement, i.e., over 6 times. The incidence of odor ina given measuring square was calculated as the arithmetic mean of the frequency at the measuringpoints constituting it.

Sustainability 2020, 12, 6102 4 of 19
The second stage of field research, after measuring the frequency of smell, was the study of itsintensity, i.e., the strength with which the odor is felt. The person conducting the measurementsassessed only the intensity of odors characteristic of the source being tested. The maximum intensity ofthe strongest impression of a given type of fragrance received during one measurement cycle (10 min)was indicated, the frequency with which this impression occurred was recorded, and at the end of themeasurement average intensity impression was noted.
To assess the intensity of the smell in the field, the intensity scale from 1 to 6 was used. It wasassumed that the value “6—extremely strong” corresponds to the intensity of the smell felt as strongerthan “5—very strong”, and the lowest value on the scale, “1—very weak”, meaning exceeding theodor recognition threshold. The average value, “3—distinct”, did not only indicate the recognition of agiven fragrance but indicated that it was stronger than “2—weak”, although weaker than “4—strong”.
During calculating the average intensity, it was essential to consider the sensitivity of smell in thefield. For this purpose, the Weber–Fechner factor Fw was used. Based on earlier studies [19], in whichcoefficients between 1.5 and 2.5 were tested, it was found that the coefficient 2 was best matchedbecause between the odor emission and the perceived annoyance, the strongest relationship occurredfor this value.
The final stage of the study was the assessment of the odor hedonic tone, i.e., the effect caused bythe odorant, classified between “extremely pleasant” and “extremely unpleasant” (VDI 3882) [19,20].In this case, only source-specific odors were considered. The evaluation consisted of 3 parts. In thefirst, the evaluator marked on the protocol the hedonic tone of a given fragrance, which was the mostpleasant in a given measurement cycle. In the second part of the assessment, the hedonic tone washighlighted for the least pleasant smell. Finally, the average hedonic quality value was indicated.To assess hedonic tone, a scale from −4 to 4 was used. In contrast to the odor intensity scale, points onthe hedonic tone scale were sequenced but had a center and two divergent ends. The average hedonictone at a given measuring point was calculated by converting values from −4 to 4 for positive valuesfrom 0 to 9 [20,21].
During each measurement, some meteorological data were recorded, such as wind direction(using a compass), cloud cover, or possible rainfall.
Surveys were conducted based on German guidelines of the VDI 3883 series [22]. During severaldays, a group of interviewers visited residents of housing estates included in the measurement areaand conducted interviews with them for about 15 min, asking questions and marking answers on theforms. The respondents were chosen randomly and were only adults. The survey contained questionsabout demographic data, as well as the state of the environment and its pollution, with an emphasison air pollution by smell and nuisance caused by it. Table 1 summarizes the data on the number ofinterviews conducted in each zone, as well as the number of residents who could not be contacted orwho refused to respond. The basic statistical data of the respondents are presented in Table 2.
Table 1. Summary of the number of surveys carried out and not carried out.
Questionnaires
Zone 1 Zone 2 Zone 3 Sum
Done
20 40 48 108
Refusal
2 46 14 62
Absent
22 96 49 167

Sustainability 2020, 12, 6102 5 of 19
Table 2. Basic statistical data on respondents.
Age Gender Education
19–25 3Male 43
Basic 2
26–40 39 Secondary 24
41–60 37Female 57
Vocational 29
>60 21 High 35
An essential part of the survey were questions about the perceived odor annoyance on an 11-pointnumerical scale (from 0 to 10) and a descriptive scale (from “not at all” to “extremely annoying”).Additionally, the comparison of these two scales allowed us to assess the reliability of the answers.
Since odor nuisance may depend, to a large extent, not only on the intensity and frequency of thesmell but also other factors that are not olfactory, such as age, health, or degree of attachment to theplace of residence, the survey also included questions about these factors (e.g., period of residencein a given location, use of a balcony or garden, health problems, and accompanying environmentalpollution, as well as personal data such as age, gender, education). In order for the respondentsnot to focus only on the fragrance, the survey was introduced in parallel to the questions about theperceived odor nuisance, with questions about the perceived nuisance caused by other pollution,in this case, noise.
Questionnaires took place in the same area where the field measurements were carried out.Each surveyed person was assigned a measurement square number, thanks to which, using statisticalanalysis, it was possible to compare later the frequency, intensity, or hedonic tone of the smell felt by agroup of experts with the odor nuisance felt by residents.
Statistical analysis of both types of measurement data was carried out using the Statistica 10software. The purpose of the analysis was to find a link between the probability of occurrence ofodor nuisance and a group of independent variables, such as age, gender, education, coexistingenvironmental pollution, subjective health, type of character (problem-oriented), amount of timespent at home, and the smell present in the area: frequency, intensity, and hedonic tone. Logisticregression was used in this analysis. It is a mathematical model that can be used to describe theimpact of independent variables on a dichotomous dependent variable. Let Y denote a dependentvariable with values: 0—will not feel odor annoyance (0 ≤OA ≤ 6), 1—will experience odor annoyance(7 ≤ OA ≤ 10) [23]. The logistic regression model for such a dichotomous variable took the form:
P(Y = 1| x1, x2, . . . , xk) =e(a0+
k∑i=1
aixi)
1 + e(a0+
k∑i=1
aixi)
(1)
ai, i = 0, . . . , k—regression coefficients; x1, x2, . . . , xk—independent variables.The backward step-wise method was used; however, the use of other available estimation methods
did not cause any visible changes in the form of the model and the values of the regression coefficients.The ratio of the product of correctly classified cases to the product of incorrectly classified cases reacheda value in excess of unity, which means a classification much better than that which can be expectedby accident. The level of test probability for the Homer–Lemeshow test p = 0.1134 and the valueof RN
2 = 0.53 indicated that there were no grounds for rejecting the hypothesis about a good fit ofthe model to the data. The odds ratios for the individual change of the analyzed parameters werealso calculated.
The measure of good fit of the model, which determines its good predictive properties, is theROC (receiver operating characteristic) curve and measures based on the classification matrix [24].The logistic regression model returns, inter alia, the probability value of belonging of individual casesto the modelled class. Often the values of this probability are used to make a decision. For this
Sustainability 2020, 12, 6102 6 of 19
purpose, a certain point in the probability value is taken as the cut-off point. Above this point weassume the occurrence of the modelled class, below the opposite event. Since the model is only anapproximation of real processes, the adopted division is likely to result in incorrect assignments toboth analyzed classes. As a result of the adopted cut-off point, the analyzed cases can be assigned tothe following states: correct indication of the distinguished class (TP—true positive) and correct failureto indicate the other class (TN—true negative) in a situation where no errors were made. On the otherhand, errors are made when the distinguished class is incorrectly indicated (FP—false positive) or thedistinguished class is not indicated when it should be indicated (FN—false negative).
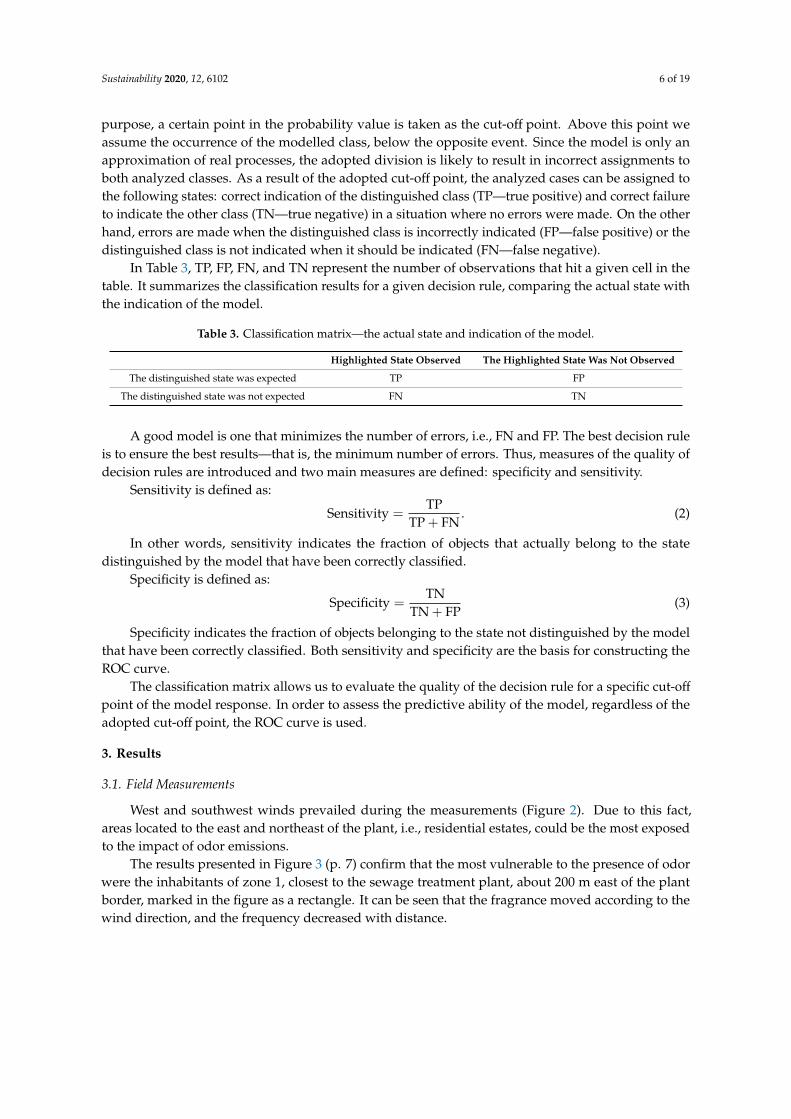
In Table 3, TP, FP, FN, and TN represent the number of observations that hit a given cell in thetable. It summarizes the classification results for a given decision rule, comparing the actual state withthe indication of the model.
Table 3. Classification matrix—the actual state and indication of the model.
Highlighted State Observed The Highlighted State Was Not Observed
The distinguished state was expected TP FP
The distinguished state was not expected FN TN
A good model is one that minimizes the number of errors, i.e., FN and FP. The best decision ruleis to ensure the best results—that is, the minimum number of errors. Thus, measures of the quality ofdecision rules are introduced and two main measures are defined: specificity and sensitivity.
Sensitivity is defined as:
Sensitivity =TP
TP + FN. (2)
In other words, sensitivity indicates the fraction of objects that actually belong to the statedistinguished by the model that have been correctly classified.
Specificity is defined as:
Specificity =TN
TN + FP(3)
Specificity indicates the fraction of objects belonging to the state not distinguished by the modelthat have been correctly classified. Both sensitivity and specificity are the basis for constructing theROC curve.
The classification matrix allows us to evaluate the quality of the decision rule for a specific cut-off
point of the model response. In order to assess the predictive ability of the model, regardless of theadopted cut-off point, the ROC curve is used.
3. Results
3.1. Field Measurements
West and southwest winds prevailed during the measurements (Figure 2). Due to this fact,areas located to the east and northeast of the plant, i.e., residential estates, could be the most exposedto the impact of odor emissions.
The results presented in Figure 3 (p. 7) confirm that the most vulnerable to the presence of odorwere the inhabitants of zone 1, closest to the sewage treatment plant, about 200 m east of the plantborder, marked in the figure as a rectangle. It can be seen that the fragrance moved according to thewind direction, and the frequency decreased with distance.

Sustainability 2020, 12, 6102 7 of 19
Figure 2. The wind rose based on measurement results.
Figure 3. The odor frequency of the sum of all odors originating from the plant in the study area (basedon [16]).

Sustainability 2020, 12, 6102 8 of 19
The results of the average intensity of individual types of fragrances are summarized in Table 4.The results of odor intensity measurements show that the most intense odor came from the sludgedryer building (4—strong), and the average intensity of the remaining odors throughout the entirestudy area was 3—distinct.
Table 4. Average intensity (on 1–6 scale) of odors from the analyzed plant.
SETTLERS SEDIMENT PLOTS SLUDGE DRYER BIOREACTORS
Average intensity 3 3 4 3
Average hedonic tone 4 4 3.5 6
The results of measurements of the odor hedonic tone from selected sources recorded throughoutthe field research show that while odors from bioreactors were received by most assessors as somehowpleasant or neutral (average hedonic tone 6), the remaining odors were, in most cases, assessed asdefinitely unpleasant: from preliminary settling tanks and sediment plots—4, and sludge dryer—3.5.Reception of odors from sewage treatment plants as pleasant could only be caused by the periodic stayof assessors in the studied area.
3.2. Questionnaires
After analyzing the results of surveys, it can be concluded that the described sewage treatmentplant was the main source of the smell in the studied area. This was indicated by the vast majorityof respondents (over 80%). Other answers to the question about the source of the fragrance were“other” (3%), including the smell of exhaust gases or smoke from domestic boilers and the “poultryplant” (8%) located in the study area. However, the last one was not identified during field tests.This may be because this type of smell was perceptible in earlier years, and the respondents’ answersare often distorted just by feelings from the past. In total, 7% of respondents could not indicate anysource (Figure 4a). To the question: “Please describe the most disruptive smell felt in this area”,the vast majority of respondents (over 80%) answered that they associate the smell present in this areawith a sewage treatment plant. Fragrances described as feces (over 36%), rotten eggs (almost 28%),or chemical (over 16%) were typically the most characteristic smells coming from the plant: primarysettling tanks, bioreactors, and sediments (Figure 4b).
Figure 4. Share of answers to the question about the source (a) and the type (b) of smell.
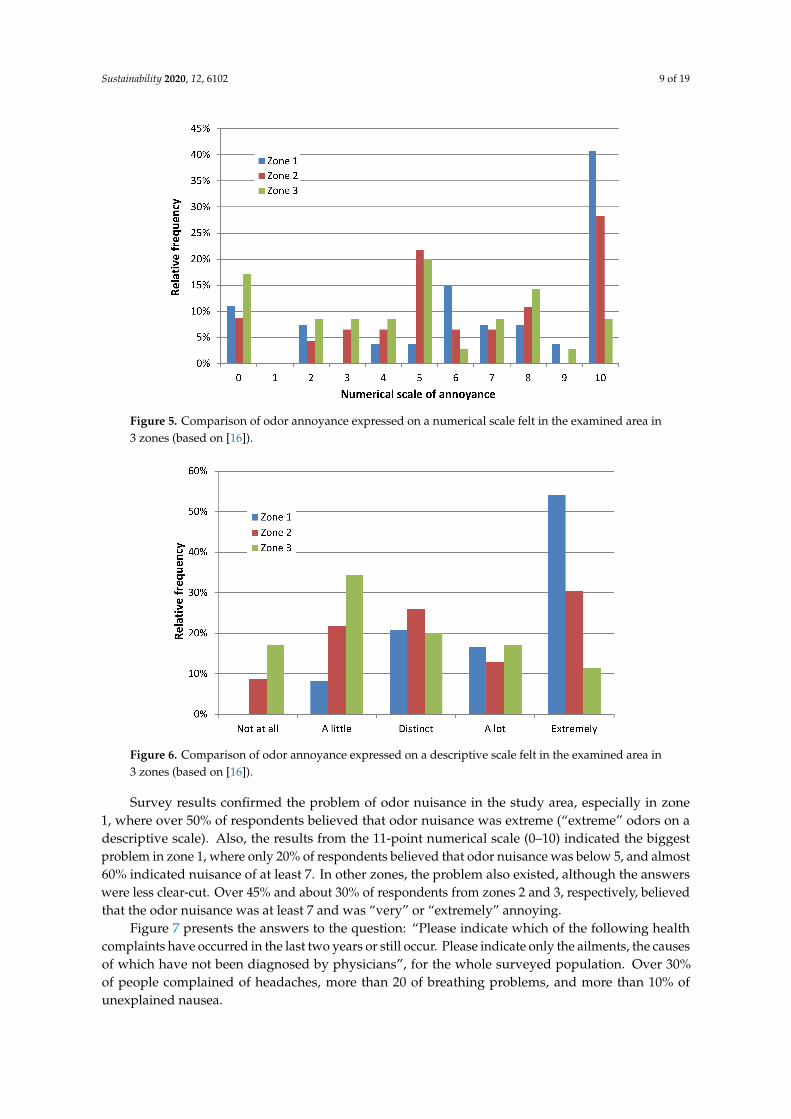
Figures 5 and 6 summarize the survey results regarding the perceived annoyance by residents ontwo scales: an 11-point numerical scale and a descriptive scale.
Sustainability 2020, 12, 6102 9 of 19
Figure 5. Comparison of odor annoyance expressed on a numerical scale felt in the examined area in3 zones (based on [16]).
Figure 6. Comparison of odor annoyance expressed on a descriptive scale felt in the examined area in3 zones (based on [16]).
Survey results confirmed the problem of odor nuisance in the study area, especially in zone1, where over 50% of respondents believed that odor nuisance was extreme (“extreme” odors on adescriptive scale). Also, the results from the 11-point numerical scale (0–10) indicated the biggestproblem in zone 1, where only 20% of respondents believed that odor nuisance was below 5, and almost60% indicated nuisance of at least 7. In other zones, the problem also existed, although the answerswere less clear-cut. Over 45% and about 30% of respondents from zones 2 and 3, respectively, believedthat the odor nuisance was at least 7 and was “very” or “extremely” annoying.
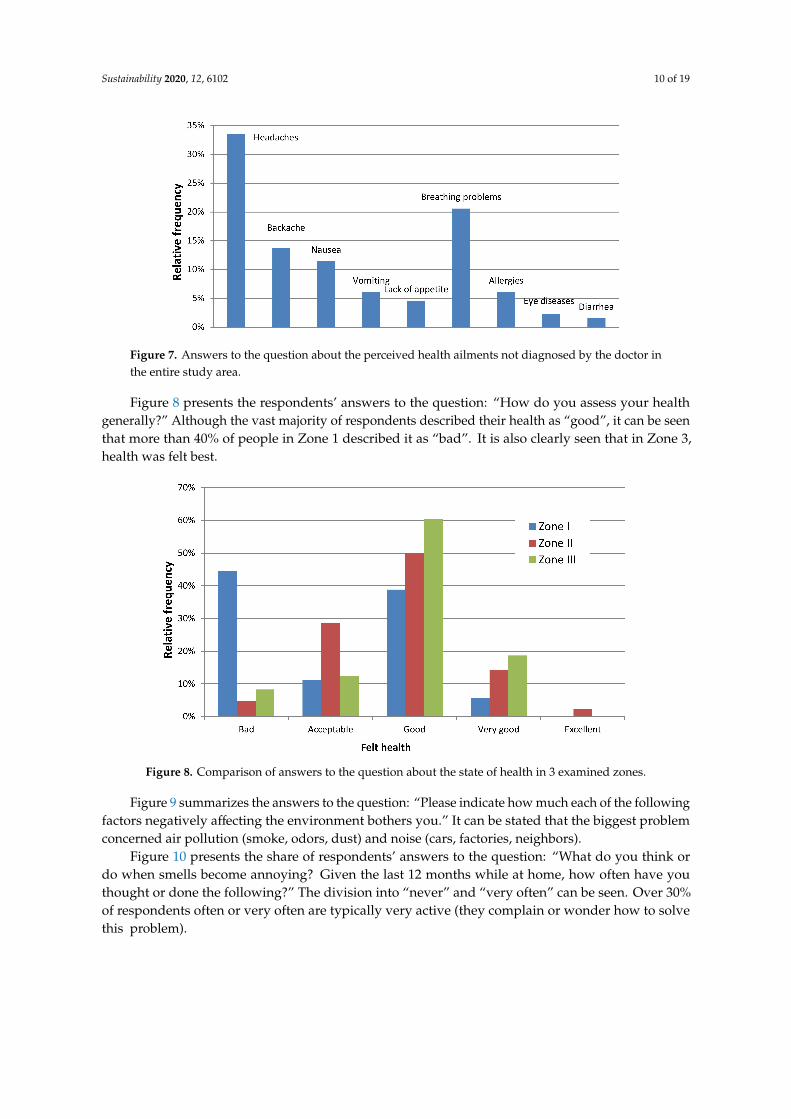
Figure 7 presents the answers to the question: “Please indicate which of the following healthcomplaints have occurred in the last two years or still occur. Please indicate only the ailments, the causesof which have not been diagnosed by physicians”, for the whole surveyed population. Over 30%of people complained of headaches, more than 20 of breathing problems, and more than 10% ofunexplained nausea.
Sustainability 2020, 12, 6102 10 of 19
Figure 7. Answers to the question about the perceived health ailments not diagnosed by the doctor inthe entire study area.
Figure 8 presents the respondents’ answers to the question: “How do you assess your healthgenerally?” Although the vast majority of respondents described their health as “good”, it can be seenthat more than 40% of people in Zone 1 described it as “bad”. It is also clearly seen that in Zone 3,health was felt best.
Figure 8. Comparison of answers to the question about the state of health in 3 examined zones.
Figure 9 summarizes the answers to the question: “Please indicate how much each of the followingfactors negatively affecting the environment bothers you.” It can be stated that the biggest problemconcerned air pollution (smoke, odors, dust) and noise (cars, factories, neighbors).
Figure 10 presents the share of respondents’ answers to the question: “What do you think ordo when smells become annoying? Given the last 12 months while at home, how often have youthought or done the following?” The division into “never” and “very often” can be seen. Over 30%of respondents often or very often are typically very active (they complain or wonder how to solvethis problem).

Sustainability 2020, 12, 6102 11 of 19
Figure 9. Questions about problems and general environmental pollution in the study area.
Figure 10. Questions about problems and general environmental pollution in the study area.
Figure 11 shows the spatial distribution of respondents’ answers to the question about theperceived odor nuisance in the studied area. A division has been introduced between answers from 0to 6 for those who did not experience significant nuisance (yellow), and from 7 to 10 for those whodescribed the perceived nuisance as very serious (red). The arrangement of individual responses raisessome doubts as to the source of the perceived annoyance. Both in the near and distant surroundings ofthe plant people experienced a serious and minor nuisance.
Figure 11. Perceived odor annoyance in measuring squares.

Sustainability 2020, 12, 6102 12 of 19
Summing up the results of this part of the research, it can be stated that odors in the studiedarea may affect housing estates located close to the plant. Survey results indicate that other parallelpollution, such as noise, also occurs in this area, which may increase the feeling of the nuisance.
3.3. Logistic Regression
The presented measurement results have shown that there is an odor nuisance in the studiedarea and that the smell—its frequency, intensity, and hedonic tone—can potentially have a negativeimpact on inhabited areas. However, there are inconsistencies (Figure 12). Many regions (squares),where there was an odor annoyance, coincided with the areas where there was an odor (red color),and there are also squares where neither odor nuisance nor odor were found (white color). However,there are many areas where there was a smell, but the residents did not complain about the nuisance,as well as such where the smell has not been registered by the assessors, and there was a severenuisance caused by it.
Figure 12. The occurrence of odor and perceived odor annoyance.
This may be because field studies are only carried out for a limited period, to a limited extent,while residents receive odors regularly, which was confirmed in other studies [25]. The perception ofsmells can, therefore, be different. As mentioned earlier, the presence of other, not olfactory, factorsmay also influence this. The answer to the question: “What causes nuisance and to what extent?” istherefore fundamental.
Respondents’ responses regarding the perceived odor nuisance indicated on a numerical scale(the so-called odor annoyance thermometer—OA dependent variable) suggest that in a given area,the smell may cause odor nuisance in residents, and thus an increasing number of complaints.As already mentioned, the scale of odor nuisance was an 11-point scale, from 0 to 10. It is thereforedifficult to determine whether the respondent feels annoyance or not if he indicates on the scale,e.g., 5. According to the latest research [26,27], to facilitate this assessment, the respondents weredivided into those who experienced severe nuisance and those for whom the smell was not annoyingor not very annoying. As mentioned, it was assumed that answers from 0 to 6, inclusive, meant thatthe respondent did not feel any severe nuisance, and from 7 to 10 that the perceived nuisance wassignificant. Each of the respondents was assigned a dichotomous type variable. Therefore, in furtheranalyses, the situation in which the variable OA takes the value “0” will mean that the person did notfeel the nuisance associated with the occurrence of smell, while the value of “1” indicates the personwho experienced severe odor nuisance.
The logistic model, based on the results of field measurements of odor properties, as well assurveys and selected nonolfactory factors, is discussed below. Estimations of the model parameterswere carried out for the whole examined population (N = 108). The presented logistic model containsonly those independent variables which, as a result of the analysis, proved to be statistically significant(at p < 0.05).

Sustainability 2020, 12, 6102 13 of 19
The values of the model parameter estimators were statistically significant (p < 0.05). Based on theLR (likelihood ratio) test, it was also found that the addition of SEDIMENT and SETTLERS variables tothe model did not significantly improve the model (p = 0.15, 0.16). Still, the addition of the DRYER,ACTION, FREQUENCY, NOISE, and HEALTH proved to be significant (p < 0.0001).
The model shows (Table 5) that the increase in the likelihood of experiencing odor nuisanceincreases with increasing values of variables: “ACTION” (OR = 2.113), “DRYER” (OR = 2.195),“SEDIMENT” (OR = 1.425), “SETTLERS” (OR = 2.325), “NOISE” (OR = 1.405), and decreases withincreasing values of the variables: “FREQUENCY” (OR = 0.001) and “HEALTH” (OR = 0.520).
Table 5. Selected results of the estimation of logistic regression model parameters for theexamined population.
VARIABLE
ACTION DRYER SEDIMENT SETTLERS FREQUENCY NOISE HEALTH
Estimatedparameter value 0.748 0.786 0.354 0.844 −7.397 0.340 −0.655
Significance level <0.05
95% confidenceinterval forparameters
0.411 ÷1.085
0.350 ÷1.222
0.064 ÷0.644
0.523 ÷1.164
−10.457 ÷4.338
0.235 ÷0.446
−1.035 ÷−0.274
Odds ratio forindividual change
parameter2.113 2.195 1.425 2.325 0.001 1.405 0.520
95% confidenceinterval forodds ratio
1.509 ÷2.958
1.420 ÷3.394
1.066 ÷1.905
1.688 ÷3.202
0.000 ÷0.013
1.264 ÷1.561
0.355 ÷0.760
Figure 13 shows plots of changes in sensitivity and specificity for the different values of the cut-off
of the model predictions.
Figure 13. Graph of changes in sensitivity and specificity for different values of the cut-off points of themodel predictions.
A good rule decision is one that maximizes both sensitivity and specificity. The sensitivity andspecificity plots are then the basis for the creation of the ROC plot, i.e., the sensitivity versus specificity

Sustainability 2020, 12, 6102 14 of 19
(1—specificity) relationship for the obtained model for all possible cut-off points. If the ROC curve(Figure 14) is smoother, the more different the values of the indicator under study are.
Figure 14. Receiver operating characteristic (ROC) curve.
The obtained ROC curve can now be used to evaluate the resulting model. For this purpose, thearea under the plot of the ROC curve is calculated, denoted as AUC (area under curve). It is also ameasure of goodness and validity of a given model. The AUC index is in the range [0,1]. The higherthe AUC the better the model.
The value of the AUC field obtained in the tests was 0.82, which confirms a good fit of the model,and may also indicate its good predictive properties.
4. Discussion
The obtained results show that the probability of experiencing odor nuisance increases when theintensity of odors increases, together with parallel pollution, which is noise in this case (Figure 15),as indicated in a previous study [27]. This happens also for people of the problem-oriented type(Figure 16), which focus on the problem around them, such as annoying odors. Similarly, this probabilitydecreases with increasing satisfaction with one’s health (Figure 17), as proved before [28] and withregularly occurring odors.
Figure 15. Expected odor annoyance depending on the degree of nuisance caused by noise.

Sustainability 2020, 12, 6102 15 of 19
Figure 16. Expected odor annoyance depending on the frequency of taking action in stressful situations.
Figure 17. Expected odor annoyance depending on the health status.
Individual values of the odds ratios also allow stating that the high intensity of odors from thesludge dryer as well as from the primary settling tanks increases the chance of experiencing odornuisance by over two times (Table 5). Also, for people who are focused on action in a stressful situation(the occurrence of smell) and those who describe their health as “bad”, this chance increases twice.More prolonged exposure to odors (low intensity) minimizes the chance of experiencing the nuisanceassociated with the occurrence of odors.
Figure 18 presents graphs of the predicted probability of occurrence of odor annoyance dependingon the intensity of odor for three different frequencies.
Figure 18. Dependence of the probability of occurrence of odor annoyance depending on the intensityof the smell.
Sustainability 2020, 12, 6102 16 of 19
The probability of occurrence of odor nuisance increases the fastest, at the lowest odor intensityvalues, in the case of the lowest frequency, and the slowest at much higher intensity values with thealmost constant occurrence of odor (Figure 18). This may be because extended exposure to the fragrancecauses people to become accustomed to it over time and in some cases, even causes a complete lack ofthe perception of a given fragrance [29].
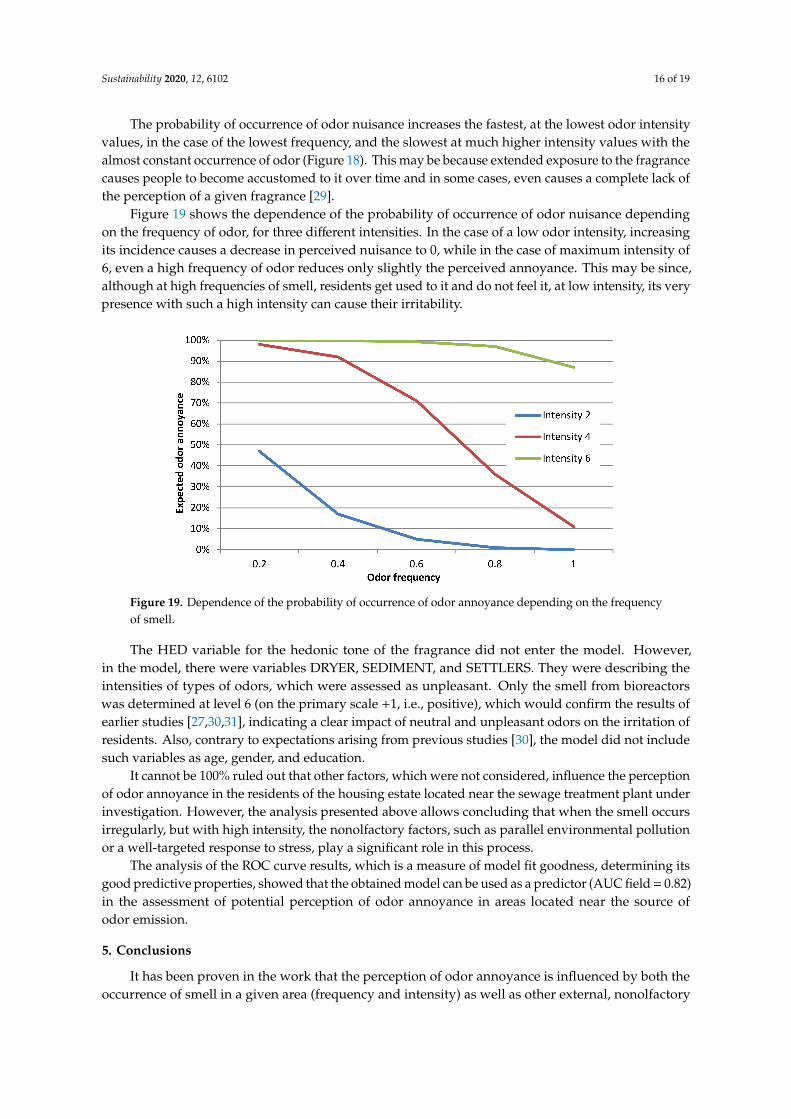
Figure 19 shows the dependence of the probability of occurrence of odor nuisance dependingon the frequency of odor, for three different intensities. In the case of a low odor intensity, increasingits incidence causes a decrease in perceived nuisance to 0, while in the case of maximum intensity of6, even a high frequency of odor reduces only slightly the perceived annoyance. This may be since,although at high frequencies of smell, residents get used to it and do not feel it, at low intensity, its verypresence with such a high intensity can cause their irritability.
Figure 19. Dependence of the probability of occurrence of odor annoyance depending on the frequencyof smell.
The HED variable for the hedonic tone of the fragrance did not enter the model. However,in the model, there were variables DRYER, SEDIMENT, and SETTLERS. They were describing theintensities of types of odors, which were assessed as unpleasant. Only the smell from bioreactorswas determined at level 6 (on the primary scale +1, i.e., positive), which would confirm the results ofearlier studies [27,30,31], indicating a clear impact of neutral and unpleasant odors on the irritation ofresidents. Also, contrary to expectations arising from previous studies [30], the model did not includesuch variables as age, gender, and education.
It cannot be 100% ruled out that other factors, which were not considered, influence the perceptionof odor annoyance in the residents of the housing estate located near the sewage treatment plant underinvestigation. However, the analysis presented above allows concluding that when the smell occursirregularly, but with high intensity, the nonolfactory factors, such as parallel environmental pollutionor a well-targeted response to stress, play a significant role in this process.
The analysis of the ROC curve results, which is a measure of model fit goodness, determining itsgood predictive properties, showed that the obtained model can be used as a predictor (AUC field = 0.82)in the assessment of potential perception of odor annoyance in areas located near the source ofodor emission.
5. Conclusions
It has been proven in the work that the perception of odor annoyance is influenced by both theoccurrence of smell in a given area (frequency and intensity) as well as other external, nonolfactory

Sustainability 2020, 12, 6102 17 of 19
factors, such as parallel environmental pollution (noise), the perceived state of health, or the degree ofsocial activity.
A reliable mathematical model has been created to assess the source of perceived odor nuisance(the H-L test p = 0.1134, RN
2 = 0.53, and AUC field = 0.82). Its results testify to a good fit of thedeveloped model to the input data. This model can also be used as a predictor in assessing the potentialperceived odor nuisance in areas located near the source of the odor emission.
The impact of nonolfactory factors on the perception of odor annoyance makes thefollowing essential:
- At the investment planning stage, do not accumulate many facilities that could potentially havea negative impact on the environment and people (e.g., city beltway, sewage treatment plant,and chemical industry plant),
- Inform residents about the harmfulness of the smell or lack of it, to minimize the feeling ofpoor health,
- Treat complaints about the odor nuisance of inhabitants of areas exposed to the smell seriously asan indicator of the current state of the environment,
- Carry out eco-mediation and social consultations in which all interested parties mustcooperate—authorities, residents’ representatives, as well as owners of the facility potentiallycausing odor emissions.
The subject of further research in this regard should be the extension of the resulting model,considering the sources of odor emissions of various origins and the broadest possible group ofrespondents. This would allow for additional factors to be included in the model, which may alsoaffect the degree of odor nuisance. It would be important to create a good model for the odor’sdispersion and to assess the odor impact in the field, which could be input to the model, together withthe possibility of obtaining statistical data. This would allow using the model developed in this workto forecast the perceived odor annoyance, as well as limiting the size of field measurements whilemaintaining high-quality results.
Author Contributions: Conceptualization, A.W. and J.Z.; methodology, A.W.; software, A.W.; validation, A.W.and J.Z.; formal analysis, A.W.; investigation, A.W.; resources, A.W. and J.Z.; data curation, A.W.; writing—originaldraft preparation, A.W.; writing—review and editing, A.W. and J.Z.; visualization, A.W.; supervision, J.Z.; projectadministration, A.W. and J.Z.; funding acquisition, J.Z. All authors have read and agreed to the published versionof the manuscript.
Funding: The research was financed from the funds of order No. 600392 carried out at the Institute of EnvironmentalProtection Engineering of the Wroclaw University of Technology. The APC was co-financed within the “ExcellentScience” program of the Polish Ministry of Science and Higher Education.
Conflicts of Interest: The authors declare no conflict of interest.
References
1. Boers, D.; Geelen, L.; Erbrink, H.; Smit, L.A.; Heederik, D.; Hooiveld, M.; Yzermans, C.J.; Huijbregts, M.;Wouters, I.M. The relation between modeled odor exposure from livestock farming and odor annoyanceamong neighboring residents. Int. Arch. Occup. Environ. Health 2016, 89, 521–530. [CrossRef] [PubMed]
2. Cervinka, R.; Neudorfer, E. Coping strategies for coping with odor nuisance. Case study and follow-up.In Smells in the Environment. Indoor and Outdoor Air; VDI Verlag GmbH: Düsseldorf, Germany, 2007;pp. 149–161. (In German)
3. Invernizzi, M.; Capelli, L.; Sironi, S. Proposal of odor nuisance index as urban planning tool. Chem. Senses2017, 42, 105–110. [CrossRef] [PubMed]
4. Hayes, J.E.; Stevenson, R.J.; Stuetz, R.M. Survey of the effect of odour impact on communities. J. Environ.Manag. 2017, 204, 349–354. [CrossRef] [PubMed]

Sustainability 2020, 12, 6102 18 of 19
5. Brancher, M.; de Melo Lisboa, H. Odour impact assessment by community survey. Chem. Eng. Trans. 2014,40, 139–144.
6. Bax, C.; Sironi, S.; Capelli, L. How Can Odors Be Measured? An Overview of Methods and Their Applications.Atmosphere 2020, 11, 92. [CrossRef]
7. Oiamo, T.H.; Luginaah, I.N.; Baxter, J. Cumulative effects of noise and odour annoyances on environmentaland health related quality of life. Soc. Sci. Med. 2015, 146, 191–203. [CrossRef]
8. Damuchali, A.M.; Huiging, G. Evaluation of odour properties, their relationships, and impact of an oil refineryplant on the surrounding environment using field measurements. Atmos. Environ. 2020, 230, 117480. [CrossRef]
9. Sówka, I.; Pachurka, Ł.; Bezyk, Y.; Grzelka, A.; Miller, U. Application of field studies and geostatisticalmethods in assessment of odour nuisance based on selected examples from municipal, industrial andagricultural environments. Environ. Prot. Nat. Resour. 2017, 28, 16–21. [CrossRef]
10. Eyckmans, J.; De Jaeger, S.; Rousseau, S. Hedonic Valuation of Odor Nuisance Using Field Measurements:A Case Study of an Animal Waste Processing Facility in Flanders. Land Econ. 2013, 89, 53–75. [CrossRef]
11. Dentoni, L.; Capelli, L.; Sironi, S.; Guillot, J.M.; Rossi, A.N. Comparison of different approaches for odourimpact assessment: Dispersion modelling (CALPUFF) vs field inspection (CEN/TC 264). Water Sci. Technol.2013, 68, 1731–1738. [CrossRef] [PubMed]
12. Conti, C.; Guarino, M.; Bacenetti, J. Measurements techniques and models to assess odor annoyance: A review.Environ. Int. 2020, 134, 10526. [CrossRef] [PubMed]
13. Capelli, L.; Sironi, S.; Del Rosso, R.; Guillot, J.M. Measuring odours in the environment vs. dispersionmodelling: A review. Atmos. Environ. 2013, 79, 731–743. [CrossRef]
14. Weeitensfelder, L.; Moshammer, H.; Öttl, D.; Payer, I. Exposure-complaint relationships of various environmentalodor sources in Styria, Austria. Environ. Sci. Pollut. Res. 2019, 26, 9806–9815. [CrossRef] [PubMed]
15. Verein Deutscher Ingenieure. VDI 3940 Part 3, Measurement of odour in Ambient Air by Field Inspections—Determinationof Odour Intensity and Hedonic Odour Tone; Verein DeutscherIngenieure, Beuth Verlag: Berlin, Germany, 2010.
16. Sówka, I.; Zwozdziak, J.; Wroniszewska, A.; Skretowicz, M.; Miller, U.; Zwozdziak, P.; Fortuna, M.;Sobczynski, P. The impact of selected wastewater treatements plant on the odour air quality. In PolishEnvironmental Engineering: [IV Congress of Environmental Engineering]; Environmental Engineering CommitteePAN, Marzenna, R., Eds.; Dudzinska, Artur Pawłowski: Lublin, Poland, 2012; pp. 247–252. (In Polish)
17. Sówka, I.; Sobczynski, P.; Skretowicz, M.; Miller, U.; Zwozdziak, J. The use of selected mathematical andgeostatistical tools to assess the smell of sewage treatment plants. In Polish Environmental Engineering:[IV Congress of Environmental Engineering]; Environmental Engineering Committee PAN, Marzenna, R., Eds.;Dudzinska, Artur Pawłowski: Lublin, Poland, 2012; pp. 261–268. (In Polish)
18. Polish Committee for Standardization. Polish Standard PN-EN 13725:2007: Air Quality—Determination ofOdour Concentration by Dynamic Olfactometry; Polish Committee for Standardization: Warsaw, Poland, 2007.
19. Sucker, K.; Bischoff, M.; Krämer, U.; Kühner, D.; Winneke, G. Investigating the Effect of Intensity and HedonicOlfactory Quality on the Level of Odor Pollution; Research Report by MIU, Düsseldorf, and deBAKOM, Odenthal;MUNLV NRW: Düsseldorf, Germany; BW: Stuttgart, Germany; VCI eV: Frankfurt/Düsseldorf, Germany, 2003.
20. Verein Deutscher Ingenieure. VDI 3882 Part 1: Olfactometry; Determination of Odour Intensity; Verein DeutscherIngenieure, BeuthVerlag: Berlin, Germany, 1992.
21. VereinDeutscher Ingenieure.VDI3882Part2: Olfactometry; DeterminationofHedonicOdourTone; VereinDeutscherIngenieure, BeuthVerlag: Berlin, Germany, 1994.
22. Verein Deutscher Ingenieure. VDI 3883, Part I, Effects and Assessment of Odours; Psychometric Assessment ofOdour Annoyance. Questionnaires; Verein Deutscher Ingenieure, BeuthVerlag: Berlin, Germany, 1997.
23. Hilbe, J.M. Logistic Regression Models; CRC Press: Boca Raton, FL, USA, 2009.24. Zwieg, M.H.; Campbell, G. Receiver-operating characteristic (ROC) plots: A fundamental evaluation tool in
clinical medicine. Clin. Chem. 1993, 39, 561–577. [CrossRef]25. Sucker, K.; Both, R.; Bischoff, M.; Guski, R.; Winneke, G. Odor frequency and odor annoyance. Part I:
Assessment of frequency, intensity and hedonic tone of environmental odors in the field. Int. Arch. Occup.Environ. Health 2008, 81, 671–682. [CrossRef]
26. Miedema, H.M.E.; Walpot, J.I.; Steunenberg, C.F. Exposure-annoyance relationships for odour from stationarysources. Atmos. Environ. 2000, 34, 2927–2936. [CrossRef]

Sustainability 2020, 12, 6102 19 of 19
27. Sucker, K.; Both, R.; Bischoff, M.; Guski, R.; Kramer, U.; Winneke, G. Odor frequency and odor annoyancePart II: Dose-response associations and their modification by hedonic tone. Int. Arch. Occup. Environ. Health2008, 81, 683–694. [CrossRef]
28. Sucker, K.; Both, R.; Winneke, G. Review of adverse health effects of odours in field studies. Water Sci. Technol.2009, 59, 1281–1289. [CrossRef]
29. Sirotin, Y.B.; Shusterman, R.; Rinberg, D. Neural coding of perceived odor intensity. eNeuro 2015, 2. [CrossRef]30. Sucker, K.; Both, R.; Winneke, G. Adverse effects of environmental odours: Reviewing studies on annoyance
responses and symptom reporting. Water Sci. Technol. 2001, 44, 43–51. [CrossRef]31. Both, R.; Sucker, K.; Winneke, G.; Koch, E. Odour intensity and hedonic tone—Important parameters to
describe odour annoyance to residents? Water Sci. Technol. 2004, 50, 83–92. [CrossRef]
© 2020 by the authors. Licensee MDPI, Basel, Switzerland. This article is an open accessarticle distributed under the terms and conditions of the Creative Commons Attribution(CC BY) license (http://creativecommons.org/licenses/by/4.0/).