
Visibility and Logistic Control Tower - the Accenture case -
111
1 School of Industrial and Information Engineering Master of Science in Management Engineering Visibility and Logistic Control Tower - the Accenture case - Supervisor: Prof. Marco Melacini Master Graduation Thesis by: Gianmarco Tenti [894336] Academic year 2019-2020
-
Upload
khangminh22 -
Category
Documents
-
view
0 -
download
0
Transcript of Visibility and Logistic Control Tower - the Accenture case -
1
School of Industrial and Information Engineering
Master of Science in Management Engineering
Visibility and Logistic Control Tower
- the Accenture case -
Supervisor:
Prof. Marco Melacini
Master Graduation Thesis by:
Gianmarco Tenti [894336]
Academic year 2019-2020

2
TABLE OF CONTENTS
TABLE OF CONTENTS .................................................................................................................................2
TABLES INDEX ..............................................................................................................................................4
FIGURES INDEX ............................................................................................................................................5
ABSTRACT ......................................................................................................................................................7
EXECUTIVE SUMMARY ..............................................................................................................................8
THE PROBLEM ......................................................................................................................................... 8
THE ACCENTURE CASE ......................................................................................................................... 8
METHODOLOGY AND OBJECTIVES .................................................................................................. 9
LIMITATIONS OF THE ANALYSIS .................................................................................................... 10
THE CONSULTING INDUSTRY ................................................................................................................11
THE SERVICE .......................................................................................................................................... 11
THE HISTORICAL BACKGROUND .................................................................................................... 22
THE PLAYERS ......................................................................................................................................... 24
PESTLE ANALYSIS ................................................................................................................................. 27
PORTER’S FIVE FORCES ..................................................................................................................... 33
FUTURE TRENDS ................................................................................................................................... 36
ACCENTURE .................................................................................................................................................38
HISTORY ................................................................................................................................................... 38
INTERNAL ORGANIZATION ............................................................................................................... 40
THE CONTINUOUS GROWTH ............................................................................................................. 43
SWOT ANALYSIS .................................................................................................................................... 44
THE SUPPLY CHAIN MANAGEMENT ....................................................................................................47
THE DEFINITION ................................................................................................................................... 47
SUPPLY CHAIN’S HISTORY ................................................................................................................ 48
TODAY’S SUPPLY CHAIN .................................................................................................................... 51
FUTURE SUPPLY CHAIN ...................................................................................................................... 52
THE VISIBILITY ..........................................................................................................................................56
THE CONTEXT ........................................................................................................................................ 56
THE DEFINITION ................................................................................................................................... 57
THE BENEFITS OF VISIBILITY .......................................................................................................... 57
DYNAMIC CAPABILITIES .................................................................................................................... 59
3
TECHNOLOGIES .................................................................................................................................... 61
THE LOGISTIC CONTROL TOWER .......................................................................................................64
THE DIGITAL SUPPLY CHAIN............................................................................................................ 64
THE DEFINITIONS ................................................................................................................................. 65
THE LCT IMPLEMENTATION ............................................................................................................ 71
LCT TECHNOLOGIES ........................................................................................................................... 73
THE PROJECT IN ACCENTURE ..............................................................................................................76
THE CLIENT ............................................................................................................................................ 76
THE BUSINESS CASE ............................................................................................................................. 76
THE SCOPE .............................................................................................................................................. 76
THE INITIAL FORECAST ..................................................................................................................... 78
ACCENTURE’S PROPOSAL.................................................................................................................. 79
LCT IMPLEMENTATION ...................................................................................................................... 81
JDA SOFTWARE ..................................................................................................................................... 82
CONTINUOUS IMPROVEMENT INITIATIVES ................................................................................ 84
KPIs MONITORING ................................................................................................................................ 91
SHIPPEO PARTNERSHIP .................................................................................................................... 102
ACTUAL BENEFITS OF THE PROJECT .......................................................................................... 105
CONCLUSIONS AND FOLLOW UPS ................................................................................................. 107
REFERENCES .............................................................................................................................................109

4
TABLES INDEX
Table 1 – National management consulting markets (sample of 15 countries) .............................................. 28
Table 2 – MC employment growth rate (2013-2017) ...................................................................................... 29
Table 3 – MC Turnover and MC Employment trend for the European panel (2013-2017) ............................ 30
Table 4 – Accenture’s revenues split by operating group ............................................................................... 42
Table 5 – Traditional Management vs SCM ................................................................................................... 48
Table 6 – Performance affected by visibility ................................................................................................... 59
Table 7 – 3PL vs 4PL ...................................................................................................................................... 67
Table 8 – LCT’s benefits ................................................................................................................................. 71
Table 9 – Delivery Window Optimization 2019 savings ................................................................................. 85
Table 10 – Truck Type Optimization per lane 2019 ........................................................................................ 85
Table 11 – Roundtrips 2019 analysis and forecast per lane ........................................................................... 86
Table 12 – Multipick 2019 analysis and forecast ............................................................................................ 87
Table 13 – Multipick 2019 savings.................................................................................................................. 88
Table 14 – LTL 2019 savings .......................................................................................................................... 89
Table 15 – Procurement Contribution 2019 savings ...................................................................................... 90
Table 16 – Trucks Volume Conversion table .................................................................................................. 95
5
FIGURES INDEX
Figure 1 – Methodology’s flow ......................................................................................................................... 9
Figure 2 – Strategy consulting services .......................................................................................................... 12
Figure 3 – Operations consulting services ..................................................................................................... 14
Figure 4 – Financial advisory services ........................................................................................................... 17
Figure 5 – Human resources consulting services ........................................................................................... 19
Figure 6 – Technology and IT consulting services ......................................................................................... 21
Figure 7 – Foundation age and location of major Brand Consultancies ...................................................... 23
Figure 8 – 2018 revenues split by locations of the Top 5 Consulting Service Providers ............................... 25
Figure 9 – Accenture IPO on the New York Stock Exchange ......................................................................... 39
Figure 10 – Accenture’s global presence ....................................................................................................... 41
Figure 11 – Accenture’s performance and growth FY2019 ........................................................................... 43
Figure 12 – Accenture vs S&P 500 Indexes .................................................................................................... 44
Figure 13 – RFID’s modus operandi .............................................................................................................. 63
Figure 14 – xPL approaches ........................................................................................................................... 65
Figure 15 – LCT’s framework......................................................................................................................... 69
Figure 16 – Top Control Tower software providers ....................................................................................... 74
Figure 17 – Geographic transport flow allocation ......................................................................................... 77
Figure 18 – First round savings forecast ........................................................................................................ 78
Figure 19 – The logistic process ..................................................................................................................... 80
Figure 20 - Affiliates onboarding Gantt ......................................................................................................... 82
Figure 21 - Accenture’s interface of JDA software ........................................................................................ 83
Figure 22 – Logistic platforms split by transportation type ........................................................................... 88
Figure 23 – Example of KPIs identification decision tree .............................................................................. 91
Figure 24 – Contractual Fill rate by Affiliate ................................................................................................. 95
Figure 25 – Contractual Fill Rate vs Physical Fill Rate ................................................................................ 96
Figure 26 – Shipment and Delivery Note volumes .......................................................................................... 97
Figure 27 – On Time Shipments by Affiliate ................................................................................................... 97

6
Figure 28 – Re-planned Shipments ................................................................................................................. 98
Figure 29 – Transportation planning process ................................................................................................ 99
Figure 30 – Carriers’ operational KPIs ....................................................................................................... 100
Figure 31 – Positioning matrixes for carriers .............................................................................................. 101
Figure 32 – Transportation planning process with Shippeo ......................................................................... 103
Figure 33 – Transport statutes and geofencing in Shippeo .......................................................................... 104
Figure 34 – Shippeo’s Map view .................................................................................................................. 105
Figure 35 - Planned total transportation cost .............................................................................................. 106
Figure 36 – Actual total transportation cost ................................................................................................. 106
Figure 37 – Accenture’s profit from the project ........................................................................................... 107

7
ABSTRACT
The purpose of this thesis is to clarify the “visibility” concept in a logistic perspective and to identify
the main approaches to increase it, as the Logistic Control Tower (LCT).
The thesis starts with a brief introduction about the history of the consulting sector, in order to make
the reader aware of the environment in which Accenture operates, and to provide a comprehensive
view of the firm.
Successively, a literature review about the history and trends of the supply chain management is
submitted. Therefore, the focus is moved to the clarification of the “visibility” concept and to the
explanation on the theory of the Logistic Control Tower. Initially, the advantages of this configuration
are presented in a qualitative way from the evidence of the literature, but successively also a
quantitative approach is made possible thanks to the direct experience of the candidate, who, during
the internship, has been in touch with a project in which Accenture plays the role of the Logistic
Control Tower for an important firm of consumer goods.
This document can be considered as an attempt to show what are the possible savings achievable with
the external LCT implementation, and as a guideline for those firms with a low logistic capability,
which should consider the idea of outsource it, and for others already relying on 4PLs, without having
visibility on what they are paying for, which should review their logistic strategy.
8
EXECUTIVE SUMMARY
THE PROBLEM
The aim of this document is to respond to the difficult question on how a firm can reach the
operational excellence in such complicated and wide field as the logistic one. In the past the logistic
capability wasn’t considered as a competitive advantage by most of the industries, but nowadays the
situation has changed. Thanks to trends such as the globalization and the digitalization, the
transportation and the inventory management have started to assume a strategical value for firms’
business in the last years. However, not all the companies are able to exploit these new advantages
for many reasons, including their tendency of not dedicating time and effort to activities whom they
are used to consider non-core. For this reason, firms tend to outsource such activities to logistic
service provider operators. Two different cases are distinguished by the literature: if only the logistic
execution is outsourced, the carrier who performs the service is called a third party logistic service
provider (3PL), while if both the execution and the management of logistic flows are externalized,
the entity which provides the service is defined a fourth party logistic service provider (4PL). This
document focuses on this last scenario and on how the creation of a central hub (the Logistic Control
Tower), where all the logistic data are visible, improves overall supply chain’s performances.
THE ACCENTURE CASE
Accenture plc, stylised as Accenture, is an Irish-domiciled multinational professional services
company that provides services in strategy, consulting, digital, technology and operations to a B2B
market. The candidate exploits his experience from the internship in the firm to describe an
Accenture’s project where the firm plays the 4PL role for its client. One of the main objectives of the
thesis is to show to the reader how a consulting firm can be a perfect provider of this type of service,
highlighting the value added whom it can bring, while a carrier company can’t.
The project started in 2016 and a five-year duration is defined (until 2020 included). In this timeframe,
Accenture is accountable for the redesign of the transport management for the client starting from the
Logistic Control Tower set-up, the renegotiation of contracts with carriers on behalf of the client and
TMS integration. Moreover, Accenture will be committed in some operative activities, such as order
management, planning, and execution, auditing and billing. Since 2017 Accenture offers an Analytics
service, which allows the issue of standards reports and dashboard to monitor cost per lane and carrier,
as well as their performance with a continuous improvement perspective. The scope of the project
consists in the transportation management of inbound and outbound flows for 4 types of commodities
(raw materials, direct inbound materials, semi-finished goods and finished goods) from or to all the
9
European factories of the clients. The project mainly focuses on managing overland truck
transportation and ocean; despite of that, and due to punctual urgent order requirement, airfreight
orders are also managed.
METHODOLOGY AND OBJECTIVES
The main objectives whom the candidate wants to achieve are:
• Introduce the reader to the theory behind the concepts of visibility and Logistic Control
Tower;
• Prove the advantages of their deployment through Accenture’s practical case.
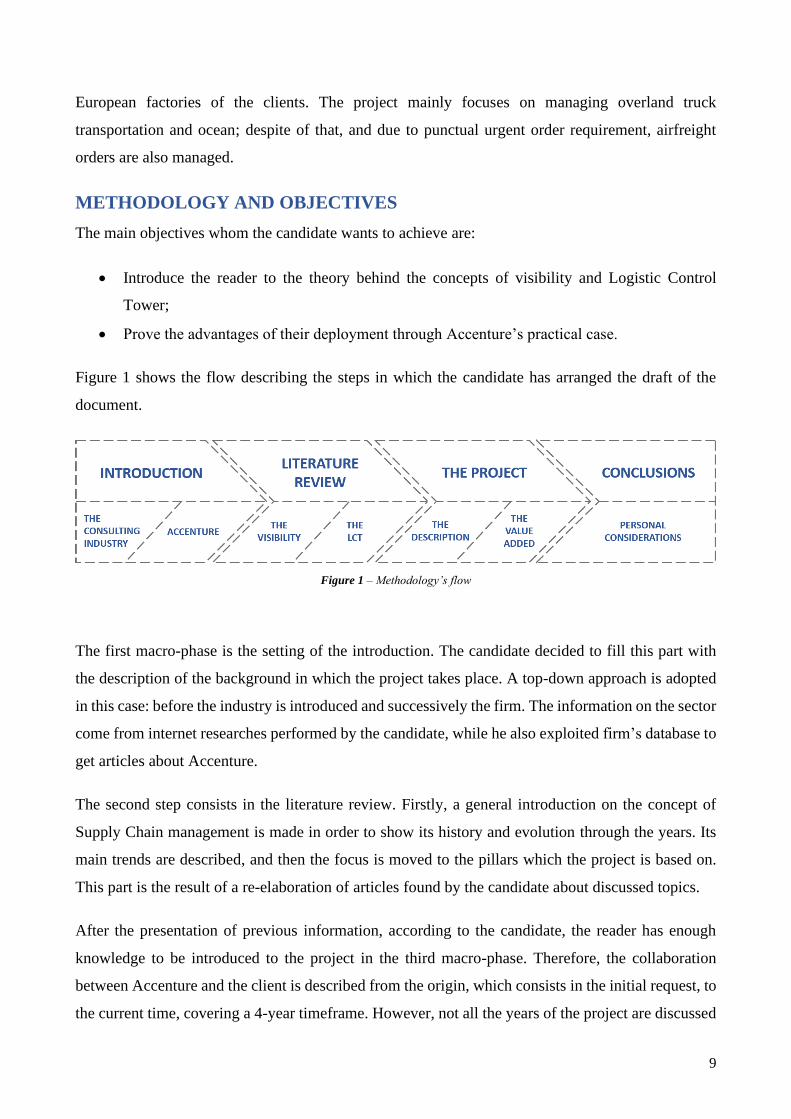
Figure 1 shows the flow describing the steps in which the candidate has arranged the draft of the
document.
Figure 1 – Methodology’s flow
The first macro-phase is the setting of the introduction. The candidate decided to fill this part with
the description of the background in which the project takes place. A top-down approach is adopted
in this case: before the industry is introduced and successively the firm. The information on the sector
come from internet researches performed by the candidate, while he also exploited firm’s database to
get articles about Accenture.
The second step consists in the literature review. Firstly, a general introduction on the concept of
Supply Chain management is made in order to show its history and evolution through the years. Its
main trends are described, and then the focus is moved to the pillars which the project is based on.
This part is the result of a re-elaboration of articles found by the candidate about discussed topics.
After the presentation of previous information, according to the candidate, the reader has enough
knowledge to be introduced to the project in the third macro-phase. Therefore, the collaboration
between Accenture and the client is described from the origin, which consists in the initial request, to
the current time, covering a 4-year timeframe. However, not all the years of the project are discussed
10
in depth, in order to avoid repetition and to focus on the 2019, when the internship of the candidate
takes place. After the general overview, a deep-dive analysis on the value added assured by the set-
up of the Logistic Control Tower and the spread of visibility is carried out through the presentation
of the practical tools used to achieve it (the savings-oriented initiatives for the economic benefit, the
KPIs and Shippeo platform for the historical and real-time monitoring of performance). This part
ends with the presentation of the actual economic results of the project considering both client’s and
Accenture’s perspective.
The last step is obviously dedicated to the conclusion part. In this phase the candidate makes
considerations on the project and on its own experience.
LIMITATIONS OF THE ANALYSIS
It is mandatory to clarify what are the hypotheses which assure the success of similar projects and of
4PL approaches in general. Taking the economic perspective, this approach is recommendable mainly
to manufacturing firms which operate globally with a huge number of shipments and have enough
revenues to justify a significant investment in the logistic side. Moreover, not all the goods’ types
need this relevant attention in the minimization of logistic costs. The logistic impact, indeed, is
negligible for high-value products, like drugs, designer clothes and high-tech ones. However, this
type of project fully fits the consumer goods industry for low-value products, where the logistic cost
is an important driver to reach a convenient margin.

11
THE CONSULTING INDUSTRY
“Management consulting is an independent professional advisory service assisting managers and
organizations to achieve organizational purposes and objectives by solving management and
business problem, identifying and seizing new opportunities, enhancing learning and implementing
changes.”
(Sabath & Kubr, 1977)
The global consulting market grew 9% reaching $188 billion in 2018 (Blackmore, Dean; Short, 2017).
Consulting services represented 19% of the overall IT services market in 2018, and the second-fastest-
growing segment, behind infrastructure as a service (IaaS) and infrastructure utility services. This
growth is driven by several factors, among them the merging of other markets into consulting.
Specifically, consultancies have enhanced their expertise by acquiring digital agencies, bringing with
them human-centred methods and a focus on user experience (digital design and innovation). They
have gained added revenue through innovation workshops leading to downstream work, advising on
new technologies and agile approaches.
THE SERVICE
What are the types of services provided by consulting firms? At the heart of the industry stand six
main domains: Strategy Consulting, Operations Consulting, Financial Advisory, HR Consulting and
Technology Consulting (Consultancy.Uk, 2018).
STRATEGIC CONSULTING
Strategy consulting, often referred to as strategy consultancy, strategic advisory or boardroom
consulting, is considered by the majority as the most high-end and prestigious segment within this
professional services industry. Strategy means “a plan with the aim of achieving long term goals" and
organisations regularly engage with consultants of this stream to seek support in developing or
implementing business strategies. The strategy consulting domain develops corporate, organisational
or functional strategies to private sector clients and helps public sector organisations and institutions
with economic policy. Strategy consulting services consists of eight disciplines: Corporate Strategy,
Business Model Transformation, Economic Policy, Mergers and Acquisitions, Organisational
Strategy, Functional Strategy, Strategy and Operations and Digital Strategy.

12
Figure 2 – Strategy consulting services
Corporate strategy, also referred to as strategic management, encompasses the formulation of
enterprise-wide and business unit strategies and goals. Strategy consultants are regularly assigned to
support the design of vision and mission statements, the development of strategic plans and the setup
of implementation roadmaps (which outline activities and resources needed to implement the
plans). Some examples of strategic advisory projects are the assessment of strategic options, the
support of business planning processes and the development of market entry strategies (when
companies want to enter new markets or launch new products).
Like corporate strategy, Business Model Transformation (BMI) also focuses on the design and
development of future-proof strategies, with the key difference that it includes fundamental changes
in how business is conducted, often triggered by major modifications in the external environment.
Business Model Transformation in addition has a wider scope than strategy, looking at a set of
organisational and operational elements and how they interact to achieve a common goal, such as
value propositions, customer segments, cost structures and organisational structures. Due to the
disruptive nature of technology in recent years, consultants of this stream in many cases work close
to Digital strategy.
The Economic Policy service area includes a range of economic advisory facilities that aid
governments and international institutions with policy setting. Most offerings cover fiscal policy,
which deals with government actions regarding taxation, budgets and spending and monetary policy,
that is related to central banking actions regarding the money supply and interest rates, or government
interventions across areas such as the labour market, national ownership, housing and so on. Further
offerings within this segment are impact assessments (such as a socio-economic benefits study),
financial valuation analysis in cases of disputes (economic litigation), economic studies for antitrust
cases, competition investigations and merger proceedings, conducted both for corporates or
governments authorities.
Strategy consultants are, together with corporate finance advisors, M&A lawyers and investment
bankers, also active in the M&A sector, with attention on strategic and commercial activities in the

13
pre-deal phase, although consultancies in many cases are too engaged to manage the initial period of
the post-merger integration phase. Strategy consulting firms serve companies and investors, for
instance, with building business cases to understand the economic drivers of M&A, and moreover
provide due diligence work on potential targets to clients. Other services that strategy consultants can
offer in this environment include the facilitation of the establishment of alliances and joint ventures,
managing divestitures/carve-outs and facilitating Initial Public Offerings (IPOs).
Organisational Strategy analyses the levers which an organisation needs to improve in order to, over
time, deliver the strategy of the enterprise. Main propositions include designing organisational
structures and corporate governance, assessing organisational competitiveness, developing human
capital strategies and supporting change management programmes.
Functional Strategy involves the development of strategic plans and roadmaps for organisational
functions, which can range from sales and marketing to finance, HR, supply chain, R&D or
procurement.
Over the past decade, strategic management and operational management have increasingly
converged, as topics such as process management, operations and technology have become
increasingly important elements of strategy execution. Consequently, several offerings which
historically were centred around strategic advisory have been expanded to include operational
considerations, and as a result the Strategy & Operations domain has gained significant importance.
The domain is not only served by strategy consulting firms that have moved towards operations, but
also operations specialist that have ramped up their strategic skills and large technology firms that
leverage their tech expertise to create an edge. Going forward, the lines between strategy, operations
and technology are forecasted to blur further, with an increasing number of consultancies set to play
a role in the field, adding competition to the landscape.
In line with the rise of technology, digital strategies have surfaced to the forefront of strategic work,
not just enabling business ambitions, but more than ever representing the crux between success and
failed strategies, and as a result, the market for Digital Strategy has shown unprecedented late growth.
The service area brings together elements from strategy and IT Organisation, and spans offerings
such as developing a strategy for digital operations, the design of a corporate IT or online strategy,
drafting approaches for analytics or cloud transitions, as well as high-level work for technology areas
such as architecture, governance and application management.

14
OPERATIONS CONSULTING
Operations consulting, also referred to as operations management, is described as advisory and/or
implementation services that improve a company's internal operations and performance in the value
chain. Operations management consulting projects create more effective client operations by advising
on and supporting with the implementation of changes to target operating model, functional business
processes, management systems, culture and so on. The market for operations consulting and
management services contains eight disciplines: Organisational Operations, Sales & Marketing,
Supply Chain, Sourcing & Procurement, Finance, Business Process Management, Research &
Development and Outsourcing.
Figure 3 – Operations consulting services
Organisational Operations is based on improving the performance of all aspects that support the
organisation’s structure; including organisation design, governance (across functions and
departments), roles and responsibilities, and employee performance. Typical activities concern either
the implementation of organisational strategies, such as workforce optimisation or the redesign of
employee roles, or are stimulated by an event or a crisis, such as a merger or a transition as part of a
broader corporate restructuring effort.
From a functional perspective, operations consulting aims at improving the processes, ways of
working and underlying systems across a broad range of areas, of which Sales & Marketing, Supply
Chain, Sourcing & Procurement, Finance and Research & Development are the largest areas in terms
of size. Sales & Marketing investigates how sales operations can be improved, including boosting
channel management, professionalising the level of customer support (i.e. from call centres to
specialised helpdesks) and advancing engagement with clients, commonly defined as customer
relationship management (CRM). Other areas under Sales & Marketing embrace the optimisation of
account and promotion management, Sales and Operations Planning (S&OP) and the improvement
of workforce effectiveness. Sales & Marketing include, among others, the fields of customer and
market research, marketing intelligence, product design and engineering, category management and,
lastly, customer experience and loyalty.
15
Supply Chain Management (SCM) consultants aim at streamlining the supply-side activities across
the full value chain, spanning from production to logistics (inbound/outbound) and warehousing
to customer delivery. Key offerings can be the supply side optimization of Sales and Operations
Planning, the enhancement of planning accuracy (i.d. demand planning, forecasting), manufacturing
operations improvement, logistics optimisation (i.d. network design, transport modes), inventory
management and managing operations risk. The latter area embraces all non-compliance-driven
efforts (which sit within Financial Advisory) aimed at minimising the risk of supply chain failures to
normal business operations. Key activities consist in the assessment of gross operating risk, the
development of operations risk mitigation plans, scenario modelling, and the development of
frameworks to automate responses to operations disruptions. One of the major growth areas in Supply
Chain Management consulting is sustainability: considering the growing value attached to corporate
social responsibility, companies are investing significantly in improving the ecological footprint of
their operations. Supply chain consultants typically work downstream of research and development
(i.d. product development, marketing) and upstream of sales and post-sale activities (i.d. sales,
customer service).
The Sourcing & Procurement segment of operations management concerns all procurement activities
aimed at finding, evaluating and engaging suppliers for acquiring goods and services. Consultants
can, for instance, support by decreasing the sourcing cost of raw materials or product/service
components, enhancing contracting terms and conditions with manufacturers/suppliers and managing
interaction with suppliers (including outsourced contracts, also known as supplier relationship
management). Key offerings consist in conducting a spend analysis in order to find synergies,
improving both the direct as well as indirect procurement operations and supporting clients with
transitioning to a greener procurement portfolio.
Services related to the Finance department, also known as CFO services, focus on a range of financial
activities. More strategic offerings can be mergers and acquisitions, capital budgeting and asset
management, although these services are commonly also part of the Financial Advisory service
portfolio of consulting firms, as well as financial planning and target operating model development,
which belong to the field of operations consulting. Implementation services aim to improve the
performance of one or a group of financial processes, such as order to cash, procure to pay, cash
management, working capital and the financial closing and reporting process. Finance operations
consists in supporting decision-making and consultants are frequently engaged to improve the flow
of relevant information to the appropriate stakeholders (management reporting) through, for instance,
data management, business intelligence and financial dashboards. Engagements that seek to raise the

16
maturity of the entire finance organisation, known as finance transformations, represent the largest
directive consultants can be given in the domain.
Business Process Management (BPM) focuses on improving operational performance by optimising
a company's business processes and it is, therefore, also defined as process management and/or
process improvement. The BPM landscape embraces several streams, such as business process
design, which sets out to define the ‘to-be’ situation and model process flow and activities to support
the blueprint, and business process re-engineering (BPR), which re-designs the entire process cycle,
commonly performed to reduce inefficiencies or complexity. Continuous improvement techniques
seeking to systematically remove waste from processes, such as Lean, Six Sigma or Lean Six Sigma,
form another major part of BPM projects, and although they come from and for long flourished in
industrial sectors, such as automotive and manufacturing, lean principles nowadays are applied across
industries, and expert consultants (or certified advisors) are frequently hired to facilitate such
transitions.
The Research & Development (R&D) service area represents the business side of innovation.
Consultants are engaged to develop and improve the bottom-line of innovation spend, which spans
from optimising new product development (NPD) processes, to boosting portfolio complexity
management and improving the efficiency of the R&D organisation, both from a “hard” (i.d.
structure/process/system) as well as a “soft” (i.d. human capital) point of view. Product lifecycle
management (PLM) is another source of productivity enhancement in the area of innovation.
Decisions involving how long to keep a product in a portfolio and when to take a product out of
service can be particularly difficult to make internally, therefore, consultants are frequently brought
in to advise around the elimination of no-longer-profitable products and to extend the profitable life
of products currently in the market.
Outsourcing advisors deal with client’s uncertainty related to the outsourcing of responsibilities and
activities to third parties. While outsourcing in its early years consisted mainly in the offshoring of
labour-intensive activities to low wage countries, the domain has over the past decades grown into
one of the largest services markets, and today it has become a mainstream line of operating models.
Consultants typically help clients with the design and build of outsourcing blueprints (mainly for
back-office processes such as finance and accounting, HR and recruitment, legal, IT infrastructure
and applications) and subsequently support the transitions. Recently, there has been a trend towards
bringing certain activities back to home base geographies (“reshoring”), and advisors also are
intensively involved with such projects. Establishing Shared Services is by the literature also
17
considered as part of the Outsourcing domain, because it is based on similar skills and expertise
(moving processes towards a new owner) and typically may include an outsourcing component if
organisations choose for an external party. Prior to establishing a Financial (FSSC) or HR (HRSSC)
Shared Service, consultants help with, among others, the harmonisation and standardisation of
processes, as well the shift towards a common template.
FINANCIAL ADVISORY
The Financial Advisory (or financial consulting) segment delivers consulting services based on a
strong financial analytical fundament. Service offerings include a wide variety of topics, such
as transaction services, risk management, tax advisory, real estate advisory, compliance and litigation
services to name a few. However, financial and accounting skills are always core competences of the
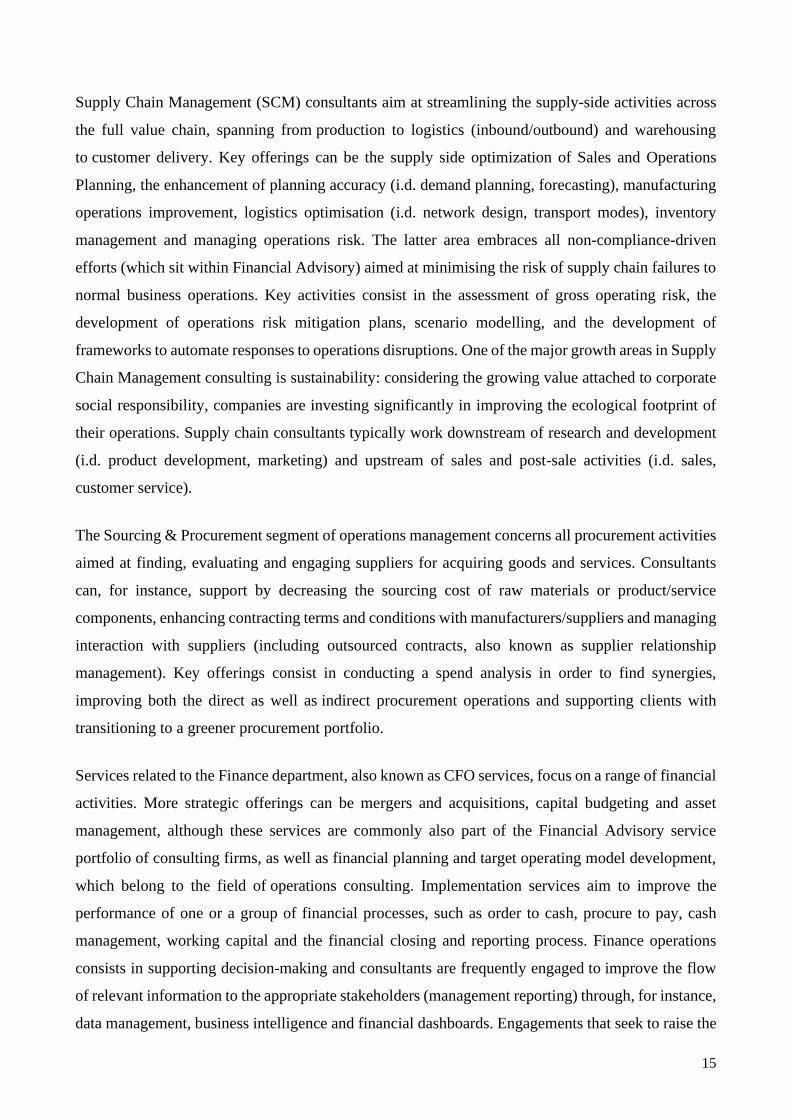
services delivered. The market for financial advisory consists of eight main disciplines: Transaction
Services, Corporate Finance, Crisis & Recovery, Risk Management, Accounting Advisory, Tax
Advisory, Real Estate Advisory and Forensics & Litigation.
Figure 4 – Financial advisory services
Corporate finance is the area of consulting dealing with funding and capital structure matters. Key
propositions are financing (including alternative investments) restructuring, working capital
management (also closely tied to the finance consulting segment within operations consulting), IPO’s
and capital markets.
Transaction services provides to the client a range of services related to the acquisition, merger or
divestiture of an organisation. Services vary from setting a M&A strategy, target screening, valuations
and due diligence in the pre-deal process to post-merger integration support and other operational
transaction services after a deal has been unveiled.
When companies are in financial difficulties, they commonly turn to crisis & recovery advisors.
Experts support them funding the root-causes (short term) and subsequently ensuring
countermeasures are in place for the longer term. Key services include insolvency (or bankruptcy)

18
management (consultants are often called in as administrators), restructuring, turnaround advisory
and debt management.
Risk management consultants support organisations with ensuring that uncertainty in the enterprise
and market does not impact (or minimally) business goals. Main offerings consist in, among others,
risk management (analysing risks and ensuring a process and governance are in place to mitigate
risks), risk control (setting up the right warning systems that can detect risks), internal audit
(assessments aimed at mapping risk profiles and compliance) and IT risk, which covers the growing
risks in the information technology area, such as cybersecurity, digital governance and enterprise data
management.
The tax advisory segment centres around supporting enterprises’ adherence to tax law, which includes
propositions such as corporate tax strategy, location advisory, transfer pricing and tax aligned supply
chains.
Accounting advisory focuses on helping clients with optimising the accounting and financial
reporting challenges facing their businesses and the finance function. Projects typically concern
boosting the efficiency of the accounting function, improving financial reporting quality and flows,
and ensuring compliance to regulatory requirements at all levels, such as International Financial
Reporting Standards (IFRS), globally and local legislation.
The real estate advisory segment supports clients with financial matters in the area of real estate and
property management. Key offerings can be location advisory, real estate valuations, transaction
support on property deals, and optimising real estate asset portfolios (often in combination with
financial asset management). Clients typically include four stakeholders’ types: governments and
local municipalities (i.e. area development), housing corporations (i.e. strategic supply management,
risk management), companies (i.e. portfolio management, location support) and real estate investors
(i.e. due diligence, portfolio analyses).
The forensics & litigation segment helps clients with a range of services that follow from actual or
anticipated disputes or litigation cases. Propositions include dispute advisory, forensic accounting
services (which combines accounting, auditing and investigative skills), litigation support and
electronic discovery (or e-discovery). Work can span across industries and topics – a forensic
consultant (also known as an auditor or investigative auditor) can bring economic damages
calculations for governments, antitrust bodies or companies, support tax fraud or money laundering
investigations or examine digital crimes such as cyber-attacks or data theft.
19
HR CONSULTING
Human resource (HR) consulting, also referred to as human capital advisory or HRM consulting,
embraces advisory and implementation activities related to the management of an organisation’s
human capital and the HR function. The scope of services ranges from overall work on human capital
strategy to the design and deployment of a compensation and benefits framework for the
transformation of the HR function. The market for human resource consulting services include
eight main disciplines: Human Capital Strategy, Compensation & Benefits, Organisational Change,
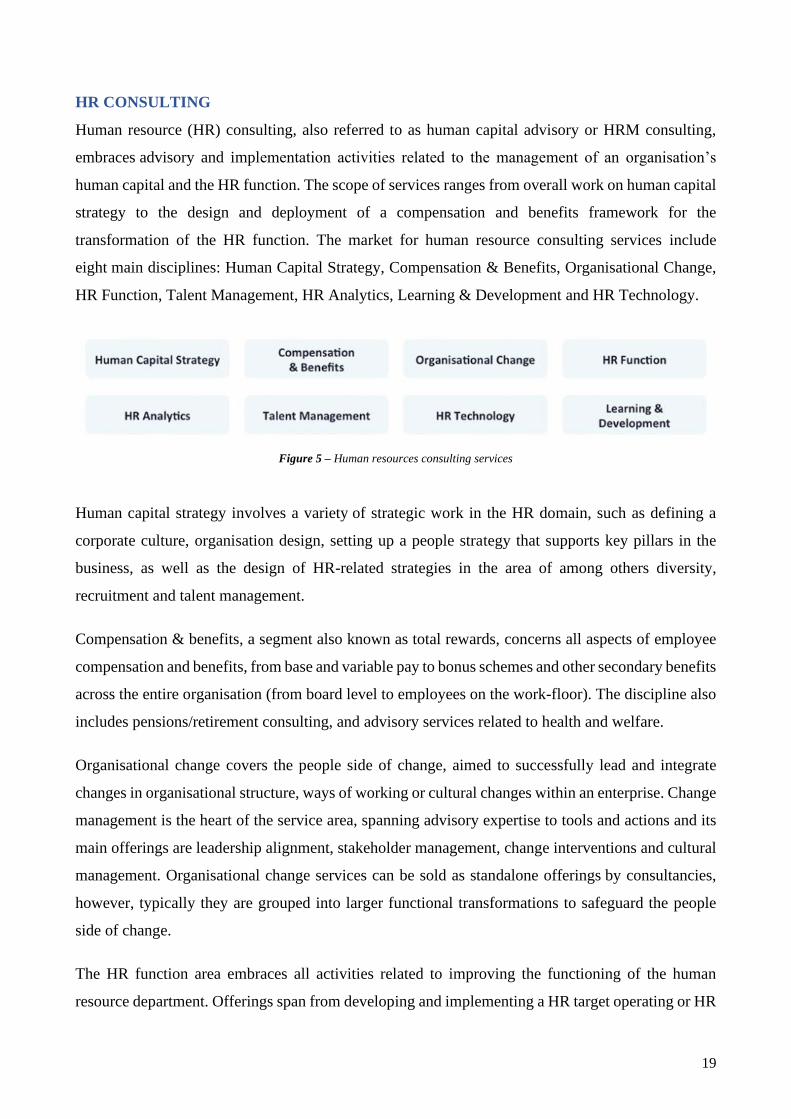
HR Function, Talent Management, HR Analytics, Learning & Development and HR Technology.
Figure 5 – Human resources consulting services
Human capital strategy involves a variety of strategic work in the HR domain, such as defining a
corporate culture, organisation design, setting up a people strategy that supports key pillars in the
business, as well as the design of HR-related strategies in the area of among others diversity,
recruitment and talent management.
Compensation & benefits, a segment also known as total rewards, concerns all aspects of employee
compensation and benefits, from base and variable pay to bonus schemes and other secondary benefits
across the entire organisation (from board level to employees on the work-floor). The discipline also
includes pensions/retirement consulting, and advisory services related to health and welfare.
Organisational change covers the people side of change, aimed to successfully lead and integrate
changes in organisational structure, ways of working or cultural changes within an enterprise. Change
management is the heart of the service area, spanning advisory expertise to tools and actions and its
main offerings are leadership alignment, stakeholder management, change interventions and cultural
management. Organisational change services can be sold as standalone offerings by consultancies,
however, typically they are grouped into larger functional transformations to safeguard the people
side of change.
The HR function area embraces all activities related to improving the functioning of the human
resource department. Offerings span from developing and implementing a HR target operating or HR

20
delivery model, to the implementation of HR systems and technologies, or other HR transformations
that boost processes and organisational efficiency.
Talent management concerns all activities required to recruit, retain and develop talent, as well as
having the right structure and processes in place to ensure professionals can perform optimally. Key
propositions encompass strategic workforce planning (the science to anticipate on present and future
human capital needs by matching business goals with HR data) recruitment and retention, workforce
effectiveness and performance management.
Through the rise of data and new technologies, HR analytics has grown into a fully developed service
area within HR consulting. HR analytics applies analytic processes to the human capital with the key
objective of adding insights and value to HR activities.
The learning & development service line, also referred to as training & development, is composed by
activities aimed to improve the performance of individuals and groups. The scope span from
organisational and competency development across leadership, departments and functions to support
the training and education needs of individuals. Learning & Development also embraces the soft side
of development, such as coaching and mentoring, as well as the technological side of training, such
as the development and implementation of learning management systems.
Lastly, HR technology is the field specialised in all systems and tools used in the HR department,
including large ERP modules by SAP, Oracle or Microsoft, and more niche solutions per functional
domain.
IT CONSULTING
IT consulting, also referred to as technology consulting, concerns services aimed to help clients on
how they can utilise information technology (IT) and digital to optimally achieve their business goals.
The IT consulting segment includes advisory and implementation services but excludes transactional
IT activities. The broad market for IT consulting services contains eight main disciplines: IT Strategy,
IT Architecture, IT Implementation, ERP services, Systems Integration, Data Analytics, IT Security
and Software Management.

21
Figure 6 – Technology and IT consulting services
IT strategy refers to strategic IT propositions and IT advisory, offerings which commonly represent
the first phase of any IT undertaking. Engagements typically last between six weeks to six months
depending on the complexity, with an average of two to three months. Examples of projects consists
in defining a corporate IT strategy, setting up a business case for an ERP system or designing a
cybersecurity vision (engagements that set the stage for further IT work).
IT architecture concerns the IT processes and systems and defines the technological blueprint that
enables business processes. Projects typically last between 6 to 12 months and architecture services
precede any IT implementation or systems integration efforts. Examples of consulting offerings are,
among others, defining an enterprise landscape, implementing a service-oriented architecture (SOA),
or guiding the outsourcing of architecture processes to an external vendor.
Enterprise Resource Planning (ERP) services supports clients with designing, implementing and/or
maintaining ERP systems and modules. Key propositions consist in ERP package selections, business
process redesigns based on an ERP template, and implementations of, for instance, SAP or Oracle
products.
The systems integration domain refers to how different computing systems and software applications
can link together in order to ensure systems acts as a coordinated whole. It requires ERP
systems/modules which can interact with other and more tailored applications in the IT landscape.
IT security encompasses risk, security and compliance responsibilities in the IT landscape, while the
IT implementation line of business includes all services related to the design and implementation of
technology-driven projects.
Software management refers to the practice that consists in managing and optimising the purchase,
deployment, maintenance, utilisation, and disposal of software applications within an organisation.
Lastly, data analytics, an upcoming domain, includes all the techniques and tools that can turn large
amounts of data into valuable information in order to support decision making. Typical propositions
22
in this segment are business intelligence, workforce analytics, customer intelligence, data
warehousing (big data) and predictive modelling.
THE HISTORICAL BACKGROUND
One of the first consulting firms of the kind known today was established in Chicago in 1914 by
Edwin Booz under the name “Business Research Services” (Sabath & Kubr, 1977). In the 1920s,
Elton Mayo, with his Hawthorne experiment, triggered research and consulting in human relations.
Another important consulting work in human resource management and motivation was started by
Mary Parker Follett. Interest in more effective selling and marketing was promoted by people such
as Harold Whitehead, the author of Principles of salesmanship, written in 1917. Several consulting
firms were established during the 1920s. These were increasingly able to analyse business
organizations in their whole, treating manufacturing and productivity problems in a wider perspective
of sales and opportunities of business expansion.
Consulting in finance, including financing the enterprise and financial control of operations, also
started developing rapidly. Several new management consultants had a background in accountancy
and experience drawn from working with firms of public accountants. This is the case of James O.
McKinsey, a protagonist of the general management and comprehensive diagnostic approach to a
business enterprise, who established his own consulting firm in 1925, and today is regarded as one of
the founders of the consulting profession.
In the 1920s and 1930s, management consulting developed, not only in the United States and in Great
Britain, but also in France, Germany, and other industrialized countries. However, its volume and
scope remained limited. There were only few firms, prestigious but rather small, and their services
were exploited mainly by the larger business corporations. The consultant remained unknown to most
small and medium-sized firms. Meanwhile, assignment requests began coming from governments:
this was the start of consulting for the public sector.
Consulting for governments, and for the army as well, played an important role during the Second
World War. The United States realized that the war was a major management challenge and that
gathering the country’s best management expertise was essential to win on the battlefield. In addition,
operations research and other analytical techniques, applied first for military purposes, rapidly found
their way into business and public management, adding a new dimension to the facilities offered by
consultants.

23
Figure 7 – Foundation age and location of major Brand Consultancies
Post-war reconstruction, the rapid expansion of business coupled with the acceleration of
technological change, the emergence of new developing economies and the growing
internationalization of the world’s industry, commerce and finance, created particularly favourable
opportunities and growing demands for management consulting. This was the period in which most
consulting firms that exist today were established and in which the consulting business achieved the
power and the technical reputation it enjoys at present. For example, PA, the largest consulting firm
in the United Kingdom, had only six consultants in 1943, but 370 in 1963, and over 1,300 based in
22 countries in 1984. The total number of full-time management consultants in the United States was
assessed at 100,000 at the end of the 1980s, six times the number that existed in the mid-1960s (Sabath
& Kubr, 1977).
Since the 1940s, the spread of management consulting has been impressive by any standard.
Significant qualitative changes have also occurred. To meet their clients’ needs and to attract clients
from new sectors of economic and social activity, management consultants developed several
strategies, creating and offering new special facilities, specializing sectors or, on the contrary,
providing broad comprehensive packages of services.
Most management consultants were able to be associated with the latest developments in management
and related fields that can interest their clients, and to offer new sophisticated services before anyone
else. The computer business, the use of information technologies in all aspects of management and
accounting, and new communication technologies are examples of such areas. Consultants do not
hesitate to step out of the traditional domain of the management field and deal with plant automation,
communication systems, quality control, equipment design, software development, economic studies,
environmental protection and other clients’ interests.

24
Competition in management consulting has greatly increased since 1950. In addition to improving
service quality and offering new sorts of facilities, management consultants have become more
dynamic and even aggressive in searching for new clients and trying to convince potential ones that
they can offer a higher value than others. This has led many developments in the advertising and
marketing of consulting services.
By the 1950s a distinct hierarchy of management consulting firms had emerged, led by three
companies: McKinsey & Company; Booz, Allen & Hamilton; and Cresap, McCormick & Page
(McKenna, 2001). These leading firms had grown rapidly during the post-war growth, and in the
early 1960s they expanded into Western Europe. The American consulting firms encountered little
competition and extraordinary demand as they moved into foreign markets; by the mid-1960s
American entrepreneurs dominated the world market for organizational advice. More similar than
different, the three leading firms all had their roots in Chicago, they hired their future partners almost
exclusively from the top Harvard Business School graduates, and at one point during the 1960s they
were all headquartered in a single building in New York City.
In the late 1960s, however, this comfortable oligopolistic structure started to deteriorate. Accounting
firms like Arthur Andersen & Company and “strategy” consulting firms, like the Boston Consulting
Group, began to move into the market for consulting services. The strategy firms stole business from
the top, while the accounting firms won routine assignments from the bottom. By the 1970s, although
McKinsey & Company, Booz, Allen & Hamilton, and Cresap, McCormick & Paget no longer
dominated the market for management consulting services, the model of the professional firm with
its related system of rewards remained the central organizational form among management consulting
firms. Only recently large, publicly owned, technology-based corporations like EDS, IBM, and
AT&T have built consulting divisions that rival the older consulting firms if not in size, at least in
their profitability per consultant.
THE PLAYERS
The 9.0% CC1 growth in consulting services in 2018 confirms the continuing demand for
organizations seeking help with the ambition and design of their technology strategies (Blackmore,
Dean; Short, 2017). Collectively, the top 10 consultancies grew 9.8% in CC in 2018 consulting
revenue.
1 “CC” means “Constant Currencies”. they are exchange rates used to eliminate the effect of fluctuations when
calculating financial performance numbers for publication in financial statements
25
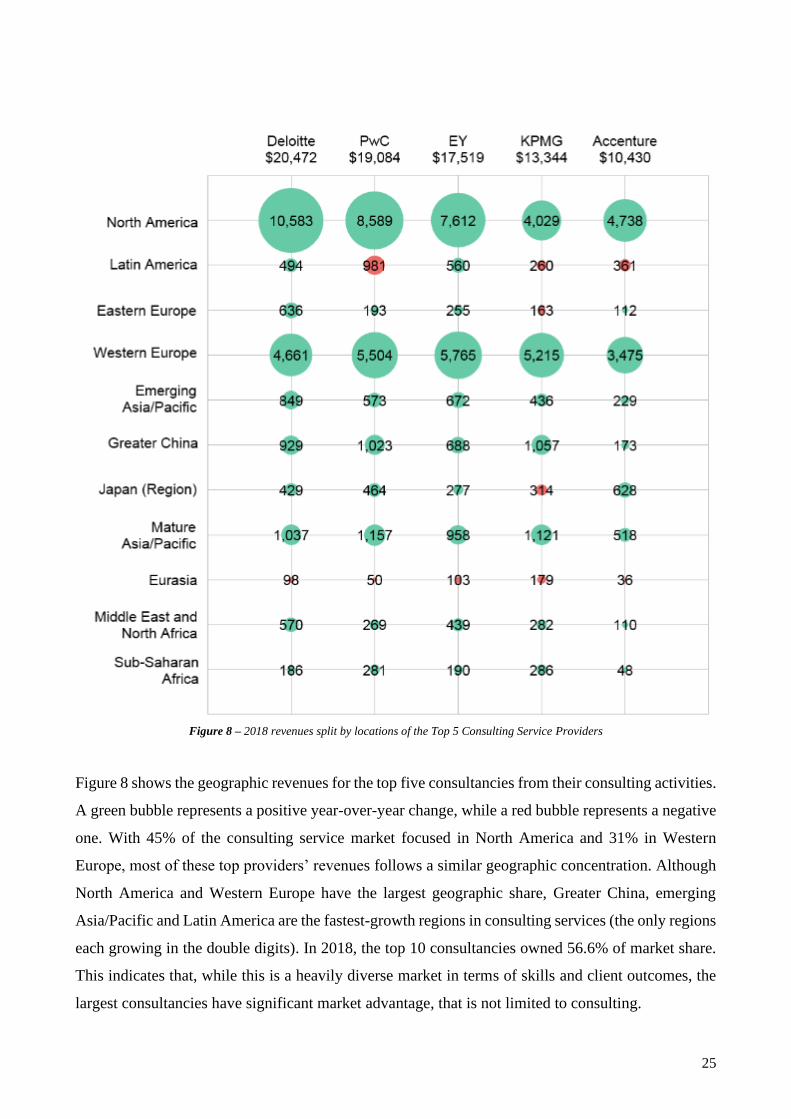
Figure 8 – 2018 revenues split by locations of the Top 5 Consulting Service Providers
Figure 8 shows the geographic revenues for the top five consultancies from their consulting activities.
A green bubble represents a positive year-over-year change, while a red bubble represents a negative
one. With 45% of the consulting service market focused in North America and 31% in Western
Europe, most of these top providers’ revenues follows a similar geographic concentration. Although
North America and Western Europe have the largest geographic share, Greater China, emerging
Asia/Pacific and Latin America are the fastest-growth regions in consulting services (the only regions
each growing in the double digits). In 2018, the top 10 consultancies owned 56.6% of market share.
This indicates that, while this is a heavily diverse market in terms of skills and client outcomes, the
largest consultancies have significant market advantage, that is not limited to consulting.

26
DELOITTE
Deloitte Touche Tohmatsu Limited, commonly referred to as Deloitte, is a multinational professional
services network. Deloitte is one of the "Big Four" accounting organizations and the largest
professional services network in the world by revenue and number of professionals with headquarters
in London. Deloitte provides audit, tax, consulting, enterprise risk and financial advisory services
with approximately 312,000 professionals globally. In FY2 2019, the network earned a record $46.2
billion in aggregate revenues. As of 2017, Deloitte is the 4th largest privately-owned company in the
United States. Deloitte has been ranked number one by market share in consulting by Gartner, and
for the fourth consecutive year, Kennedy Consulting Research and Advisory ranks Deloitte number
one in both global consulting and management consulting based on aggregate revenue.
PWC
PricewaterhouseCoopers International Limited is a multinational professional services network with
headquarters in London. PwC ranks as the second largest professional services firm in the world and
is considered one of the Big Four accounting firms, along with Deloitte, EY and KPMG. PwC is a
network of firms in 158 countries, 721 locations, with 250,930 people. As of 2018, 28% of the
workforce worked in Asia, 28% in North America and the Caribbean and 30% in Western Europe.
The company's global revenues were $41.3 billion in FY 2018 and it provides services to 420 out of
500 Fortune 500 companies. The firm in its present form was created in 1998 by a merger between
two accounting firms: Coopers & Lybrand, and Price Waterhouse. Both firms had histories dating
back to the 19th century. The trading name was shortened to PwC in September 2010 as part of a
rebranding effort. As of 2019, PwC is the 5th-largest privately-owned company in the United States.
EY
Ernst & Young Global Limited, commonly known as Ernst & Young or simply EY, is a multinational
professional services firm headquartered in London. EY is one of the largest professional services
firms in the world. Along with Deloitte, KPMG and PricewaterhouseCoopers, it is considered one of
the Big Four accounting firms. It primarily provides assurance (which includes financial audit), tax,
consulting and advisory services to its clients. Like many of the larger accounting firms in recent
years, EY has expanded into markets adjacent to accounting, including strategy, operations, HR,
technology, and financial services consulting. EY operates as a network of member firms which are
structured as separate legal entities in a partnership, which has over 270,000 employees in over 700
offices in 150 countries around the world. The firm's current partnership was formed in 1989 by a
merger of two accounting firms: Ernst & Whinney and Arthur Young & Co.. It was pertinently named
2 “FY” means “Fiscal Year”

27
Ernst & Young until a rebranding campaign officially changed its name to EY in 2013, although this
initialism was already used informally prior to its authorising adoption. In 2019, EY was the seventh
largest privately-owned organization in the United States. EY has continuously been ranked on
Fortune magazine's list of the “100 Best Companies to Work For” for the past 21 years, longer than
any other accounting firm.
KPMG
KPMG International Cooperative, or simply KPMG, is a multinational professional services network,
and one of the Big Four accounting organizations, along with Deloitte, Ernst & Young (EY), and
PricewaterhouseCoopers (PwC). Seated in Amstelveen, in Netherlands, KPMG is a network of firms
in 154 countries, with 207,050 people and has three lines of services: financial audit, tax, and
advisory. Its tax and advisory services are further divided into various service groups. The name
"KPMG" stands for "Klynveld Peat Marwick Goerdeler". It was chosen when KMG (Klynveld Main
Goerdeler) merged with Peat Marwick in 1987.
ACCENTURE
An entire chapter will be dedicated to Accenture, since it is the host of the project described in this
thesis.
PESTLE ANALYSIS
POLITICAL
The increase in protectionism politics has impacted the global free trade (S&P, 2017). A major portion
of consultancy business’s revenue comes from United Kingdom and Brexit will severely impact it.
Immediate consequence is the low business visibility and economic uncertainty in the environment.
The new policies in the region will significantly affect the revenues and cost of operation. Moreover,
3 out of the Big Four are financial based in London. The Brexit has raised the economic volatility and
has led to decrease in revenue of UK operations due to sharp depreciation in GBP post the referendum.
ECONOMIC
Since 2004, the Consulting industry has recovered significantly: all firms are now aggressively
recruiting again. Most firms were surprisingly resilient to the Great Recession of 2008 and 2009.
Currently, most consulting offices are working at full capacity and the prospect for the sector is very
positive. Top consulting firms continue to compete with investment banks and each other for the top
candidates from universities and business school programs across the country, offering highly
attractive compensation packages and career opportunities. At many top business schools, as much
as 1/3 of the graduating class will sign with consulting firms upon graduation (Street of Walls, 2013).

28
Table 1 – National management consulting markets (sample of 15 countries)
Table 1 shows the size of the management consulting markets in M$ for the fifteen countries in the
sample and its strength in terms of the proportion of the country’s GDP and of the number of the
population (Haslam, Bodenstein, & Abdel-jaber, 2018).
SOCIAL
The European Management Consulting employment in 2017 has grown by 5.2%, continuing its
positive trend. In 2017 all the countries included in the report have achieved a significant growth, the
only exceptions being Greece and Slovenia where employment registered just a slight increase.
Austria, France and Switzerland are showing very high growth in the employment levels, a clear
indicator that MC companies in these countries believe that the industry growth is going to last. While
data are fragmented, it appears that employment growth is concentrated mainly in the large and very
large consulting companies (i.e. those with more than 50 employees).
Country
Size of management
consulting market (2017
data, M$)
Strength of management
consulting sector to GDP
(M$ MC/BN$ GDP)
Strength of management
consulting sector per
capita – M$/pop (M)
USA 63,185 32,6% 194.7
UK 10,006 38.2% 151.1
Germany 9,141 25.9% 116.2
France 5,111 19.8% 78.6
Australia 5,003 37.8% 205
China 4.992 4.1% 3.5
Canada 3,912 23.7% 106.9
Spain 1,662 12.7% 35.8
Italy 1,412 7.3% 23.8
Netherlands 1,402 15.4% 82.5
Japan 1,408 2.9% 11
Switzerland 1,241 18.3% 146
Brazil 1,183 5.8% 5.7
Russia 493 3.1% 3.4
Austria 321 7.7% 36.9

29
Table 2 – MC employment growth rate (2013-2017)
Management Consulting is traditionally a “people” business. An increase in turnover, unless driven
by a variation in price levels, is related to an increase in billed hours and therefore in employment.
However, in the short term, the employment trend does not always match turnover growth. Given the
time required for the development of a consultant, many consulting firms, when a recovery is
forecasted, may hire in anticipation or, during a recession period, may retain their consultants.
Moreover, during a period of turnover growth, MC companies often partially balance the increased
workload by asking their consultants to stay overtime. A comparative analysis of the past six years’
trend in MC turnover vs. MC employment highlights that the MC employment level has grown
slightly less than the MC turnover: 5.6% per year vs. 6.6% per year (Cerruti, Borra, Appolloni,
Benedetto, & Elisabetta, 2018). In 2013 MC employment grew more than MC turnover and since
then the turnover has increased at a faster pace.
30
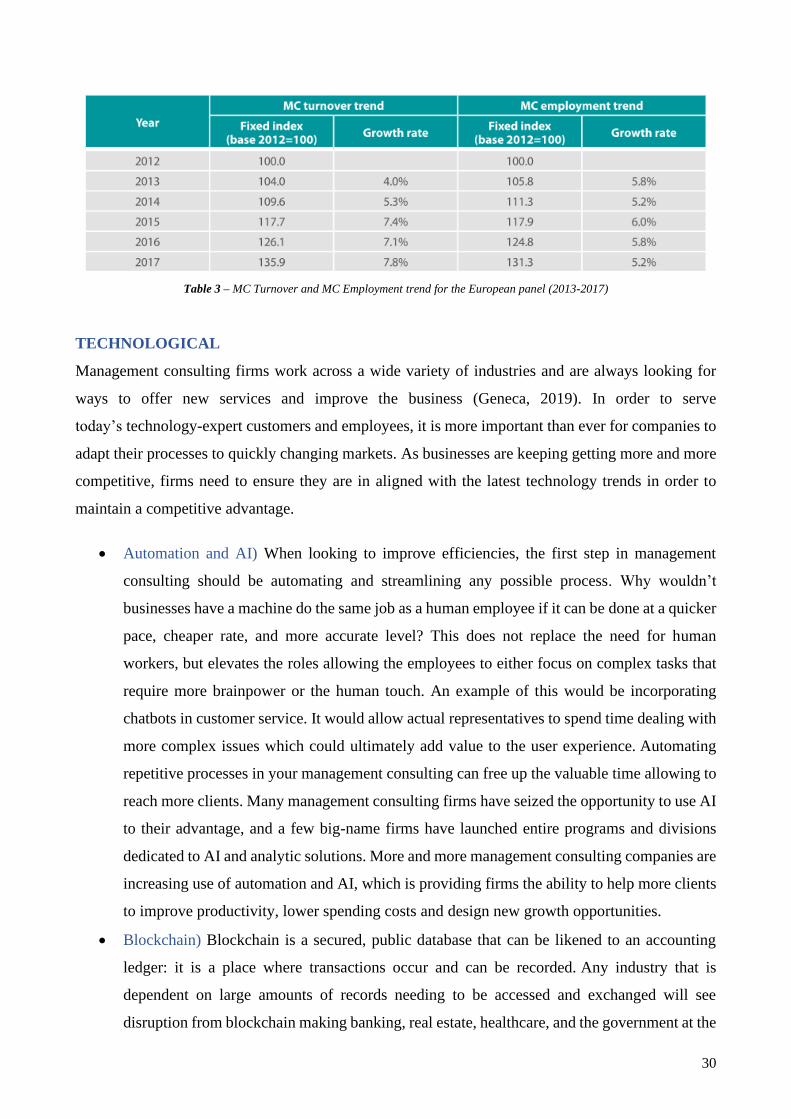
Table 3 – MC Turnover and MC Employment trend for the European panel (2013-2017)
TECHNOLOGICAL
Management consulting firms work across a wide variety of industries and are always looking for
ways to offer new services and improve the business (Geneca, 2019). In order to serve
today’s technology-expert customers and employees, it is more important than ever for companies to
adapt their processes to quickly changing markets. As businesses are keeping getting more and more
competitive, firms need to ensure they are in aligned with the latest technology trends in order to
maintain a competitive advantage.
• Automation and AI) When looking to improve efficiencies, the first step in management
consulting should be automating and streamlining any possible process. Why wouldn’t
businesses have a machine do the same job as a human employee if it can be done at a quicker
pace, cheaper rate, and more accurate level? This does not replace the need for human
workers, but elevates the roles allowing the employees to either focus on complex tasks that
require more brainpower or the human touch. An example of this would be incorporating
chatbots in customer service. It would allow actual representatives to spend time dealing with
more complex issues which could ultimately add value to the user experience. Automating
repetitive processes in your management consulting can free up the valuable time allowing to
reach more clients. Many management consulting firms have seized the opportunity to use AI
to their advantage, and a few big-name firms have launched entire programs and divisions
dedicated to AI and analytic solutions. More and more management consulting companies are
increasing use of automation and AI, which is providing firms the ability to help more clients
to improve productivity, lower spending costs and design new growth opportunities.
• Blockchain) Blockchain is a secured, public database that can be likened to an accounting
ledger: it is a place where transactions occur and can be recorded. Any industry that is
dependent on large amounts of records needing to be accessed and exchanged will see
disruption from blockchain making banking, real estate, healthcare, and the government at the

31
head of the line. Just as all companies look for ways to grow and expand their audiences,
management consulting firms need to provide strategic offerings and to be aligned with new
technologies. Blockchain offers new advantages for management consulting firms to examine.
According to Forbes, “The security is built into a blockchain system through the distributed
timestamping server and peer-to-peer network, and the result is a database that is managed
autonomously in a decentralized way.” Faster, more secure financial transactions, the ability
to establish an identity, and a more efficient way to establish contracts are just a few of the
advantages management consulting firms can offer through blockchain. As blockchain
eliminates the need of intermediaries in a process, transactions can be recorded and completed
much faster. Accenture recently advertised the future of this technology as “Blockchain will
supercharge artificial intelligence and IoT to make everything from supply chains to digital
identity management smarter and more secure.”
• Data Analytics) Many companies in today’s world use data analytics to draw conclusions and
make informed business decisions in order to increase revenue, improve efficiencies, and gain
a competitive advantage. While there are various data analytic applications that can be tested,
the process also has multiple parts, in addition to analysing the actual data. There are many
steps involved in collecting, organizing, testing and revising the data to ensure accurate
information has been obtained. As the data analytics process can be intimidating, management
consulting firms are able to step in and help companies organize the process from the very
beginning. Management consultants set the strategy and design the full data action plan. They
are also able to interpret technologies based on their business value and help companies to
change market conditions. When data has been analysed and new initiatives need to be
implemented, management consulting firms will be there to help ensure things run smoothly.
As clients continue to make more and more data-driven business decisions, management
consulting firms will keep improving the data analytics process.
• Digitalization) Digitalization has many different meanings and can be interpreted in several
ways, but for those in the management consulting industry, the idea is straight-forward.
Digitalization can be summed up as shifting business processes into digital formats in order
to increase revenue, improve efficiencies and provide more valuable opportunities. Clients
will expect digital products to remain, after the management consulting firm concludes
business, to ensure an effective business transformation for the future. Consultants without
digital tools will need to build some to attract and maintain their clients, as well as stand out
from competitors. To define the digital transformation, Boston Consulting Group says
“Leveraging digital technologies is more than just good business, it’s crucial to stay relevant

32
and profitable. Companies lacking in this area risk losing ground to newer entrants and
business models that are going to disrupt markets with innovative products and
services.” Digitalization presents a massive opportunity for management consulting firms, but
they must first rethink their own business models and update their own processes before it
will take them anywhere.
LEGAL
All the Big Four accounting firms have come under fire over their client relationships in recent years
(Financial Times, 2018). One prominent example of accountants getting too close to clients
is KPMG’s relationship with South Africa’s billionaire Gupta family, which has been at the centre of
a huge government corruption scandal over a 15-year period that ended in 2016.
EY, meanwhile, was fined $9.3m by the SEC two years ago for failing to take appropriate action
when it emerged that two audit partners had formed improperly close relationships with clients. One
of the partners had become involved romantically with the chief accounting officer at a company she
audited, while the other partner spent more than $100,000 on corporate entertainment for the chief
financial officer of a listed company he audited.
More recently, PwC has been criticised in the UK for its work for collapsed retailer BHS. The UK
regulator raised concerns about PwC’s failure to adequately monitor conflicts of interest after it
emerged the firm earned eight times more from consulting work for BHS than it did from auditing.
The firm’s lead partner on the audit, Steve Denison, agreed to a 15-year ban from the industry after
the regulator found he recorded just two hours of work on the audit.
Meanwhile, Deloitte is under investigation over its work for Frankfurt and Johannesburg-listed
retailer Steinhoff, which last year revealed a black hole of more than 5bn€ in its accounts.
Shareholders have criticised Deloitte, which audited Steinhoff for at least 18 years, for “seriously
failing in its statutory task as auditor” by giving the retailer an unqualified audit shortly before the
accounting irregularities were uncovered.
ENVIRONMENTAL
Efforts towards renewable energy and technologies producing low emissions are obtaining more and
more government funding. Organizations that invest in research and development within these areas
are also growing and are one of the places where environmental consultants can be found. They have
extensive knowledge on environmental regulations and can advise clients in private industry or public
government institutions on how to handle possible fines, legal action or misguided transactions. An
33
environmental consultant addresses issue such as (CareerExplorer, 2019):
• land and water contamination;
• waste management policies;
• environmental management systems;
• air assessment;
• environmental impact assessment;
• environmental audit;
• the management of legislative issues for clients;
• the development of conceptual models (identifying and considering potential contaminant
sources);
• on-going communication with clients, inspectors and regulators;
• identifying previous activities and any contamination when assessing accountability.
PORTER’S FIVE FORCES
MARKET ENTRY
Management consulting firms range in size from multi-thousand-member firms with global reach to
single-member local independents: there is no scale effect and even small firms can enter in the
market (Crighton, 2005).
The consulting industry spans horizontally across all other industries and involves general
management consulting skills and knowledge that are transferable from one industry to another. There
are no specialized requirements or certifications to enter the overall market. Consequently, product
differentiation for project management services does not serve as a market barrier, while the lack of
branding, as a form of product differentiation at the firm level, is an obstacle for the market entry.
Except for incidental expenses, the management consulting entrant has no financial capital-related
barrier to enter on a small scale locally. On the other hand, to enter the market on a large scale or to
enter as a global competitor does have a capital requirement barrier. Such entry would require the
acquisition of one or more existing firms, either through mergers or through buy-outs. Since most
firms are not publicly traded, such acquisitions would likely require transfers of significant amounts
of capital to compensate current firm owners appropriately. Alternatively, mergers could be effective
but would require a large amount of time to negotiate the details and to establish the internal processes
and bureaucracy necessary to deliver a consistent standard of practice for clients.
Incumbent firms also have established a network of contacts to the potential clients within each firm's
34
target market. Developing this network requires time and dedicated effort and is a sunk cost for the
incumbent, often due to both understanding a familiar process (the learning curve) and reusing
portions of previous submissions (the experience curve). The new entrant will not have this network
and consequently may face higher costs to secure each engagement.
Successful consulting firms protect their access to the most profitable customers in a variety of way
including developing expert knowledge and tying client processes to their own. With a securely bound
relationship in place, the profitable clients may be unwilling to entertain proposals from new market
entrants, particularly those without a proven track record. The restricted access to the distribution
channels is a significant market entry barrier in the top tier of management consulting, where services
are sold to business executives. At the middle and lower ranges of the market, the introduction of
internet-based bidding mechanisms has partly addressed the lack of a distribution channel. This is
where most of the smaller firms compete.
BUYER BARGAINING POWER
Management consulting firms have historically offered relatively homogeneous product offerings for
project management skills, a trend that continues today. This lack of differentiation has given buyers
a wider audience from which to secure the needed services and this increases the bargaining power
of any buyer.
Secondly, consulting firms carry a high fixed-cost component that requires each firm to keep working,
even if on narrower margins, a fact that is well known by the buyers within the market.
Thirdly, market buyers are producing a product and the consulting services sought will represent a
high percentage of the product's end cost, although it doesn’t usually affect its final quality. This gives
the buyers an incentive to negotiate the price as low as possible for the consulting services.
Countering this increase in buyer bargaining power is the fact that the buyers have a need to acquire
the consulting services as these skills are not well established within the buyers' organizations.
However, two aspects combine to partially diffuse the impact of this need: the buyers have a low
appreciation for the value of the skills they are acquiring, especially for project management services,
and low switching costs allow to source them from another consulting firm.
Lastly, the buyers' bargaining power is also increased by the perception of the possibility that he could
backwards integrate and simply hire the necessary skills into their own organizations.

35
SUBSTITUTES
The main source of substitute services is the use of internal resources instead of external consultants
and the current practice of securing technical skills offshore, with India being the primary location of
choice. According to the Indian National Association of Software and Services Companies
(NASSCOM), the Global Software Product Industry is estimated to be 413 B$ (Preamble,
Technology, & Services, 2019). The offshoring process is part of the greater phenomenon called
Business Process Outsourcing (BPO). With outsourcing becoming a common event, and offshoring
a featured portion of outsourcing, it is reasonable to anticipate that offshore services will continue to
substitute for locally offered project of management consulting services.
SUPPLIER BARGAINING POWER
For management consulting firms, the primary component is human resources and that is commonly
the only aspect of the suppliers' services, given the nature of the industry. The supply varies with the
niche occupied by the consulting firm. For instance, for a consultancy to the bio-tech field the supply
would be very limited and consequently the bargaining power of their suppliers would be high.
Instead, the services offered by the suppliers to the project management niche are not unique, although
there is a sliding scale based on the experience and education of the individual in question. Higher
levels of education and longer, more diverse or unique experience can confer more bargaining power,
given the proper demand conditions.
The advent of resume distribution Internet sites has further diffused the industry and decreased the
bargaining power of suppliers. Therefore, there is no credible threat of the individual suppliers as
they are highly widespread, and their fortunes are tied to the fortunes of the industry.
RIVARLY
In the management consulting industry, there are many competitors with the firms clustering at the
two ends of the size and power spectrum. There are a few large firms offering services that span the
traditional management consulting and computer integration services categories, such as the Big
Four, and many small and single-operator firms. As expected with the range of sizes, the market
competition takes place within two spheres: the large firms compete for large project undertakings
while the small firms bid against each other for the smaller opportunities.
One of the measures of competition has been the four-firm concentration ratio, that corresponds to
the percentage of the market share held by the largest four competitors in the market. Together the Big
Four consultancy firms accounted for around 37.4 percent of the global consultancy market in 2018,
36
with Deloitte’s market share of 10.9 percent making them the largest. Outside the Big Four, the largest
consultancy firm was Accenture with a market share of 5.5 percent (Statista, 2019). Rivalry, however,
is usually considered to be inversely proportional to the concentration ratio and to the rate of growth:
consulting firms posted a median annual growth rate of 9.3 percent in 2017, down from 9.6 percent
in 2016 and 11.5 percent in 2015 (Hinge Marketing, 2018).
Regarding the rivalry between competitors, the industry's offerings are typically undifferentiated, at
least from the buyers' perspective. Some firms have expertise in some lines of business while others
possess skills in business aspects that transcend an industry's classification, but most of the projects
could be handled by different players of the same size: usually the winner of the contract is the one
with lower price, the one with past collaborations with the customer or the one with a better network
of contacts.
Product perishability is another factor affecting the rivalry among competitors. In the consulting
industry, the inventory for a firm is the billable-hour. There are a fixed number of hours in a week
from which to draw billable-hours and once an hour has passed, that portion of the inventory of the
firm has perished, never to be available again. This immutable fact stimulates the competition
between industry incumbents as each must seek to maintain an operating capacity as high as possible,
which the fixed costs are spread over, and, since the primary cost component for the industry is human
resources, they are sunk costs.
Finally, the rivalry is further increased by the low exit barriers due to the penalties that clients usually
set in contracts in order to keep a certain performance measured by the achievement of a minimum
threshold target. Therefore, consulting firms are pushed to reach that target in order to avoid paying
extra-cost and damaging their reputation, the worst scenario in this industry since it could deny the
opportunity of future new contracts.
FUTURE TRENDS
• Merging with Digital Agencies) As the definition of “consulting” continues to evolve, digital
agencies are increasingly offering consulting services, and established consulting firms are
adding digital expertise to their offerings (Insights Success, 2019). The consulting world is
undergoing a shift. Since the last few years, consulting firms have been rapidly launching new
digital consulting divisions. What started off as a fascination with product design and more
engaging web interfaces has become a movement towards digitalization.
• Commodification of knowledge) Today, increasing amounts of Internet-based content is
available to the public. Like best practices, guidelines and case studies, consulting

37
“knowledge” and “expertise” are more commoditized. Even the concept of “micro consulting”
has entered the language of the consulting industry. This concept involves an expert engaging
in short and targeted projects for clients opposed to months-long work by a team of
consultants.
• Freelancers) Like other professions, the freelance model of work continues its influence
within the consulting field. Some freelance consultants work independently while some
consultants join online consulting marketplaces or partner with small or large consulting
firms. A recent independent survey found that most freelancers had no intention of leaving
the independent world in order to transition to full-time work for a consulting firm. The
freelance consultants are in high demand due to such issues as cost pressures by clients.
Freelance experts often can customize their prices and billing, whereas larger consultancies
may not have that flexibility.
• Performance-based billing model) As the repercussions of the 2008 recession still permeate
the thinking of many clients, the pay structures of some consultancies are being affected. Since
many clients now have the technological capability to analyse every expense, they are
analysing spending on consulting and examining the return on their investment. Accordingly,
many clients are requesting customized prices for targeted projects. Additionally,
performance-based billing is also trending among consultants. Such pricing styles can prevent
client concerns regarding unexpected fees, as well as provide a real reliable benchmark for
consultancies to prove their value.
• Individual expert crowd source) Like the freelance trend, the consulting industry is also
exploiting talent from external sources. The crowdsourcing trend is becoming very common
among consultancies. It is difficult to have every required expertise that a client desires, so
firms are often working with specialty companies and experts outside of the consultancy. With
this expanded network of knowledge, a client can gain their desired insights. The consultants
are working with digital agencies or tech start-ups and even independent freelance
professionals in order to gain the know-how that is needed. The relationships among the
different firms are mutually beneficial.
38
ACCENTURE
Accenture plc, stylised as Accenture, is an Irish-domiciled multinational professional services
company that provides services in strategy, consulting, digital, technology and operations (Wikipedia,
2019). It is part of the Fortune Global 500 company and it has been incorporated in Dublin since 1st
September 2009. In 2019, the company reported net revenues of $43.2 billion, with more than
505,000 employees serving clients in more than 200 cities in 56 countries. In 2015, the company had
about 150,000 employees in India, 48,000 in the US, and 50,000 in the Philippines. Accenture's
current clients include 92 of the Fortune Global 100 and more than three-quarters of the Fortune
Global 500.
HISTORY
THE FIRST YEARS
After Arthur Edward Andersen graduated from college in 1908, he became the youngest certified
public accountant in Illinois. He then went on to hold several prominent jobs, including senior
accountant for Price Waterhouse, comptroller for Uihlein, and chairperson of North-western
University's accounting department. However, he eventually desired to strike out on his own. In 1913
he co-founded an accounting firm in Chicago with Clarence Delany, called Andersen, DeLany &
Company. It grew rapidly, due to increased demand for accounting services following the
introduction of the Federal Reserve and federal income tax. While it primarily served utilities
companies, it accrued prominent clients across industries, such as Colgate-Palmolive. The next few
decades saw several milestones. In 1918 Delany left the firm and it was renamed Arthur Andersen &
Company. The firm expanded throughout the 1920s, opening six offices nationwide. It also began
offering financial investigation services, and proudly pushed its role as a watchdog of procedures in
the accounting industry. Andersen also launched several branches internationally.
1970-2000
By the 1970s, the accounting industry was reaching a stage of maturity and slowing down in growth
(Cleverism, 2016). Andersen responded by introducing consulting services, focusing on the areas of
strategy and technology. It flourished, and in the 1980s leadership gave the division more operating
control, despite the disappointment of the accounting party. This would not be the last of the conflict
between the two sides. By 1988, consulting fees were responsible for 40% of firm revenues, making
Andersen the biggest consulting firm in the world. Consulting partners demanded to be paid as much
as accountants. Executives decided it would be best to divide the firm into two entities, auditing/tax
firm Arthur Andersen & Co. and Andersen Consulting, both subsidiaries of Andersen Worldwide.

39
In 1997, following a failed struggle to get one of its employees to replace the retiring CEO, Andersen
Consulting sought complete independence. In 2000 it got its wish through arbitration and went on its
way. It continued to be a dominant player in its industry, while Arthur Andersen & Co. was eventually
shut down due to the Enron accounting scandal.
EMERGENCE OF ACCENTURE
On 1st January 2001, Andersen Consulting adopted its current name, "Accenture". The word
"Accenture" is derived from "Accent on the future". The name "Accenture" was submitted by Kim
Petersen, a Danish employee from the company's Oslo office, as a result of an internal competition.
Andersen felt that the name should represent its will to be a global consulting leader and high
performer and intended that the name should not be offensive in any country in which Accenture
operates.
On 19th July 2001, Accenture's initial public offering (IPO) was priced at $14.50 per share, and the
shares began trading on the New York Stock Exchange (NYSE); Goldman Sachs and Morgan
Stanley served as its lead underwriters. Accenture stock closed the day at $15.17, with the day's high
at $15.25. On the first day of the IPO, Accenture raised nearly $1.7 billion.
Figure 9 – Accenture IPO on the New York Stock Exchange
IRELAND HEADQUARTERS AND RECENT HISTORY
Accenture announced on 26th May 2009 that its board of directors unanimously approved changing
the company's place of incorporation from Bermuda to Ireland and would become Accenture plc.
Accenture was chosen to replace CGI Group as the lead contractor for HealthCare.gov in January
2014. In December 2014, Accenture won a $563 million contract to provide ongoing maintenance,
software development and technology support for HealthCare.gov through 2019. In July 2015, the

40
United States Department of Defence awarded a major Electronic Health Records contract
to Cerner, Leidos and Accenture. The contract valued $4.33 billion will serve 55 hospitals and 600
clinics. Accenture Federal Services and Leidos will play the role of configuration specialist, while
Cerner is the prime contractor.
On 29th August 2017, Apple Inc. announced a partnership with Accenture to create iOS business
software. In January 2019, CEO Pierre Nanterme stepped down from his position, citing health
reasons. Twenty days after stepping down, Nanterme died in France at the age of 59 after being
diagnosed with colon cancer. Chief Financial Officer David Rowland was named as the interim CEO.
In July 2019, Julie Sweet, previously CEO of Accenture North America, was named the new chief
executive officer of the firm, effective September 2019. She replaced the interim CEO, David
Rowland. On 7th January 2020, news sources reported that Accenture had agreed to acquire
Symantec's 300-person cybersecurity services division from Broadcom.
INTERNAL ORGANIZATION
BUSINESS UNITS
Accenture is split in five business units (Accenture Strategy, Accenture Consulting, Accenture
Digital, Accenture Technology and Accenture Operations) which develop and deliver integrated
services and solutions for its clients (Jones, 2019).
• Accenture Strategy combines deep industry expertise, advanced analytics capabilities and
design methodologies to help leaders in the C-suite envision and execute strategies that drive
growth and digital transformation. It provides a range of strategy services to enable
competitiveness and innovation, including new business and operating models, mergers and
acquisitions, talent and organization, technology strategies, sustainability, security, advanced
customer services, supply chain strategies and enterprise-wide strategies to realign resources
for growth.
• Accenture Consulting provides to industry experts the insights, management and technology
consulting capabilities to help transform the world’s leading companies. Its consulting
capabilities, including advanced analytics and design expertise, enable its clients to design
and implement transformational change programs, either for one or more functions or business
units, or across their entire organization. It provides industry-specific consulting services, as
well as functional and technology consulting services.
• Accenture Digital brings together Accenture’s global digital capabilities to help clients unlock
value and transform their businesses. It includes Accenture Interactive, which helps clients

41
deliver seamless multi-channel customer experiences and enhance their marketing
performance, Accenture Applied Intelligence, which combines its capabilities in advanced
analytics and artificial intelligence, and Accenture Industry X.0, which is focused on the
digital reinvention of industries with smart, connected products and services.
• Accenture Technology comprises two primary areas: Technology Services and Technology
Innovation & Ecosystem. Technology Services includes application services, such as systems
integration and application outsourcing, intelligent platforms and services, cloud and
infrastructure services and global delivery through its Advanced Technology Centres.
Technology Innovation & Ecosystem includes the R&D activities in Accenture Labs and the
management of its alliance relationships across a broad range of technology providers.
• Accenture Operations provides business process services for specific functions, including
finance and accounting, procurement and supply chain, marketing and sales, as well as
industry-specific services, such as platform trust and safety, health and utility services. It
operates business processes on behalf of clients, through a combination of its talent powered
by data, artificial intelligence, analytics and digital technologies to help improve their
productivity, customer experience and performance.
Accenture’s geographical coverage can be grouped in three clusters: North America, Europe and
Accenture’s “Growth Markets” (i.e. India, China, Middle East, Africa, Asia Pacific and Latin
America).
Figure 10 – Accenture’s global presence

42
The figure above shows Accenture’s offices around the world. Orange circles represents normal
branches, yellow ones are offices with innovation centres and, lastly, the green ones represent
Accenture’s Training Corporate Schools.
BUSINESS SEGMENTS
The company operates in five reportable business segments (Cleverism, 2016):
• Communications, Media, & Technology helps clients accelerate and deliver digital
transformation, enhance business results through industry-specific solutions, and seize
opportunities made possible by the convergence of communications, content, and computing.
It focuses on the communications, high tech, electronics, media, and entertainment industries.
• Financial Services works with clients to address cost/growth/profitability pressures,
regulatory changes, industry consolidation, and the need to adapt to new, digital technologies.
It focuses on the banking, insurance, and capital markets industries.
• Health & Public Service helps clients deliver better social, economic, and health outcomes to
the people they serve. It focuses on the health and public service (government, non-profits,
etc.) industries.
• Products helps clients transform their organizations and increase their relevance in the digital
world. It focuses on the consumer goods, retail, travel, industrial and life sciences industries.
• Resources works with clients to develop and execute innovative strategies, manage complex
change initiatives, improve operations, and integrate digital technologies designed to help
them differentiate themselves in the marketplace. It focuses on the energy, chemicals, forest
products, utilities, metals and mining and related industries.
Table 4 – Accenture’s revenues split by operating group
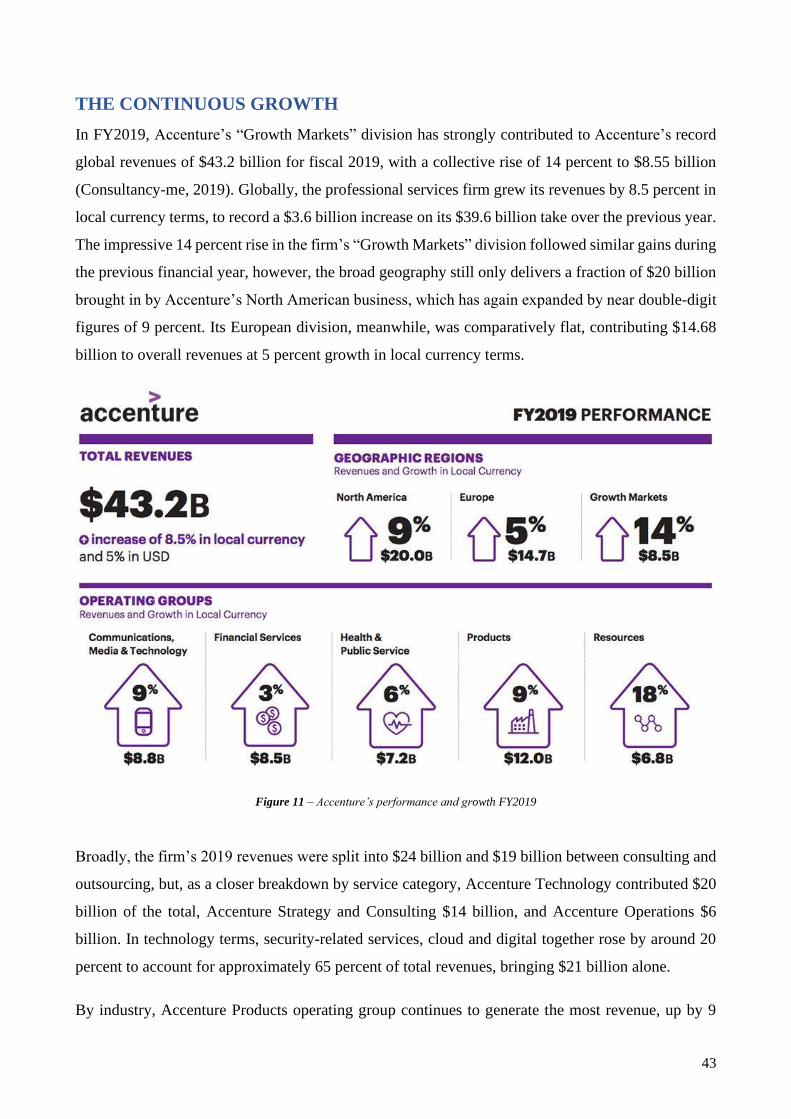
43
THE CONTINUOUS GROWTH
In FY2019, Accenture’s “Growth Markets” division has strongly contributed to Accenture’s record
global revenues of $43.2 billion for fiscal 2019, with a collective rise of 14 percent to $8.55 billion
(Consultancy-me, 2019). Globally, the professional services firm grew its revenues by 8.5 percent in
local currency terms, to record a $3.6 billion increase on its $39.6 billion take over the previous year.
The impressive 14 percent rise in the firm’s “Growth Markets” division followed similar gains during
the previous financial year, however, the broad geography still only delivers a fraction of $20 billion
brought in by Accenture’s North American business, which has again expanded by near double-digit
figures of 9 percent. Its European division, meanwhile, was comparatively flat, contributing $14.68
billion to overall revenues at 5 percent growth in local currency terms.
Figure 11 – Accenture’s performance and growth FY2019
Broadly, the firm’s 2019 revenues were split into $24 billion and $19 billion between consulting and
outsourcing, but, as a closer breakdown by service category, Accenture Technology contributed $20
billion of the total, Accenture Strategy and Consulting $14 billion, and Accenture Operations $6
billion. In technology terms, security-related services, cloud and digital together rose by around 20
percent to account for approximately 65 percent of total revenues, bringing $21 billion alone.
By industry, Accenture Products operating group continues to generate the most revenue, up by 9
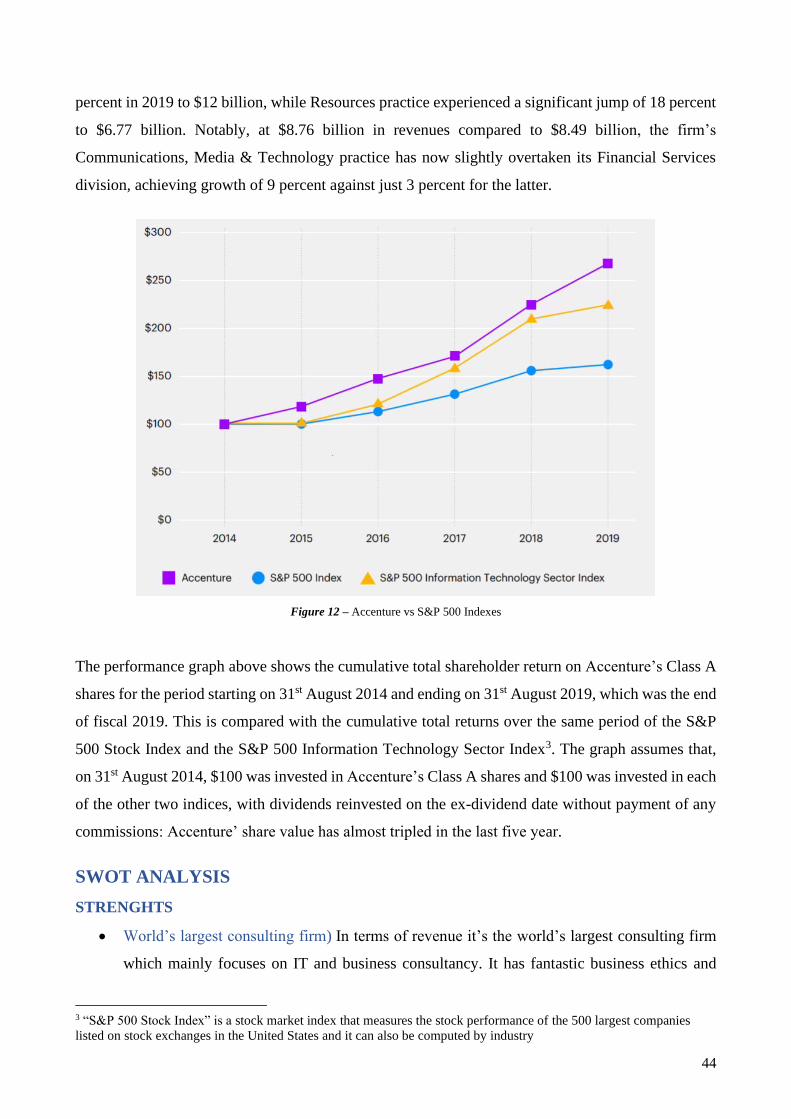
44
percent in 2019 to $12 billion, while Resources practice experienced a significant jump of 18 percent
to $6.77 billion. Notably, at $8.76 billion in revenues compared to $8.49 billion, the firm’s
Communications, Media & Technology practice has now slightly overtaken its Financial Services
division, achieving growth of 9 percent against just 3 percent for the latter.
Figure 12 – Accenture vs S&P 500 Indexes
The performance graph above shows the cumulative total shareholder return on Accenture’s Class A
shares for the period starting on 31st August 2014 and ending on 31st August 2019, which was the end
of fiscal 2019. This is compared with the cumulative total returns over the same period of the S&P
500 Stock Index and the S&P 500 Information Technology Sector Index3. The graph assumes that,
on 31st August 2014, $100 was invested in Accenture’s Class A shares and $100 was invested in each
of the other two indices, with dividends reinvested on the ex-dividend date without payment of any
commissions: Accenture’ share value has almost tripled in the last five year.
SWOT ANALYSIS
STRENGHTS
• World’s largest consulting firm) In terms of revenue it’s the world’s largest consulting firm
which mainly focuses on IT and business consultancy. It has fantastic business ethics and
3 “S&P 500 Stock Index” is a stock market index that measures the stock performance of the 500 largest companies
listed on stock exchanges in the United States and it can also be computed by industry
45
uncompromising standards for high performance (Marketing91, 2020).
• Strong Clientele) It has a large client base with some top-level companies having Accenture
as their consultants. Nearly 90 out of the fortune top 100 companies and more than three
quarters of fortune global 500 companies have Accenture as a consulting firm.
• Service Delivery Network) Accenture have global service delivery network with presence in
more than 200 cities, 56 countries and employing 505,000 passionate employees continuously
working to give optimum service delivery to end customers.
• Client Driven processes) Strong business relations and client driven approach by Accenture
helps in creating industry based and sustainable value for their consulting partners.
• Continuous improvement) Like Kaizen of Toyota, Accenture is always looking towards
improving its capabilities, hiring better and more talented manpower, thereby matching their
talent to the end customers.
• Diverse capabilities) With its five operating groups namely Communications, Media &
Technology, Financial Services, Health & Public Services, Products and Resources, it has
created diverse capabilities within its team. Dedicated and trained manpower is what
differentiates Accenture from the rest.
• Expertise) With its client base stretching out from health care to automobile to IT services,
Accenture has a lot of experience and the talent behind it to get things done. Hence, Accenture
has become the “specialist” or “expert” across different industries.
WEAKNESSES
• Lack of coordination) Accenture has 5 business units collaboratively working with the clients
and with each other. This leads to conflicts due to lack of internal coordination.
• Dependency on its consulting business) Although its business is in management consulting,
technology & BPO, the consulting part forms the major source of revenue for Accenture. This
can be dangerous for the company in the long run because running such a large operation
requires that the firm be ready for bad financial days
OPPORTUNITIES
• Expansion of business) By targeting small and mid-sized projects and expanding to other
developing economies, Accenture can increase its revenue even more.
• Acquisitions) Accenture recently acquired Gaspo, an analytics solution provider based out of
Brazil. It also acquired Agilex technologies, which is a digital and IT services provider for
U.S Govt. agencies. Such acquisitions can increase the analytic strength of Accenture, thereby
helping it in expansion.

46
• Focusing on other businesses) More focus on technology and BPO, and making the revenue
equivalent to consulting, can help the firm to penetrate the market even better. Also,
this diversification will provide a protection against harsh financial times.
THREATS
• Competition) Tough competition from IT giants like IBM, Capgemeni, Infosys is the area of
concern for the company.
• Bad financial times) The recession period was tough for the company because of over
dependability on premium clients. The large clients were the first ones which got affected
badly by the financial downturn. Hence, the revenue drive to Accenture dropped badly.
• Automation) Most of the jobs being outsourced to Accenture are the repetitive tasks which
might be affected by this trend.
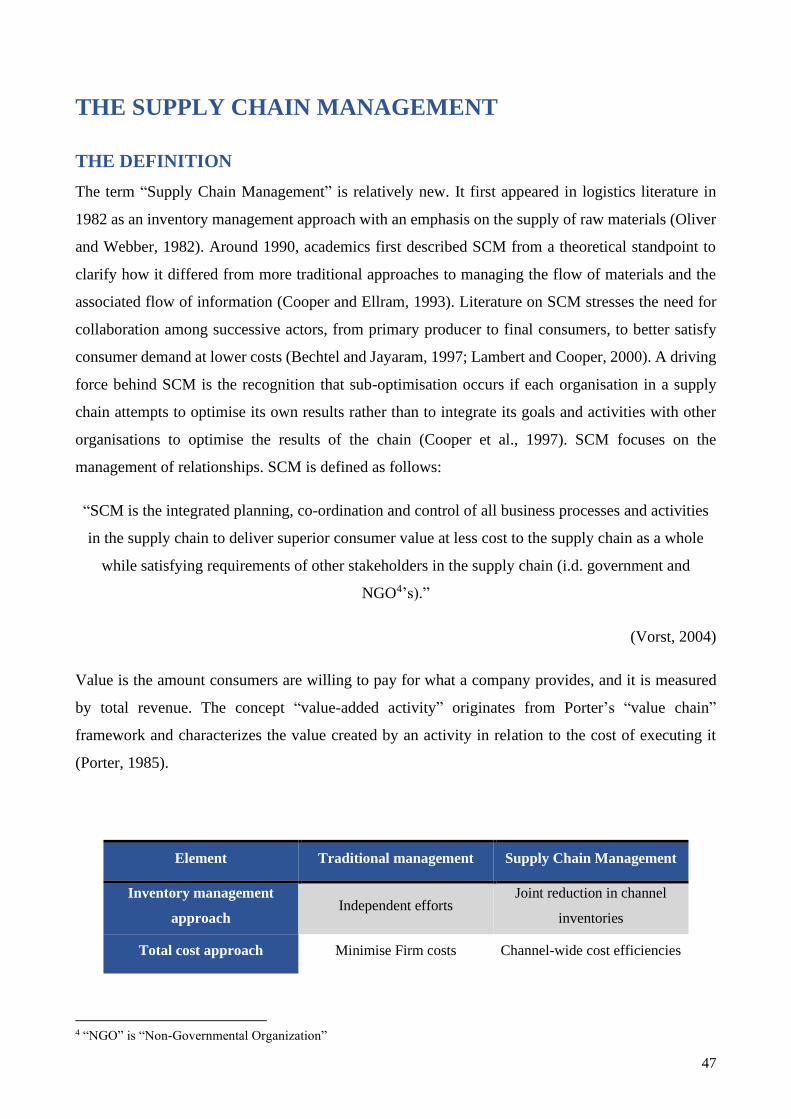
47
THE SUPPLY CHAIN MANAGEMENT
THE DEFINITION
The term “Supply Chain Management” is relatively new. It first appeared in logistics literature in
1982 as an inventory management approach with an emphasis on the supply of raw materials (Oliver
and Webber, 1982). Around 1990, academics first described SCM from a theoretical standpoint to
clarify how it differed from more traditional approaches to managing the flow of materials and the
associated flow of information (Cooper and Ellram, 1993). Literature on SCM stresses the need for
collaboration among successive actors, from primary producer to final consumers, to better satisfy
consumer demand at lower costs (Bechtel and Jayaram, 1997; Lambert and Cooper, 2000). A driving
force behind SCM is the recognition that sub-optimisation occurs if each organisation in a supply
chain attempts to optimise its own results rather than to integrate its goals and activities with other
organisations to optimise the results of the chain (Cooper et al., 1997). SCM focuses on the
management of relationships. SCM is defined as follows:
“SCM is the integrated planning, co-ordination and control of all business processes and activities
in the supply chain to deliver superior consumer value at less cost to the supply chain as a whole
while satisfying requirements of other stakeholders in the supply chain (i.d. government and
NGO4’s).”
(Vorst, 2004)
Value is the amount consumers are willing to pay for what a company provides, and it is measured
by total revenue. The concept “value-added activity” originates from Porter’s “value chain”
framework and characterizes the value created by an activity in relation to the cost of executing it
(Porter, 1985).
Element Traditional management Supply Chain Management
Inventory management
approach Independent efforts
Joint reduction in channel
inventories
Total cost approach Minimise Firm costs Channel-wide cost efficiencies
4 “NGO” is “Non-Governmental Organization”
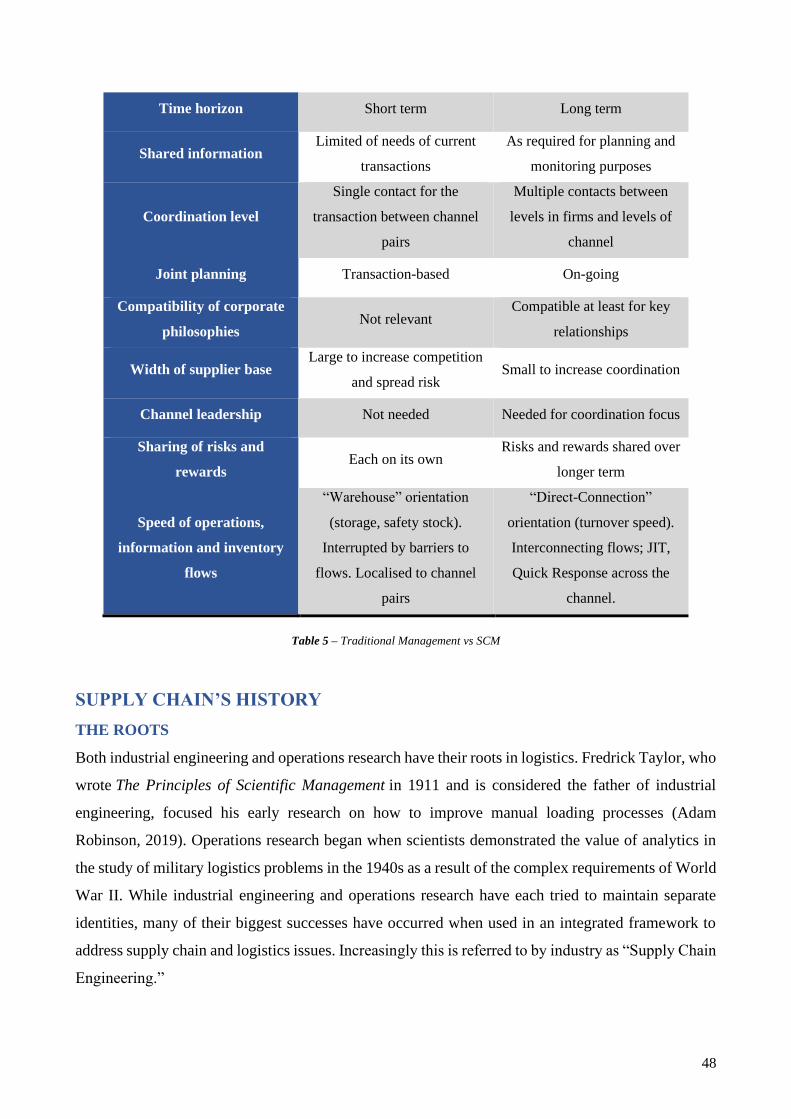
48
Time horizon Short term Long term
Shared information Limited of needs of current
transactions
As required for planning and
monitoring purposes
Coordination level
Single contact for the
transaction between channel
pairs
Multiple contacts between
levels in firms and levels of
channel
Joint planning Transaction-based On-going
Compatibility of corporate
philosophies Not relevant
Compatible at least for key
relationships
Width of supplier base Large to increase competition
and spread risk Small to increase coordination
Channel leadership Not needed Needed for coordination focus
Sharing of risks and
rewards Each on its own
Risks and rewards shared over
longer term
Speed of operations,
information and inventory
flows
“Warehouse” orientation
(storage, safety stock).
Interrupted by barriers to
flows. Localised to channel
pairs
“Direct-Connection”
orientation (turnover speed).
Interconnecting flows; JIT,
Quick Response across the
channel.
Table 5 – Traditional Management vs SCM
SUPPLY CHAIN’S HISTORY
THE ROOTS
Both industrial engineering and operations research have their roots in logistics. Fredrick Taylor, who
wrote The Principles of Scientific Management in 1911 and is considered the father of industrial
engineering, focused his early research on how to improve manual loading processes (Adam
Robinson, 2019). Operations research began when scientists demonstrated the value of analytics in
the study of military logistics problems in the 1940s as a result of the complex requirements of World
War II. While industrial engineering and operations research have each tried to maintain separate
identities, many of their biggest successes have occurred when used in an integrated framework to
address supply chain and logistics issues. Increasingly this is referred to by industry as “Supply Chain
Engineering.”

49
THE EARLY YEARS
In the 1940s and 1950s, the focus of logistics research was on how to use mechanization
(i.d., pallets and pallet lifts) to improve the very labour-intensive processes of material handling and
how to take better advantage of space using racking and better warehouse design and layout. The
“unit load” concept gained popularity and the use of pallets became widespread. In the mid-1950s,
this concept was extended to transportation management with the development of intermodal
containers together with ships, trains, and trucks to handle these containers. This was a prerequisite
for the supply chain globalization that was to come much later. Although the terms “warehousing”
and “materials handling” were used to describe many of these efforts, this work could be viewed as
fundamental applications of industrial engineering rather than as a discipline of it.
By the 1960s, a clear trend had developed in shifting more time-dependent freight transportation to
truck rather than rail. This led to the need for joint consideration of warehousing, material handling,
and freight transportation, which emerged under the label of “physical distribution.” The National
Council of Physical Distribution Management was formed in 1963 to focus industry attention on this
area and quickly became the predominant organization in the field. Academic research and education
followed this trend to satisfy the growing industry recognition of the needs in this area. This area
gained much wider recognition in both industry and academia due in large part to the fundamental
paradigm change that occurred during the 1960s and 1970s regarding computers. Prior to the 1960s,
virtually all transactions and record keeping were done manually. The computerization of this data
opened the door to a huge opportunity for innovations in logistics planning, from randomized storage
in warehouses to optimization of inventory and truck routing. The technologies, particularly those
from operations research, that researchers had to this point only been able to examine in theoretical
models had now become much closer to reality. However, there were still many difficult research
issues to resolve in the transition from theory to practice. In the late 1970s and early 1980s, this led
to the creation at Georgia Tech5 of the Production and Distribution Research Centre, the Material
Handling Research Centre, and the Computational Optimization Centre. Each of these centres was
focused on a different aspect of what this new computer technology made possible.
LOGISTICS COMES OF AGE
The 1980s marked the beginning of a sea-change in logistics in the history of supply chain
management. The emergence of personal computers in the early 1980s provided tremendously better
computer access to planners and a new graphical environment for planning. This spawned a flood of
new technology including flexible spreadsheets and map-based interfaces which enabled huge
5 “Georgia Tech” is a technology-focused college in Atlanta and one of the top research universities in the USA
50
improvements in logistics planning and execution technology. The Production and Distribution
Research Centre was the early innovation leader in combining map interfaces with optimization
models for supply chain design and distribution planning. The Material Handling Research Centre
provided leadership in developing new control technology for material handling automation. The
Computational Optimization Centre developed new large-scale optimization algorithms that enabled
solution of previously intractable airline scheduling problems. Much of the methodology developed
in these centres rapidly began to find its way into commercial technology.
Perhaps the most important trend for logistics in the 1980s was that it had begun to get tremendous
recognition in industry as being very expensive, very important, and very complex. Company
executives became aware of logistics as an area where they had the opportunity to significantly
improve the bottom line if they were willing to invest in trained professionals and new technology.
In 1985, the National Council of Physical Distribution Management changed its name to the Council
of Logistics Management (CLM). The reason given for the name change by the new CLM was “to
reflect the evolving discipline that included the integration of inbound, outbound and reverse flows
of products, services, and related information.” Prior to this, logistics was a term that had been used
almost exclusively to describe the support of military movements.
THE TECHNOLOGY REVOLUTION
The logistics boom was fuelled further in the 1990s by the emergence of Enterprise Resource
Planning (ERP) systems. These systems were motivated in part by the successes achieved by Material
Requirements Planning systems developed in the 1970s and 1980s, in part by the desire to integrate
the multiple databases that existed in almost all companies and seldom talked to each other, and in
part by concerns that existing systems might have catastrophic failures as a result of not being able
to handle the year 2000 date. Despite some significant problems in getting the ERP systems installed
and working, by 2000 most large companies had installed ERP systems. The result of this change to
ERP systems was a tremendous improvement in data availability and accuracy. The new ERP
software also dramatically increased recognition of the need for better planning and integration
among logistics components. The result was a new generation of “Advanced Planning and Scheduling
(APS)” software.
GLOBALIZATION AND SUPPLY CHAINS
The widespread recognition of the term “supply chain” has come primarily as a result of the
globalization of manufacturing since the mid-1990s, particularly the growth of manufacturing in
China. U.S. imports from China grew from about $45 billion per year in 1995 to more than $280
billion per year in 2006. The focus on globalization highlighted the need for logistics strategies to

51
deal with complex networks including multiple entities spanning multiple countries with diverse
control. There has been an increasing trend to use the term supply chain management to refer to
strategic issues and logistics to refer to tactical and operational issues. This growing association of
supply chain management with strategy is reflected in the Council of Logistics Management’s
changing its name to the Council of Supply Chain Management Professionals in 2005. They make
the distinction that “Logistics is that part of the supply chain process that plans, implements, and
controls the efficient, effective forward and reverse flow and storage of goods, services, and related
information between the point of origin and the point of consumption in order to meet customers’
requirements” while “Supply Chain Management is the systemic, strategic coordination of the
traditional business functions and the tactics across these business functions within a particular
company and across businesses within the supply chain for the purposes of improving the long-term
performance of the individual companies and the supply chain as a whole.”
TODAY’S SUPPLY CHAIN
Several factors are influencing the way in which the contemporary supply chains is supposed to be.
In this context, it is important to recognise that all companies and all supply chains have their own
unique characteristics in terms of products, markets, customers, people and culture. Each organisation
will, therefore, have its own strategic rules and supply chain drivers. Developing an exhaustive list
of generic drivers is impossible and would, in any event, be unlikely to add much real value. However,
the following are amongst the most critical ones for many organisations across a range of sectors
(Sweeney, Edward, & Fcilt, 2013).
• Internationalisation) Structural changes in the global economy have resulted in many of the
barriers, that traditionally existed to the movement of products, services, people, capital and
information across international borders, being reduced or eliminated. Consequently, global
procurement of products and services and access to new international markets have become
the reality for many firms. In this context, supply chains have become much more
international (or even global) in complexion.
• Vertical Disintegration) Recent years have seen a strong focus on the identification and
development of core competencies as firms attempt to identify appropriate strategic responses
to 21st century challenges. The corollary of this is that many supply chain activities that are
supposed to be “non-core” have been outsourced. This process of vertical disintegration has
resulted in the development of supply chain architectures that are much more “virtual” than
in the past. In this context, the old logic of Henry Ford that “you must own it to control it” has
been replaced by a strong focus on the management of relationships with key suppliers of

52
products and services. It has also resulted in third-party logistics providers (3PLs) playing a
more strategically important role (often that of a designer and/or orchestrator) in many supply
chains.
• Complexity) Products and service offerings have become more complex with the aim to
mirror the rapid rate of technological development that has been a feature of recent years. The
shortening of product lifecycles that has been a feature in many sectors is related to this. This
is compounded by the increasing complexity of the international markets and the business
environments in which companies operate. Technological developments have also resulted in
the development of quite sophisticated and relatively complex supply chain planning and
execution systems.
• Customers) Customers have become more perceptive and markets have become more
sophisticated as a result. They are demanding more and more in terms of product quality and
service levels at ever more competitive prices. In short, customers are demanding better value
for money: a trend that has been accentuated by the recent economic downturn.
• Competition) Finally, the 21st century is characterised by intense competition between rival
firms in most sectors. The term “hyper-competition” has been used to describe this scenario.
This has perhaps been the main biggest driver of innovation in all aspects of business in recent
years. Nowhere is this need for innovation more evident than in the design, planning and
execution of supply chains.
FUTURE SUPPLY CHAIN
From the first assembly lines to today’s advanced robotic solutions, the supply chain process is
constantly evolving. The latest trends in supply chain and logistics focus on smart, tech-driven
management to reduce operating expenses and increase efficiency (A&A, 2019).
• Supply chain digitalization) Digitization is the process of using the latest tech solutions
together with other physical and digital assets to redesign logistics practices. This way, they
can adjust better to the fast-paced, highly competitive, omni-channel business environment.
Digitization improves the speed, dynamics and resiliency of the supply chain operations,
leading to greater customer responsiveness and ultimately higher revenue. By embracing
digitalization, companies can experience real value, increased revenue and market valuation.
In order to reap the full benefits of digitalization, companies must fundamentally redesign
their supply chain strategy. It’s not enough to just decorate it with digital technology. In the
field of digitization, the Internet of Things (IoT) holds a prominent place as a highly
transformative technological solution in the logistics sphere. IoT refers to a system of

53
interrelated computing devices allowing transfer of data over networks without human input.
It helps companies monitor inventory, manage warehouse stock, optimize fleet routes, and
reduce dead mileage.
• Artificial intelligence) Advanced AI solutions have numerous applications in the supply
chain, especially the warehousing segment. This includes use of gesture recognition solutions
instead of keyboards in the procurement process. It also includes autonomous vehicles (self-
driving cars), designed to navigate without human input. The concept of robotics and
automation is also widely implemented in the supply chain. The latest generations of robots
are easier to program, more flexible and affordable. Their role is to assist workers with
repetitive and physically challenging tasks.
• Strong collaboration) Solid procurement practices and stronger relationships with suppliers
should be considered a priority in the supply chain process. For instance, the procurement
department can utilize the business data on suppliers to enhance supply chain decisions, such
as supplier evaluation and recommendations of the best business partners. Also, effective
cooperation can help assess risks in the supply chain based on global industrial and political
trends to prevent or mitigate danger of stock shortages. Meanwhile, collaboration in the supply
chain can streamline internal processes and reduce overutilization of resources spent on
administrative and other time-consuming tasks. Furthermore, it can help generate referrals
from satisfied business partners and bring new customers.
• Risk management and resiliency) There’s no doubt that companies must seriously
consider supply chain risk management as a way to prepare for undesirable events. The
increasing outsourcing practices, offshoring, product versatility, supply chain security and
substantial interdependence along the supply chain further accentuate the importance of
dealing with risks in the supply chain. Still, no matter how comprehensive the plan is, it can’t
prevent things from happening. This is where supply chain resiliency comes into the picture.
It’s a real measure of the ability of a company to withstand disruptive events. Steps to make
the supply chain more flexible and resilient include visibility throughout the supply chain so
disruptions can be detected on time, close cooperation with suppliers and distributors so
alternative supply routes can be found, and a good incident response plan to provide a course
of action when disruption occurs.
• Global knowledge work) Nearly half of the work in the modern supply chain is knowledge
work. This type of work includes complex analytics, planning and procurement processing.
As businesses go global, the knowledge work in the supply chain should go global as well.
This will allow companies headquartered in one country to perform logistics operations, have
54
procurement centres or do analytics in different parts of the world.
• Circular supply chain) The term “linear supply chain” refers to the conventional concept
where goods flow linearly (from raw material to finished product). Modern logistics practices
focus on the circular supply chain concept, involving the use of previously used products as
raw materials. The reuse of products and materials is known as reverse logistics, and it is a
novel, innovative approach. It helps companies reduce administrative and transportation costs,
achieve higher sustainability, better customer service and loyalty, create value and conserve
resources. Used products can be kept in circulation through good cooperation between
companies and their suppliers and customers.
• Wearable devices) Wearable technology refers to devices designed to be worn by people.
Combined with cloud technology, wearable devices help employees’ access and input data in
real time. Through proper data collection and analysis, wearable technology allows companies
to maintain control of their inventories. They can also stay up to date with product demand.
Warehouse managers can use wearables for fast, accurate collection of inventory data,
keeping track of manufactured, stored and distributed products. Wearables can also monitor
vital signs so health problems (exhaustion, heart attacks) among the warehouse workers can
be prevented.
• SaaS) Use of the software-as-a-service model in supply chain technologies and logistics
management is gaining popularity, hand in hand with the rise of cloud computing. This is
mostly due to the safety and security of SaaS and the convenience of being able to use only
the services you need on pay-per-use basis. SaaS allows companies to avoid high fixed costs
of continuous system maintenance, upgrades and infrastructure-related costs.
• Visibility) Proper analysis of supply chain data can significantly improve business forecasting
and decision making. It can also optimize the use of resources involved in inventory
management, storage and transport. Supply chain visibility gives insight into what’s
happening at each point of the supply chain. It’s extremely important for the efficiency of the
entire supply chain process, including procurement, manufacturing, transport and delivery.
One of the benefits of improved chain visibility is real-time inventory management. It
involves use of mobile point-of-sale systems and sensors and takes inventory management to
a whole new level. For instance, instead of paying for purchased goods in a store, people can
just take the desired items, and get charged for the goods on their cards automatically.
Furthermore, real-time inventory management allows the goods to be replaced as they are
consumed.
• Customer segmentation) To address customer needs in the best possible way, companies

55
should segment them into groups. These groups can be based on what triggers
customer purchasing decisions, as opposed to a broad generalization. By implementing a more
direct-to-consumer business model and adapting their supply chain strategy to each customer
and product, companies can significantly increase their revenue.
56
THE VISIBILITY
THE CONTEXT
Market globalisation, intensified competition and stronger emphasis on customer satisfaction are
generally considered to be the main reasons for the growing interest in Supply Chain Management
(SCM) by both academics and practitioners (i.d. Gunasekaran et al., 2001; Webster, 2002). In this
competitive environment, the profitability of the focal company (that firm identified by consumers as
being “responsible” for the specific product or service and the coordination of material and
information flows) depends strongly on its ability to manage complex relationships with its business
partners (Caridi et al., 2010a). Visibility has therefore become a key issue in SCM research (Yuet et
al., 2001), because it affects the performance of the whole supply chain (SC) (Choi et al., 2010).
Moreover, visibility can be considered an enabler for strong SC relationships: indeed, Spekman et al.
(1998) identified three possible intensity levels for interactions in a SC relationship, shifting from
cooperation (visibility on essential information and long-term contracts) to coordination
(implementation of visibility mechanisms such as EDI6 and JIT) and full collaboration (which also
includes a high level of trust and a common vision of the future).
Despite significant interest in the matter, having access to accurate and timely information is a
challenging issue in global SCs. In this regard, a key role is played by new Information and
Communication Technologies (Moinzadeh, 2002; Nudurupati and Bititci, 2007). The adoption of
several technologies, i.d. Radio Frequency Identification (i.d. Balocco et al., 2011; Ramudhin et al.,
2008), Enterprise Resource Planning (i.d. Green et al., 2007) and Electronic Data Interchange (i.d.
Choe, 2008; Perego and Salgaro, 2010; Balocco et al., 2010) could increase the level of visibility
along the chain, leading to a strong interest in these solutions in recent years.
However, since companies must devote a lot of energy and resources to the introduction of ICTs,
managers need to fully understand the benefits for the company in order to be confident that the
investment will be valuable. Several empirical studies have been conducted since the 1950s (Ackoff,
1958), and a large number of tools and techniques have been proposed to help companies assess the
value of ICT investments (i.d. Anandarajan and Wen, 1999; Bassioni et al., 2005; Brun et al., 2006;
Dehlin and Olofsson, 2008). According to Brun et al. (2004), ICT value assessment can be defined
as a methodology for evaluating the impacts (i.e. costs, benefits) of a certain ICT solution, thus
assisting managers to select the technology that best suits their specific situation.
6 “EDI” means “Electronic Data Interchange”

57
THE DEFINITION
SC visibility relates to the ability of the focal company (i.e. the supply chain leader) to access or share
information related to the SC strategy and the operations of SC partners (Caridi, Moretto, Perego, &
Tumino, 2014). SC visibility is a commonly used expression in the SCM and logistics community
(Francis, 2008), but its meaning is still somewhat ambiguous, and several definitions have been
proposed.
All the definitions in the literature relate SC visibility to information sharing, but the concept of SC
visibility goes beyond simple access to certain information flows related to SC processes. Several
definitions refer to the properties of the shared information. Many authors view SC visibility as
strongly related to the usefulness of the exchanged information, which should be relevant and
meaningful (i.d. Kaipia and Hartiala, 2006; McCrea, 2005; Schoenthaler, 2003; Tohamy, 2003). For
illustrative purposes, Kaipia and Hartiala define SC visibility as “the sharing of all relevant
information between SC partners, even over-echelons in the chain”. Other studies have suggested
looking at other properties of the exchanged information, i.d. accuracy, trustworthiness, timeliness,
and usability (i.d. Closs et al., 1997; Mohr and Sohi, 1995).
Another critical issue is the identification of the SC processes that are the most affected by visibility,
in order to better define which information flows should be shared. Lancioni et al.(2000) and Maltz
(2000) believe visibility can positively affect manufacturing, transaction activities, planning,
supplying, and evaluation. Other authors (Kulp et al., 2004; Wang and Wei,2007) focus more on
forecasting, planning, scheduling and execution. Barratt and Barratt (2011) analyse the role played
by internal and external information-sharing in improving operations. Rojas and Frein (2008) focus
on coordination under demand uncertainty. Zhang et al. (2011) analyse the impact of SC visibility on
inventory management, whereas Marchet et al. (2012) explore its effects on transportation.
THE BENEFITS OF VISIBILITY
Today, supply chain visibility is an essential instrument for the accomplishment of a company.
However, deficiency of synchronization within the performance of the different tasks often occurs
when the individuals within an organization did not completely understand and comprehend all
activities, operations, production process, and work in process one level below or above their position
within the supply chain network (Diez, 2000; Holcomb et al, 2011). Nevertheless, it is feasible, from
the enhancement of transparency and visibility throughout the whole phase of the supply chain, to
produce opportunities and possibilities for individual’s motivation within several departments to
share ideas and collaborate (Cao et al., 2011). Furthermore, there are several types of technology and
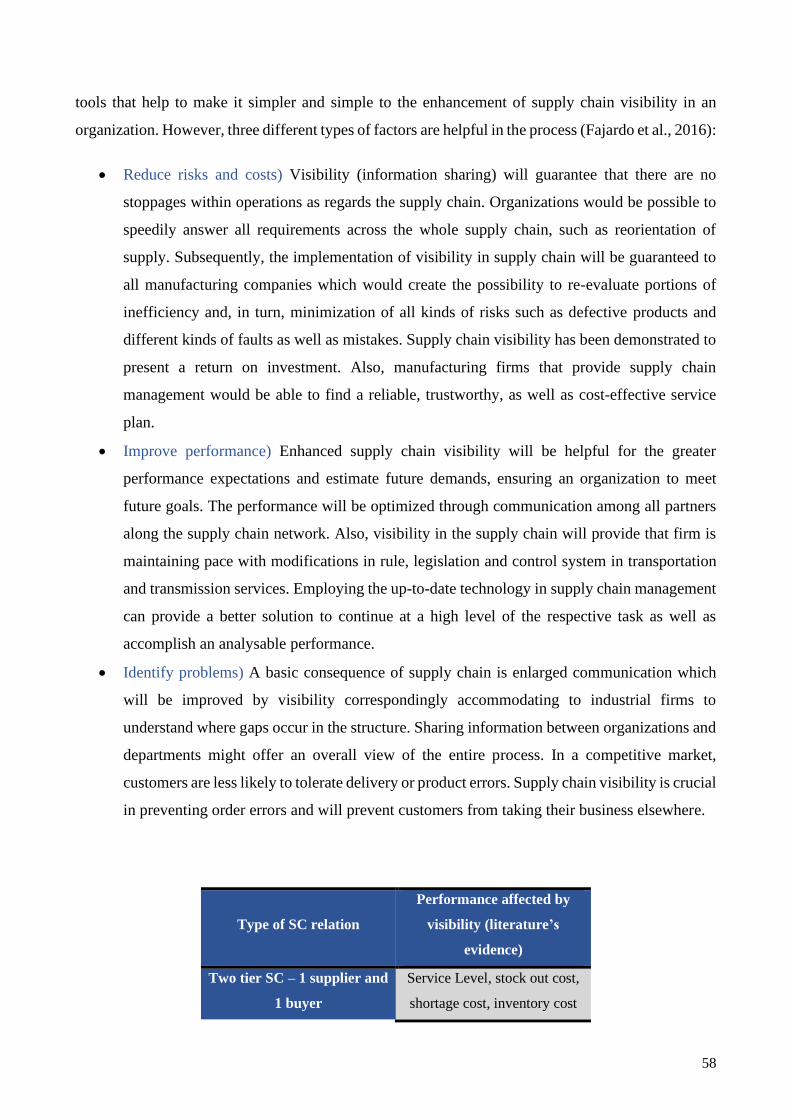
58
tools that help to make it simpler and simple to the enhancement of supply chain visibility in an
organization. However, three different types of factors are helpful in the process (Fajardo et al., 2016):
• Reduce risks and costs) Visibility (information sharing) will guarantee that there are no
stoppages within operations as regards the supply chain. Organizations would be possible to
speedily answer all requirements across the whole supply chain, such as reorientation of
supply. Subsequently, the implementation of visibility in supply chain will be guaranteed to
all manufacturing companies which would create the possibility to re-evaluate portions of
inefficiency and, in turn, minimization of all kinds of risks such as defective products and
different kinds of faults as well as mistakes. Supply chain visibility has been demonstrated to
present a return on investment. Also, manufacturing firms that provide supply chain
management would be able to find a reliable, trustworthy, as well as cost-effective service
plan.
• Improve performance) Enhanced supply chain visibility will be helpful for the greater
performance expectations and estimate future demands, ensuring an organization to meet
future goals. The performance will be optimized through communication among all partners
along the supply chain network. Also, visibility in the supply chain will provide that firm is
maintaining pace with modifications in rule, legislation and control system in transportation
and transmission services. Employing the up-to-date technology in supply chain management
can provide a better solution to continue at a high level of the respective task as well as
accomplish an analysable performance.
• Identify problems) A basic consequence of supply chain is enlarged communication which
will be improved by visibility correspondingly accommodating to industrial firms to
understand where gaps occur in the structure. Sharing information between organizations and
departments might offer an overall view of the entire process. In a competitive market,
customers are less likely to tolerate delivery or product errors. Supply chain visibility is crucial
in preventing order errors and will prevent customers from taking their business elsewhere.
Type of SC relation
Performance affected by
visibility (literature’s
evidence)
Two tier SC – 1 supplier and
1 buyer
Service Level, stock out cost,
shortage cost, inventory cost

59
Two tier SC – multiple
supplier and multiple buyers
Quality (supplier’s and
internal), total cost, service
level (product availability, on
time delivery), inventory cost,
back-order penalty cost,
flexibility, responsiveness,
Multiple tier SC Inventory cost, product
availability, quality (external)
Table 6 – Performance affected by visibility
DYNAMIC CAPABILITIES
The dynamic capabilities view focuses on exploiting internal and external firm-specific competencies
and developing new ones to address changing environments (Wei & Wang, 2007). Renewing
competencies and reconfiguring organizational resources are two key aspects to achieve new forms
of competitive advantage. Dynamic capabilities are the unique processes to integrate, reconfigure,
gain and release resources (Teece et al., 1997; Eisenhardt et al., 2000). Many specific routines or
processes are identified as dynamic capabilities, i.d. product development routines, strategic decision-
making routines, knowledge creation routines, and alliance routines (Eisenhardt et al., 2000). The
supply chain management process that integrates new resources into the firm from external sources
can be viewed as an important dynamic capability because it may create the modification of operating
routines in both the buying and the supplying firms. Moreover, dynamic capabilities need to rely on
real-time information to quickly understand the changing situation and adjust actions (Eisenhardt et
al., 2000). Therefore, effective supply chain management typically involves the improvement of
supply chain visibility. Based on the dynamic capabilities view, we can understand the nature and the
important role of supply chain visibility in supply chain management.
Dynamic capabilities are difficult to conceptualize, operationalise, and measure due to their complex
and tacit nature (Diericks et al.,1989), but they can be identified as a specific set of processes
(Eisenhardt et al., 2000; Pavlou, 2004; Zollo et al., 2002). Accordingly, Pavlou proposes
reconfiguration as the deployment process to achieve new configuration, and three enabling processes
to facilitate it: sensing the environment, learning and coordinating activities. Based on this
framework, supply chain visibility consists of three important constructs: sensing for visibility,
learning for visibility and coordinating for visibility.
• Sensing for Visibility) Sensing for visibility is important from the dynamic capabilities view

60
as it represents a firm’s ability to sense and acquire real-time information about external,
changing environments and to adjust its actions accordingly. In order to react to change, firms
in supply chains need to obtain sensing for visibility in the following information areas:
information about external-sensed events and information about supply chain change
(Handfield et al., 2002). The most important external information in supply chains is market
intelligence about customer needs. Market trend and customer demand information is critical
for both responding to market changes and creating new opportunities. Sharing such
information allows a firm to sense the needs of its partners and communicate its own needs to
the partners (Gosain et al., 2004). Firms that engage in broader information exchanges with
current partners, including product changes, customer preference changes, and demand
changes, are likely to be aware of new opportunities and may be able to sense and adapt to
key supply chain events (Madhavan et al., 1998).
• Learning for Visibility) Learning for visibility represents the extent to which a firm can learn
new information and knowledge from supply chain partners. As external knowledge is
fundamental to building capabilities, a firm can extend its knowledge base from supply chain
relationships and explore the external sources of knowledge to improve performance
(Eisenhardt et al., 2000; Johnson et al., 2004; Teece et al., 1997). Zollo and Winter suggest
that dynamic capabilities arise from learning and emerge from three important learning
mechanisms: experience accumulation, knowledge articulation, and knowledge codification.
For building dynamic capabilities through learning from supply chain partners, firms need to
exchange information related to their specific domain experience, discuss different ideas and
viewpoints, and share performance evaluation and valuable knowledge for improving supply
chain performance. Complementary knowledge from external linkages may involve into
important sources of new ideas and improve performance (Decarolis et al., 1999; Deeds et al.,
1996; Shan et al., 1994). Frequent contacts and regular meetings among supply chain
members can increase the amount of complex knowledge transferred and facilitate the sharing
of different interpretation of information. In these interacting processes, people are forced to
reflect on how they understand their work and articulate their tacit knowledge as explicit
knowledge. The explicit knowledge can then be combined into more complex and systematic
sets of new knowledge (Nonaka et al., 2000).
• Coordinating for Visibility) Coordinating for visibility is central for effective decision-making
in a supply chain (Sahin et al., 2002). Complete information to support specific decision-
making can align all decisions to accomplish global system objectives and improve supply
chain performance by effective resource allocation. This shared information provides

61
visibility to coordinate the flow of products in the supply chain (Simatupang et al., 2004).
Malone and Crowston propose a general definition of coordination: “coordination is
managing dependencies.” Two kinds of dependencies need to be coordinated in supply chain
management: required constraints transfer, and usability (Malone et al., 1994). According to
coordination theory, coordinating for visibility can provide critical information for managing
different kinds of dependencies in supply chain relationships. Managing prerequisite
dependency is the most common coordination in supply chains. Christiaanse and Kumar
indicate that upstream flows of customer orders and downstream flows of shipping
information coordinate the operations of supply chains. One way of managing transfer
dependency about storage is to share information for controlling the timing that items are
delivered and used, such as through just-in-time practices (Malone et al., 1994). Another way
is to establish stocks of inventory to buffer between two dependent activities. Therefore, some
planning related information like material requirements plans, order forecasts, production
schedules and transportation schedules can help firms manage transfer dependency. For
usability dependency, organizations must realize the product characteristics that customers
want. This can be done by market research or by participatory design (Malone et al., 1994).
Supplier involvement in new product design helps manage this kind of dependency in supply
chains.
TECHNOLOGIES
In the distribution and logistics field track and trace is defined as the process of identifying past and
current locations of inventory items (Datex, 2019). This inventory should be tracked at any level from
ingredient to finished product and anywhere in between. Track and trace processes are supported
through a variety of SCM technologies that help to provide real-time information on both location
and status of these items as they move throughout the supply chain. A focus has been placed on track
and trace due to the increasing complexity of governmental regulations. The government is becoming
more active due to food recalls reaching their all-time high in 2013 (Datex, 2019). On average, 6
recalls occur in the U.S. each day. These recalls impact up to 18.4 million products including
pharmaceuticals, food and much more. This issue has triggered the focus on technology and
automation throughout the supply chain.
These technologies are being used to manage the many moving pieces of the supply chain. In order
to create a detailed, accurate audit trail needed to satisfy new regulations, supply chain operators are
implementing a variety of track and trace solutions including WMS, RFID and automated data
collection devices. SCM businesses handling food and pharmaceutical products have started to

62
implement temperature indicators to track temperature, humidity and shock levels throughout the
delivery process. These devices come in a variety of designs for flexible use. The data collected using
temperature indicators can be transferred directly into inventory management software to develop a
complete audit trail.
• WMS) Developed to optimize the functionality of warehouse operations, a warehouse
management system is software that facilitates the planning, organization, control,
management and monitoring of daily activities. A warehouse management system handles
the orchestration of tasks involved with inbound and outbound operations, inventory tracking,
processing orders and shipments, inventory cycle counts, order processing and shipping.
Using a database that has been configured to support the operation of a warehouse, a
warehouse management system is a powerful tool to drive efficiency and accuracy across the
business. The software provides the means of warehouse control, enabling facility managers
to have visibility into processes, labour resource activity, and much more. Today, most
warehouses, distribution centres, 3PLs and fulfilment centres rely on warehouse management
system (WMS) technology as the “brains” of their operations. Data involving operational
processes flows into the warehouse management software from automated data capture
methods such as barcode scanners, mobile computers and RFID enabled devices. The data is
then used throughout the system to track inventory through the progression of warehouse
processes. Automated data capture ensures that valuable information reaches the system so
that it can be used in a wide variety of ways, not only for inventory management and inventory
tracking and other warehouse processes but also for reporting, dashboards and business
intelligence.
Having the ability to use real time data in reports and dashboards helps to empower more
accurate, effective decision making. Today, businesses across the supply chain use
warehouses to store goods on their way to customers. If the goods are destined for consumers,
retailers, manufacturers or other business entities, it is important that whatever goods are
ordered, shipped and delivered, they are processed properly, quickly, reliably and accurately.
The speed at which operational processes are performed, either in a fulfilment centre, 3PL
warehouse or distribution centre is often a critical factor: getting the correct goods to the
required location with the appropriate amount of handling, packaging, etc. is essential and can
mean the difference between success and failure.
• RFID) RFID, or radio frequency identification, is a system that transmits identity in the form
of a unique serial number of a product wirelessly. RFID, a type of Auto-ID technology is used
to reduce time and labour and improve real time data accuracy. Most commonly, an RFID tag
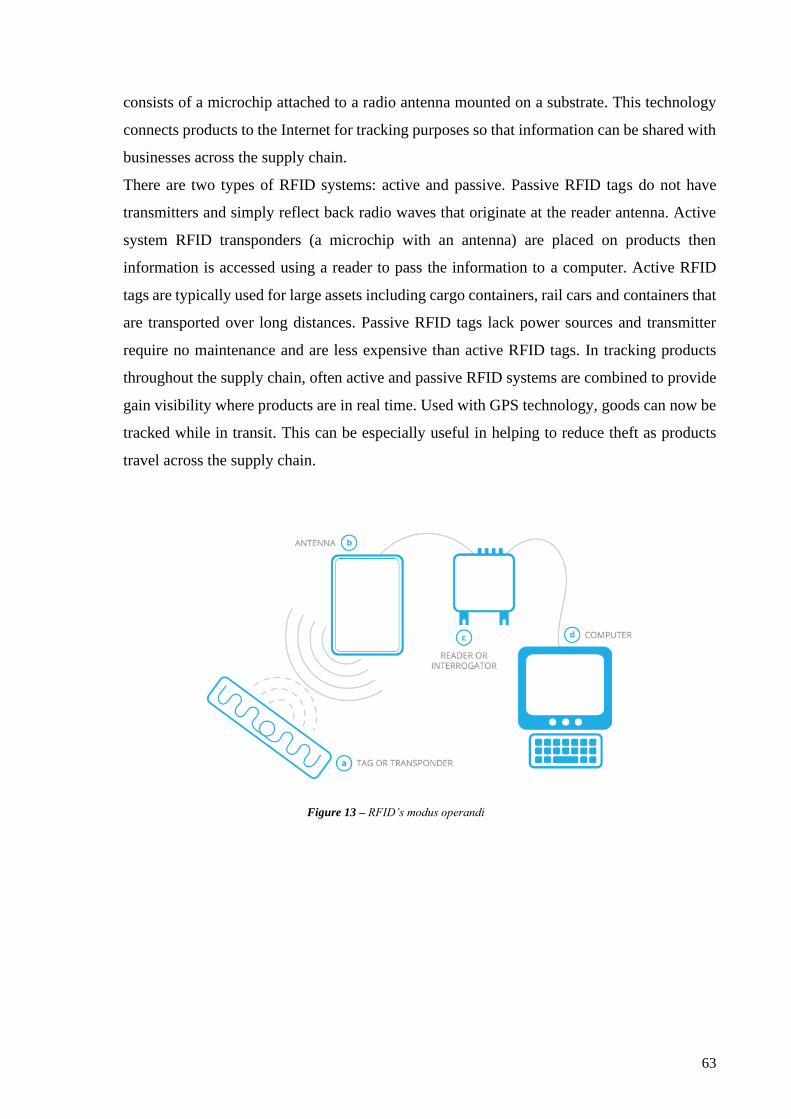
63
consists of a microchip attached to a radio antenna mounted on a substrate. This technology
connects products to the Internet for tracking purposes so that information can be shared with
businesses across the supply chain.
There are two types of RFID systems: active and passive. Passive RFID tags do not have
transmitters and simply reflect back radio waves that originate at the reader antenna. Active
system RFID transponders (a microchip with an antenna) are placed on products then
information is accessed using a reader to pass the information to a computer. Active RFID
tags are typically used for large assets including cargo containers, rail cars and containers that
are transported over long distances. Passive RFID tags lack power sources and transmitter
require no maintenance and are less expensive than active RFID tags. In tracking products
throughout the supply chain, often active and passive RFID systems are combined to provide
gain visibility where products are in real time. Used with GPS technology, goods can now be
tracked while in transit. This can be especially useful in helping to reduce theft as products
travel across the supply chain.
Figure 13 – RFID’s modus operandi
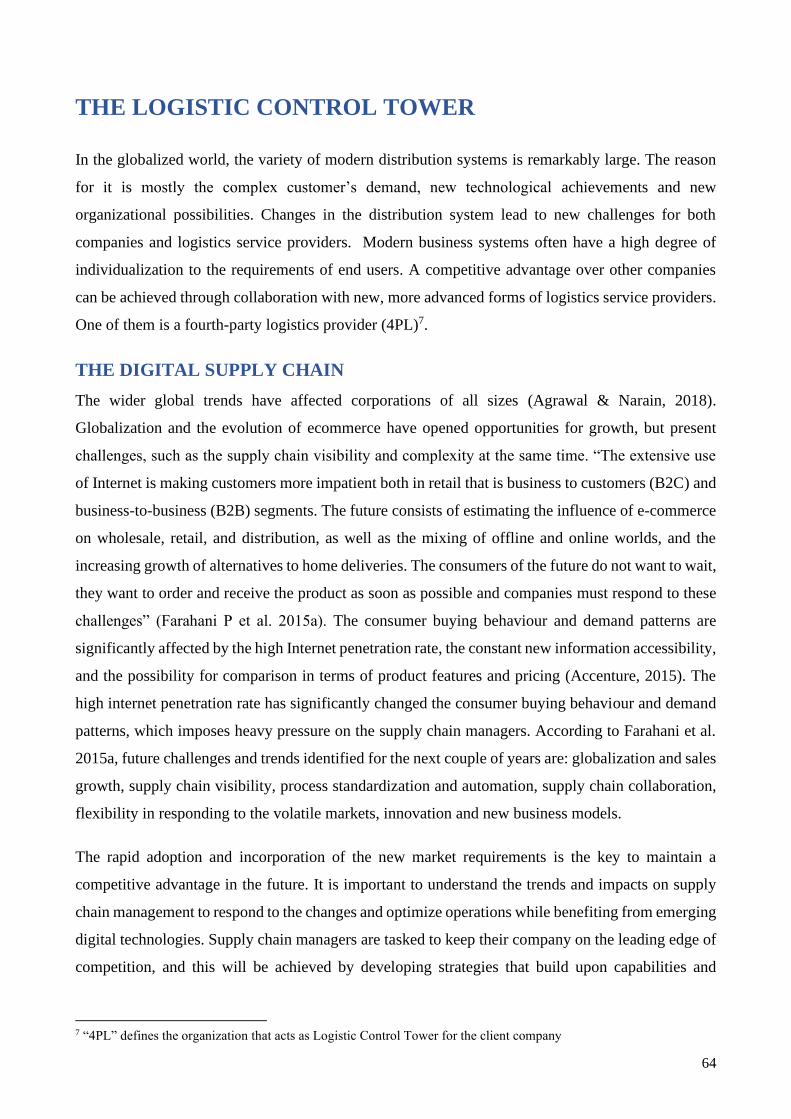
64
THE LOGISTIC CONTROL TOWER
In the globalized world, the variety of modern distribution systems is remarkably large. The reason
for it is mostly the complex customer’s demand, new technological achievements and new
organizational possibilities. Changes in the distribution system lead to new challenges for both
companies and logistics service providers. Modern business systems often have a high degree of
individualization to the requirements of end users. A competitive advantage over other companies
can be achieved through collaboration with new, more advanced forms of logistics service providers.
One of them is a fourth-party logistics provider (4PL)7.
THE DIGITAL SUPPLY CHAIN
The wider global trends have affected corporations of all sizes (Agrawal & Narain, 2018).
Globalization and the evolution of ecommerce have opened opportunities for growth, but present
challenges, such as the supply chain visibility and complexity at the same time. “The extensive use
of Internet is making customers more impatient both in retail that is business to customers (B2C) and
business-to-business (B2B) segments. The future consists of estimating the influence of e-commerce
on wholesale, retail, and distribution, as well as the mixing of offline and online worlds, and the
increasing growth of alternatives to home deliveries. The consumers of the future do not want to wait,
they want to order and receive the product as soon as possible and companies must respond to these
challenges” (Farahani P et al. 2015a). The consumer buying behaviour and demand patterns are
significantly affected by the high Internet penetration rate, the constant new information accessibility,
and the possibility for comparison in terms of product features and pricing (Accenture, 2015). The
high internet penetration rate has significantly changed the consumer buying behaviour and demand
patterns, which imposes heavy pressure on the supply chain managers. According to Farahani et al.
2015a, future challenges and trends identified for the next couple of years are: globalization and sales
growth, supply chain visibility, process standardization and automation, supply chain collaboration,
flexibility in responding to the volatile markets, innovation and new business models.
The rapid adoption and incorporation of the new market requirements is the key to maintain a
competitive advantage in the future. It is important to understand the trends and impacts on supply
chain management to respond to the changes and optimize operations while benefiting from emerging
digital technologies. Supply chain managers are tasked to keep their company on the leading edge of
competition, and this will be achieved by developing strategies that build upon capabilities and
7 “4PL” defines the organization that acts as Logistic Control Tower for the client company
65
opportunities, particularly, within the context of digitalized supply chains. Digitalization not only
changes the way of working but it also increases the rate of change that companies are facing.
Emerging technologies such as 3D printing, internet of things, and social media are having a notable
impact on current and future supply chain management model. It is expected that emerging
technologies can provide answers to some of the most meaningful challenges in SCM, leading to cost
and complexity reduction, an increase in volume flexibility, or a rise in service level management.
THE DEFINITIONS
4PL
In 1996, Accenture first coined the term ‘4PL’ (Fourth Party Logistics Provider) and defined it as:
“A Supply Chain Integrator that assembles and manages the resources, capabilities, technology of its
own organisation, with those of complementary service providers to deliver a comprehensive supply
chain solution”. Considering a logistic perspective, a company can assume five different approaches
(Warehouse Anywhere, 2018):
Figure 14 – xPL approaches
• 1PL) An enterprise that sends goods or products from one location to another is a 1PL. For
example, a local farm that transports eggs directly to a grocery store for sale is a 1PL.
• 2PL) An enterprise that owns assets such as vehicles to transport products from one location
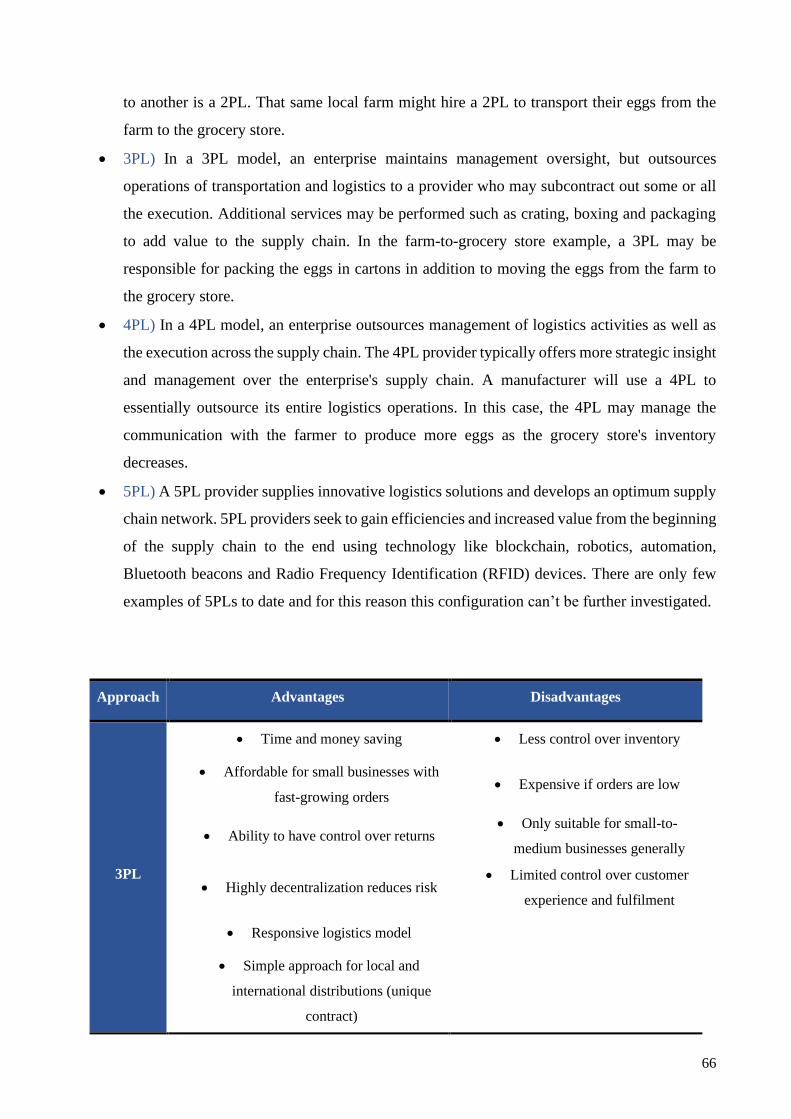
66
to another is a 2PL. That same local farm might hire a 2PL to transport their eggs from the
farm to the grocery store.
• 3PL) In a 3PL model, an enterprise maintains management oversight, but outsources
operations of transportation and logistics to a provider who may subcontract out some or all
the execution. Additional services may be performed such as crating, boxing and packaging
to add value to the supply chain. In the farm-to-grocery store example, a 3PL may be
responsible for packing the eggs in cartons in addition to moving the eggs from the farm to
the grocery store.
• 4PL) In a 4PL model, an enterprise outsources management of logistics activities as well as
the execution across the supply chain. The 4PL provider typically offers more strategic insight
and management over the enterprise's supply chain. A manufacturer will use a 4PL to
essentially outsource its entire logistics operations. In this case, the 4PL may manage the
communication with the farmer to produce more eggs as the grocery store's inventory
decreases.
• 5PL) A 5PL provider supplies innovative logistics solutions and develops an optimum supply
chain network. 5PL providers seek to gain efficiencies and increased value from the beginning
of the supply chain to the end using technology like blockchain, robotics, automation,
Bluetooth beacons and Radio Frequency Identification (RFID) devices. There are only few
examples of 5PLs to date and for this reason this configuration can’t be further investigated.
Approach Advantages Disadvantages
3PL
• Time and money saving • Less control over inventory
• Affordable for small businesses with
fast-growing orders • Expensive if orders are low
• Ability to have control over returns • Only suitable for small-to-
medium businesses generally
• Highly decentralization reduces risk • Limited control over customer
experience and fulfilment
• Responsive logistics model
• Simple approach for local and
international distributions (unique
contract)
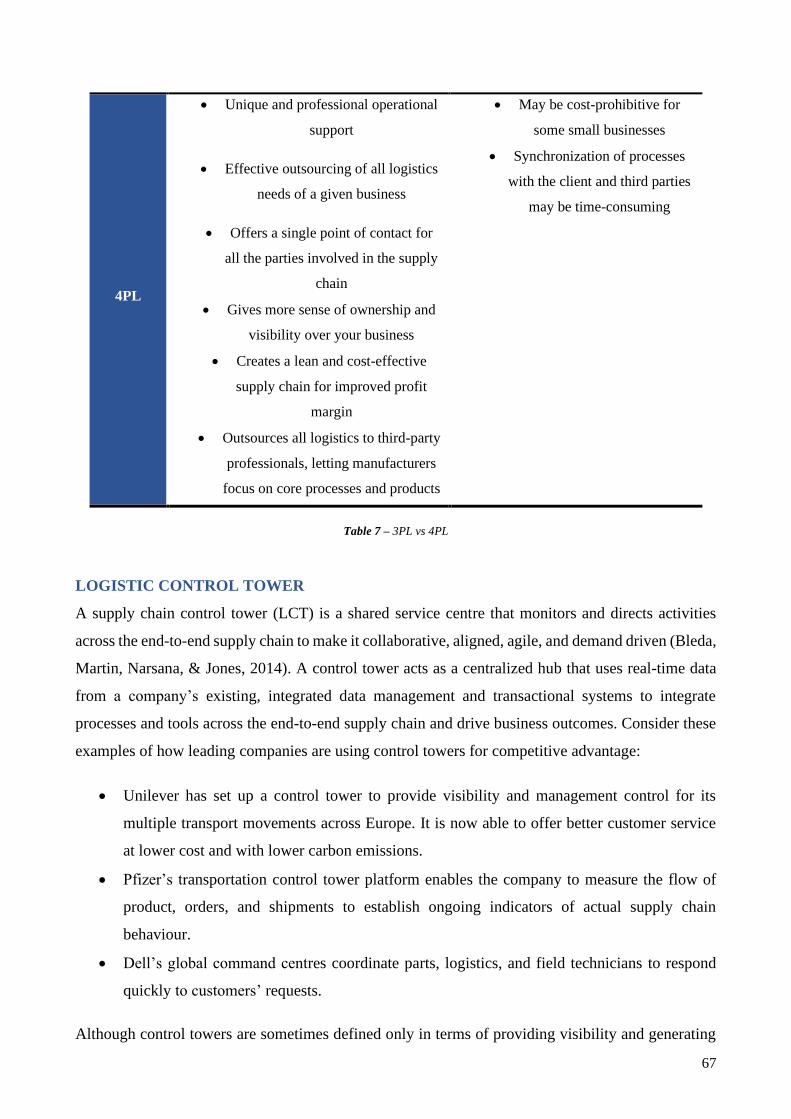
67
4PL
• Unique and professional operational
support
• May be cost-prohibitive for
some small businesses
• Effective outsourcing of all logistics
needs of a given business
• Synchronization of processes
with the client and third parties
may be time-consuming
• Offers a single point of contact for
all the parties involved in the supply
chain
• Gives more sense of ownership and
visibility over your business
• Creates a lean and cost-effective
supply chain for improved profit
margin
• Outsources all logistics to third-party
professionals, letting manufacturers
focus on core processes and products
Table 7 – 3PL vs 4PL
LOGISTIC CONTROL TOWER
A supply chain control tower (LCT) is a shared service centre that monitors and directs activities
across the end-to-end supply chain to make it collaborative, aligned, agile, and demand driven (Bleda,
Martin, Narsana, & Jones, 2014). A control tower acts as a centralized hub that uses real-time data
from a company’s existing, integrated data management and transactional systems to integrate
processes and tools across the end-to-end supply chain and drive business outcomes. Consider these
examples of how leading companies are using control towers for competitive advantage:
• Unilever has set up a control tower to provide visibility and management control for its
multiple transport movements across Europe. It is now able to offer better customer service
at lower cost and with lower carbon emissions.
• Pfizer’s transportation control tower platform enables the company to measure the flow of
product, orders, and shipments to establish ongoing indicators of actual supply chain
behaviour.
• Dell’s global command centres coordinate parts, logistics, and field technicians to respond
quickly to customers’ requests.
Although control towers are sometimes defined only in terms of providing visibility and generating

68
alerts to enable reactive response, a supply chain control tower, as Accenture defines it, has three
essential capabilities for managing complex supply chains end-to-end: not just visibility but also
analytics and execution.
Real-time access to information from across the end-to-end supply chain (information about, for
example, demand, capacity, orders, inventory, and shipments) can enable supply chain managers to
answer the question “What is happening now?” This end-to-end visibility in a control tower is
provided by built-for-purpose technologies leveraging a single-page information model, milestone
modelling, master data management, and dashboards and alarms.
Powerful analytics tools, including predictive analytics, can enable supply chain managers to answer
questions such as “Why is this happening?” “What can happen next?”, and “How can we improve?”
Supply chain control towers are equipped with analytics to help answer these questions and target
value opportunities by making sense of the visibility data (conducting root cause analysis, triggering
alerts, detecting “tipping points,” and initiating action), performing “what if” analysis of scenarios,
and engaging in risk analysis and response management.
Streamlined processes (for tasks such as planning, materials management, fulfilment, distribution,
and service) enable supply chain managers to orchestrate the dissemination of information and action
plans across the supply chain and then monitor activity to help ensure compliance. This is a very
powerful tool, particularly for an organization with several shared service centres delivering
transactional services to multiple divisions and business units. The control tower helps ensure that
each part of the supply chain knows when and how it will be impacted by another, and the monitoring
of activity helps to enable continuous improvement.
In defining a control tower, it is also important to understand what it is not. A control tower is not a
replacement for transactional and data management systems. It is not just a visualization portal on
top of a data warehouse, since a control tower has analytics capabilities, nor is it just an in-memory
processing system. All these ideas capture only part of what a control tower can do for a business.

69
Figure 15 – LCT’s framework
Control towers offer the following features:
• Planning and routing) LCT provides unprecedented supply chain flexibility for dynamic
planning and routing.
• Auditing and reporting) It helps in auditing all the stages in detail within the supply chain
movement and in generating reports that shows the total landed cost of every product with the
breakdown.
• Forecasting) It makes predictions at the daily “operational” level, about ETAs and forecast
supply chain cost and demand.
• Event management) It provides event management at all stages within the supply chain,
warehouse, transport, yard and container management and billing and invoicing.
• Decision making) It provides a one-stop-shop solution with centralized accountability and
responsibility for cost, quality and performance by creating decision making platform.
• End-to-end visibility and control) It assures visibility over the order, drivers and third-party
logistics partners.
• Real-time tracking) This can be done through smart devices and it helps to create an easy
communication with drivers as well as allowing to have visibility and managing orders easily.
• Omni-channel access) It has access to information on any device in order to share them and

70
facilitate collaboration in real-time.
• Data analytics) A delivery management software utilizes data analytics to efficiently direct
the field workforce and last-mile delivery to their intended destinations, speeding up the
delivery process while keeping the same level of quality.
• Notifications and alerts on-the-go) It gives the possibility to quickly resolve disruptions before
they disrupt your business.
In order to provide these services, it must be:
• Secure) It must be complaint with ICT security-requirements.
• Scalable) If the network grows, also the logistic control tower must increase its structure in
order to include new joiners and locations.
• Compatible) It must communicate and exchange data with several systems and interfaces
using different formats.
• Feasible) It must guarantee efficiency over time respecting the defined budget cost.
• Internally sustainable) Its management mustn’t rely on external entities and software out of
the 4PL organization can be used only if interfaces are directly managed by the logistic control
tower.
Area of benefits List of benefits
General
• Integrated supply chain with ability to retrieve information
• Reduced compliance penalties
• Improve decision making capabilities
• Reduced network failures, increased network visibility and
responsiveness
• Respect customer commitment: schedule, cost, quality and
improved customer satisfaction
Inbound
• Optimal inventory levels and reduced buffer inventory
• Synergies in procurement transport carriers leading in
reduction in transportation expense
• Reduction in total landed cost and increase on time and in full
deliveries
• Helps to change sourcing strategies, shift supplier allocations,
modify commercial terms, re-engineer a logistics process or
swap out a logistic partner.

71
Manufacturing
• Awareness of WIP and improved productivity
• Manufacturing in optimal way over plants operating globally
• More accurate demand planning, better scheduling, reduction
in cycle times, reduced inventory levels and timely and
complete management information
Outbound
• Improved load efficiency in Outbound
• Improve transport efficiency using best-in-class carriers and
redesigning transport solution
• Ability to predict right ETA for customers
Table 8 – LCT’s benefits
THE LCT IMPLEMENTATION
Control Towers are cross-divisional organizations with system integrated “information hubs” that
provide Supply Chain Visibility. These hubs are used for gathering and distributing information, and
allow people trained to use these visibility capabilities to detect and act on risks or opportunities more
quickly. Control Towers are typically set-up to monitor, measure and manage transport and inventory
movements across the supply chain. Control towers combine organizations, systems and processes in
order to provide supply chain partners with a high level of product visibility along the entire supply
chain. This enables three levels of management control (Van Doesburg, 2011):
• Strategic) It provides control over the design of the overall supply chain network;
• Tactical) It enables proactive planning of procurement, operations and distribution according
to market demand;
• Operational) It encompasses various real time functionality including transportation
management, inventory tracking and exception management.
Getting the technology aspect right is fundamental to the overall success of the control tower concept.
While setting up a Control Tower, different systems are integrated with each other with the help of
common middleware software and all information is gathered at a centralized location. This
information is then used for auditing, monitoring and taking effective decisions. Every product
ordered from a supplier, every shipment shipped to a customer, every document created, every cost
accrued, and every event generated in the flow of product from order to final delivery is captured,
organized and stored in the tower. In-transit inventory at the part/SKU level can also be captured by
the Control Tower. This way a rich store of valuable supply chain information is created, enabling
end-to-end control of a customer driven supply chain.

72
Therefore, Control Towers provide unprecedented supply chain flexibility for dynamic planning and
routing and it allows the generation of reports that shows the total landed cost of every product
ordered, including a breakdown by cost category showing how these costs have fluctuated over time.
This data can be used to make predictions at the daily “operational” level and to predict supply chain
costs. Control Towers can also accurately predict ETAs (expected time of arrivals) based on what is
happening in areas of the supply chain that are not always so easy to forecast. In order to provide this
functionality Control Towers often utilize virtual network organizations. Consequently, the
establishment of a Control Tower usually results in the creation of new roles at different levels in the
organization which work together towards capturing and monitoring the process flows at each stage
and standardizing operational practices. A Control Tower can be customized according to the specific
organization’s needs in terms of their geographic reach, scope, functions, processes and industry type.
In order to successfully implement a Control Tower, however, organizations need to carefully think
through a few vital decisions when setting-up their Control Tower. These decisions include:
• Deciding on the goals and objectives of Supply Chain Visibility;
• Identifying the list of functions, processes or departments to be monitored;
• Determining the new organizational design;
• Identifying which functions or processes can be run collaboratively or outsourced;
• Deciding the technology solution to be implemented and potentially selecting a solution
provider to build the Control Tower;
• Deciding whether to outsource the Control Tower operation or manage it in-house.
While some of these decisions may be complex, if done correctly, the resulting Control Tower will
yield important cross-functional benefits that ultimately also benefit end-customers and provide the
organization with a long-term competitive advantage.
In order to successfully set-up a Control Tower and ultimately achieve the desired visibility,
companies need to follow a proven approach. A two-stage methodology to set-up an end-to-end
Control Tower solution that can be tailored to an organization’s specific scope, functions, processes,
industries and geographic needs has proven very useful in effectively setting up Control Towers. Such
an approach usually consists of two distinct stages: a strategic stage and an implementation stage.
The Strategic stage, generally entails assessing the as-is business, capturing the Supply Chain
Visibility needs and evaluating the benefits (including financial) which a control tower could provide.
Areas for collaboration with subcontractors, vendors and partners within the value-chain are
identified. Once the scope of the Control Tower set-up is finalized, it is important to understand

73
existing internal systems and the systems of identified collaboration partners. After gaining a deep
understanding of the requirements, a high-level to-be concept for the organization, processes,
in/outsourcing and systems is designed. The plan is then shared and signed off with the key
stakeholders, along with the detailed roadmap for setting-up the Control Tower. This stage usually
lasts for 8 to 12 weeks.
During the Implementation stage, the high-level Control Tower architecture is designed. The most
suitable middleware software solution to be implemented is identified which considers the current
system set-up and visibility need. The selected solution should also help the organization to integrate
all its processes and capture the information centrally. After the approval of the selected solution,
end-to-end system integration proceeds on a phase-by-phase basis. Once the systems are completely
integrated, testing is done and a Business Continuity Plan to support any system failure is developed.
Once the Control Tower network is validated, different roles in the virtual Control Tower organization
are created and developed. Training in how to generate and interpret different kinds of reports and
track the movements within the supply chain is conducted and Control Tower managers are coached
in how to conduct process level auditing, planning and predictions based on the available information.
Finally, a regular monitoring mechanism at each stage within the supply chain flow of the
organization is established. This stage takes 6 to 12 months.
LCT TECHNOLOGIES
To control costs and position product for sale, more companies realize that they need to be able to
make changes in production and distribution in response to changing market events or consumer
behaviour. Control towers give them both a platform and a console to see events happening and make
modifications. Control towers have their roots in visibility applications that provided overviews of
shipments or production. Today’s leading control tower solutions are more comprehensive, taking a
view broader than just that of a single enterprise. They provide transparency over supply chain
partners, being they suppliers, contract manufacturers, transportation carriers, or third-party logistic
providers. They also have a front-end part to capture demand, such as signals which can drive
production and distribution.
Leading towers can process streaming data from multiple parties to create an end-to-end picture. In
addition, they provide advanced business intelligence such as prescriptive and predictive analytics to
guide supply chain managers in making data-driven decisions.
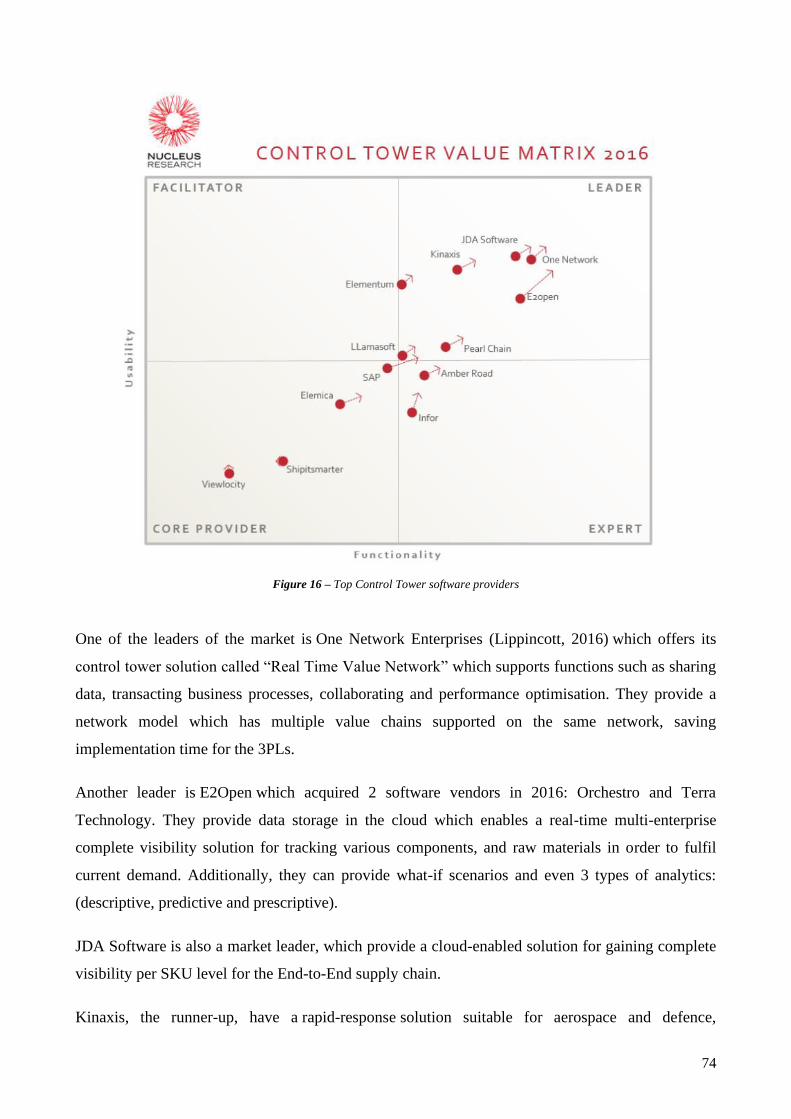
74
Figure 16 – Top Control Tower software providers
One of the leaders of the market is One Network Enterprises (Lippincott, 2016) which offers its
control tower solution called “Real Time Value Network” which supports functions such as sharing
data, transacting business processes, collaborating and performance optimisation. They provide a
network model which has multiple value chains supported on the same network, saving
implementation time for the 3PLs.
Another leader is E2Open which acquired 2 software vendors in 2016: Orchestro and Terra
Technology. They provide data storage in the cloud which enables a real-time multi-enterprise
complete visibility solution for tracking various components, and raw materials in order to fulfil
current demand. Additionally, they can provide what-if scenarios and even 3 types of analytics:
(descriptive, predictive and prescriptive).
JDA Software is also a market leader, which provide a cloud-enabled solution for gaining complete
visibility per SKU level for the End-to-End supply chain.
Kinaxis, the runner-up, have a rapid-response solution suitable for aerospace and defence,

75
automotive, industrial and high-tech industries, among many others. They provide analytics, support
sales and operations planning (S&OP) and offer real-time alerts in case of sudden change in the supply
chain. Their total solution is defined as Software-as-a-Service (Saas).
Elementum also offers a Saas solution, through their value-matrix service providing real-time
visibility on key operational information to support decision making, on both desktop and mobile
platforms.
Pearl Chain supports the real-time synergy between planning and execution, by providing complete
End-to-End visibility on items such as SKUs and shipments. They make this data available even on
tablets. Additionally, they incorporate data collected from the Internet-of-Things (IoT) sensors
attached, and even make use of drones for customers.
LLamasoft offers an Enterprise Simulation Platform (ESP), which is a Saas and which provides data
integration of the supply chain, predictive analytics and a quick setup.

76
THE PROJECT IN ACCENTURE
THE CLIENT
The client of the project is a listed firm of consumer goods with more than 70B$ revenues in the last
FY. He deliveries its products in about 180 countries and it owns more than 40 active plants
worldwide, where 70,000 employees work. Moreover, it can praise 150 years of history and its control
over the main brands of the industry where it operates. Lastly, it is also part of the sample of firms on
which is based the S&P 100 index, which measures the stock performance of the 100 largest
companies listed on stock exchanges in the United States.
THE BUSINESS CASE
In the last years Transportation Control Towers are moving from Logistic Services Providers based
on assets and execution to 4PL models focused on Supply Chain Integration and advanced capabilities
(with tactical and strategic view). This new model is based on the integration capabilities of already
existing systems (such as ERP, TMS and WMS) in order to manage the overall logistics adopting a
tactical and strategic perspective.
The request of the client is not only a matter of increased visibility: this must be the tool to obtain the
real objective of the project, that are the improvement of the whole logistic performance creating
added value that will be used to assure its leadership in the market. Following this trend, the client
turns to Accenture in 2016 to achieve the following goals:
• Transform its Supply Chain to unlock savings in the extended transportation process, while
keeping the service continuity;
• Achieve Operational Excellence by centralizing the activities and operating with best in class
processes and systems;
• Sustain and expand the savings overtime targeting all the business opportunities and possibly
expanding the scope developing initiatives intended to resources optimization.
THE SCOPE
The project started in 2016 and a five-year duration is defined (until 2020 included). In this timeframe,
Accenture is accountable for the redesign of the transport management for the client starting from the
Logistic Control Tower set-up, the renegotiation of contracts with carriers on behalf of the client and
TMS integration. Moreover, Accenture will be committed in some operative activities, such as order
management, planning, and execution, auditing and billing. Since 2017 Accenture offers an analytics

77
service, which allows the issue of standards reports and dashboard to monitor cost per lane and carrier,
as well as their performance with a continuous improvement perspective. The scope of the project
consists in the transportation management of inbound and outbound flows for 4 types of commodities
(raw materials, direct inbound materials, semi-finished goods and finished goods) from or to all the
European factories and warehouses of the clients and his providers. The project mainly focuses on
managing overland truck transportation and ocean; despite of that, and due to punctual urgent order
requirement, airfreight orders are also managed.
At the beginning the service includes about 60K shipments per year, the involvement of 40 carriers
and a total of 80 different markets. Secondary distribution, defined as the movement of finished goods
from regional warehouses to local markets, is still held by the single warehouse and considered out
of the scope, as well as transportation of spare parts and machinery movement. The project income
is based on a fixed fee and on a variable one depending on the actual performance.
Figure 17 – Geographic transport flow allocation
Inbound Outbound DCs Factories

78
THE INITIAL FORECAST
Due to the project size, Accenture builds three different teams: operations in Barcelona, procurement
in London and continuous improvement in Milan. A cost investigation is carried out, possible areas
of improvement are detected, and a first rough forecast of potential savings is shown to the client.
Figure 18 – First round savings forecast
The objective is the achievement of a value of savings between 14,6% and the 20,9% of the annual
transportation cost (figure above) when the project is at full speed, which correspond to a range in
absolute values from 11M€ to a maximum of 15,7M€. This analysis is performed on a consistent
sample of client’s routes leveraging Accenture’s expertise in similar projects. The 5 points on which
savings are computed are:
• Model Transformation) For Model Transformation Accenture means client’s possibility of
outsourcing the logistics, a field where he doesn’t have the expertise needed to handle his
huge volume in terms of products and relationships with carriers, in order to focus on the core
activities of his business. Since a consulting firm can act as a 4PL without any conflict in the
transportation sector, a Logistic Control Tower provided by Accenture will be completely
dedicated to the maximization of client’s savings. On the other hand, this wouldn’t occur in
the case a carrier company operates as a 4PL for the client, because it will always give priority
to its economic return, instead of client’s one.
• Logistics Procurement) Logistics Procurement refers to the ability of requesting a favourable
quotation about a certain lane from a carrier in the annual tendering phase. In case Accenture
becomes accountable for this activity on the behalf of the client, it can exploit its knowledge
79
and experience in similar projects to obtain fair prices, which respect the actual market trend.
• Transport Planning – Execution – Invoicing & Audit) A new logistic process should be
designed by the consultancy firm in order to spread visibility along every step of it and this
approach will assure the possibility to spot inefficiencies whenever they occur and to trace
them downstream.
• Continuous improvement) Another important objective of the project is to keep creating value
even after it will be at full speed. In order to achieve this goal a team of experts should be
dedicated to the monitoring of performance and to the constant detection of possible initiatives
aimed to improve efficiency year by year.
ACCENTURE’S PROPOSAL
In order to achieve the previous mentioned goal, Accenture proposes to build up a Logistic Control
Tower based on the following pillars:
• Transformation) An action plan is scheduled to define the new business model and spread to
all the processes. The first step consists in the review of contractual terms with carriers and
the markets. Therefore, negotiation with older contractors and renegotiations with new ones
are carried out by Accenture on behalf of the client in order to obtain logistic advantages
across the whole supply chain. Calendars, delivery windows, lead times, minimum order
quantity and order frequencies are examples of topics questioned thanks to Accenture’s
expertise.
Successively, processes are reviewed and a standard “modus operandi” is approved for all the
markets. In line with this approach, accountability of each step of the process is assigned to a
specific role or team. This fact creates even the need of re-organize all involved parts, that are
not only the ones related to logistics, but also the connected functions which logistics work
with. This consideration concerns particularly third parties, such as carriers, because they must
adapt themselves to the new way their client operates, and they must learn to interact with the
new platform. All the affiliates (the main national factories of the clients) from now on don’t
operate as single entities, but they are made compliant to new requirements.
Last step consists in the measurement of economic result. A strict collaboration between
procurement and logistics is set up to facilitate costs cut and the integration of new informative
systems. Indeed, the TMS8 becomes the main software of this new configuration and its
integration with the incumbent ERP9 assures the improvement of visibility along all the supply
8 “TMS” is “Transportation Management System” 9 “ERP” is “Enterprise Resource Planning”
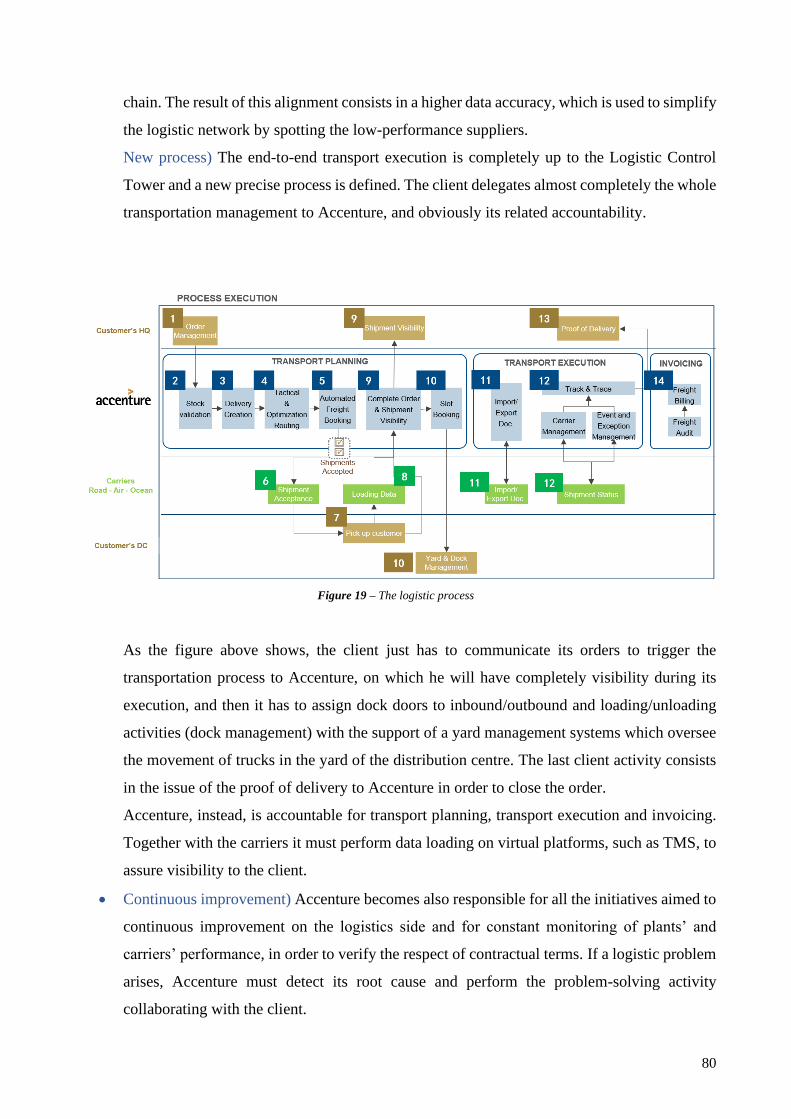
80
chain. The result of this alignment consists in a higher data accuracy, which is used to simplify
the logistic network by spotting the low-performance suppliers.
New process) The end-to-end transport execution is completely up to the Logistic Control
Tower and a new precise process is defined. The client delegates almost completely the whole
transportation management to Accenture, and obviously its related accountability.
Figure 19 – The logistic process
As the figure above shows, the client just has to communicate its orders to trigger the
transportation process to Accenture, on which he will have completely visibility during its
execution, and then it has to assign dock doors to inbound/outbound and loading/unloading
activities (dock management) with the support of a yard management systems which oversee
the movement of trucks in the yard of the distribution centre. The last client activity consists
in the issue of the proof of delivery to Accenture in order to close the order.
Accenture, instead, is accountable for transport planning, transport execution and invoicing.
Together with the carriers it must perform data loading on virtual platforms, such as TMS, to
assure visibility to the client.
• Continuous improvement) Accenture becomes also responsible for all the initiatives aimed to
continuous improvement on the logistics side and for constant monitoring of plants’ and
carriers’ performance, in order to verify the respect of contractual terms. If a logistic problem
arises, Accenture must detect its root cause and perform the problem-solving activity
collaborating with the client.

81
Historical data and information gathered from benchmarking within the sector allows
Accenture team to make hypothesis and what-if scenario, which allows to adopt a predictive
approach. Therefore, Accenture can spot a possible solution to a problem, even before the
problem itself arises, or it can change the operative dynamics detecting new and more efficient
paths to follow. An example could be the awareness of switching the carrier assigned to a
certain lane because actual data are showing an increasing trend of its tariff in the last period.
In summary, the strengths of Accenture proposals could be clustered in the following ones:
• Accenture provides a dedicated team composed by experts of the field;
• Advanced analytic capabilities are provided to spot opportunities and improve the model in
the long-term.
• Accenture can provide a governance model that assures visibility to the client and the
alignment with its strategic objectives.
• The client can exploit Accenture’s expertise in the field of change management, since the
reengineering of processes and the implementation of technologic innovations are the
competitive advantage of the firm in the consultancy industry.
• It is a 4PL model and the end-to-end transportation management is entrusted to a third part
(Accenture), which has no conflict of interests with the client since transportation isn’t its
main business.
LCT IMPLEMENTATION
In the past the lack of adequate technologies was the main reason that prevented the development of
Logistic Control Towers. However, nowadays the situation is changed and there are many factors
which facilitate its implementation. Firstly, most of firms has systems to support their business, such
as ERP, TMS and WMS. Together with cloud technology, they allow the storage of sensitive data
and the integration between different functions within the same firm and along the whole supply
chain, making interoperability possible.
The transformation is the prerequisite of the entire project. The analysis on the client business spots
the inefficiency of transportation in the European area due to decentralized governance and lack of
standardization: all the activities are managed at a local level with a unique approach. This
configuration makes very difficult for client’s headquarters to have a global view that allows to
compare logistic status among different countries.
The client requests that LCT will manage the whole transportation volume in scope within a year.
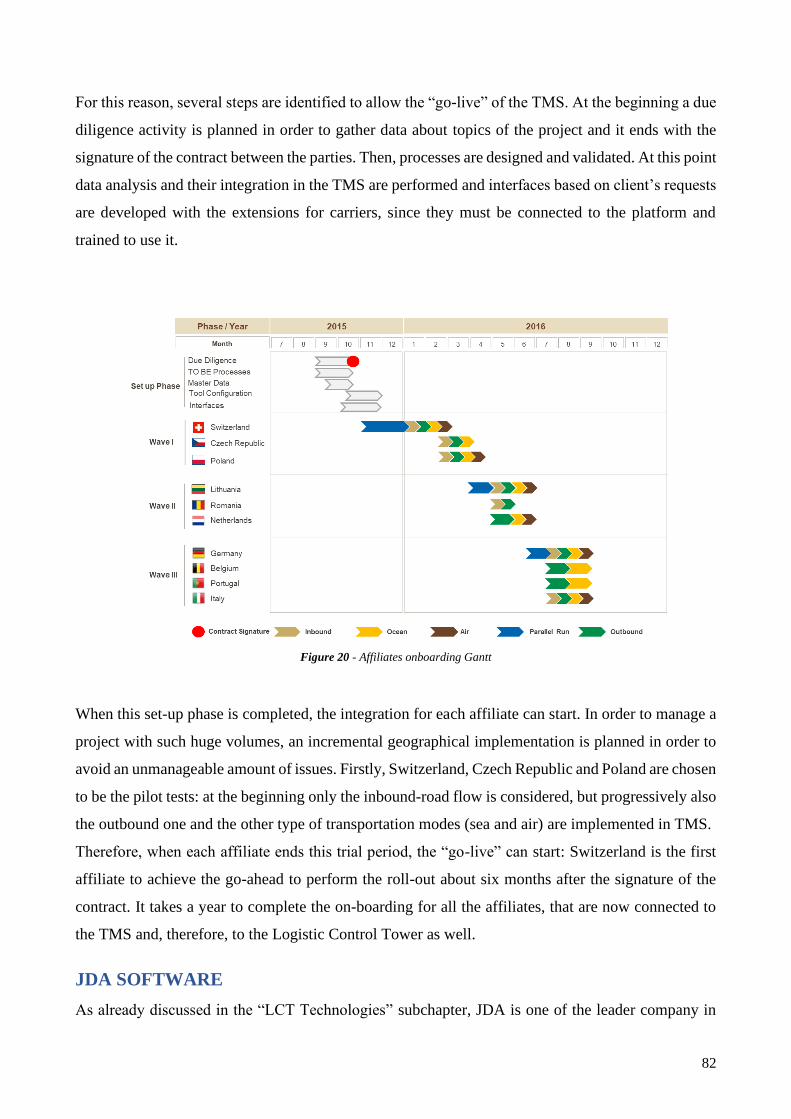
82
For this reason, several steps are identified to allow the “go-live” of the TMS. At the beginning a due
diligence activity is planned in order to gather data about topics of the project and it ends with the
signature of the contract between the parties. Then, processes are designed and validated. At this point
data analysis and their integration in the TMS are performed and interfaces based on client’s requests
are developed with the extensions for carriers, since they must be connected to the platform and
trained to use it.
Figure 20 - Affiliates onboarding Gantt
When this set-up phase is completed, the integration for each affiliate can start. In order to manage a
project with such huge volumes, an incremental geographical implementation is planned in order to
avoid an unmanageable amount of issues. Firstly, Switzerland, Czech Republic and Poland are chosen
to be the pilot tests: at the beginning only the inbound-road flow is considered, but progressively also
the outbound one and the other type of transportation modes (sea and air) are implemented in TMS.
Therefore, when each affiliate ends this trial period, the “go-live” can start: Switzerland is the first
affiliate to achieve the go-ahead to perform the roll-out about six months after the signature of the
contract. It takes a year to complete the on-boarding for all the affiliates, that are now connected to
the TMS and, therefore, to the Logistic Control Tower as well.
JDA SOFTWARE
As already discussed in the “LCT Technologies” subchapter, JDA is one of the leader company in
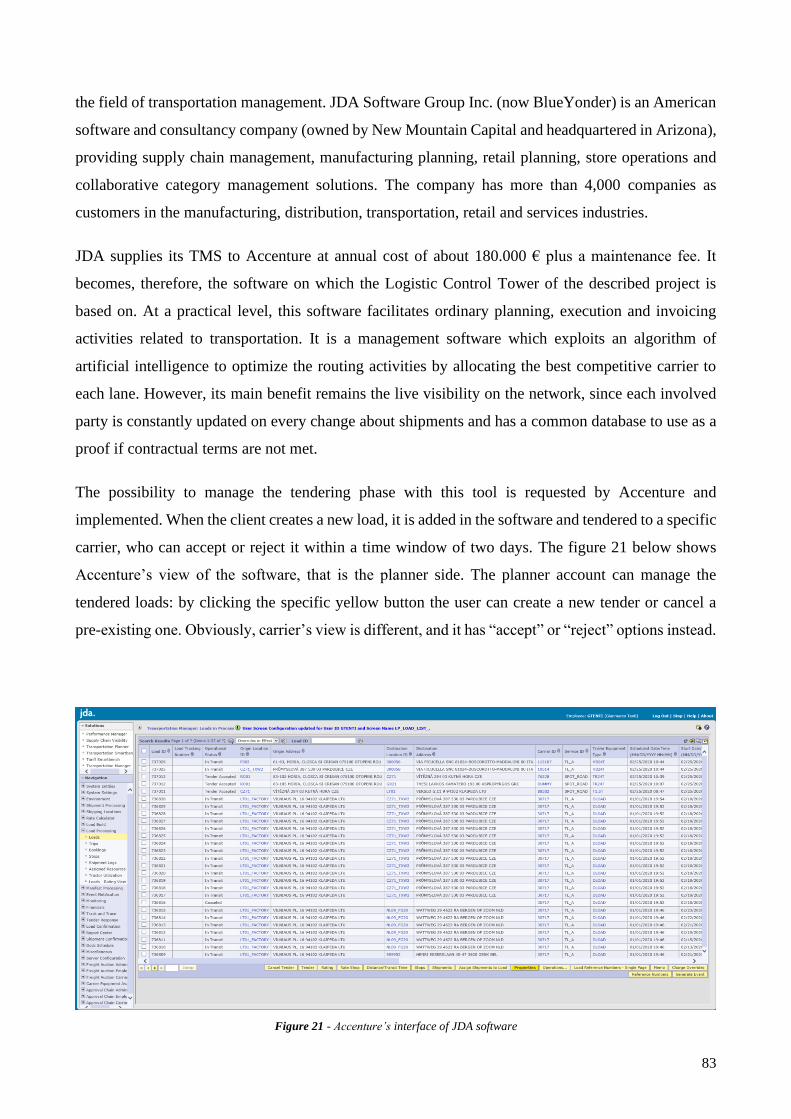
83
the field of transportation management. JDA Software Group Inc. (now BlueYonder) is an American
software and consultancy company (owned by New Mountain Capital and headquartered in Arizona),
providing supply chain management, manufacturing planning, retail planning, store operations and
collaborative category management solutions. The company has more than 4,000 companies as
customers in the manufacturing, distribution, transportation, retail and services industries.
JDA supplies its TMS to Accenture at annual cost of about 180.000 € plus a maintenance fee. It
becomes, therefore, the software on which the Logistic Control Tower of the described project is
based on. At a practical level, this software facilitates ordinary planning, execution and invoicing
activities related to transportation. It is a management software which exploits an algorithm of
artificial intelligence to optimize the routing activities by allocating the best competitive carrier to
each lane. However, its main benefit remains the live visibility on the network, since each involved
party is constantly updated on every change about shipments and has a common database to use as a
proof if contractual terms are not met.
The possibility to manage the tendering phase with this tool is requested by Accenture and
implemented. When the client creates a new load, it is added in the software and tendered to a specific
carrier, who can accept or reject it within a time window of two days. The figure 21 below shows
Accenture’s view of the software, that is the planner side. The planner account can manage the
tendered loads: by clicking the specific yellow button the user can create a new tender or cancel a
pre-existing one. Obviously, carrier’s view is different, and it has “accept” or “reject” options instead.
Figure 21 - Accenture’s interface of JDA software
84
Moreover, in case of delay the carrier must update the platform declaring the new estimated time of
arrival. However, if the delay exceeds the day of arrival, the carrier hasn’t the credentials to change
previous date and, in this scenario, he must contact the planner to perform such activity. Finally, the
carrier must also insert in the platform the actual pick-up date or the delivery date performed in a
location of a vendor or of a client. Otherwise the update is performed by the accountable employee
in case the good issue or the good receive takes place in a factory or in a distribution centre of the
client of the project.
CONTINUOUS IMPROVEMENT INITIATIVES
After a year (2017) the implementation phase ends, all the affiliates are connected to the Logistic
Control Tower and most of the carriers can work on JDA’s TMS. Then the project is at full speed and
now, according to the contract, Accenture must exploit the improved visibility to find out initiatives
aimed to a continuous improvement of the process. Thanks to Accenture’s expertise in other projects
and in the logistic background, many initiatives have been proposed to the client in these two years
and some of them have been approved and implemented. The initiatives concern exclusively the road
transportation, since there is no need to improve the cost performance for sea transportation, which
is already cost-efficient, while air freight is performed only to respond to urgencies from the markets.
The main initiatives are described in the following subchapters.
DELIVERY WINDOW OPTIMIZATION
The objective of the Delivery Window Optimization initiative is the consolidation of orders in less
shipments than current ones by reducing replenishment frequency. An analysis is performed on
historical data to group orders with the same origin and destination and with a temporal distance
between delivery dates at most of 7 days. The result of such activity is a rearrangement of the number
of shipments, which the new planning will be based on.
Although at the beginning this initiative is developed for all the commodities, successively it
generates the opposition from most of the suppliers, since this approach requires a higher storage time
for the products to be shipped to the client. Even the client shows space constraints in some plants
and warehouses and, especially for this final reason, the initiative is redesigned only for product types
with a current high level of stocks, since the impact of its drawback is minimum in this case.
Therefore, the proposal is implemented only for DIM (direct inbound materials) in Czech Republic,
Romania, Greece, Poland and Lithuania. The summary of 2019 savings for this initiative is described
in table 9 below.
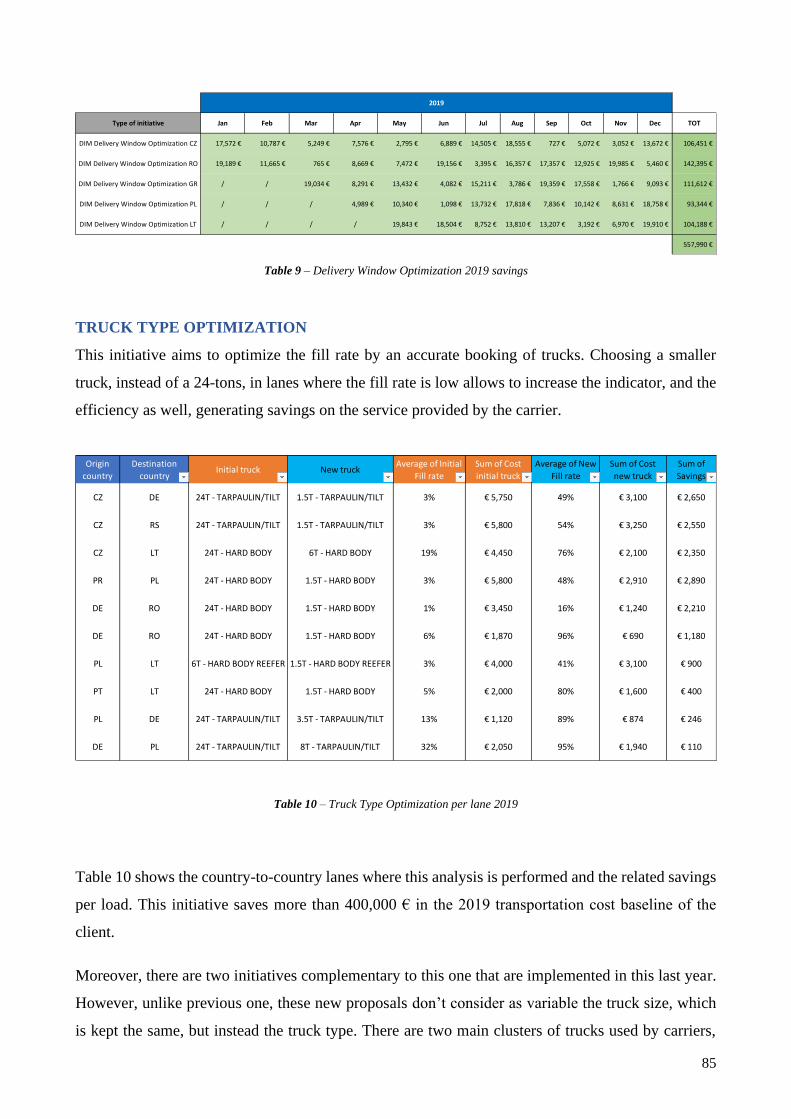
85
Table 9 – Delivery Window Optimization 2019 savings
TRUCK TYPE OPTIMIZATION
This initiative aims to optimize the fill rate by an accurate booking of trucks. Choosing a smaller
truck, instead of a 24-tons, in lanes where the fill rate is low allows to increase the indicator, and the
efficiency as well, generating savings on the service provided by the carrier.
Table 10 – Truck Type Optimization per lane 2019
Table 10 shows the country-to-country lanes where this analysis is performed and the related savings
per load. This initiative saves more than 400,000 € in the 2019 transportation cost baseline of the
client.
Moreover, there are two initiatives complementary to this one that are implemented in this last year.
However, unlike previous one, these new proposals don’t consider as variable the truck size, which
is kept the same, but instead the truck type. There are two main clusters of trucks used by carriers,
Type of initiative Jan Feb Mar Apr May Jun Jul Aug Sep Oct Nov Dec TOT
DIM Delivery Window Optimization CZ 17,572 € 10,787 € 5,249 € 7,576 € 2,795 € 6,889 € 14,505 € 18,555 € 727 € 5,072 € 3,052 € 13,672 € 106,451 €
DIM Delivery Window Optimization RO 19,189 € 11,665 € 765 € 8,669 € 7,472 € 19,156 € 3,395 € 16,357 € 17,357 € 12,925 € 19,985 € 5,460 € 142,395 €
DIM Delivery Window Optimization GR / / 19,034 € 8,291 € 13,432 € 4,082 € 15,211 € 3,786 € 19,359 € 17,558 € 1,766 € 9,093 € 111,612 €
DIM Delivery Window Optimization PL / / / 4,989 € 10,340 € 1,098 € 13,732 € 17,818 € 7,836 € 10,142 € 8,631 € 18,758 € 93,344 €
DIM Delivery Window Optimization LT / / / / 19,843 € 18,504 € 8,752 € 13,810 € 13,207 € 3,192 € 6,970 € 19,910 € 104,188 €
557,990 €
2019
Origin
country
Destination
countryInitial truck New truck
Average of Initial
Fill rate
Sum of Cost
initial truck
Average of New
Fill rate
Sum of Cost
new truck
Sum of
Savings
CZ DE 24T - TARPAULIN/TILT 1.5T - TARPAULIN/TILT 3% € 5,750 49% € 3,100 € 2,650
CZ RS 24T - TARPAULIN/TILT 1.5T - TARPAULIN/TILT 3% € 5,800 54% € 3,250 € 2,550
CZ LT 24T - HARD BODY 6T - HARD BODY 19% € 4,450 76% € 2,100 € 2,350
PR PL 24T - HARD BODY 1.5T - HARD BODY 3% € 5,800 48% € 2,910 € 2,890
DE RO 24T - HARD BODY 1.5T - HARD BODY 1% € 3,450 16% € 1,240 € 2,210
DE RO 24T - HARD BODY 1.5T - HARD BODY 6% € 1,870 96% € 690 € 1,180
PL LT 6T - HARD BODY REEFER 1.5T - HARD BODY REEFER 3% € 4,000 41% € 3,100 € 900
PT LT 24T - HARD BODY 1.5T - HARD BODY 5% € 2,000 80% € 1,600 € 400
PL DE 24T - TARPAULIN/TILT 3.5T - TARPAULIN/TILT 13% € 1,120 89% € 874 € 246
DE PL 24T - TARPAULIN/TILT 8T - TARPAULIN/TILT 32% € 2,050 95% € 1,940 € 110

86
that are the hard-body and the tarpaulin. The former has the trailer covered by a metallic surface,
while the latter has the superior part of the trailer covered by a surface made by “tarpaulin”, a large
sheet of strong, flexible, water-resistant or waterproof material, often cloth such as canvas or polyester
coated with polyurethane, or made of plastics such as polyethylene. Obviously, the hard-body is more
expensive but it assures a higher security level than the tarpaulin and, for this reason, it is required by
the client to perform finished good transportation, while tarpaulin can be used for raw material and
direct inbound material. Therefore, Accenture notices that this distinction wasn’t always respected
and helps to avoid this inconvenience for last year’s loads: in this way the Logistic Control Tower
not only assures that carriers provide the established minimum service level, but also creates savings
by spotting lanes performed by a hard-body in the past, that can be instead covered by a tarpaulin
with its lower tariff.
The other initiative concerns a similar analysis to assess the possibility to remove the freezing truck
for lanes where this requirement isn’t mandatory. Both the projects allow to save about 100,000 € in
client’s 2019 spending.
ROUNDTRIPS, MULTIDROPS AND MULTIPICKS
Firstly, it is necessary to clarify what above terms mean in the vocabulary of the project. For example,
a roundtrip is considered as the possibility to exploit a backhaul trip of an empty truck to reach a
supplier’s location and fill the truck with raw materials or direct inbound material to ship towards the
initial factory. This approach allows to avoid a non-value-added shipment, but it is possible only if
the start of the back-haul can assure the arrival in the transhipment point in a strict delivery window.
The table 11 below shows the lanes where the initiative is proposed.
Table 11 – Roundtrips 2019 analysis and forecast per lane
Roundtrip Lane Country-to-Country Average of Savings 2018 Volumes 2019 Savings Estimate
CZ_DE 537 € 75 40,275 €
CZ_DE (2) 456 € 15 6,840 €
CZ_NL 858 € 15 12,870 €
CZ_RO 590 € 31 18,290 €
DE_LT 479 € 25 11,975 €
DE_PL 634 € 60 38,040 €
LT_CZ 383 € 12 4,596 €
LT_DE 379 € 25 9,475 €
PL_CZ 608 € 80 48,640 €
PL_DE 514 € 60 30,840 €
RO_CZ 560 € 31 17,360 €
239,201 €
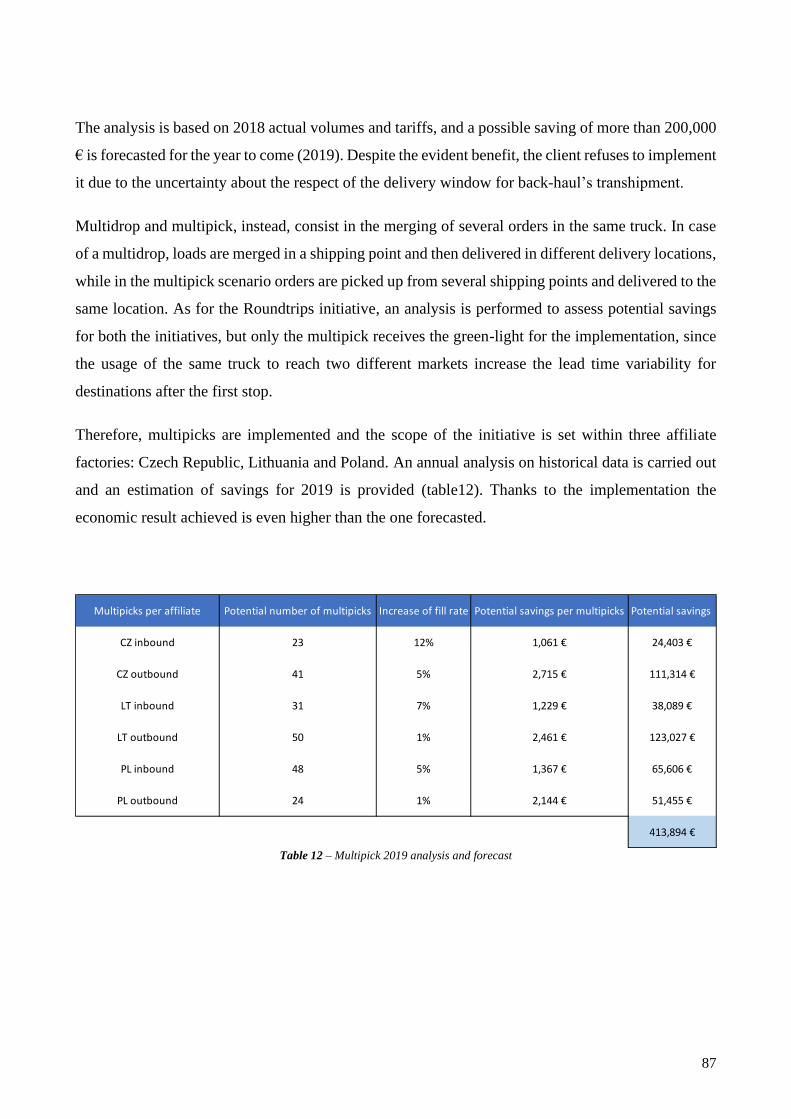
87
The analysis is based on 2018 actual volumes and tariffs, and a possible saving of more than 200,000
€ is forecasted for the year to come (2019). Despite the evident benefit, the client refuses to implement
it due to the uncertainty about the respect of the delivery window for back-haul’s transhipment.
Multidrop and multipick, instead, consist in the merging of several orders in the same truck. In case
of a multidrop, loads are merged in a shipping point and then delivered in different delivery locations,
while in the multipick scenario orders are picked up from several shipping points and delivered to the
same location. As for the Roundtrips initiative, an analysis is performed to assess potential savings
for both the initiatives, but only the multipick receives the green-light for the implementation, since
the usage of the same truck to reach two different markets increase the lead time variability for
destinations after the first stop.
Therefore, multipicks are implemented and the scope of the initiative is set within three affiliate
factories: Czech Republic, Lithuania and Poland. An annual analysis on historical data is carried out
and an estimation of savings for 2019 is provided (table12). Thanks to the implementation the
economic result achieved is even higher than the one forecasted.
Table 12 – Multipick 2019 analysis and forecast
Multipicks per affiliate Potential number of multipicks Increase of fill rate Potential savings per multipicks Potential savings
CZ inbound 23 12% 1,061 € 24,403 €
CZ outbound 41 5% 2,715 € 111,314 €
LT inbound 31 7% 1,229 € 38,089 €
LT outbound 50 1% 2,461 € 123,027 €
PL inbound 48 5% 1,367 € 65,606 €
PL outbound 24 1% 2,144 € 51,455 €
413,894 €

88
Table 13 – Multipick 2019 savings
LTL
LTL means “Less than full Truck Load” and consists in the rent of space in a truck performing a
certain shipment. The vehicle is no more dedicated to a single customer, like in the FTL case (Full
Truck Load), and obviously this type of transportation is possible only for a limited number of pallets,
but it is characterized by lower tariffs. JDA’s TMS can manage both FTL and LTL, since it can
optimize the transportation considering the fill rate and proposing an LTL shipment to the planner if
the indicator is lower than a certain threshold.
The figure 22 shows the current logistic digital platforms available on the market, which match
client’s demand of shipments with carrier’s offer. They are split in three different clusters, that are
the transportation types they can manage, while the vertical axis describes their ranking considering
clients’ adoption.
Figure 22 – Logistic platforms split by transportation type
Type of initiative Jan Feb Mar Apr May Jun Jul Aug Sep Oct Nov Dec TOT
Multipick CZ inbound 7,473 € 5,030 € 5,342 € 9,809 € 6,033 € 5,863 € 8,086 € 5,966 € 8,492 € 10,783 € 11,038 € 11,868 € 95,783 €
Multipick CZ outbound 5,923 € 8,819 € 9,807 € 9,287 € 7,943 € 9,634 € 8,938 € 7,847 € 8,908 € 8,908 € 8,908 € 5,175 € 100,097 €
Multipick LT inbound / 6,681 € 5,797 € 6,165 € 6,617 € 8,530 € 9,739 € 8,701 € 6,115 € 9,576 € 10,698 € 11,577 € 90,196 €
Multipick LT outbound / / / 5,028 € 9,306 € 6,768 € 8,990 € 8,201 € 10,463 € 5,960 € 9,987 € 10,602 € 75,305 €
Multipick PL inbound / / / 6,907 € 6,314 € 7,118 € 6,591 € 8,424 € 9,873 € 7,962 € 5,832 € 5,361 € 64,382 €
Multipick PL outbound / / / / 6,490 € 9,734 € 7,253 € 9,748 € 5,348 € 7,166 € 11,436 € 8,377 € 65,552 €
491,315 €
2019
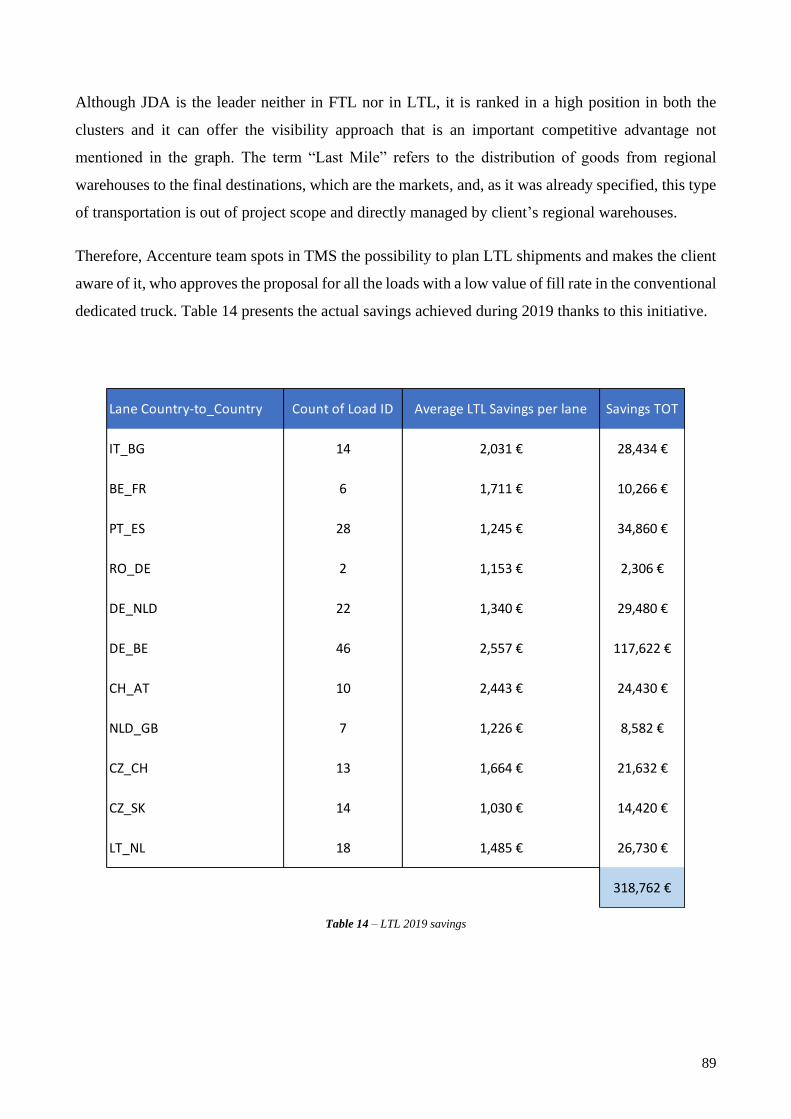
89
Although JDA is the leader neither in FTL nor in LTL, it is ranked in a high position in both the
clusters and it can offer the visibility approach that is an important competitive advantage not
mentioned in the graph. The term “Last Mile” refers to the distribution of goods from regional
warehouses to the final destinations, which are the markets, and, as it was already specified, this type
of transportation is out of project scope and directly managed by client’s regional warehouses.
Therefore, Accenture team spots in TMS the possibility to plan LTL shipments and makes the client
aware of it, who approves the proposal for all the loads with a low value of fill rate in the conventional
dedicated truck. Table 14 presents the actual savings achieved during 2019 thanks to this initiative.
Table 14 – LTL 2019 savings
Lane Country-to_Country Count of Load ID Average LTL Savings per lane Savings TOT
IT_BG 14 2,031 € 28,434 €
BE_FR 6 1,711 € 10,266 €
PT_ES 28 1,245 € 34,860 €
RO_DE 2 1,153 € 2,306 €
DE_NLD 22 1,340 € 29,480 €
DE_BE 46 2,557 € 117,622 €
CH_AT 10 2,443 € 24,430 €
NLD_GB 7 1,226 € 8,582 €
CZ_CH 13 1,664 € 21,632 €
CZ_SK 14 1,030 € 14,420 €
LT_NL 18 1,485 € 26,730 €
318,762 €

90
PROCUREMENT
Lastly, the most profitable continuous improvement initiative is the one related to the tendering
activity. Accenture commits to renegotiating the rates of lanes with carriers at the beginning of every
year of the contract in order to obtain more convenient prices for the client, exploiting its expertise in
the sector from similar projects. Obviously, tendered price is different than actual one, that will take
place in the year to come, however carriers usually respect the planned tariff and if this doesn’t
happen, Accenture can notice if they require extra-costs for their lanes, informing the client about
their non-collaborative behaviour.
Table 15 – Procurement Contribution 2019 savings
LANE COUNTRY-TO-COUNTRY Average of FTL RATE 2019 Average of FY 2018 BASELINE Average of DELTA RATE FOR 2019 TOT VOLUMES TOT SAVINGS
DE_LT 681 € 829 € 148 € 760 101,290 €
CZ_NL 1,094 € 1,245 € 152 € 544 91,522 €
DE_BE 998 € 1,140 € 141 € 415 77,993 €
DE_PL 474 € 501 € 27 € 1941 64,428 €
CZ_BE 1,268 € 1,329 € 61 € 441 64,057 €
DE_RO 1,284 € 1,387 € 103 € 484 51,015 €
BE_PL 826 € 883 € 58 € 759 42,165 €
DE_NL 976 € 1,074 € 98 € 350 40,024 €
NL_LT 1,019 € 1,140 € 121 € 809 39,514 €
ES_LT 1,424 € 1,922 € 499 € 84 39,104 €
BE_CZ 839 € 933 € 94 € 566 38,794 €
DE_GR 2,468 € 2,712 € 244 € 161 37,032 €
PL_BE 1,535 € 1,635 € 100 € 361 35,922 €
DE_CZ 441 € 503 € 62 € 828 33,424 €
TR_LT 2,180 € 2,842 € 662 € 54 30,187 €
PL_CZ 480 € 531 € 51 € 617 29,621 €
PL_LT 553 € 730 € 177 € 185 28,941 €
PL_NL 1,223 € 1,251 € 28 € 1131 26,197 €
BE_IT 1,271 € 1,425 € 154 € 168 25,801 €
BE_LT 1,176 € 1,255 € 78 € 498 22,583 €
CZ_DE 363 € 455 € 92 € 314 21,219 €
LT_SE 2,277 € 2,371 € 94 € 217 20,337 €
TR_PL 1,590 € 2,127 € 537 € 43 19,421 €
CZ_PT 2,159 € 2,547 € 388 € 92 18,489 €
ES_PL 1,289 € 1,342 € 54 € 213 17,851 €
CZ_LT 740 € 850 € 110 € 221 15,931 €
PL_DE 643 € 667 € 24 € 345 15,177 €
PT_CZ 1,693 € 2,153 € 460 € 115 14,519 €
PT_LT 2,377 € 2,616 € 240 € 62 11,755 €
1,074,312 €

91
KPIs MONITORING
As previously defined in the Accenture’s proposal subchapter, the main aims of the Logistic Control
Tower are the guarantee of visibility, the continuous improvement and the logistic support. The tools
that allows the fulfilment of such objectives are respectively the TMS, the analytical capabilities in
developing the continuous improvement initiatives and the complete accountability of transport
planning and execution. Although JDA’s TMS is a very complete platform which provides all data
needed to assure the visibility required, it is not enough to assure just by itself the concept of visibility.
Indeed, the information on it are reported with the higher possible level of detail, that is per load id,
and a re-elaboration of these data is mandatory in order to have a general overview about
performances of carriers and affiliates.
For this reason, the client requests Accenture to develop metrics in order to decrease TMS’s level of
detail. According to the 4PL approach, the Logistic Control Tower becomes accountable for KPIs
constant computation and monitoring on behalf of the client.
Figure 23 – Example of KPIs identification decision tree

92
The process, which the LCT must follow, include the following steps:
• Assessment of “As Is” metrics and reporting methodology;
• Identification of new relevant metrics considering the whole value-generation chain;
• Metrics validation and their placement along the process;
• Development of a dashboard template to be sent to the client or to be analysed in order to get
insights;
• Monthly update of KPIs and sharing to all the affiliates and to client’s headquarters;
The client has two main requirements: from one side he wants to have metrics describing each plants,
in order to have complete visibility from the geographical perspective, and from the other KPIs must
monitor performances of the specific carriers, considering all the affiliates of the holding company,
in order to verify if requirements of SLA10 are met.
The KPIs identification isn’t a one-time event, but it is itself a continuous improvement process.
Indeed, KPIs computation and sharing with the client on a regular basis facilitate their review, in
order to better adapt them to the actual situation, and their alignment to client’s requirements to assess
new dimensions. This approach allows a mutual collaboration to spot root causes behind poor
performances and to take corrective actions on time.
Obviously, KPIs dimensions are the ones on scope of the projects: all the transportation phase can be
monitored with metrics, since Accenture has access to this type of data on the TMS and also on SAP,
where some external user accounts are created for Accenture’s team and transaction codes are shared
in order to guarantee the extraction of in-scope information and their exploitation for analytics.
Unfortunately, the whole part connected to the inventory level is out of the project scope, therefore
key performances indicators such as warehouse cost and inventory turnover can’t be included in the
dashboard.
For the KPIs implementation the software Power BI is chosen to structure metrics and group them in
dashboards, each one dedicated to a specific dimension. It is a business analytics service offered by
Microsoft and it provides interactive visualizations and business intelligence capabilities through a
user-friendly interface. It imports master data from excel files and, if the documents include
cumulated numbers over time, the application’s view can be refreshed, and it can show information
about last period as well as historical trends. The main features that differentiate it to similar
applications are the high accessibility, thanks to the possibility to upload reports in the dedicated
10 “SLA” means “Service Level Agreement”
93
cloud storage, and the dynamic filtering, which consists in the possibility of applying a certain filter
in all the dashboard just by clicking the related dimension of a KPI on which the deep-dive analysis
is focused.
Therefore, the Power BI model is split in two different documents, one dedicated to the performance
description from an affiliate perspective, while the other presents results grouped by carrier. The
master data imported in the systems are mainly two extractions, one from SAP, more related to
information about shipped products, and the other from TMS, which includes raw data to compute
carriers’ performances. The main integration issue of these two databases is the fact that they differ
on the data granularity, since the extraction from TMS has delivery notes as rows, while the extraction
from SAP has loads as rows. This means that data from SAP has a higher level of detail, since a
delivery note is a document associated to a shipped material and a load can be composed by several
delivery notes. Despite this last consideration, a delivery note can be associated to two different
shipments, for example in case of a pre-carriage11 which anticipates a sea transportation.
KPIs for affiliates are the following ones:
• Contractual Fill Rate
• Physical Fill Rate
• Shipment created
• Delivery created
• On time shipments
• Re-planned shipments
Instead, indicators for carriers’ performance are:
• Pick up on Date
• Delivery on Date
• Acceptance on Time
• €/km
• Tender Rejected
Accenture and the client decide to update the two reports on a monthly basis and to share them to the
specific plants and carriers in a pdf format, filtering on their specific performance in order to avoid
11 A “pre-carriage” is the transportation of a container by road or train from an in-land shipping point to a port in order
to be loaded in a vessel

94
the spread of sensitive data among suppliers. Only the client headquarters have the direct accessibility
to both the reports in Power BI format.
CONTRACTUAL AND PHYSICAL FILL RATE
The Fill Rate is the percentage that describes the volume covered by shipped goods over the total
available volume of the truck dedicated to freight. Two types of Fill Rate are identified: the
Contractual Fill Rate and the Physical Fill Rate. The former can be considered as the nominal fill rate,
since it describes the percentage of the total volume covered by goods in an “as usual” scenario, that
consists in an FTL shipment with a 24-tons truck. The Physical Fill Rate, instead, considers the real
size of the truck which performs the shipment, that can be a 24-tons, 8-tons, 6-tons, 3.5-tons, 1.5-tons
truck or even a van.
The computation of the Contractual Fill Rate indicator is organized in several steps. Firstly, the
number of pallets per delivery note is obtained by dividing the amount of materials over a conversion
factor, which depends on the material and pallet type.
#𝑃𝑎𝑙𝑙𝑒𝑡𝑠
𝐷𝑁=
𝐴𝑚𝑜𝑢𝑛𝑡
𝐷𝑁 ∗ 𝐶𝑜𝑛𝑣𝑒𝑟𝑠𝑖𝑜𝑛 𝑓𝑎𝑐𝑡𝑜𝑟
The latter can be a euro-pallet (EUR) or an industrial pallet (INDU) and the result of the division is
rounded up. The number of pallets obtained from this procedure can differ from the actual one by
some units, but it still considered a good estimate. Obviously, this step is completely useless and
counterproductive in the case the actual number of pallets is already given by the database. Therefore,
the number of pallets per shipment is equal to the sum of pallets of the delivery notes included in the
load, multiplied by the stackable factor, which defines how many pallets can be vertically distributed.
#𝑃𝑎𝑙𝑙𝑒𝑡𝑠
𝑆ℎ𝑖𝑝𝑚𝑒𝑛𝑡= 𝛴[𝑅𝑜𝑢𝑛𝑑𝑢𝑝 (
#𝑃𝑎𝑙𝑙𝑒𝑡𝑠
𝐷𝑁)] ∗ 𝑆𝑡𝑎𝑐𝑘𝑎𝑏𝑙𝑒 𝑓𝑎𝑐𝑡𝑜𝑟
Finally, the Contractual Fill Rate is obtained by simply dividing the obtained number of pallets per
shipment by the maximum number of pallets that can be loaded in a 24-tons truck.
𝐶𝑜𝑛𝑡𝑟𝑎𝑐𝑡𝑢𝑎𝑙 𝐹𝑖𝑙𝑙 𝑅𝑎𝑡𝑒 =
#𝑃𝑎𝑙𝑙𝑒𝑡𝑠𝑆ℎ𝑖𝑝𝑚𝑒𝑛𝑡
𝑀𝑎𝑥(#𝑃𝑎𝑙𝑙𝑒𝑡𝑠
𝑆ℎ𝑖𝑝𝑚𝑒𝑛𝑡)

95
Figure 24 – Contractual Fill rate by Affiliate
Figure 24 shows the results of such KPI for the fiscal year 2019 and the minimum and expected
targets defined by the client for his affiliates (75% and 85% respectively). Despite this convention, a
low fill rate value doesn’t always mean a bad performance: for instance, Greece and Romania have a
low Contractual Fill Rate, but it is due to the type of products they produce, since they have particular
requirements and the client request not to ship them together to other materials.
The Physical Fill Rate considers the actual truck used to perform the shipment. In order to obtain such
measure, a conversion table is created to derive it from the Contractual Fill Rate value.
Size of truck 𝑉𝑜𝑙𝑢𝑚𝑒 𝑋𝑇
𝑉𝑜𝑙𝑢𝑚𝑒 24𝑇
1.5T 6.3%
3.5T 14.6%
6T 25.1%
8T 33.1%
24T 100.0%
Table 16 – Trucks Volume Conversion table
𝑃ℎ𝑦𝑠𝑖𝑐𝑎𝑙 𝐹𝑖𝑙𝑙 𝑅𝑎𝑡𝑒 =𝐶𝑜𝑛𝑡𝑟𝑎𝑐𝑡𝑢𝑎𝑙 𝐹𝑖𝑙𝑙 𝑅𝑎𝑡𝑒
(𝑉𝑜𝑙𝑢𝑚𝑒 𝑋𝑇
𝑉𝑜𝑙𝑢𝑚𝑒 24𝑇)

96
The figure 25 shows the comparison between the two indicators during all months of 2019.
Obviously, the Physical Fill Rate assume always values at least equal or higher than the Contractual
one. All the months have a Physical Fill Rate higher than 80%, while before the project start it was
lower than 70%. This is a clear proof of the improvement the Logistic Control Tower delivers with
its initiatives, such as the Truck Type Optimization one.
Figure 25 – Contractual Fill Rate vs Physical Fill Rate
SHIPMENTS AND DELIVERS CREATED
Performance of affiliates are monitored even on volumes and they are classified per product,
inbound/outbound flow and time. The total number of shipments and delivery notes are counted
during 2019 (figure 26). The products sold is a consumer goods and it is characterized by a demand
with a seasonality index close to zero. This is clear from the two visuals below, where the volumes
of shipments and delivery notes follow a constant trend.

97
Figure 26 – Shipment and Delivery Note volumes
ON TIME SHIPMENTS
Although the name of this KPIs seems to be connected to the carriers’ performance, it is related to the affiliates’
one, since it measures the capability of client’s factories to respect the planning carried out by the Accenture
team. Two different scenarios are analysed: Goods Issue and Goods Receipt. The former is defined as a
physical outbound movement of materials from the warehouse (or factory as in this case), while the latter is a
physical inbound movement of materials to the warehouse. Every time a Goods Issue is performed the time
and date is recorded on the TMS system and the same happens for the Good Receipt. If the Goods Issue or the
Goods Receipt takes place within two days from the planned date by the planner, the load is considered “On
Time”, otherwise not.
Figure 27 – On Time Shipments by Affiliate
Considering the annual shipment volumes, except for Netherlands, all the affiliates are within the
acceptable interval and Portugal and Czech Republic even manage to overcome the expected target
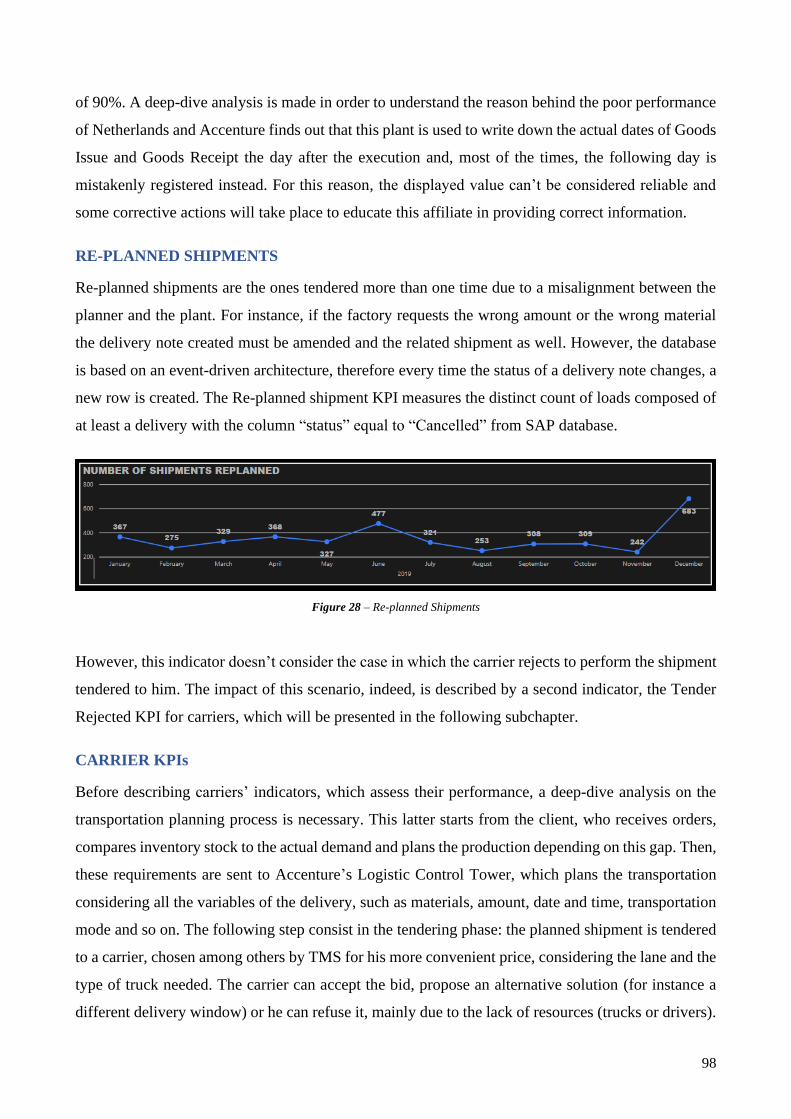
98
of 90%. A deep-dive analysis is made in order to understand the reason behind the poor performance
of Netherlands and Accenture finds out that this plant is used to write down the actual dates of Goods
Issue and Goods Receipt the day after the execution and, most of the times, the following day is
mistakenly registered instead. For this reason, the displayed value can’t be considered reliable and
some corrective actions will take place to educate this affiliate in providing correct information.
RE-PLANNED SHIPMENTS
Re-planned shipments are the ones tendered more than one time due to a misalignment between the
planner and the plant. For instance, if the factory requests the wrong amount or the wrong material
the delivery note created must be amended and the related shipment as well. However, the database
is based on an event-driven architecture, therefore every time the status of a delivery note changes, a
new row is created. The Re-planned shipment KPI measures the distinct count of loads composed of
at least a delivery with the column “status” equal to “Cancelled” from SAP database.
Figure 28 – Re-planned Shipments
However, this indicator doesn’t consider the case in which the carrier rejects to perform the shipment
tendered to him. The impact of this scenario, indeed, is described by a second indicator, the Tender
Rejected KPI for carriers, which will be presented in the following subchapter.
CARRIER KPIs
Before describing carriers’ indicators, which assess their performance, a deep-dive analysis on the
transportation planning process is necessary. This latter starts from the client, who receives orders,
compares inventory stock to the actual demand and plans the production depending on this gap. Then,
these requirements are sent to Accenture’s Logistic Control Tower, which plans the transportation
considering all the variables of the delivery, such as materials, amount, date and time, transportation
mode and so on. The following step consist in the tendering phase: the planned shipment is tendered
to a carrier, chosen among others by TMS for his more convenient price, considering the lane and the
type of truck needed. The carrier can accept the bid, propose an alternative solution (for instance a
different delivery window) or he can refuse it, mainly due to the lack of resources (trucks or drivers).

99
The following picture traces all the phases of the transportation planning processes split by
accountability.
Figure 29 – Transportation planning process
The first performance indicator in order of time is the Acceptance on Time. This KPI measures
carrier’s compliance in responding to the tender of a load within two days, that is the contractual
threshold. Beyond this time frame of 48h the acceptance is considered late and a second notification
is sent to re-tender the load. If even this latter doesn’t receive any answer, the load is tendered to the
back-up carrier of that lane.
In case of a rejection, the Tender Rejected KPI traces it at the same time of the Acceptance on Time.
As already explained in the previous subchapter, it monitors the percentage of times the carrier rejects
to perform the load tendered to him. The rejection can take place both during the on-time phase and
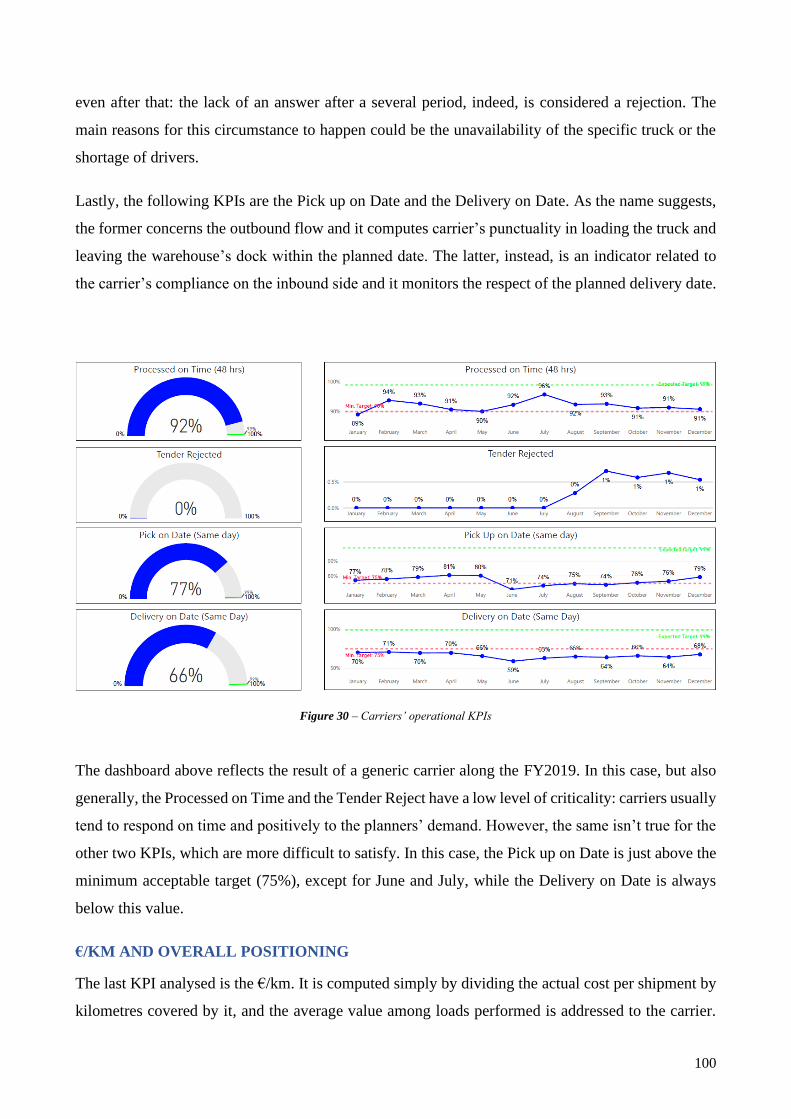
100
even after that: the lack of an answer after a several period, indeed, is considered a rejection. The
main reasons for this circumstance to happen could be the unavailability of the specific truck or the
shortage of drivers.
Lastly, the following KPIs are the Pick up on Date and the Delivery on Date. As the name suggests,
the former concerns the outbound flow and it computes carrier’s punctuality in loading the truck and
leaving the warehouse’s dock within the planned date. The latter, instead, is an indicator related to
the carrier’s compliance on the inbound side and it monitors the respect of the planned delivery date.
Figure 30 – Carriers’ operational KPIs
The dashboard above reflects the result of a generic carrier along the FY2019. In this case, but also
generally, the Processed on Time and the Tender Reject have a low level of criticality: carriers usually
tend to respond on time and positively to the planners’ demand. However, the same isn’t true for the
other two KPIs, which are more difficult to satisfy. In this case, the Pick up on Date is just above the
minimum acceptable target (75%), except for June and July, while the Delivery on Date is always
below this value.
€/KM AND OVERALL POSITIONING
The last KPI analysed is the €/km. It is computed simply by dividing the actual cost per shipment by
kilometres covered by it, and the average value among loads performed is addressed to the carrier.
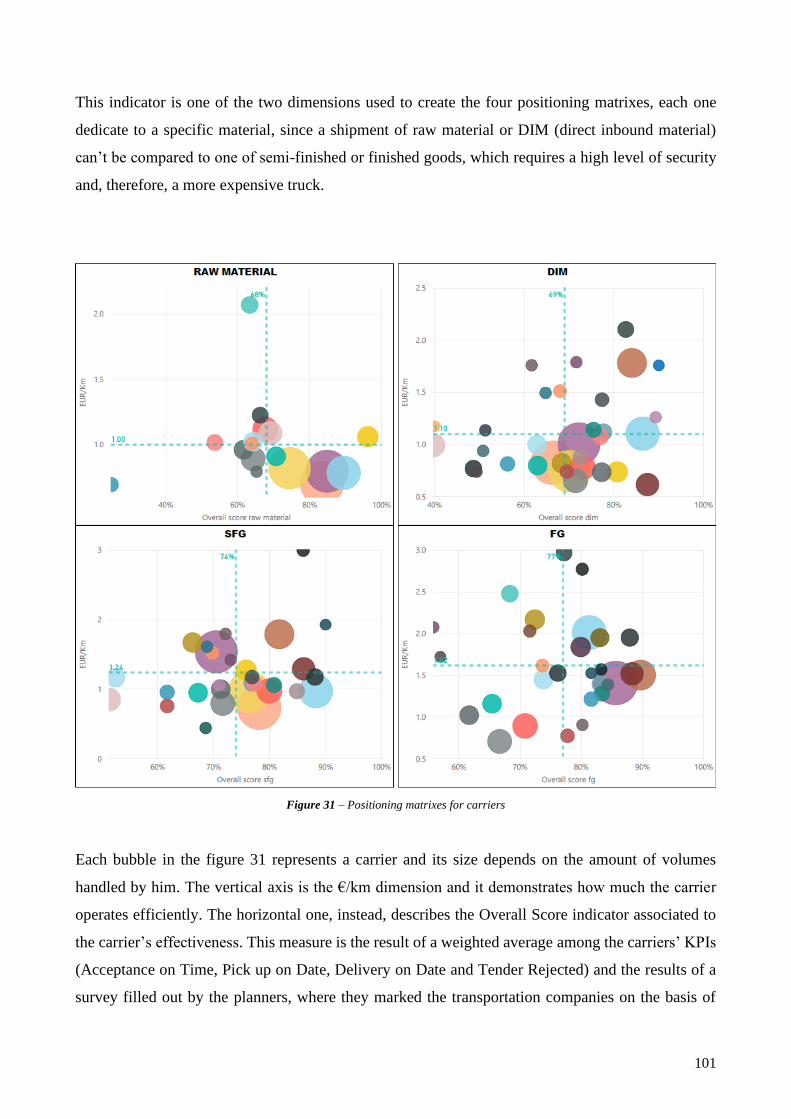
101
This indicator is one of the two dimensions used to create the four positioning matrixes, each one
dedicate to a specific material, since a shipment of raw material or DIM (direct inbound material)
can’t be compared to one of semi-finished or finished goods, which requires a high level of security
and, therefore, a more expensive truck.
Figure 31 – Positioning matrixes for carriers
Each bubble in the figure 31 represents a carrier and its size depends on the amount of volumes
handled by him. The vertical axis is the €/km dimension and it demonstrates how much the carrier
operates efficiently. The horizontal one, instead, describes the Overall Score indicator associated to
the carrier’s effectiveness. This measure is the result of a weighted average among the carriers’ KPIs
(Acceptance on Time, Pick up on Date, Delivery on Date and Tender Rejected) and the results of a
survey filled out by the planners, where they marked the transportation companies on the basis of
102
collaboration. The finished goods’ Overall Score takes also into account the results of TAPA12 audits,
that are performed on carrier’s trucks to assess their compliance to the requirements needed to ship
such materials. Average values are used as a benchmark to spot carriers with high performance in
terms of efficiency (below the horizontal €/km average line) and in terms of effectiveness (on the
right of the vertical Overall Score average line) or to alert ones with low ranks.
SHIPPEO PARTNERSHIP
As already explained, the initial implementation phase ends in 2017, however other changes in the
project structure have been taken place even successively. Thanks to the positive results of previous
years, in 2019 the scope of the project is increased to include also the new product categories and the
new plants. The most remarkable innovations are the introduction of INTTRA, a platform able to
standardize the ocean booking process for several main shipping lines, and Shippeo, a platform which
provides real-time tracking of trucks increasing the data accuracy for KPIs computation. This chapter
is completely dedicated to the latter, since the ocean transportation is not considered as critical as the
road one for this project.
THE COMPANY
Founded in 2014 as a start-up, Shippeo nowadays tracks more than 5M deliveries per year throughout
Europe for market-leading companies such as Leroy Merlin, Saint-Gobain, and Faurecia, and
connects to more than 140,000 carriers (Shippeo, 2019). Shippeo helps leading Supply Chains
leverage transportation to deliver exceptional customer service and achieve operational excellence.
Its real-time transport visibility platform provides shippers, carriers and 4PLs instant tracking of every
delivery, and enables proactive communication with end-customers.
Shippeo’s mission consists in giving market-leading companies instant access to predictive and real-
time information of every delivery. Its proprietary machine-learning ETA algorithm accurately
calculates arrival times allowing companies to quickly anticipate problems, proactively alert
customers, and efficiently manage exceptions. Shippeo’s offers is based on 4 main pillars:
• Adopt the multichannel approach) Shippeo connects to all data sources to aggregate real-time
information and instantly surface it in the platform. The dedicated in-house teams will help
the client and his carriers smoothly onboard onto Shippeo, ensuring project's success.
• Quickly anticipate and manage exceptions) Shippeo's machine-learning proprietary ETA
algorithm allows to quickly and accurately anticipate problems, help to efficiently manage
12 “TAPA” is the “Transported Asset Protection Association”
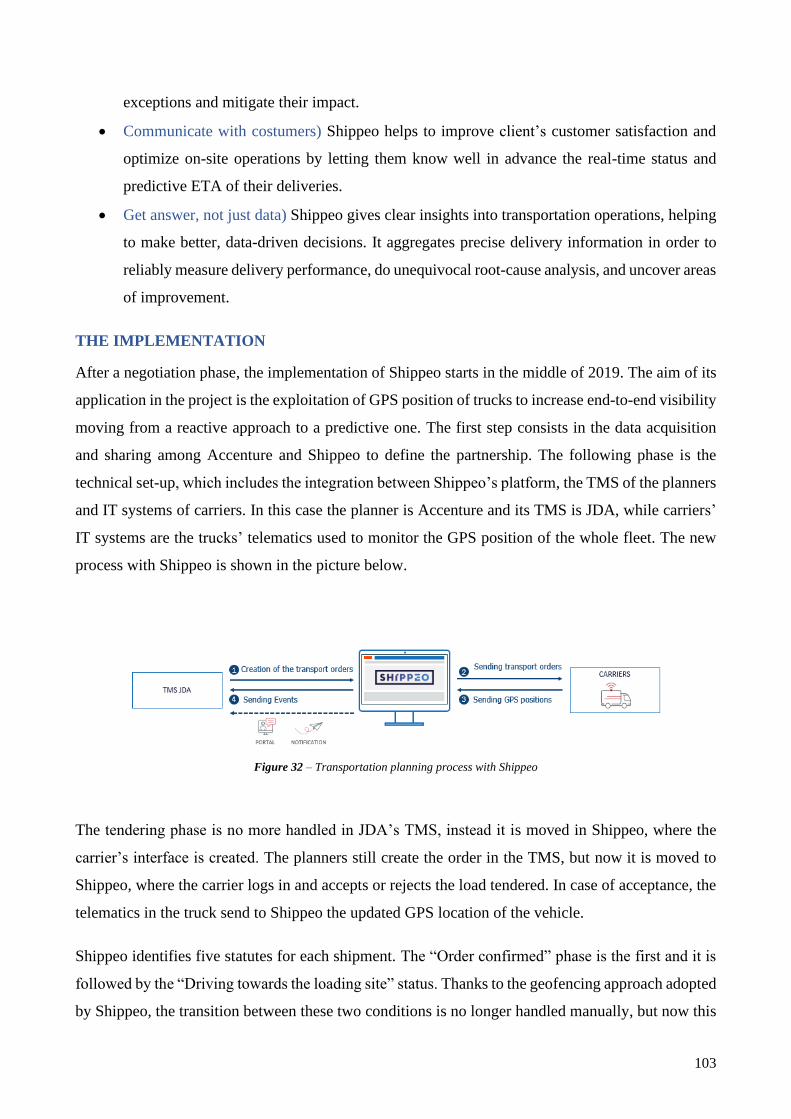
103
exceptions and mitigate their impact.
• Communicate with costumers) Shippeo helps to improve client’s customer satisfaction and
optimize on-site operations by letting them know well in advance the real-time status and
predictive ETA of their deliveries.
• Get answer, not just data) Shippeo gives clear insights into transportation operations, helping
to make better, data-driven decisions. It aggregates precise delivery information in order to
reliably measure delivery performance, do unequivocal root-cause analysis, and uncover areas
of improvement.
THE IMPLEMENTATION
After a negotiation phase, the implementation of Shippeo starts in the middle of 2019. The aim of its
application in the project is the exploitation of GPS position of trucks to increase end-to-end visibility
moving from a reactive approach to a predictive one. The first step consists in the data acquisition
and sharing among Accenture and Shippeo to define the partnership. The following phase is the
technical set-up, which includes the integration between Shippeo’s platform, the TMS of the planners
and IT systems of carriers. In this case the planner is Accenture and its TMS is JDA, while carriers’
IT systems are the trucks’ telematics used to monitor the GPS position of the whole fleet. The new
process with Shippeo is shown in the picture below.
Figure 32 – Transportation planning process with Shippeo
The tendering phase is no more handled in JDA’s TMS, instead it is moved in Shippeo, where the
carrier’s interface is created. The planners still create the order in the TMS, but now it is moved to
Shippeo, where the carrier logs in and accepts or rejects the load tendered. In case of acceptance, the
telematics in the truck send to Shippeo the updated GPS location of the vehicle.
Shippeo identifies five statutes for each shipment. The “Order confirmed” phase is the first and it is
followed by the “Driving towards the loading site” status. Thanks to the geofencing approach adopted
by Shippeo, the transition between these two conditions is no longer handled manually, but now this

104
procedure is completely automated. The geofencing consists in the use of GPS or RFID technology
to create a virtual geographic perimeter, enabling software to trigger a response when a mobile device
enters or leaves this area. In this case, a geofence area is built around the shipping location in order
to automatically update the status when the carrier arrives there (“At loading site” status), picks up
the load and starts the shipment (“Driving towards delivery site”). Finally, the geofence area
dedicated to the destination point detects when the truck reaches the location (“At delivery site”).
Although TMS has different statuses, the integration of the two platforms makes possible the
synchronization between before-mentioned phases in Shippeo and the two main temporal information
in TMS, which are the “Driver check-in” and the “Driver check-out”.
Figure 33 – Transport statutes and geofencing in Shippeo
Moreover, the Map view enables users to have a nice and quick overview of overall shipments in
progress (figure 34). There are three types of trucks that can appear in the map:
• Red truck: it is delaying according to ETA (expected arrival time).
• Blue truck: it is on time or it is even anticipating the arrival time according to ETA.
• Grey truck: the mean position is not accurately tracked. Shippeo does not receive GPS signal
from more than one hour and the position in the map is the last received one by the system.
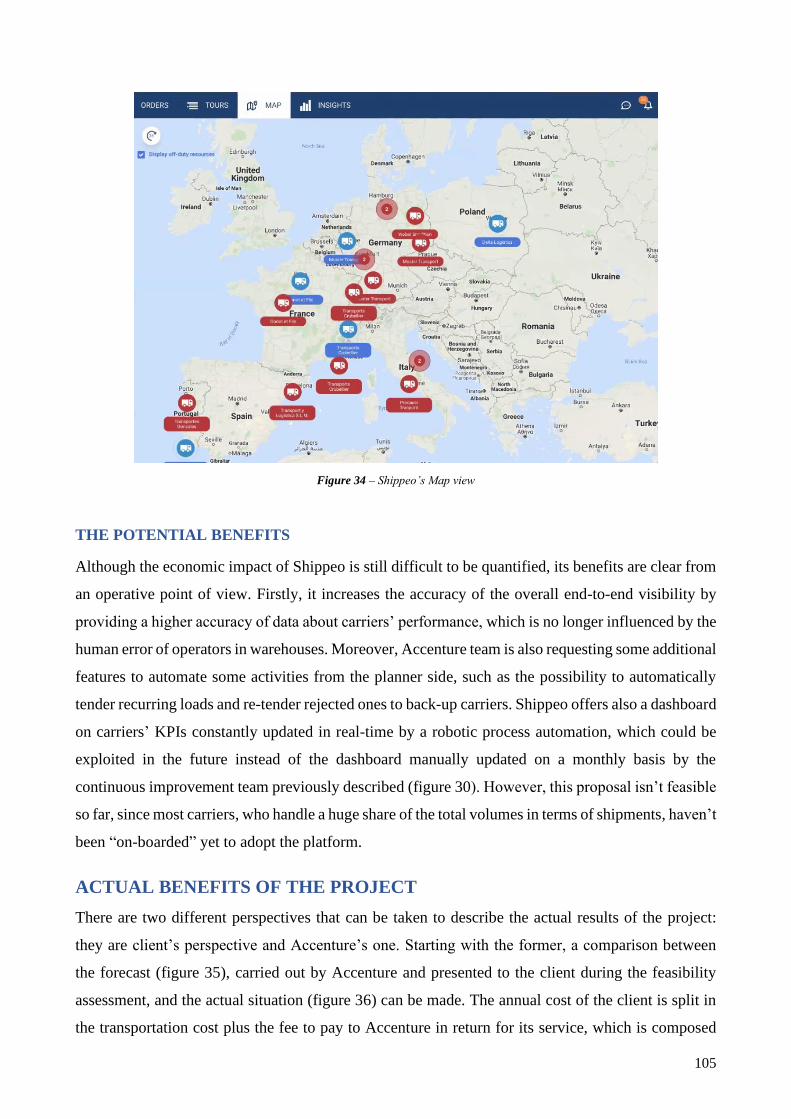
105
Figure 34 – Shippeo’s Map view
THE POTENTIAL BENEFITS
Although the economic impact of Shippeo is still difficult to be quantified, its benefits are clear from
an operative point of view. Firstly, it increases the accuracy of the overall end-to-end visibility by
providing a higher accuracy of data about carriers’ performance, which is no longer influenced by the
human error of operators in warehouses. Moreover, Accenture team is also requesting some additional
features to automate some activities from the planner side, such as the possibility to automatically
tender recurring loads and re-tender rejected ones to back-up carriers. Shippeo offers also a dashboard
on carriers’ KPIs constantly updated in real-time by a robotic process automation, which could be
exploited in the future instead of the dashboard manually updated on a monthly basis by the
continuous improvement team previously described (figure 30). However, this proposal isn’t feasible
so far, since most carriers, who handle a huge share of the total volumes in terms of shipments, haven’t
been “on-boarded” yet to adopt the platform.
ACTUAL BENEFITS OF THE PROJECT
There are two different perspectives that can be taken to describe the actual results of the project:
they are client’s perspective and Accenture’s one. Starting with the former, a comparison between
the forecast (figure 35), carried out by Accenture and presented to the client during the feasibility
assessment, and the actual situation (figure 36) can be made. The annual cost of the client is split in
the transportation cost plus the fee to pay to Accenture in return for its service, which is composed

106
by a fix amount of 1.2 M€/year plus a 0.3 M€/year in case of a reduction of at least 2M€ from last
year spending.
Figure 35 - Planned total transportation cost
Although Accenture’s analysis has underestimated the impact of Y113, when the implementation takes
place, the good work of Accenture is evident from the value of savings created, more than 18 M€ in
just 4 year (the fifth is on-going and not analysed in the “actual” part) considering the base case of 75
M€/year of Y0. Although the decreasing trend in absolute value wasn’t reconfirmed in the last year
(2019), the transportation cost per shipment moved from 1,253 €/load in Y0 to 1,185 €/load in Y4.
Figure 36 – Actual total transportation cost
13 “Y0” is 2015, therefore “Y1” is 2016 and so on
7572.7
68.966.8
65.2 64
0 1.5
1.5
1.51.2
1.2
7574.2
70.4 68.3
66.465.2
0 0.8
5.4
12.1
20.7
30.5
0
5
10
15
20
25
30
35
58
60
62
64
66
68
70
72
74
76
Y0 Y1 Y2 Y3 Y4 Y5
Planned Total Transportation Cost (M€)
Year End Transp Cost Accenture fee
Total Client's Cost Tot Savings cumulated
75 74.5 70.2
65.2 66.6
0
1.2
1.5
1.51.2
75 75.7
71.7
66.767.8
0 -0.7
2.6
10.9
18.1
-5
0
5
10
15
20
58
60
62
64
66
68
70
72
74
76
78
Y0 Y1 Y2 Y3 Y4
Actual Total Transportation Cost (M€)
Year End Transp Cost Accenture fee
Total Client's Cost Tot Savings cumulated

107
The chart in the figure 37 considers Accenture’s perspective. From its revenues, which corresponds
to the orange stacked column of previous chart, the expenses of the projects are subtracted to obtain
the operating profit and the cumulated value per year. The main cost item is the personnel cost, since
an average of 15 employees, mainly business analysists and few consultants, are completely dedicated
to the projects due to the high workload of the planning phase. The other expenses consist in the
annual rental fees for the informatic systems outside the organization, which are JDA’s TMS and
Shippeo. There is a huge difference between the two tariffs since Shippeo is an emerging reality,
while TMS is one of the leaders in the market of transportation software. All the costs are assumed
constant for sake of simplicity and the only actual variable is the margin related to the bonus of year-
over-year improvement (0.3 M€/year).
Figure 37 – Accenture’s profit from the project
CONCLUSIONS AND FOLLOW UPS
The project is an evident proof of the advantages which can be exploited by adopting a 4PL approach
with a service provider, as Accenture, able to shape the new transportation model leveraging on
innovation and visibility. Nowadays, the firms which want to reach an operational excellence must
rely on decisions based on historical and real-time monitoring of performance, on the live access to
these data and on the analytical capability of interpreting them and getting insights from their analysis.
Despite the simplicity of a 3PL approach, it doesn’t assure before-mentioned features, because in this
case only the transport execution is outsourced, while its management is always up to the firm, which
0.52
0.82 0.82
0.52
0.43
0.43 0.43
0.43
0.19
0.19 0.19
0.190.06
0.06 0.06
0.06
1.2
1.5 1.5
1.2
0.52
1.34
2.16
2.68
0.00
0.50
1.00
1.50
2.00
2.50
3.00
0.00
0.20
0.40
0.60
0.80
1.00
1.20
1.40
1.60
Y1 Y2 Y3 Y4
Accenture's Profit from The Project (M€)
Final profit Personnel cost TMS cost
Shippeo cost Revenues Cumulated profit
108
is not supposed to have logistic competences or the time to dedicate its own effort to non-core
activities. An improved situation, but always lacking a transparent collaboration, is the choice of a
carrier as a 4PL. If the client had outsourced its whole logistics to a single carrier company, he would
have certainly obtained more savings in Y1, but they would have been kept constant also in the
following years, since the carrier would have exploited scale and learning economies to minimize its
own cost while maintaining the same annual fee towards the client, who wouldn’t have been aware
of that due to the lack of visibility on loads not performed by himself. The business case of the thesis,
instead, is a win-win situation for both parties, since the complete collaboration allows the adoption
of a continuous improvement approach, through the implementation of saving initiatives, and the
alignment with firm’s strategy without any interruption in the continuity of the “as-usual” business,
through the transparency on data.
Moreover, economic benefits aren’t the only advantages obtained with the adoption of a Logistic
Control Tower. According to the candidate’s experience, the most important achievement, indeed, is
the know-how transferability. What really pushes a firm to turn to a consulting firm is the awareness
of its lack of knowledge in a certain field, which leads to the need of being supported in a business
transformation required from the market in order to keep the same service level as before. The actual
Accenture’s value added is the ability to show to its client the best-in-class approach to reach this
goal. A normal outsourcing could reach a good level of operational performance, but the firm must
rely on its supplier until the client will hire new experts, who will provide the missing knowledge.
The service offered by Accenture, instead, includes also the empowerment of client’s employees,
since they can have access to the transportation process, due to the spread of visibility, and learn from
it the approach which they will exploit after the end of the project, when they will return to be
accountable for the activity.
Although the project is going well, it doesn’t mean that there aren’t some problems on it. There are,
indeed, activities still carried out manually, which should be automated, and data accuracy isn’t
always trustworthy, leading to the necessity of “cleaning” information before the analysis. However,
the main issue is the lack of an informatic specialist fully dedicate to the project, with the task of
assuring the constant integration of the platforms whenever a change in their settings are requested
by the client. However, these difficulties aren’t impacting the outcome even in these first months of
2020, the last year of the project lifecycle. In fact, many important new initiatives have been already
proposed to the client and are under approval. They concern the optimization of the palletization, the
proposal of intermodal solutions and the possibility of turning road shipments into sea ones, due to
its cheaper tariff.

109
REFERENCES
A&A. (2019). Top 10 Future Trends in Supply Chain and Logistics. Retrieved February 2, 2020, from Web
Article website: https://aacb.com/trends-in-supply-chain-and-logistics/
Adam Robinson. (2019). The Evolution and History of Supply Chain Management. Retrieved February 2,
2020, from Web Article website: https://cerasis.com/history-of-supply-chain-management/
Agrawal, P., & Narain, R. (2018). Digital supply chain management: An Overview. IOP Conference Series:
Materials Science and Engineering, 455(1). https://doi.org/10.1088/1757-899X/455/1/012074
Blackmore, Dean; Short, J. (2017). Market Share Analysis: Consulting Services, Worldwide, 2016. Gartner,
(April). Retrieved from https://www.gartner.com/doc/3732917/market-share-analysis-consulting-
services
Bleda, J., Martin, R., Narsana, T., & Jones, D. (2014). Prepare for Takeoff with a Supply Chain Control
Tower Enabling technologies for supply chain control towers.
CareerExplorer. (2019). What does an environmental consultant do? ‐ CareerExplorer. Retrieved January 4,
2020, from Web Article website: https://www.careerexplorer.com/careers/environmental-consultant/
Caridi, M., Moretto, A., Perego, A., & Tumino, A. (2014). The benefits of supply chain visibility: A value
assessment model. International Journal of Production Economics, 151, 1–19.
https://doi.org/10.1016/j.ijpe.2013.12.025
Cerruti, C., Borra, S., Appolloni, A., Benedetto, G., & Elisabetta, A. (2018). Survey of the European
Management Consultancy 2017/2018. Survey, 1–52. Retrieved from
http://www.feaco.org/sites/default/files/sitepagefiles/Feaco.Survey 2017-2018.pdf
Cleverism. (2016). Accenture | Jobs, Benefits, Business Model, Founding Story. Retrieved January 24, 2020,
from Web Article website: https://www.cleverism.com/company/accenture/
Consultancy-me. (2019). Accenture books $43.2 billion in global revenues with 8.5% growth. Retrieved
January 25, 2020, from Web Article website: https://www.consultancy-me.com/news/2362/accenture-
books-432-billion-in-global-revenues-with-85-growth
Consultancy.Uk. (2018). Consulting Industry | Consultancy.uk. Retrieved December 28, 2019, from Web
Article website: https://www.consultancy.uk/consulting-industry
Crighton, R. D. (2005). A Strategic Analysis of a Consulting Firm’s Market Expansion Plans. Master Thesis.
Datex. (2019). What is New in in Supply Chain Track and Trace Technology? Retrieved February 6, 2020,
from Web Article website: https://www.datexcorp.com/what-is-new-in-track-and-trace-technology/
Fajardo, S., García-Galvan, R., F., Barranco, V., Galvan, J. C., & Batlle, S. F. (2016). Role of visibility in
Supply Chain Management. Intech, i(tourism), 13. https://doi.org/http://dx.doi.org/10.5772/57353
Financial Times. (2018). A dangerous dance: when auditors are too close to the client | Financial Times.
Retrieved January 3, 2020, from Article website: https://www.ft.com/content/29a029a0-a7b2-11e8-
8ecf-a7ae1beff35b
Geneca. (2019). Top Technology Trends in Management Consulting. Retrieved January 3, 2020, from Web
Article website: https://www.geneca.com/top-technology-trends-in-management-consulting/

110
Haslam, S., Bodenstein, R., & Abdel-jaber, T. (2018). How developed is a country ’ s management
consulting sector ? CMC-Global, (October).
Hinge Marketing. (2018). The Research is Out on 2018 High-Growth Consulting Firms | Hinge Marketing.
Retrieved January 12, 2020, from Web Article website: https://hingemarketing.com/blog/story/the-
research-is-out-on-2018-high-growth-consulting-firms
Insights Success. (2019). Top Trends Disrupting the Business Consulting Industry - Insights Success.
Retrieved January 19, 2020, from Web Article website: https://www.insightssuccess.in/top-trends-
disrupting-the-business-consulting-industry/
Jones, S. (2019). Accenture Fact Sheet Q1 Fy18. Report, 18–19. Retrieved from
https://newsroom.accenture.com//content/1101/files/Accenture_Factsheet_Q2_FY18_V2.pdf
Lippincott, S. (2016). Control Tower Value Matrix 2016. (November), 1–10.
Marketing91. (2020). Accenture SWOT analysis. Retrieved January 26, 2020, from Web Article website:
https://www.marketing91.com/swot-analysis-of-accenture/
McKenna, C. D. (2001). The World’s Newest Profession: Management Consulting in the Twentieth Century.
Enterprise and Society, 2(4), 673–679. https://doi.org/10.1017/S1467222700005322
Preamble, I., Technology, I., & Services, E. (2019). National Policy on Software Products ( 2019 ). Article,
1–12.
S&P. (2017). SWOT & PESTLE.com. Retrieved January 2, 2020, from Web Article website:
https://www.swotandpestle.com/
Sabath, R. E., & Kubr, M. (1977). Management Consulting, a Guide to the Profession. In Journal of
Marketing Research (Vol. 14). https://doi.org/10.2307/3150794
Shippeo. (2019). About Us | Shippeo. Retrieved March 21, 2020, from Web Article website:
https://www.shippeo.com/en/company/about-us
Statista. (2019). Consulting firms: global market share by company 2018 | Statista. Retrieved January 12,
2020, from Web Article website: https://www.statista.com/statistics/624204/market-share-of-leading-
consulting-firms-worldwide/
Street of Walls. (2013). Consulting Industry Overview | Street Of Walls. Retrieved January 2, 2020, from
Web Article website: http://www.streetofwalls.com/finance-training-courses/consulting-interview-
training/consulting-industry-overview/
Sweeney, E., Edward, B. Y., & Fcilt, S. (2013). Supply Chain “Mega-Trends” : Current Status and Future
Trends. LinkLine: Journal of the Chartered Institute of Logistics and Transport (CILT) in Ireland,
(Spring), 31–34.
Van Doesburg, R. (2011). Global Supply Chain Control Towers. Article, (1), 16–27.
Vorst, I. J. G. A. J. Van Der. (2004). Supply Chain Management : theory and practices. The Emerging
Science of Chains and Networks: Bridging Theory and Practice, (January 2004), 1–19.
Warehouse Anywhere. (2018). 3PL vs. 4PL Logistics - Warehouse Anywhere. Retrieved February 8, 2020,
from Web Article website: https://www.warehouseanywhere.com/resources/3pl-vs-4pl-logistics-

111
definition-and-comparison/
Wei, H. L., & Wang, E. T. G. (2007). Creating strategic value from supply chain visibility- The dynamic
capabilities view. Proceedings of the Annual Hawaii International Conference on System Sciences, 1–
10. https://doi.org/10.1109/HICSS.2007.157
Wikipedia. (2019). Accenture - Wikipedia. Retrieved January 24, 2020, from Web Article website:
https://en.wikipedia.org/wiki/Accenture