Evaluating logistic mixed-effects models of corpus - linguistic data, with Vsevolod Kapatsinski
Upload
khangminh22Category
view
3download
0
agronomy
Article
Application of Logistic Regression Models for theMarketability of Cucumber Cultivars
Manuel Díaz-Pérez *, Ángel Carreño-Ortega , José-Antonio Salinas-Andújar andÁngel-Jesús Callejón-Ferre
Department of Engineering, University of Almería, Agrifood Campus of International Excellence (CeiA3),La Cañada de San Urbano, 04120 Almería, Spain; [email protected] (A.C.-O.); [email protected] (J.-A.S.-A.);[email protected] (A.-J.C.-F.)* Correspondence: [email protected]; Tel.: +34-950-014-093
Received: 15 November 2018; Accepted: 27 December 2018; Published: 3 January 2019�����������������
Abstract: The aim of this study is to establish a binary logistic regression method to evaluate andselect cucumber cultivars (Cucumis sativus L.) with a longer postharvest shelf life. Each samplewas evaluated for commercial quality (fruit aging, weight loss, wilting, yellowing, chilling injury,and rotting) every 7 days of storage. Simple and multiple binary logistic regression models wereapplied in which the dependent variable was the probability of marketability and the independentvariables were the days of storage, cultivars, fruit weight loss, and months of evaluation. The resultsshowed that cucumber cultivars with a longer shelf life can be selected by a simple and multiplebinary logistic regression analysis. Storage time was the main determinant of fruit marketability.Fruit weight loss strongly influenced the probability of marketability. The logistic model allowed usto determine the cucumber weight loss percentage over which a fruit would be rejected in the market.
Keywords: cucumber; cultivar; quality; days of storage; logistic regression; probabilityof marketability
1. Introduction
The production and marketability of cucumber (Cucumis sativus L.) for fresh consumption is veryimportant throughout the world [1,2]. However, the greatest losses of fruit and vegetable supplychains occur during postharvest and distribution. For example, the losses in fruits and vegetables inEurope from the beginning of postharvest until reaching the consumer are 36% [3].
Losses in horticultural products can occur throughout the process from harvesting throughhandling, storage, processing, and marketing to the consumer [4–6]. Losses will be greater as the timebetween harvest and consumption increases [7]. Cucumber fruit quality includes many variables,such as skin color, skin texture, fruit shape, and the presence or absence of defects. [8,9]. The maincauses of postharvest losses and poor quality for cucumbers are overmaturity at harvest, rot, water loss(wilting), chilling injury, decay, loss of green color (i.e., chlorophyll), yellow and orange spots, bruises,and other mechanical injuries [10–12].
Biological variations in the postharvest quality of cucumber are influenced by several aspects,including the cultivar as a source of this variation [13]. Therefore, one of the main aims of geneticimprovement in cucumber is to increase fruit shelf life [14]. Genetic improvements to cultivars toprolong shelf life represent one of the best alternatives for increasing fruit marketability.
Many other strategies to prolong the shelf life of cucumbers have been studied in recent years.For example, authors have related the shelf life of cucumbers with color [15–17]; however, predictingcucumber yellowing via image analysis at harvest and using a statistical multiple regression approachled to unsatisfactory results [17]. Shelf life has also been related with fruit weight loss caused by water
Agronomy 2019, 9, 17; doi:10.3390/agronomy9010017 www.mdpi.com/journal/agronomy

Agronomy 2019, 9, 17 2 of 19
loss [18]. Other authors have related incident light and shelf life in cucumbers [19]. Finally, severalstudies have shown that the use of modified atmospheres and the application of chitosan [20] andnitric oxide [21] improve shelf life.
Despite many postharvest studies in cucumbers, the effects of all aspects with the potential tocause fruit damage have not been comprehensively considered because of the scarcity of mathematicaltools able to assess the loss of commercial value, which is based on categorical and continuous variablesacting jointly on the fruit [22].
In certain situations, such as studying shelf life during selection for genetic improvement [22],the use of ANOVA, simple or multiple regressions, and linear or nonlinear models are not appropriatefor characterizing the relationship between a response variable and a set of explanatory variables [23–26].
Recently, Díaz-Pérez [22] described a mathematical approach for the selection of tomato cultivarsbased on applying the binary logistic regression model, which included all aspects that cause fruitdamage and commercial value losses. In this study, categorical explanatory variables (rotting, cracking,aging, etc.) and continuous variables (firmness, color, etc.) were integrated and combined to determinethe probability of fruit marketability. Therefore, binary logistic regression has already been applied incomparative studies of tomato cultivars; however, it has not yet been used in the selection of cucumbercultivars (Figure 1).
Agronomy 2018, 8, x FOR PEER REVIEW 2 of 20
regression approach led to unsatisfactory results [17]. Shelf life has also been related with fruit weight loss caused by water loss [18]. Other authors have related incident light and shelf life in cucumbers [19]. Finally, several studies have shown that the use of modified atmospheres and the application of chitosan [20] and nitric oxide [21] improve shelf life.
Despite many postharvest studies in cucumbers, the effects of all aspects with the potential to cause fruit damage have not been comprehensively considered because of the scarcity of mathematical tools able to assess the loss of commercial value, which is based on categorical and continuous variables acting jointly on the fruit [22].
In certain situations, such as studying shelf life during selection for genetic improvement [22], the use of ANOVA, simple or multiple regressions, and linear or nonlinear models are not appropriate for characterizing the relationship between a response variable and a set of explanatory variables [23,24,25,26].
Recently, Díaz-Pérez [22] described a mathematical approach for the selection of tomato cultivars based on applying the binary logistic regression model, which included all aspects that cause fruit damage and commercial value losses. In this study, categorical explanatory variables (rotting, cracking, aging, etc.) and continuous variables (firmness, color, etc.) were integrated and combined to determine the probability of fruit marketability. Therefore, binary logistic regression has already been applied in comparative studies of tomato cultivars; however, it has not yet been used in the selection of cucumber cultivars (Figure 1).
The aim of this study is to establish a binary logistic regression method to evaluate and select cucumber cultivars (Cucumis sativus L.) with longer postharvest shelf life. Different analytical approaches based on simple and multiple logistic regression will be considered to deepen the results and obtain more solid conclusions to facilitate the selection of plant materials with a longer postharvest shelf life.
Figure 1. Diagram of the interest in and practical application of the logistic regression model in comparative studies of cucumber cultivars to identify cultivars with the longest postharvest shelf life. In the figure, π (x) is the probability of marketability of a cucumber, “x” is the days of storage, “e” is Euler’s number, “α” is the intercept, and “β” is the slope. Source: Author’s elaboration based on Díaz-Pérez [22].
Figure 1. Diagram of the interest in and practical application of the logistic regression model incomparative studies of cucumber cultivars to identify cultivars with the longest postharvest shelf life.In the figure, π (x) is the probability of marketability of a cucumber, “x” is the days of storage, “e” isEuler’s number, “α” is the intercept, and “β” is the slope. Source: Author’s elaboration based onDíaz-Pérez [22].
The aim of this study is to establish a binary logistic regression method to evaluate and selectcucumber cultivars (Cucumis sativus L.) with longer postharvest shelf life. Different analyticalapproaches based on simple and multiple logistic regression will be considered to deepen the resultsand obtain more solid conclusions to facilitate the selection of plant materials with a longer postharvestshelf life.

Agronomy 2019, 9, 17 3 of 19
2. Materials and Methods
2.1. Production and Preparation of Cucumber Fruit Samples
The study was conducted on six LET (Long European Type) and five “mini”-type cucumbercultivars, which are included within the BAT (Beta Alpha Type) cultivars (Table 1) and representcommercial or precommercial cultivars. The LET cultivars are also known as “Dutch” or “Almería”type, and they have cylindrical and elongated fruits with smooth or slightly furrowed skin. The lengthcan exceed 25 cm and reach up to 40 cm. The average diameter fluctuates at approximately 4 cm,and the average fruit weight is between 400 and 500 g. The mini-type (BAT) has small fruits withsmooth and shiny skin. The length fluctuates at approximately 15–20 cm and fruit weight from 80 to180 g.
Table 1. Sampling for each crop cycle and month of evaluation and days in which the samples of eachcucumber cultivar were measured in the laboratory.
Evaluated Cycle Month of Evaluation/Cycle DOS (a)
Cultivars 14–15 16–17 17–18 Nov. Dec. Jan. Feb. Mar. 0 7 14 21 28 35LET
Litoral X X X X X X X X X X XLevantino X X X X X X X X X X XGalerno X X X X X X X X X X XPoniente X X X X X X X X X X X
Valle X X X X X X X X X X XMini-type 0 5 10 15 20 25 30 35
Katrina X X X X X X X X X X X X176 X X X X X X X X X X X X
15999 X X X X X X X X X X X X16000 X X X X X X X X X X X X16054 X X X X X X X X X X X X(a) Days of storage over which the fruit samples were measured during postharvest in the laboratory.X: Sampling conducted.
Fruit samples were obtained from professional producers dedicated to the production and exportof cucumbers. The crops were grown in greenhouses located in different areas of the province ofAlmería (southeastern Spain). All plants were cultivated in a typical growing cycle of southeasternSpain. Cultivation began in the second half of August. By the first week of April, the crops werealready finished. All plants were cultivated under standard conditions in the cultivation area in termsof fertilization, irrigation, climate control, and so forth. The harvested fruits were in a state of optimumcommercial maturity.
2.2. Experimental Design
Table 1 shows the vegetal materials, cultivation cycles, and months of evaluation.Three independent experiments were performed. One study was on the mini-type cucumber and twoon the LET cucumber (one each for the Litoral and Levantino cultivars and another for the Galerno,Poniente, and Valle cultivars).
A sample was taken for each cultivar and month of evaluation, which consisted of 200 fruitsfor LET cucumbers and 150 fruits for mini-cultivars. Each sample was identified and labeled tomaintain traceability throughout the study. The study of the fruits was carried out in a laboratory atthe University of Almeria (located in Almeria, Spain). Each sample was subdivided into subsamplesof 50 fruits to evaluate the commercial quality in time intervals of 7 days for the LET types and 5 daysfor the mini-types, as shown in Table 1.
The cucumber fruits were kept under preservation conditions throughout the storage period.Storage conditions were a temperature of 10 ◦C and 85–95% relative humidity [27,28]. At each samplingtime described in Table 1, a subsample of 50 fruits was taken at random for quality analysis.

Agronomy 2019, 9, 17 4 of 19
Market quality was evaluated for each fruit individually. The measured parameters includedcommercial quality and fruit weight loss. The commercial quality of each fruit was evaluatedconsidering the main causes of a loss of commercial value during the postharvest period described byKader [10,12] and Valero and Serrano [11]. The loss of commercial value parameters considered in theevaluated fruits were fruit aging, water loss (wilting), color loss (yellowing), chilling injury, and decay(see Figure 2). These parameters are usually the main causes of disputes associated with postharvestproblems between distribution companies (wholesalers and retailers) and production companies.
Agronomy 2018, 8, x FOR PEER REVIEW 4 of 20
sampling time described in Table 1, a subsample of 50 fruits was taken at random for quality analysis.
Market quality was evaluated for each fruit individually. The measured parameters included commercial quality and fruit weight loss. The commercial quality of each fruit was evaluated considering the main causes of a loss of commercial value during the postharvest period described by Kader [10,12] and Valero and Serrano [11]. The loss of commercial value parameters considered in the evaluated fruits were fruit aging, water loss (wilting), color loss (yellowing), chilling injury, and decay (see Figure 2). These parameters are usually the main causes of disputes associated with postharvest problems between distribution companies (wholesalers and retailers) and production companies.
Figure 2. Details of noncommercial cucumber fruits identified during the study. Apical wilt caused by fruit aging and water loss (a). Apical rot (b). Loss of green color (i.e., chlorophyll) with yellow development (c).
Weight loss was evaluated individually for each sample fruit of each cultivar. During the evaluation, the weight of each fruit was controlled at different time intervals. With the LET cucumber, the time intervals were 7 days (0, 7, 14, 21, 28, and 35 days of storage). With the mini-type cucumber, the time intervals were 0, 5, 10, 15, 20, 25, 30, and 35 days of storage (Table 1). The cucumbers were weighed on a NAHITA 5061 balance with a maximum capacity of 500 g and an accuracy of 0.1 g. Weight loss was calculated as a percentage of weight compared to the initial weight [29,20].
2.3. Data Analysis
Binary logistic regression seeks to identify whether a relationship exists between a dependent variable (Y) associated with the occurrence or not of an event (dichotomous type) and one or more categorical or continuous independent variables (Xi) [24,25].
In the present research, simple and multiple binary logistic regression models were applied as described by Díaz-Pérez [22] in a study conducted on tomato to predict the probability of fruit marketability (commercial fruit: Y = yes/no) based on certain individual characteristics (Xi): storage time, cultivar type (cv. 1, cv. 2…), presence of pathogens (yes/no), aged fruit (yes/no), and so forth. In the present context, the “probability of marketability” in cucumber cultivars is a term chosen to define the capacity of the fruits to be marketed during storage time under experimental conditions [22].
The simplest situation in which the regression model was applied was to evaluate the influence of storage time on the probability of marketability based on simple independent logistic regressions for each cucumber cultivar, and its expression is shown in Equation 1 [22,26].
c b a
Figure 2. Details of noncommercial cucumber fruits identified during the study. Apical wilt causedby fruit aging and water loss (a). Apical rot (b). Loss of green color (i.e., chlorophyll) with yellowdevelopment (c).
Weight loss was evaluated individually for each sample fruit of each cultivar. During theevaluation, the weight of each fruit was controlled at different time intervals. With the LET cucumber,the time intervals were 7 days (0, 7, 14, 21, 28, and 35 days of storage). With the mini-type cucumber,the time intervals were 0, 5, 10, 15, 20, 25, 30, and 35 days of storage (Table 1). The cucumbers wereweighed on a NAHITA 5061 balance with a maximum capacity of 500 g and an accuracy of 0.1 g.Weight loss was calculated as a percentage of weight compared to the initial weight [20,29].
2.3. Data Analysis
Binary logistic regression seeks to identify whether a relationship exists between a dependentvariable (Y) associated with the occurrence or not of an event (dichotomous type) and one or morecategorical or continuous independent variables (Xi) [24,25].
In the present research, simple and multiple binary logistic regression models were appliedas described by Díaz-Pérez [22] in a study conducted on tomato to predict the probability of fruitmarketability (commercial fruit: Y = yes/no) based on certain individual characteristics (Xi): storagetime, cultivar type (cv. 1, cv. 2 . . . ), presence of pathogens (yes/no), aged fruit (yes/no), and so forth.In the present context, the “probability of marketability” in cucumber cultivars is a term chosen todefine the capacity of the fruits to be marketed during storage time under experimental conditions [22].
The simplest situation in which the regression model was applied was to evaluate the influenceof storage time on the probability of marketability based on simple independent logistic regressionsfor each cucumber cultivar, and its expression is shown in Equation (1) [22,26].
π(x) =exp (α+ βx)
1 + exp (α+ βx)=
eα+βx
1 + eα+βx (1)

Agronomy 2019, 9, 17 5 of 19
where X is the days of storage (DOS) and π (x) is the probability of marketability of cucumbers.The multiple logistic regression model was also applied, and its expression is shown in
Equation (2) [24,26].
π(x) =eα+∑n
i=1 βixi
1 + eα+∑ni=1 βixi
(2)
where X1, X2, . . . , Xi are the independent variables and π (x) is the probability of marketability ofcucumbers. In our study, the independent variables used in the different multiple analyses were DOS,cultivar, fruit weight loss percentage (FWL %) during storage, and month of evaluation.
In our study, a multiple binary logistic regression was applied with the followinganalytical approaches:
1. Estimating the model parameters associated with cultivars and storage time as the main factorsinfluencing the probability of marketability;
2. Estimating the model parameters associated with cultivars and cucumber FWL % as the mainfactors influencing the probability of marketability; and
3. Using multiple binary logistic regression to identify the factors capable of predicting with greaterprecision the probability of marketability.
To apply the multiple binary logistic regression in which categorical variables were included,these were treated as independent dummy variables [24]. The parameters α and βi of the simpleand multiple regression models were estimated from data measured in the laboratory using the“maximum-likelihood method” [30]. To verify that coefficient βi differs from 0, we used the Wald test,which is based on the Wald contrast as shown in Equation (3) [26].
Zwald =β̂
SE(β̂)
(3)
where β̂ is the estimate of parameter β by the maximum likelihood method and SE is the standarderror of β̂.
The study and analysis of odds ratios (θ) allow us to provide a good interpretation of the logisticregression models. Equation (4) shows the mathematical expression of the odds ratio used in ourstudy [26]:
θ =odds1
odds2=
π(1)1−π(1)π(2)
1−π(2)
(4)
where odds of an event represent the ratio between the probability that the event will occur and theprobability that it will not occur and π (x) is the probability of marketability of cucumbers.
One reason for using the linear logistic model in the analysis of data from shelf-life studies infruits and vegetables is that the coefficients associated with the explanatory variables of the model(α and βi) can be interpreted as logarithms of odds ratios, which means that estimates of the relativerisk of a probability of marketability and the corresponding standard errors can be easily obtainedfrom a fitted model [25].
Finally, to evaluate whether the measured data fit well with the calculated models,the goodness-of-fit test was applied based on the “Hosmer–Lemeshow goodness-of-fit” statistic [24].
All the simple and multiple binary logistic regression analyses were performed with the softwarepackages Statgraphics Centurion XVII-X64 and IBM SPSS Statistics Version 23.

Agronomy 2019, 9, 17 6 of 19
3. Results and Discussion
The study was proposed independently for the mini cucumber cultivars (176, 15999, 16000, 16054,and Katrina) and LET cultivars Levantino and Litoral (November–January) and Galerno, Poniente,and Valle (February–March). Simple binary logistic regression analyses were performed for eachcultivar, and different multiple regression approaches were used.
3.1. Influence of Storage Time on the Commercialization of Cucumber Cultivars
Simple binary logistic regression analyses were conducted for each cucumber cultivar to determinethe development of the probability of marketability during storage.
The results for the simple logistic regression models adjusted for all LET cucumber cultivars areshown in Table 2 and Figure 3. The results for the mini cucumber cultivars are shown in Table 3 andFigure 4. These fitted models consider DOS as a variable that significantly affects the probability ofmarketability for all cucumber cultivars (p < 0.001 in all cases), where the probability of marketabilityrefers to the global changes in postharvest quality that occurred in fruits under the experimentalstorage conditions (wrinkling, rotting, etc.). In addition, in all cases, a negative relationship (β < 0) wasobserved between the commercial value of the fruit and storage time, meaning that the probability ofmarketability decreases as the storage time increases.
Table 2. Estimated independent simple logistic regression parameters for each LET cucumber cultivaras a function of the days of storage (DOS), which is a factor influencing the probability of marketability.
CultivarCoefficients Odds Ratio 95% CI for (Exp(β))
Variable (α, β) Wald χ2 p (Exp(β)) Lower Upper
Period: November–January
Levantino *DOS −0.330 193.198 <0.000 0.719 0.687 0.753
Constant 6.430 192.484 <0.000 619.996
Litoral *DOS −0.366 180.054 <0.000 0.694 0.658 0.732
Constant 5.910 171.565 <0.000 368.591Period: February–March
Galerno *DOS −0.585 15.730 <0.000 0.557 0.417 0.744
Constant 7.620 15.470 <0.000 2039.480
Poniente *DOS −0.357 186.558 <0.000 0.700 0.665 0.737
Constant 6.033 179.682 <0.000 417.092
Valle *DOS −0.514 66.923 <0.000 0.598 0.529 0.676
Constant 5.521 57.952 <0.000 249.885
* Likelihood ratio (omnibus; p < 0.001). Hosmer–Lemeshow test (p > 0.05). The results are obtained from the simplelogistic model for each cultivar as a function of the days of storage.
Agronomy 2018, 8, x FOR PEER REVIEW 6 of 20
The study was proposed independently for the mini cucumber cultivars (176, 15999, 16000, 16054, and Katrina) and LET cultivars Levantino and Litoral (November–January) and Galerno, Poniente, and Valle (February–March). Simple binary logistic regression analyses were performed for each cultivar, and different multiple regression approaches were used.
3.1. Influence of Storage Time on the Commercialization of Cucumber Cultivars
Simple binary logistic regression analyses were conducted for each cucumber cultivar to determine the development of the probability of marketability during storage.
The results for the simple logistic regression models adjusted for all LET cucumber cultivars are shown in Table 2 and Figure 3. The results for the mini cucumber cultivars are shown in Table 3 and Figure 4. These fitted models consider DOS as a variable that significantly affects the probability of marketability for all cucumber cultivars (p < 0.001 in all cases), where the probability of marketability refers to the global changes in postharvest quality that occurred in fruits under the experimental storage conditions (wrinkling, rotting, etc.). In addition, in all cases, a negative relationship (β < 0) was observed between the commercial value of the fruit and storage time, meaning that the probability of marketability decreases as the storage time increases.
Table 2. Estimated independent simple logistic regression parameters for each LET cucumber cultivar as a function of the days of storage (DOS), which is a factor influencing the probability of marketability.
Cultivar Coefficients Odds Ratio- 95% CI for (Exp(β))
Variable (α, β) Wald χ2 p (Exp(β)) Lower Upper Period: November–January
Levantino * DOS −0.330 193.198 <0.000 0.719 0.687 0.753
Constant 6.430 192.484 <0.000 619.996
Litoral * DOS −0.366 180.054 <0.000 0.694 0.658 0.732
Constant 5.910 171.565 <0.000 368.591 Period: February–March
Galerno * DOS −0.585 15.730 <0.000 0.557 0.417 0.744
Constant 7.620 15.470 <0.000 2039.480
Poniente * DOS −0.357 186.558 <0.000 0.700 0.665 0.737
Constant 6.033 179.682 <0.000 417.092
Valle * DOS −0.514 66.923 <0.000 0.598 0.529 0.676
Constant 5.521 57.952 <0.000 249.885 * Likelihood ratio (omnibus; p < 0.001). Hosmer–Lemeshow test (p > 0.05). The results are obtained from the simple logistic model for each cultivar as a function of the days of storage.
Figure 3. Timeline of the probability of marketability of the LET cucumber cultivars. The results are obtained from the simple logistic model for each cultivar as a function of the days of storage.
Figure 3. Timeline of the probability of marketability of the LET cucumber cultivars. The results areobtained from the simple logistic model for each cultivar as a function of the days of storage.

Agronomy 2019, 9, 17 7 of 19
Table 3. Estimation of independent simple logistic regression parameters for each mini cucumbercultivar based on the days of storage (DOS), which is a factor influencing the probabilityof marketability.
CultivarCoefficients Odds ratio 95% CI for (Exp(β))
Variable (α, β) Wald χ2 p (Exp(β)) Lower Upper
176 *DOS −0.296 125.198 <0.000 0.744 0.706 0.784
Constant 4.724 114.867 <0.000 112.664
15999 *DOS −0.348 30.631 <0.000 0.706 0.624 0.799
Constant 4.207 40.793 <0.000 67.155
16000 *DOS −0.367 34.819 <0.000 0.693 0.613 0.783
Constant 5.209 43.385 <0.000 182.856
16054 *DOS −0.590 27.759 <0.000 0.554 0.445 0.690
Constant 6.019 29.840 <0.000 411.181
Katrina *DOS −0.345 214.049 <0.000 0.708 0.676 0.742
Constant 4.237 197.549 <0.000 69.201
* Likelihood ratio (omnibus; p < 0.000). Hosmer–Lemeshow test (p > 0.05). The results are obtained from the simplelogistic model for each cultivar, as a function of the days of storage.
Agronomy 2018, 8, x FOR PEER REVIEW 7 of 20
Table 3. Estimation of independent simple logistic regression parameters for each mini cucumber cultivar based on the days of storage (DOS), which is a factor influencing the probability of marketability.
Cultivar Coefficients Odds ratio- 95% CI for (Exp(β))
Variable (α, β) Wald χ2 p (Exp(β)) Lower Upper
176 * DOS −0.296 125.198 <0.000 0.744 0.706 0.784
Constant 4.724 114.867 <0.000 112.664
15999 * DOS −0.348 30.631 <0.000 0.706 0.624 0.799
Constant 4.207 40.793 <0.000 67.155
16000 * DOS −0.367 34.819 <0.000 0.693 0.613 0.783
Constant 5.209 43.385 <0.000 182.856
16054 * DOS −0.590 27.759 <0.000 0.554 0.445 0.690
Constant 6.019 29.840 <0.000 411.181
Katrina * DOS −0.345 214.049 <0.000 0.708 0.676 0.742
Constant 4.237 197.549 <0.000 69.201 * Likelihood ratio (omnibus; p < 0.000). Hosmer–Lemeshow test (p > 0.05). The results are obtained from the simple logistic model for each cultivar, as a function of the days of storage.
Figure 4. Timeline of the probability of marketability in mini cucumber cultivars. The results are obtained from the simple logistic model for each cultivar, as a function of the days of storage.
The odds ratios (Exp (β)) and their confidence intervals for all cucumber cultivars are shown in Table 2 and Table 3. The value of the confidence interval for Exp (β) is never 1, which shows that the DOS variable explains the behavior of the probability of marketability for each cucumber cultivar.
The odds ratios show the relationships between variables. In the case of cucumber cultivars, a decrease is observed in the probability of marketability during storage time (β < 0 → Exp (β) < 1). In the case of the LET cucumber cultivar, an increase of one day of storage decreased the probability of marketability of the fruit by 28.1% [(1−0.719) × 100] in Levantino and 30.6% [(1−0.694) × 100] in Litoral. In the case of the Galerno, Poniente, and Valle cultivars, the increase in one day of storage
Figure 4. Timeline of the probability of marketability in mini cucumber cultivars. The results areobtained from the simple logistic model for each cultivar, as a function of the days of storage.

Agronomy 2019, 9, 17 8 of 19
The odds ratios (Exp (β)) and their confidence intervals for all cucumber cultivars are shown inTables 2 and 3. The value of the confidence interval for Exp (β) is never 1, which shows that the DOSvariable explains the behavior of the probability of marketability for each cucumber cultivar.
The odds ratios show the relationships between variables. In the case of cucumber cultivars,a decrease is observed in the probability of marketability during storage time (β < 0→ Exp (β) < 1).In the case of the LET cucumber cultivar, an increase of one day of storage decreased the probabilityof marketability of the fruit by 28.1% [(1−0.719) × 100] in Levantino and 30.6% [(1−0.694) × 100] inLitoral. In the case of the Galerno, Poniente, and Valle cultivars, the increase in one day of storagedecreased the probability of marketability (odds of marketability decreased) by 44.3% in Galerno,40.2% in Valle, and 30.0% in Poniente. In the case of the mini cucumber, these decreases were 44.6%in the 16054 phenotype, 30.7% in cv. 16000, 29.4% in 15999, 29.2% in Katrina, and 25.6% in 176,which means that Levantino, Poniente, and 176 had a longer shelf life as seen in Figures 3 and 4.
In Figures 3 and 4, the fitted models are represented, which predict for each phenotype theprobability of marketability of a cucumber sample at a particular storage time (DOS). For example,in the Levantino cultivar (Figure 3), when the storage time is 0, the probability of marketability is1, meaning that all the fruits are marketable. However, after 14 days of storage, the probabilityof marketability of the fruits is 0.86, which means that 14% of the fruits would not be marketable.The probability of marketability as a function of the DOS variable in Levantino is given by thefollowing equation:
π(x)“Levantino” =exp(α+ βx)
1 + exp(α+ βx)=
exp(6.430− 0.330x)1 + exp(6.430− 0.330x)
(5)
Authors have indicated that 5% of nonmarketable fruits is the tolerance limit allowed by thedistribution chains for the marketability of fruits and vegetables in the European Union [22,31].Figures 3 and 4 show a line marking a tolerance level of 5% of nonmarketable fruits (95% ofmarketable fruits).
The total allowed tolerance of 5% nonmarketable fruits in the commercial types studied wasreached after 10 days of storage for Levantino, 8 days for Litoral, 9 days for Poniente, 8 days forGalerno, 5 days for Valle (Figure 3), 6 days for the mini cucumber cultivars 176 and 16000, 5 days forcultivar 16054, and 4 days for cultivars 15999 and Katrina (Figure 4).
This approach allows us to determine the greater or lesser shelf-life potential of a cucumbercultivar independently. A comparison of the results between cultivars allows us to identify thosephenotypes with a longer shelf life [22]. For example, Poniente has a longer shelf life than that ofValle (Figure 3).
3.2. Effect of Cultivar and Storage Time as Factors Influencing Marketability
To study the effect of storage time and cultivars, multiple binary logistic regressions were proposedwhose explanatory variables were DOS (continuous variable) and cucumber cultivar (categoricalvariable). This analysis was proposed independently for the LET cultivars (Levantino, Litoral, Galerno,Poniente, and Valle) and mini-type cultivars (176, 15999, 16000, 16054, and Katrina). In the threestudies, regression coefficients, odds ratios (and their confidence intervals), and the significance ofeach variable were calculated, and each cultivar was used as a reference in the regression model.
The parameters of the multiple logistic regressions for the DOS and cultivar variables used tomodel the probability of marketability of cucumbers are shown in Table 4 for the Levantino and Litoralcultivars, in Table 5 for the Galerno, Poniente, and Valle cultivars, and in Table 6 for the mini-typecucumber cultivars. In order to improve the discussion of the results when more than two cultivarsare included in the study, different ways of seeing the same model are presented when each of thecultivars is considered as a reference (Tables 5 and 6).

Agronomy 2019, 9, 17 9 of 19
Table 4. Estimation of the multiple logistic regression parameters for cultivars (Levantino and Litoral)and DOS as factors influencing the probability of marketability.
VariablesCoefficients
Wald χ2 pOdds Ratio 95% CI for (Exp(β))
(α, β) (Exp(β)) Lower Upper
Constant 5.602 325.113 <0.000 271.048DOS −0.346 373.355 <0.000 0.707 0.683 0.733
Levantino 1.144 39.917 <0.000 3.140 2.202 4.477Litoral Reference
Likelihood ratio (omnibus, p < 0.000). Hosmer–Lemeshow test (p = 0.886). CI: Confidence interval.
Table 5. Estimation of the multiple logistic regression parameters for cultivars (Galerno, Poniente,and Valle) and days of storage (DOS) as factors influencing the probability of marketability.
VariablesCoefficients
Wald χ2 pOdds Ratio 95% CI for (Exp(β))
(α, β) (Exp(β)) Lower Upper
Constant 4.272 160.644 <0.000 71.692DOS −0.398 266.725 <0.000 0.671 0.640 -0.398
Galerno 1.007 5.654 0.017 2.736 1.193 1.007Poniente 2.447 72.483 <0.000 11.558 6.580 2.447
Valle ReferenceConstant 6.720 249.830 <0.000 828.620
DOS −0.398 266.725 <0.000 0.671 0.640 0.704Valle −2.447 72.483 <0.000 0.087 0.049 0.152
Galerno −1.441 12.835 <0.000 0.237 0.108 0.521Poniente ReferenceConstant 5.279 125.272 <0.000 196.184
DOS −0.398 266.725 <0.000 0.671 0.640 0.704Poniente 1.441 12.835 <0.000 4.224 1.920 9.290
Valle −1.007 5.654 0.017 0.365 0.159 0.838Galerno Reference
Likelihood ratio (omnibus, p < 0.000). Hosmer–Lemeshow test (p = 0.079).
Table 6. Estimation of the multiple logistic regression parameters for the mini-type cultivars and daysof storage (DOS) as factors influencing the probability of marketability.
VariablesCoefficients
Wald χ2 pOdds Ratio 95% CI for (Exp(β))
(α, β) (Exp(β)) Lower Upper
Constant 4.180 343.022 <0.000 65.337DOS −0.340 426.987 <0.000 0.712 0.689 0.735176 1.247 39.387 <0.000 3.480 2.357 5.136
15999 −0.054 0.035 0.851 0.947 0.537 1.67016000 0.701 6.905 0.009 2.016 1.195 3.40116054 −0.491 3.170 0.075 0.612 0.357 1.051
Katrina ReferenceConstant 3.689 164.413 <0.000 40.000
DOS −0.340 426.987 <0.000 0.712 0.689 0.735Katrina 0.491 3.170 0.075 1.633 0.952 2.803
176 1.738 31.765 <0.000 5.684 3.106 10.40015999 0.437 1.469 0.225 1.547 0.764 3.13416000 1.192 11.771 0.001 3.293 1.667 6.50616054 Reference

Agronomy 2019, 9, 17 10 of 19
Table 6. Cont.
VariablesCoefficients
Wald χ2 pOdds Ratio 95% CI for (Exp(β))
(α, β) (Exp(β)) Lower Upper
Constant 4.881 248.244 <0.000 131.723DOS −0.340 426.987 <0.000 0.712 0.689 0.73516054 −1.192 11.771 0.001 0.304 0.154 0.600
Katrina −0.701 6.905 0.009 0.496 0.294 0.837176 0.546 3.547 0.049 1.726 1.012 3.046
15999 −0.755 4.444 0.035 0.470 0.233 0.94816000 Reference
Constant 4.125 181.986 <0.000 61.891DOS −0.340 426.987 <0.000 0.712 0.689 0.73516000 0.755 4.444 0.035 2.128 1.054 4.29616054 −0.437 1.469 0.225 0.646 0.319 1.309
Katrina 0.054 0.035 0.851 1.056 0.599 1.861176 1.301 16.643 <0.000 3.673 1.966 6.863
15999 ReferenceConstant 5.426 325.873 <0.000 227.345
DOS −0.340 426.987 <0.000 0.712 0.689 0.73515999 −1.301 16.643 <0.000 0.272 0.146 0.50916000 −0.546 3.547 0.060 0.579 0.328 1.02216054 −1.738 31.765 <0.000 0.176 0.096 0.322
Katrina −1.247 39.387 <0.000 0.287 0.195 0.424176 Reference
Likelihood ratio (omnibus, p < 0.000). Hosmer–Lemeshow test (p = 0.159).
In the two analyses performed in the LET cucumber shown in Tables 4 and 5, statistical significanceis observed in the values of the Wald statistic, so its value differs from zero. Therefore, the DOSand cultivar variables included in the analysis are statistically relevant to explain the probabilityof marketability. In addition, all confidence intervals for Exp (β) exclude the value 1. In all cases,the DOS variable is negatively associated with the probability of marketability, whereas a positive ornegative relationship may be observed for the cultivars because it is a nominal categorical variableand therefore depends on whether the cultivar in question has more (positive value) or less (negativevalue) probability of marketability than the cultivar considered as a reference.
For the study conducted on the mini-type cucumbers (Table 6), the DOS variable was significantin some cultivars but not in other phenotypes. Specifically, the Wald test did not show statisticalsignificance in the 15999 and 16054 phenotypes when Katrina was considered as the reference cultivar,the 16054 and Katrina phenotypes when 15999 was considered as a reference, and 15999 and Katrinawhen 16054 was considered as a reference. This was confirmed with the analysis of the confidenceintervals for Exp (β) in these cultivars, which include the value 1 within the interval. In the studies ofthe LET cucumber phenotypes, the coefficient β for DOS was negative; therefore, the probability ofmarketability decreased as the storage time increased. In the case of cultivars, this relationship can bepositive or negative because the probability of marketability increases or decreases in relation to thereference cultivar.
From the analysis of the odds ratio for the days of storage, its value was 0.712, which produceda decrease of 28.8% in the probability of marketability with one day of storage (if we consider thecultivars = 1). The odds ratio refers to the relationship between the probability of marketabilityof a cultivar compared to the reference; therefore, values greater than 1 indicate an increase in theprobability of marketability of that phenotype compared to the reference, and vice versa [22]. In theodds ratios for the mini-type cucumber cultivars, for example, when we consider the DOS variable witha fixed value and Katrina as the reference cultivar, the probability of marketability is approximately3.5- and 2-fold higher (in terms of probabilities) for 176 and 16000, respectively, and 5.3% and 38.8%lower for 15999 and 16054, respectively (Table 6). In general, for each study conducted on cucumber

Agronomy 2019, 9, 17 11 of 19
with the DOS variable with a fixed value, the highest odds ratios occurred in Levantino, Poniente,and 176 and the lowest values occurred in Litoral, Valle, and 16054 (Tables 4–6). This finding can beverified with the illustrations in Figures 5–7.Agronomy 2018, 8, x FOR PEER REVIEW 11 of 20
Figure 5. Timeline of the probability of marketability as a function of the days of storage (DOS) for the Levantino and Litoral cucumber cultivars.
Figure 6. Timeline of the probability of marketability as a function of the days of storage (DOS) for the Poniente, Galerno, and Valle cucumber cultivars.
Figure 5. Timeline of the probability of marketability as a function of the days of storage (DOS) for theLevantino and Litoral cucumber cultivars.
Agronomy 2018, 8, x FOR PEER REVIEW 11 of 20
Figure 5. Timeline of the probability of marketability as a function of the days of storage (DOS) for the Levantino and Litoral cucumber cultivars.
Figure 6. Timeline of the probability of marketability as a function of the days of storage (DOS) for the Poniente, Galerno, and Valle cucumber cultivars.
Figure 6. Timeline of the probability of marketability as a function of the days of storage (DOS) for thePoniente, Galerno, and Valle cucumber cultivars.

Agronomy 2019, 9, 17 12 of 19Agronomy 2018, 8, x FOR PEER REVIEW 12 of 20
Figure 7. Timeline of the probability of marketability as a function of the days of storage (DOS) for the mini-type cucumber cultivars.
When the DOS variable is plotted against the probability of marketability through a multiple regression analysis and compared with the 95% probability line [22,31], the probability of reaching the 5% level of nonmarketable fruits occurred at 11 days in the Levantino cultivar and 8 days in the Litoral (Figure 5). In the case of Poniente, Galerno, and Valle, the values were 10, 6, and 4 days, respectively (Figure 6). Finally, in the mini-type cultivars, the 5% probability was reached at 3 days of storage for 16054, at 4 days for Katrina and 15999, at 6 days for 16000, and at 8 days for 176 (Figure 7).
3.3. Effect of Cultivar and Fruit Weight Loss as Factors Influencing Marketability
Cucumber fruit weight loss increases during storage and is directly related to temperature and storage time [32] as well as fruit deterioration, such as browning, fungal growth, and so forth. [33,34].
In the LET cucumber cultivars, the combined effect of postharvest FWL % and cultivar type, that is, the probability of marketability of cultivars based on fruit weight loss, was analyzed (Table 7 and Table 8). In the case of the mini-type cultivars, the Hosmer–Lemeshow statistic showed a value of 36.803 and a p-value < 0.001, which means that the multiple logistic model is ill-fitted to the data considered. Consequently, to compare the percentage of weight loss of the mini-type cultivars, simple regression analyses were performed for each cultivar in which the explanatory variable was FWL % and the response variable was the probability of marketability (Table 9).
Table 7. Estimation of the multiple logistic regression parameters for cucumber cultivars (Levantino and Litoral) and FWL % during storage as factors influencing the probability of marketability.
Variables Coefficients
Wald χ2 p Odds Ratio 95% CI for (Exp(β))
(α, β) (Exp(β)) Lower Upper Constant 7.718 227.008 <0.000 2248.731 FWL % −1.395 236.828 <0.000 0.248 0.207 0.296 Litoral 1.941 79.759 <0.000 6.965 4.549 10.663
Figure 7. Timeline of the probability of marketability as a function of the days of storage (DOS) for themini-type cucumber cultivars.
When the DOS variable is plotted against the probability of marketability through a multipleregression analysis and compared with the 95% probability line [22,31], the probability of reaching the5% level of nonmarketable fruits occurred at 11 days in the Levantino cultivar and 8 days in the Litoral(Figure 5). In the case of Poniente, Galerno, and Valle, the values were 10, 6, and 4 days, respectively(Figure 6). Finally, in the mini-type cultivars, the 5% probability was reached at 3 days of storage for16054, at 4 days for Katrina and 15999, at 6 days for 16000, and at 8 days for 176 (Figure 7).
3.3. Effect of Cultivar and Fruit Weight Loss as Factors Influencing Marketability
Cucumber fruit weight loss increases during storage and is directly related to temperature andstorage time [32] as well as fruit deterioration, such as browning, fungal growth, and so forth. [33,34].
In the LET cucumber cultivars, the combined effect of postharvest FWL % and cultivar type,that is, the probability of marketability of cultivars based on fruit weight loss, was analyzed (Tables 7and 8). In the case of the mini-type cultivars, the Hosmer–Lemeshow statistic showed a value of 36.803and a p-value < 0.001, which means that the multiple logistic model is ill-fitted to the data considered.Consequently, to compare the percentage of weight loss of the mini-type cultivars, simple regressionanalyses were performed for each cultivar in which the explanatory variable was FWL % and theresponse variable was the probability of marketability (Table 9).
Table 7. Estimation of the multiple logistic regression parameters for cucumber cultivars (Levantinoand Litoral) and FWL % during storage as factors influencing the probability of marketability.
VariablesCoefficients
Wald χ2 pOdds Ratio 95% CI for (Exp(β))
(α, β) (Exp(β)) Lower Upper
Constant 7.718 227.008 <0.000 2248.731FWL % −1.395 236.828 <0.000 0.248 0.207 0.296Litoral 1.941 79.759 <0.000 6.965 4.549 10.663
Levantino Reference
Likelihood ratio (omnibus, p < 0.000). Hosmer–Lemeshow test (p = 0.140). FWL %: Fruit weight loss percentageduring storage.

Agronomy 2019, 9, 17 13 of 19
Table 8. Estimation of multiple logistic regression parameters for cucumber cultivars (Galerno,Poniente, and Valle) and fruit weight loss percentage during storage as factors influencing theprobability of marketability.
VariablesCoefficients
Wald χ2 pOdds Ratio 95% CI for (Exp(β))
(α, β) (Exp(β)) Lower Upper
Constant 5.091 198.615 <0.000 162.540FWL % −1.069 273.219 <0.000 0.343 0.302 0.390Galerno −0.155 0.147 0.702 0.857 0.388 1.891Poniente 1.351 29.928 <0.000 3.861 2.380 6.265
Valle ReferenceConstant 6.442 251.470 <0.000 627.610FWL % −1.069 273.219 <0.000 0.343 0.302 0.390
Valle −1.351 29.928 <0.000 0.259 0.160 0.420Galerno −1.506 14.408 <0.000 0.222 0.102 0.483Poniente ReferenceConstant 4.936 125.463 <0.000 139.224FWL % −1.069 273.219 <0.000 0.343 0.302 0.390
Poniente 1.506 14.408 <0.000 4.508 2.072 9.810Valle 0.155 0.147 0.702 1.167 0.529 2.577
Galerno Reference
Likelihood ratio (omnibus, p < 0.000). Hosmer–Lemeshow test (p = 0.235). FWL %: Fruit weight loss percentageduring storage.
Table 9. Estimation of the independent simple logistic regression parameters for each mini-typecucumber cultivar as a function of postharvest FWL % as a factor influencing the probabilityof marketability.
cv. VariableCoefficients
Wald χ2 pOdds Ratio 95% CI for (Exp(β))
(α, β) (Exp(β)) Lower Upper
176 *DOS −0.507 116.197 <0.000 0.603 0.550 0.661
Constant 3.983 116.870 <0.000 53.696
15999 *DOS −0.434 30.836 <0.000 0.648 0.556 0.755
Constant 3.829 44.146 <0.000 46.005
16000 *DOS −0.387 35.562 <0.000 0.679 0.598 0.771
Constant 3.385 63.741 <0.000 29.505
16054 *DOS −0.603 27.788 <0.000 0.547 0.437 0.685
Constant 4.089 33.558 <0.000 59.709
Katrina *DOS −0.446 207.820 <0.000 0.640 0.603 0.680
Constant 3.230 197.323 <0.000 25.277
* Likelihood ratio (omnibus; p < 0.000). Hosmer–Lemeshow test (p > 0.05). The results are obtained from the simplelogistic model for each cultivar as a function of the days of storage.
These results showed that the FWL % variable was significant in the three studies performed(two in LET and one in mini). In contrast, in the evaluated cultivars, the estimate of the coefficients wasnot always significant. Of the five LET cucumber cultivars, the estimates of the model coefficients werenot statistically significant in Galerno when Valle was the reference and in Valle when Galerno wasthe reference. In the other cases, the model coefficients were statistically significant (Tables 7 and 8).In these cases, the probability of marketability was not affected between the cultivar in question andthe one considered as a reference (considering FWL % with a fixed value) [20].
On the other hand, the values of FWL % show a negative relationship (β < 0) with the probabilityof marketability of cucumbers (Figures 8–10). The greater the fruit weight loss during storage,the lower its market value, which is consistent with reports by other researchers [20,32–34]. The levelof nonmarketable fruits reached 5% when the FWL % was 3.2% in Poniente, 1.8% in Galerno, 2.0% inValle (Figure 9), and 4.4% and 3.4% in Levantino and Litoral, respectively (Figure 8). In the case ofthe mini-type cultivars, the FWL % for 5% of nonmarketable fruits was obtained from the simple

Agronomy 2019, 9, 17 14 of 19
logistic regressions for each cultivar. The FWL % associated with 5% of nonmarketable fruits was 0.8%in Katrin”, 1.3% in 16000, 2.0% in 16054, and 2.2% in 176 and 15999. These findings show Katrinapresented a lower probability of marketability with less weight loss than the other phenotypes.In contrast, 176 and 15999 could present a higher percentage of weight loss before losing theircommercial value (Figure 10).
Agronomy 2018, 8, x FOR PEER REVIEW 14 of 20
weight loss during storage, the lower its market value, which is consistent with reports by other researchers [20,32–34]. The level of nonmarketable fruits reached 5% when the FWL % was 3.2% in Poniente, 1.8% in Galerno, 2.0% in Valle (Figure 9), and 4.4% and 3.4% in Levantino and Litoral, respectively (Figure 8). In the case of the mini-type cultivars, the FWL % for 5% of nonmarketable fruits was obtained from the simple logistic regressions for each cultivar. The FWL % associated with 5% of nonmarketable fruits was 0.8% in Katrin”, 1.3% in 16000, 2.0% in 16054, and 2.2% in 176 and 15999. These findings show Katrina presented a lower probability of marketability with less weight loss than the other phenotypes. In contrast, 176 and 15999 could present a higher percentage of weight loss before losing their commercial value (Figure 10).
Figure 8. Probability of marketability based on fruit loss percentage during storage for the Levantino and Litoral cultivars.
Figure 8. Probability of marketability based on fruit loss percentage during storage for the Levantinoand Litoral cultivars.Agronomy 2018, 8, x FOR PEER REVIEW 15 of 20
Figure 9. Probability of marketability based on fruit loss percentage during storage for the Galerno, Poniente, and Valle cultivars.
Figure 10. Probability of marketability based on fruit weight loss of the mini-type cucumber cultivars studied. The results are obtained from the simple logistic model for each cultivar and based on fruit weight loss percentage (FWL %) during storage.
3.4. Future Lines of Research
It would be interesting to study the application of the logistic regression model in other species in order to determine the qualitative and quantitative variables with the greatest influence on the probability of marketability of these species. In order to improve the predictive approach of the
Figure 9. Probability of marketability based on fruit loss percentage during storage for the Galerno,Poniente, and Valle cultivars.

Agronomy 2019, 9, 17 15 of 19
Agronomy 2018, 8, x FOR PEER REVIEW 15 of 20
Figure 9. Probability of marketability based on fruit loss percentage during storage for the Galerno, Poniente, and Valle cultivars.
Figure 10. Probability of marketability based on fruit weight loss of the mini-type cucumber cultivars studied. The results are obtained from the simple logistic model for each cultivar and based on fruit weight loss percentage (FWL %) during storage.
3.4. Future Lines of Research
It would be interesting to study the application of the logistic regression model in other species in order to determine the qualitative and quantitative variables with the greatest influence on the probability of marketability of these species. In order to improve the predictive approach of the
Figure 10. Probability of marketability based on fruit weight loss of the mini-type cucumber cultivarsstudied. The results are obtained from the simple logistic model for each cultivar and based on fruitweight loss percentage (FWL %) during storage.
3.4. Future Lines of Research
It would be interesting to study the application of the logistic regression model in other speciesin order to determine the qualitative and quantitative variables with the greatest influence on theprobability of marketability of these species. In order to improve the predictive approach of themodel, it would be interesting to include in future studies biochemical, physical, and microbiologicalparameters that may affect postharvest storage (e.g., Total Soluble Solids (TSS), colour, etc.).
Finally, it is also interesting to carry out research that includes logistic regression in studiesto improve the fruits’ commercial life, both in the preharvest conditions (actions on crops) and inpostharvest conditions (actions on the storage conditions, fruit treatment, etc.).
3.5. Selection of the Study Variables with the Greatest Influence on the Probability of Marketability
In the study of the mini-type cucumbers, all variables (DOS, FWL %, month, and cultivar) werestatistically significant in the ability to predict the probability of marketability when subjected to themultiple logistic regression model. In contrast, in the two studies of the LET cucumber, not all variableswere statistically significant because the high correlation effect of certain dependent variables in themultiple regression models produces nonsignificant effects in other dependent variables with lesscorrelation effect [20,35,36].
In the case of Levantino and Litoral (Table 10), the cultivar categorical variable was not consideredin the initial model after backward elimination, which may be related to the significantly lower cultivarcorrelation compared with that of the other variables (DOS, FWL %, month). Therefore, the generalmultiple logistic regression models were fitted except for DOS (Table 11), which does not affect thelogistic regression model since FWL % and DOS were highly correlated as previously described byother authors [20], and one can be replaced by the other.

Agronomy 2019, 9, 17 16 of 19
Table 10. Estimation of the multiple logistic regression parameters for the Levantino and Litoralcucumber cultivars.
VariablesCoefficients
Wald χ2 pOdds Ratio 95% CI for (Exp(β))
(α, β) (Exp(β)) Lower Upper
Constant 10.561 262.608 <0.000 38,613.016DOS −0.259 108.555 <0.000 0.772 0.735 0.810
FWL % −0.627 58.702 <0.000 0.534 0.455 0.627Month
November −2.809 79.297 <0.000 0.060 0.032 0.112December −2.246 60.086 <0.000 0.106 0.060 0.187
January Reference
Likelihood ratio (omnibus, p < 0.000). Hosmer–Lemeshow test (p = 0.072). DOS: Days of storage.CI: Confidence interval.
Table 11. Estimation of the multiple logistic regression parameters for the Levantino and Litoralcucumber cultivars.
VariablesCoefficients
Wald χ2 pOdds Ratio 95% CI for (Exp(β))
(α, β) (Exp(β)) Lower Upper
Constant 12.585 223.694 <0.000 29,2001.831FWL % −1.572 230.198 <0.000 0.208 0.169 0.254
PhenotypeLitoral −2.239 88.104 <0.000 0.107 0.067 0.170
Levantino ReferenceMonth
November −2.227 58.624 <0.000 0.108 0.061 0.191December −1.927 50.642 <0.000 0.146 0.086 0.248
January Reference
Likelihood ratio test (omnibus, p < 0.000). Hosmer–Lemeshow test (p = 0.128). DOS: Days of storage.CI: Confidence interval.
For the Valle, Galerno, and Poniente cultivars, when the months of evaluation, DOS, and FWL% were subjected to the multiple logistic regression analysis, almost all variables were found to bestatistically significant in the ability to predict the probability of marketability. The independentvariable month was the only nonsignificant variable; therefore, it was not included in Table 12. For themini-type cultivars, all variables were statistically significant (Table 13).
Table 12. Estimation of the multiple logistic regression parameters for the Galerno, Poniente, and Vallecucumber cultivars.
VariablesCoefficients
Wald χ2 pOdds Ratio 95% CI for (Exp(β))
(α, β) (Exp(β)) Lower Upper
Constant 6.964 251.516 <0.000 1058.172Phenotype
Valle −2.120 52.380 <0.000 0.120 0.068 0.213Galerno −1.581 15.203 <0.000 0.206 0.093 0.456Poniente Reference
DOS −0.248 38.792 <0.000 0.781 0.722 0.844FWL % −0.459 19.048 <0.000 0.632 0.515 0.777
Likelihood ratio (omnibus, p < 0.000). Hosmer–Lemeshow test (p = 0.236). DOS: Days of storage.CI: Confidence interval.
Agronomy 2019, 9, 17 17 of 19
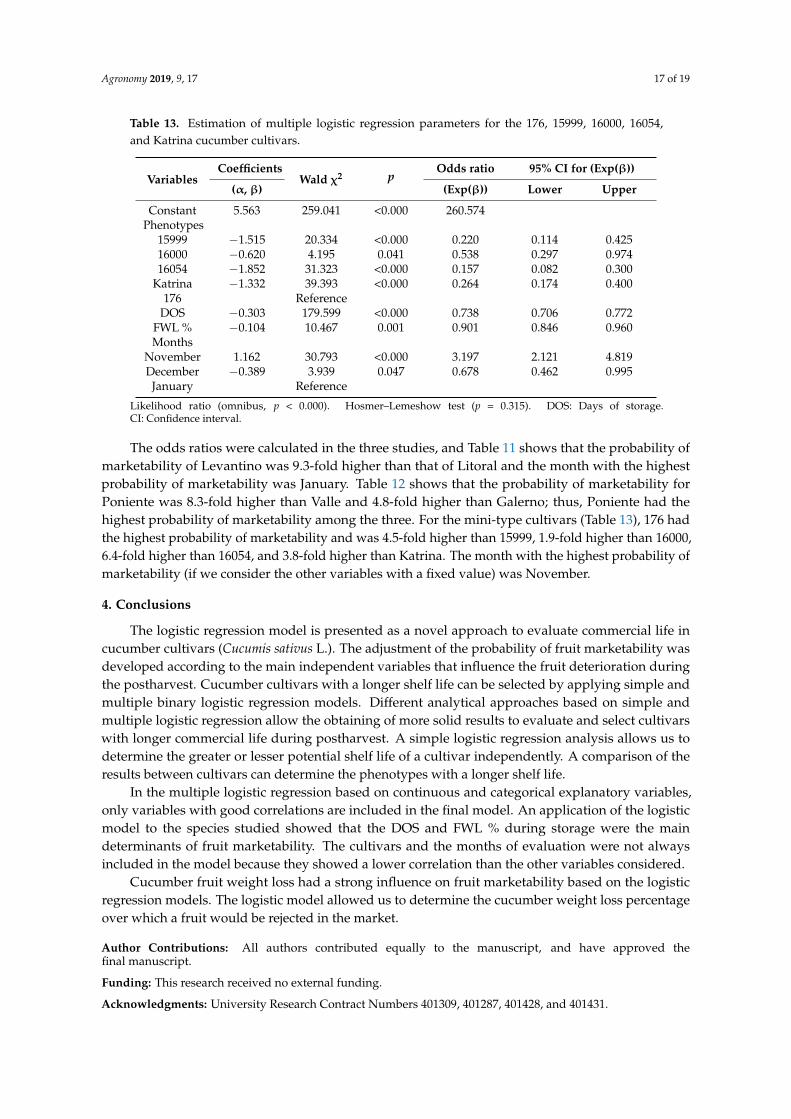
Table 13. Estimation of multiple logistic regression parameters for the 176, 15999, 16000, 16054,and Katrina cucumber cultivars.
VariablesCoefficients
Wald χ2 pOdds ratio 95% CI for (Exp(β))
(α, β) (Exp(β)) Lower Upper
Constant 5.563 259.041 <0.000 260.574Phenotypes
15999 −1.515 20.334 <0.000 0.220 0.114 0.42516000 −0.620 4.195 0.041 0.538 0.297 0.97416054 −1.852 31.323 <0.000 0.157 0.082 0.300
Katrina −1.332 39.393 <0.000 0.264 0.174 0.400176 Reference
DOS −0.303 179.599 <0.000 0.738 0.706 0.772FWL % −0.104 10.467 0.001 0.901 0.846 0.960Months
November 1.162 30.793 <0.000 3.197 2.121 4.819December −0.389 3.939 0.047 0.678 0.462 0.995
January Reference
Likelihood ratio (omnibus, p < 0.000). Hosmer–Lemeshow test (p = 0.315). DOS: Days of storage.CI: Confidence interval.
The odds ratios were calculated in the three studies, and Table 11 shows that the probability ofmarketability of Levantino was 9.3-fold higher than that of Litoral and the month with the highestprobability of marketability was January. Table 12 shows that the probability of marketability forPoniente was 8.3-fold higher than Valle and 4.8-fold higher than Galerno; thus, Poniente had thehighest probability of marketability among the three. For the mini-type cultivars (Table 13), 176 hadthe highest probability of marketability and was 4.5-fold higher than 15999, 1.9-fold higher than 16000,6.4-fold higher than 16054, and 3.8-fold higher than Katrina. The month with the highest probability ofmarketability (if we consider the other variables with a fixed value) was November.
4. Conclusions
The logistic regression model is presented as a novel approach to evaluate commercial life incucumber cultivars (Cucumis sativus L.). The adjustment of the probability of fruit marketability wasdeveloped according to the main independent variables that influence the fruit deterioration duringthe postharvest. Cucumber cultivars with a longer shelf life can be selected by applying simple andmultiple binary logistic regression models. Different analytical approaches based on simple andmultiple logistic regression allow the obtaining of more solid results to evaluate and select cultivarswith longer commercial life during postharvest. A simple logistic regression analysis allows us todetermine the greater or lesser potential shelf life of a cultivar independently. A comparison of theresults between cultivars can determine the phenotypes with a longer shelf life.
In the multiple logistic regression based on continuous and categorical explanatory variables,only variables with good correlations are included in the final model. An application of the logisticmodel to the species studied showed that the DOS and FWL % during storage were the maindeterminants of fruit marketability. The cultivars and the months of evaluation were not alwaysincluded in the model because they showed a lower correlation than the other variables considered.
Cucumber fruit weight loss had a strong influence on fruit marketability based on the logisticregression models. The logistic model allowed us to determine the cucumber weight loss percentageover which a fruit would be rejected in the market.
Author Contributions: All authors contributed equally to the manuscript, and have approved thefinal manuscript.
Funding: This research received no external funding.
Acknowledgments: University Research Contract Numbers 401309, 401287, 401428, and 401431.

Agronomy 2019, 9, 17 18 of 19
Conflicts of Interest: The authors declare no conflict of interest.
References
1. Ramírez-Pérez, L.J.; Morales-Díaz, A.B.; de Alba-Romenus, K.; González-Morales, S.; Benavides-Mendoza, A.;Juárez-Maldonado, A. Determination of Micronutrient Accumulation in Greenhouse Cucumber Crop Usinga Modeling Approach. Agronomy 2017, 7, 79. [CrossRef]
2. Wan, S.; Kang, Y.; Wang, D.; Liu, S.P. Effect of saline water on cucumber (Cucumis sativus L.) yield and wateruse under drip irrigation in North China. Agric. Water Manag. 2010, 98, 105–113. [CrossRef]
3. Gustavsson, J.; Cederberg, C.; Sonesson, U.; Van Otterdijk, R.; Meybeck, A. Pérdidas y Desperdicio deAlimentos en el Mundo. Alcances, Causas y Prevención. FAO: Roma, Italy, 2012. Available online:http://www.fao.org/3/a-i2697s.pdf (accessed on 15 November 2018).
4. Parfitt, J.; Barthel, M.; Macnaughton, S. Food waste within food supply chains: Quantification and potentialfor change to 2050. Philos. Trans. R. Soc. B Biol. Sci. 2010, 365, 3065–3081. [CrossRef] [PubMed]
5. Takeda, F.; Yang, W.; Li, C.; Freivalds, A.; Sung, K.; Xu, R.; Hu, B.; Williamson, J.; Sargent, S. Applying NewTechnologies to Transform Blueberry Harvesting. Agronomy 2017, 7, 33. [CrossRef]
6. Prusky, D. Reduction of the incidence of postharvest quality losses, and future prospects. Food Secur. 2011, 4,463–474. [CrossRef]
7. Kader, A.A. Flavor quality of fruits and vegetables. J. Sci. Food Agric. 2008, 11, 1863–1868. [CrossRef]8. Breene, W.M.; Davis, D.W.; Chou, H. Texture profile analysis of cucumbers. J. Food Sci. 1972, 37, 113–117.
[CrossRef]9. Kingston, B.D.; Pike, L.M. Internal fruit structure of warty and non-warty cucumbers and their progeny.
Hortic. Sci. 1975, 10, 319.10. Kader, A.A. Postharvest quality maintenance of fruits and vegetables in developing countries. In Postharvest
Physiology and Crop Preservation; Lieberman, M., Ed.; Plenum Press: New York, NY, USA, 1983; pp. 455–470.[CrossRef]
11. Valero, D.; Serrano, M. Postharvest Biology and Technology for Preserving Fruit Quality; CRC Press, Taylor &Francis Group: New York, NY, USA, 2010; p. 217, ISBN 978-1-4398-0266-3.
12. Kader, A.A. Tecnología Postcosecha de Cultivos Hortofrutícolas, 3rd ed.; University of California Publications:Oakland, CA, USA, 2011; ISBN 987-1-60107-744-8.
13. Schouten, R.E.; Jongbloed, G.; Tijskens, L.M.M.; van Kooten, O. Batch variability and cultivar keeping qualityof cucumber. Postharvest Biol. Technol. 2004, 32, 299–310. [CrossRef]
14. Reche, J. Cultivo del Pepino en Invernadero; Ministerio de Medio Ambiente y Medio Rural y Marino:Madrid, Spain, 2011; p. 262, ISBN 978-84-491-1112-9.
15. Lim, W.; Ehret, D. Nutrient Concentration and Fruit Thinning Affect Shelf Life of Long English Cucumber.HortScience 1991, 26, 1299–1300.
16. Schouten, R.E.; Tijskens, L.M.M.; van Kooten, O. Predicting keeping quality of batches of cucumber fruitbased on a physiological mechanism. Postharvest Biol. Technol. 2002, 26, 209–220. [CrossRef]
17. Jolliffe, P.A.; Lin, W.C. Predictors of shelf life in long English cucumber. J. Am. Soc. Hort. Sci. 1997, 122, 686–690.18. Muy-Rangel, D.; Siller-Cepeda, J.; Díaz-Pérez, J.; Valdéz Torres, B. Efecto de las condiciones de
almacenamiento y el encerado en el estatus hídrico y la calidad poscosecha de pepino de mesa.Rev. Fitotec. Mex. 2004, 27, 157–165.
19. Klieber, A.; Lin, W.C.; Jolliffe, P.A.; Hall, J.W. Training methods affect canopy light exposure and shelf life oflong English cucumber. J. Am. Soc. Hort. Sci. 1993, 118, 786–790.
20. Mohammadi, A.; Hashemi, M.; Hosseini, S.M. Postharvest treatment of nanochitosan-based coating loadedwith Zataria multiflora essential oil improves antioxidant activity and extends shelf-life of cucumber.Innov. Food Sci. Emerg. 2016, 33, 580–588. [CrossRef]
21. Yang, H.; Wu, F.; Cheng, J. Reduced chilling injury in cucumber by nitric oxide and the antioxidant response.Food Chem. 2011, 127, 1237–1242. [CrossRef]
22. Díaz-Pérez, M.; Carreño-Ortega, Á.; Gómez-Galán, M.; Callejón-Ferre, Á.-J. Marketability Probability Studyof Cherry Tomato Cultivars Based on Logistic Regression Models. Agronomy 2018, 8, 176. [CrossRef]
23. Silva, L.C.; Barroso, I.M. Regresión Logística; La Muralla: Madrid, Spain, 2004; p. 173, ISBN 847133738X.

Agronomy 2019, 9, 17 19 of 19
24. Hosmer, D.W.; Lemeshow, S.; Sturdivant, R.X. Applied Logistic Regression; John Wiley & Sons:Hoboken, NJ, USA, 2013; Volume 398, p. 500, ISBN 978-0-470-58247-3.
25. Collett, D.R. Modelling Binary Data, 2nd ed.; Chapman and Hall: London, UK, 2002; p. 408,ISBN 9871420057386.
26. Agresti, A. An Introduction to Categorical Data Analysis, 2nd ed.; John Wiley & Sons: Hoboken, NJ, USA, 1996;p. 372, ISBN 978-0-471-22618-5.
27. Kasmire, R.F.; Cantwell, M. Postharvest handling systems: Fruit vegetables. In Postharvest Quality ofHorticultural Crops, 3rd ed.; Kader, A.A., Ed.; University of California Publications: Oakland, CA, USA, 2011;pp. 457–474, ISBN 987-1-60107-744-8.
28. Thompson, J.F. Storange systems. In Postharvest Quality of Horticultural Crops, 3rd ed.; Kader, A.A., Ed.;University of California Publications: Oakland, CA, USA, 2011; pp. 73–76, ISBN 987-1-60107-744-8.
29. Meng, X.; Li, B.; Liu, J.; Tian, S. Physiological responses and quality attributes of table grape fruit to chitosanpreharvest spray and postharvest coating during storage. Food Chem. 2008, 106, 501–508. [CrossRef]
30. Kleinbaum, D.G.; Klein, M. Logistic Regression. A Self-Learning Text, 3rd ed.; Springer: New York, NY, USA,2010; p. 701, ISBN 978-1-4419-1741-6.
31. Commission Implementing Regulation (EU) No 543/2011 of 7 June 2011. Laying down Detailed Rules for theApplication of Council Regulation (EC) No 1234/2007 in Respect of the Fruit and Vegetables and Processed Fruit andVegetables Sectors; EU: Brussel, Belgium, 2011.
32. Bahnasawy, A.H.; Khater, E. Effect of wax coating on the quality of cucumber fruits during storage. J. FoodProcess Technol. 2014, 5, 2. [CrossRef]
33. Smith, N.J.S.; Tucker, G.A.; Jeger, J. Softening and cell wall changes in bananas and plantains. Asp. Appl. Biol.1989, 20, 57–65.
34. Valverde, J.M.; Guillén, F.; Martínez-Romero, D.; Castillo, S.; Serrano, M.; Valero, D. Improvement of tablegrapes quality and safety by the combination of modified atmosphere packaging (MAP) and eugenol,menthol, or thymol. J. Agric. Food Chem. 2005, 53, 7458–7464. [CrossRef] [PubMed]
35. Tolesa, G.N.; Workneh, T.S.; Melesse, S.F. Logistic regression analysis of marketability of tomato fruitharvested at different maturity stages and subjected to disinfection, storage condition and storage periodtreatments. Biol. Agric. Hortic. 2017, 1, 40–52. [CrossRef]
36. Melesse, S.; Sobratee, N.; Workneh, T.S. Application of logistic regression statistical technique to evaluatetomato quality subjected to different pre-and postharvest treatments. Biol. Agric. Hortic. 2016, 4, 277–287.[CrossRef]
© 2019 by the authors. Licensee MDPI, Basel, Switzerland. This article is an open accessarticle distributed under the terms and conditions of the Creative Commons Attribution(CC BY) license (http://creativecommons.org/licenses/by/4.0/).
Copyright © 2022 FDOKUMEN