Structural Method Statement for Basement Development at 9 ...
Upload
independentCategory
view
2download
0
Acta med. scand. Vol. 194, pp. 3 9 4 7 , 1973
HUMAN GLOMERULAR BASEMENT MEMBRANE: CHEMICAL COMPOSITION IN DIABETES MELLITUS
N. Gunnar Westberg and Alfred F. Michael
From Medical Deparfment V , Sahlgren's Hospital, University of Goteborg, Goteborg, Sweden, and the Department of Pediatrics, University of Minnesota, Minneapolis, Minn., USA
Abstract. Glomerular basement membrane (GBM) was isolated from human kidneys obtained at autopsy or nephrectomy in preparation for transplantation. Kidneys from 22 patients were used: 10 patients without a history of diabetes mellitus or kidney disease and with normal kidney morphology, 5 with a short history of diabetes and minimal pathological changes in the kid- neys, and 7 with very advanced diabetic nephropathy. The GBM preparations were individually analysed for amino acids, carbohydrates, phospholipids and cholesterol. The cystine concentration was found to be lower both in early diabetic nephropathy and advanced diabetic nephro- pathy than in normal kidneys. In advanced diabetic nephropathy a significant decrease in the content of sialic acid was found. Contrary to other reports there was no increase in the amounts of hydroxylysine or glu- cosyl-galactosyl-hydroxylysine. The influence of technical factors on the chemical composition of GBM prepara- tions is discussed.
Thickening of the capillary and arteriolar base- ment membranes is a prominent feature in diabetes mellitus, at least in the advanced stage. These changes in the basement membrane, particularly of the glomerular capillaries, have been the sub- ject of extensive investigations (2, 3, 10, 19). A study of the possible biochemical alterations that correlate with this membrane thickening could contribute to our understanding of the patho- genesis of diabetic vascular disease.
Based on our previous experience with the pre- paration and analysis of normal human glomerular basement membrane (GBM) (26) we have studied the chemical composition of GBM prepared from kidneys with mild or advanced diabetic nephro- pathy.
MATERIAL AND METHODS
In general only one kidney was available from each patient for this study. Ten normal kidneys were obtained
from persons killed in accidents. Three of the normal kidneys were perfused with 3 % low molecular weight dex- tran containing lidocaine and heparin as used in pre- paration for kidney transplantation (6) , which was not undertaken. Kidneys from 12 diabetic patients were ob- tained at autopsies performed within 12 h of death or by nephrectomy before kidney transplantation. Glomeruli and human GBM were prepared as previously described from kidneys that were fresh or had been stored at -20" (26). Samples of fresh kidney tissue were fixed in buffered formalin for light microscopy and sections were studied af- ter staining with hematoxylin-eosin, periodic acid-Schiff and azocarmine. Snap-frozen tissue was studied by immuno- fluorescence for the presence of IgG, IgM, fibrin and 6,C as previously described (14). The purity of the GBM preparation was evaluated by phase contrast microscopy. In a few cases from each group isolated GBM, after washing in distilled water, was fixed in cold 2% glu- taraldehyde buffered in sodium cacodylate (pH 7.4) and embedded in Vestopal, and thin sections (0.5 p) were prepared and stained with toluidine blue for light micro- scopy.
The diagnosis of diabetes mellitus was based upon the clinical picture, including a history of chemical diabetes and insulin dependency. The pathological changes in the kidneys were in all cases compatible with diabetic kidney disease; in no cass was there reason on clinical or patho- logical grounds to suspect a complicating pyelonephritis or other kidney disease. The glomerular changes observed by light microscopy were evaluated, and the degree of apparent basement membrane thickening, increase in mesangial material and proliferation of endothelial and epithelial cells were semiquantitatively graded from 0 to 3 + , with employed for questionable or very localized changes. The number of completely hyalinized glomeruli per 100 glomeruli was counted.
Based on the degree of pathoEgica1 alterations in the kidneys the material was divided into two groups, early diabetes and advanced diabetes (Table I). Three of the five kidneys in the early diabetic group (nos. 91, 92 and 144) have been discussed in an earlier publication (27) and were then included in the group normal pathology or minimal lesions (Figs. 1-3, ref. 27). All the five patients in this group had shown a consistently normal serum creatinine; two had slight proteinuria (nos. 95 and 141). The duration of diabetes was 2-8 years. All diabetic
Acta med. scand. 194

40 N . G. Westberg and A . F. Michael
Table I. Semiquantitative evaluation of glomerirlar pathology
Known Proliferation Age of duration of Basement Mesangial Hyalinized Deposition on GBM
Kidney pats. diabetes membrane material glomeruli Endothelial- no. (Y.) (Y.) thickening increase ( % ) Mesangial epithelial IgG PIC Fibrin
Early diabetes 91 I0 92 14 95 32
141 12 I44 I I
Adoanced diabetes 124 26 125 42 I28 35 I35 21 I45 32 150 35 I 5 5 42
2 4 8 8 7
-, 20 -' 20
20 > 20
20 20 ; 20
0 0 i I t
I + 1 1 1 1 ' 3 3 1 I
0 i- l l 21 I t
I + 3 1 2 t 21 3 t 3 t 1 1
0 0 0 0 0
90 60 50 50 35 50 30
0 0 0 I i
0 I 1 1 1 I t 0 I , 0
0 0 0 0 0
0 I I 0 0 0 0 0
I c 0 0 I h 0 I 0 0 0 I 1 I 1 3 -
I d 1 1 1
0 0 0 0 0 0 2 1 1 ' 0 0 1 1 0 0 27 0 0 21 0 I 1 I t 1 '
patients in both groups had been treated with insulin. Only one patient (no. 141) had adult onset type of dia- bztes mellitus. Five of the seven kidneys in the advanced diabetic group (nos. 124, 125, 128, 135 and 150) were included in a previous publication (27). The duration of diabetes in this group was more than 20 years in all cases.
In the normal control group the light microscopy of the glomeruli was considered to be within normal limits in all cases, but slight arteriolar thickening was seen in some of the kidneys from the older patients. The age of the patients in this group was 14-55 years (mean 35). There was no evidence of diabetes in their clinical history.
Chemical analysis for amino acids, carbohydrates, phos- pholipids, cholesterol and serum proteins, and analysis
for water content, were performed as described previously (26). However, for the analysis of glucose, galactose and mannose the TechniconQ Automatic Carbohydrate Ana- lyzer was used as described by Catravas (7). Glucosyl- galactosyl-hydroxylysine (Glc-Gal-HyLys) and fr?e hy- droxylysine were measured after alkaline hydrolysis as described by Spiro (23). GBM samples isolated from normal and abnormal kidneys were analysed in random order to increase the reliability of comparisons of group averages.
Statistical significance of group differenccs was tested using Student's t-test. Appropriate formulas for the ana- lysis of independent samples with unequal variances were used when indicated by the F-test. Linear regression and correlation coefficient were calculated according to
Fig. 1. One of the more severely affected glomeruli in sections from kidney 141. This kidney showed the most abnormal histology in the early diabetic group. A slight to moderate increase in mesangial material ig s-en. PAS stain. x 600.
Acta med. scand. 194
Glomerular basement membrane in diabetes 41
Fig. 2. A glomerulus from kidney 124 in the advanced diabztic group. About 90% of the glxneruli in this kidney were hyalinized. The remaining glomeruli showed a substantial increase in mesangial material and the basement membranes appcared to be thickened. PAS stain. x 600.
standard methods (20). A two-sided hypothesis was as- sumed in all cases. A paired comparison on the basis of age match was not done, as none of the chemical constituents studied showed any age-dependent trend and the age distribution in the three groups of patients was similar.
RESULTS
Glomerular pathology. The results of the semi- quantitative evaluation of gIomeruIar pathology are given in Table I. In the early diabetic group no definite thickening of the GBM was apparent by light microscopy. An increase in mesangial material was observed in three of the five kid- neys in this group. Typical hyaline mesangial nodules were not observed in any of these kidneys, but were not systematically sought for by serial sectioning. The most advanced changes in glomer- ular pathology in this group were found in kid- ney 141 (Fig. 1). Immunofluorescent microscopy showed one kidney only to be completely negative for IgG, PIC and fibrin. Linear staining for IgG and fibrin was observed in all glomeruli from four and three kidneys, respectively, and granular as well as linear deposition of p l C were seen in a few glomeruli from two kidneys.
In kidneys from the advanced diabetic group apparently thickened basement membranes and increased amounts of mesangial material were present in all cases; proliferation was slight or absent (Fig. 2). Immunofluorescent microscopy:
A linear deposition of IgG and fibrin was found on the GBM in two and one kidneys, respectively, while a linear and granular deposition of PIC was found in five kidneys.
Within the early and advanced diabetic groups no correlation was apparent between the degree or type of pathological abnormality seen and the biochemical composition.
Preparation of GBM. No special difficulties were encountered in the preparation of GBM from kidneys in the early diabetic group. In the advanced diabetic group a large percentage of the glomeruli remained intact after 7 min of soni- cation and were removed by the 250 mesh sieve. On phase contrast microscopy or light micro- scopy of thin sections no difference was observed in purity or appearance between various prepara- tions. The yield of lyophilized GBM was 23.0f 7.3 mg, 22 .0 i6 .2 and 36.8211.5 (mean+S.D.) mg per kidney in the normal, early diabetic and advanced diabetic groups, respectively. These dif- ferences were not statistically significant.
Water content. The overnight weight loss of three GBM samples on drying at 105" was 4.4, 4.7 and 6.1 % , respectively. All analytical results in this paper are adjusted for a water content of 5.1%. Lipid composition. The results of the analyses
for phospholipid phosphorus and cholesterol are given in Table 11. One sample only, prepared from a kidney in the advanced diabetic group, was ex-
Actu med. scand. 194
42 N . G. Westberg and A . F . Michael
Table 11. Ligid composition of GBM (mean and range)
No. of samples analysed given in italics
Normal kidneys Early diabetes Advanced diabetes
Phospholipid phosphorus (pg/mg) 0.71 (0.50-0.98) 5 1.02 (0.71-1.48) 5 0.95 (0.70-1.05) 4 Cholesterol (pg/rng) 9.05 (5.50-12.3) 4 9.07 I 21.7 (17.5-30.0) 3 Ratio cholesterol/phospholipid phosphorus 14.3 (8.9-16.4) 4 12.2 I 22.9 (16.2-28.0) 3
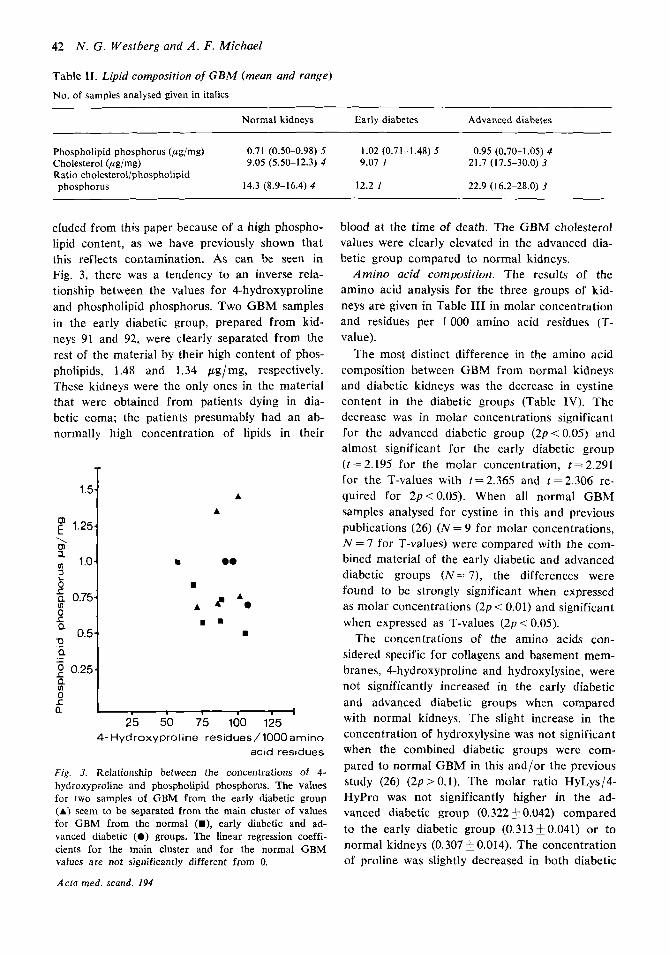
cluded from this paper because of a high phospho- lipid content, as we have previously shown that this reflects contamination. As can be seen in Fig. 3, there was a tendency to an inverse rela- tionship between the values for 4-hydroxyproline and phospholipid phosphorus. Two GBM samples in the early diabetic group, prepared from kid- neys 91 and 92, were clearly separated from the rest of the material by their high content of phos- pholipids, 1.48 and 1.34 ,ug/mg, respectively. These kidneys were the only ones in the material that were obtained from patients dying in dia- betic coma; the patients presumably had an ab- normally high concentration of lipids in their
1.5
f 1.25 \ m a a 1.0 2 0 8 5: 0.75 0 S Q
0.5 0 Q
2 0.25 .- -
a 8 L Q
A A
m 0.
A A? A.
w . . I
25 50 75 100 125 4 - H y d r o x y p r o l i n e r e s i d u e s / l O O O a m i n o
acid r e s i d u e s
Fig. 3. Relationship between the concentrations of 4- hydroxyproline and phospholipid phosphorus. The values for two samples of GBM from the early diabetic group (A) seem to be separated from the main cluster of values for GBM from the normal (U), early diabetic and ad- vanced diabetic (0) groups. The linear regression coeffi- cients for the main cluster and for the normal GBM values are not significantly different from 0.
Acta med. scand. 194
blood at the time of death. The GBM cholesterol values were clearly elevated in the advanced dia- betic group compared to normal kidneys.
Amino acid composition. The results of the amino acid analysis for the three groups of kid- neys are given in Table I11 in molar concentration and residues per 1000 amino acid residues (T- value).
The most distinct difference in the amino acid composition between GBM from normal kidneys and diabetic kidneys was the decrease in cystine content in the diabetic groups (Table IV). The decrease was in molar concentrations significant for the advanced diabetic group (2p<0.05) and almost significant for the early diabetic group ( t = 2.195 for the molar Concentration, t = 2.291 for the T-values with t=2.365 and t=2.306 re- quired for 2p<0.05). When all normal GBM samples analysed for cystine in this and previous publications (26) ( N = 9 for molar concentrations, N = 7 for T-values) were compared with the com- bined material of the early diabetic and advanced diabetic groups ( N = 7), the differences were found to be strongly significant when expressed as molar concentrations (2p < 0.01) and significant when expressed as T-values ( 2 p < 0.05).
The concentrations of the amino acids con- sidered specific for collagens and basement mem- branes, 4-hydroxyproline and hydroxylysine, were not significantly increased in the early diabetic and advanced diabetic groups when compared with normal kidneys. The slight increase in the concentration of hydroxylysine was not significant when the combined diabetic groups were com- pared to normal GBM in this and/or the previous study (26) ( 2 p > 0.1). The molar ratio HyLys/4- HyPro was not significantly higher in the ad- vanced diabetic group (0.322 * 0.042) compared to the early diabetic group (0.313i0.041) or to normal kidneys (0.307 0.014). The concentration of proline was slightly decreased in both diabetic

Glomerular basement membrane in diabetes 43
Table 111. Amino acid composition of human CBM
3-hydroxyproline 4-hydroxyproline Aspartic acid Threonine Serine Glutamic acid Proline Glycine Alanine Valine Methionine lsoleucine Leucine Tyrosine Phenylalanine Hydroxylysine Lysine Histidine Arginine Half-cystine
Amount (pM/100 mg, mean +S.E.M.) Residues per 1 000 amino acid residues (T-values)
Normal kidneys (N= 8)
14.1 I0 .72 63.1 k4.35 50.6+ 1.57 28.1 _+ 0.82 37.1k1.59 71.2-t 2.57 46.82 2.10
159.05 5.01 41.02 1.23 25.8+- 1.01 12.2+ 0.72 23.41 0.58 49.8 k 1.34 11.620.44 21 ,850.55 I8.5k 0.91 14.92 0.85 10.8f0.52 30.52 1.19 18.3 20.62
Early diabetes (N=4)
14.7 k0.90 68.623.29 48.6k1.74 27.9_f I . I7 35.8 f 1 .I7 68.4f 1.49 41.8k I .74*
152.7j5.89 39.020.74 26.4 f 1.62 1 l .2f 1.04 22.9F0.33 48.2k 1.29 11.6fO.46 23.4-t 1 . I 1 19.1+1.70 18.4f1.60* 12.3 +0.67** 27.1 24.45 13.7k 1.99*
Advanced diabetes (N=5)
12.1+1.37 62.3 f4.59 45.5 f 2.78 27.7f 1.62 3 1.6+2.11* 65.8 i 2.88 42.6f3.25
156.3 7.97 37.2f2.17 26.7 -t 0.96 12.41 1.39 2 3 . 2 j 0.3 1 45.1 f2.14
21.720.86 19.5f1.39 lS.9k 1.88
30.3 j 3.09 13.5$-2.09**
12.2j1.17
10.1j1.21
Normal kidneys ( N - 10)
18.5i0.93 82.22 4.52 67.6f 1.39 37.6 1 0.56 49.551.07 93.95 2. I3 62.5+ 1.67
210.5 + 4.14 54.820.66 34.821.10 17.65 1.08 3 1.7 2 0.64 66.8+ 1.18 16.OkO.47 29.1 2 0.43 24.910.97 20.4 20.99 14.5f0.61 41.52 1.64 26.1i1.63
Early diabetes ( N = 5 )
18.6k 1.62 88.6f 5.43 66.3f 1.65 37.5 i 0.97 48.4f0.96 91 .0 i 1.32 58.4k 2.69
206.51 7.85 52.1 +0.99** 35.7f 1.46 16.4+ 1.64 31.81 0.79 65.82 1.04 16.01 0.44 31.6+0.94** 27.012.17 24.4 2 1.65 * 16.62 0.63** 38.1 i 4.74 18.91 2.68*
Advanced diabetes (N=5)
16.8k 1.95 88.127.92 63.7k2.59 38.9 -t 2.05 45.7f 1.53* 92 .4 i 1.93 59.5i. 3.18
220.1 i: 7.62 52.2 f 1.83 37.7 f 2.1 7 18.1 22.00 32.6 k 0.72 63.2f1.74 16.9i. 1.19 30.5 k 0.78 27.3 f 1.65
14.0j1.27 42.2 k 3.07 19.6f 3.03
22.222.02
Average+ S.E.M. Nine, five and four samples, respectively, were analysed in triplicates or duplicates and the averages were used for calculation of S.E.M. Six, four and three samples, respectively, were analysed in triplicate for cystine and methio- nine. Residues per 1 000 amino acid residues calculated without regard to tryptophan, which was not analysed. Because of a low sum of molar concentrations of amino acids, 2 samples of normal GBM and I sample in the early diabetic group were used only for the calculation of residues per 1 000 amino acid residues. * 0.05-<2pi0.10, * * 0.02<2p<0.05, when compared to normal GBM.
groups as compared to normal kidneys. There compared to the normal kidneys, but the differ- was a slight increase in lysine and histidine ( 2 p < ences reached significance ( 2 p < 0.05) only when 0.10 and 2 p < 0.05, respectively) in the early dia- the early and advanced diabetic groups were com- betic but not in the advanced diabetic group. A bined and the values were expressed as residues small decrease in the concentration of alanine and per 1000 amino acid residues. The concentra- a small increase in the concentration of phenyl- tion of serine was also slightly decreased in the alanine was evident for both diabetic groups when diabetic kidneys.
Table 1V. Comparison of data for cystine iri normal and diabetic kidney GBM
Concentration of half-cystine
Residues per 1 000 amino acid residues (T)
1. Normal kidneys 18.3k0.62 ( N = S ) 11. Early diabetes 13,7+ 1.99 (N=4)
I l l . Advanced diabetes 13.5k2.09 ( N = 3 )
1V. Normal kidneys (present
2p i0 .10 (I versus 11)
2p<0.05 (I versus 111)
17.9j0.47 ( N - 9)
2p < 0.025 (I versus I1 I 2pi0.01 (IV versus 11 1
and previous publication (26)) 11. + I l l . All diabetic kidneys 33.6f1.33 (N=7)
111) - 111)
26.1i1.63 (N=6) 18.922.68 “-4) 2p<0.10 (I versus 11) 19.6f3.03 (N=3) 2p>0.10 (I versus 111)
25.2+ 1.62 (N-7) 19.2k1.84 (N=7) 2p<0.002 (I versus I1 I 111) 2p < 0.05 (IV versus II i 111)
Acta med. scand. 194
44 N . G. Westberp and A . F . Michael
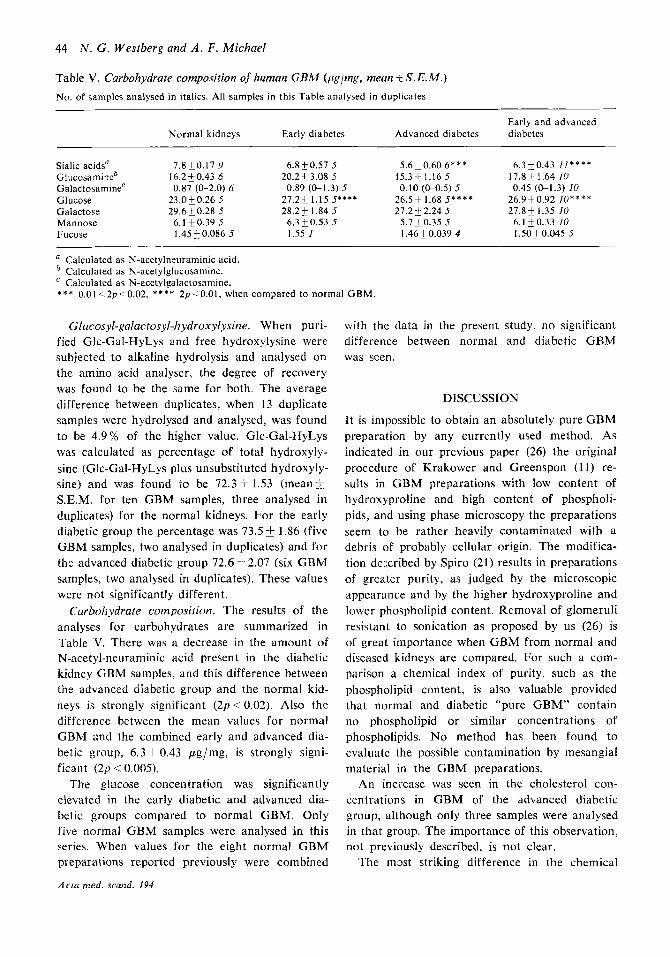
Table V. Carbohydraie composition of human CBM (pglmg, mean I S . E.M.) No. of samples analysed in italics. All samples in this Table analysed in duplicates
Early and advanced Normal kidneys Early diabetes Advanced diabetes diabetes
Sialic acidsa 7.8+0.17 Y 6.8 50.57 5 5.6k0.60 6 * * * 6.310.43 / I * * * * Glucosamineb 16.2 & 0.43 6 20.2 5 3.08 5 15.3-t 1.16 5 17.8 & 1.64 IU G alact osa mine' 0.87 (0-2.0) 6 0.89 (0-1.3) 5 0.10 (0-0.5) 5 0.45 (0-1.3) 10 Glucose 23.0k0.26 5 27.25 1.15 5*** * 26.5+ 1.68 5 * * * * 26.9k0.92 lo**** Galactose 29.6 k 0.28 5 28.2k 1.84 5 27.2 F 2.24 5 27.8-t 1.35 I0 Mannose 6.1 k0.39 5 6.3k0.53 5 5.7 k 0.35 5 6. I k 0.33 10 Fucose 1.45 0.086 5 1.55 1 1.46 0.039 4 I .50 0.045 5
a Calculated as N-acetylneuraminic acid. * Calculated as N-acetylglucosamine.
Calculated as N-acetylgalactosamine. * * * 0.01 .-2p<0.02, * * * * 2p.: 0.01, when compared to normal GBM.
Glucosyl-galactosyl-hydroxylysine. When puri- fied Glc-Gal-HyLys and free hydroxylysine were subjected to alkaline hydrolysis and analysed on the amino acid analyser, the degree of recovery was found to be the same for both. T h e average difference between duplicates, when 13 duplicate samples were hydrolysed and analysed, was found to be 4.9% of the higher value. Glc-Gal-HyLys was calculated as percentage of total hydroxyly- sine (Glc-Gal-HyLys plus unsubstituted hydroxyly- sine) and was found to be 72.3 1.53 (mean & S.E.M. for ten GBM samples, three analysed in duplicates) for the normal kidneys. For the early diabetic group the percentage was 73.5 f 1.86 (five GBM samples, two analysed in duplicates) and for the advanced diabetic group 72.6 f 2.07 (six GBM samples, two analysed in duplicates). These values were not significantly different.
Carbohydrate composition. The results of the analyses for carbohydrates are summarized in Table V. There was a decrease in the amount of N-acetyl-neuraminic acid present in the diabetic kidney GBM samples, and this difference between the advanced diabetic group and the normal kid- neys is strongly significant ( 2 p < 0.02). Also the difference between the mean values for normal GBM and the combined early and advanced dia- betic group, 6 .3k0 .43 ,ug/mg, is strongly signi- ficant (2p < 0.005).
The glucose concentration was significantly elevated in the early diabetic and advanced dia- betic groups compared to normal GBM. Only five normal G B M samples were analysed in this series. When values for the eight normal G B M preparations reported previously were combined
Acta med. scand. I94
with the data in the present study, n o significant difference between normal and diabetic GBM was seen.
DISCUSSION
I t is impossible to obtain an absolutely pure G B M preparation by any currently used method. As indicated in our previous paper (26) the original procedure of Krakower and Greenspon (11) re- sults in G B M preparations with low content of hydroxyproline and high content of phospholi- pids, and using phase microscopy the preparations seem to be rather heavily contaminated with a debris of probably cellular origin. The modifica- tion described by Spiro (21) results in preparations of greater purity, as judged by the microscopic appearance and by the higher hydroxyproline and lower phospholipid content. Removal of glomeruli resistant to sonication as proposed by us (26) is of great importance when GBM from normal and diseased kidneys are compared. For such a com- parison a chemical index of purity, such as the phospholipid content, is also valuable provided that normal and diabetic "pure GBM" contain no phospholipid or similar concentrations of phospholipids. No method has been found to evaluate the possible contamination by mesangial material in the GBM preparations.
An increase was seen in the cholesterol con- centrations in G B M of the advanced diabetic group, although only three samples were analysed in that group. The importance of this observation, not previously described, is not clear.
The m s t striking difference in the chemical

Glornerular basement membrane in diabetes 45
composition between GBM samples from normal and diabetic kidneys was the decrease in cystine content in diabetic GBM. This decrease was seen in both early and advanced diabetes. When cys- tine values derived from all the diabetic GBM samples were compared with values for all the normal human GBM samples analysed by us, the decrease was statistically strongly significant.
This decrease in content of one amino acid cannot be explained on the basis of contamina- tion of the samples with cellular material, as this would have reduced to an equal extent the con- centration of, e.g., 3- and .l-hydroxyproline, hy- droxylysine and glycine, a pattern which we have repeatedly seen in GBM samples obtained by centrifugation at a higher g-force than used in this study. Contamination with collagen can also be excluded as the cause of this change in com- position, as this would increase the concentrations of proline, glycine and alanine and decrease the concentrations of threonine, methionine, isoleu- cine, tyrosine and hydroxylysine, changes that were not seen in these samples. A contaminating material that could explain the decrease in cystine would thus have to be of a composition very similar to GBM but with a low cystine content. Whether the mesangial intercellular substance fulfils these criteria cannot be decided at this tim:, as no satisfactory method has been described to obtain pure mesangial material.
By light microscopy no increase in mesangial material could be found in two kidneys in the early diabetes group (nos. 91 and 92). The GBM prepared from these kidneys had a low cystine content, similar to the mean values discussed.
The biological importance of a decrease in the cystine concentration in diabetic GBM is not clear, but a decrease in the number of disulfide bridges, whether inter- or intramolecular, could well be a cause of increased permeability to larger molecules, such as serum albumin.
For the remaining amino acids some dissimilari- ties were observed between the groups, but these differences were quite small and of low statistical significance. When so many numbers are com- pared, some differences of small statistical signi- ficance should occur according to the laws of probability. No major differences in the concen- trations of hydroxylysine, lysine or hydroxypro- line were found.
In the carbohydrate analysis a strongly signi-
ficant decrease in the sialic acid concentration was observed in GBM prepared from kidneys with advanced diabetic nephropathy. GBM from the group early diabetes also showed a slight but not significant decrease in the sialic acid content. No difference was found in the concentrations of hexosamines and fucose, indicating that the number of heteropolysaccharide molecules was un- changed ( 2 2 ) . The most probable explanation is that the amount of sialic acid per heteropolysac- charide molecule in the GBM is decreased in the advanced diabetic group. This question can only be answered by a careful study of the composition of the isolated heteropolysaccharide in GBM samples prepared from a large number of kidneys showing diabetic nephropathy.
The amount of glucose was decreased and the galactose/glucose ratio increased in the five nor- mal GBM samples analysed in this study com- pared to the eight normal GBM samples reported in our previous paper (26). The amount of glu- cose in the two diabetic GBM groups in the present study was similar to that reported for normal GBM in our previous publication. Thus, our studies do not conclusively prove the presence or absence of a change in diabetic GBM in the concentration of glucose and galactose, but minor differences may have been overlooked because of the relatively large intersample variation for glu- cose and galactose.
Tornblom (25) described a method for isolating the hyalinized glomeruli resistant to ultrasonic vibration from diabetic kidneys and compared the biochemical composition of this hyalinized material to that of intact glomeruli isolated from normal human kidneys. No consistent difference was seen between the preparations obtained from normal and from diabetic kidneys (18).
In their extensive study on GBM from normal and diabetic human kidneys Lazarow and Speidel (12) found no difference in the overall chemical composition, except for a slight increase in the ratio hydroxyproline/nitrogen in the diabetic GBM. The use of alkali in the preparation of GBM in their study may have led to alterations in the GBM glycoprotein.
Deisswenger and Spiro (1) reported data on the chemical composition of GBM isolated from kidneys obtained at autopsy from eight diabetic individuals showing moderate to severe degrees of mcsangial and basement membrane changes.
Acta med. scand. 194

46 N . G. Westberg and A . F . Michael
They found in the diabetic GBM samples a signi- ficant increase in the hydroxylysine content and a decrease in the lysine content, while the sum of the concentrations of hydroxylysine and lysine was constant. The amount of Glc-Gal-HyLys was also increased in GBM from the diabetic kidneys.
We cannot confirm the observations of Beis- swenger and Spiro ( 1 ) of an increased hydroxyla- tion of lysine in GBM from diabetic kidneys. On the contrary we found a slight and statistically not significant increase (0.1 < 2 p < 0.2) in the ly- sine concentration in GBM from the early dia- betic group. In our experience a high value for lysine in GBM isolated from normal kidney is found in samples contaminated with cellular ma- terial. A high lysine value is often found together with a high phospholipid concentration, but in our limited material this correlation did not quite reach statistical significance. I t is conceivable that under certain circumstances the thicker base- ment membrane from diabetic kidneys may give a GBM preparation of higher purity than GBM from normal kidneys. The lysine value reported by Beisswenger and Spiro for GBM from normal kidneys (25.4 0.94 residues per 1 000 amino acid residues) is higher than ours (20.4 0.99). Differ- ences in the purity of the GBM preparations ob- tained could possibly explain the discrepancy be- tween the results obtained in our study and those reported by Beisswenger and Spiro.
The suurce of the diabetic kidneys could d s o be of importance. All the kidneys in the advanced diabetic group in this study were obtained by nephrectomy from patients awaiting kidney trans- plantation. These patients had been hospitalized for some t:me before the opzration and their dia- betes was well controlled. In the early diabetic group only two patients are known not to have been in good diabetic control when the kidneys were obtained. The kidneys used by Beisswenger and Spiro werc obtained at autopsy. It is possible that insufficient metabolic control during the final period before death in these patients may have influenced the composition of the GBM, as is indicated by the sensitivity of the kidney glucosyl transferase to insulin or glucose concentrations in the experiments on alloxan diabetic rats de- scribed by Spiro and Spiro (24).
A striking difference in the carbuhydrate com- position in this study between GBM isolated from normal and diabetic kidneys is a decreased con- .4cta med. scand. 194
centration of sialic acid in the diabetic prepara- tions. The presence of sialic acid in the basement membrane proper has been challenged primarily on histochemical grounds. Mohos and Skoza (15) and Michael et al. (13) found that the basement membrane shows no or only a weak reaction with colloidal iron. Nolte and Ohkuma (17), Jones (9) and Geyer et al. (8), on the other hand, found a weak staining for colloidal iron in the laminae rara externa and interna. The basement mem- brane may be a not entirely homogenous struc- ture, and variations in the proportions of laminae rara and laminae densa could possibly explain the difference in sialic acid content between normal and diabetic GBM. Mohos and Skoza (16) pointed out that the sialic acid concentration decreased with decreasing centrifugal force when sonicated glomeruli were centrifuged in 1.5 M NaCI, indi- cating that a t least some of the sialic acid found in the basement membrane preparations could be contained in cellular material contaminating the preparation.
It has recently been shown by Blau and Michael (5) that in rats, made nephrotic with puromycin aminonucleoside, the sialic acid concentrations are decreased in GBM and glomerular cell mem- brane preparations. Blau and Haas (4) have also shown that the colloidal iron staining for sialic acid residues in the glomeruli is decreased or absent in children with proteinuria secondary to glomerular disease, including the minimil lesion nephrotic syndrome. Whether the decreased stain- ing for sialic acids is secondary to the proteinuria or related to the cause of proteinuria is not clear.
No histochemical study of the basement mem- brane in diabetic kidneys using specific stains for polyanions h2.s been published, but could be of value to explain our results.
Despite its thickness, the GBM in kidneys from patients with diabetes mellitus appears to have an increased permeability to serum proteins. The finding in this study of decreased concentrations of sialic acids and cystine may be related to this phenomenon. Further studies, including both hu- man kidneys and kidneys from animals with ex- perimental or spontaneous diabetes, using histo- chemical and biochemical methods, will obviously be necessary.

Glomerular basement membrane in diabetes 47
ACKNOWLEDGEMENTS This work was supported by grants from the Swedish Diabetes Association and the National Institutes of Health (AM 13756, AM 12375, HE 05662, HE 06134, H 1263C).
1.
2. 3.
4.
5.
6.
7.
8.
9.
REFERENCES
Beisswenger, P. J . & Spiro, R. G.: Science 168: 596, 1970. Bell, E. T.: Amer. J. Path. 18: 744, 1942. Bergstrand, A. & Bucht, H . : J. Path. Bact. 77: 231, 1959. Blau, E. B. & Haas, J. E.: Proc. SOC. exp. Biol. (N.Y.). In press 1973. Blau, E. B. & Michael, A. F.: Proc. Sac. exp. Biol. (N.Y.) 141: 164, 1972. Brunius, U., Bergentz, S.-E., Ekman, H., Gelin, L.-E. & Westberg, G.: Scand. J. Urol. Nephrol. 2: 15, 1968. Catravas, G. N.: Technicon Symposium “Automation in Analytical Chemistry”, p. 397. Mediad Inc., Ards- ley, New York 1967. Geyer, G., Linss, W., Schaaf, P., Moller, 1. & Mul- ler, A.: Acta histochem. (Jena) 35: 67, 1970. Jones, D. B.: Lab. Invest. 21: 119, 1969.
10. Kimmelstiel, P., Osawa, G. & Beres, J.: Amer. J . clin. Path. 45: 21, 1966.
11. Krakower, C. A. & Greenspon, S. A,: Arch. Path. 51: 629, 1951.
12. Lazarow, A. & Speidel, E.: In: Small blood vessel involvement in diabetes mellitus (ed. M. Siperstein), p. 127. Amer. Inst. biol. Sci., Washington 1964.
13. Michael, A. F., Blau, E. & Vernier, R. L.: Lab. Invest. 23: 649, 1970.
14. Michael, A. F., Drummond, K. N., Good, R. A. & Vernier, R. L.: J. clin. Invest. 45: 237, 1966.
15. Mohos, S . C . & Skoza, L.: Science 164: 1519, 1969. 16. - J. biol. Chem. 45: 450, 1970. 17. Nolte, A. & Ohkuma, M.: Histochemie 17: 170, 1969. 18. Odin, L. & Tornblom, N.: Acta Sac. Med. upsalien.
19. Psterby Hansen, R.: Diabetologia 1: 97, 1965. 20. Snedecor, G. W. & Cochran, W. G.: Statistical meth-
ods, 6th ed. Iowa State University Press, Ames 1967. 21. Spiro, R. G.: J. biol. Chem. 242: 1915, 1967. 22. - J. biol. Chem. 242: 1923, 1967. 23. - J. biol. Chem. 242: 4813, 1967. 24. Spiro, R. G. & Spiro, M. J.: Diabetes 20: 641, 1971. 25. Tornblom, N.: Acta med. scand. 159: 370, 1957. 26. Westberg, N. G. & Michael, A. F.: Biochemistry 9:
27. - Diabetes 21: 163, 1972.
64: 313, 1959.
3837, 1970.
Acta med. scand. 194
Copyright © 2022 FDOKUMEN