Cardiac Markers as Diagnostic Biochemical Markers in Heart Failure
Upload
khangminh22Category
view
1download
0
Risk factors and Blood borne-
biochemical markers in type 2
diabetes mellitus
By
Shanthi Sharon Kappala, M.Sc.
A thesis submitted to the University of Central Lancashire in
partial fulfilment of the requirements for the degree of
Doctor of Philosophy
University of Central Lancashire
October 2012

Page I
“The Fear of the Lord is the beginning of wisdom”
Proverbs 1:7

Page II
Dedication
I dedicate this thesis to The Lord Almighty and my parents Suneeth Kumar John
Kappala and Kalpana Kappala for their boundless love, support and faith in me which
made me what I am today. Mom and Dad, I love you and thank you for trusting in me.
Your prayers kept me alive and never let me to give up on my dreams. This thesis
would have been incomplete without you.

Page III
Declaration
I declare that while registered as a candidate for this degree, I have not registered as a
candidate for any other award from an academic institution. The work present in this
thesis, except where otherwise stated, is based on my own research and has not been
submitted for any other award in this or any other University.
Signed
Shanthi Sharon Kappala (B.Sc., M.Sc.)

Page IV
Abstract
The burden of Diabetes Mellitus (DM) is increasing worldwide and it is estimated to
reach indefinite proportions of about 450 million by year 2030. Patients with type 2
diabetes mellitus (T2DM) have a significantly increased risk of developing
cardiovascular diseases (CVD). Moreover, CVD is the major cause of mortality and
morbidity (75%) in T2DM patients. DM itself has been long recognised as an
independent risk factor for several forms of CVD including coronary heart disease
(CHD), peripheral arterial disease, cardiomyopathy and congestive heart failure in both
men and women. It is well-known that T2DM is associated with several factors
including hyperglycaemia, hypertension, dyslipidemia, obesity all of which contribute
to CVD. In order to prevent CVD, early intervention on cardiovascular risk factors is
vital during clinical assessment of T2DM patients. A major role of inflammation has
been well described in the development of CVD in T2DM patients. Inflammatory
process and factors which contribute to CVD in T2DM patients have recently become a
focus in diabetic research. Elucidation of common patho-physiological mechanisms
among T2DM patients might emphasize the role of inflammation in CVD.
The main purpose of this study was to investigate any patho-physiological changes in
red blood cells (RBC), white blood cells (neutrophils and lymphocytes) and plasma,
measuring RBC membrane fragility and proteins, intracellular free calcium
concentrations [Ca2+
]i and several cations including Na+,
Mg2+
, Ca2+
, Fe2+
, Zn2+
and
Cu2+
, biochemical parameters and inflammatory mediators which normally serve as
independent predisposing risk factors for CVD among T2DM patients compared to age-
match healthy controls.
The results have shown that fura-2 loaded neutrophils and lymphocytes in blood from
T2DM patients contain significantly (p<0.05) less [Ca2+
]i than neutrophils and

Page V
lymphocytes from healthy subjects upon stimulation with physiological doses of either
fMLP or thapsigargin indicating a derangement in cellular calcium homeostasis during
T2DM. Similarly, RBC membranes from T2DM patients contained significantly
(p<0.05) more spectrin, ankyrin, band 3, band 4.1, glycophorin etc compared to RBC
membranes from age-matched healthy control subjects. The results also show that the
RBCs from T2DM patients were more fragile compared to RBC from healthy controls.
Measurement of protein glycation in plasma have revealed significantly (p<0.05) more
fluorescence in proteins form T2DM patients compared to control. In relation to plasma
cations and intracellular markers and mediators, the results show that plasma from
T2DM patients contain significantly (p<0.05) more Na+,
Mg2+
, Ca2+
, Fe2+
, Zn2+
and
Cu2+
compared to plasma levels from age-match healthy controls. Similarly, the
concentrations of kidney and liver function markers such as urea, creatinine, alkaline
phosphatase, ALT, AST, GGT, total protein and albumin increased significantly
(p<0.05) compared to healthy controls. The same is also true for glucose, total
cholesterol, triglycerides, CRP, HbA1c, WBC where the blood from T2DM patients
contained elevated concentrations compared to blood from healthy age-matched control
patients.
Together, the results of this study have clearly demonstrated marked and significant
changes in cellular calcium homeostasis in white blood cells, RBC membrane proteins
and fragility, plasma protein glycation and in plasma levels of cations, intracellular
markers and mediators of T2DM patients compared to healthy controls. Therefore, it is
proposed that an early integrated and multi-factorial intervention of risk factors and
inflammatory markers must be done in order to reduce the risk of CVD and possible
mortality of T2DM patients.

Page VI
Table of Contents
Dedication II
Declaration III
Abstract IV
List of Figures XV
List of Tables XVIII
Acknowledgements XIX
Abbreviations XXI
Chapter 1 Introduction 1
1.1 Scope of this study 2
1.2 Type 2 Diabetes Mellitus (T2DM) 3
1.2.1 Classification of Diabetes 4
1.2.2 Symptoms 5
1.2.2.1 Hypoglycaemia 5
1.2.2.2 Hyperglycaemia 5
1.2.2.3 Diet, physical activity and diabetes 6
1.3 Epidemiology of T2DM 8
1.4 Pathogenesis of T2DM 9
1.5 Diagnosis 10
1.6 Type 2 diabetes: genetic and environmental factors 12
1.7 Cellular basis for type 2 diabetes 13
1.7.1 Introduction 13
1.7.2 Insulin resistance 13
1.7.3 Insulin secretion 16
1.8 Genetics of type 2 diabetes mellitus 18

Page VII
1.8.1 Candidate genes for type 2 diabetes 20
1.9 Cardiovascular diseases 22
1.9.1 Development of atherosclerosis 22
1.9.2 Role of inflammation in the pathogenesis of atherosclerosis 26
1.9.3 Endothelial Dysfunction 27
1.9.3.1 Initiation of the atherosclerotic lesion; where inflammation
meets endothelial dysfunction
28
1.10 Diabetes-induced changes in myocardial fuel selection 28
1.11 Metabolic syndrome 29
1.12 Obesity- a major health concern 29
1.12.1 Measurement of obesity 29
1.13 Diabetes mellitus and cardiovascular disease 32
1.13.1 Epidemiology of CVD 32
1.13.1.1 The concept of ―risk factors‖ 32
1.13.1.2 Current cardiovascular risk factors 34
1.13.1.3 Emerging CVD risk markers 35
1.14 Inflammatory risk markers 36
1.14.1 Inflammation and T2DM 37
1.14.2 Inflammation 38
1.15 Cations in T2DM 40
1.15.1 Sodium (Na+) 41
1.15.2 Potassium (K+) 41
1.15.3 Calcium (Ca2+
) 42
1.15.4 Magnesium (Mg2+
) 43
1.15.5 Zinc (Zn2+
) 43

Page VIII
1.15.6 Copper (Cu2+
) 44
1.15.7 Iron (Fe2+
) 44
1.16 Biochemical markers 46
1.16.1 Glucose 46
1.16.2 Liver function tests (LFT‘s) 47
1.16.3 HbA1c 47
1.16.4 Full blood count 48
1.16.5 Lipid profile 49
1.16.6 C-reactive protein (CRP) 50
1.16.7 Interleukine-6 (IL-6) 53
1.16.8 Fatty acid binding protein (FABP) 54
1.16.9 Homocysteine 55
1.16.10 Tumour Necrosis Factor- α (TNF- α) 56
1.17 Cellular Calcium (Ca2+
) homeostasis and Type 2 diabetes (T2DM) 56
1.17.1 Cell Ca2+
regulation 57
1.17.1.1 Abnormal-cell Ca2+
regulation in diabetes 59
1.17.1.2 Impaired-Cell Ca2+
Homeostasis and Insulin Secretion 60
1.17.2 Calcium and cardiovascular disease 61
1.18 Structure of red blood cell (RBC) or Erythrocyte membrane 61
1.18.1 RBC membrane proteins 63
1.18.1.1 Spectrin 63
1.18.1.2 Ankyrin 64
1.18.1.3 Protein 4.1 64
1.18.1.4 Actin 65
1.18.1.5 Band 3 65

Page IX
1.18.1.6 Glycophorin 67
1.19 Osmotic fragility 67
1.20 Advanced Glycation End-products (AGEs) 68
1.20.1 Formation of AGEs 69
1.20.2 AGEs in Diabetes 70
1.20.3 AGE‘s in cardiovascular disease 71
1.21 Total Antioxidant Status 73
1.22 Working hypothesis 75
1.22.1 Main Aim 75
1.22.2 Objectives 75
Chapter 2 Materials and Methods 77
2.1 Subjects and samples 78
2.1.1 Recruitment of subjects 78
2.2 Blood collection 78
2.3 Sample handling and storage 78
2.3.1 Blood handling and preservation 79
2.3.2 Blood storage 79
2.4 Comparison and analysis of various biochemical parameters and
inflammatory mediators in plasma of T2DM and healthy controls
79
2.4.1 Measurement of various cations in plasma 79
2.4.2 Measurement of various biochemical parameters 80
2.4.3 Measurement of inflammatory mediators 80
2.4.3.1 Experimental procedure 80
2.4.3.2 Preparation of standard dilutions of cytokines 80
2.4.3.3 Blocking and incubation 81

Page X
2.4.3.4 Wash 81
2.4.3.5 Incubation with detection antibody and washing 81
2.4.3.6 Incubation with Cy3 equivalent dye- Streptavidin and wash 82
2.4.3.7 Detection of fluorescence 82
2.4.3.8 Imaging 82
2.5 Analysis of Red blood cell (RBC) membrane proteins using SDS-PAGE 83
2.5.1 Extraction of RBC membrane proteins by native method 83
2.5.1.1 Purification of RBC from whole blood 83
2.5.1.2 Purification of human RBC open ghosts 84
2.5.1.3 RBC plasma membrane washes 84
2.5.1.4 Proteolytic digestion of RBC plasma membrane 84
2.5.2 Extraction of RBC membrane proteins from suspension cells 86
2.5.2.1 Cell harvesting and permeabilization 86
2.5.2.2 Extraction of cytoplasmic proteins 87
2.5.2.3 Extraction of membrane proteins 87
2.6 Protein quantification by Bradford Assay 87
2.6.1 Bovine Serum Albumin (BSA) 87
2.6.2 SDS-Page Electrophoresis 88
2.6.3 Silver Staining method 90
2.6.3.1 Preparation of Fixative solutions 90
2.6.3.2 Preparation of staining solutions 91
2.6.3.3 Gel imaging 93
2.7 Measurement of cytosolic free calcium concentration ([Ca2+
]c) in human
lymphocytes and neutrophils of T2DM and healthy controls
93
2.7.1 Preparation of cells 93

Page XI
2.7.2 Preparation of lymphocytes 93
2.7.3 Preparation of neutrophils 94
2.7.4 Measurement of intracellular free calcium concentration [Ca2+] in
lymphocytes
95
2.7.5 Measurement of intracellular free calcium concentration in neutrophils 95
2.8 Measurement of low molecular weight AGEs in serum of T2DM and
healthy control samples
96
2.9 Antioxidant assay 96
2.9.1 Reagent Preparation 97
2.9.1.1 Antioxidant Assay Buffer 97
2.9.1.2 Antioxidant Assay Chromogen 97
2.9.1.3 Antioxidant Assay Metmyoglobin 97
2.9.1.4 Antioxidant Assay Trolox 97
2.9.1.5 Antioxidant Assay Hydrogen Peroxide 98
2.9.2 Sample Preparation (Serum) 98
2.9.3 Performing the Assay 98
2.9.4 Analysis of results 100
2.10 Comparison of osmotic fragility of RBC‘s of T2DM and healthy controls 100
2.11 Statistical analysis 102
Chapter 3 Measurement of intracellular calcium in neutrophils and
lymphocytes of T2DM patients and healthy controls
103
3.1 Objectives of this study 104
3.2 Introduction 104
3.2.1 Role of calcium in lymphocytes 104
3.2.2 Role of calcium in neutrophils 105
3.3 Methods 108

Page XII
3.4 Results 100
3.4.1 Effect of fMLP on calcium release in neutrophils of T2DM and
healthy controls
109
3.4.2 Effect of thapsigargin on calcium release in neutrophils of T2DM
patients and healthy controls
111
3.4.3 Effect of thapsigargin on calcium release in lymphocytes of T2DM
patients and healthy controls
113
3.5 Discussion 115
Chapter 4 Analysis of Red Blood Cell membrane proteins in T2DM patients
compared to healthy controls using SDS-PAGE
120
4.1 Objectives of this study 121
4.2 Introduction 121
4.3 Methods 122
4.4 Results 123
4.5 Discussion 127
Chapter 5 Analysis of various biochemical parameters in T2DM patients and
healthy controls
131
5.1 Objectives of this study 132
5.2 Introduction 132
5.3 Methods 133
5.4 Results 134
5.4.1 Biochemical parameters 138
5.4.1.1 Full blood count 141
5.4.1.2 Serum lipid profile 145
5.4.1.3 Glucose, CRP and HbA1c 147
5.4.1.4 Kidney function tests 148

Page XIII
5.4.1.5 Liver function tests (LFT‘s) 149
5.5 Discussion 152
5.6 Conclusion 156
Chapter 6 Analysis of osmotic fragility and advanced glycation end-products
(AGEs) in RBC of T2DM patients and healthy age-matched controls
157
6.1 Objectives of this study 158
6.2 Introduction 158
6.3 Methods 158
6.4 Results 159
6.4.1 Osmotic fragility 159
6.4.2 Advanced glycation end-products 160
6.4.3 Anti-oxidant status 161
6.5 Discussion 162
Chapter 7 General discussion and scope for future studies 167
7.1 General discussion 168
7.2 Conclusion 176
7.3 Limitations 177
7.4 Scope for future studies 177
References 179
Appendix 1 Poster presentation at ―Physiology 2011‖, Physiological Society
Meeting, University of Oxford, 11-14 July, 2011.
218
Appendix 2 Poster presentation at ―The 3rd International Conference on
Advanced Technologies and Treatments for Diabetes‖, Basel,
Switzerland, Feb 10-13, 2010.
220
Appendix 3 Poster presentation at ―Annual Graduate Conference‖, University
of Central Lancashire, Preston, United Kingdom, June 2009.
222

Page XIV
Appendix 4 Chemicals and Reagents 224
Appendix 5 Conference Proceedings 226

Page XV
List of Figures
Figure 1.1 Diagnosis and screening for type 2 diabetes and impaired glucose
metabolism.
11
Figure 1.2 Detailed mechanism of Artherosclerosis plaque. 25
Figure 1.3 Potential mechanisms for the development of diabetic
cardiomyopathy: ROS, reactive oxygen species; TNFα, tumor necrosis factor
alpha; IL-6, interleukin-6; AGE, advanced glycation end products.
31
Figure 1.4 Clinical Joint British Societies risk assessment chart for CHD in
diabetic patients.
35
Figure 1.5 The erythrocyte membrane; A model depicting the interactions and
associations of the major human erythrocyte membrane proteins which include
α and ß spectrin, ankyrin, band 3, 4.1 (protein 4.1), 4.2 (protein 4.2), actin, and
GP (glycophorin).
66
Figure 3.1 (A) Original Chart Readings of an age matched controls and
T2DM human neutrophils. (B) Bar charts showing mean ±SD data for (Ca2+
)i
in age matched control and T2DM human neutrophils.
110
Figure 3.2 Calcium release in response to thapsigargin in human neutrophils
from a total of 6 T2DM patients and healthy controls.
112
Figure 3.3 (A) Original chart readings showed the effect of Thapsigargin on
(Ca2+
)i in lymphocytes of T2DM patients and age-matched controls.
114
Figure 4.1 SDS-PAGE protein patterns of T2DM patients following silver
staining procedure using Fermentas Page Silver Staining Kit.
123
Figure 4.2 Analysis of protein bands performed by Bio-Rad Gel Doc analyser. 124
Figure 4.3 Sodium dodecyl sulfate–polyacrylamide gel (SDS-PAGE)
electrophoresis patterns of protein extractions performed on Bio-Rad mini-gel
system using Bio-Rad 12% Tris-Hcl gel following silver staining technique.
125
Figure 4.4 Bar charts show the levels of 5 different proteins in RBC
membrane of healthy age-matched controls and T2DM patients.
126
Figure 5.1 Graphical representation of Sodium (Na+) concentration in
mmol/L.
135
Figure 5.2 Graphical representation of Potassium (K+) concentration in
mmol/L.
135
Page XVI
Figure 5.3 Graphical representation of Calcium (Ca2+
) concentration in
mmol/L.
136
Figure 5.4 Graphical representation of Iron (Fe2+
) concentration in mmol/L. 136
Figure 5.5 Graphical representation of Copper (Cu2+
) concentration in
mmol/L.
137
Figure 5.6 Graphical representation of Zinc (Zn2+
) concentration in mmol/L. 137
Figure 5.7 Graphical representation of Magnesium (Mg2+
) concentration in
mmol/L.
138
Figure 5.8 The graph represents concentration of RBC expressed in terms of
mean ± SEM.
142
Figure 5.9 The graphs represent concentrations of haemoglobin and Platelets
expressed in terms of mean ± SEM.
142
Figure 5.10 The graphs represent concentrations of HCT and MCV expressed
in terms of mean ± SEM.
143
Figure 5.11 The graphs represent concentrations of MCH and Neutrophils
expressed in terms of mean ± SEM.
143
Figure 5.12 The graphs represent concentrations of Lymphocytes and
Monocytes expressed in terms of mean ± SEM.
144
Figure 5.13 The graph represents concentrations of Eosinophils expressed in
terms of mean ± SEM.
144
Figure 5.14 The graphs represent concentrations of Cholesterol and
Triglyceride expressed in terms of mean ± SEM.
145
Figure 5.15 The graph represents concentration of Total Cholesterol
expressed in terms of mean ± SEM.
146
Figure 5.16 The graphs represent concentrations of HDL Cholesterol and
LDL Cholesterol expressed in terms of mean ± SEM.
146
Figure 5.17 The graphs represent concentrations of Plasma Glucose and CRP
expressed in terms of mean ± SEM.
147
Figure 5.18 The graphs represent concentrations of HbA1c both in % and
mmol/mol expressed in terms of mean ± SEM.
148
Figure 5.19 The graphs represent concentrations of urea and creatinine
expressed in terms of mean ± SEM.
149
Page XVII
Figure 5.20 The graphs represent concentrations of Total Calcium expressed
in terms of mean ± SEM.
150
Figure 5.21 The graphs represent concentrations of Total Bilirubin and
Alkaline Phosphatase expressed in terms of mean ± SEM.
150
Figure 5.22 The graphs represent concentrations of ALT and GGT expressed
in terms of mean ± SEM.
151
Figure 5.23 The graphs represent concentrations of ALT and GGT expressed
in terms of mean ± SEM.
151
Figure 6.1 Graph represents the osmotic fragility curve of RBC in T2DM
patients compared with healthy control.
160
Figure 6.2 Bar charts showing low molecular weight plasma AGEs in T2DM
and healthy controls.
161
Figure 6.3 Standard curve for different concentrations of Trolox at absorbance
of 750 nm.
162

Page XVIII
List of Tables
Table 1.1 Candidate genes for insulin resistance and insulin secretion defects. 21
Table 1.2 Classification of overweight in adults according to BMI. 30
Table 1.3 Major conventional risk factors for CVD. 33
Table 1.4 Direct role of C-reactive protein in atherogenesis. 52
Table 2.1 Step by step procedure for SDS-PAGE. 89
Table 2.2 Preparation of gel fixing solutions for silver staining. 90
Table 2.3 Preparations of reagents/staining solutions for silver staining. 91
Table 2.4 Silver staining protocol for maximum staining. 92
Table 2.5 Preparation of Trolox standard for making standard curve. 99
Table 2.6 Preparation of dilutions using different concentration of NaCl for
measurement of osmotic fragility.
102
Table 3.1 Data of Subjects recruited for chapter 3 108
Table 4.1 Data of Subjects recruited for chapter 4 122
Table 5.1 Data of Subjects recruited for chapter 5 133
Table 5.2 Results of all the biochemical parameters measured in healthy
controls and T2DM patients.
140
Table 6.1 Data of Subjects recruited for chapter 6 159

Page XIX
Acknowledgements
Firstly, all glory and praise to the Lord Almighty for giving me the wisdom and power
to follow my dreams, for all the love he bestowed upon me throughout my life.
Everything I am today is by his amazing love and grace.
To me, this voyage has been a constant learning process which shaped me into a better
self both at personal and professional levels. I am very grateful for my years at
University of Central Lancashire made possible because of many wonderful people.
My heartfelt appreciation goes to my Director of studies Prof. Jaipaul Singh, for giving
me an opportunity to carry out this study and for his invariable support and guidance all
the way through this journey. It was a great honour working with such an enthusiastic
and dedicated Professor.
I would like to sincerely thank my other supervisors Professor Satyan Raj Bhandari, Dr.
Martin Myers, Dr Arati Iyengar, and Peter Abel also for their supervision and support in
various ways to carry out this project.
I would like to thank Prof Jose Antonio Pariente and Prof Ana Moratinos for their
collaboration and their support to carry out some of this work at University of
Extremadura, Spain and also for their love and hospitality during my stay in Spain. I
would like to specially thank Javier Espino for his help during the research work. I
would like to thank all the members of their team who made my stay an unforgettable
experience.
I would like to sincerely express my deep gratitude to all those kind people who came
forward to donate their valuable blood samples without which this work would have
been impossible.

Page XX
I would like to thank all members of the University of Central Lancashire and
Lancashire teaching hospitals who have contributed enormously to this work and
provided help in all ways and means.
It was a pleasure to share doctoral studies and life with wonderful fellow researchers in
my research office at UCLan. I appreciate their camaraderie and valuable help at all
times during my study. Special thanks to my friend Sharizah Alimat for her constant
support and Dilip Bhuva for his incredible help. I would like to thank Tony Dickson,
Tamar Knight, Jim Donelly and all the other lab technicians at UCLan and Lancashire
Teaching Hospitals for their timely help and assistance.
Much love to my true friends and guardian angels Amit Sharma and Anu Sharma for
their love and encouragement throughout. Finally, my endless love and honour to my
lovely parents, my only beloved sister and brother-in-law, my extended family and
friends who have always been there for me and whose unconditional love and
unequivocal emotional support kept me going throughout everything during the last 3
years. I am forever indebted to my mum and dad whose values paved way to my most
privileged education.
Thank you with all my heart!
Shanthi Sharon

Page XXI
Abbreviations
µg microgram
µl microlitre
µM micromolar
A350 absorbance at 350 nm
A420 absorbance at 420 nm
A505 absorbance at 505 nm
A595 absorbance at 595 nm
AGEs Advanced Glycation End-products
LMW AGEs Low molecular weight AGEs
ALT Alanine aminotransferase
AST Aspartate aminotransferase
BMI Body Mass Index
CVD Cardiovascular disease
CAD Coronary artery disease
CHD Coronary heart disease
CRP C-reactive protein
DNA deoxyribonucleic acid
ED Endothelial dysfunction
ETOH ethanol
g gram
GFR Glomerular filtration rate
GGT Gamma-glutamyl transferase
Page XXII
GP Glycophorin
HbA1c Glycated haemoglobin A1c
HCT Hematocrit
HDL-C High density lipoprotein cholesterol
IL-6 Interleukine-6
IR Insulin Resistance
kDa Kilo Daltons
l litre
LDL-C Low density lipoprotein cholesterol
M Molar
MCH Mean corpuscular hemoglobin
MCV Mean corpuscular volume
mg milligram
MgCl2 Magnesium Chloride
min minute(s)
ml millilitre
mmol millimolar
MW Molecular weight
NO Nitric oxide
OS Oxidative Stress
PAS Periodic acid-Schiff
PKC Protein kinase C
PLT Platelets

Page XXIII
RAGE Receptor for AGEs
RBC Red blood cells
WBC White blood cells
ROS Reactive Oxygen Species
SDS-PAGE Sodium dodecyl sulphate polyacrylamide
gel electrophoresis
T1DM Type 1 Diabetes Mellitus
T2DM Type 2 Diabetes Mellitus
TAS Total anti-oxidant Status
TC Total cholesterol
TNF-α Tumour necrosis factor-α
VLDL-C Very low density lipoprotein cholesterol
SOCE Store operated calcium entry
CRAC Calcium release activated calcium
DAG Di Acyl Glycerol
fMLP N-formyl Methionyl Leucyl Phenyl
Alanine
SMCE Store mediated calcium entry
Fura 2 AM Fura-2 Acetoxy methyl ester
AU Arbitrary units
RPMI Rosewell park memorial Institute
RPM Rotations per minute
G gravitational force
EDTA Ethylenediaminetetraacetic acid

Page XXIV
EGTA Ethylene glycol tetraacetic acid
IGF Insulin-like growth factor
ATP Adenosine triphosphate
ADP Adenosine diphosphate
ICP-MS Inductively coupled plasma mass
spectrometry
ABI Ankle brachial index
ER Endoplasmic reticulum
WHO World Health Organisation
ADA American Diabetes Association

Page 1
Chapter 1
Introduction

Page 2
1.1 Scope of this study
Diabetes mellitus (DM) is the most widespread complex metabolic disorder among the
world‘s population currently affecting around 250 million people globally (Srinivasan et
al., 2008). In early 1930‘s, Himsworth documented that two types of diabetes existed
(Himsworth, 1936). This complicated metabolic syndrome is due to either insulin
insufficiency or impaired action of the insulin hormone or both (American Diabetes
Association, 2004). This disease is classified as insulin- dependent or type 1 diabetes
mellitus (T1DM) and non-insulin dependent diabetes mellitus or type 2 diabetes
mellitus (T2DM) of which both types of are associated with high levels of morbidity
and mortality (Alberti et al., 2004). The epidemic of diabetes mellitus is accompanied
by an increase in the incidence of diabetic complications including cardiovascular
disease (CVD), retinopathy, nephropathy and microangiopathy, neuropathy and several
other complications (Kumar and Clark, 2007).
It is well understood that CVD are the leading cause of mortality and morbidity in
T2DM patients as there is an increased risk of CVD in this particular population. Some
of the types of cardiovascular risk encountered in diabetic patients include coronary
heart disease (CHD), small vessel coronary artery disease (CAD), cerebrovascular
disease, peripheral vascular disease, hypertension and congestive heart failure (Grundy
et al., 1999). Diabetes-induced CVD is due to several conditions which are associated
with increased concentration of glucose in the blood often referred to as
hyperglycaemia. Dyslipidemia, hyperglycaemia and inflammation could also lead to
insulin resistance (DSouza et al., 2009; Mooradian, 2009).
There is strong evidence that inflammation forms the basis in the pathophysiology of
both insulin resistance and CVD among T2DM patients (Sobel and Schneider, 2005)
CVD has several underlying risk factors including the conventional hypertension,
Page 3
hyperglycemia, increased levels of total cholesterol and low density cholesterol (LDL)
and several other factors like race, origin, gender and smoking, lack of exercise, DM,
genetics (Al-Ozairi et al.,2006) as well as the non-conventional risk factors like
considerable variations in the levels of inflammatory markers including C-reactive
protein (CRP), Interleukine-6 (L-6), Tumour necrosis factor (TNF-a), C-peptide and
fatty acid binding protein (FABP) are all involved in the pathogenesis of insulin
resistance (Erdmann, 2005; DSouza et al., 2009).
The main aim of this study was to identify and evaluate the levels of various
biochemical parameters and inflammatory markers, which serve as predisposition
factors and govern the susceptibility to CVD in T2DM patients of different ages
compared to healthy age-matched controls.
Chapter 1 of this study contains a general introduction of the subject area. Chapter 2
summarizes materials and methods involved in tackling the scientific problems. Chapter
3 of this thesis describes measurement of intracellular free calcium [Ca2+
]i in
neutrophils and lymphocytes of T2DM patients and healthy controls. Chapter 4 is an
analysis of red blood cell membrane proteins in T2DM patients compared to healthy
controls using SDS-PAGE and Chapter 5 of this thesis is an analysis of various
biochemical parameters in T2DM patients and healthy controls. Chapter 6 involves
analysis of low molecular weight advanced glycation end products (AGEs), anti-oxidant
status and osmotic fragility of red blood cells (RBC) in T2DM patients compared with
healthy age-matched controls. Chapter 7 is a general discussion of this study followed
by conclusion, the scope for future studies, the references, appendix and presentations.
1.2 Type 2 Diabetes Mellitus (T2DM)
Diabetes mellitus (DM) can be described as a metabolic disorder which is caused by the
deficiency of insulin hormone secreted by the pancreatic beta cells (Rosenbloom et al.,
Page 4
2008). The hormone is responsible for the uptake of glucose from the blood mainly into
muscle and fat cells of the body and it also inhibits hepatic glucose production, and
therefore regulates the concentration of blood glucose at normal levels of 4-6 mmol/l
(Kumar and Clark, 2007).
1.2.1 Classification of diabetes
Generally, there are two types of DM namely, T1DM and T2DM. T1DM is also called
insulin dependent or early onset diabetes, which is diagnosed during childhood and
accounts for about 5-10% of DM. T1DM is due to autoimmune destruction of
pancreatic β cells in islets of Langerhans resulting in a decrease of insulin production.
T1DM is commonly associated with microvascular complications including
nephropathy and retinopathy and it also predisposes to CHD (Adler et al., 2003).
T2DM is also called non-insulin dependent DM (NIDDM) or late onset diabetes and it
is the most prevalent form of diabetes which usually makes its appearance later in life. It
is due to a combination of defective secretion of insulin by pancreatic β cells and
impairment of insulin- mediated glucose disposal, which is called insulin resistance.
This accounts for 90-95% of DM (Kumar and Clark, 2007; DSouza et al., 2009; Ripsin
et al., 2009; Ahmed, 2010).
The World Health Organisation classified diabetes in 1980 and revised it in 1985 into
the two most common types which was insulin-dependent diabetes mellitus (IDDM)
and non-insulin-dependent diabetes mellitus (NIDDM). Depending on the nutrition
status, the WHO also categorized DM into other types like malnutrion-related diabetes,
which is now omitted from the new classification due to its unknown aetiology, and
diabetes, which is diagnosed during pregnancy as gestational diabetes. The WHO
ultimately authorized the classification proposed by the American Diabetes Association

Page 5
(ADA), which was based on aetiology in 1997 (Holt, 2004; Kumar and Clark, 2007;
Ahmed, 2010).
1.2.2 Symptoms
Both types of diabetes have similar symptoms, but for T1DM the symptoms develop
more rapidly in days or weeks. They include polyuria, polydipsia, unexplained weight
loss, muscle wasting, fatigue, cramps, constipation, blurred vision and skin infections.
Diabetes is often diagnosed from those complications of untreated patients like foot
ulcers and eye problems. The various long term complications due to DM are classified
as macrovascular, microvascular and nephropathic which cause different dysfunctions
and are the major causes of morbidity and mortality in Diabetics (Kumar and Clark,
2007; Song and Hardisty, 2008; Ahmed, 2010).
1.2.2.1 Hypoglycaemia
Hypoglycaemia occurs due to low blood glucose levels. It is caused by over medication,
excessive exogenous insulin, and strenuous exercise. Sometimes it may even lead to
seizures, coma and irreversible brain death as blood glucose regulates the functioning of
body and organs including the brain. Symptoms due to hypoglycaemia include
irritability, sweating, tingling lips, weakness, hunger and nausea (Kumar and Clark,
2007; Ahmed, 2010).
1.2.2.2 Hyperglycaemia
Hyperglycaemia is due to an increase in blood glucose levels. It is due to many factors
including not taking medication or exogenous insulin, or by not controlling the diet or
taking exercise. It may also occur due to autoimmune destruction of β-cells of pancreas.
Symptoms include increased thirst and urination, blurred vision, lethargy, weight loss,
cramps and dehydration. Lack of insulin also releases ketones into the blood which in
turn raise the acidity of the blood leading to a state called ketoacidosis. Both hypo and
Page 6
hyperglycemia are reversible and can be treated (Kumar and Clark, 2007; DSouza et al,
2009; Ahmed, 2010).
1.2.2.3 Diet, physical activity and diabetes
Since this study is concerned mainly with T2DM, much emphasis will be placed on this
type of DM. T2DM results from an interaction between genetic and environmental
factors. The rapidly changing incidence rates, however, suggest a predominantly
significant role for the latter as well as a potential for stemming the tide of the global
epidemic of the disease. The most remarkable increases in T2DM are occurring in
societies in which there have been major changes in the type of diet consumed,
reductions in physical activity, and increases in overweight and obesity (Aronne and
Segal, 2002).
The diets concerned are typically energy-dense, high in saturated fatty acids and
depleted in non-starch polysaccharides (NSP). In all societies, overweight and obesity
are associated with an increased risk of T2DM, especially when the excess adiposity is
centrally distributed (Parker et al., 1993). Conventional body mass index (BMI)
categories may not be an appropriate means of determining the risk of developing
T2DM in individuals of all population groups because of ethnic differences in the
composition of the body and because of the importance of the distribution of excess
adiposity. While all life style-related and environmental factors, which contribute to
excess weight gain, thus may be regarded as contributing factors to T2DM. The
evidence that an individual‘s dietary factors have an effect, which is independent of
their obesity promoting effect, is unconvincing. Evidence that saturated fatty acids
increase risk of T2DM and that NSP are protective is more convincing than the
evidence for several other nutrients, which have been implicated (Lindgarde et al.,
2006). The presence of maternal diabetes, including gestational diabetes and intrauterine
Page 7
growth retardation appears to increase the risk of developing diabetes in future
(Dabelea, 2007).
The association between excessive weight gain, central adiposity and the development
of T2DM is convincing. The relationship has been frequently demonstrated in
longitudinal studies in diverse populations, with a striking gradient of risk apparent with
increasing levels of BMI, adult weight gain, waist circumference and waist-to-hip ratio
(Despres et al., 2001). Indeed, either waist circumference or waist-to-hip ratio
(reflecting abdominal or visceral adiposity) is a more powerful determinant of
subsequent risk of T2DM than BMI (Colditz, 1990).
Central adiposity is also a vital determinant of insulin resistance, the underlying
abnormality in most cases of T2DM (Hayashi et al., 2003). Voluntary weight loss
improves insulin sensitivity (McAuley et al., 2002) and several randomized controlled
trials have been shown to reduce the risk of progression from impaired glucose
tolerance to T2DM (Tuomilehto et al., 2005).
Longitudinal studies have clearly indicated that increased physical activity reduces the
risk of developing T2DM regardless of the degree of adiposity (Myers et al., 2003).
Vigorous exercise (i.e. training to an intensity of 80--90% of age-predicted maximum
heart rate for at least 20 minutes, at least five times per week) has the potential to
substantially enhance insulin sensitivity. Physical activity might decrease T2DM by
increasing insulin sensitivity although the intensity and duration of physical activity
required to improve insulin sensitivity has not been established (Jeon et al., 2007).
Insulin sensitivity also increases with physical activity according to a study based on
questionnaires (Mayer-Davis et al., 1998). Offspring of diabetic pregnancies (including
gestational diabetes) are often large and heavier at birth, tend to develop obesity in
childhood and are at high risk of developing T2DM at an early age in life (Cook &

Page 8
Hurley, 1998). Those born to mothers after they have developed diabetes have a three-
fold higher risk of developing diabetes than those born before (Momiyama et al., 1999).
A number of studies, mostly in developing countries, have suggested that intrauterine
growth retardation and low birth weight are associated with subsequent development of
insulin resistance (McCance et al., 1994). In countries where there has been
malnutrition, insulin resistance may have been selectively advantageous in terms of
surviving famine. In populations where energy intake has increased and lifestyles have
become more sedentary, however, insulin resistance and the consequent risk of T2DM
have been enhanced. In particular, rapid postnatal catch-up growth appears to further
increase the risk of T2DM in later life (Cook and Hurley, 1998). Appropriate strategies,
which may help to reduce the risk of T2DM in this situation, include improving the
nutrition of young children, promoting linear growth and preventing energy excess by
limiting intake of energy-dense foods, controlling the quality of fat supply, and
facilitating physical activity. At a population level, foetal growth may remain restricted
until maternal height improves. This may take several generations to correct (Lindsay,
2009). The prevention of T2DM in infants and young children may be facilitated by the
promotion of exclusive breast feeding, avoiding overweight and obesity, and thus,
promoting optimum linear growth.
1.3 Epidemiology of T2DM
T2DM is a multifaceted disorder due to both genetic, lifestyle and environmental factors
and it accounts for up to 90-95% of total diabetes cases. In the United Kingdom, around
2.4 million people have T2DM. Globally, over 250 million people have DM. The
prevalence of diabetes has been increasing day by day and is expected to reach
indefinite proportions by 2030 (Zimmet et al., 2003). The worldwide distribution and
the prevalence of T2DM are increasing rapidly. It has been envisaged by the World

Page 9
Health Organisation (WHO) that the number of people with diabetes will be doubled by
the year 2030 reaching almost 500 million (Holt, 2004).
The incidence of T2DM varies enormously from one population to the other. A major
discrepancy in the frequency of this disease globally has been very well established by
several prospective population-based studies. Much information on the incidence of
T2DM is unavailable though it is the most common form of diabetes, which has no
genetic factors associated with it. The Pima Native Americans of Arizona and those
from South Pacific Island of Nauru are found to have the maximum rates of people with
diabetes (Barnett, 2005).
In the present world, diabetes has become one of the most expensive health conditions
to treat. In the United Kingdom, for example, it costs the NHS £5 billion to diagnose,
treat and care for diabetic patients and UK only has 2.5 million cases. If these numbers
are extrapolated to the current 250 million people globally, then it will cost the
Governments of the world £500 billion annually to diagnose, treat and care for diabetic
patients. Its prevalence worldwide has been growing in most populations (King et al.,
1998). Due to its insidious onset and asymptomatic nature, diabetes remains
undiagnosed in many people which makes them susceptible to life-threatening
complications, and thus reducing the quality of life.
1.4 Pathogenesis of T2DM
The two main reasons underlying the pathophysiology of T2DM are impaired insulin
secretion due to the dysfunction of pancreatic beta cells and impaired insulin action
because of insulin resistance (Kumar and Clark, 2007). A breakdown of these two
mechanisms consequently results in abnormal high levels of plasma glucose
concentrations that are usually maintained at a definite range irrespective of the various
Page 10
changes for the requirement and supply which is regulated by a dynamic process
between tissue sensitivity and insulin (Kasim-Karakas, 2000).
Inflammation and inflammatory cytokines have been very recently suggested to be the
reason for the development of insulin resistance and T2DM. Insulin resistance develops
from physical inactivity, obesity along with a substrate of genetic susceptibility. It is
commonly accompanied by other cardiovascular risk factors like dyslipidemia,
hypertension and pro-thrombotic factors (Al-Ozairi et al., 2006). These factors together
in an individual are called the metabolic syndrome, which precedes T2DM (Kumar and
Clark 2007, Ahmed, 2010).
1.5 Diagnosis
There was major perplexity regarding the criteria for diagnosis of diabetes mellitus
before the 1970s. The WHO has put forward its first statement on the diagnosis of
diabetes in 1965, which was later tailored and made simple. The ADA proposed its first
diagnostic criteria following WHO, which emphasised on the concentration of fasting
glucose. Consequently, WHO revised its old version. Figure 1.1 shows a flow diagram
for the diagnosis and screening of T2DM including IGTT (Jonathan and Donald, 2003).
Since the diagnosis of diabetes mellitus has major implications on social, legal and
medical aspects of an individual, security for diagnosis is indispensable. The test for
diagnosing diabetes should include a venous plasma sample that can be tested in an
accredited laboratory. A recent report by WHO recommends the acceptability of
glycated haemoglobin (HbA1c) as an additional test to diagnose diabetes.

Page 11
Figure 1.1: Diagnosis and screening for T2DM and impaired glucose metabolism
(Taken from Jonathan and Donald, 2003).
Page 12
1.6 T2DM: genetic and environmental factors.
T2DM is a multifactorial disease caused by the interaction of both genetic and
environmental factors. Its strong genetic component is suggested by its familial
aggregation and transmission patterns. Other factors include its high concordance rate in
twins (60-100%), and its high prevalence in certain ethnic populations after controlling
for lifestyle factors. The role of environmental factors is established in populations that
are genetically similar, but have different living conditions (Kraine and Tisch, 1999).
Predisposition to develop T2DM following a change in lifestyle of an individual can be
explained by the "thrifty genotype" hypothesis. According to this theory, factors in early
humans that favoured fat deposition during periods of abundant food conferred survival
advantage during subsequent periods of hardship and perhaps starvation, leading to the
selection of genes for insulin resistance (James, 1962). However, these factors may be
unfavourable to the individual post-urbanisation, resulting in the development of
diabetes during the normal ageing process or with the onset of obesity (McDermott,
1998; Lee, 2001). Consequently, relative resistance to glucose uptake in skeletal muscle
leads to increased adiposity contributing to the pathogenesis of diabetes and other
metabolic abnormalities (Dube et al., 2006).
In contrast, the "thrifty phenotype" theory proposes that the excess modem living is the
major cause for insulin resistance (Hales and Barker, 2001). These excesses lead to
reprogramming of carbohydrate metabolism and subsequent β cell dysfunction and
insulin resistant tissues. Disparities in T2DM and its complications between ethnic
groups suggest that T2DM may represent a selection of particular genotypes in response
to different evolutionary pressures (Speakman, 2008).
Page 13
1.7 Cellular basis for type 2 diabetes
1.7.1 Introduction
Insulin resistance and a deficiency in insulin secretion are the major cellular basis of
T2DM (Mahler and Adler, 1999). The action of insulin is to lower the glucose levels in
the blood and to stimulate the uptake of glucose principally in muscle and liver cells,
thus involved in promoting glucose oxidation and glycogenesis (Johnson et al., 2008).
Insulin also plays a major role in controlling the production of hepatic glucose and
inhibits lipolysis, which is the process of breakdown of fat in adipose tissue (Barbetti,
1996). The initiation of the insulin action takes place by its binding to the extracellular
domain of the β subunit in the insulin receptor, leading to auto phosphorylation of
several tyrosine residues in the intracellular domain of the β subunit. Activation of
tyrosine kinase of the insulin receptor, by insulin, then directs to phosphorylation of
tyrosine residues on the insulin receptor substrates 1 and 2 (IRS-I and IRS-2), shc, and
various other intracellular proteins which are uncharacterised (Polonsky et al., 1996).
Consequently, the insulin-signalling cascade is triggered when the phosphotyrosines of
these proteins bind to SH2 domains on the other signal kinases. IRS proteins
preferentially involve in different signal pathways for glucose uptake as well as
glycogen synthesis. They also involve in stimulating protein synthesis by transferring
both the growth promoting and mitogenic signals of insulin to the nucleus (Polonsky et
al., 1996; Ahmed, 2010).
1.7.2 Insulin resistance
The presence of a very high and unusual amount of endogenous or exogenous insulin to
obtain a normal biologic response is the state of insulin resistance (IR). In muscle, fat
and liver cells, the resistance to endogenous insulin is compensated by the high levels of
serum insulin in association with normal or high blood glucose concentrations. The

Page 14
main cause underlying diabetes, hypertension and coronary heart disease is insulin
resistance (Nosadini et al., 1993; Ahmed and Thornalley, 2007; DSouza et al., 2009).
Different environmental factors and the diverse patterns of lifestyle habits are involved
in the development of insulin resistance in a person. Glucose intolerance,
hyperinsulinemia, dyslipidemia and hypertension are included in the insulin resistance
syndrome. Insulin resistance may occur due to many reasons involved in the functioning
of insulin which can be either at the stage of the binding of insulin to the receptor or
after the level of downstream signalling (Kumar and Clark, 2007). These defects caused
by mutations in the insulin receptor gene which may include alterations in the receptor
number, structure and function in signalling resulting in insulin resistance (Nigro et al.,
2006). The high levels of circulating free fatty acids increase the release of glucose from
the liver reducing the disposal of glucose in the skeletal muscle leading to insulin
resistance. Substantial information have established that the increased levels of
inflammatory markers in the insulin resistance state helps in predicting the progress of
T2DM and cardiovascular diseases (Festa et al., 2003).
Adipose tissue plays a major role in the state of insulin resistance by producing the
complement factor B, adipsin, acylation-stimulating protein. In addition, the adipose
tissue also help in triglyceride synthesis and they are also involved in the increase of
paracrine signalling (DeFronzo, 2006).
In T2DM, the inability of insulin to maintain normal glycaemic levels is caused by a
combination of both insulin resistance and a fault in glucose-stimulated secretion.
Insulin resistance has been a strong predictor of T2DM, which is identified as
hyperinsulinemia 10 to 20 years preceding the diagnosis of the disease.
Page 15
The major causes of insulin resistance in T2DM are defects in glucose oxidation and
glycogen synthesis in skeletal muscle. It is observed that when adipocytes are taken
from T2DM, they are found to have impaired insulin-stimulated glucose uptake and
moreover, lipolysis is increased. By reducing glucose oxidation through the glucose
fatty acid cycle in the muscle, it is possible that the elevated levels of circulating free
fatty acids will induce insulin resistance. Greater levels of free fatty acids can also
induce insulin resistance by reducing hepatic clearance of insulin and by enhancing
gluconeogenesis (Tang et al., 2001).
It has been previously suggested that long chain fatty acids are actively involved in
directly affecting the glycogen synthase activity and can also modulate the transcription
of pancreatic β cell transcription factor HNF-4α. Increased expression of cytokines may
also result in insulin resistance. When tumour necrosis factor (TNFα) is over expressed
in obese people, it inhibits the phophorylation of insulin receptor and insulin receptor
substrate (IRS-1), which in turn blocks the insulin-signalling cascade in the adipose
tissue (Federici, 2004). In T2DM, the isoform of low affinity insulin receptor and
hybrid receptors when over expressed are also proposed to contribute to insulin
resistance (Kroder et al., 1996).
Hybrid receptor is formed when fusion occurs in between the insulin and insulin growth
factor (IGF) receptors (Sesti et al., 2005). The insulin receptor is found to be negatively
correlated with insulin sensitivity in vivo as it has greater affinity for insulin like growth
factor (ILGF) than insulin (Yamauchi et al., 1996). Recent studies have also suggested
that insulin resistance is caused by poor foetal and postnatal nutrition, leading to β cell
dysfunction and insulin resistant tissues and thus can be detected by low birth weight of
the child. According to "thrifty phenotype" hypothesis, these individuals have a greater
chance of developing diabetes with the onset of diabetes during the later stages of life
Page 16
(Hales & Barker, 2001). In contrast, the "thrifty genotype" theory also proposed that
smaller birth weight would enable the foetus to store energy and fat more efficiently in
an unfavourable intrauterine environment and this can be genetically determined
(Dunger et al., 2007).
1.7.3 Insulin secretion
In response to increasing plasma glucose concentrations, pancreatic β cells are involved
in the secretion of insulin. In subjects with T2DM, several abnormalities in β cell
insulin secretion have been detected. Insulin response to intravenous glucose is
decreased in patients with T2DM, with loss of the first phase insulin secretion response,
defective pulsatile pattems, and hyper-proinsulinaemia (Gumbiner et al., 1996).
T2DM is characterised by a 20-50% reduction in β cell mass and this could be an
impulsive factor in defective insulin secretion. Progressive loss of β cell function is
associated with insulin resistance in skeletal muscle, and in the formation of islet
myeloid deposits in the pancreas. In turn, this can induce pancreatic β cell death in vitro
(Westermark & Wilander, 1978). In early or first-phase insulin secretion, the pattern of
loss is the initial defect followed by a reduction in glucose to potentiate non-glucose
signals, and finally β cell failure that requires insulin treatment (Lorenzo et al., 1994).
In mice, the development of islet amyloid has been attributed to a high fat diet and it is
associated with hyperglycaemia. However, a 50% reduction in β cell mass alone is not
enough to explain the fasting hyperglycaemia observed in these animals, suggesting that
the amyloidogenic process may impair the function of islet cells prior to cell death and
reduction in islet mass (Verchere et al., 1996).
Mitochondrial DNA (mtDNA) may also affect insulin action. Mitochondria are the
major site for Krebs cycle function, ATP synthesis and transfer of fatty acids (Ahmed,
2010). Elevated ATP in the cytoplasm is necessary for the membrane-dependent
Page 17
increase in cytosolic Ca2+
, which in turn triggers insulin exocytosis by the β cell.
Patients with T2DM are found to have approximately 35% less mtDNA in their
peripheral blood leukocytes (Lee et al., 1998). This reduction has been observed to
precede the onset of diabetes. Low copy numbers of mtDNA are inversely correlated to
fasting plasma glucose levels in patients with T2DM, and are associated with insulin
resistance and defective insulin secretion in the offspring of diabetic mice. Mothers with
low mtDNA in their peripheral blood leukocytes, tend to have offspring‘s with low birth
weight indicating that mtDNA content may be an significant characteristic of the
heritable ―thrifty phenotype" (Lee, 2001).
The relationship between low levels of mtDNA and diabetes is unknown. In vitro, β cell
depletion of mitochondrial DNA results in altered mitochondrial morphology and
inhibition of glucose-stimulated ATP production that is required for downstream insulin
release by the islet β cell (Lee et al., 2005). Glucose toxicity may be another mechanism
for defective insulin secretion. When β cells are exposed to high glucose levels for
prolonged period, impaired insulin gene transcription can result in decreased insulin
secretion. Chronic exposure to high levels of glucose can also cause defective K+
channel function and a reduced expression of GLUT-2, which is responsible for glucose
storage and transportation to the cell membrane (Maechler & Wollheim, 2000).
Severe hyperglycaemia is correlated with increased insulin deficiency (DSouza et al.,
2009). Once hyperglycaemia has developed, glucose toxicity can induce insulin
resistance and decreased pancreatic β cell function. It has been predicted that a 50%
decrease in β cell function (i.e. decreased β cell function) in the presence of insulin
resistance may induce hyperglycaemia (Chen et al., 1998).
In addition, glucose responsive tissue resistance to insulin will increase as β cell
function decreases (Gerich, 2003). Hyperglycaemia can be considerably improved by

Page 18
insulin therapy or by sulfonylureas and treatment with diet, resulting in reduction of
insulin resistance and glucose toxicity (Cook et al., 1993). Insulin secretion and
resistance are hence interrelated at several levels; however, it is unclear which defect is
primary in the aetiology of diabetes (Kahn and Porte, 1988). It has been envisaged that a
50% decrease in β cell function in the presence of insulin resistance results in
significant levels of hyperglycaemia (Halter et al., 1985). Once hyperglycaemia
develops, glucose itself leads directly to a loss of glucose induced-insulin release and
impairment in glucose disposal (glucose toxicity), resulting in exacerbation of the
disease state (Meece, 2007).
1.8 Genetics of type 2 diabetes mellitus
Both the types of diabetes mellitus have a characteristic feature to run in a family, which
indicates a genetic predisposition to the disease. Different genes are likely to be
involved in each type of DM as they have major difference in their underlying
aetiology. The wide spread distribution and the ever growing prevalence of T2DM in
the modern society has urged the research community to investigate the underlying
genetic defects of the disease. The statement that T2DM is principally caused by genetic
factors is known for many years. Until recently, the identification of genetic variants,
contributing to the difference among individual susceptibility to T2DM is characterised
by very slow progress in spite of strenuous efforts (Kahn et al., 1996).
With the advances in the techniques involved in gene expression, like genome-wide
association analysis, there has been a remarkable transformation in the ability to mark
the common genetic variants, which play a major role in contribution to the
predisposition of complex metabolic disorders such as T2DM during the last few years.
Around 20 common variants have been implicated in the susceptibility of T2DM
through related studies (Shu et al., 2010).
Page 19
The two main candidate gene associations claimed for T2DM are Pro12Al variant in the
peroxisome proliferator-activated receptor gamma (PPARG) gene, which encodes the
target for thiazolidinedione class of drugs and the Glu23Lys variant in KCNJ11, which
encodes the target for sulphonylureas (Gouda et al., 2010). These are the two most
common polymorphisms involved in influencing the risk of T2DM. Some rare
mutations in both of these genes are also involved in other syndromes, which have
severe metabolic disturbances as their characteristic feature (Gouda et al., 2010).
It has been reviewed earlier that the variants in the PPARG, KCNJ11 and TCF7L2
genes are confirmed as carriers of established T2DM susceptibility loci and studies have
led to further identification and replication of novel T2DM-susceptibility loci (Chauhan
et al., 2010). The discovery that the variants in the Transcription factor 7-like 2 gene
(TCF7L2) have a great effect on the susceptibility to T2DM has paved the way to
identification of genes related to T2DM including gene association studies. After
several replication studies, it has been finally proven that, the variants in TCF7L2 have
a powerful role than those of PPARG and KCNJ11. It has been reported that almost
10% of Europeans carrying this homozygous allele have a greater risk of developing
T2DM than those without it (Zeggini and McCarthy, 2007). Alterations in either
TCF7L2 gene function or expression causes disturbance in the function of pancreatic
islet cells thereby dysregulating the gene expression of proglucagon, which decreases
the secretion of insulin and results in T2DM. The effort towards discovering the genes
responsible for a disease is driven by expectations to generate key insights into its
various mechanisms giving a chance for clinical translation (Zeggini and McCarthy,
2007; Chauhan et al., 2010). Further knowledge of the various biochemical pathways
involved in T2DM is required for future research to understand the genetic variation in
populations.
Page 20
1.8.1 Candidate genes for type 2 diabetes
The aetiology and pathogenesis of insulin resistance involve multiple signalling
proceedings and pathways, and therefore a number of target genes. See (Table 1.1).
Numerous researchers have sought to identify a genetic determinant that may be
sufficient to considerably impair one or more of the major transduction pathways.
Linkage of diabetes to different genetic loci in diverse populations has been well
demonstrated by whole genome studies (Kahn, 1988; Mahtani et al., 1996).
On the other hand, mutations in individual genes resulting in defective insulin secretion
and signalling leading to T2DM have been unidentified by the candidate gene approach,
which tests the association of a particular gene to diabetes. However, a single gene
mutation is yet to be identified, with exception of monogenic form of diabetes (Hart et
al., 1999).

Page 21
Table 1.1: Candidate genes for insulin resistance and insulin secretion defects.
Insulin resistance genes
Insulin receptor
Insulin receptor substrate- I IRS-1
Glucose transporter-4 GLUT-4
Glycogen synthase GYS
Amylin IAPP
β -3-adrenergic receptor β-3AR
Fatty acid binding protein 2 FABP2
Obesity OB
Prohormone convertase-2 PC-2
Tumour necrosis factor- α TNF- α
Ras associated with diabetes Rad
Insulin secretion defects
Glucose transporter-2 GLUT-2
Maturity onset diabetes of the young MODY1, 2,3,4,5
NeuroD1/ β 2 β 2
Mitochondrial DNA mtDNA

Page 22
1.9 Cardiovascular diseases (CVD)
The major cause of mortality and morbidity worldwide among diabetics is due to CVD
which are expected to reach indefinite proportions very soon (Murray and Lopez, 1997).
The burden of CVD is a major challenge for community health worldwide and this has
been especially noticeable in developing countries. The WHO placed CHD in the sixth
place for morbidity and mortality and it is believed that it which would reach first place
in future (Hoang et al., 2003). CHD is caused because of accumulation of atheromatous
plaques inside the arterial walls which supply the myocardium (Mensah, 2007). It has
been suggested that healthy men and women have a chance of developing CVD at age
40 and above (Rosamond et al., 2007).
According to WHO, CVD had affected around 15 million people in 1990, which
increased to 17 million in 1999 and this figure is expected to reach 25 million in 2020
(Murray and Lopez, 1997). The fact that CVD is associated with the lifestyle habits of
an individual including high fatty diet, smoking, lack of exercise has been well known
for years. Increased urbanisation in developing world has brought about a major
difference in the various aspects of life, ultimately making it sedentary. The prevention
of CVD is an important social and economic issue as it costs the UK Government, £26
billion per year (BHF, 2007). It is of paramount importance to identify individuals at
higher risk of a cardiovascular event and to manage their lifestyle. Understanding the
molecular mechanisms in the progression of CVD and developing novel approaches for
prevention and treatment of CVD is urgently required at this moment in time.
1.9.1 Development of atherosclerosis
The presence of atherosclerotic lesions within the vasculature is virtually a pre-requisite
for acute ischaemic events. Complex lesions within the coronary arteries can cause
luminal occlusion leading to stable and unstable angina pectoris (Dsouza et al., 2009).

Page 23
Either erosion or rupture of vulnerable lesions can cause to atherothrombotic
complications leading to myocardial infarction (MI), stroke, renal failure, heart failure,
sudden death and peripheral vascular disease (PVD) (Cohn, 2004). Indeed,
atherosclerosis and atherothrombosis are generalised processes, although vascular
pathology is usually discussed and managed on an organ-by-organ basis. Patients may
only clinically present with arterial pathology in a specific area, but the disease is
almost invariably ubiquitous, and it is the root cause of the associated morbidity and
mortality. For example, in a study of 1500 patients with leg artery atherosclerosis
(intermittent claudication), it was found that in a 4-10 year follow-up, 60% of deaths
were cardiac, 17% were cerebrovascular, and 8% were due to other vascular causes and
complications such as ruptured aortic aneurysm (Kahn, 1988; Laing S. et al., 1991). In
addition, a recent study has established that the ankle brachial blood pressure index
(ABI) (a marker of peripheral atherosclerosis and subclinical stenosis) is associated with
the site and number of arterial beds affected by atherosclerosis in vascular patients and
to a lesser extent with the patient risk factor profile. These studies show that the
atherosclerosis underlying the claudication pathology and this is also by far the main
cause of mortality in this patient group.
It is therefore advantageous to fully comprehend the complex cellular and molecular
interplay involved in the development of atherosclerosis, considering the ubiquitous
nature of atherosclerosis in the Westernised population, and its diffused nature in the
vasculature. The rationale is that individuals who are at risk of progressing to an event
may be identified at an early stage. Equally, it is also possible to identify pathways of
therapeutic intervention for these individuals.
Until the mid-1970s, atherosclerosis was considered a bland lipid storage disease where
lesion swelling and stenosis were thought to be the primary cause of luminal occlusion
Page 24
leading to ischemic heart disease and stroke (Ross & Harker, 1976). Indeed, much
historical and current evidence supports the role of plasma lipids (cholesterol and
triglycerides) and lipoproteins (low-density lipoprotein [LDL] and very low density
lipoprotein [VLDL]) in atherogenesis (Kannel, 1979; Martin et al., 1986). To suggest
that lipid storage alone is the cause of atherogenesis is, however, an over-simplification.
With the extent of atherosclerosis being proportional to sustained blood lipid
concentration in most cases, it would be a reasonable assumption that the main driving
force would be hyperlipidaemia, if atherosclerosis was purely a lipid storage disease
(Lloyd-Jones et al., 2001). Though hyperlipidaemia is a major risk factor for future
cardiovascular death, almost half of all coronary events occur in individuals without
clinical hyperlipidaemia (Braunwald, 1997) and other risk factors such as smoking and
blood pressure are of similar importance. Furthermore, hyperlipidaemia is only weakly
related to ischemic stroke (Shahar et al., 2003).
Adipocytes play a very important role in the process of development of atherosclerosis
by producing inflammatory factors like tumour necrosis factor, interleukine-6,
interleukine-8, interleukine-10, monocyte chemoattractant protein-1, plasminogen
activator inhibitor-1 and also adipokines such as adiponectin, leptin, angiotensinogen
and resistin all of which accelerate the progression of atherosclerotic events (Hattori et
al., 2006). It has been shown very recently that leptin enhances cellular immune
responses and it also takes part in the increase of blood pressure. It has been observed
that leptin tends to decrease the sensitivity to insulin when injected in obese rats. In the
presence of high levels of glucose, leptin is also involved in the accumulation of
cholesterol by the macrophage (Piemonti et al., 2003).
The development of atherosclerosis in vivo is currently thought to be a more complex
process, requiring persistent lipid presence, endothelial dysfunction and inflammation

Page 25
(Libby et al., 2002; Szmitko et al., 2003; Willerson and Ridker, 2004; Hansson, 2005)
(See Figure 1.2). This model in Figure 1.2 gives inflammatory cells and cytokines a
pivotal role in the development of the lesion.
Figure 1.2: Schematic diagram showing the development of atherosclerosis

Page 26
Low density-lipoprotein (LDL) infiltrates the arterial wall and is modified by oxidation
processes. It is then phagocytosed by macrophages which become active inflammatory
lipid-laden foam cells characteristic of early atherosclerotic fatty streaks. Activated
local endothelium starts to produce P- and E- selectins and integrins such as vascular
cell adhesion molecule-1 (VCAM-1). Monocytes and activated lymphocytes from the
periphery roll adhere and extravasate into the tissue. Macrophages activated via toll like
receptors (TLRs) produce inflammatory cytokines, chemokines, proteases, and free
radicals which perpetuate inflammation and damage tissue. A Th1 type adaptive
response becomes established and interferon- (IFN-) γ is produced. This stimulates
further activation of macrophages and proliferation of smooth muscle cells (SMCs). A
stable fatty lesion develops with the collagenous cap manufactured by the SMCs.
Production of IL-6 and other cytokines (interleukin-1, TNFα) leads to stimulation of the
hepatic acute phase response (APR) releasing acute phase reactants such as fibrinogen,
serum amyloid A, and C-reactive protein (CRP) (Taken from Hansson, 2005).
1.9.2. Role of inflammation in the pathogenesis of atherosclerosis
Accumulating evidence from both basic and applied laboratories indicates that
inflammation plays a critical role in several stages of atherogenesis, including acute
plaque rupture as well as early initiation of foam cell deposits (Libby et al., 2002). The
plaque is typically an advanced atherosclerotic lesion covered by a fibrous cap
consisting of smooth muscle cells and connective tissue containing macrophages and T
lymphocytes. Under the fibrous cap, the lipid-rich core is filled with macrophages,
lipids, calcium and other materials. Unstable plaques often have activated macrophages
and leukocytes on their ―shoulders‖. Certain characteristics may predispose a plaque to
rupture. These characteristics include a softer lipid core, the presence of macrophages,

Page 27
fewer smooth muscle cells, a thinner fibrous cap and increased inflammatory activity
(Adams III and Vickie, 2001). Cytokines, which cause the de novo hepatic production
of acute phase reactants, such as C-reactive protein, have been shown to increase in
acute coronary syndromes (Liuzzo et al., 1994).
1.9.3 Endothelial dysfunction
Endothelial dysfunction is commonly described as a diminished ability of the
endothelium to produce the vasorelaxing compound nitric oxide (NO), or a profound
imbalance in the relative amounts of other vasoactive compounds such as angiotensin II
and oxidants (Verma and Anderson, 2002). Using this definition, endothelial
dysfunction is confined to unfolding inappropriate vasomotor constriction of the
vasculature, consequently aggravating luminal occlusion caused by conventional
atherosclerotic lesions.
In atherosclerotic development, however, diminished NO production by the
endothelium is an intricate player in the development of patho-physiological
inflammatory and molecular processes in the vasculature (Szmitko et al., 2003).
In addition to vasodilatory effects, NO also generates an anti-thrombotic environment
by limiting platelet aggregation at the endothelium (Freedman et al., 1997), In turn, this
prevents leukocyte adhesion to the endothelium by suppressing expression of adhesion
molecules (Gauthier et al., 1995) and it maintains vascular smooth muscle in a non-
proliferative state (Cornwell et al., 1994). This is a delicate balance, and local changes
in vascular environments (such as LDL cholesterol, free radicals, infectious
microorganisms, low shear stress, and angiotensin II-induced hypertension) can cause
endothelial activation, in part by reducing the intracellular concentration of NO (Sloop
et al., 1999).

Page 28
1.9.3.1 Initiation of the atherosclerotic lesion; where inflammation meets
endothelial dysfunction
Systemic risk factors such as elevated LDL, hypertension, high blood sugar, and by-
products of tobacco smoking help in the process of initiation and exacerbation of
atherosclerosis. Atherosclerotic lesions develop preferentially at bifurcations, branch
points, and inner curvatures of arteries, although the entire vascular endothelium is
exposed to these stimuli, which suggests that local factors contribute to the
susceptibility of the disease. It is widely established that the complex patterns of blood
flow in these regions expose the endothelium to "disturbed" hemodynamic forces low
shear stress (Lowe, 2004), which may in turn cause physical disruption of the
endothelium and concomitant inflammation (Gimbrone et al., 1997).
1.10 Diabetes-induced changes in myocardial fuel selection
Remarkable changes occur in the concentration of various energy substrates within the
circulation in T2DM, which in turn can control cardiac metabolism. The rate of
substrate uptake and oxidation in cardiomyocytes is significantly affected due to an
increase in the levels of both plasma glucose and fatty acids in diabetes. Fatty acid-
induced inhibition of sarcolemmal GLUT4 expression impairs the uptake of glucose in
the diabetic heart. Increased supply of FA can also result in the activation of cardiac
PPARα, which promotes the expression of genes involved in uptake of FA and
oxidation. In diabetes mellitus, an abundance of fatty acid causes an increase in the
uptake of fatty acid in the myocardium increasing the oxidative capacity of the heart.
This in turn leads to an accumulation of triglycerols, fatty acid intermediates, and
ceramides resulting in a state of lipotoxicity within the cardiomyocytes (DSouza et al.,
2009; Lopaschuk et al., 2010).

Page 29
1.11 Metabolic syndrome
WHO defined metabolic syndrome as a state, which includes central obesity,
dyslipidemia, impaired glucose tolerance, high blood pressure and T2DM. An
individual with a BMI of >30 kg/m2 (obese) carrying a minimum of two other risk
factors like dyslipidemia and hypertension is required to meet the criteria for diagnosis
of metabolic syndrome.
1.12 Obesity- a major health concern
One of the major health concerns in the 21st Century is obesity. This is when a person
has a BMI in excess of 25-30 and moreover, it can be defined as excess body weight
with an abnormally high proportion of body fat. An imbalance between energy intake
and energy expenditure can lead to obesity.
Obesity occurs due to interplay of sedentary lifestyle habits, genetic factors, medical
illness, microbiological aspects and social factors. Figure 1.3 depicts the relationship
between obesity, diabetes and the development of heart diseases.
1.12.1 Measurement of obesity
Obesity is commonly defined as body mass index (BMI, weight in kilograms divided by
height in meters squared) of 30 kg/m2 or higher. BMI (or Quetelet index) was
introduced by the Belgian polymath Adolphe Quetelet between 1830 and 1850. The
classification of body weight according to WHO is shown in table 1.2.

Page 30
Table 1.2: Classification of overweight in adults according to BMIa
Classification BMI (kg/m2) Risk of comorbidities
Underweight <18.5 Low
Normal range 18.5--24.9 Average
Overweight ≥25.0
Pre-obese 25.0-29.9 Increased
Obese class I 30.0--34.9 Moderate
Obese class II 35.0--39.9 Severe
Obese class III ≥40.0 Very severe
aThese BMI values are age-independent and the same for both sexes. However, BMI
may not correspond to the same degree of fatness in different populations due, in part,
to differences in body proportions. The table shows a simplistic relationship between
BMI and the risk of comorbidity, which can be affected by a range of factors, including
the nature and the risk of comorbidity. In turn this can be affected by a range of factors,
including the nature of the diet, ethnic group and activity level. The risks associated
with increasing BMI are continuous and graded and begin at a BMI below 25. The
interpretation of BMI gradings in relation to risk may differ for different populations.
Both BMI and a measure of fat distribution (waist circumference or waist: hip ratio
(WHR)) are important in calculating the risk of obesity comorbidities.

Page 31
Figure 1.3: Flow chart showing potential mechanisms for the development of diabetic
cardiomyopathy: ROS, reactive oxygen species; TNFα, tumor necrosis factor alpha; IL-
6, interleukin-6; AGE, advanced glycation end products.

Page 32
1.13 Diabetes mellitus and cardiovascular disease
As mentioned earlier that DM is classified as type 1 and type 2 DM. Lifestyle, dietary
habits, obesity, fat distribution, and age are the main pre-disposition factors for DM.
T1DM is mostly caused by genetic predisposition with a combination of autoimmune
disorders and viral infections. The prevalence of type 2 diabetes is growing globally and
is established to be related to morbidity and mortality due to cardiovascular events.
T2DM patients are more prone to acute myocardial infarction and angina and their
mortality in terms of cardiac events is found to be higher when compared to non-
diabetics. Ischaemic heart disease and diabetic cardiomyopathy are the two important
patho-physiological processes leading to diabetes-related cardiovascular disease.
Metabolic disturbances like hyperglycemia, hyperlipidemia, insulin resistance,
myocardial fibrosis, oxidative stress, and pro-inflammatory cytokines are the various
contributing factors to this complex process (DSouza et al., 2009).
1.13.1 Epidemiology of CVD
1.13.1.1 The concept of “risk factors”
Epidemiological studies trying to determine the various factors responsible for chronic
diseases associated with infection and nutritional deficiency in the past have put forward
the concept of ―risk factors‖. Research focussing on this type of disorders has been
subsequently tailored with the improval of public health sector and when chronic
diseases related to aging such as cancer and cardiovascular disease have become very
common (Kannel et al.,, 1961).
Therefore, the diverse factors linked to a disease have been statistically evaluated using
epidemiological methods. The concept of ‗risk factors‘ in cardiovascular disease was
initially popularised by the Framingham Heart Study (Kannel et al., 1961) which
originated from the latin verb ―facere‖ meaning ―to make‖. According to the definition,
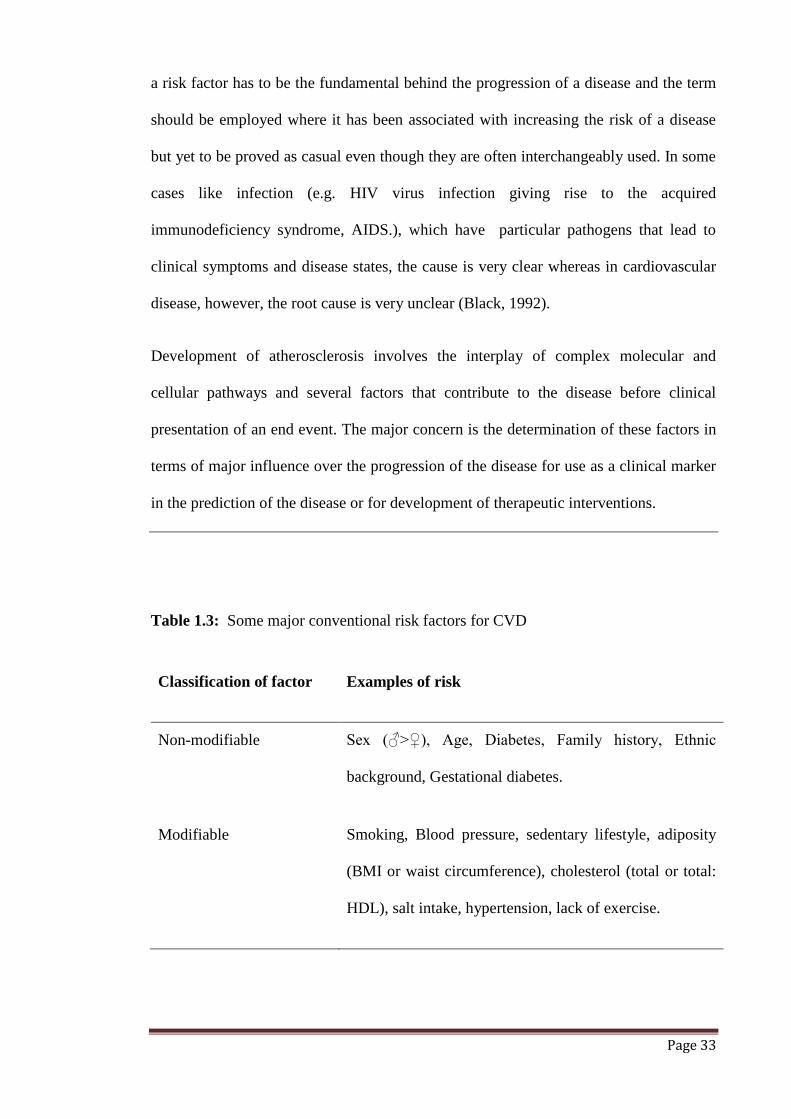
Page 33
a risk factor has to be the fundamental behind the progression of a disease and the term
should be employed where it has been associated with increasing the risk of a disease
but yet to be proved as casual even though they are often interchangeably used. In some
cases like infection (e.g. HIV virus infection giving rise to the acquired
immunodeficiency syndrome, AIDS.), which have particular pathogens that lead to
clinical symptoms and disease states, the cause is very clear whereas in cardiovascular
disease, however, the root cause is very unclear (Black, 1992).
Development of atherosclerosis involves the interplay of complex molecular and
cellular pathways and several factors that contribute to the disease before clinical
presentation of an end event. The major concern is the determination of these factors in
terms of major influence over the progression of the disease for use as a clinical marker
in the prediction of the disease or for development of therapeutic interventions.
Table 1.3: Some major conventional risk factors for CVD
Classification of factor Examples of risk
Non-modifiable Sex (♂>♀), Age, Diabetes, Family history, Ethnic
background, Gestational diabetes.
Modifiable Smoking, Blood pressure, sedentary lifestyle, adiposity
(BMI or waist circumference), cholesterol (total or total:
HDL), salt intake, hypertension, lack of exercise.
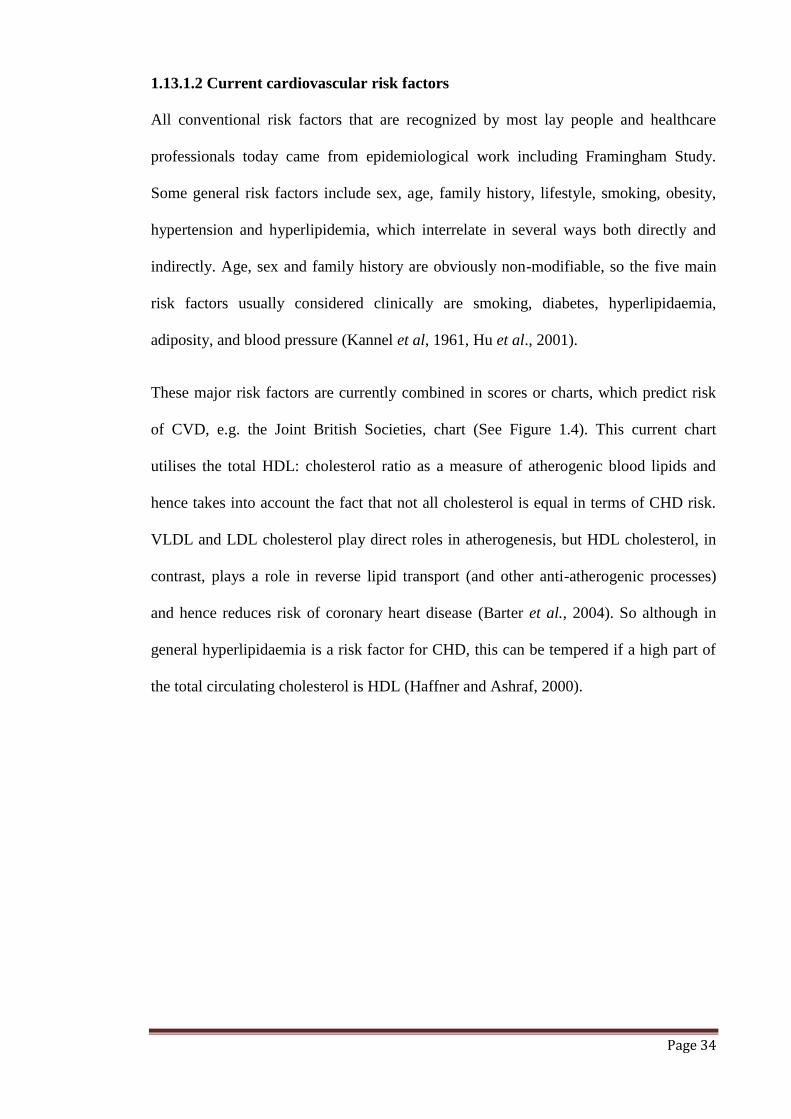
Page 34
1.13.1.2 Current cardiovascular risk factors
All conventional risk factors that are recognized by most lay people and healthcare
professionals today came from epidemiological work including Framingham Study.
Some general risk factors include sex, age, family history, lifestyle, smoking, obesity,
hypertension and hyperlipidemia, which interrelate in several ways both directly and
indirectly. Age, sex and family history are obviously non-modifiable, so the five main
risk factors usually considered clinically are smoking, diabetes, hyperlipidaemia,
adiposity, and blood pressure (Kannel et al, 1961, Hu et al., 2001).
These major risk factors are currently combined in scores or charts, which predict risk
of CVD, e.g. the Joint British Societies, chart (See Figure 1.4). This current chart
utilises the total HDL: cholesterol ratio as a measure of atherogenic blood lipids and
hence takes into account the fact that not all cholesterol is equal in terms of CHD risk.
VLDL and LDL cholesterol play direct roles in atherogenesis, but HDL cholesterol, in
contrast, plays a role in reverse lipid transport (and other anti-atherogenic processes)
and hence reduces risk of coronary heart disease (Barter et al., 2004). So although in
general hyperlipidaemia is a risk factor for CHD, this can be tempered if a high part of
the total circulating cholesterol is HDL (Haffner and Ashraf, 2000).
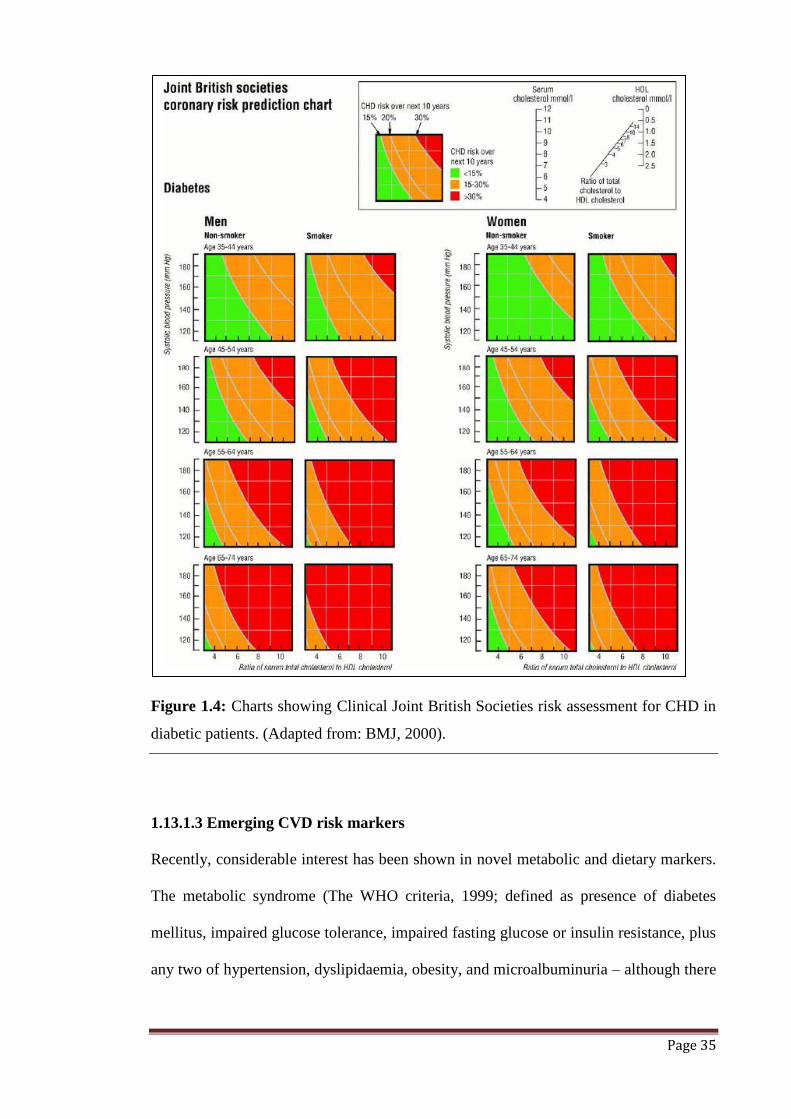
Page 35
Figure 1.4: Charts showing Clinical Joint British Societies risk assessment for CHD in
diabetic patients. (Adapted from: BMJ, 2000).
1.13.1.3 Emerging CVD risk markers
Recently, considerable interest has been shown in novel metabolic and dietary markers.
The metabolic syndrome (The WHO criteria, 1999; defined as presence of diabetes
mellitus, impaired glucose tolerance, impaired fasting glucose or insulin resistance, plus
any two of hypertension, dyslipidaemia, obesity, and microalbuminuria – although there
Page 36
are several proposed clinical definitions) has attracted considerable attention as a
predictor of T2DM as well as cardiovascular disease.
Recent meta-analysis shows T2DM as a predictor of CVD (Galassi et al., 2006),
although the clinical utility in diagnosing the syndrome as a CHD risk marker over and
above the Framingham risk assessment is extremely uncertain despite enthusiasm for its
use particularly in the USA (Wannamethee et al., 2005). In other examples, of
individual dietary hormones, lipids and triglycerides have recently been confirmed to be
moderately associated with the incidence of CHD during meta-analysis (Sarwar et al.,
2007). This is believed to have lipoprotein (a) (Danesh et al., 2000) and apolipoprotein
B:A ratios (Thompson and Danesh, 2006). In contrast, the hormone adiponectin is often
reported to be inversely associated with CHD, but any association was recently shown
to be weak on meta-analysis (Sattar et al., 2006). Some haemostatic markers have also
been shown to be associated with the incidence of CVD, perhaps due to their roles in
thrombus formation, longevity and degradation (Lowe, 2004).
In addition to these, measurements of subclinical plaque progression and stenosis have
also been shown to have associations with incident CVD. The simplest measure of
peripheral arterial resistance is the ankle brachial index (ABI), which shows a low
sensitivity, but high specificity association with CVD and CHD risk. More recent
computer imaging shows both non-invasive, and invasive procedures can predict CHD
risk (Ottolini et al., 2005). Typically, all of these markers have risk associations with
CVD and CHD that can be described as moderate, but are clearly not as useful as the
Framingham-based tests in clinical practice.
1.14 Inflammatory risk markers
As mentioned above, the role of inflammation in atherogenesis would suggest, a great
deal of work has been done looking for inflammatory markers that are risk factors for
Page 37
CHD (Libby et al., 2002). The most widely examined markers are fibrinogen, C-
reactive protein (CRP), white cell count (WCC) and IL-6. All of these markers are
associated with acute phase response and hence circulating levels reflecting the current
inflammatory state of the individual with WCC and CRP being the routine clinical
measures of inflammation.
These have been used in epidemiological studies to examine the hypothesis ―elevated
baseline inflammation predicts risk of CVD.‖ Meta-analysis of prospective studies in
generally healthy populations has shown that WCC (Wheeler et al., 2004), CRP
(Danesh et al., 2004), and fibrinogen (FSC, 2005) are risk predictors for CHD. CRP has
been promoted as a risk marker in cardiovascular disease, and much publication space
has been dedicated to this, particularly from the USA (Verma et al., 2005). Publication
bias is an important confounding factor in the epidemiological study of newer risk
markers.
In the USA, the measurement of CRP level has been suggested to add to established risk
factors for individual risk prediction for cardiovascular prevention (Pearson et al.,
2003), but not in Europe. Several other markers were considered potential candidates as
inflammatory risk markers in this debate (including WCC, fibrinogen and IL-6), but it
was decided that CRP best fitted the above criteria, and was generally the most
comprehensively studied of the markers (Pearson et al., 2003).
1.14.1 Inflammation and T2DM
T2DM is a progressive disorder emerging as a global epidemic and imposes a
tremendous burden on the health economy of many countries due to its fatal micro and
macrovasular complications (Zimmet et al., 2003). T2DM patients have an increased
risk for CVD due to many conventional risk factors which cannot fully account for the
disease. There is increasing evidence that atherosclerosis is accompanied by

Page 38
inflammation in several research studies. Full blood cell count including RBC, WBC
cell counts, C- reactive protein (CRP), HbA1c, lipid profile including HDL, LDL,
triglycerides are all positively associated with increasing CVD risk in T2DM (Kumar
and Clark, 2007).
1.14.2 Inflammation
Inflammation is the local protective response to tissue injury. The word inflammation
means ―setting on fire‖ (16th
century), and the process has been known since Egyptian
times (c. 2500 B.C.). The cardinal signs of redness, swelling, heat, and pain were
described by Celsus (first century A.D.), and loss of function was added by Galen (130–
200 A.D.) (Rather, 1971). Microscopically, these features are due to vasodilation,
accumulation of leukocytes, increased capillary permeability and interstitial fluid, and
stimulation of nerve endings by mediators such as substance P.
Cells such as monocytes, macrophages, T-cells, endothelial cells, vascular smooth
muscle cells, release inflammatory mediators including cytokines and chemokines
during the process of plaque development, which develop an inflammatory response in
the vessel (Ross, 1999). Potential epidemiological studies have found increased
cardiovascular risk with elevated basal levels of some of these same mediators
particularly, cytokines such as interleukin (IL)-6 or tumor necrosis factor-α (TNF-α),
soluble adhesion molecules, and downstream acute phase reactants such as C- reactive
protein (CRP), fibrinogen, and serum amyloid A (SAA) which have shown to predict
the risk of cardiovascular events (Libby et al., 2002).
It has been proposed that inflammatory cytokines secreted by the adipose tissue exert an
endocrine effect which is responsible for insulin resistance in liver, skeletal muscle and
vascular endothelial tissue and ultimately results in clinical expression of both T2DM
and CVD (Yudkin et al., 1999; Hu and Stampfer, 2003). An elevated production of

Page 39
adipocyte cytokines particularly, tumor necrosis factor (TNF-α) and interleukin-6 (IL-
6) produces an acute phase response that leads to an increased production of C-reactive
protein (CRP), a sensitive marker of low-grade systemic inflammation (Hotamisligil &
Spiegelman, 1994; Caballero et al., 1999). Apart from promoting insulin resistance,
TNF-α, IL-6 and CRP also stimulate endothelial production of adhesion molecules
including E-selectin, intercellular adhesion molecule-1 (ICAM-1) and vascular adhesion
molecule-1 (VCAM-1) which are crucial mediators of endothelial dysfunction in
capillary and arteriolar endothelium (Gabay and Kushner, 1999; Targher et al., 2005).
Interleukine 6 is a major proinflammatory cytokine produced in tissues including
activated leukocytes, adipocytes and endothelial cells. C- reactive protein is the main
downstream mediator of acute phase response and is primarily derived from IL-6-
dependent haepatic biosynthesis (Sattar et al., 2007). IL-6 has been shown to induce
gluconeogenesis, subsequent hyperglycemia, and compensatory insulinemia in rodent
models of glucose metabolism. Similar metabolic responses have been observed in
humans after subcutaneous administration of recombinant IL-6 (Tsigos et al., 1997).
Cross–sectional studies have shown that inflammation plays a major role in the
aetiology of T2DM and also demonstrated that elevated levels of IL-6 and CRP have
been observed in individuals with T2DM (Sattar et al., 2004).
Markers of inflammation are associated with T2DM and features of the metabolic
syndrome in cross-sectional studies (Thorand et al., 2007). Several cross-sectional
studies in non-T2DM subjects, the general population or in individuals with impaired
glucose tolerance (IGT)/impaired fasting glucose (IFG) have confirmed that acute-phase
reactants such as CRP (and sometimes the cytokines IL-6 and TNF-α) are positively
correlated with measures of insulin resistance/plasma insulin concentration, BMI/waist

Page 40
circumference, and circulating triglycerides and negatively correlated with HDL
cholesterol concentration.
In general, increasing components of the metabolic syndrome in individuals are
associated with higher levels of inflammatory markers. In subjects with IGT or IFG, IL-
6 but not TNF-α appears to be elevated compared with individuals with normal glucose
tolerance and in one study, inflammatory markers were related to insulin resistance but
not to insulin secretion.
Additional cross-sectional studies in newly diagnosed or established T2DM patients
have confirmed that acute-phase markers such as CRP and IL-6 are elevated in these
subjects compared with non-diabetic control subjects. In the study by Leinonen et al.,
2003, all markers of inflammation, including CRP, serum amyloid A, secretory
phospholipase A2, and IL-6, and endothelial dysfunction (soluble cell adhesion
molecules) correlated with the homeostasis model–measured insulin resistance.
1.15 Cations in T2DM
Several studies were published during the last century evaluating the various cations
and trace elements in T2DM. However, significant changes were observed within
similar reports and these differences were shown to be a result of various factors
including age, genetic factors, dietary habits, medication and glycaemic control of
patients. Alterations in the levels of various cations could also result due to chronic
hyperglycaemia and possibly modulation of glucose homeostasis by micronutrients
themselves. Blood plasma is considered to be a tissue pool for various cations and
single trace elements. However, recently, it became evident that micronutrient level of
plasma is a reflection of cations and trace elements only in cases of severe deficiency or
in excess. Several underlying factors for excess and deficiency of these various cations
Page 41
in plasma include infection, regulation of hormones, stress, circadian rhythm, impaired
homeostatic regulation.
1.15.1 Sodium (Na+)
Hyperglycaemia in patients with T2DM is a common clinical problem in which variable
changes in plasma sodium (Na+) concentration can occur. Acute studies suggest that
hyperinsulinemia may cause sodium retention and increased sympathetic activity, which
will be an important cause of hypertension (Reaven & Hoffman, 1987). Much evidence
from epidemiological, migration, intervention, animal and genetic studies suggest that
salt intake plays an vital role in regulation of blood pressure (He and MacGregor, 2003).
Several other studies have described significant effects of dietary salt intake on blood
pressure in normotensive and hypertensive patients (Morgan et al., 1978).
Recently, it has been predicted that through its effects on blood pressure, the
cardiovascular benefits of reduced salt intake are comparable with the benefits of
population-wide reductions in tobacco use, obesity and cholesterol levels (Bibbins-
Domingo et al., 2010). However, dietary salt intake may play a more important role in
diabetes than in the community at large, as it has been shown that patients with diabetes
have an increased total body exchangeable sodium (Beretta-Piccoli & Weidmann, 1982)
and moreover, they have higher blood pressure levels and higher aggregate
cardiovascular risk than the general population (Sowers et al., 2001).
1.15.2 Potassium (K+)
The results from the Atherosclerosis Risk in Communities (ARIC) Study, suggest that
serum potassium is an independent predictor of incident T2DM. Essentially,
maintenance of normal potassium homeostasis is important limiting factor in the
therapy of cardiovascular disease.

Page 42
A diet deficient in potassium intake has a critical role in regulating blood pressure in
primary hypertension (Horacio and Nicolaos, 2007) and may potentially increase the
risk of stroke (Green et al., 2002). Several studies have shown that hypokalemia could
be a possible risk factor for T2DM. Serum potassium levels affect insulin secretion by
pancreatic β-cells. Serum potassium in randomized controlled trials of thiazide diuretics
was found to be inversely associated to glucose which might possibly be a result of oral
potassium supplementation (Zillich et al., 2006). Experimental evidence also suggests
that thiazide-induced hypokalemia can lead to reduced insulin secretion (Rowe et al.,
1980, Adrogue and Madias, 2007).
1.15.3 Calcium (Ca2+
)
Calcium is the most important physiological cation in the body (Berridge et al., 2000).
It is the mediator and promoter of several physiological processes. Calcium is an
essential component for insulin secretion as it is a calcium-dependent process (Hellman
et al., 1994). Therefore, fluctuations in calcium levels might intervene and effect β-cell
secretory function. Inadequate calcium intake might alter the balance between
extracellular and intracellular cell calcium pools which interfere with normal insulin
release, particularly when there is glucose overload (Berridge, 1994). In insulin-
responsive tissues such as skeletal muscle and adipose tissue calcium are essential for
insulin-mediated intracellular processes (Ojuka, 2004; Wright et al., 2004). A very
narrow range of [Ca2+
]i is needed for optimal insulin-mediated functions (Draznin et al.,
1987). Changes in [Ca2+
]i in primary insulin target tissues possibly contribute to
peripheral insulin resistance via impaired insulin signal transduction, resulting in a
decreased glucose transporter-activity (Draznin et al., 1989).

Page 43
1.15.4 Magnesium (Mg2+
)
Magnesium (Mg2+
) is the fourth most abundant cation in the human body and the
second most abundant intracellular cation, which is an important cofactor for many
enzymes, particularly those involved in phosphate transfer reactions (Wacker, 1969).
Mg2+
is therefore essential in the regulation of metabolism of other ions and cell
functions. Recently, interest has been focused on the clinical importance of altered Mg2+
status (Whang, 1987). It has been shown that Mg2+
deficiency is associated with serious
cardiovascular diseases, such as cardiac arrhythmia and coronary heart disease, as well
as with risk factors including hypertension, hypercholesterolemia and diabetes mellitus
and moreover, a deficiency of serum magnesium has been reported in T2DM (Altura
and Altura, 1991).
1.15.5 Zinc (Zn2+
)
Zinc (Zn2+
) forms part of many protein domains, such as zinc metaloenzymes, and are
involved in the synthesis, storage and secretion of insulin monomers (Maret &
Sandstead, 2006; Kazi et al., 2008). It is considered to be deficient if serum zinc is less
than 60 μg/dl. Diabetes is usually accompanied by zincuria and consumption of
nutritional supplements can substantially increase zinc absorption by the gastrointestinal
tract (Cunningham et al., 1994). Nevertheless, the effects of zinc supplement, if dietary
intake is adequate, are incompletely understood. More clinical data on diabetic patients
who are at increased risk of zinc deficiency would be helpful as zinc has an
insulinomimetic effect and moreover, it also protects against the oxidative damage
associated with the disease (Chen et al., 1998). Additionally, oxidative damage in
diabetic patients may result in lower antioxidant micronutrient status, especially trace
elements (Wolff et al., 1991).
Page 44
Therefore, abnormal serum Zn2+
status, can promote the progression of diabetes (Ding
et al., 1998). Microalbuminuria is a major factor which predicts the onset of overt renal
disease and reflects glomerular dysfunction in diabetic patients (O'Brien et al., 1997).
Zinc supplementation has beneficial effects on microalbuminuria and serum lipid profile
in T2DM with microalbuminuria (Mahmoud et al., 2008).
1.15.6 Copper (Cu2+
)
Copper is one of the essential trace elements and it plays an important role in
cytochrome oxidase function at the terminal end of the mitochondrial electron transport
chain. Loss of this activity might contribute to the characteristic swelling and distortion
of mitochondria which can be observed in copper deficiency, particularly in
metabolically active tissues such as pancreatic acinar cells, enterocytes, and hepatocytes
(Aggett, 1985). In subjects with insulin dependent diabetes mellitus (IDDM), zinc
concentrations have been demonstrated to be lower in leucocytes and erythrocytes than
in serum, while no such alteration has been found with copper (Razz & Haivivi, 1989).
No definite association has been explained between copper concentrations and the
clinical status of patients with diabetes mellitus (Fujimoto, 1987).
1.15.7 Iron (Fe2+
)
Iron is the most abundant transitional metal in the body and it has been recognized that
an increase of total body iron stores is associated with an increased risk for the
development of T2DM (Fernández-Real et al., 2002). T2DM is a common
manifestation of haemochromatosis, a disease of iron overload. Iron is a catalyst
involved in the formation of hydroxyl radicals, which are powerful pro-oxidants that
attack cellular membrane lipids, proteins, and nucleic acids (Beard, 2001; Andrews,
1999). Formation of hydroxyl radicals catalyzed by iron contributes initially to insulin
resistance and subsequently to decreased insulin secretion which leads to the

Page 45
development of T2DM (Larry, 1988). Thus, iron plays a major role in several steps of
insulin action and glucose metabolism.
Page 46
1.16 Biochemical markers
1.16.1 Glucose
T2DM is a disease associated with abnormal carbohydrate metabolism which arises due
to insulin deficiency as insulin is the key hormone responsible for glucose homeostasis
in blood (Kumar et al., 2005). Consequently, elevation of blood glucose predominantly
affects RBC‘s, vascular endothelial cells and walls of capillaries which often leads to
microvascular complications in T2DM including retinopathy, nephropathy and
neuropathy (Pirat, 1978). Hyperglycaemia can lead to vascular complications through
various mechanisms (DSouza et al, 2009). High blood glucose concentration or
hyperglycaemia can activate several factors including nuclear factor kB, which in turn
increases the expression of various genes in endothelial cells, monocyte-derived
macrophages and vascular smooth-muscle cells (DSouza et al., 2009). Various
mechanisms have been proposed to explain how hyperglycaemia causes vascular
complications in T2DM. An increase in glucose can lead to an increase in the
fluctuation of glucose to sorbitol through the polyol pathway as well as an increase in
glucosamine -6-phosphate via the hexosamine pathway, activation of PKC (protein
kinase C) via de novo synthesis of diacylglycerol DAG (Ahmed, 2010). The first study
which reported glucose as a risk factor in the UK was the Bedford Study in 1965 and
the Tecumseh Study in the U.S which suggested that elevation of glucose could be
associated with CHD mortality and verified this hypothesis.
The results from several clinical trials have proven that intensive glucose control can
reduce the risk of microvascular complications among T2DM patients although its
effect on CVD is uncertain. One of the most crucial features of T2DM is
hyperglycaemia that affects haemoglobin and membrane proteins of RBC as a result of

Page 47
abnormal glycation which is shown to be positively correlated with reduced membrane
fluidity.
1.16.2 Liver function tests (LFT’s)
Human liver plays an important role in maintaining blood glucose concentration during
both fasting and postprandial states. An increase in haepatic glucose production
following glycogenolysis is due to loss of insulin effect on the liver. Early
manifestations of conditions that are characterized by insulin resistance and detected
earlier than fasting hyperglycaemia include abnormalities of triglyceride storage and
lipolysis in insulin-sensitive tissues such as liver. The sequence of various events and
factors leading to underlying insulin resistance include genetic, environmental and
metabolic factors. However, the mechanism how these factors induce insulin resistance
is not clearly understood. Individuals with T2DM have a higher incidence of liver
function test abnormalities when compared with healthy age-matched controls (Lewis et
al., 2002; Harris, 2005).
Serum aminotransferases, alkaline phosphatase, bilirubin, albumin are the most
common LFT. Aminotransferases including alanine aminotransferase (ALT) and
aspartate aminotransferase (AST) serve as markers of hepatocyte injury by measuring
the concentration of intracellular hepatic enzymes that leaked into the circulation.
Albumin and prothrombin reflect liver synthetic function while alkaline phosphatase
(AP) and γ-glutamyl transpeptidase (GGT) act as markers of biliary function and
cholestasis.
1.16.3 HbA1c
Haemoglobin A1c is a marker of cumulative glycaemic exposure over the preceding two
to three months in diabetic patients. Measurement of glycated haemoglobin was the first
clinically used method around 30 years ago to assess the levels of hyperglycaemia in

Page 48
T2DM patients (Koenig et al., 1976). The values of HbA1c in patients are a reflection
of weighted mean glucose levels over the past 3-month period (Tahara and Shima,
1995). Elevated HbA1c is strongly associated with long-term microvascular
complications and assessment of HbA1c is used for monitoring effective glycaemic
levels.
In recent years, several research studies have made an effort to expand the role of
HbA1c as an index of cumulative glycaemic exposure in both diabetes and
cardiovascular risk assessment (Ko et al., 2000). Several studies have also tried to
evaluate the function of HbA1c in predicting future T2DM in patients with high risk
pre-diabetes. Recent studies also have suggested that HbA1c can be used to predict
cardiovascular risk in T2DM patients. During the past three decades, elevated HbA1c
has been associated with long-term risk of microvascular complications and currently,
HbA1c assessment is being used ubiquitously for monitoring effective glycaemic
control as a keystone of diabetes care (Little, 2003). In one of a recent case-control
study, it has been shown that elevated levels of HbA1c could predict the incidence of
cardiovascular events. However, this similar effect was not observed when some of the
other cardiovascular risk factors were adjusted (Blake, 2004).
1.16.4 Full blood count
A number of studies have reported significant associations of routine haematological
parameters with T2DM and CVD. Results suggest that these abnormalities might form
the common soil for both T2DM and CVD. In this study, the levels of various
haematological parameters including haemoglobin, RBC, WBC, glucose concentration
were evaluated and compared with non-diabetics. A strong association between insulin
resistance syndrome and cardiovascular diseases has been demonstrated. High RBC

Page 49
count is a strong independent predictor of acute cardiovascular events including stroke
and myocardial infarction.
Haemorheological parameters including haematocrit, plasma proteins, erythrocyte
aggregation, and erythrocyte deformability in T2DM patients are often disturbed. These
abnormalities lead to an increase of both plasma and whole blood viscosity (WBV).
Deformability of RBC‘s is one of the haemorheological parameters which is altered in
T2DM patients. RBCs of T2DM patients tend to aggregate more easily when compared
with healthy subjects. Excessive aggregation of RBC is one of the most important
features in T2DM patients with poor glycaemic control. This has a direct effect on the
WBV (Grigoleit et al., 1973).
1.16.5 Lipid profiles
A significant percentage of T2DM patients have abnormal serum lipid. Recent studies
have revealed that insulin resistance is not only associated with hyperglycaemia alone,
but also with several other disorders which are associated with the concentrations of
lipoproteins (Grundy, 1997). In T2DM patients, typical abnormalities frequently
observed in lipid profile are elevated total and VLDL cholesterol, triglyceride, low
levels of HDL, and a large number of dense LDL particles (Lamarche et al., 1997). It is
well understood that diabetic dyslipidemia is a major hallmark of metabolic syndrome
and found to play an extensive role in the pathogenesis of CVD (Wannamethee et al.,
2007). Moreover, it has become the main reason responsible for cardiovascular
morbidity and mortality in T2DM patients. An increased risk of coronary heart disease
has been observed in both T2DM patients and non-T2DM subjects having
triglyceridemia (Fontbonne, 1989). The central characteristic of dyslipidemia in T2DM
patients is an elevated triglyceride level, particularly triglyceride-rich VLDL and
decreased HDL cholesterol levels, though concentration of LDL cholesterol does not

Page 50
significantly differ from non-diabetic subjects. This characteristic lipid triad is often
referred to as atherogenic dyslipidemia which is commonly observed in people having
premature CAD and considered as diabetic dyslipidemia when observed in T2DM
patients and which leads to CVD risk. According to American Diabetes Association
(ADA), increased levels of triglyceride and decreased levels of HDL is the best
predictor of CVD in T2DM patients.
1.16.6 C- reactive protein (CRP)
Multiple organs and organ systems as the heart, brain, kidneys and peripheral arteries
are typically affected by the risk factors for CVD. T2DM and hypertension are two
major candidates which are associated with CVD risk and other organ damage.
Recently, novel CV risk markers have been introduced as predictors of cardiovascular
morbidity and mortality. One such factor is C-reactive protein (CRP). CRP is the
prototypic acute-phase protein which can predict cardiovascular (CV) morbidity and
mortality in high-risk patient groups such as T2DM and the general population. CRP is
a sensitive marker of inflammation (King et al., 2003; Lloyd et al., 2006).
Inflammation, either systemically or at local sites may underlie the atherosclerotic
process resulting in vascular end-organ damage or applies to multiple vascular beds.
Indeed, slight increases in serum CRP levels are associated with an increased risk for
damage in different vascular beds (Ridker et al., 1997) including the heart, brain,
kidneys and lower extremities. However, CRP is not an independent risk marker for CV
disease in some reports.
CRP, an acute phase biomarker in systemic inflammation plays an important role in the
patho-physiology of T2DM (Dehghan et al., 2007). It is also one of the emerging
independent risk factors for cardiovascular disease and it can be used as a predictor in
some healthy populations (King et al., 2002). CRP is an oligomeric protein belonging to
Page 51
the family of pentraxin and is known to engage in innate immunity in recognition of
patterns (see Table 1.4).
CRP actively participates in complement fixation, modulation of platelet activation, in
enhancement of activity of leukocytes and in the elimination of cellular debris from the
sites of active inflammation (King, 2003).
CRP is produced by the liver through the stimulation of other cytokines like Interleukin
1 and 6 and tumour necrosis factor. Many prospective recent studies have suggested that
CRP carries a higher risk for the development of T2DM (Doi et al., 2005). Numerous
cross sectional studies stated that high levels of CRP in serum are linked with obesity,
insulin resistance and glucose intolerance (Ford, 1999). A high level of C-reactive
protein is associated with an increase in the risk of thrombotic events and later
development of diabetes (Ridker et al., 1997). There is an established relation between
CRP and insulin resistance (Festa et al., 2003). It is widely assumed that CRP represents
the inflammatory component of the process of atherosclerosis in the arterial vessel wall
(Table 1.4).

Page 52
Table 1.4: Direct role of C-reactive protein in atherogenesis
Localisation
Localises in shoulder regions of (vulnerable) plaques
Depositions with inflammatory cells and lipid-rich areas
Co-localisation with complement in infarcted tissue
CRP ligand binding
Binds selectively to LDL, especially oxLDL
Aggregated and/or ligand-complexed CRP activates complement
Phagocytic function
Enhances LDL uptake by macrophages
Vascular function
Decreases NO synthase expression in endothelial cells
Decreases prostacyclin release from human aortic cells
Relaxes human vessels
Leukocyte adhesion
Induces expression of leukocyte adhesion molecules
Induces secretion of MCP-1
Thrombosis
Increased rate of thrombosis in CRP-transgenic mice
Tissue factor production by macrophages
Page 53
1.16.7 Interleukin-6 (IL-6)
Interleukin-6 is a pleiotropic cytokine belonging to the IL-6 family which include IL-11,
oncostatin M, ciliary neurotrophic factor, cardiotrophin-1, cardiotrophin like cytokine
and leukemia inhibitory factor (Giraud et al., 2007). It is a 26 kDa pleiotropic cytokine
mainly produced by endothelial cells, macrophages, adipocytes and lymphocytes (Kerr
et al., 2001). As mentioned previously, IL-6 is implicated as a pivotal acute phase
response (APR)-inducing cytokine in IL-6 knock out (KO) mice, although there is
evidence that it is not exclusively responsible for this. In addition to its role in the APR,
it is thought to stimulate haemostasis and influence T- and B-cell differentiation (Kerr et
al., 2001) as well as stimulating endothelial cells to produce chemokines (in complex
with soluble IL-6 receptor [sIL-6R]). Moreover, it also plays a major role in the
transition between acute and chronic inflammatory responses (Gabay, 2006). Mouse
models indicate that exogenous addition of IL-6 exacerbates atherogenesis, indicating a
role for IL-6 (Huber et al., 1999) through the mechanisms described above. Despite this,
IL-6 KO models indicate that basal physiological levels of IL-6 may be required to
maintain plaque integrity. This observation may be consistent with some of the
condition-specific pro- versus anti-inflammatory actions of IL-6 (Kerr et al., 2001;
Gabay, 2006).
In epidemiology, major correlates of IL-6 are age, smoking and acute phase response
markers. A recent meta-analysis of 10 available prospective studies (Ridker et al., 1997)
including 2089 cases of non-fatal MI or CHD deaths, demonstrated that men in the top
third of the population for IL-6 expression had an OR 1.67 (95% confidence intervals
[CI] 1.35 –2.05) independent of conventional risk markers. This does not include more
recent data, such as that from the Edinburgh Artery Study (Tzoulaki et al., 2007).

Page 54
Although the data are again in broad agreement with the meta-analysis; OR 1.85 (1.33
to 2.58) in the top versus bottom tertile in a fully adjusted model.
In the same study (Mann et al., 2011) a meta-analysis of the well-studied IL-6 promoter
polymorphism -174 G/C was performed, since this allele is generally thought to be
associated with elevated circulating concentrations of IL-6. In this analysis, and in
contrast with some published literature, no association between the single nucleotide
polymorphism (SNP) and circulating levels of IL-6 was observed (in 9 studies with
5871 participants) and unsurprisingly nor was there any association with CHD risk.
Hence, IL-6, like fibrinogen and CRP, is associated with atherogenesis in some
molecular and animal models, and moreover, it is associated with CHD risk in
epidemiological studies to a similar extent.
IL-6 impinges on the immunoregulation and non-immune processes in various cells of
the body. Several studies have revealed the relation between IL-6 and pathogenesis of
type 2 diabetes (Yudkin et al., 2000; Kristiansen and Mandrup, 2005). IL-6 is produced
by many types of cells counting endothelial cells, skeletal and smooth muscle cells,
islet-cells, microglial cells, hepatocytes, astrocytes, adipocytes and most of the cells of
immune system.
1.16.8 Fatty acid binding protein (FABP)
H-FABP is a protein of low -molecular weight concerning the uptake of free fatty acids
in the myocardium (de Windt et al., 2002). It is abundantly found to be in the cytoplasm
of cardiomyocytes and it gets elevated when there is myocardial injury. FABP assists in
the transportation of fatty acids in cardiomyocytes and moreover, it holds a key role in
the mitochondrial beta oxidative system.
Page 55
Heart type fatty acid binding protein (HFABP) is known to play a major role in
myocardial infarction (Naraoka et al., 2005). FABP is found to be a new biomarker
predicting the development of T2DM. It has been recognized that there is an augmented
level of circulating FABP in people with glucose dysregulation.
It has been shown earlier that FABP levels are associated with metabolic syndrome
leading to an increased risk of T2DM (Tso et al., 2007). FABP alters the production of
inflammatory cytokines and the accretion of cholesterol esters in the macrophages
which are quite similar to adipocytes (Xu et al., 2006).
1.16.9 Homocysteine
Homocysteine is recognized as a possible independent risk factor for atherosclerotic
disease (Selhub et al., 1995). It a sulphur containing amino acid produced by the
metabolism of amino acid methionine (Cronin et al., 1998) which is reversibly
converted into homocysteine by the transmethylation process. It is identified as an
independent cardiovascular risk factor among diabetic patients and is quite often linked
to insulin resistance syndrome (Tessari et al., 2005) by numerous potential clinical
studies. Prospective studies have also suggested a possible association between an
increased level of plasma homocysteine and insulin resistance (Malinow et al., 1995,
Cornelius et al., 1998).
An array of risk factors for cardiovascular disease such as obesity, hypertension, and
hyperlipidemia are related to insulin resistance which consequently can result in
atherosclerotic events in diabetic population (Anan et al., 2007). One of the possible
means by which elevated levels of plasma homocysteine can lead to atherosclerosis is
through inflammatory processes (Zhang et al., 2004).

Page 56
1.16.10 Tumour Necrosis Factor- α (TNF- α)
TNFα is now acknowledged as being a pluripotent cytokine, and the mechanisms of
many of its biological activities are still not clearly understood. It seems to be capable
of inducing diverse, and at times, contradictory physiological effects depending on the
experimental setting. It is known that TNFα can cause apoptosis, septic shock,
inflammation and cachexia systemically (Beutler and Ceramic, 1988). Yet, in contrast,
it can induce growth through mitosis, it immunologically protects the host, and may also
help to induce obesity by metabolic mechanisms (Ferrari, 1999).
TNFα has a long scientific history associated with CVD. For more than 2.5 millennia, it
has been recognised that patients with end-stage chronic heart failure (CHF) share
clinical features with individuals with neoplasia or inflammatory disorders (Ferrari,
1999).
1.17 Cellular Calcium (Ca2+
) homeostasis and Type 2 diabetes (T2DM)
Moreover, complications of T2DM can also affect vascular endothelium, vascular
smooth muscle cells, platelets, monocytes and several other cells and tissues. Ca2+
homeostasis and Ca2+
signalling play a very crucial role in the regular functioning of
these cells as they are actively involved in cell-proliferation, cell-death and secretion in
many cells (Kumar and Clark, 2007). Numerous studies have investigated the diverse
aspects of Ca2+
signalling in β-cells and homeostasis in T2DM. It is well known that
Ca2+
plays a very active physiological role in insulin secretion and there is also evidence
that Ca2+
is involved in mediating actions of insulin contributing to the pathogenesis of
insulin resistance in T2DM. It is observed that basal Ca2+
is elevated and Ca2+
signalling
is impaired in many cells including platelets, endothelial cells and vascular smooth
muscle cells in diabetes and hypertension (Resnick et al., 1983). Insulin decreases
vascular resistance by stimulating nitric oxide production in endothelial cells and

Page 57
reduces Ca2+
in vascular smooth muscle cells. High concentration of Ca2+
in endothelial
cells increases secretion of basement membrane proteins and contributes to thickening
of basement membrane which leads to narrowing of blood vessels.
There is increasing evidence which reveals that T2DM is a state in which calcium
homeostasis is impaired (Marhoffer et al., 1992; Levy et al., 1994b). Dysfunctioning of
calcium regulation is found in various body cells including erythrocytes, platelets,
lymphocytes and neutrophils which confirm the basic pathology associated with
diabetic condition. An increase in the calcium level is the most common finding which
was described in diabetes among the various other problems associated with the
dysregulation of calcium homeostasis.
The primary defect of these multiple functions involved in Ca2+
regulation is still
unknown. Ca2+
metabolism plays a very important role in the vascular complications
associated with T2DM such as atherosclerosis, hypertension and angiopathy and also in
the pathogenesis of some of the microvascular complications. Therefore, Ca2+
homeostasis could be a common pathway which links most of features of T2DM.
1.17.1 Cell Ca2+
regulation
Even though there underlies tissue specificity, most of the mechanisms for the
maintenance of Ca2+
homeostasis are shared by tissues (Howard, 1989; Okamoto et al.,
1992; Antony, 1994; Levy et al., 1994a). Intracellular free Ca2+
concentration [Ca2+
]i is
104 times lower than extracellular Ca
2+ levels which is maintained by a complex
interplay of various Ca2+
transporters responsible for the influx, extrusion and release of
Ca2+
in different cells. These include the Na+/Ca
2+ exchanger, the calmodulin- (CaM)
dependent Ca2+
- ATPase, the sarcoplasmic endoplasmic ATPase pump (SERCA) which
induces calcium release from the ER or SR and the different Ca2+
channels that regulate
Ca2+
entry into the cell (Rasmussen, 1986; Petersen et al., 1994).
Page 58
Ca2+
is mainly stored in cell organelles such as the endoplasmic sarcoplasmic reticulum
(ER/SR), and the mitochondria within the cell (Ann, 1993). Regulation of [Ca2+
]i is
more active in the ER than the mitochondria. Release of Ca2+
from the ER has several
mediators which include inositol triphosphate (Ip3), Ca2+
via ryanodine receptors and
also cyclic adenosine triphosphateribose (cADP-ribose) (Takasawa et al., 1993). The
entry of Ca2+
into the ER is mediated by a CaM-independent Ca2+
-ATPase.
Flooding of excess Ca2+
into the cytoplasm after its release from the cellular stores is
mediated by several cellular responses (Clapham, 1993). Excess Ca2+
is pumped out of
the cell and back to the ER which is mediated by Ca2+
-ATPase pumps. To prevent
depletion of Ca2+
stores due to the repetition of such cycles, there are Ca2+
specific Ca2+
channels in the plasma membrane which allow a small amount of Ca2+
into the cell and
pumped into the Ca2+
stores to replenish the ER. The rate of this Ca2+
entry is
determined by Ca2+
influx factor and cytoplasmic Ca2+
levels. (Na+ + K
+)-ATPase and
the Na+/H
+ and Na
+/ Ca
2+ exchanger are some of the other mechanisms that regulate
[Ca2+
]i which affect [Na+]i. The stimulation or inhibition of Na
+/Ca
2+ exchanger might
result in the increase or decrease of Ca2+
levels which ultimately leads to the disruption
of [Ca2+
]i homeostasis and damage Ca2+
-regulated ligand functions (Levy et al., 1994a).
However, it is important to emphasize that the calcium signal is very specific to the
particular stimuli involved. This specificity of calcium signal is accomplished since two
factors determine the ―calcium language‖: the amplitude of the change in [Ca2+
]i level,
and the distance that this change spreads. A specific pattern of change is created by
these two determinants in the level and distribution of the cation in the cell, and make
each Ca2+
signal unique to the specific stimuli (Allbritton et al., 1992; Petersen et al.,
1994).
Page 59
1.17.1.1 Abnormal-cell Ca2+
regulation in diabetes
Although [Ca2+
]i is important for vital functions in all cells, some of its effects such as
contraction in muscle and secretion in glands are tissue-specific (Boris, 1988; Levy et
al., 1989; Levy et al., 1994a).Therefore, defects in [Ca2+
]i homeostasis might be
expressed differently in the different tissues involved. Further, since the mechanisms
that regulate [Ca2+
]i are tightly interrelated, a defect in one mechanism may impair the
function of the other mechanisms, making the identification of the primary defect a
complicated task. Various abnormalities in [Ca2+
]i regulation were described in animal
models of diabetes and obesity and in obese and diabetic patients (Kato et al., 1994;
Levy et al., 1994b). These include pathologies of function of the plasma membrane and
the ER/SR Ca2+
-ATPase, (Na+
+ K+)-ATPase, Na
+- Ca
2+ exchanger, Ca
2+-induced Ca
2+
release from the ER, the tissue total calcium content, and the actual [Ca2+
]i levels (Juntti
et al, 1993; Roe et al., 1994).
Defects in cell Ca2+
homeostasis were described in erythrocytes, cardiac muscle,
platelets, skeletal muscle, kidney, aorta, adipocytes, liver, osteoblasts, arteries, lens,
peripheral nerves, brain synaptosomes, retinal tissue, and in pancreatic β cells
(Tomizawa et al., 1993; Roe et al., 1994; Janicki et al., 1994; Levy et al., 1998).
However, there is noticeable variation with regard to the described specific defect in
each of the [Ca2+
]i regulatory functions. For example, basal [Ca2+
]i levels have been
described to be either high, low, or normal in cardiomyocytes in diabetes ( Schaffer &
Mozaffari, 1996; Hayashi & Noda, 1997; Yu et al., 1997). Similarly, basal activity of
the plasma membrane Ca2+
-ATPase was described to be either high, low, or normal
(Levy et al., 1994b). However, even when basal functions were normal, dynamic
studies that tested responses of the [Ca2+
]i regulatory function to an agonist were
abnormal, suggesting that dynamic studies might be more sensitive in identifying early
defects in cell Ca2+
homeostasis in diabetes and obesity. Since the functional state of the
Page 60
[Ca2+
]i regulatory mechanisms, such as the ATPase‘s, depends on many factors
including membrane phospholipid content, level of Mg2+
, free fatty acids, cholesterol,
and glucose and these conditions were not standardized in the different studies, it is
expected to observe contradictory results obtained in the different reports. However, an
increase in the level of [Ca2+
]i has been described most frequently as a defect in cell
[Ca2+
]i homeostasis in diabetes and obesity (Levy et al., 1988; Gonzalez Flecha et al.,
1990; Mene et al., 1993; Williams & Schrier, 1993, Espino et al., 2010).
1.17.1.2 Impaired-Cell Ca2+
Homeostasis and Insulin Secretion
So far, defects in β-cell [Ca2+
]i homeostasis have been described only in animal models
of diabetes and in islet cells exposed to high glucose for a long time, but it is expected
that similar defects will appear in human diabetes (Roe et al., 1994). Islets from db/db
mice lack the initial reduction of [Ca2+
]i and the subsequent Ca2+
oscillations in
response to glucose, and islets from neonatal induced T2DM rats lacking insulin
response to glucose, but respond to amino acid stimulation have selective defect in the
increase of [Ca2+
]i in response to glucose (Giroix et al., 1983; Tsuji et al., 1993). L-type
voltage-dependent Ca2+
channel activities are increased in β cells from these T2DM rats
and their Ca2+
-ATPase activity is decreased. Since oscillations of [Ca2+
]i are essential
for the pulsatile insulin secretion, loss of these oscillations may play a significant role in
the loss of pulsatile insulin secretion observed early in T2DM (Leahy, 1990). Finally,
there is evidence that the ―glucose toxicity,‖ which selectively impairs insulin secretion
in response to glucose (and may play a significant role in the β-cell dysfunction in
diabetes) may be mediated in part by a glucose-induced impairment in the β cells‘
[Ca2+
]i homeostasis (Dunbar et al., 1989; Okamoto et al., 1992). Culture of rat islet cells
in media that contain high glucose concentration cause a progressive, dose- and time-
dependent decrease in the membrane Ca2+
-ATPase activity of the islet cells (Levy et al.,
Page 61
1998). In turn, the significance of the Ca2+
ATPase for normal insulin secretion has
recently been considered (Gagliardino & Rossi, 1994).
1.17.2 Calcium and cardiovascular disease
T2DM is a well-established and independent risk factor for the development and
progression of atherosclerosis. The mechanisms that predispose T2DM subjects to
organ injury and atherosclerosis are multifactorial. Abnormalities of endothelium
function and morphology appear to play a central role in the pathogenesis of T2DM-
related atherosclerosis. Among the mechanisms causing endothelial dysfunction that
have been recently implicated in essential T2DM are insulin resistance and its
accompanying compensatory hyperinsulinemia, oxidative stress (OS), and
inflammation. Recent evidence from various studies suggests that Ca2+
might play a
major role in hypertension, atherosclerosis and cardiomyopathy (Levy et al., 1994a;
Schaffer & Mozaffari, 1996).
It has been suggested that diabetes and cardiovascular disease are associated with a
common defect of divalent cation metabolism, which also includes calcium (Lawrence,
1989). [Ca2+
]i has a role as a key mediator in the production of oxidants by PMN and in
their degranulation, resulting in OS, inflammation, and damage to endothelial cells,
vasoconstriction, and hypertension. Elevated [Ca2+
]i has been described in various cells
in insulin-resistant states such as uremia, diabetes, and hypertension. An elevation in
[Ca2+
]i in PMN from hemodialysis patients, diabetic patients, and diabetic rats has been
previously described as playing an important role in the pathogenesis of their impaired
phagocytosis (Espino et al., 2011).
1.18 Structure of red blood cell (RBC) or Erythrocyte membrane
Structure of RBC membrane is studied comprehensively as a model for the membrane
of many other complex cells. Due to their availability in large numbers and relatively
Page 62
simple membranes which can be purified easily, erythrocytes have attracted such
investigations for many years including medical conditions like haemolytic anaemia,
transfusion reactions and so on. Erythrocyte skeleton plays a major role in determining
the shape and the deformability of the cell. Disruption of the interaction between the
various components of the red cell membrane skeleton may cause loss of structural and
functional integrity of the membrane.
The erythrocyte holds a unique, biconcave shape which allows an excess of about 40%
membrane surface to cell volume (Mayhew et al., 1994). This shape provides plasticity
to the cell and contributes to its deformation, which is an essential component to
traverse capillary beds containing vessels smaller than a diameter of 8 μm. A dynamic
interaction between the cytoskeleton and the membrane enables these morphological
changes to take place in the RBC (Sivilotti, 2004). The membrane skeleton is made of a
protein network which consists of structural proteins on the inner surface of the
erythrocyte membrane and is bound, through linking proteins, to integral proteins of the
erythrocyte membrane (Delaunay, 2007). Hence, the membrane is considered as a
structure that extends into the cytoplasm as well as the extracellular space (Bruce et al.,
2003).
Erythrocyte membrane belongs to the bilayer membrane composed of various proteins
and lipids. The nomenclatures and ordinal numbers of the erythrocyte membrane
proteins are assigned according to the mobility of their bands during separation by
sodium dodecyl sulfate polyacrylamide gel electrophoresis (SDS-PAGE) (Petropoulos
et al., 2007). In general, erythrocyte membrane proteins can be divided into two groups.
One group includes peripheral proteins such as spectrin, ankyrin, protein 4.1, actin,
protein 4.2 and the other group includes integral proteins such as band 3 and
glycophorin (Figure. 4.1).

Page 63
1.18.1 RBC membrane proteins
1.18.1.1 Spectrin
Spectrin is the major components of the RBC membrane skeleton and it comprises of
25%–30% of total membrane proteins. It is a heterodimer consisting of alpha- and beta-
subunits that are encoded by different genes and associate head-to-head to form
tetramers. The molecular weight of α-spectrin is 240 kDa, which contains 20
homologous 106 amino acid repeat segments and two non-homologous segments. The
molecular weight of β-spectrin is 220 kDa, which contains 17 homologous 106 amino
acid repeat segments, non-homologous amino terminal anti-parallel segments,
connected by short non-helical segments. Spectrin heterodimer is a rod-like flexible
filament, measuring approximately 100 nm in length (Gallagher and Forget, 1993).
Each erythrocyte contains about 200,000 copies of α and β Spectrin and these chains
interlink in an anti-parallel fashion, forming the heterodimer. Spectrin tetramers link
together in a hexagonal array which is connected to the plasma membrane at junctional
complexes by interacting with actin, protein 4.1 and GPC. Self-association of spectrin
dimers into tetramers is possibly the best-characterised interaction of membrane
proteins, allowing the erythrocyte to acquire its mechanical properties (Van Zwieten et
al., 1995).
The functions of spectrin include maintenance of erythrocyte shape, regulation of lateral
motion of integral proteins and to provide structural support to the lipid bilayer and are
dependent on its interaction with membrane proteins. Spectrin also plays an essential
role in maintaining local concentration of plasma membrane proteins. It is also involved
in early stages of cell junction formation and regulation of entrance of secretory vesicles
into the plasma membrane in non-erythroid cells (Schwartz et al., 1991).
Page 64
1.18.1.2 Ankyrin
Human ankyrin is an asymmetrical polar protein composed of 1881 amino acid
residues, with a molecular weight of 206 kDa. It is a mixture of proteins with different
sizes and contains three functional domains defined by chymotrypsin cleavage. These
include the 89 kDa N-terminal domain extending from Pro-2 to Phe-827 containing the
binding site for band 3 and tubulin, the central 62 kDa domain which starts at Lys-828
and ends at either Leu-1382 or Tyr-1386 or both. It contains the binding sites for β-
Spectrin and the intermediate filament proteins vimentin and desmin. Spectrin is
anchored on the cell membrane using a functional 55 kDa domain formed from the
remaining 495 th−499 th C-terminal amino acids. It participates in the widely selective
processing of mRNA and modulates the interaction of ankyrin with Sp and band 3. This
domain can affect the hydrodynamic properties of ankyrin and is extremely sensitive to
proteases, suggesting that it may be more loosely assembled and its last 20 kDa segment
possibly extends from the ankyrin molecule like a tail.
The binding protein, ankyrin, creates a second linkage by linking of spectrin to the
erythrocyte anion exchanger, band 3 through high affinity (Bruce et al., 2003).
Recently, two erythrocyte membrane multiprotein complexes namely band 3 complex,
positioned close to the center of the spectrin tetramer, and protein 4.1 located at the
membrane skeletal junctions have been described elaborately (Salomao et al., 2008).
1.18.1.3 Protein 4.1
Protein 4.1 accounts for about 6% of the total membrane proteins and can be separated
by PAGE into two isoforms (4.1a and 4.1b) with molecular weights of 80 kDa and 78
kDa, respectively. Protein 4.1 gene is located on chromosome 1 adjacent to Rh protein
locus, and usually encounters alternative mRNA processing that shows cell
differentiation and tissue-specific nature. Protein 4.1 possesses two important functions

Page 65
which include interaction of its 10 kDa Spectrin-binding domain with the N-terminal of
β-Sp which promotes the binding of spectrin with actin and binding of its N-terminal
domain with GPC. These negatively charged lipids which are present on the inner hemi-
leaflets of lipid bilayer allow the distal ends of spectrin tetramer to bind to erythrocyte
membrane.
1.18.1.4 Actin
Actin is one of the important proteins which is required for muscular contraction and
motion of the cell. Each erythrocyte consists of appropriately 40~50 x104 actin
monomers, arranged into short protofilaments of F-actin composing of 12–14
monomers within erythrocyte membrane, 30–40 nm in length. β-actin participates in the
formation of junctional complex (JC). Protein 4.2 is present in almost same number of
copies as Spectrin or ankyrin. It is associated with the cytoplasmic domain of band 3,
ankyrin, and protein 4.1, but its function is unknown. A complete deficiency of protein
4.2 may cause spheroovalocytosis and hemolytic anemia, suggesting that it plays a
certain role in the maintenance of erythrocyte membrane integrity.
1.18.1.5 Band 3
Band 3 is the major trans-membrane protein of erythrocytes, comprising of about 25%
of the total membrane proteins. Each erythrocyte contains 106 copies of band 3
protomer with a molecular weight of 95 kDa. Various forms of band 3 exist in
erythrocyte membrane including homodimer, tetramer or oligomer; and its
polymorphism appears approximately in 6% of population. This is a multifunctional
protein consisting of 3 domains, a membrane-spanning domain that carries out
chloride/bicarbonate exchange, a short C-terminal cytoplasmic domain, and a large N-
terminal cytoplasmic domain (Tanner, 1997). The C-terminal cytoplasmic domain of
band 3 binds carbonic anhydrase II (CAII), forming a metabolon that channels HCO-3 at
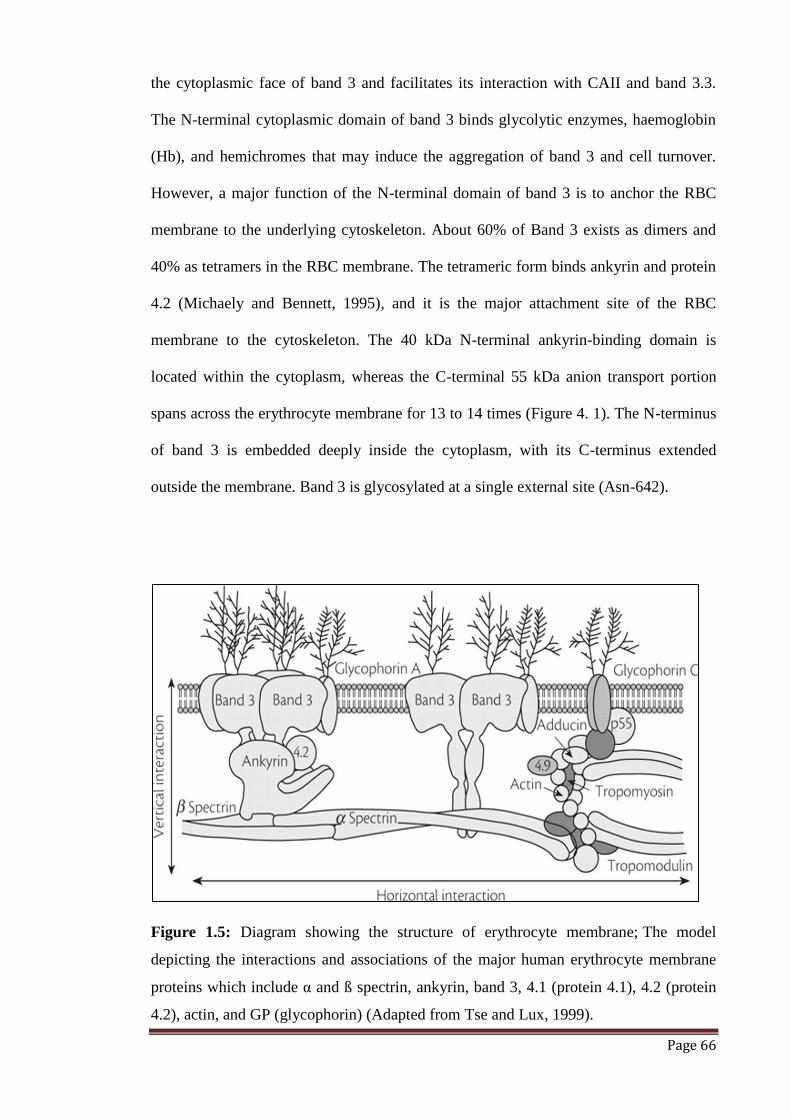
Page 66
the cytoplasmic face of band 3 and facilitates its interaction with CAII and band 3.3.
The N-terminal cytoplasmic domain of band 3 binds glycolytic enzymes, haemoglobin
(Hb), and hemichromes that may induce the aggregation of band 3 and cell turnover.
However, a major function of the N-terminal domain of band 3 is to anchor the RBC
membrane to the underlying cytoskeleton. About 60% of Band 3 exists as dimers and
40% as tetramers in the RBC membrane. The tetrameric form binds ankyrin and protein
4.2 (Michaely and Bennett, 1995), and it is the major attachment site of the RBC
membrane to the cytoskeleton. The 40 kDa N-terminal ankyrin-binding domain is
located within the cytoplasm, whereas the C-terminal 55 kDa anion transport portion
spans across the erythrocyte membrane for 13 to 14 times (Figure 4. 1). The N-terminus
of band 3 is embedded deeply inside the cytoplasm, with its C-terminus extended
outside the membrane. Band 3 is glycosylated at a single external site (Asn-642).
Figure 1.5: Diagram showing the structure of erythrocyte membrane; The model
depicting the interactions and associations of the major human erythrocyte membrane
proteins which include α and ß spectrin, ankyrin, band 3, 4.1 (protein 4.1), 4.2 (protein
4.2), actin, and GP (glycophorin) (Adapted from Tse and Lux, 1999).
Page 67
1.18.1.6 Glycophorin
Glycophorin (GP) molecules consist of about 60% saccharides. The N-terminus of its
polypeptide chain extends beyond the erythrocyte membrane. The majority of 16
scattered oligosaccharides hold trioses and tetroses on their side chains, with sialic acid
as end sugar residues. Erythrocyte membrane of healthy subjects display 4-5 GP bands
after electrophoretic separation using periodic acid-Schiff (PAS) staining Human GPs
belong to transmembrane sialoglycoprotein families, including GPs A, B, C, D (α, δ, β,
γ GPs), and GP E. GPs A, B, and E carry the MNSs blood group antigens: while GPs C
and D carry the Gerbich (Ge) blood group antigens. The structures of all five GPs and
their encoding genes are clearly explained, with molecular weights ranging in between
17–36 kDa. High degree of homology is found in the amino acid sequences of primary
structures among GPs A, B, and E. The α, δ and ε genes encoding GPs A, B, and E are
located on q31-34 of chromosome 4. They relate to the autosomes of codominant
heredity, which are organized in clusters, with spanning sequence of approximate 330
kb in order of 5p−GP A−GP B−GP E−3p. Previous research studies provided
information that about 25 variants were detected in GP families, most of them which
originated as a result of unequal homologous recombination or micro-conversion
between α GP genes and δ GP genes. Five types of GP variants were also identified in
Southern China (Lu and Liu, 1999).
1.19 Osmotic fragility
Osmotic fragility of Red blood corpuscles (RBCs) can be defined as the rate at which
the cells burst in hypotonic solutions. Several factors including disease, age, and drugs
can alter the fragility of red blood cell membrane which plays a major role in the
survival and function of the RBCs. Cell membranes are semi- permeable barriers and
there are certain established osmotic gradients between intracellular and extracellular

Page 68
fluids which allow water to flow in and out of these membranes. The concentration of
non-diffused ions on either side of the cell membrane determines the amount of osmotic
pressure.
Prolonged exposure of RBC membrane to elevated concentrations of oxygen and iron in
haemoglobin (Hb), and its high polyunsaturated fatty acid contents are some of the
factors which make RBCs a very sensitive model to study injury caused by oxidative
stress (Kusmic et al., 2000). Elevated levels of glucose (hyperglycaemia) in blood is
known to cause damage to cell membrane and cell death in various cells including
cultured pericytes, endothelial cells, kidney cells, retinal cells and RBC‘s (Li et al.,
1984).
Anaemia is a highly prevalent condition in T2DM patients. According to World Health
Organisation (WHO), nearly 30% of T2DM patients have anaemia, especially those
having kidney problems (Almoznino-Sarafian et al., 2010). People with T2DM have
anaemia with a complex and multifactorial etiopathogenesis and is associated with an
increased risk of cardiovascular mortality (Zoppini et al., 2010). Recent epidemiological
studies predominantly performed on Asian and African populations reported that
patients with T2DM are characterised by increased erythrocyte osmotic fragility
(Ramana Devi et al., 1997; Ibanga et al., 2005; Osuntokl et al., 2007; Kung et al.,
2009).
1.20 Advanced Glycation End-products (AGEs)
T2DM is greatly associated with an increased risk of CVD which cannot be explained
by known risk factors. Diabetes is regarded as a CHD risk equivalent by the adult
Treatment Panel III. Some of the factors involved in determining atherosclerotic disease
are formation of advanced glycation end-products (AGEs). There is increasing evidence
that AGEs play a major role in atherosclerosis in diabetics. Accumulation of AGEs is

Page 69
considered as a measure of hyperglycaemia and also represents the increasing metabolic
burden, oxidative stress and inflammation (Baynes and Thorpe, 2000). Inflammatory
reactions and endothelial dysfunction occur as a result of interactions between AGEs
and AGE-specific receptors (Ahmed, 2005). AGEs cause damage through the formation
of unusual cross-links in collagen which might contribute to vascular stiffening
(Vlassara and Palace, 2002). Recent studies have reported that there is an increased
serum level of AGEs in T2DM patients with Coronary Heart Disease (CHD). It has also
been shown that AGEs tend to accumulate in coronary atherosclerotic plaques and
cardiac tissue of T2DM patients in several immune-histochemical studies (Nakamura et
al., 1993, Grillo and Colombatto, 2008).
1.20.1 Formation of AGEs
Glucose reacts non-enzymatically and chemically with proteins in vivo, to form
covalently attached glucose-addition products and cross-links between proteins.
Advanced glycation end-products are a class of complex products formed as a result of
Maillard‘s reaction which occurs between carbohydrates and free amino group of
proteins. Intermediate products during this reaction are a result of dehydration,
molecular rearrangement which leads to carboxyl residue as 3-deoxyglucosone which
in turn reacts with free amino groups and form cross linked proteins. Maillard‘s reaction
is a succession of chemical reactions linked in a complicated network. The first step
results in the formation of a Schiff base after a condensation reaction between amino
group and a carboxyl group. The second step includes a molecular rearrangement that
results in the formation of N-substituted glycosylamine which leads to Amadori‘s
products. Finally, Amadori‘s products undergo further rearrangements to form AGEs
(Ahmed, 2005; Diamanti et al., 2007; DSouza et al., 2009).

Page 70
AGEs are very unstable, reactive compounds and their end products are often
complicated to be completely analysed. Pentosidine and carboxymethylysine (CML) are
the best chemically characterised AGEs in humans. Excessive accumulation of these
products is believed to contribute to chronic complications of DM. Chemical
modification of proteins by reducing sugars in diabetes alters the structure and function
of tissue proteins leading to further diabetic complications (Monnier, 1990). Glycation
involves formation of chemically reversible early glycosylation products with proteins
namely Schiff bases and Amadori‘s products. These products undergo slow and
complex rearrangements and form AGEs.
The significance of oxidizing conditions and reactive oxygen species involved in the
formation of glycoxidation products which are a major class of AGEs that accumulate
in diabetic tissues was studies by Baynes and colleagues (Baynes and Thorpe, 2000).
Some of the other pathways which lead to the formation of AGEs are autoxidation of
glucose by reactive oxygen species and through carbonyl compounds (Kilhovd et al.,
2003). Predominantly, methylglyoxal which is a reactive dicarbonyl metabolite of
glucose has received substantial consideration as the most reactive AGE precursor in
endothelial cells (Ahmed, 2010). Curcumin diminishes the impact of hyperglycemia.
This is affected through abrogating GLUT2 gene expression. It also induces expression
of PPARγ to reduce oxidative stress (Lin and Chen, 2011). Curcumin also eliminates
oxidised LDL by suppressing Lectin like oxidised LDL receptor-1 (LOX-1) (Kang and
Chen, 2009).
1.20.2 AGEs in Diabetes
Some of the most common features of diabetic microvascular complications are
capillary basement membrane thickening and hypertrophy of extracellular matrix. High
plasma levels of glucose lead to an accumulation of AGEs in tissues which further

Page 71
cause tissue damage and moreover, several studies showed a significant correlation
between AGE deposits and diabetic complications (Hammes et al., 1999, Kaji et al.,
2006; Meerwaldt et al., 2008).
A state of exaggerated oxidative stress in diabetic patients is because of excessive
production of free radicals including free oxygen species, increased oxidation of
substrates and auto-oxidation of glucose. In several animal studies, it has been
demonstrated that excess production of free radicals via a decrease in production of
nitric oxide (NO) leads to endothelial dysfunction which further restricts vaso-
relaxation of smooth muscle cells (Testafamarian, 1994).
1.20.3 AGE’s in cardiovascular disease
There is an increased risk of cardiovascular morbidity and mortality in patients with
T2DM. AGEs play a significant role in the development and progression of CVD in
diabetic patients (Jakus and Rietbrock, 2003). Serum level of AGEs are higher in
diabetic patients with CHD when compared with those without CHD (Kiuchi et al.,
2001). Serum AGE levels are found to be significantly associated with CHD even after
other CVD risk factors have been adjusted and several studies have demonstrated
deposits of AGEs in atherosclerotic plaques and also in myocardium fibres (Sakata et
al., 1995; Schalkwijk et al., 2004).
AGEs also increase the level of NF-Kappa B, a transcription factor which is considered
to be involved in the development of atherosclerosis and also in apoptosis (Bierhaus et
al., 1997). AGEs promote atherogenesis by oxidizing low density lipoproteins and
cause changes in the intimal collagen. Some studies have led to isolation of a receptor
for AGEs on cell surface which is termed as RAGE. This functions as a signal
transduction receptor and in binding non-AGE-related pro-inflammatory molecules
such as S100/calgranulins and amphoterins. Elevated levels of AGEs and CML have

Page 72
been reported in T2DM patients with CHD (Kilhovd et al., 1999). Analyses of human
atherosclerotic lesions have demonstrated extracellular as well as intracellular
deposition of AGEs in macrophages and vascular smooth muscle cells (Nakamura et al.,
1993; Vlassara et al., 1996). Concentration of AGEs in tissues is associated with the
severity of atherosclerotic lesions and accumulation of plasma proteins, lipids and
lipoproteins in the vessel wall (Sims et al., 1996). AGEs can highly affect the integrity
and function of blood vessel wall through various mechanisms. The first method to
promote atherogenesis includes formation of AGE cross bridges within the vessel wall
macromolecules causing mechanical dysfunction and the second is adherence of
circulating blood cells to the vessel wall due to excessive accumulation of AGEs (Sell
and Monnier, 1989).
The final mechanism is through alterations of cellular function of various cells
including macrophages, endothelial cells, smooth muscle cells, renal and neuronal cells
by binding to a variety of receptors (Hori et al., 1995; Miyata et al., 1996;Yan et al.,
1996). Formation of AGEs alters functional properties of several important matrix
molecules. Collagen within the blood vessel has a comparatively long biological half-
life and undergoes non-enzymatic glycation to play a significant role in atherosclerosis
(Brownlee et al., 1986). AGEs also entrap soluble plasma proteins like LDL and
immunoglobulin (IgG) and form covalent cross links (Meng et al., 1998). Furthermore,
the mechanism through which AGEs could lead to the development of CVD is unclear.
Some of these mechanisms including endothelial and renal dysfunction, low-grade
inflammation and arterial stiffness could contribute to the progression of CVD in T2DM
patients (Suliman et al., 2003; Goldin et al., 2006; Semba et al., 2009).
Page 73
1.21 Total Antioxidant Status
In recent years, several studies have investigated the possible role of reactive oxygen
species (ROS) in the pathogenesis of T2DM (Galli et al., 2005). In disease mechanisms,
where increased oxidative stress might play a major role, ROS are considered to be
actively involved in a large variety of physiological and patho-physiological processes.
Oxidative stress can be defined as excessive formation of highly reactive molecules
(free radicals) including ROS and reactive nitrogen species. Oxidation reactions
produce free radicals which start chains of reactions that damage cells (DSouza et a.l,
2009; Ahmed, 2010).
Antioxidants serve as reducing agents by terminating these chain reactions through
removal of free radical intermediates and inhibition of other oxidation reactions (Sies,
1997). There are several other potential sources of free radical production in diabetes
which include autooxidation of glucose, activation of leukocytes and increased
bioavailability of transition metal which could perturb the natural antioxidant defence in
the body (Wolff et al., 1991). These highly reactive molecules quench nitric oxide
(NO), which is the main endothelial vasodilatation factor and impairs NO-mediated
vasodilation by reducing its bioavailability (Honing et al., 1998). Serum of diabetic
patients is found to contain increased levels of lipid peroxides produced due to oxidative
damage caused to lipids and proteins which shows an association with the development
of diabetic complications (Nishigaki et al., 1981; Jones et al., 1988; Stringer et al.,
1989). Research has exposed that free radicals have an important role to play in
aetiology of T2DM and a strong association exists between oxidative stress and
secondary complications of diabetes (Singal et al., 2001; Rolo and Palmeira, 2006).
Patients with T2DM have chronic oxidative stress (Ghiselli et al., 1995). It has been
demonstrated that increased levels of intracellular ROS play a significant role in chronic

Page 74
inflammatory responses to atherosclerosis (Berliner et al., 1995; Kojda & Harrison,
1999; Chisolm & Steinberg, 2000). In T2DM patients, LDL oxidation contributes to
LDL accumulation and therefore leads to an accelerated development of atherosclerosis
(Panasenko et al., 1991). Recently, much attention has been given to the possibility that
T2DM patients might be subjected to severe oxidative stresses. Oxidative modification
of LDL particles is presently recognized as a vital step in the atherogenic process
(Steinberg et al., 1989).
Higher levels of oxidative stress in T2DM patients might be a result of prolonged
periods of hyperglycaemia which cause non-enzymatic glycation of plasma proteins
including LDL (Tames et al., 1992). Persistent hyperglycaemia increases the production
of ROS within the aortic endothelial cells. Some of the recognized biochemical
mechanisms of hyperglycaemia induced cell and tissue damage are ROS-induced
activation of protein kinase-C isoforms, increased formation of glucose–derived AGEs,
increased glucose flux via aldose reductase pathways and activation of cytokines
(Brownlee, 1995). Reaction of ROS on cell membranes leads to the formation of lipid
peroxidation products such as malondialdehyde (MDA).
Patients with T2DM suffer from an increased risk of vascular disease when compared
with those without T2DM (Deckert et al., 1978). Vascular complications take the form
of premature and accelerated atherosclerosis of large arteries or cause increased
permeability of capillaries which is associated with thickening of the basement
membrane. Increased prevalence of dyslipidemia and hypertension are the most
important predisposing factors for the development of vascular disease in diabetes
(Bierman, 1992).
Several low molecular weight antioxidant molecules such as vitamin C, vitamin E,
urate, thiols and bilirubin act as primary defence against oxidative stress in extracellular

Page 75
fluids (Frei et al., 1988). A wide range of natural antioxidants including superoxide
dismutase, glutathione-glutathione peroxidase system are present to scavenge free
radicals in order to prevent oxidative damage. Superoxide dismutase becomes inactive
due to prolonged hyperglycaemia in diabetic patients (Arai et al., 1987).
Antioxidant therapy may be useful to relieve symptoms and complications in T2DM
patients. Many traditional medicinal plants are found to possess substantial amount of
anti-oxidant properties that were effective against diabetes and its related complications
(Bailey and Day, 1989). Correspondingly, it has been proven that anti-oxidants
including vitamin C and E improve endothelium-dependent vasodilation in DM
(Keegan et al., 1995; Ting et al., 1996; Timimi et al., 1998).
1.22 Working hypothesis
Endogenous inflammatory markers and mediators can predict the risk for cardiovascular
diseases in T2DM patients.
1.22.1 Main Aim
The main aim of this study was to investigate the relationship between endogenous
inflammatory markers and mediators and the risk of CVD in T2DM patients.
1.22.2 Objectives
The objectives of this study are the following
To carry out an epidemiological study of some risk factors among T2DM
patients.
To measure intracellular free calcium concentrations in lymphocytes and
neutrophils of T2DM patients compared to healthy age-matched controls.

Page 76
To measure cations, inflammatory markers and mediators in blood of T2DM
compared to healthy age-matched controls.
To investigate the osmotic fragility and different membrane proteins in RBC of
T2DM patients compared to healthy age-matched control.
To measure low molecular weight advanced glycation end products, anti-oxidant
status in the blood of T2DM patients compared to healthy age-matched controls.

Page 77
Chapter 2
Materials and Methods
Page 78
2.1 Subjects and samples
2.1.1 Recruitment of subjects
This project recruited both male and female T2DM patients and healthy age-matched
control subjects from Royal Preston Hospital, Chorley General Hospital, and Christina
Infant hospital in Badajoz, Spain, University of Central Lancashire. Type 2 diabetic
patients who attended the Diabetic Clinics at Royal Preston Hospital, Chorley General
Hospital were recruited for this study. The project had relevant ethical clearance from
LREC (LTHTR Ethics Committee), UCLan Ethics Committee and the University of
Extremadura in Spain.
Since each chapter of this thesis comprised of different cohort of patients, the
recruitment process including venipuncture techniques, handling of the samples, and
patient follow up were discussed individually in each chapter.
2.2 Blood collection
Samples of blood were collected by venipuncture technique from both T2DM patients
and healthy controls following consent. The patients were also given a questionnaire to
fill in which contained several questions regarding their lifestyle habits and medical
history for epidemiological study.
2.3 Sample handling and storage
The collection, handling and storage of blood samples were considered a vital
component in order to minimise any inter-sample differences. The results obtained from
these studies were definitely a reflection of the care taken during these procedures.
Therefore, blood samples were only collected from patients who were diagnosed with
T2DM and healthy age-matched controls.
Page 79
2.3.1 Blood handling and preservation
Universal precautions were followed while handling the blood samples. Plasma and
serum tubes were labelled properly with an ID number and collection date. The samples
were centrifuged depending on the requirements followed by storage at appropriate
temperatures.
2.3.2 Blood storage
The blood (5 ml) was collected by the candidate in EDTA tubes, centrifuged at 3500
rpm for 10 minutes to separate the red blood cells from the plasma, buffy coat and was
stored at -80 ºC for later analysis. The candidate has obtained relevant training at Royal
Preston Hospital, Preston to collect blood from patients and age matched control
subjects by venipuncture technique.
2.4 Comparison and analysis of various biochemical parameters and
inflammatory mediators in plasma of T2DM and healthy controls
2.4.1 Measurement of various cations in plasma
Measurement of various cations including sodium, potassium, calcium, magnesium,
zinc, copper, iron and selenium was performed using inductively coupled plasma mass
spectrometry, (ICP-MS) technique with plasma of both T2DM and healthy controls.
Blood was collected in an EDTA tube by venipuncture technique and it was centrifuged
at 3500 rpm for 10 min to separate plasma from the red blood cells. A volume of 0.2 ml
of plasma was diluted with 9.8 ml deionised water to make 10 ml solution in each tube.
A volume of 4 ml of nitric acid was added to 1 ml of the above solution in each tube
and 10 µl of internal standard was added to each tube. The HNO3 was used to denature
any proteins in the plasma in order to facilitate the measurement of the ions. Cations
were measured using ICP-MS according to standard protocol of the instrument. Values

Page 80
were expressed as parts per billion which were subsequently converted into mM/L
values.
2.4.2 Measurement of various biochemical parameters
Various biochemical parameters in blood including glucose, insulin, full blood count,
cholesterol, serum lipid profile, HbA1c, U and E, and C - reactive protein were
measured according to standard protocols in both T2DM and healthy controls using Pre-
modular analytics by Roche/Hitachi in the Biochemistry Laboratory, at the Pathology
Department at Royal Preston Hospital.
2.4.3 Measurement of inflammatory mediators
Inflammatory mediators were measured using microarray kits. Quantitative
measurement of 10 human cytokines in the serum samples was done using Quantibody®
Human Inflammation Array 1 from Ray Biotech, Inc., USA. The cytokines including
IL-1α, IL-1β, IL-4, IL-6, IL-8, Il-10, IL-13, MCP-1, IFNγ, and TNFα were detected by
fluorescence measurement of samples using laser scanner with Cy3 equivalent dye.
2.4.3.1 Experimental procedure
The glass chip was removed from the box and air dried by leaving at room temperature
for 20-30 min inside the sealed plastic bag. Thereafter, the slide was removed from the
plastic bag, the cover film was peeled off and air dried again for 1-2 hours at room
temperature as incomplete air drying of the slide would result in the formation of comet
tails.
2.4.3.2 Preparation of standard dilutions of cytokines
The cytokine standard mix was provided in lyophilized form and then was reconstituted
by adding 500 µl of sample diluents to the tube. The powder was dissolved thoroughly
by mixing gently and labelled as standard 1. This was done within one hour of usage. A

Page 81
total of 6 clean microcentrifuge tubes were labelled as Std 2 to Std 7 and 200 µl of
sample diluent was added to each tube. A volume of 100 µl of Std 1 was pipetted into
Std 2 tube and mixed gently. A serial dilution was performed by carrying on to Standard
3 up to Standard 7. A volume of 100 µl of sample diluent was added to another tube
labelled as control. This tube was used as negative control. Either standard cytokines or
sample was not added to this tube.
2.4.3.3 Blocking and incubation
A volume of 100 µl of sample diluent was added into each well and incubated at room
temperature for 30 min to block slides. The buffer was decanted from each well and 100
µl of standard of each cytokine and samples were added to each well. The array was
incubated at room temperature for 2 hours. This step was performed overnight at 4 ºC
for best results.
2.4.3.4 Wash
The samples were decanted from each well and washed 5 times per min for 5 min each
time with 150 µl of 1 x wash buffer I at room temperature with gentle shaking. The
wash buffer was completely removed in each wash step. 20 x wash buffer 1 was diluted
with distilled water. The glass chip with frame was placed in a box with 1x wash buffer
and washed at room temperature with gentle shaking for 20 min. The 1 x wash buffer
was decanted from each well and washed with 150 µl of wash buffer II for minimum
time of 5 min each at room temperature with gentle shaking. The wash buffer was
completely removed in each wash step. 20 x wash buffer II was diluted with distilled
water.
2.4.3.5 Incubation with detection antibody and washing
The detection antibody was reconstituted by adding 1.4 ml of sample diluent to the tube
and spinned briefly. A volume of 80 µl of detection antibody cocktail was added to each

Page 82
well and incubated at room temperature. The samples were decanted from each well and
washed 5 times with 150 µl of 1 x wash buffer I and then 2 times with 150 µl of 1 x
wash buffer II at room temperature with gentle shaking. The wash buffer was
completely removed in each wash step.
2.4.3.6 Incubation with Cytochrome 3 (Cy3) equivalent dye- Streptavidin and wash
A volume of 1.4 ml of sample diluent was added to Cy3 equivalent dye-conjugated
streptavidin tube after briefly spinning down and mixed gently. An aliquot or a volume
of 80 µl of Cy3 equivalent dye- conjugated streptavidin was added to each well. The
device was covered with aluminium foil to avoid exposure to light and incubated in a
dark room at room temperature for one hour. The samples were decanted from each
well and washed 5 times with 150 µl of 1x wash buffer I at room temperature with
gentle shaking. The wash buffer was removed completely in each wash step.
2.4.3.7 Detection of fluorescence
The device was disassembled by pushing the clips outward from the side of the slide
and the slide was carefully removed from the gasket. The slide was placed in a slide
washer and enough amount of 1 x wash buffer was added to cover the whole slide and
gently shaken at room temperature for 15 min. The wash buffer I was decanted and
washed with about 30 ml of 1 x wash buffer II by gently shaking at room temperature
for 5 min. The water droplets were completely removed by placing the slide in a washer
and drying the glass chip by centrifugation at 1000 rpm for 3 min without cap.
2.4.3.8 Imaging
The imaging of the signals was visualised using a laser scanner equipped with a Cy3
wavelength Axon GenePix. Data extraction was done using microarray analysis
software GenePix and quantitative analysis was done using Quantibody®
Q-Analyser
software.
Page 83
2.5 Analysis of Red blood cell (RBC) membrane proteins using SDS-
PAGE
In this series of experiments, the analysis of human RBC membrane proteins was done
using sodium dodecyl sulphate polyacrylamide gel electrophoresis (SDS-PAGE).
Membrane proteins including spectrin, ankyrin, band 3, band 4.1 and glycophorin were
analysed and compared between T2DM patients and healthy controls. Isolation of
membrane proteins from human RBC was performed using a kit method from
Fermentas, UK and native extraction method.
2.5.1 Extraction of RBC membrane proteins by native method
2.5.1.1 Purification of RBC from whole blood
Fresh whole blood was obtained using EDTA tubes and stored at 4 °C. RBC were
purified within 48 hours of withdrawal from the human donors. Human RBC were
initially isolated by centrifugation at 600 x g for 20 min at 4 °C. After the careful
removal of plasma and buffy coat layers by careful suction, the RBC pellet was
resuspended in cold isotonic buffer (145 mM NaCl, 5 mM KCl, and 5 mM Hepes, (pH
7.4) by trituration and then recentrifuged at 2000 x g for 10 min at 4 °C. The RBC were
washed with the isotonic buffer four times to completely remove the plasma and buffy
layers. To remove white blood cells from the RBC suspensions, the samples were
passed through the white blood cell filters (Plasmodipur, Euro-diagnostica B. V.) a total
of two times.
At each step in the purification process, the upper RBC layer was removed. The final
preparation of washed RBC was resuspended in cold isotonic buffer at pH 7.4 to an
approximate hematocrit 50% and stored at 4 °C. All RBC samples were stored at 4 °C
and used for analysis within 24 h of purification.

Page 84
2.5.1.2 Purification of human RBC open ghosts
A volume of 1 ml of packed RBC was lysed by trituration and stirring on ice for 10 min
in 100 ml of hypotonic lysing solution containing 15 mM KCl, 0.01 mM EDTA, 1 mM
EGTA, and 5 mM Hepes solution, pH 6.0 at 4 °C to reduce premature, spontaneous
resealing of the erythrocyte ghosts. The membranes were then centrifuged at 12,000 x g
for 10 min at 4 °C. After discarding the supernatant, the membranes were then washed
in 100 ml of hypotonic lysing solution without EGTA by trituration and recentrifuged at
12,000 x g for 10 min at 4 °C. Once again, after discarding the supernatant, the
membranes were washed in 100 ml of EGTA –free hypotonic lysing solution containing
2 mM Mg2+
by trituration and re-centrifuged at 12,000 x g for 10 min at 4 °C. After
removing the supernatant a final time, the erythrocyte ghost membranes were
concentrated in 4 ml of the EGTA-free lysing solution containing 2 mM Mg2+
by
centrifugation at 12,000 Х g for 10 min at 4°C. This method has been shown to dilute
most cytosolic components of RBC by 4 million fold.
2.5.1.3 RBC plasma membrane washes
Purified RBC open ghost membranes (300 µl) were suspended in 10 mM NaOH (30 ml)
at 4 °C. The membrane suspensions were then placed on a nutator and were rotated at
medium speed at 4 °C for 30 min. Washed membrane samples were then pelleted at
12,000 x g for 10 min and resuspended in fresh 10 mM NaOH (1 ml) at 4 °C. The
washed membranes were then immediately subjected to proteolytic digestion with
Proteinase K.
2.5.1.4 Proteolytic digestion of RBC plasma membrane
On purifying erythrocyte plasma membranes from human ghosts and washing the
membrane samples with NaOH, the RBC ghost membranes were shaved by using
Proteinase K, a serine protease with broad cleavage specificity. In this study, Proteinase

Page 85
K was active over the pH range 7.5-12.0 but was most often used in the pH range 7.5-
9.0. The activity of the enzyme was at a maximum at 37 ºC, but the activity was >80%
of its maximum between 20 ºC and 60 ºC. Washed RBC ghost membranes were pelleted
in a microcentrifuge at 12,000 x g at room temperature for 10 min. The supernatant was
then removed and discarded and the pellet was resuspended in 10 mM NaOH.
Proteinase K was then added to the membrane suspension at a final concentration of 3.0
mg/ml per 100 µl of washed membranes for each shaving reaction and the samples were
left on a nutator at medium speed for varying durations of time (up to 48 h) at room
temperature. The digestions with Proteinase K were conducted at room temperature
rather than at 37 °C where protease activity is maximised to reduce the amount of
resealing of the erythrocyte open ghost membranes that occurred completely within 6
min at 37 °C.
At designated time points, PMSF, a protease inhibitor specific for Proteinase K, was
added at a final concentration of 5 mM and the samples were left on a nutator at
medium speed for 30 min to be sure that all of the Proteinase K activity was inhibited.
The membranes were then pelleted in a microcentrifuge at 12,000 x g at room
temperature for 10 min. The supernatant was then removed and discarded and the pellet
was resuspended in 10 mM NaOH once again.
This washing procedure of the fully washed and shaved RBC open ghost membranes
was repeated 2 more times for a total of four washes. In the final round, the membrane
samples were resuspended in buffer K (15 mM KCl, 5 mM Hepes, 2 mM Mg2+
, 0.01
mM EDTA, pH 8.0). To be sure that Proteinase K and PMSF were removed from the
membrane samples with the series of four wash steps, samples of the supernatants and
membrane pellets from each wash step were run on 1D SDS/PAGE gels and silver-
stained. By the fourth wash step, all the Proteinase K and PMSF were removed from the
Page 86
membrane pellet. This particular gel system was chosen because it provided a much
lower pH environment than traditional SDS/PAGE systems. The advantages of the
lower pH include sharper band resolution and higher accuracy of results.
2.5.2 Extraction of RBC membrane proteins from suspension cells
Membrane proteins from human RBC were extracted using ProteoJETTM
Membrane
Protein Extraction Kit (Fermentas Life Sciences, UK). The kit was designed for
efficient isolation of membrane proteins from mammalian cells. This kit isolated high
quality membrane and cytoplasmic protein extracts without cross-contamination
between the two fractions. Both fractions contained pure, non-denatured functional
proteins. Membrane protein fraction was used directly in SDS-PAGE analysis. Cells
were first permeabilized with cell permeabilization buffer to release the cytoplasmic
protein fraction. The cell debris was then treated with the membrane protein extraction
buffer which selectively solubilized the majority of integral and membrane-associated
proteins and isolated them as a separate fraction. The extraction procedure was
performed on ice and ice-cooled buffers were used throughout this process. A protease
inhibitor cocktail (Fermentas Life Sciences, UK) was added to cell permeabilization and
membrane protein extraction buffers to minimize proteolysis. The detailed procedure
included the following:
2.5.2.1 Cell harvesting and permeabilization
Approximately, 5 x 10⁶ cells were pelleted by centrifugation for 5 min at 250 × g and
the supernatant was discarded. The cells were resuspended in 3 ml of ice-cold cell wash
solution, centrifugation was repeated for 5 min at 250 × g and the supernatant was
discarded. A volume of 1.5 ml of ice-cold cell wash solution was added and transferred
into a 2 ml Eppendorf tube. The cells were centrifuged for 7 min at 250 x g and the
supernatant was discarded. A volume of 1.5 ml of ice-cold cell permeabilization buffer

Page 87
was added to the solution and vortexed briefly to eliminate cell clumps. This solution
was incubated for 10 min at 4 ºC while shaking continuously in a shaking water bath in
the cold room.
2.5.2.2 Extraction of cytoplasmic proteins
The permeabilized cells were centrifuged at 16000 x g for 15 min at 4 ºC. After
centrifugation, the supernatant was carefully removed (cytoplasmic protein extract) and
was transferred into a new tube. This was stored as aliquots at -70 ºC. The cell debris
pellet which contains membrane proteins was set on ice. All the liquid, which contained
cytoplasmic proteins, was carefully removed.
2.5.2.3 Extraction of membrane proteins
A volume of 1 ml of ice-cold membrane protein extraction buffer was added to the cell
debris pellet and pipetted thoroughly. This was incubated for 30 min at 4 ºC in the
thermomixer, shaking at 1400 rpm. Clear membrane protein was extracted by
centrifugation at 16000 x g for 15 min at 4 ºC. The supernatant (membrane protein
fraction) was transferred into a new tube. This was used directly or stored as aliquots at
-70 ºC for later analysis.
2.6 Protein quantification by Bradford Assay
Membrane proteins isolated from RBC were quantified using Bradford assay (Bradford,
1976) kit produced by Fermentas, UK.
2.6.1 Bovine Serum Albumin (BSA)
BSA standard set, ready-to-use, (Fermentas, UK), contained seven pre-diluted protein
concentrations in the following standard solutions 2.0 mg/ml, 1.5 mg/ml, 1.0 mg/ml,
0.75 mg/ml, 0.50 mg/ml, 0.25 mg/ml and 0.125 mg/ml. The standard assay was
performed in glass test tubes. The different concentrations of BSA mentioned above

Page 88
were provided in 0.15 M NaCl solution containing 0.05% sodium azide as preservative.
The Bradford reagent was gently mixed by inverting the bottle a few times before it was
used, and the amount of reagent needed was aliquoted and equilibrated to room
temperature. A volume of 20 µl of either each pre-diluted standard or sample was
pipetted to be assayed into appropriately labelled test tubes. An aliquot of 1 ml of
Bradford reagent was added to each tube and mixed well. The solution was then
incubated at room temperature for 5 min and transferred into a cuvette. The
spectrophotometer was set to 595 nm. The instrument was set to zero with the blank
sample. The absorbance of either standard or the sample solution was measured. A
standard curve was created by plotting the absorbance at 595 nm vs protein
concentration of each protein standard (mg/ml). The protein concentration of unknown
samples was determined by comparing their absorbance values against the standard
curve.
2.6.2 SDS-PAGE Electrophoresis
Analysis of membrane proteins was performed using SDS-PAGE electrophoresis using
a mini protean system with 12% Ready gel- Tris HCl gel (Bio-Rad Laboratories, UK).
10 x Tris- glycine-SDS electrophoresis buffer was used as running buffer (Fermentas,
UK).
Protein sample was loaded into SDS-PAGE gels according to manufacturer‘s protocol.
Dual Color Protein Loading Buffer (Fermentas, UK) was used for the preparation of
protein samples for SDS-PAGE. Some of the proteins were sensitive to pH changes and
temperature fluctuations during electrophoresis in Tris buffers. As such, the optimised
composition of this loading buffer prevented protein degradation during sample heating
prior to SDS-PAGE and during the electrophoresis run. PageRulerTM
Plus Prestained
Protein Ladder (Fermentas, UK) was used as it was a mixture of 9 recombinant, highly
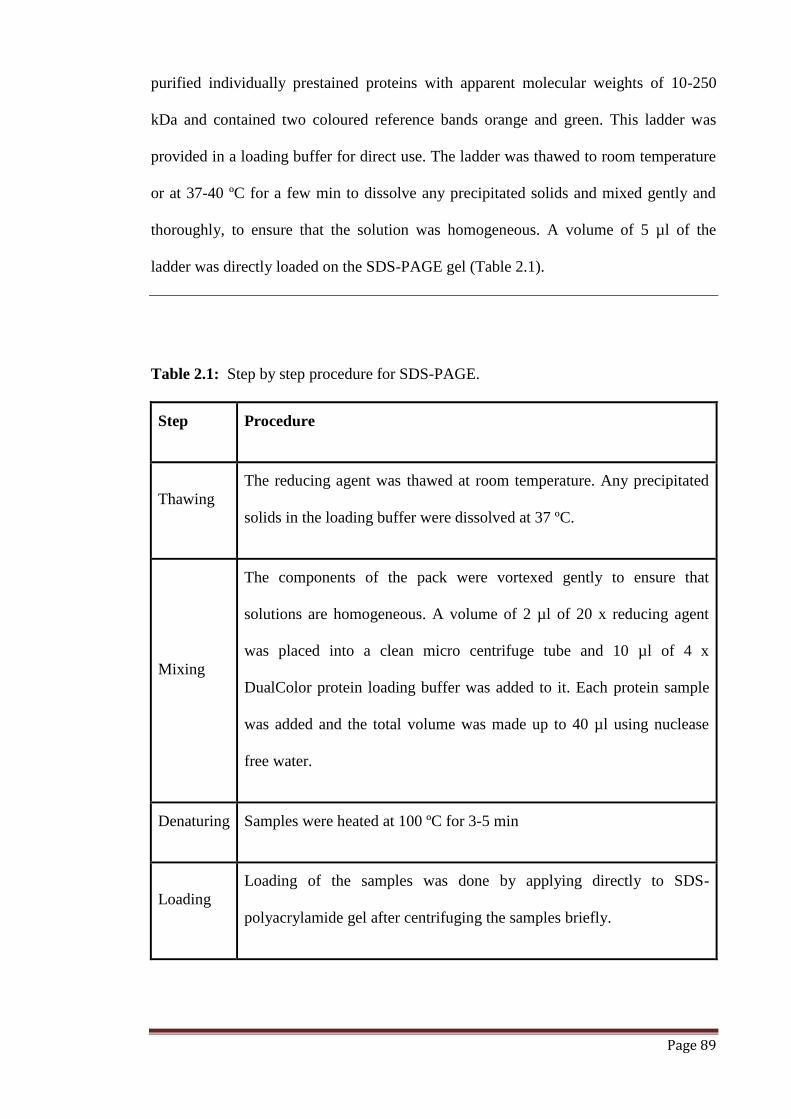
Page 89
purified individually prestained proteins with apparent molecular weights of 10-250
kDa and contained two coloured reference bands orange and green. This ladder was
provided in a loading buffer for direct use. The ladder was thawed to room temperature
or at 37-40 ºC for a few min to dissolve any precipitated solids and mixed gently and
thoroughly, to ensure that the solution was homogeneous. A volume of 5 µl of the
ladder was directly loaded on the SDS-PAGE gel (Table 2.1).
Table 2.1: Step by step procedure for SDS-PAGE.
Step Procedure
Thawing
The reducing agent was thawed at room temperature. Any precipitated
solids in the loading buffer were dissolved at 37 ºC.
Mixing
The components of the pack were vortexed gently to ensure that
solutions are homogeneous. A volume of 2 µl of 20 x reducing agent
was placed into a clean micro centrifuge tube and 10 µl of 4 x
DualColor protein loading buffer was added to it. Each protein sample
was added and the total volume was made up to 40 µl using nuclease
free water.
Denaturing Samples were heated at 100 ºC for 3-5 min
Loading
Loading of the samples was done by applying directly to SDS-
polyacrylamide gel after centrifuging the samples briefly.

Page 90
2.6.3 Silver Staining Method
PageSilverTM
staining kit from Fermentas was used to stain SDS-Page gels after the
electrophoresis. This kit facilitated rapid and sensitive staining of proteins in
polyacrylamide gels. This procedure was better than traditional Coomassie Blue
staining and allowed detection of very low abundance proteins. In this process, the
protein was bound to silver nitrate at a weakly acidic pH followed by subsequent
reduction of silver ions to metallic silver by formaldehyde at an alkaline pH. Silver
staining included the following steps:
2.6.3.1 Preparation of Fixative Solutions
Fixative solutions in volumes sufficient to stain one gel were prepared and stored in
tightly closed bottles at room temperature (Table 2.2).
Table 2.2: Preparation of gel fixing solutions for Silver Staining.
Reagent
Gel Fixing Solution 1 Gel Fixing Solution 2
Volume Final
Concentration
Volume 1 Volume 2 Final
Concentration
Ethanol 50 ml 50% (v/v) 60 ml 90 ml 30% (v/v)
Glacial acetic
acid
10 ml 10% (v/v) - - -
Water
(ultrapure)
40 ml - 140 ml 210 ml -
Total
volume
100 ml - 200 ml 300 ml -
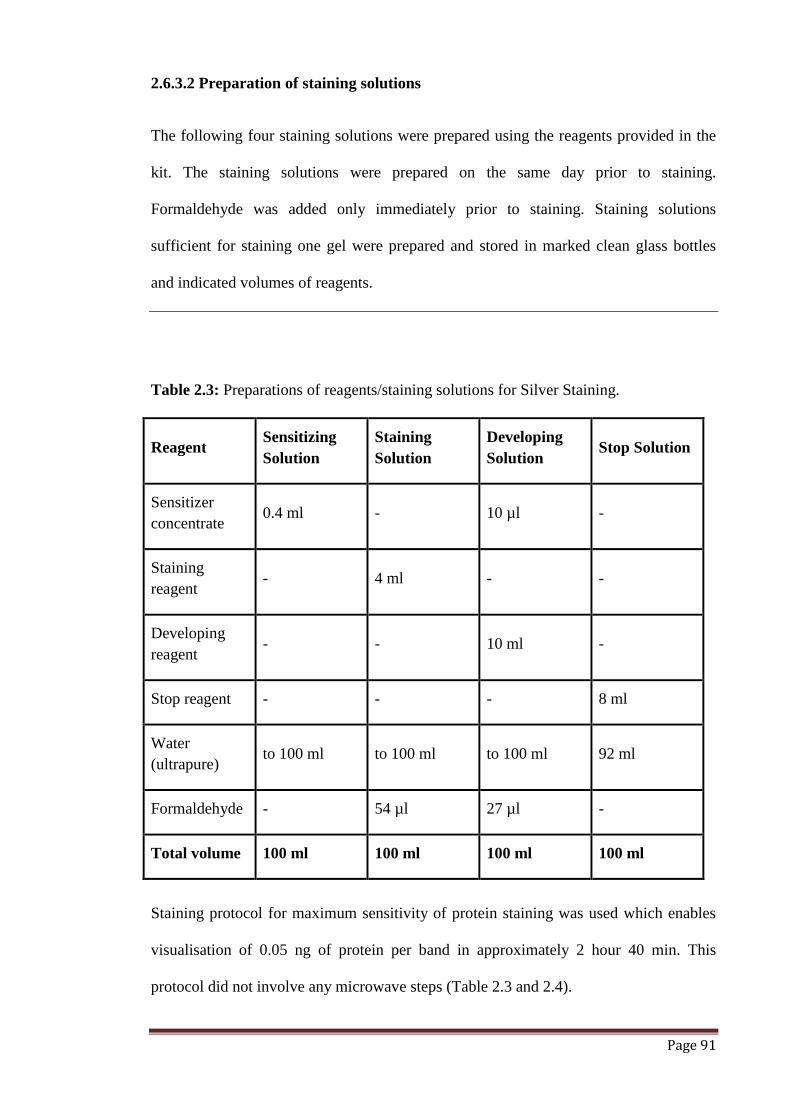
Page 91
2.6.3.2 Preparation of staining solutions
The following four staining solutions were prepared using the reagents provided in the
kit. The staining solutions were prepared on the same day prior to staining.
Formaldehyde was added only immediately prior to staining. Staining solutions
sufficient for staining one gel were prepared and stored in marked clean glass bottles
and indicated volumes of reagents.
Table 2.3: Preparations of reagents/staining solutions for Silver Staining.
Reagent Sensitizing
Solution
Staining
Solution
Developing
Solution Stop Solution
Sensitizer
concentrate 0.4 ml - 10 µl -
Staining
reagent - 4 ml - -
Developing
reagent - - 10 ml -
Stop reagent - - - 8 ml
Water
(ultrapure) to 100 ml to 100 ml to 100 ml 92 ml
Formaldehyde - 54 µl 27 µl -
Total volume 100 ml 100 ml 100 ml 100 ml
Staining protocol for maximum sensitivity of protein staining was used which enables
visualisation of 0.05 ng of protein per band in approximately 2 hour 40 min. This
protocol did not involve any microwave steps (Table 2.3 and 2.4).
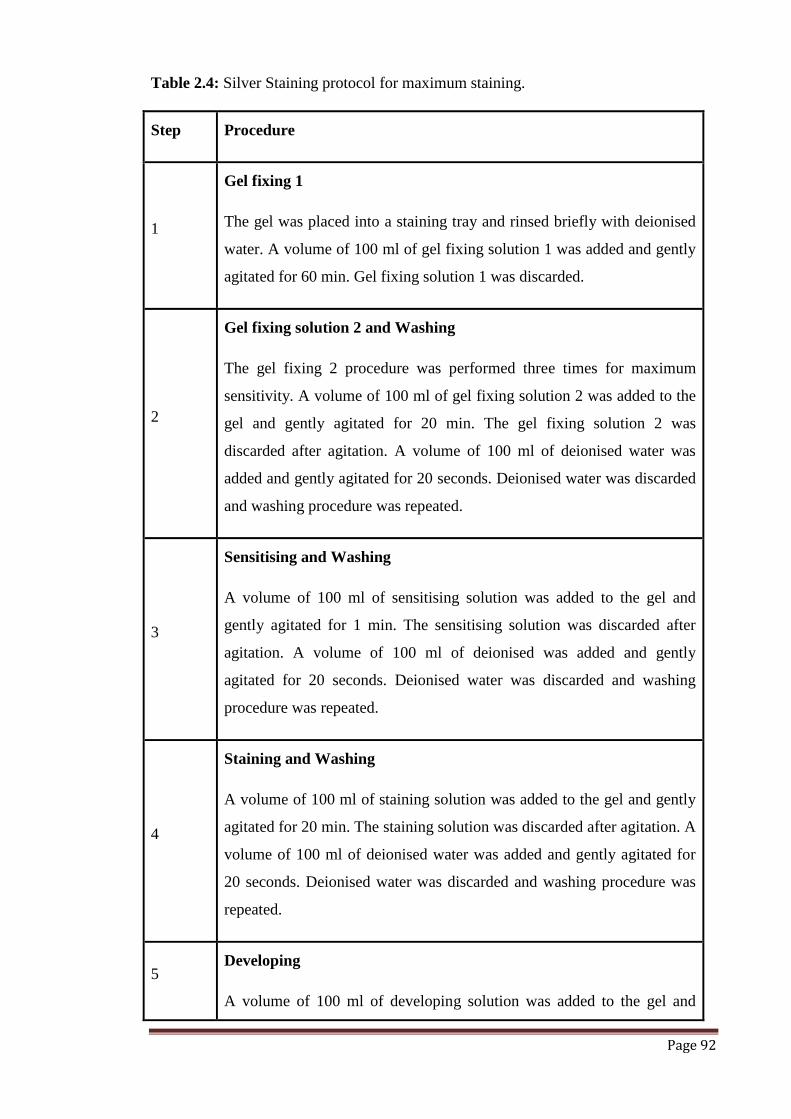
Page 92
Table 2.4: Silver Staining protocol for maximum staining.
Step Procedure
1
Gel fixing 1
The gel was placed into a staining tray and rinsed briefly with deionised
water. A volume of 100 ml of gel fixing solution 1 was added and gently
agitated for 60 min. Gel fixing solution 1 was discarded.
2
Gel fixing solution 2 and Washing
The gel fixing 2 procedure was performed three times for maximum
sensitivity. A volume of 100 ml of gel fixing solution 2 was added to the
gel and gently agitated for 20 min. The gel fixing solution 2 was
discarded after agitation. A volume of 100 ml of deionised water was
added and gently agitated for 20 seconds. Deionised water was discarded
and washing procedure was repeated.
3
Sensitising and Washing
A volume of 100 ml of sensitising solution was added to the gel and
gently agitated for 1 min. The sensitising solution was discarded after
agitation. A volume of 100 ml of deionised was added and gently
agitated for 20 seconds. Deionised water was discarded and washing
procedure was repeated.
4
Staining and Washing
A volume of 100 ml of staining solution was added to the gel and gently
agitated for 20 min. The staining solution was discarded after agitation. A
volume of 100 ml of deionised water was added and gently agitated for
20 seconds. Deionised water was discarded and washing procedure was
repeated.
5 Developing
A volume of 100 ml of developing solution was added to the gel and
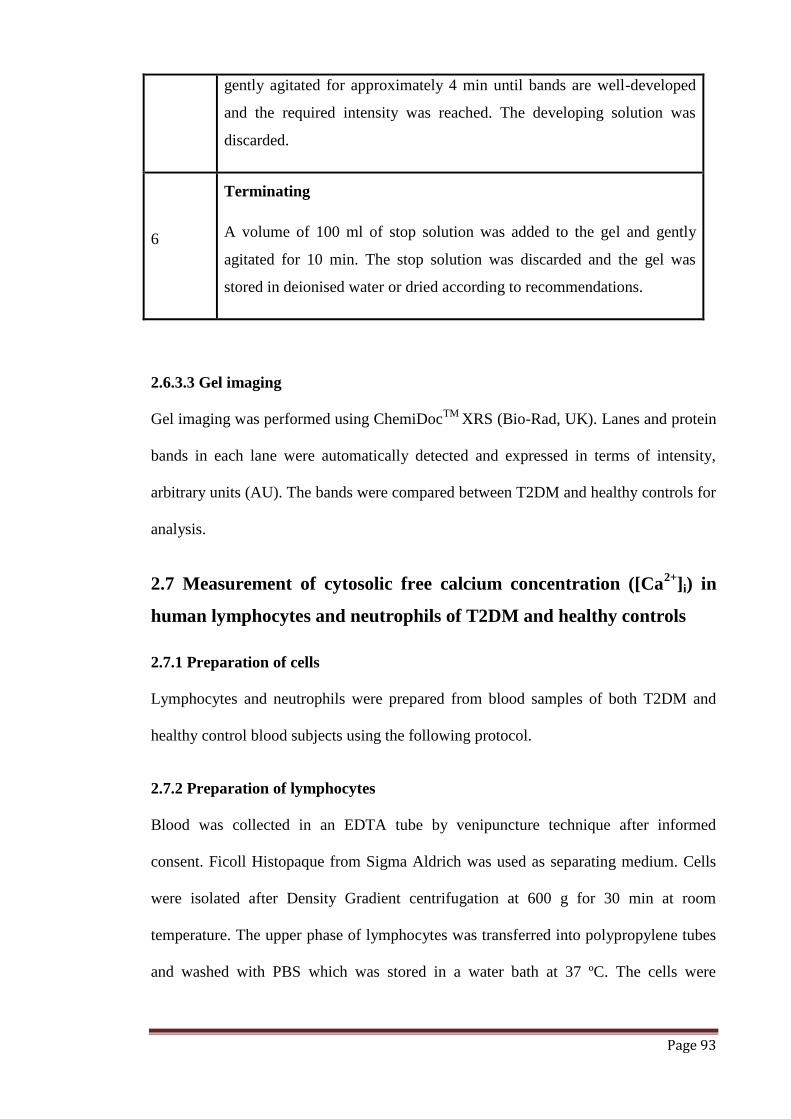
Page 93
gently agitated for approximately 4 min until bands are well-developed
and the required intensity was reached. The developing solution was
discarded.
6
Terminating
A volume of 100 ml of stop solution was added to the gel and gently
agitated for 10 min. The stop solution was discarded and the gel was
stored in deionised water or dried according to recommendations.
2.6.3.3 Gel imaging
Gel imaging was performed using ChemiDocTM
XRS (Bio-Rad, UK). Lanes and protein
bands in each lane were automatically detected and expressed in terms of intensity,
arbitrary units (AU). The bands were compared between T2DM and healthy controls for
analysis.
2.7 Measurement of cytosolic free calcium concentration ([Ca2+
]i) in
human lymphocytes and neutrophils of T2DM and healthy controls
2.7.1 Preparation of cells
Lymphocytes and neutrophils were prepared from blood samples of both T2DM and
healthy control blood subjects using the following protocol.
2.7.2 Preparation of lymphocytes
Blood was collected in an EDTA tube by venipuncture technique after informed
consent. Ficoll Histopaque from Sigma Aldrich was used as separating medium. Cells
were isolated after Density Gradient centrifugation at 600 g for 30 min at room
temperature. The upper phase of lymphocytes was transferred into polypropylene tubes
and washed with PBS which was stored in a water bath at 37 ºC. The cells were
Page 94
centrifuged at 480 x g for 10 min at room temperature. The supernatant was discarded
and each pellet was resuspended in 4 ml of RPMI (Sigma Aldrich, UK).
A volume of 16 µl of 4 µM Fura-2 AM (fura-2 acetoxymethyl ester) was added to each
tube and incubated in dark at room temperature. After incubation, the cells were
centrifuged at 480 x g for 10 min at room temperature and the supernatant was
discarded. The cells were resuspended by adding 1 ml of Na-HEPES (1 x) per cuvette
and left for 10-15 min for cleaving.
2.7.3 Preparation of neutrophils
Blood was collected in an EDTA tube by venipuncture technique after informed
consent. Ficoll Histopaque from Sigma Aldrich was used as separating medium. Cells
were isolated after Density Gradient centrifugation at 600 x g for 30 min at room
temperature. The lower interphase of neutrophils were transferred into polypropylene
tubes and washed with PBS which was stored in a water bath at 37 ºC. The cells were
centrifuged at 480 x g for 10 min at room temperature. After centrifugation, the
supernatant was discarded and 3-4 ml of cold ammonium chloride was added to each
tube and stored at 4 ºC for 5 min to lyse the red blood cells in the pellet. The tubes were
centrifuged at 480 x g for 10 min at room temperature and the supernatant was
discarded. Each pellet was resuspended in 4 ml of RPMI (Sigma Aldrich). A volume of
16 µl of 4 µM Fura-2 AM was added to each tube and incubated for 30 min in dark at
room temperature. After incubation, the cells were centrifuged at 480 x g for 10 min at
room temperature and the supernatant was discarded. The cells were resuspended by
adding 1 ml of Na-HEPES (1 x) per cuvette and left for 10-15 min for cleaving.

Page 95
2.7.4 Measurement of intracellular free calcium concentration [Ca2+
]i in
lymphocytes
Fura-2-loaded human lymphocytes from healthy and T2DM patients were stimulated
with 1 μM thapsigargin (TG) in normal calcium solution (1.2 mM [Ca2+
]0). A volume of
1 ml of suspended lymphocytes was taken in a cuvette and 10 µl thapsigargin was added
to the cells to measure the level of intracellular Ca2+
release as a result of the
thapsigargin stimulation. For calibration of the curve, a volume of 6 µl of triton was
added, left for 50 seconds and then 200 µl of 0.5 M EGTA was added. Fluorescence of
the sample was measured from the above 1 ml aliquots of magnetically stirred
lymphocyte suspensions were observed using a Shimadzu spectrofluorophotometer with
excitation at 340/380 nm and emission at 505 nm and changes in [Ca2+
]c were calculated
using the fura-2 340/380 ratio and were calibrated according to the method previously
described by Espino et al. (2009).
2.7.5 Measurement of intracellular free calcium concentration [Ca2+
]i in
neutrophils
A volume of 1 ml of suspended neutrophils was taken in a cuvette and 10 µl of fMLP
Formyl-Methionyl-Leucyl-Phenylalanine (final concentration 10 mM) was added to the
cells to measure the level of intracellular Ca2+
release induced by fMLP. For calibration,
a volume of 6 µl of triton was added, left for 50 seconds and then a volume of 200 µl of
0.5 M EGTA was added. Fluorescence of the sample was measured from the above 1 ml
aliquot of magnetically stirred neutrophil suspensions using a Shimadzu
spectrofluorophotometer with excitation at 340/380 nm and emission at 505 nm.
Changes in [Ca2+
]c were calculated using the fura-2 340/380 ratio and values were
calculated. Calcium release were estimated using the integral of the rise in [Ca2+
]c for
2.5 min after addition of thapsigargin or fMLP. Calcium release were expressed as
Page 96
nanomolar taking a sample every second (nM • s), as previously described by Espino et
al. (2009).
2.8 Measurement of low molecular weight AGEs in serum of T2DM
and healthy control samples
Low molecular weight AGEs in serum samples of T2DM and healthy controls were
measured using the following procedure:
Plasma samples were thawed to room temperature and 0.2 ml of serum sample was
diluted with 1.8 ml distilled water. Fluorescence of 10 fold diluted serum samples was
measured in a luminesecence spectrometer at a wavelength of 420 nm after excitation at
350 nm. The measurement was performed in triplicate. Haemolytic samples were
excluded. Fluorescence intensity standards were used to calibrate and monitor the
performance of the instrument and calibrated against quinine sulphate (1 mg/ml) in
HSO. Deionised water was used as blank to zero the instrument. The fluorescence
signals of samples were expressed as the relative fluorescence intensity in arbitrary unit
(A.U) and multiplied by the dilution factor.
2.9 Antioxidant assay
Antioxidant assay was performed on plasma samples from both T2DM and healthy
control samples using Antioxidant assay kit method (Cayman Chemical Company,
USA). This kit was used to measure the total anti-oxidant capacity of plasma. This kit
gave the combined anti-oxidant activities of all its constituents including vitamins,
proteins, lipids, glutathione, uric acid, etc. The assay relied on the ability of anti-
oxidants in the sample to inhibit the oxidation of ABTS® (2, 2
‘-Azino-di-[3-
ethylbenzthiazoline sulphonate]) to ABTS®●+
by metmyoglobin. The amount of
ABTS®●+
produced was monitored by reading the absorbance at 405 nm. The capacity

Page 97
of the anti-oxidants in the sample to prevent ABTS®
oxidation was compared with that
of Trolox, a water soluble tocopherol analogue, and was quantified as millimolar Trolox
equivalents.
2.9.1 Reagent Preparation
Some of the kit components were provided in lyophilized (under vacuum) or
concentrated form and were reconstituted prior to use.
2.9.1.1 Antioxidant Assay Buffer
A volume of 3 ml of concentrated assay buffer was diluted with 27 ml of HPLC-grade
water. This diluted assay buffer (5 mM potassium phosphate, pH 7.4, containing 0.9%
sodium chloride and 0.1% glucose) was used to reconstitute the metmyoglobin.
2.9.1.2 Antioxidant Assay Chromogen
Chromogen was supplied as lyophilised powder of ABTS®. This was reconstituted by
adding 6 ml of HPLC-grade water to the vial and vortexed well. The reconstituted
reagent was stable for 24 h at 4 ºC.
2.9.1.3 Antioxidant Assay Metmyoglobin
This was provided in lyophilised powder of metmyoglobin. The content was
reconstituted by adding 600 µl of assay buffer and vortexed well. The reconstituted
reagent was stable for at least one month at -20 ºC.
2.9.1.4 Antioxidant Assay Trolox
Lyophilized powder of Trolox (6-Hydroxy-2,5,7,8-tetramethylchouroman-2-carboxylic
acid) was reconstituted by adding 1 ml of HPLC-grade water and was vortexed well.
The reconstituted reagent was used to prepare the Trolox standard curve. The
reconstituted reagent was stable for 24 h at 4 ºC.

Page 98
2.9.1.5 Antioxidant Assay Hydrogen Peroxide
Hydrogen peroxide was supplied as a stock solution of 8.82 M. A volume of 10 µl of
this solution was diluted with 990 µl of HPLC-grade water. It was further diluted by
removing 20 µl and added to 3.98 ml of HPLC-grade water to yield a 441 µM working
solution. The hydrogen peroxide working solution was stable for 4 hours at room
temperature.
2.9.2 Sample Preparation (Serum)
Blood sample was collected without using an anticoagulant and then allowed to clot for
30 min at 25 ºC. Blood was then centrifuged at 2000 x g for 15 min at 4 ºC. After
centrifugation, the top yellow serum layer was pipetted off without disturbing the white
buffy layer. Serum was then stored on ice. Before assaying serum was diluted to 1:20
and 1:30.
2.9.3 Performing the Assay
The assay was performed using 96 well microtitre plate. Trolox standards were prepared
in seven clean glass tubes. Amount of reconstituted Trolox and assay buffer was added
to each tube as described in table 2.5.
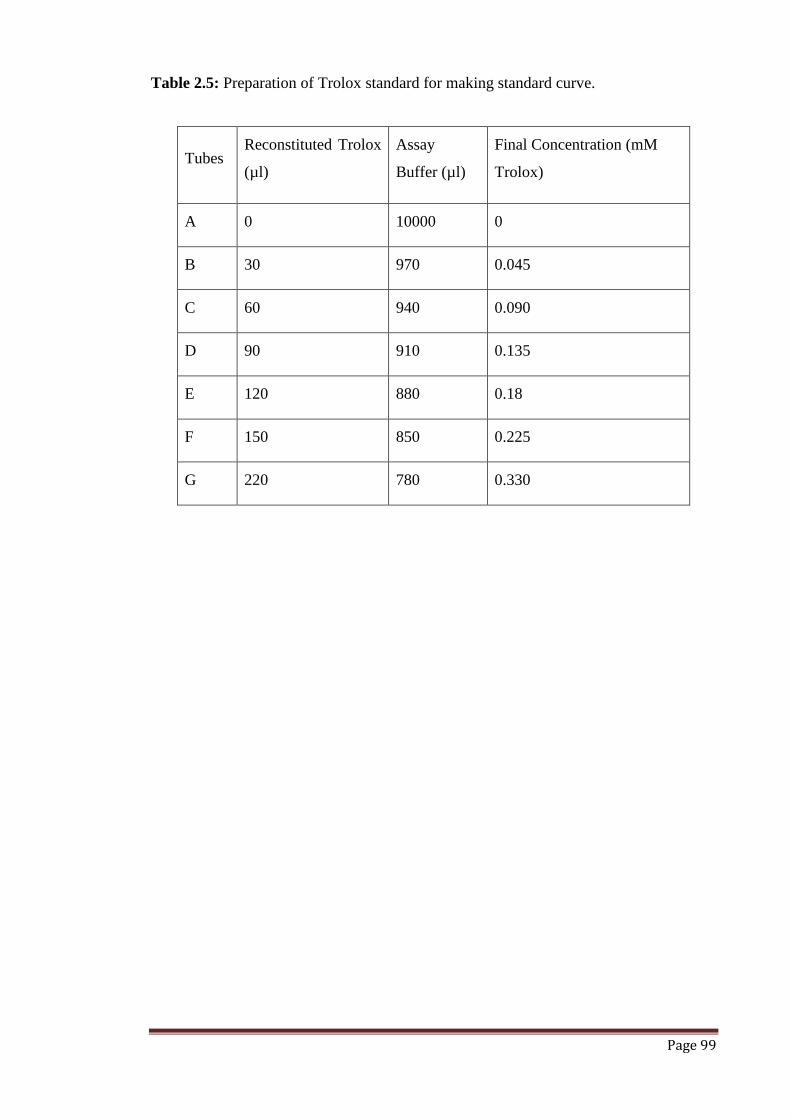
Page 99
Table 2.5: Preparation of Trolox standard for making standard curve.
Tubes Reconstituted Trolox
(µl)
Assay
Buffer (µl)
Final Concentration (mM
Trolox)
A 0 10000 0
B 30 970 0.045
C 60 940 0.090
D 90 910 0.135
E 120 880 0.18
F 150 850 0.225
G 220 780 0.330
Page 100
Master mix was prepared for Trolox standard wells using 10 µl of Trolox standard
(tubes A-G), 10 µl of metmyoglobin and 150 µl of chromogen per well. For each
sample well, 10 µl of sample was added in instead of Trolox standards along with 10 µl
of metmyoglobin and 150 µl of chromogen per well. The reaction was then initiated by
adding 40 µl of hydrogen peroxide working solution to all the wells that were used.
Hydrogen peroxide was added as quickly as possible according to the protocol. After
adding all the reagents, the 96 well plate was covered with a plate cover and incubated
on a shaker for 5 min at room temperature. Absorbance of the samples in each well was
measured in a Tecan plate reader at 405 nm.
2.9.4 Analysis of results
Average absorbance of each standard and sample was calculated and the standard graph
was plotted as a function of the final Trolox concentration (mM) from the table 2.5.
Antioxidant concentration of the samples was then calculated using the equation
obtained from the linear regression of the standard curve by substituting the average
absorbance values for each sample into the equation:
( )
2.10 Comparison of osmotic fragility of RBC’s of T2DM and healthy
controls.
Erythrocytes placed in hypotonic solutions, absorbed water osmotically to reach a
critical volume which resulted in their lysis due to the fragility of their membranes. This
phenomenon of osmotic fragility was originally described by Parpart et. al., in 1946
(Parpart et al., 1946). In this study, the osmotic fragility of RBC was compared between
T2DM patients and healthy controls. Blood was collected in EDTA tubes by a
venipuncture technique after obtaining consent from both T2DM patients and healthy

Page 101
controls. This experiment was performed within 2 h after the withdrawal of blood.
Blood tubes were centrifuged at 3500 rpm for 10 min to separate the plasma from the
buffy coat and RBC. A volume of 50 µl of RBC was added to each solution of NaCl in
increasing concentrations and incubated for 30 min at room temperature. After
incubation, the tubes were centrifuged at 1500 rpm for 10 min and absorbance of the
supernatant in each tube was measured in a spectrophotometer at 540 nm.
The result of osmotic fragility test (OFT) was expressed as the concentration of NaCl
causing 50% haemolysis and the median corpuscular fragility for fresh normal samples
was taken between 4.0 and 4.45 g/L. Percentage of haemolysis for each solution was
plotted against NaCl concentrations. The osmotic fragility curve was then compared
between T2DM and healthy controls. This experiment required preparation of a series
of hypotonic solutions with NaCl ranging from 0.1% to 0.9%. Dilutions of different
concentrations of buffered NaCl (100g/L) were made from the stock solution as given in
the table 2.6 below:
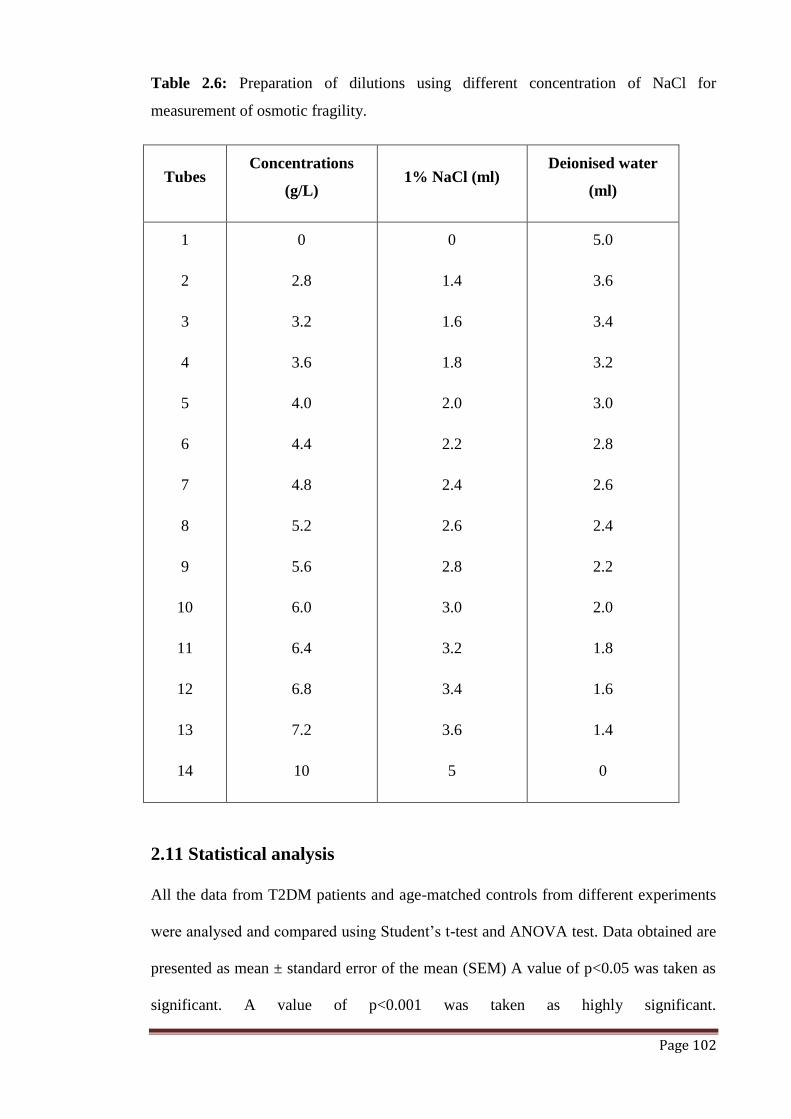
Page 102
Table 2.6: Preparation of dilutions using different concentration of NaCl for
measurement of osmotic fragility.
Tubes Concentrations
(g/L) 1% NaCl (ml)
Deionised water
(ml)
1
2
3
4
5
6
7
8
9
10
11
12
13
14
0
2.8
3.2
3.6
4.0
4.4
4.8
5.2
5.6
6.0
6.4
6.8
7.2
10
0
1.4
1.6
1.8
2.0
2.2
2.4
2.6
2.8
3.0
3.2
3.4
3.6
5
5.0
3.6
3.4
3.2
3.0
2.8
2.6
2.4
2.2
2.0
1.8
1.6
1.4
0
2.11 Statistical analysis
All the data from T2DM patients and age-matched controls from different experiments
were analysed and compared using Student‘s t-test and ANOVA test. Data obtained are
presented as mean ± standard error of the mean (SEM) A value of p<0.05 was taken as
significant. A value of p<0.001 was taken as highly significant.
Page 103
Chapter 3
Measurement of intracellular calcium
in neutrophils and lymphocytes of
T2DM patients and healthy controls

Page 104
3.1 Objectives of this study
To measure basal [Ca2+
]i and to investigate the effect of either thapsigargin or fMLP
on [Ca2+
]i in neutrophils and lymphocytes from T2DM patients and healthy age-
matched control subjects for comparison.
3.2 Introduction
It is known well that in T2DM condition where the host defence mechanism is highly
compromised (Kumar and Clark, 2007). Impaired functions of granulocytes and
lymphocytes and several other immunological dysfunctions have been reported in
studies relating to diabetic patients and animals (Marhoffer et al., 1992; Alexiewicz
et al., 1995). There are many on-going studies trying to elucidate the association
between diabetes and leukocyte functions. Calcium plays a very important role as a
second messenger in mediating cellular regulation (Berridge, 1995). A disturbance
in the intracellular free calcium concentration [Ca2+
]i is a major cause of metabolic
disorders and there is much evidence that Ca2+
plays an important regulatory role in
the cascade of insulin-generated signals and β-cell function. An elevated or sustained
level of calcium is the major reason to diminish cellular sensitivity to insulin and
contributes to the pathogenesis of T2DM. In this chapter, [Ca2+
]i was measured in
lymphocytes and neutrophils of T2DM subjects and compared with healthy controls.
Formyl-methionyl-leucyl-phenylalanine (fMLP) and thapsigargin-induced changes in
[Ca2+
]i of both lymphocytes and neutrophils were evaluated using spectrophotometric
methods (Espino et al, 2009).
3.2.1 Role of calcium in lymphocytes
Calcium signals are crucial for various functions of all immune cells including
differentiation, effector function, and gene transcription. [Ca2+
]i ions are increased

Page 105
through the sequential operation of two interdependent processes: depletion of
endoplasmic reticulum Ca2+
stores as a result of binding of inositol trisphosphate
(IP3) to IP3 receptors, followed by ‗store-operated‘ Ca2+
entry through plasma
membrane Ca2+
channels (Berridge, 1995; Peterson et al, 1994).
In lymphocytes, mast cells and other immune cell types, store-operated Ca2+
entry
through specialized Ca2+
release-activated calcium (CRAC) channels constitutes the
major pathway of intracellular Ca2+
increase. In lymphocytes, the main mechanism
for the entry of extracellular Ca2+
across the plasma membrane is store-operated Ca2+
entry (SOCE) through Ca2+
release-activated calcium (CRAC) channels. Opening of
CRAC channels leads directly to the sustained increase of intracellular Ca2+
concentrations resulting in both short-term and long-term functional consequences
(Berridge 1995; Peterson et al, 1994).
3.2.2 Role of calcium in neutrophils
Neutrophils play a significant role in immune response during the initial stages of
host response to infection via a series of processes which include chemotaxis,
phagocytosis and the production of reaction oxygen species (ROS) (Roitt et al.,
1996; Vlahos et al., 1995). This leads to an activation of phosphatidylinositol
cascade, resulting in inositol triphosphate (IP3) and diacylglycerol (DAG) production
which is an activator of protein kinase C (PKC) (Hu et al., 1999). These processes
are calcium dependent in which [Ca2+
]i acts as a second messenger in most of signal
transduction pathways. It is also shown that [Ca2+
]i is actively involved in insulin
signalling where it actively depends on intracellular calcium swings rather than large
calcium swings resulting by influx from intracellular compartments (Clausen et al.,
1974; Jakubczak et al., 2006).

Page 106
In T2DM, neutrophil dysfunction is considered to augment bacterial infection
(Repine et al., 1980; Marhoffer et al., 1992) and cardiovascular disease (Berliner et
al., 2000; McDonagh et al., 1997). Neutrophils from patients with T2DM also show
signs of impaired phagocytosis, chemotaxis, adhesion and oxidase activity.
Alterations in the level of [Ca2+
]i is responsible for many functions of neutrophils.
[Ca2+
]i transients are essential for the release of neutrophil granule contents and
oxidase activity as well as neutrophil adherence and chemotaxis (Jaconi et al., 1988;
Lew, 1989; Levy et al., 1994a; Alteraifi & Zhelev, 1997) .There is also increasing
evidence that [Ca2+
]i levels are higher in most tissues in T2DM (Levy et al., 1994b).
In T2DM, normalization of hyperglycaemia is associated with a lowering of [Ca2+
]i
to non-diabetic levels and an associated improvement in neutrophil function
(Alexiewicz et al., 1995).
The initial mechanism involved in the response of leukocytes to inflammatory
stimuli is mobilization of [Ca2+
]i. Activation of Polymorphonuclear leukocytes
(PMNs) by chemoattractants like N-formyl-,methionyl-leucyl-phenylalanine (fMLP)
induce changes in [Ca2+
]i. This process is characterised by three major steps: a rapid
increase, which is followed by a small sustained increase which returns to the initial
levels in the final stage. Calcium release from internal stores is mediated by inositol
1,4,5-triphosphate (IP). Response of [Ca2+
]i is biphasic with a transient release of
Ca2+
from intracellular stores (calciosomes) which is followed by a delayed influx of
extracellular Ca2+
across the plasma membrane as it requires extracellular calcium
[Ca2+
]o. The principal second messengers for Ca2+
influx across the plasma
membrane is possibly Ca2+
release from intracellular stores and Ins(1,4,5)P3 and
inositol 1,3,4,5-tetrakisphosphate (Ins1,3,4,5)P4 as neutrophils do not express
voltage-operated Ca2+
channels (Kelly et al., 1989; Popko et al., 2003).

Page 107
The mechanism of store-mediated calcium entry (SMCE) is not very well understood
and several hypotheses have been proposed (Alvarez et al., 1992; Fasolato et al.,
1993; Randriamampita & Tsien, 1993; Sargeant et al., 1993). An integrated
secretion-like coupling model involves trafficking of the Ca2+
stores towards the cell
surface and a physical interaction with the plasma membrane (Patterson et al., 1999;
Rosado & Sage, 2000a). The actin cytoskeleton plays a major role in intracellular
trafficking, however, cortical actin filaments hinder coupling of Ca2+
stores with the
plasma membrane. Therefore, cytoskeletal remodelling is a key event in SMCE
(Rosado & Sage, 2000b). It has been shown earlier that neutrophil actin
polymerization is impaired in T2DM (Advani et al., 2002). As SMCE is dependent
on cytoskeletal remodelling it is hypothesized that, in response to stimulation, Ca2+
influx across the plasma membrane would be impaired in neutrophils from patients
with T2DM.
Calcium plays a central role in signal transduction for many responses in neutrophils
(Sha'afi et al., 1981). An early increase in [Ca2+
]i ~ has been recorded after
stimulation of neutrophils with a variety of agents (Bengtsson et al., 1986; Pozzan
et al., 1983). Neutrophil adhesion is a major event of the early inflammatory
response that is characterized by the recruitment of neutrophils into areas of
inflammation, which begins with the binding of these cells to endothelium followed
by their transmigration into tissues (Albelda et al., 1994).
Distinct phases have been characterized during neutrophil binding, including rolling,
activation, and firm adhesion (Ley, 1996). The molecular basis for these phases is the
up-regulation of various cell adhesion molecules that belong to three major families.
These include the selectins (e.g., P-selectin, L-selectin, and Eselectin), the b2

Page 108
integrins (e.g., CD11/CD18), and the immmunoglobulin super family (e.g.,
intercellular adhesion molecule-1, vascular cell adhesion molecule-1, and platelet
endothelial cell adhesion molecule-1) (Albelda et al., 1994).
The main aim of this chapter of the study was to measure basal [Ca2+
]i and to
investigate the effect of either thapsigargin or fMLP on [Ca2+
] homeostasis in
neutrophils and lymphocytes of T2DM patients and healthy age-matched control
subjects for comparison especially since derangement in [Ca2+
]i homeostasis is
associated with several diseases.
3.3 Methods
As described in chapter 2 of this thesis.
Table 3.1 Subjects recruited for this study
Healthy controls T2DM
No of subjects 6 6
Age group 30-60 years 30-60 years
Gender 4 Male & 2 Female 5 Male & 1 Female
Diabetic status Non-T2DM T2DM
Treatment - Insulin
Ethnicity European European

Page 109
3.4 Results
3.4.1 Effect of fMLP on calcium release in neutrophils of T2DM and healthy
controls.
Basal [Ca2+
]i in lymphocytes and neutrophils of age-matched control subjects was
100±0.01 nM and 75.0±0.01 nM, respectively. Basal [Ca2+
]i in lymphocytes and
neutrophils of T2DM patients was 0.92±0.01 nM (n=16) and 0.87±0.01 nM (n=16),
respectively. These values show no significant differences between basal [Ca2+
]i for
control and T2DM patients. Graphs were plotted to compare the difference of
calcium release from neutrophils of T2DM patients and healthy controls and the
results are presented in Figure 3.1.
Figure 3.1 shows original time course chart recordings of [Ca2+
]i level in neutrophil
of T2DM patients and healthy age-matched controls following stimulation with
fMLP. The data show that fMLP can elicit a large and transient increases in [Ca2+
]i
from neutrophils of both control and diabetic subjects. However, the release of Ca2+
was much more prominent in neutrophils of control subjects compared to T2DM
subjects. The results also show that [Ca2+
]i reach a maximum level after 20-30 sec of
fMLP stimulation followed by a rapid decline but remained slightly above the basal
level. These experiments were repeated over 24 times for neutrophils of 6 T2DM
patients and 6 control subjects and the peak responses for each were analysed and
plotted as bar charts in Figure 3.1B. The results show that neutrophils of T2DM
patients contain significantly (p<0.05) less [Ca2+
]i compared to neutrophils from
healthy age-matched controls.

Page 110
Figure 3.1 – (A) Original time course chart readings showing [Ca2+
]i transients in human neutrophils of age-matched controls and T2DM
patients following fMLP stimulation. (B) Bar charts showing mean ±SD data for [Ca2+
]i from fMLP stimulated neutrophils of age-matched
controls and T2DM human subjects (n=6), *p<0.001 for diabetic compared to control. Note the significant elevation in [Ca
2+]i for T2DM patients
compared to control.

Page 111
3.4.2 Effect of thapsigargin (TG) on calcium release in neutrophils of T2DM
patients and healthy controls.
Thapsigargin is a major Ca2+
mobilising secretagogue (Berridge 1995; Peterson et al,
1994). It specifically acts on the endoplasmic reticulum (ER) in epithelial cells and
release Ca2+
. As such, TG was employed in this study to analyse [Ca2+
]i release from
WBC.
Similarly, calculations were performed and graphs were plotted to compare the
difference of calcium release between T2DM patients and healthy controls. A
significant difference was observed when neutrophils were stimulated with
thapsigargin under presence of normal calcium conditions. A decreased response to
thapsigargin was observed in T2DM patients when compared with healthy controls
(Figure 3.2).
Original traces are representative of six independent experiments (Figure 3.2 A).
Histogram represents the integral for 2.5 min of the calcium release, in healthy
controls and T2DM patients, calculated as described in Methods section. Values are
mean ± SD of six independent experiments *P < 0.05 (Figure 3.2 B). The results
clearly show that thapsigargin can evoke significant and sustained increases in
[Ca2+
]i in neutrophils from T2DM patients and age-matched controls compared to
basal [Ca2+
]i. Moreover, the results also show that neutrophils from T2DM patients
produced significant (P<0.01) less [Ca2+
]i compare to neutrophils from age-matched
control subjects following thapsigargin stimulation.
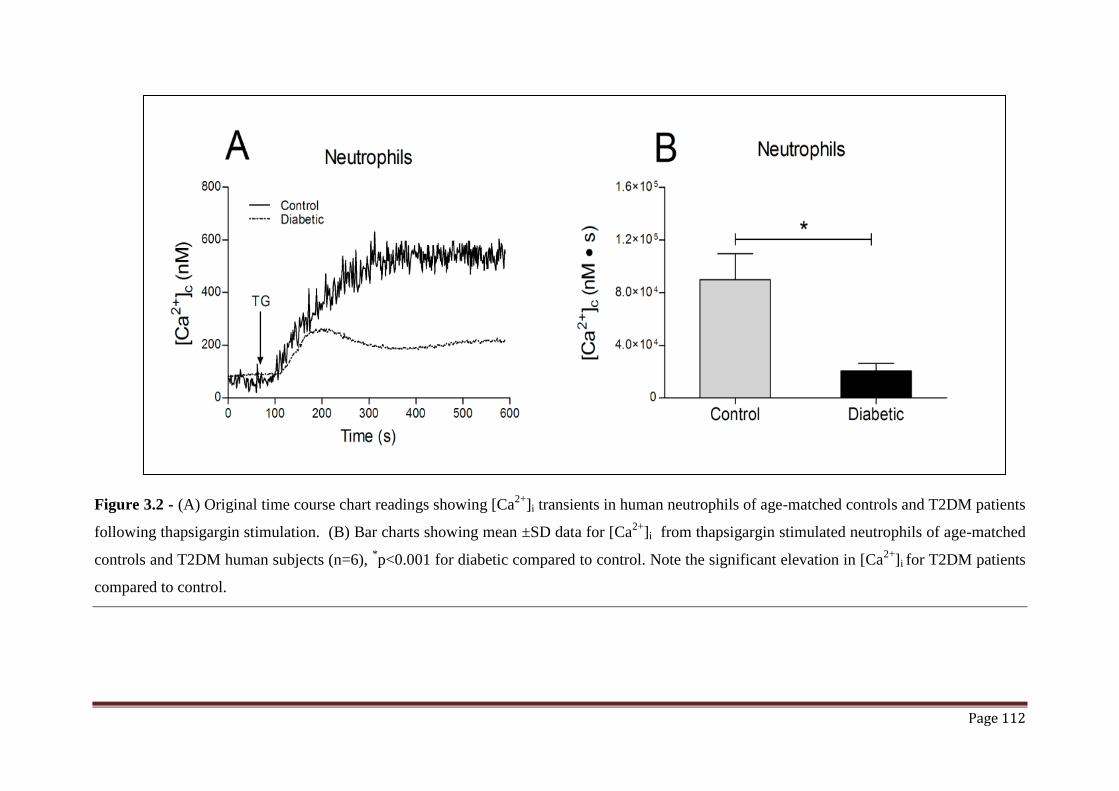
Page 112
Figure 3.2 - (A) Original time course chart readings showing [Ca2+
]i transients in human neutrophils of age-matched controls and T2DM patients
following thapsigargin stimulation. (B) Bar charts showing mean ±SD data for [Ca2+
]i from thapsigargin stimulated neutrophils of age-matched
controls and T2DM human subjects (n=6), *p<0.001 for diabetic compared to control. Note the significant elevation in [Ca
2+]i for T2DM patients
compared to control.

Page 113
3.4.3 Effect of thapsigargin on calcium release in lymphocytes of T2DM patients
and healthy controls.
Figure 3.3 (A) shows the effect of thapsigargin (TG) on [Ca2+
]i from lymphocytes of
T2DM patients and age-matched control subjects. The results show (A) time course
original chart readings of Ca2+
release and (B) the mean±SD peak responses
following TG stimulation.
The graphs in Figure 3.3B were plotted to compare the difference of calcium release
between T2DM patients and healthy controls. The results show that thapsigargin can
evoke significant (p<0.05) and sustained increase in from neutrophils of healthy age-
matched control subjects compare to basal release. Analysis of the data show a
significant (p<0.05) difference when lymphocytes from T2DM patients were
stimulated with thapsigargin under presence of normal calcium conditions compared
to healthy controls (see Figure 3.3 B).
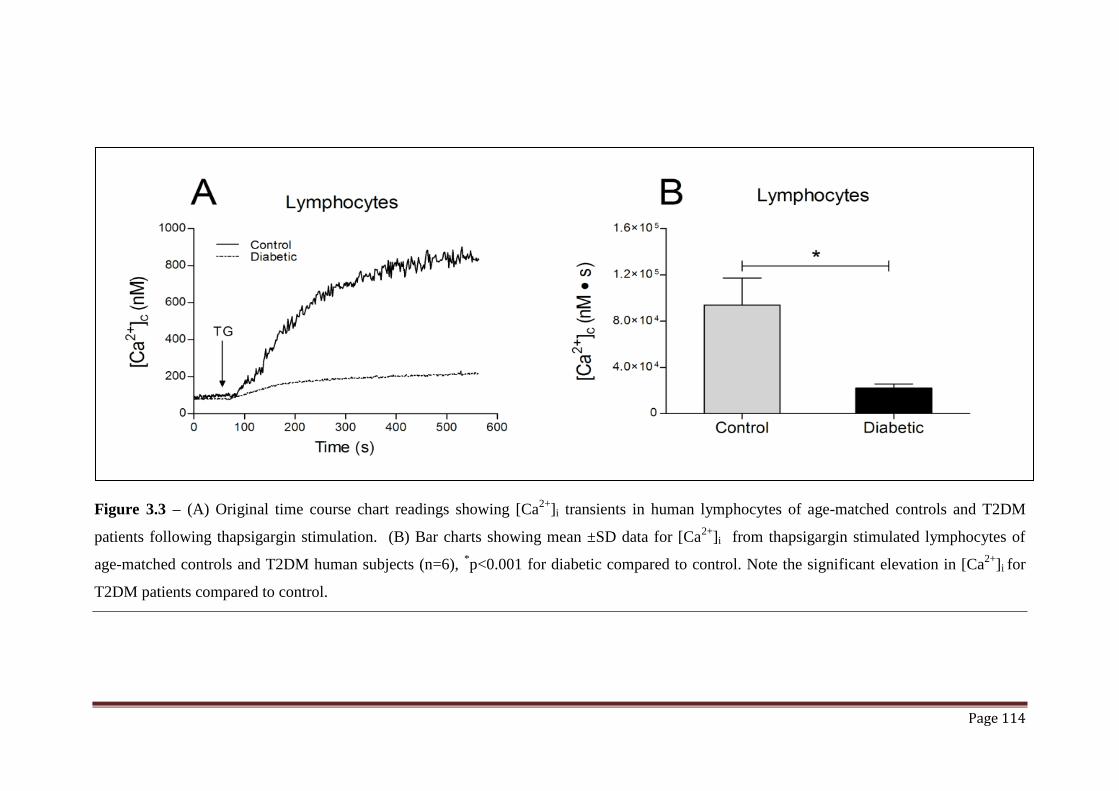
Page 114
Figure 3.3 – (A) Original time course chart readings showing [Ca2+
]i transients in human lymphocytes of age-matched controls and T2DM
patients following thapsigargin stimulation. (B) Bar charts showing mean ±SD data for [Ca2+
]i from thapsigargin stimulated lymphocytes of
age-matched controls and T2DM human subjects (n=6), *p<0.001 for diabetic compared to control. Note the significant elevation in [Ca
2+]i for
T2DM patients compared to control.
Page 115
3.5 Discussion
The common links among several clinical disorders including T2DM and
cardiovascular disease have been suggested in various studies (Gonzalez Flecha et al.,
1990; Levy et al., 1994a; Schaffer & Mozaffari, 1996). One of the most common
reported clinical manifestations is insulin resistance. However, there is limited data
available about the underlying molecular basis for insulin resistance and cardiovascular
dysfunction. The major findings made in the present study are the significant and
marked changes in [Ca2+
]i in neutrophils and lymphocytes from T2DM patients
compared to healthy controls. The measurement of Ca2+
concentration was determined
by detection of the fluorescent dyes Fura 2. Bacterial peptide fMLP and thapsigargin
were used for stimulation of lymphocyte and neutrophil. The results of this study show
a significant decrease in peak [Ca2+
]i after stimulation with either fMLP or thapsigargin,
reflecting impaired activity of neutrophils and lymphocytes from T2DM patients when
compared with healthy controls.
Insulin secretion is a calcium-dependent biological process and an elevation of calcium
is required for both first and second-phase insulin secretions. T2DM is associated with a
shift from biphasic to monophasic insulin release, which might result from a functional
impairment of Cav2.3 Ca2+
channels (Berridge, 1993). The threshold of blood glucose,
which normally causes sustained second phase insulin release is increased. Elevated
level of serum calcium is the reflection of extracellular calcium possibly in conjunction
with impairments of voltage-gated Ca2+
channels (Berridge, 1993). There is also
evidence of a link between serum calcium levels and cellular function relating to
cytosolic calcium (Boris, 1988) .
This altered metabolic response detected in granulocytes (neutrophil and lymphocytes)
from T2DM patients under stimulation with fMLP may be a reflection of a disease-

Page 116
induced adaptive metabolic response. Defects in intracellular Ca2+
homeostasis have
been implicated in the impaired mechanical performance of the diabetic heart (Roe et
al., 1994). Deranged [Ca2+
]i may also play a role in the development of other diabetic
complications, such as nephropathy and cardiomyopathy (Pierce & Russell, 1997). It is
suggested that albuminuria in T2DM patients is associated with a primary defect in
[Ca2+
]i homeostasis (Volzke et al., 2006). The results of the present study show an
appreciable impairment of Ca2+
kinetics in neutrophils and lymphocytes from T2DM
patients compared to control. Thus, decreased [Ca2+
]i level in immune cells may be one
of the mechanisms of impaired immunity in diabetic patients. Secondly, this may also
be associated with constant infection and delayed wound healings normally associated
with T2DM patients (Kumar and Clark, 2007). Lymphocytes play a major role in the
development and production of antibodies in the body. Neutrophils are responsible for
killing or engulfing foreign organisms (bacteria etc.) once they enter the body (Kumar
and Clark, 2007).
From the present results, it can be speculated that a correct response of granulocytes to
extrinsic stimuli depends on the proper function of cell signalling pathways. A reduction
in neutrophilic functional activity may contribute to higher susceptibility to and severity
of infections in T2DM (Kumar & Clark, 2007). Such alterations are strongly associated
with cytosolic calcium disturbances. It is concluded that patients with T2DM have a
decreased cytosolic calcium level in polymorphonuclear granulocytes after thapsigargin
and fMLP stimulation. This abnormality is possibly responsible for impaired
neutrophilic function seen in these patients (McManus et al., 2001).
The present study also shows that in neutrophils from patients with T2DM, despite
elevated resting cytosolic-free calcium [Ca2+
]i, stimulation gives rise to a significantly
subnormal [Ca2+
]i signal. The defect in neutrophil [Ca2+
]i rise in T2DM is evident when
Page 117
cells are incubated with either fMLP or thapsigargin. This suggests the presence of an
abnormality that may affect more than one signalling pathway. Thus, in T2DM, the
impaired [Ca2+
]i signal results from a defect in influx of extracellular calcium across the
plasma membrane and is likely owing to an abnormal store mediated calcium entry,
which is a cytoskeletal-dependent process. There was a significantly greater response to
fMLP in neutrophils from the controls than from the patient‘s with T2DM.
Thapsigargin caused a similar change in [Ca2+
]i as fMLP, with a significantly greater
increase in control neutrophils and lymphocytes (Popko et al., 2003).
The concentration (10-6
M) of thapsigargin used has been suggested to cause inhibition
of Ca2+
entry (Geiszt et al., 1995). However, it is unlikely that the response in
neutrophils from patients is owing to a differential sensitivity to thapsigargin, as the
finding could be reproduced with fMLP. Previous work has shown that incubation of
neutrophils, from healthy controls, with 10 nmolL-1
fMLP is associated with a
significant increase in [Ca2+
]i and that this can occur when cells are incubated in
calcium-free medium (Espino et al, 2009).
The demonstration of increased [Ca2+
]i in resting neutrophils from patients with T2DM
is consistent with previous findings in neutrophils and other tissues (Lew, 1989).
Increased resting [Ca2+
]i may be owing to reduced activity of membrane Ca2+
-ATPase
activity in T2DM (Levy et al., 1986). In contrast to the present study, in platelets and
fibroblasts from patients with T2DM, increased Ca2+
influx has been observed (Ishii et
al., 1991). However, the present observations in leucocytes are consistent with reports
of a reduced [Ca2+
]i response to increased glucose concentrations in endothelial cells
(Salameh and Dhein, 1998) and cardiomyocytes (Yu et al., 1997b). Intriguingly,
increased [Ca2+
]i is associated with platelet hyper function in diabetes whereas the
defect in neutrophil behaviour is one of impaired function (Ishii et al., 1991).
Page 118
It is unclear whether abnormal calcium homeostasis in T2DM is primarily genetic or
metabolic. Improvement in glycaemic control is associated with normalization of
resting [Ca2+
]i (Alexiewicz et al., 1995). On the other hand, a defect in Ca2+
handling by
fibroblasts is most commonly observed in a subgroup of patients with T2DM with
hypertension and microalbuminuria, suggesting a basic cellular defect (Solini et al.,
1996). In this study, subject groups differed in terms of BMI, blood pressure, lipids and
insulin levels as well as level of glycaemia. There was, however, no correlation done
between any of these parameters and the response of neutrophils to stimulation. The
cause of the defect that was observed in patients with T2DM might be a reduced Ca2+
influx across the plasma membrane secondary to impaired neutrophil cytoskeletal
remodelling (Advani et al., 2002). Alternative hypothesis for the defect in Ca2+
homeostasis in neutrophils and lymphocytes may be due to lipid abnormalities affecting
membrane composition and possible insulin resistance (Pierce & Russell, 1997). Similar
results have been obtained in cardiomyocytes from T2DM rats (Bracken et al, 2004).
In conclusion, the results of this study, have clearly demonstrated a derangement in
calcium homeostasis in both neutrophils and lymphocytes of T2DM patients compare to
healthy age-matched control subjects. Either fMLP or thapsigargin can elicit marked
and significant increases in [Ca2+
]i from either neutrophils or lymphocytes of age-
matched control subjects. In contrast, in T2DM patients, either fMLP or thapsigargin
elicited significantly less [Ca2+
]i from either neutrophils or lymphocytes compared to
controls. The decreases in [Ca2+
]i from neutrophils and lymphocytes in T2DM patients
may be responsible for constant infections and delayed wound-healing, normally seen in
T2DM patients. Therefore, altered intracellular calcium metabolism may represent a
common, underlying abnormality linking the metabolic and cardiovascular
manifestations of the diabetic disease process. Further studies are required to determine
the molecular mechanisms responsible for this effect.

Page 119
These include the measurement of Ca2+
from extracellular medium and its release from
intracellular organelles including the endoplasmic reticulum and the mitochondria.
Additionally, it is worthy to measure gene expressions for the different calcium
transporting proteins in lymphocytes and neutrophils.

Page 120
Chapter 4
Analysis of red blood cell membrane
proteins in T2DM patients compared to
healthy controls using SDS-PAGE

Page 121
4.1 Objectives of this study
To analyse RBC cell membrane proteins from T2DM patients and healthy age-
matched controls using SDS-PAGE electrophoresis and silver staining techniques.
4.2 Introduction
T2DM is a multifaceted syndrome which leads to the development of cardiovascular
diseases (CVD) (Nishikawa et al., 2000). Significant evidence has demonstrated that
T2DM is responsible for the production of reactive oxygen species (ROS) which
contributes for the initiation and progression of atherosclerosis and other related
complications (Saha et al., 2005). In recent years, there has been growing interest in
characterising red blood corpuscle (RBC) membrane since structural and functional
alterations of the membrane might also contribute to patho-physiology of the disease
(Kahane et al., 1978). Cell membranes are fluid membrane structures which actively
participate in the central regulation of different functions of the cell. Moreover, they
are responsible for the maintenance of fluidity which is a prerequisite for their
function, viability and growth. Zeta potential (ZP) is a characteristic signature for the
diagnosis of haemolytic diseases, studies of membrane permeability, and other
alterations leading to destruction of erythrocytes (Ohno et al., 1985).
In this chapter, alterations of erythrocyte membrane proteins including spectrin,
ankyrin, band 3, band 4.1 and glycophorin in T2DM patients and healthy controls
were analysed by sodium dodecyl sulfate polyacrylamide gel electrophoresis (SDS-
PAGE) and quantitative estimation of protein bands was performed using scanning
densitometry as described in chapter 2

Page 122
4.3 Methods
Methods for this chapter as described in chapter 2.
Table 4.1 Subjects recruited for this study
Healthy controls T2DM
No of subjects 9 9
Age group 20-60 years 20-60 years
Gender 5 Male & 4 Female 7 Male & 2 Female
Diabetic status Non-T2DM T2DM
Treatment - Medication &
Insulin
Ethnicity Caucasian Caucasian

Page 123
4.4 Results
Figure 4.2 shows the overall electrophoretic mobility and relative intensity of stained
bands. The results reveal that the bands for proteins spectrin, ankyrin, band 3, band
4.1, glycophorin were significantly (p<0.05) different between the two groups
(Figure 4.4).
Figure 4.1: SDS-PAGE protein patterns of T2DM patients following silver staining
procedure using Fermentas Page Silver Staining Kit. Lane 1 represents molecular
weight marker. Lane 3 and 5 represent controls and lanes 7 and 9 represent T2DM
samples. These images are typical of 9 such experiments.

Page 124
Figure 4.2: Analysis of protein bands performed by Bio-Rad Gel Doc analyser. Each
electrophoretic protein band is expressed in terms of intensity (arbitrary units, AU).
The peaks represent the intensity of each band in terms of AU units in this figure.
Typical of 9 such experiments.

Page 125
Figure 4.3: Sodium dodecyl sulfate–polyacrylamide gel (SDS-PAGE)
electrophoresis patterns of protein extractions performed on Bio-Rad mini-gel
system using Bio-Rad 12% Tris-HCl gel following silver staining technique. The
first column on the left hand side represents molecular weight marker in kDa. Lanes
1 and 2 represent healthy controls and lanes 3 and 4 represent T2DM patients.
Typical of 9 such different experiments.
The data presented in Figure 4.3 showed significant (p<0.05) increases in the
intensity of bands of all proteins in T2DM patients compared to healthy controls
which might indicate a genetic problem underlying the excess production of these
proteins in T2DM. Following quantification of the different bands, the data are
presented as a family of bar charts in Figure 4.5. The results have indicated
significant (Student‘s t-test; p<0.05; n=9) increases in the amounts of all five
proteins in erythrocyte membranes of T2DM patients compared to healthy controls.

Page 126
Figure 4.4: Bar charts showing the levels of 5 different proteins in RBC membranes of healthy age-matched controls and T2DM patients.
Data are mean±SEM, n=9, *p<0.05 for T2DM compare to controls. Note the significant increases for spectrin, ankyrin, band 3, band 4.1 and
glycophorin compared to healthy controls
.
0
500
1000
1500
2000
2500
3000
3500
4000
Control T2DM Control T2DM Control T2DM Control T2DM Control T2DM
Spectrin Ankyrin Band 3 protein Protein 4.1 Glycophorin
Inte
nsi
ty o
f B
and
s in
AU
un
its
RBC membrane proteins

Page 127
4.5 Discussion
The membrane of the RBC plays a significant role in the structural and functional
aspects of the cell and therefore any defects in the blood cell membrane could lead to
various diseases including severe haemolytic anaemias. Unfortunately, present
diagnostic tools are limited and the cause of these membrane defects is still unknown.
The analysis of membrane proteins is challenging, as they are complicated to solubilise
and also have the tendency to precipitate during analysis while the dynamic interaction
between membrane and cytoskeleton of the RBC membrane makes it more difficult to
analyse the proteins in its membrane. Therefore, for future analysis of patient with
unknown deficiencies, detection of new potential biomarkers should be always
confirmed by analysis including ELISA/radio immuno assays, immunohistochemistry
or confocal immuno-fluorescence microscopy.
Hyperglycaemia which results from uncontrolled glucose regulation is generally
documented as an underlying link between diabetes and diabetic complications (Rolo &
Palmeira, 2006). Chronic hyperglycaemia causes oxidation and non-enzymatic
glycosylation (Maillard reaction) of proteins which also affects the erythrocyte
membrane proteins (Bunn, 1981). Particularly, the slow turnover of the erythrocyte
membrane proteins makes them more susceptible to hyperglycaemia. Glycosylation of
erythrocyte membrane decreases the negative surface electric charge due to cleavage of
terminal sialic acid components of glycophorin A, leading to accelerated ageing of
erythrocytes (Raz et al., 1988). It also leads to increased erythrocyte aggregation and
accumulation of advanced glycation end products (AGEs), which are associated with
erythrocyte deformability defects and microvascular complications of diabetes (Rogers
et al., 1992). The present study was able to show some of the erythrocyte membrane
Page 128
protein alterations that may result from altered glucose metabolism to produce diabetic
complications.
Erythrocyte membrane proteins perform various specific functions. For example, band 3
is the most abundant erythrocyte trans-membrane protein to carry out anion exchange at
the plasma membrane level (Kay, 1991). Other trans-membrane proteins serve as pumps
or channels for the movement of ions and assist in the transport of glucose and other
small molecules. Furthermore, cytoskeletal proteins provide structural integrity and are
also important for the maintenance of the biconcave shape of the erythrocyte.
Therefore, disorders of the erythrocyte membrane proteins may alter the surface electric
charge and the mechanical properties of plasma membrane, including shape and
deformability, which in turn reflect the elastic reserve of the erythrocyte when it
receives shear stress forces while passing through either small vessels or capillaries. In
conclusion, erythrocyte membrane protein alterations are linked to altered erythrocyte
rheology. Several studies provide evidence of the association of haemorrheological
abnormalities with diabetes mellitus which possibly participate in the pathogenesis of
diabetic microangiopathy. Altered rheology of erythrocytes leads to increased
aggregation, endothelial damage and capillary closure. This also applies on diabetic
retinopathy, the most common of diabetic vascular microangiopathies (Babu and Singh,
2004; Ernst and Matrai, 1986).
There has been improved emphasis on the pathogenic mechanisms linking erythrocyte
membrane protein alterations following altered erythrocyte rheology and further
development of diabetic complications. Several studies described a variety of
erythrocyte membrane protein alterations in diabetic humans or animals. Oxidation of
spectrin has been demonstrated in diabetic erythrocytes (Schwartz et al., 1991).
Page 129
Absence of spectrin has been reported in T1DM and increased ankyrin and band 6 has
been reported in both T1DM and T2DM (Adewoye et al., 2011).
In the present study, electrophoretic alterations of the erythrocyte membrane proteins
are shown in T2DM patients compared to healthy controls. Detection of such alterations
may help to clarify the pathogenic steps that contribute to the development of CVD in
T2DM patients and they also might serve as a blood marker for the existence of diabetic
microangiopathy or as a sign of increased risk to develop diabetic complications. In
recent studies, alterations in the ultrastructure of red blood cell have been considered as
a possible progression marker in T2DM (Straface et al., 2002). There are several
possible interpretations to these alterations in the RBC structure. Alterations of the red
blood cell membrane might lead to accelerated ageing of erythrocytes in T2DM
(Mazzanti et al., 1992). It has been reported that the proteins present in erythrocyte
membrane have an increased susceptibility to lysis by endogenous enzymes in diabetes
(Jones, 1984).
However, in this study it has not been possible to find out whether the increased
percentage of protein bands in T2DM patients is attributed to a glycosylation defect or
to increased proteolysis. Abnormal low MW bands possibly arise due to increased
proteolysis of original membrane proteins. The high MW band of above 255 KDa
appeared due to a cross linkage event between spectrin and haemoglobin and has been
previously found in membranes of oxidatively stressed erythrocytes. The formation of
spectrin-haemoglobin cross linking represents a well-known oxidant damage of the
senescent erythrocyte membrane (Snyder et al., 1983) and is reproduced in vitro by
hydrogen peroxide treatment which is associated with echinocyte transformation,
membrane rigidity, adherence and phagocytosis (Snyder et al., 1985).
Page 130
In conclusion, the results presented in this study have shown that structural alterations
of the erythrocyte membrane proteins, that occur as a result of oxidation and non-
enzymatic glycosylation of those proteins in chronic diabetes and which in turn affect
the erythrocyte rheology, possibly are associated with the development of microvascular
complications of diabetes, in particular diabetic cardiovascular disease. A lot of such
protein alterations are shown exclusively in the present study. Their detection may serve
as a blood marker for the development of diabetic microangiopathy or as a sign of
increased risk to develop diabetic microangiopathy. Further studies are needed to assess
whether pharmaceutical intervention to the rheology of erythrocytes can prevent or
alleviate microvascular diabetic complications. Future research might explore the
biochemical foundation of this difference and, possibly, its clinical significance.
Therefore, an approach to study erythrocyte membrane proteins by SDS PAGE,
quantification by scanning densitometry was used in this study which allowed
identification and quantification of proteins in the RBC membrane. This may lead to a
new proteomic approach to discover the unknown defects in erythrocyte membrane
proteins and to obtain potential biomarkers, which may lead to an improved
understanding of erythrocyte functioning in T2DM patients. Therefore, a more profound
analysis of the erythrocyte membrane proteins is required, which can lead to the
discovery of novel biomarkers and also provide an extension of the existing diagnostic
tools. Proteomics technology is most suited for this research as it can provide
simultaneous detection and quantification of proteins.
Page 131
Chapter 5
Analysis of various biochemical
parameters in blood of T2DM patients
and healthy controls
Page 132
5.1 Objectives of this study
To measure the concentrations of cations, biochemical parameters and inflammatory
markers in plasma and serum of T2DM patients and healthy age-matched controls for
comparison.
5.2 Introduction
T2DM is a metabolic disease associated with a group of abnormalities including
hyperglycemia, dyslipidemia, hypertension, elevated levels of biochemical and
inflammatory markers in circulation. This condition predisposes an individual to a
number of adverse consequences which include atherosclerotic cardiovascular disease,
neuropathy, nephropathy and retinopathy (Kumar and Clark, 2007). T2DM and
atherosclerotic CVD have many common antecedent factors that frequently coexist,
which has given rise to the concept of ―common soil‖ (Jarrett & Shipley, 1988; Stern,
1995). These factors are associated with increased concentrations of inflammatory
markers in people with T2DM (Pickup et al., 1997; Nilsson et al., 1998). Inflammatory
processes play a part in the cause of atherosclerotic CVD (Ross, 1999). Concentrations
of acute-phase response markers and mediators of inflammation–cytokines such as
tumour necrosis factor α (TNF-α) and interleukin-6 are increased in people with T2DM.
This finding has led to the suggestion that raised concentrations of proinflammatory
cytokines and the resultant acute-phase response may underlie much of the metabolic
disease including glucose intolerance (Pickup and Crook, 1998).
Moreover, patients with T2DM have an increased risk of developing extensive
atherosclerosis and its sequelae including unstable angina pectoris, and acute
myocardial infarction (Beckman et al., 2002). During the last few years, experimental
data have emphasised the role of inflammation in atherogenesis. Clinical studies have
revealed that this upcoming idea of the role of inflammation in atherosclerosis applies

Page 133
directly to patients (Libby et al., 2002). Therefore the aim of this chapter of the study is
to measure the concentrations of blood plasma cations and other biochemical
parameters and inflammatory markers of T2DM patients compared to healthy age -
matched controls for comparison.
5.3 Methods
Materials and methods of this study are as described in Chapter 2 of this thesis.
Table 5.1 Subjects recruited for this study
Healthy controls T2DM
No of subjects 22 22
Age group 30-60 years 30-60 years
Gender 14 Male & 8 Female 12 Male & 10 Female
Diabetic status Non-T2DM T2DM
Treatment - Medication & Insulin
Ethnicity Caucasian & Asian Caucasian & Asian

Page 134
5.4 Results
In this cationic study, sodium, potassium, calcium, iron, zinc and magnesium were
measured in plasma of T2DM and healthy controls by a method described in chapter 2.
A total of 22 T2DM patients and 19 healthy controls were involved in this particular
study. The results in table 5.1 show that all the trace elements were observed to be
significantly (p<0.05) higher in concentrations in T2DM patients when compared with
healthy controls except for potassium which remains more or less the same for each
group. The values are also expressed graphically in figures 5.1 to 5.7 for comparison.
The results for the measurements of the different cations are presented in figure 5.1 to
figure 5.7. The results show that the plasma of T2DM patients contains significant
(p<0.05) more sodium, calcium, copper, zinc, and magnesium compared to plasma of
age healthy age-matched controls. The results also showed that there was no change in
potassium levels comparing control with T2DM patients. However, T2DM patients had
significantly (p<0.05) less iron compared to age-matched healthy controls.

Page 135
Figure 5.1: Bar chart showing plasma sodium (Na+) concentrations (mmol/L) in T2DM
compared to controls. Values are expressed in terms of mean ± SEM, n=22, *p<0.05 for
T2DM compared to control group.
Figure 5.2: Bar chart showing plasma potassium (K+) concentrations (mmol/L) in
T2DM compared to controls. Values are mean ± SEM, n=22. Note that there is no
significant difference in K+ levels in both control and diabetic groups.
0
100
200
300
400
500
600
Control T2DM
Co
nce
ntr
ati
on
of
Na
+ i
n m
mo
l/L
Sodium
*
0
5
10
15
20
25
Control T2DM
Con
cen
trati
on
of
K+ i
n m
mol/
L
Potassium

Page 136
Figure 5.3: Bar chart showing plasma calcium (Ca2+
) concentrations (mmol/L) in
T2DM compared to controls. Values are mean ± SEM, n=22, *p<0.05 for T2DM
compared to control group.
Figure 5.4: Bar chart showing iron (Fe2+
) concentrations (mmol/L) in T2DM compared
to controls. Values are mean ± SEM, n=22, *p<0.001 for T2DM compared to control
group.
0
2
4
6
8
10
12
14
16
18
Control T2DM
Con
cen
trati
on
of
Ca
2+ i
n m
mol/
L
Calcium
*
0
0.05
0.1
0.15
0.2
0.25
0.3
0.35
0.4
Control T2DM
Con
cen
trati
on
of
Fe2
+ i
n m
mol/
L
Iron
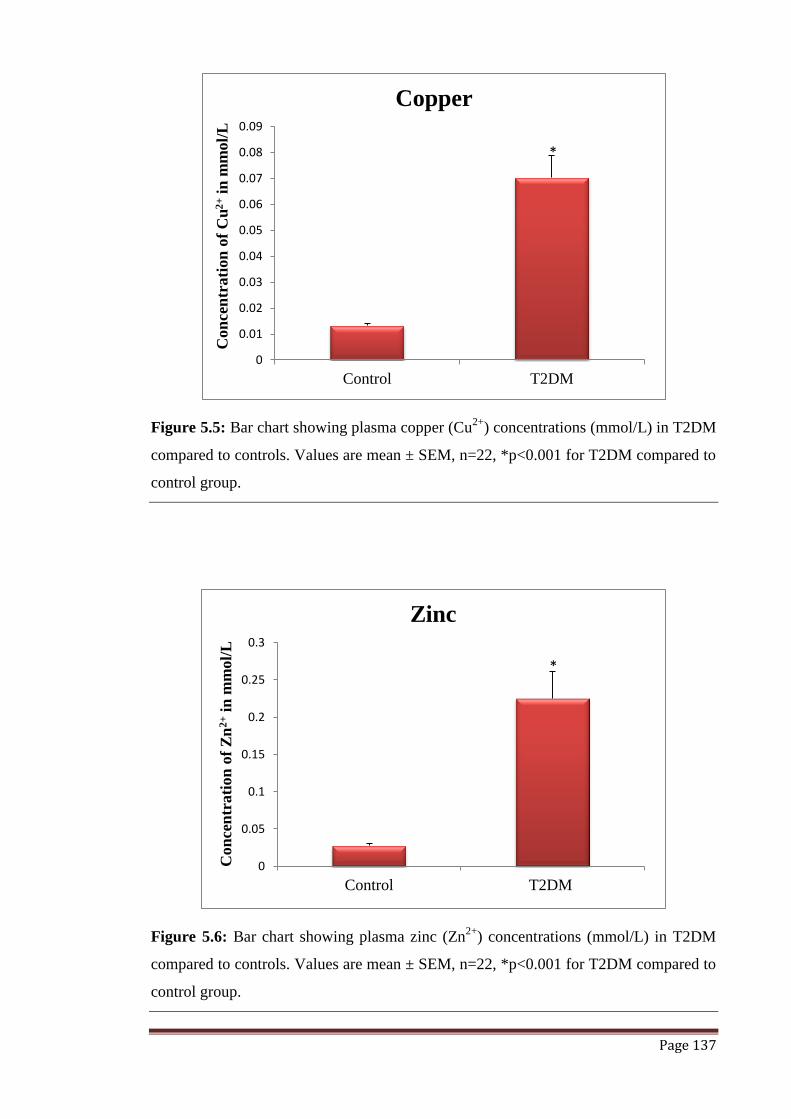
Page 137
Figure 5.5: Bar chart showing plasma copper (Cu2+
) concentrations (mmol/L) in T2DM
compared to controls. Values are mean ± SEM, n=22, *p<0.001 for T2DM compared to
control group.
Figure 5.6: Bar chart showing plasma zinc (Zn2+
) concentrations (mmol/L) in T2DM
compared to controls. Values are mean ± SEM, n=22, *p<0.001 for T2DM compared to
control group.
0
0.01
0.02
0.03
0.04
0.05
0.06
0.07
0.08
0.09
Control T2DM
Con
cen
trati
on
of
Cu
2+ i
n m
mol/
L
Copper
*
0
0.05
0.1
0.15
0.2
0.25
0.3
Control T2DM
Con
cen
trati
on
of
Zn
2+ i
n m
mol/
L
Zinc
*

Page 138
Figure 5.7: Bar chart showing plasma magnesium (Mg2+
) concentrations (mmol/L) in
T2DM compared to controls. Values are mean ± SEM, n=22, *p<0.001 for T2DM
compared to control group.
5.4.1 Biochemical parameters
Table 5.1 and figures 5.8–5.13 show the results of full blood count in plasma of T2DM
patients and healthy age-matched controls. The results show higher concentrations of
RBC, haemoglobin, HCT and lymphocytes in healthy controls when compared with
T2DM patients and lower concentrations of WBC, platelets, MCV, MCH, neutrophils,
monocytes and eosinophils in healthy controls when compared with T2DM patients
(See Table 5.2).
Figures 5.14-5.16 show the serum lipid profiles in plasma of control and T2DM
patients. The results show high levels of serum lipid profiles including cholesterol,
HDL-C, LDL-C and total cholesterol ratio in healthy age-matched controls when
compared with T2DM patients. In contrast, the levels of triglycerides were found to be
lower in healthy controls when compared with T2DM patients.
0
0.5
1
1.5
2
2.5
3
Control T2DM
Con
cen
trati
on
of
Mg
2+ i
n m
mol/
L
Magnesium
*

Page 139
Figures 5.17-5.23 show the levels of plasma glucose, CRP, HbA1c, urea, creatinine,
alkaline phosphatise and GTT in healthy controls and T2DM patients. The results show
that levels of plasma glucose, C-reactive protein, HbA1c were significantly (p<0.05)
higher in T2DM patients when compared with those without T2DM (healthy controls).
The results also show significantly (p<0.05) high levels of urea, creatinine, alkaline
phosphatase, GGT in plasma of T2DM patients when compared to plasma from age-
matched healthy controls. There were also significantly (p<0.01) low levels of total
bilirubin, ALT, total protein, albumin, total calcium in plasma of TDM patients when
compared with plasma from healthy age matched controls.

Page 140
Table 5.2: Table showing the results of all the biochemical parameters measured in
plasma of healthy controls and T2DM patients. All results are expressed as
mean±SEM,*p<0.05 for T2DM compared to control group.
Haematological parameters
Full blood count
Healthy
control (n=19)
T2DM (n=21) p values
Red blood cells (10*12/L)
White blood cells (10*9/L)
Platelets (10*9/L)
Lymphocytes (10*9/L)
Monocytes (10*9/L)
Neutrophils (10*9/L)
Eosinophils (10*9/L)
Haemoglobin (g/Dl)
HCT (ratio)
MCV (fL)
MCH (pg)
5.142±0.145
6.425±0.360
222.8±13.091
2.284±0.131
0.412±0.029
3.4785±0.296
0.2295 ±
0.0421
14.83±0.333
0.434±0.008
85.07±1.318
28.98±0.473
4.511±0.140
8.542±0.380
245.388±15.260
2.040±0.168
0.635±0.038
5.464±0.307
0.2311±0330
13.311±0.317
0.402±0.008
89.72±1.311
29.64±0.464
0.05
-
-
0.05
0.05
-
-
-
-
-
Biochemical/Lipid parameters
Serum lipid profile
Healthy
control (n=19)
T2DM (n=21)
Total Cholesterol (ratio)
HDL-C (mmol/L)
LDL-C (mmol/L)
Triglycerides (mmol/L)
4.480±0.184
1.268±0.094,
2.584±0.188
1.418±0.123
3.965±0.181
1.030±0.079
1.921±0.200
2.223±0.266
-
-
0.05
0.05

Page 141
Total Cholesterol ratio 3.913±0.316 3.805±0.232 -
Kidney function tests Healthy
control (n=19)
T2DM (n=21)
Urea (mmol/L)
Creatinine (umol/L)
4.278±0.266
74.695±2.770
8.616±0.881
106.66±12.004
0.05
0.05
Liver function tests Healthy
control (n=19)
T2DM (n=21)
Total bilirubin (umol/L)
Alkaline Phosphatase (u/L)
ALT (U/L)
GGT (u/L)
Total Protein (g/L)
Albumin (g/L)
11.565±1.449
64.347±3.198
31.090±8.359
20.217±1.506
79.304±0.723
48.565±0.543
18, 8±1.275
89.722±10.497
20.785±2.727
69.111±17.683
74.444±0.682
45.111±0.675
0.05
0.05
0.05
0.05
0.05
-
Total Calcium (mmol/L)
Plasma Glucose (mmol/L)
HbA1c (DCCT %)
HbA1c (IFCCmmol/mol)
CRP (mg/L)
2.375±0.016
4.726±0.189
5.547±0.084
37.238±0.940
1.421±0.209
2.374±0.02
11.23±1.337
8.277±0.407
67.111±4.469
8.441±2.438
-
0.05
0.05
0.05
0.05
5.4.1.1 Full blood count
Analysis of full blood counts in plasma included measurements of RBC, WBC,
platelets, lymphocytes, neutrophils, eosinophils, monocytes, mean corpuscular volume
(MCV), mean corpuscular haemoglobin (MCH) and haematocrit (HCT) in both T2DM
patients and healthy age-matched controls (Figures 5.8-5.13).

Page 142
Figure 5.8: Bar charts A and B showing the concentrations of RBC and WBC in T2DM
patients compared to controls, respectively. Data are mean ± SEM, n=22; *p<0.05 for
T2DM compared with control group. Range of normal values is also shown in the figure
for comparison.
Figure 5.9: Bar charts A and B showing the concentrations of haemoglobin and
platelets (PLT) in T2DM patients compared to controls, respectively. Data are mean ±
SEM, n=22; *p<0.05 for T2DM compared with control group. Range of normal values
is also shown in the figure for comparison.
4
4.2
4.4
4.6
4.8
5
5.2
5.4
Control T2DM
Co
nce
ntr
ati
on
of
RB
C/L
(A) RBC [4.50-6.50]10*12/L
0
1
2
3
4
5
6
7
8
9
10
Control T2DM
Co
nce
ntr
ati
on
of
WB
C/L
(B) WBC [4.0-11.0]10*9/L
12
12.5
13
13.5
14
14.5
15
15.5
Control T2DM
Co
nce
ntr
ati
on
of
Ha
emo
glo
bin
in
g/D
L
(A) Haemoglobin [13.0-
18.0]g/Dl
200
210
220
230
240
250
260
270
Control T2DM
Co
nce
ntr
ati
on
of
PL
T/L
(B) PLT [140-440]10*9/L
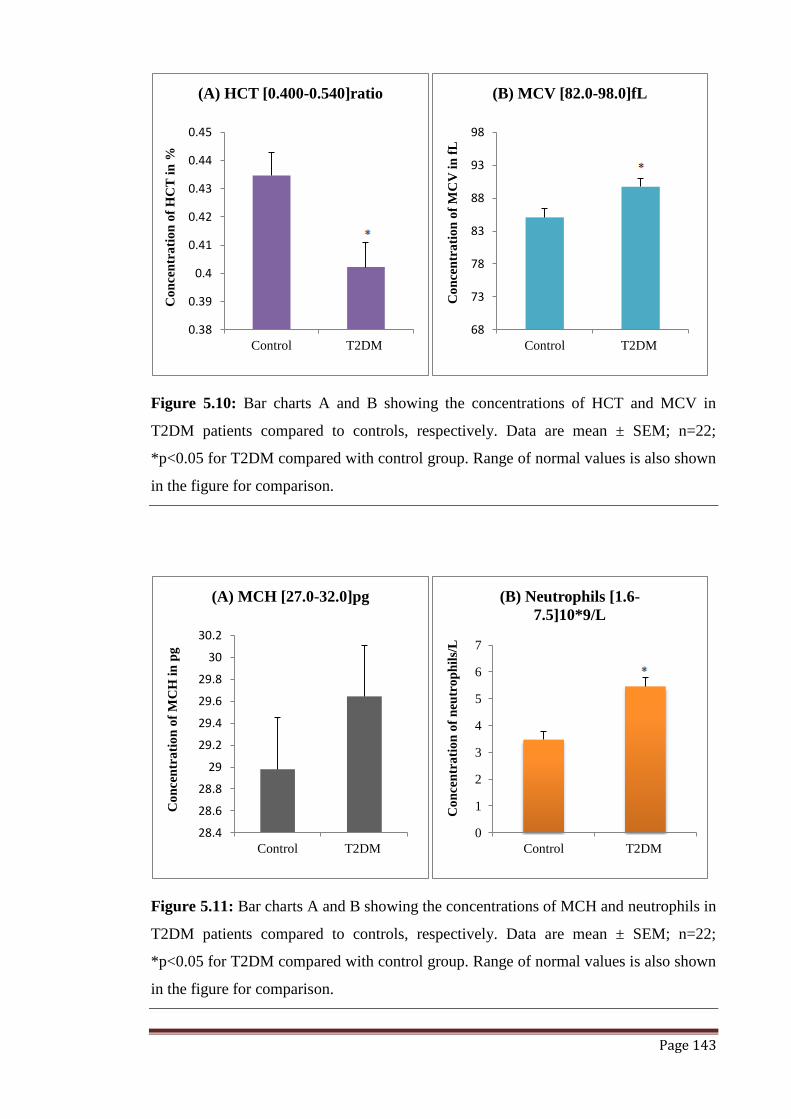
Page 143
Figure 5.10: Bar charts A and B showing the concentrations of HCT and MCV in
T2DM patients compared to controls, respectively. Data are mean ± SEM; n=22;
*p<0.05 for T2DM compared with control group. Range of normal values is also shown
in the figure for comparison.
Figure 5.11: Bar charts A and B showing the concentrations of MCH and neutrophils in
T2DM patients compared to controls, respectively. Data are mean ± SEM; n=22;
*p<0.05 for T2DM compared with control group. Range of normal values is also shown
in the figure for comparison.
0.38
0.39
0.4
0.41
0.42
0.43
0.44
0.45
Control T2DM
Co
nce
ntr
ati
on
of
HC
T i
n %
(A) HCT [0.400-0.540]ratio
68
73
78
83
88
93
98
Control T2DM
Co
nce
ntr
ati
on
of
MC
V i
n f
L
(B) MCV [82.0-98.0]fL
28.4
28.6
28.8
29
29.2
29.4
29.6
29.8
30
30.2
Control T2DM
Co
ncen
tra
tio
n o
f M
CH
in
pg
(A) MCH [27.0-32.0]pg
0
1
2
3
4
5
6
7
Control T2DM
Co
nce
ntr
ati
on
of
neu
tro
ph
ils/
L
(B) Neutrophils [1.6-
7.5]10*9/L

Page 144
Figure 5.12: Bar charts A and B showing the concentrations of lymphocytes and
monocytes in T2DM patients compared to controls, respectively. Data are mean ± SEM;
n=22; *p<0.05 for T2DM compared with control group. Range of normal values is also
shown in the figure for comparison.
Figure 5.13: Bar chart A showing the concentrations of eosinophils in T2DM patients
compared to controls. Data are mean ± SEM; n=22. Note that there was no significant
difference between the values. Range of normal values is also shown in the figure for
comparison.
1.8
1.9
2
2.1
2.2
2.3
2.4
2.5
Control T2DM
Co
nce
ntr
ati
on
of
lym
ph
ocy
tes/
L
(A) Lymphocytes [1.0-
4.0]10*9/L
0
0.1
0.2
0.3
0.4
0.5
0.6
0.7
0.8
Control T2DM
Co
nce
ntr
ati
on
of
mo
no
cyte
s/L
(B) Monocytes [0.2-1.0]10*9/L
0.2
0.21
0.22
0.23
0.24
0.25
0.26
0.27
0.28
Control T2DM
Co
nce
ntr
ati
on
of
Eo
sin
op
hil
s/L
(A) Eosinophils [0.04-
0.44]10*9/L

Page 145
5.4.1.2 Serum Lipid Profile
Analysis of serum lipid profiles included measurements of such parameters as
cholesterol, triglycerides, HDL-C, LDL-C and total cholesterol ratio in both T2DM
patients and healthy controls. The data are shown in figures 5.14-5.16.
Figure 5.14: Bar charts A and B showing the concentrations of cholesterol and
triglyceride in T2DM patients compared to controls, respectively. Data are mean ±
SEM; n=22; *p<0.05 for T2DM compared with control group. Range of normal values
is also shown in the figure for comparison.
0
0.5
1
1.5
2
2.5
3
Control T2DM
Co
nce
ntr
ati
on
of
Tri
gly
ceri
des
in
mm
ol/
L
(B) Triglyceride [<1.71]mmol/L
3.6
3.8
4
4.2
4.4
4.6
4.8
Control T2DM
Co
nce
ntr
ati
on
of
Ch
ole
stero
l in
mm
ol/
L
(A) Cholesterol [<5.2]mmol/L

Page 146
Figure 5.15: Bar chart A showing the concentrations of total cholesterol in T2DM
patients compared to controls. Data are mean ± SEM; n=22; *p<0.05 for T2DM
compared with control group.
Figure 5.16: Bar charts A and B showing the concentrations of HDL cholesterol and
LDL cholesterol in T2DM patients compared to controls, respectively. Data are mean ±
SEM; n=22; *p<0.05 for T2DM compared with control group. Range of normal values
is also shown in the figure for comparison.
3.5
3.6
3.7
3.8
3.9
4
4.1
4.2
4.3
Control T2DM
Co
nce
ntr
ati
on
of
To
tal
Ch
ole
ster
ol
HD
L
rati
o
(A) Total Cholesterol HDL
ratio
0
0.2
0.4
0.6
0.8
1
1.2
1.4
1.6
Control T2DM
Co
nce
ntr
ati
on
of
HD
L C
ho
lest
ero
l in
mm
ol/
L
(A) HDL Cholesterol
[>1.42]mmol/L
0
0.5
1
1.5
2
2.5
3
Control T2DM
Co
nce
ntr
ati
on
of
LD
L C
ho
lest
ero
l in
mm
ol/
L
(B) LDL Cholesterol
[<3.90]mmol/L

Page 147
5.4.1.3 Glucose, CRP and HbA1c
This analysis included measurement of plasma glucose, C-reactive protein and HbA1c
in both T2DM patients and healthy controls. The data are shown in Figures 5.17-5.18.
The results show significant (p<0.05) increases in the levels of glucose, CRP and
HbA1c in plasma of T2DM compared to control.
Figure 5.17: Bar charts A and B showing the concentrations of plasma glucose and
CRP in T2DM patients compared to controls, respectively. Data are mean ± SEM;
n=22; *p<0.05 for T2DM compared with control group. Range of normal values is also
shown in the figure for comparison.
0
2
4
6
8
10
12
14
Control T2DM
Co
nce
ntr
ati
on
of
Pla
sma
Glu
cose
in
mm
ol/
L
(A) Plasma Glucose [3.5-
6.0]mmol/L
0
2
4
6
8
10
12
Control T2DM
Co
nce
ntr
ati
on
of
CR
P i
n m
g/L
(B) CRP [0.5]mg/L
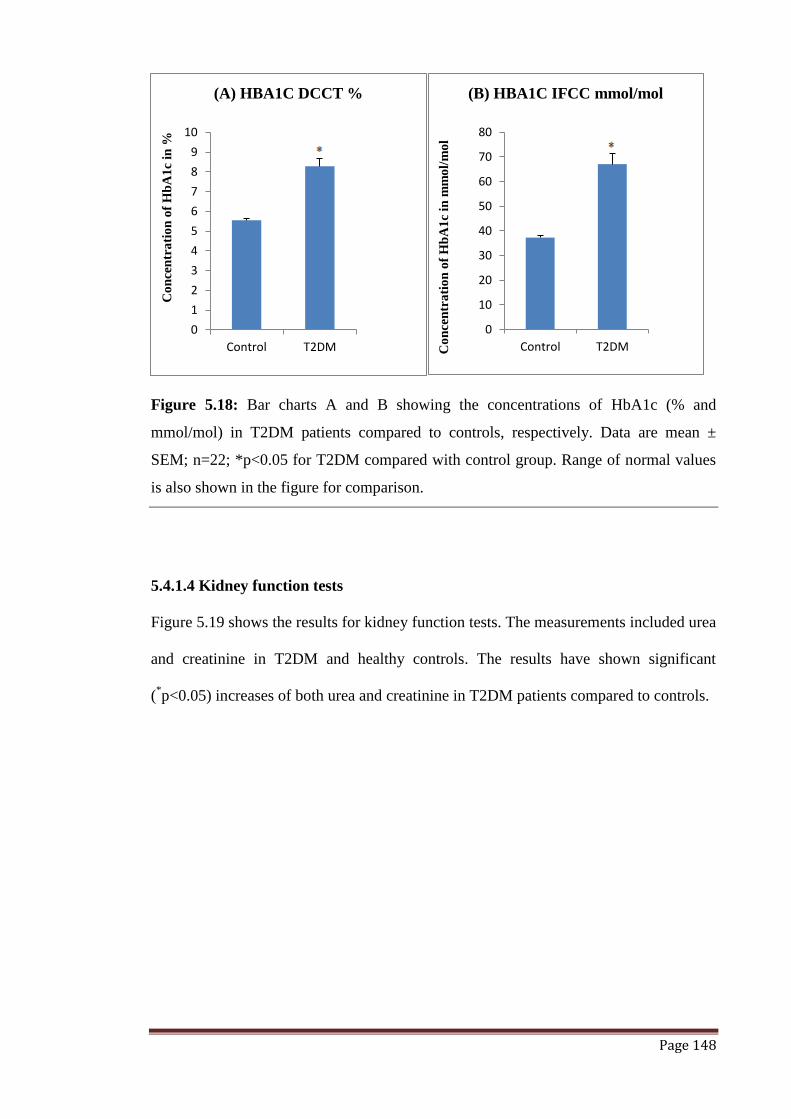
Page 148
Figure 5.18: Bar charts A and B showing the concentrations of HbA1c (% and
mmol/mol) in T2DM patients compared to controls, respectively. Data are mean ±
SEM; n=22; *p<0.05 for T2DM compared with control group. Range of normal values
is also shown in the figure for comparison.
5.4.1.4 Kidney function tests
Figure 5.19 shows the results for kidney function tests. The measurements included urea
and creatinine in T2DM and healthy controls. The results have shown significant
(*p<0.05) increases of both urea and creatinine in T2DM patients compared to controls.
0
1
2
3
4
5
6
7
8
9
10
Control T2DM
Co
nce
ntr
ati
on
of
Hb
A1
c in
%
(A) HBA1C DCCT %
0
10
20
30
40
50
60
70
80
Control T2DMCo
nce
ntr
ati
on
of
Hb
A1
c in
mm
ol/
mo
l
(B) HBA1C IFCC mmol/mol
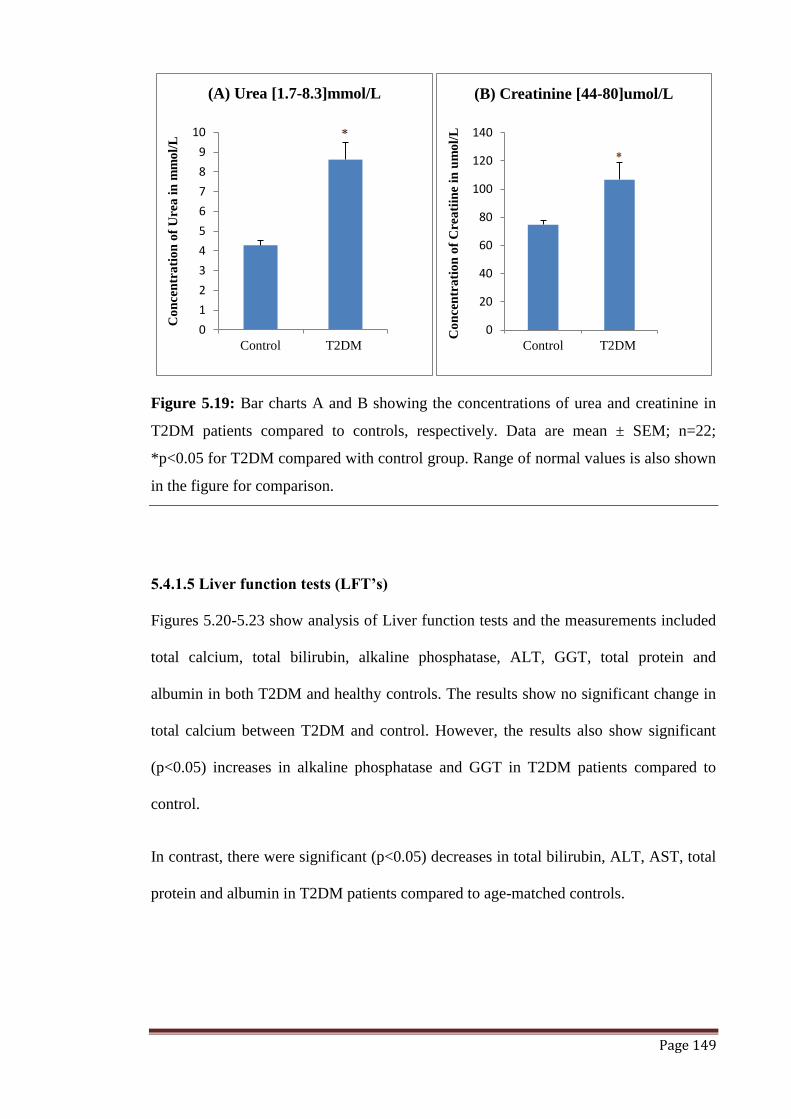
Page 149
Figure 5.19: Bar charts A and B showing the concentrations of urea and creatinine in
T2DM patients compared to controls, respectively. Data are mean ± SEM; n=22;
*p<0.05 for T2DM compared with control group. Range of normal values is also shown
in the figure for comparison.
5.4.1.5 Liver function tests (LFT’s)
Figures 5.20-5.23 show analysis of Liver function tests and the measurements included
total calcium, total bilirubin, alkaline phosphatase, ALT, GGT, total protein and
albumin in both T2DM and healthy controls. The results show no significant change in
total calcium between T2DM and control. However, the results also show significant
(p<0.05) increases in alkaline phosphatase and GGT in T2DM patients compared to
control.
In contrast, there were significant (p<0.05) decreases in total bilirubin, ALT, AST, total
protein and albumin in T2DM patients compared to age-matched controls.
0
1
2
3
4
5
6
7
8
9
10
Control T2DM
Co
nce
ntr
ati
on
of
Ure
a i
n m
mo
l/L
(A) Urea [1.7-8.3]mmol/L
0
20
40
60
80
100
120
140
Control T2DM
Co
nce
ntr
ati
on
of
Cre
ati
ine
in u
mo
l/L
(B) Creatinine [44-80]umol/L

Page 150
Figure 5.20: Bar chart A showing the concentration of total calcium in T2DM patients
compared to controls. Data are mean ± SEM; n=22. Note that there is no significant
difference in the data. Range of normal values is also shown in the figure for
comparison.
Figure 5.21: Bar charts A and B showing the concentrations of total bilirubin and
alkaline phosphatase in T2DM patients compared to controls, respectively. Data are
mean ± SEM; n=22; *p<0.05 for T2DM compared with control group. Range of normal
values is also shown in the figure for comparison.
0
0.5
1
1.5
2
2.5
3
Control T2DM
Con
cen
trati
on
of
Tota
l C
alc
ium
in m
mol/
L
(A) Total Calcium [2.18-
2.63]mmol/L
0
2
4
6
8
10
12
14
Control T2DM
Co
ncen
tra
tio
n o
f T
ota
l B
ilir
ub
in i
n
um
ol/
L
(A) Total Bilirubin [1-
20]umol/L
0
20
40
60
80
100
120
Control T2DM
Co
nce
ntr
ati
on
of
Alk
ali
ne
Ph
osp
ha
tase
in u
/L
(B) Alkaline Phosphatase [30-
130]u/l

Page 151
Figure 5.22: Bar charts A and B showing the concentrations of ALT and GGT in
T2DM patients compared to controls, respectively. Data are mean ± SEM; n=22;
*p<0.05 for T2DM compared with control group. Range of normal values is also shown
in the figure for comparison.
Figure 5.23: Bar charts A and B showing the concentrations of total protein and
albumin of T2DM patients compared to controls, respectively. Data are mean ± SEM;
n=22; *p<0.05 for T2DM compared with control group. Range of normal values is also
shown in the figure for comparison.
0
5
10
15
20
25
30
35
40
45
Control T2DM
Co
nce
ntr
ati
on
of
AL
T i
n U
/L
(A) ALT [1-41]U/L
0
10
20
30
40
50
60
70
80
90
100
Control T2DM
Co
nce
ntr
ati
on
of
GG
T i
n u
/L
(B) GGT [1-42]u/L
71
72
73
74
75
76
77
78
79
80
81
Control T2DMCon
cen
trati
on
of
To
tal P
rote
in i
n
g/L
(A) Total Protein [60-80]g/L
43
44
45
46
47
48
49
50
Control T2DM
Co
nce
ntr
ati
on
of
Alb
um
in i
n g
/L
(B) Albumin [35-55]g/L

Page 152
5.5 Discussion
There is now much evidence that risks for CVD are higher among T2DM patients
compared to age-matched healthy control subjects. Other well-known risk factors
including dyslipidaemia, hypertension, sedentary lifestyle, smoking and obesity add to
this risk. In fact, 75-80% of mortality rate in T2DM patients are due to a combination of
coronary heart disease, peripheral vascular disease and cerebrovascular diseases.
Several research studies have provided evidence that patients with T2DM have several
abnormalities in their blood and lipid profiles including U and E‘s, CRP, HbA1c,
Glucose and various other biochemical parameters (Wilson et al., 2005).
The results of this study have revealed marked and significant elevation in all the
cations (except potassium) in plasma of T2DM patients compared to control. The results
of cationic studies (Table 5.1) provide evidence that there is an alteration in the plasma
concentrations of various cations including sodium, magnesium, calcium, zinc, copper,
and iron in plasma of T2DM patients when compared with healthy age-matched
controls. These interesting findings suggest that perturbations in cationic metabolism in
T2DM are more pronounced and might lead to further complications. Further
exploration of these data may provide fundamental new insights as to whether these
differences are a cause or a consequence of T2DM.
The present results are in total agreement with current evidence regarding the
association of inflammatory markers with the development of metabolic disease, CVD
and causes of mortality (Table 5.2). These prospective results support a possible role for
inflammation in T2DM and they go with the hypothesis that T2DM might possibly be
an expression of ongoing cytokine-mediated acute phase response which is initiated by
the innate system of our body.
Page 153
The present results also show that an elevation of plasma glucose (hyperglycaemia) is
observed in T2DM patients when compared with those without T2DM. Glucose- related
complications such as formation of advanced glycation end-products might be
important in the pathogenesis of diabetic-late complications. In most of the previous
studies, glycaemia and the duration of clinical T2DM did not appear to be very strong
risk factors CHD. However, the reason for this has not been considerably understood.
Elevated WBC count in T2DM patients might contribute to the development of vascular
complications. Chronic inflammation might play a crucial role in the pathogenesis of
CVD in T2DM patients. The close association between WBC and various complications
of T2DM provides evidence that inflammation might be a common linking factor and
consequently documented as a major risk factor for atherosclerosis (DSouza et al.,
2009). Mononuclear leukocytes are recruited to the site of endothelial injury and form
foam cells in the plaque. Inflammatory markers including various cytokines like IL-6,
TNF-α are released from activated leukocytes and cause endothelial dysfunction. An
interaction between various risk factors and inflammatory responses lead to widespread
vascular damage, endothelial dysfunction, and cause complications in T2DM patients.
Further research is required to establish the relation between these factors and
underlying mechanisms of diabetic complications.
Abnormalities in lipid profile might be a result of unbalanced metabolic states of
diabetic patients that include hyperglycaemia and insulin resistance (Haffner, 2000).
Aggressive therapy of diabetic dyslipidemia can reduce the risk of CVD in T2DM
patients. Primary therapy should be directed to lower the levels of LDL. Patients with
T2DM have many lipid abnormalities including elevated levels of Low-density
lipoprotein cholesterol (LDL-C), very low density lipoprotein cholesterol (VLDL-C)
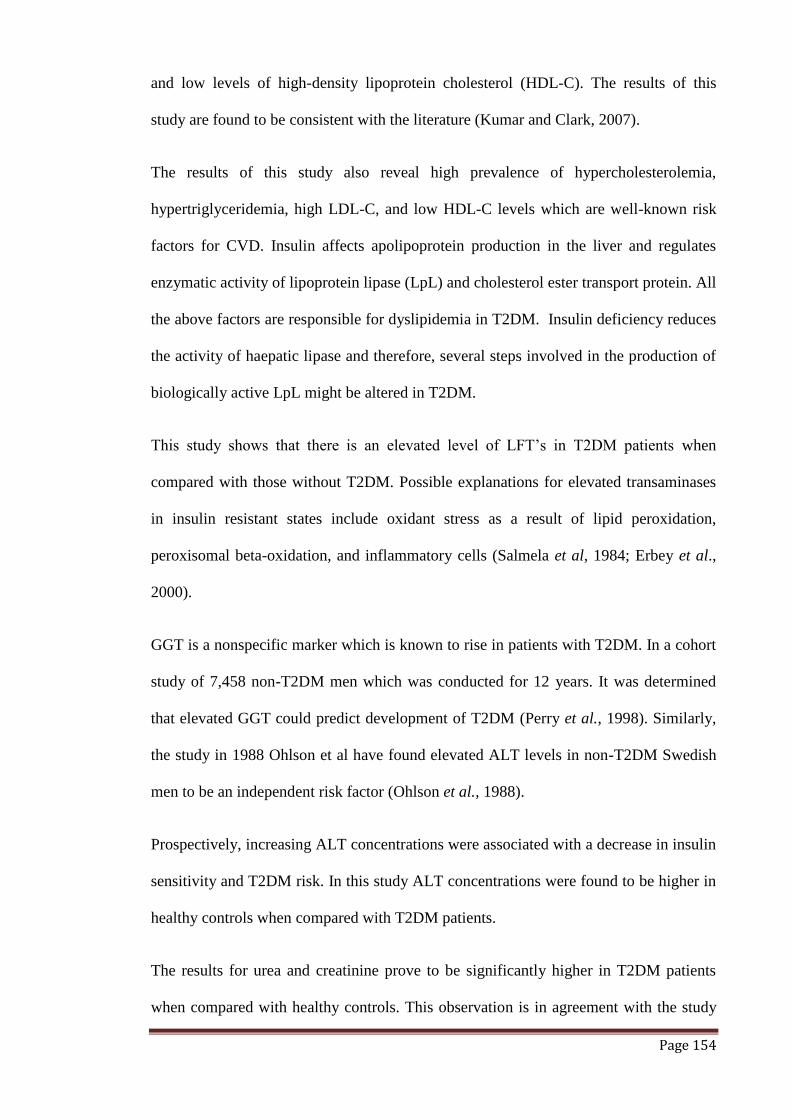
Page 154
and low levels of high-density lipoprotein cholesterol (HDL-C). The results of this
study are found to be consistent with the literature (Kumar and Clark, 2007).
The results of this study also reveal high prevalence of hypercholesterolemia,
hypertriglyceridemia, high LDL-C, and low HDL-C levels which are well-known risk
factors for CVD. Insulin affects apolipoprotein production in the liver and regulates
enzymatic activity of lipoprotein lipase (LpL) and cholesterol ester transport protein. All
the above factors are responsible for dyslipidemia in T2DM. Insulin deficiency reduces
the activity of haepatic lipase and therefore, several steps involved in the production of
biologically active LpL might be altered in T2DM.
This study shows that there is an elevated level of LFT‘s in T2DM patients when
compared with those without T2DM. Possible explanations for elevated transaminases
in insulin resistant states include oxidant stress as a result of lipid peroxidation,
peroxisomal beta-oxidation, and inflammatory cells (Salmela et al, 1984; Erbey et al.,
2000).
GGT is a nonspecific marker which is known to rise in patients with T2DM. In a cohort
study of 7,458 non-T2DM men which was conducted for 12 years. It was determined
that elevated GGT could predict development of T2DM (Perry et al., 1998). Similarly,
the study in 1988 Ohlson et al have found elevated ALT levels in non-T2DM Swedish
men to be an independent risk factor (Ohlson et al., 1988).
Prospectively, increasing ALT concentrations were associated with a decrease in insulin
sensitivity and T2DM risk. In this study ALT concentrations were found to be higher in
healthy controls when compared with T2DM patients.
The results for urea and creatinine prove to be significantly higher in T2DM patients
when compared with healthy controls. This observation is in agreement with the study

Page 155
conducted by Alder et al, 2003 who showed that elevated levels of creatinine and urea
in T2DM patients might signify a pre-renal problem such as volume depletion. In
T2DM patients, impairment of renal function is assessed through measurement of
plasma concentrations of urea and creatinine. Plasma creatinine and urea are established
markers of Glomerular Filtration Rate (GFR). Plasma creatinine is a more sensitive
index of kidney function compared to plasma urea level. Creatinine fulfils most of the
requirements of a perfect filtration marker. Plasma creatinine is also helpful in
recognising when there is a drop in kidney function (Perrone et al., 1992).
Previous studies measuring HbA1c as a predictor of CVD in T2DM patients have been
largely confined to high-risk populations (Peters, 1997). Findings from earlier studies
including Pima Indians, Japanese, and Chinese suggest that in pre-diabetic individuals,
elevated levels of HbA1c predicts the progression to biochemical diabetes as
determined by oral glucose tolerance testing (Little, 1994; Narayan et al., 1996;
Yoshinaga and Kosaka, 1996). Association of HbA1c with incidence of cardiovascular
events is largely attributed to coexistent risk factors. The findings of this particular
study demonstrate the potential prognostic importance of this biomarker in clinical care.
Measurement of CRP, a specific marker of inflammation, is an additional finding in this
study. Levels of CRP have been observed to be significantly higher in T2DM patients
when compared with healthy controls. CRP is a member of the pentraxin family of
oligomeric proteins involved with pattern recognition in innate immunity. The
biological mechanism through which CRP increases the risk of T2DM is not well
understood. CRP is a marker of low-grade inflammation and influences both insulin
resistance and insulin secretion indirectly as a result of heightened systemic
inflammation. Positive association between CRP and T2DM reflects underlying
endothelial dysfunction and sub-clinical atherosclerosis. Studies should be directed at

Page 156
confirming these findings in animal models. It can be concluded that CRP is a risk
marker for cardiovascular disease and could emerge as a mediator in atherogenesis.
5.6 Conclusion
The best approach to prevent potential CVD in T2DM patients is early recognition of
risk factors and aggressive therapy. In this study, it is found that elevated plasma levels
of several biochemical parameters and inflammatory markers were independent
predictors of CVD in T2DM patients. The findings in this study support the hypothesis
that low-grade systemic inflammation is an underlying factor in the pathogenesis of
T2DM and also a common antecedent for both T2DM and CVD. The data from this
particular study also provide further evidence that inflammatory markers might provide
a method for early detection of CVD risk. These data might have many significant
implications for the prevention and treatment of T2DM. Modification of lifestyle habits
and management of systemic inflammation should be the major targets for prevention
and treatment of CVD in T2DM patients. Pharmacological therapies with anti-
inflammatory properties might also play an essential role in T2DM induced CVD.
Healthy diet, regular exercise, yoga and meditation, may also help in both reduction and
prevention of T2DM-induced long term cardiac complications.

Page 157
Chapter 6
Analysis of osmotic fragility and
advanced glycation end-products
(AGEs) in RBC of T2DM patients and
healthy age-matched controls

Page 158
6.1 Objectives of this study
To measure osmotic fragility of RBC, low molecular weight AGEs in seum and anti-
oxidant status in serum of T2DM patients compared to healthy age-matched controls.
6.2 Introduction
Biophysical features of red blood corpuscles (RBCs) play a crucial role in cell
behaviour during blood flow. RBCs determine blood viscosity and blood flow through
processes like cell aggregation and deformation and hence, they maintain effectiveness
of blood circulation and normal physiological conditions in an organism.
In this chapter, the biophysical and biochemical changes of erythrocytes including
osmotic fragility, formation of advanced glycation end-products (AGEs) and anti-
oxidant status in T2DM patients are analysed and compared to healthy age-matched
controls.
In light of these different endogenous results of T2DM patients, this chapter of the
thesis investigated the osmotic fragility of the RBC and low molecular weight AGEs
and anti-oxidant status in serum of T2DM patients compared to healthy age-matched
controls.
6.3 Methods
Materials and methods of this chapter are as described in chapter 2 of the thesis.

Page 159
Table 6.1 Subjects recruited for this study
Healthy controls T2DM
No of subjects 22 22
Age group 30-60 years 30-60 years
Gender 14 Male & 8 Female 12 Male & 10 Female
Diabetic status Non-T2DM T2DM
Treatment - Medication & Insulin
Ethnicity Caucasian & Asian Caucasian & Asian
6.4 Results
6.4.1 Osmotic fragility
Figure 6.1 shows the osmotic fragility curves of RBC in 5 T2DM patients compared
with 5 healthy age -matched controls. The results show that there were increases in
osmotic fragility (haemolysis) in the RBC of all the 5 T2DM patients as compared with
healthy controls with increased concentration of NaCl up to 4.8 mM. Thereafter, the
fragility increased in the RBC as NaCl concentration increased to 10 mM. Median
corpuscular fragility (MCF) is calculated from the graph at which 50% of RBCs were
haemolysed. The MCF in 2 T2DM patients was found to be present between 2.8-3.6 g/L
NaCl concentration and 3 T2DM patients the values were found to be present between
4.8-5.6 g/L NaCl concentration while control remained at 4.4-5.2 g/L NaCl
concentration.
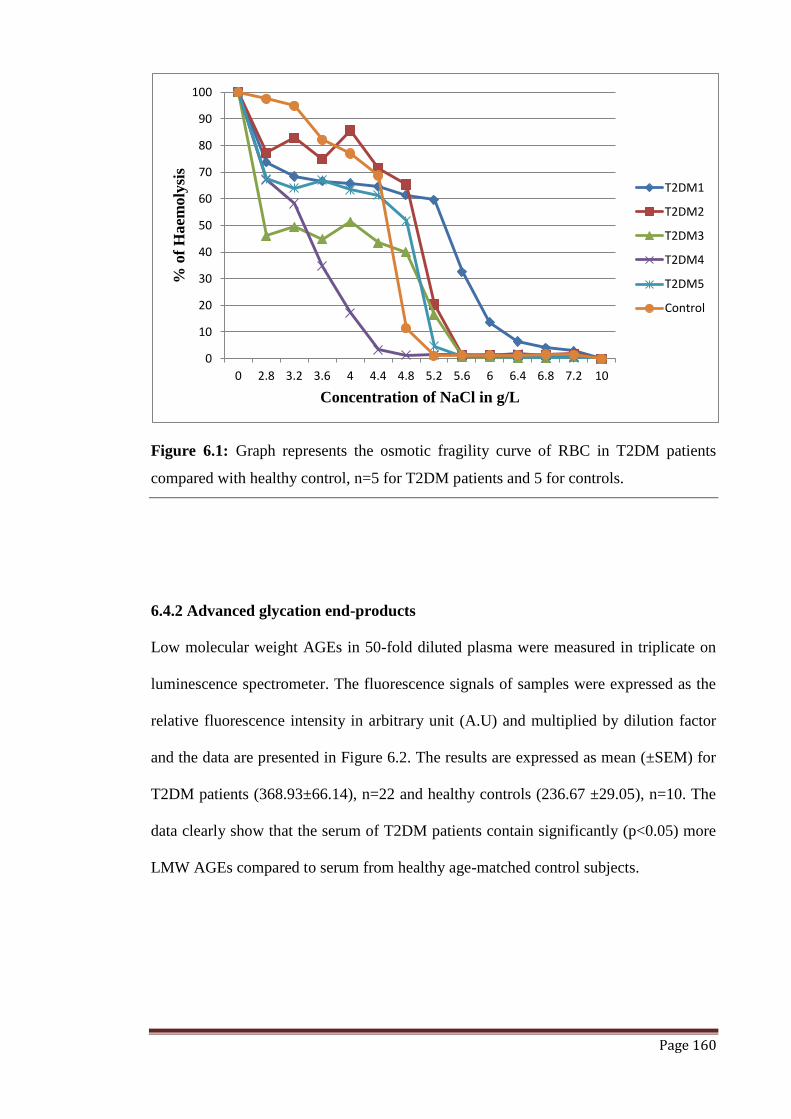
Page 160
Figure 6.1: Graph represents the osmotic fragility curve of RBC in T2DM patients
compared with healthy control, n=5 for T2DM patients and 5 for controls.
6.4.2 Advanced glycation end-products
Low molecular weight AGEs in 50-fold diluted plasma were measured in triplicate on
luminescence spectrometer. The fluorescence signals of samples were expressed as the
relative fluorescence intensity in arbitrary unit (A.U) and multiplied by dilution factor
and the data are presented in Figure 6.2. The results are expressed as mean (±SEM) for
T2DM patients (368.93±66.14), n=22 and healthy controls (236.67 ±29.05), n=10. The
data clearly show that the serum of T2DM patients contain significantly (p<0.05) more
LMW AGEs compared to serum from healthy age-matched control subjects.
0
10
20
30
40
50
60
70
80
90
100
0 2.8 3.2 3.6 4 4.4 4.8 5.2 5.6 6 6.4 6.8 7.2 10
% o
f H
aem
oly
sis
Concentration of NaCl in g/L
T2DM1
T2DM2
T2DM3
T2DM4
T2DM5
Control
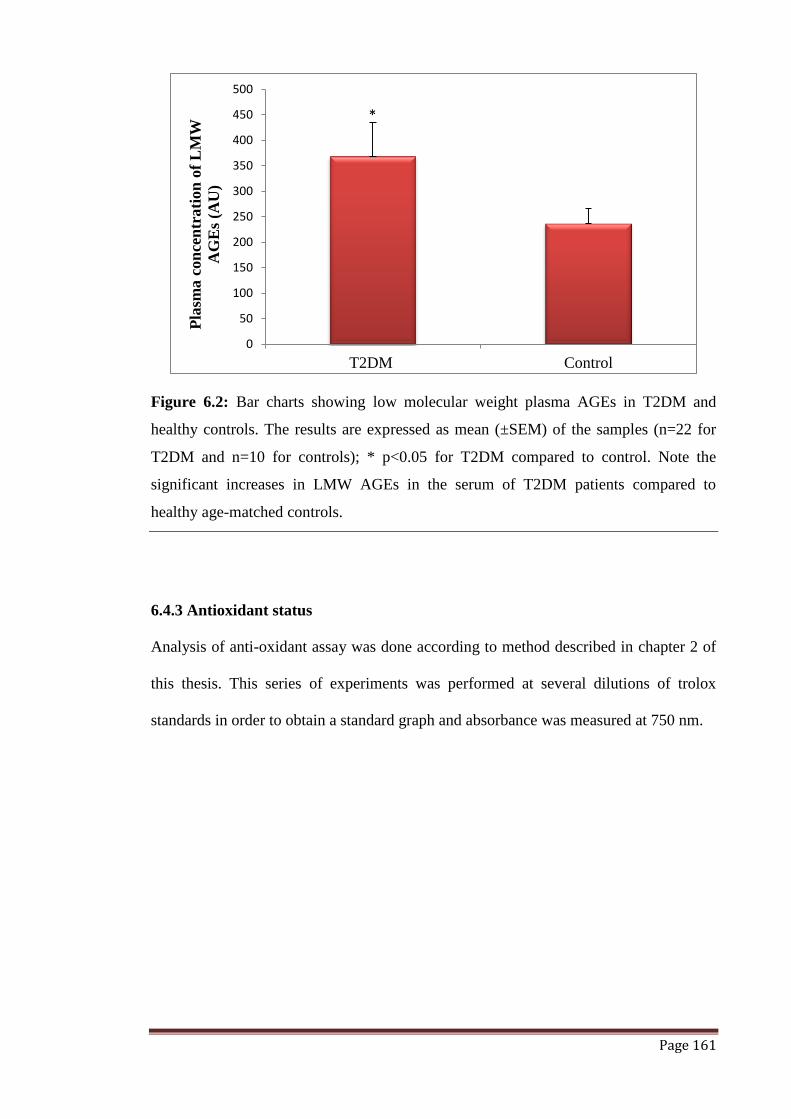
Page 161
Figure 6.2: Bar charts showing low molecular weight plasma AGEs in T2DM and
healthy controls. The results are expressed as mean (±SEM) of the samples (n=22 for
T2DM and n=10 for controls); * p<0.05 for T2DM compared to control. Note the
significant increases in LMW AGEs in the serum of T2DM patients compared to
healthy age-matched controls.
6.4.3 Antioxidant status
Analysis of anti-oxidant assay was done according to method described in chapter 2 of
this thesis. This series of experiments was performed at several dilutions of trolox
standards in order to obtain a standard graph and absorbance was measured at 750 nm.
0
50
100
150
200
250
300
350
400
450
500
T2DM Control
Pla
sma c
on
cen
trati
on
of
LM
W
AG
Es
(AU
)
*

Page 162
Figure 6.3: Standard curve for different concentrations of trolox at absorbance of 750
nm. This curve is typical of 4-5 such different experiments.
The results obtained in this study were not found to be accurate due to several reasons
which might include the dilution of the samples, age of the samples, concentrations of
trolox standards, high or low concentration of anti-oxidants in the samples. However,
there was no significant difference observed in the absorbance readings between T2DM
patients and healthy controls in this particular experiment.
6.5 Discussion
T2DM patients have a higher incidence of CVD compared with non-T2DM individuals.
Atherosclerosis is considered as an inflammatory disease since the presence of humoral
and cellular components of the immune response has been detected within the
atherosclerotic lesion. Increased production of activated leukocyte-derived products
such as ROS, enzymes, and pro-inflammatory mediators contribute to the development
of atherosclerotic process (Ross, 1999; Libby, 2002).
y = -0.0052x + 0.2418 R² = 0.9985
0.2000
0.2050
0.2100
0.2150
0.2200
0.2250
0.2300
0.2350
0.2400
0 1 2 3 4 5 6 7 8
Ab
sorb
an
ce a
t 7
50 n
m
Trolox (mM)

Page 163
The results of RBC membrane fragility experiments in this chapter of the study have
indicated both an increase as well as decrease in the membrane fragility of T2DM
patients when compared with those without T2DM. These reciprocal changes might be
a result of disturbances in ions through the membrane and changes in the properties of
membrane which leads to further changes in metabolic functions. Enhancement of
glycosylation of membrane protein in DM might be one of the possible reasons for
reduced membrane fluidity (Lux et al., 1978). The degree of squeezing of RBCs
depends on the elasticity of their membranes as they have to pass through blood
capillaries of diameters smaller than themselves.
Decreased RBC membrane elasticity, can lead to an increase in blood capillary
resistance for RBC passage to carry out normal metabolism due to which toxicity occurs
in few organs of the body (Ali et al., 2003). However, it is necessary to emphasize the
urgent need for increasing investigations on the pathogenic mechanisms involved in the
process of RBC fragility in order to prevent CVD in T2DM patients.
Several animal and human studies have shown that AGEs have been implicated in the
pathogenesis of long- term complications in T2DM patients (Peppa et al., 2003). AGEs
react with extra cellular proteins and activate production of cytokines and transcription
factors through binding to AGE receptors (Tan et al., 2004). Accumulation of AGEs
predicts future development of cardiovascular complications in T2DM patients.
Experimental evidence to date demonstrates that AGEs can alter the walls of the vessel
through various mechanisms including modifications in permeability of extracellular
matrix, release of inflammatory cytokines and growth factors, alterations of
antithrombotic properties of vascular endothelium along with increased expression of
adhesion molecules and chemokines on vascular cells (Chappey et al., 1997; Singh et
al., 2001).

Page 164
In this study, it was observed that there was an increase in the concentration of low
molecular weight AGEs in T2DM patients when compared with healthy controls.
Therefore, AGEs might constitute a specific target for treatment of CVD in patients
with T2DM. The findings of this study are in agreement with some of the previous
studies which have shown positive associations between plasma AGEs particularly non-
CML AGE, pentosidine, Amadori-albumin and microvascular complications but were
limited in size of their population and cross-sectional designs (Salman et al., 2009;
Miura et al., 2001; Schalkwijk et al., 2002).
Several studies have demonstrated that increased levels of LMW AGEs were associated
with macrovascular disease and suggested that fluorescent AGEs are not independently
associated with presence of diabetic complications in T2DM patients. Other smaller
studies have established an association between fluorescent serum AGEs and CAD in
T2DM.
It is clear that while AGEs appear to be capable of contributing to diabetic
complications individually, advanced glycation is only one pathway by which injury
may be induced in diabetes. LMW AGEs form through the incomplete digestion of
AGE-modified protein and incorporation of AGE modifications. These accumulate in
the circulation of T2DM patients. Indeed, LMW AGEs might have a higher toxic
potential than those of larger AGE-modified proteins and react with AGE-receptors
through circulation (Thomas et al., 2005). Hence, LMW fluorescence could be
considered as a biomarker of measurement of toxic molecules with the ability to
activate specific AGE receptors. Several factors including diet, inflammation, metabolic
acidosis and dialysis modality might affect the levels of circulating AGEs in diabetic
patients (Uribarri et al., 2003).
Page 165
In diabetes, LMW fluorescence is induced as result of hyperglycemia and oxidative
stress, but not exclusively via the Maillard reaction. Drugs that hinder the formation of
AGEs also reduce LMW fluorescence, which suggests a close relation between the two.
LMW fluorescence is elevated in experiment models only within a few weeks of disease
and progressively accumulates in proportion to the duration of diabetes and with normal
aging in control animals (Sharp et al., 2003). LMW fluorescence is also elevated in
patients with diabetes, particularly those with impaired renal function or anemia
(Thomas et al., 2005). These findings provide support for the association between
LMW fluorescence and diabetes. The identification of the molecular source of LMW
fluorescence remains a priority to elucidate the associations demonstrated in this
research.
Increased oxidative stress is observed in a system where the production of free radicals
is higher and anti-oxidant mechanisms are impaired. In recent times, free radicals
produced through oxidative stress have been implicated in the pathology of T2DM
(Irshad and Chaudhuri, 2002; Tian et al., 2005; American Diabetes Association, 2006;
Ashour et al., 1999). The most crucial factor for the increased production of free
radicals is the condition of hypercholesterolemia which might induce damage through
overproduction of superoxide radicals in mitochondria. Lipid peroxidation is initiated
when superoxide is converted into hydro-peroxyls and diffuses through membranes
(Baynes, 2000). The most important risk factors and crucial steps involved in the
pathogenesis of atherosclerosis are hypercholesterolemia and abnormalities in
lipoprotein metabolism (Mallika et al., 2007; Maxfield and Tabas, 2005). In DM,
hyperglycaemia leads to production of oxygen-free radicals through various processes
including auto-oxidation of glucose, non-enzymatic glycosylation of proteins, and
through activation of enzymes that produce oxidant species and subsequently oxidative
stress (Atamer et al., 1998).

Page 166
In conclusion, these preliminary results presented in this study have demonstrated that
oxidative stress can be significantly increased in T2DM patients compared with non-
T2DM controls. These initial experiments could lead to further investigation of anti-
oxidant status in diabetic patients.

Page 167
CHAPTER 7
General discussion and scope for
future studies

Page 168
7.1 General Discussion
Within recent years, there has been an increasing interest in research on inflammation
involving T2DM patients who have developed cardiovascular diseases (CVD) (Kumar
and Clark, 2007). This project was originally designed to investigate the effect of age on
different cardiovascular risk and inflammatory markers in T2DM patients compared to
healthy controls. However, as the project developed and expanded in a logical manner
and it was of paramount importance to measure the parameters associated with T2DM.
Second, it was very difficult to obtain enough samples of blood from different age
groups. It was only possible to measure blood samples from age-matched control and
T2DM patients pooling all the data. Blood was obtained mainly from age-groups 40
years and over in the study compared to the respective age–matched controls.
The results in this study are presented in four different chapters focussing on
measurement of intracellular free Ca2+
concentration [Ca2+
]i in lymphocytes and
neutrophils in blood of T2DM patients compared to healthy controls, an analysis of
RBC membrane proteins, an analysis of haematological and biochemical parameters in
blood and finally measurement of low molecular weight advanced glycation end-
products (LMW-AGEs) in T2DM compared with healthy controls. Collectively, the
results have demonstrated marked and significant changes in all the measured
parameters in this thesis. Therefore, the general discussion of this thesis will be
focussed on the four measured parameters.
The results of Chapter 3 are significant as [Ca2+
]i are found to be affected in T2DM
patients compared to healthy controls. Several previous studies have demonstrated
elevated levels of [Ca2+
]i in cells from diabetic individuals (Levy et al., 1989; Levy et
al., 1994; Takaya et al., 1997). In this study, a decreased response to both fMLP and
thapsigargin was observed in both neutrophils and lymphocytes of T2DM patients when

Page 169
compared with healthy controls in normal calcium conditions. These findings suggest
the presence of an abnormality in cellular calcium homeostasis probably affecting more
than one calcium transport pathways in neutrophils and lymphocytes in blood of T2DM
patients.
The results of this study have demonstrated a significant lower response to both fMLP
and thapsigargin for [Ca2+
]i in neutrophils and lymphocytes of T2DM patients
compared to controls suggesting either a deficit in influx of extracellular calcium across
the plasma membrane or a decrease in the release of calcium from intracellular stores or
both. It is still not clear whether abnormal calcium homeostasis in T2DM is primarily
genetic or metabolic. The findings of this study have indicated a possible role for
Na+/Ca
2+ exchanges in Ca
2+ regulation in neutrophils and lymphocytes and their
modulation in neutrophils and lymphocytes of blood of T2DM patients compared to
controls. The original basis behind cellular Ca2+
shifts in T2DM is not obvious. Genetic
defects involved in the transport of Ca2+
across cell membrane might contribute to alter
cellular Ca2+
homeostasis. Altered Ca2+
homeostasis at both cellular and sub-cellular
levels can cause abnormal insulin secretion, increased vascular resistance, reduced
muscle contraction, reduced enzyme secretion and altered response of vascular smooth
muscle cells to Ca2+
mobilising vasoactive hormones (Fleischhacker et al., 1999; Levy,
1999; Berridge et al., 2000). Other metabolites including free fatty acids, triglycerides
and cholesterol can also affect Ca2+
-ATPase activity (Levy et al., 1994; Levy et al.,
1986).
Evaluation of Ca2+
homeostasis in populations that are genetically susceptible to
development of T2DM should be performed to determine the primary defect of
impairment in [Ca2+
]i regulation. This study is more complicated as there are a number
of similar abnormalities including ageing, hypertension and obesity that are associated
Page 170
with impaired insulin action and insulin resistance (Boris, 1988; Draznin, 1993; Levy &
Gavin, 1995; Orlov et al., 1995). Further studies in future on the molecular and genetic
levels of altered Ca2+
homeostasis in WBC might reveal the initial defect and its genetic
component.
The results presented in Chapter 4 of thesis are either contradictory or very interesting
compared to previous findings. Several workers have found either less or more of the
different RBC membrane proteins in their studies (Petropoulos et al., 2007, Adewoye et
al., 2011). Nevertheless, the result of the present study have clearly demonstrated that
the RBC membrane proteins including spectrin, ankyrin, band 3, band 4.1, and
glycophorin were found to be present in significantly higher concentrations in T2DM
patients when compared with healthy controls. Blood vessel is considered as a major
target organ in T2DM. It is therefore, practical to assume that properties of RBC
membrane might have certain abnormalities during disease progression such as CVD in
T2DM patients (Kahane et al., 1978).
Many studies have demonstrated erythrocyte deformability in several diseases including
T2DM and CVD (Kahane et al., 1978; Saha et al., 2005; Ohno et al., 1985). However,
very little is known about the content and quality of membrane proteins which
contribute to this. SDS-PAGE analysis of RBC membrane proteins from T2DM showed
weaker bands compared to healthy controls. These results suggest that the observed
abnormalities might be a result of reduced erythrocyte membrane deformability which
is associated with T2DM.
RBC membrane proteins perform several functions including maintaining the
membrane integrity, anion exchange, serve as channels for movement of cations,
involved in transport of glucose, carbon dioxide and oxygen and moreover, they confer
blood groupings (Kumar and Clark, 2007). Cytoskeletal proteins are crucial for the

Page 171
maintenance of structure and integrity of the erythrocyte membrane. Thus, defects in
RBC membrane proteins might result in alteration of surface electric charge, and
mechanical properties of the membrane thus affecting erythrocyte rheology (Baba et al.,
1979; Petropoulos et al., 2007).
There is increasing evidence regarding association of haemorheological abnormalities in
T2DM patients leading to increased aggregation, endothelial damage, and capillary
closure (Adak et al., 2008). These results are consistent with findings by Schwartz et al
(1991) who demonstrated oxidation of spectrin in diabetic erythrocytes (Schwartz et al.,
1991). A study by Adewoye et al., (2001) showed the absence of spectrin in RBC of
T2DM patients and increased ankyrin and band-6 in both T1DM and T2DM patients
(Adewoye et al., 2011; Kaymaz et al., (2005) showed weaker actin and the absence of
band 4.5 and band 4.9 in diabetic cats (Kaymaz et al., 2005). Several possible
interpretations/explanations can be drawn to these alterations in RBC proteins of T2DM
patients. These include ageing of erythrocytes in diabetes (Mazzanti et al., 1992), the
relation of AGEs with macrophages (Vlassara et al., 1987) and increased susceptibility
of membrane proteins to lysis by endogenous enzymes in diabetes (Gaczynska et al.,
1993; Graham Lloyd, 1984).
Therefore, it can be hypothesised that detection of such alterations in RBC membrane
proteins of T2DM patients might contribute to the development of CVD and that the
results of this study might serve as a blood marker for the existence of CVD risk in
T2DM patients.
In chapter 5, the results show that markers of inflammation in T2DM patients were
clearly elevated when compared with healthy controls. This study has also shown a
significant increase in several other factors in T2DM patients when compared with
healthy controls. These findings support the hypothesis that low-grade systemic

Page 172
inflammation is an underlying factor in the pathogenesis of T2DM. Furthermore, these
findings might have important implications for the prevention and treatment of T2DM
(Libby et al., 2002; Festa et al., 2003; Zozulinska and Wierusz, 2006). Recently, C-
reactive protein has emerged as an important independent predictor of CVD in both men
and women (Ridker et al., 1997; Ridker et al., 2000). It is observed to be present in
higher levels in diabetic subjects when compared with non-diabetic control subjects
which suggests that inflammation might contribute to accelerated atherosclerosis in
diabetes (Ford, 1999).
Recent cross sectional data have also established that elevated levels of CRP are
associated with obesity, insulin resistance and glucose intolerance. CRP is a marker of
low-grade inflammation and it is involved both in insulin secretion and resistance
through altered innate immune response due to heightened systemic inflammation
(Pradhan et al., 2001; Pickup, 2004). Diabetic vascular complications induce tissue
injuries which stimulate cytokine secretions from cells like macrophages and
endothelium. The biological mechanisms behind this are not very well understood
(Pickup et al., 1997; Pickup and Crook, 1998). In this study, it was observed that there
was a higher level of HbA1c in T2DM patients when compared with healthy controls
which suggests hyperglycaemia.
High increase in triglyceride level was observed in T2DM patients when compared with
healthy controls, which is a common feature of DM. Several research studies have
suggested that this is due to an inhibition of lipolysis as a result of reduced action of
insulin on adipocytes. This in turn leads to great increase in non-esterified fatty acids
due to reduced hydrolysis of stored triglycerides. Increased triglycerides and LDL levels
are risk factors for CVD (Garber, 2000; Nesto, 2008).
Page 173
Impairment of renal function was observed in T2DM patients, which was assessed by
the measurement of plasma concentrations of creatinine and urea in both T2DM and
healthy controls. The results of this study were consistent with reports of several other
workers (Alder 2003; Judykay 2007; Wagle 2010). Plasma creatinine and urea are
recognized markers of Glomerular Filtration Rate (GFR) and in nephropathy, it is
suggested that high levels of creatinine which is observed in diabetic patients might be
due to impairment in the function of nephrons. It is well known that one long term
complication of T2DM is nephropathy (Kumar and Clark, 2007). Similarly, high levels
of urea could be a result of reduced filtering capacity of kidneys which leads to
accumulation of waste products within the system of T2DM patients. Hyperuricemia is
commonly associated with DM, obesity, hypertension and in the development of CAD
(Kelley & Palella, 1991; Madsen et al., 2005; Short et al., 2005).
Plasma glucose was found to be significantly higher in T2DM patients compared with
healthy controls. One of the earlier studies showed that a higher concentration of
glucose was observed in T2DM patients when compared with non-diabetic controls
(D'Souza et al., 2009; Wagle, 2010). Increased liver function test (LFT) abnormalities
were observed in this study in T2DM patients compared to controls. There was a higher
incidence of LFT abnormalities in T2DM patients when compared with healthy
controls. One of the most common marker, is elevated levels of ALT, a gluconeogenic
enzyme which specifies impairment of insulin signalling rather than merely hepatocyte
injury (O'Brien and Granner, 1991). Chronic elevations of transaminases in T2DM
patients reflect underlying insulin resistance.
Levels of trace elements and cations were observed to be higher in T2DM patients
compared with healthy controls. Cations and trace elements are required especially for
the maintenance of healthy metabolism in the body and either the lack or excess of these

Page 174
elements can lead to numerous diseases in the body (Kumar and Clark, 2007). The
results of this study have shown that the levels of various cations including calcium,
magnesium, zinc, copper, and sodium were significantly elevated in T2DM patients
compared to controls. These findings are in agreement with previous studies which
support alteration of these cationic levels in T2DM patients when compared with
healthy controls (Kazi et al., 2008; Mahmoud et al., 2008). The results of Zn levels in
the present study are consistent with the findings of Mateo et al (1975) who showed that
levels of Zn are equal or higher in diabetic patients compared to that of controls which
might be due to heterogenecity of patients (Mateo et al., 1975; Melchior et al., 1989;
Zargar et al., 1998). Various studied have shown similar results that diabetic patients
have higher plasma levels of Zn (Golik et al., 1993; Rohn et al., 1993; Ruiz et al., 1998;
Zargar et al., 1998). Plasma Zn varies according to metabolic status and hormonal
changes and hence it is a poor indicator of zinc status. Hyperzincuria is consistent with
other studies and has been associated with hyperglycaemia (Ekmekcioglu et al., 2001).
The results of Cu levels are consistent with those reported by Noto et al., (1984) who
showed high levels of Cu in older subjects (Noto et al., 1984). These results also
support the findings by Walter et al., 1991 and Zargar et al., 1998 who demonstrated
high levels of Cu in diabetic women on oral contraceptives and with retinopathy and
hypertension (Walter et al., 1991; Zargar et al., 1998). Increased concentration of Cu is
associated with several disorders related to structure of arterial walls, stress, infection
and diabetes mellitus (Beshgetoor and Hambidge, 1998).
The results of Mg levels are inconsistent with those findings of several other research
studies which demonstrated that plasma levels of Mg are lower in diabetic patients than
controls Mg levels are observed to be higher in T2DM patients compared with healthy

Page 175
controls in this particular study which are consistent with other studies that already have
been published (Fujii et al., 1982; McNair et al., 1978; Sjögren et al., 1988).
The results of iron levels are consistent with those of other research studies. DM is
associated with altered iron homeostasis in both human and animal models. Iron serves
as a catalyst for lipid and protein oxidation and it is involved in generation of reactive
oxygen species. It also contributes to diabetic nephropathy. Excessive iron is also
implicated in the pathogenesis of T2DM and its complications (Thomas et al., 2004).
Even though the data of this study are observed to be consistent with those of other
research studies, it is very important to obtain more quantitative data from larger groups
in order to fully elucidate the relationship between T2DM and various cations in the
body. Analyses could also be performed between various cations in plasma and
compare their levels in cells including erythrocytes and lymphocytes.
Levels of total protein were observed to be lower in T2DM patients when compared
with healthy controls which are characteristic of nephrotic syndrome that occurs due to
long standing diabetes and is also the primary indication for dialysis. One of the
common causes of hypoproteinemia is excessive protein discharge in urine (Hanoune et
al., 1972; Ahmed, 2010).
The results presented in Chapter 6 of this study have shown an increased level of low
molecular weight AGEs in plasma of T2DM patients when compared with healthy
controls. Incomplete digestion of AGEs-modified protein can result in the formation of
low-molecular weight AGEs. These LMW-AGEs have a high toxic potential and LMW
fluorescence increases with duration of disease which appears to be higher in patients
with T2DM. LMW fluorescence is a marker of tissue fluorescence which is induced in
DM due to a result of hyperglycaemia and oxidative stress, but not only because of

Page 176
Maillard‘s reaction (Ahmed, 2005; Ahmed and Thornalley, 2007; DSouza et al., 2009;
Ahmed, 2010). Excessive accumulation of AGEs underlies various complications in
patients including diabetic neuropathy, nephropathy, vasculopathy and retinopathy
(Peppa et al., 2003; Ahmed, 2005). AGEs have been implicated in the initiation and
progression of CVD (Thomas et al., 2005; DSouza et al., 2009). LMW-AGEs can
predict mortality in patients receiving chronic haemodialysis. (Roberts et al., 2006).
Therefore, the possible involvement of LMW-AGEs in the mechanisms leading to
atherosclerosis and inflammation in T2DM patients may need further investigation.
The main findings of this study show that individual risk factors for both T2DM and
CVD provide a common soil for the development of either of them or both. This study
supports a positive association between various markers and T2DM and moreover, it
supports the hypothesis that inflammation is closely involved in the pathogenesis of
T2DM. Clearly, T2DM is more than a risk factor for CVD in T2DM patients. The
elevated levels of various risk factors and blood borne markers in T2DM patients lead
to development of CVD. Further studies are needed to establish pathophysiological
relationship between inflammation and T2DM.
7.2 Conclusion
This study was originally designed to investigate how T2DM can lead to CVD and
subsequent to morbidity and mortality of the patients compared to healthy age-matched
controls. In doing so, the project employed blood to measure a number of biochemical
markers and mediators including cations in plasma, intracellular free calcium
concentrations in WBC, osmotic fragility of RBC and proteins in RBC membrane
which are associated with the development of T2DM. The results show that
inflammation is very strongly associated with micro-vascular complications and CVD
in diabetes. Measurement of these inflammatory markers in T2DM patients is very

Page 177
important for risk assessment of diabetic complications. Prevalence of T2DM is
increasing worldwide. There is also an increase in the number of people with CVD
among T2DM patients. In order to prevent and to reduce the incidence of
cardiovascular morbidity and mortality in high-risk diabetic patients, it is imperative to
emphasize on routine measurements of these blood borne biochemical markers and
mediators. Although this appears to be a challenging task, strict screening for an
underlying sub-clinical CVD and aggressive prevention programmes would possibly
achieve the target in T2DM patients.
7.3 Limitations
There are several limitations for this study. The sample size of this study could have
been larger in terms of T2DM patients and healthy controls in all chapters. T2DM
patients with diabetic complications including diabetic retinopathy, neuropathy, and
nephropathy could also have been included in this study. Measurement of [Ca2+
]i could
also have been performed in platelets of T2DM patients and controls.
7.4 Scope for future studies
Future studies can involve the measurement of [Ca2+
]i in different blood cells
including basophils, eosinophils and platelets of both T1DM and T2DM patients
and compare them with healthy controls. In addition, it is also important to
characterize the different transporters which are associated with cellular Ca2+
homeostasis using specific agents.
Studies can also include the measurement of biochemical parameters and more
inflammatory markers in large population groups and comparison can be done
with various other populations. These include both T1DM and T2DM patients
and diabetic patients who suffer from heart failure, coronary heart disease,
Page 178
hypertension, arrhythmias, nephropathy, retinopathy and neuropathy compared
to controls.
Further studies can involve an investigation of age-related changes on various
measured biochemical parameters concentrating more on different age-group (eg
15-39, 40-59, 60 and above) taking also into account factors like gender and
ethnicity.
A study of how chronic T1DM and T2DM affect blood vessels and heart at both
cellular and sub-cellular levels including development of hypertrophy and
fibrosis could be performed. This will involve the use of animal models for both
T1DM and T2DM to analyse fibrosis, remodelling and contraction.

Page 179
References

Page 180
References
American Diabetes Association (2004). Diagnosis and Classification of Diabetes
Mellitus. Diabetes Care 27, s5-s10.
Adewoye EO, Akinlade KS, & Olorunsogo OO (2011). Erythrocyte membrane protein
alteration in diabetics. East Afr Med J 78, 438-440.
Adler AI, Stevens RJ, Manley SE, Bilous RW, Cull CA, & Holman RR (2003).
Development and progression of nephropathy in type 2 diabetes: The United Kingdom
Prospective Diabetes Study (UKPDS 64). Kidney Int 63, 225-232.
Adrogue HJ & Madias NE (2007). Sodium and Potassium in the Pathogenesis of
Hypertension. New England Journal of Medicine 356, 1966-1978.
Advani A, Marshall SM, & Thomas TH (2002). Impaired neutrophil actin assembly
causes persistent CD11b expression and reduced primary granule exocytosis in Type 2
diabetes. Diabetologia 45, 719-727.
Aggett PJ (1985). Physiology and metabolism of essential trace elements: An outline.
Clinics in Endocrinology and Metabolism 14, 513-543.
Ahmed N & Thornalley PJ (2007). Advanced glycation endproducts: what is their
relevance to diabetic complications? Diabetes, Obesity and Metabolism 9, 233-245.
Ahmed N (2005). Advanced glycation endproducts-role in pathology of diabetic
complications. Diabetes Research and Clinical Practice 67, 3-21.
Ahmed N (2010). Chemical Biochemistry, IBMS, Oxford University, pp. 341.
Albelda SM, Smith CW, & Ward PA (1994). Adhesion molecules and inflammatory
injury. The FASEB Journal 8, 504-512.
Alberti G, Zimmet P, Shaw J, Bloomgarden Z, Kaufman F, & Silink M (2004). Type 2
Diabetes in the Young: The Evolving Epidemic. Diabetes Care 27, 1798-1811.
Alexiewicz JM, Kumar D, Smogorzewski M, Klin M, & Massry SG (1995).
Polymorphonuclear leukocytes in non-insulin-dependent diabetes mellitus:
abnormalities in metabolism and function. Ann Intern Med 123, 919-924.

Page 181
Ali FM, Mohamed S, & Mohamed MR (2003). Effect of 50 Hz, 0.2 mT magnetic fields
on RBC properties and heart functions of albino rats. Bioelectromagnetics.
Bioelectromagnetics 24, 535-545.
Allbritton NL, Meyer T, & Stryer L (1992). Range of messenger action of calcium ion
and inositol 1,4,5-trisphosphate. Science 258, 1812-1815.
Almoznino-Sarafian D, Shteinshnaider M, Tzur I, Bar-Chaim A, Iskhakov E, Berman S,
Efrati S, Modai D, Cohen N, & Gorelik O (2010). Anemia in diabetic patients at an
internal medicine ward: Clinical correlates and prognostic significance. European
Journal of Internal Medicine 21, 91-96.
Al-Ozairi E, Middelbeek R, & Horton E (2006). Cardiovascular risk assessment in type
2 diabetes mellitus. Current Diabetes Reports 6, 333-336.
Alteraifi AM & Zhelev DV (1997). Transient increase of free cytosolic calcium during
neutrophil motility responses. J Cell Sci 110, 1967-1977.
Altura BM & Altura BT (1991). Cardiovascular risk factors and magnesium:
relationships to atherosclerosis, ischemic heart disease and hypertension. Magnesium
Trace Elem 10, 182-192.
Alvarez J, Montero M, & Garcia-Sancho J (1992). Cytochrome P450 may regulate
plasma membrane Ca2+
permeability according to the filling state of the intracellular
Ca2+
stores. FASEB J 6, 786-792.
American Diabetes Association (2006). Standards of Medical Care in Diabetes - 2006,
29 ed., pp. s4-s42.
Anan F, Masaki T, Umeno Y, Yonemochi H, Eshima N, Saikawa T, & Yoshimatsu H
(2007). Correlations between homocysteine levels and atherosclerosis in Japanese type
2 diabetic patients. Metabolism 56, 1390-1395.
Andrews NC (1999). Disorders of Iron Metabolism. New England Journal of Medicine
341, 1986-1995.
Ann L (1993). Molecular medicine: Making calcium signals selective. The Lancet 341,
1248.
Antony G (1994). Cyclic ADP-ribose, the ADP-ribosyl cyclase pathway and calcium
signalling. Molecular and Cellular Endocrinology 98, 125-131.

Page 182
Arai K, Iizuka S, Tada Y, Oikawa K, & Taniguchi N (1987). Increase in the
glycosylated form of erythrocyte Cu-Zn-SOD in diabetes and the close association of
non-enzymatic glycosylation with enzyme activity. Biochim Biophys Acta 924, 292-
296.
Aronne LJ & Segal KR (2002). Adiposity and Fat Distribution Outcome Measures:
Assessment and Clinical Implications. Obesity 10, 14S-21S.
Ashour M, Salem S, Hassaneen H, EL-Gadban H, Elwan N, Awad A, & Basu TK
(1999). Antioxidant status and insulin dependent diabetes mellitus (IDDM). J Clin
Biochem Nutr 26, 99-107.
Atamer Y, Kocyigit Y, Atamer A, Mete N, Canoruc N, & Toprak G (1998). Alterations
of erythrocyte and plasma lipid peroxides as well as antioxidant mechanism in patients
with type II diabetes mellitus (NIDDM). Tr J Med Sci 28, 143-148.
Babu N & Singh M (2004). Influence of hyperglycemia on aggregation, deformability
and shape parameters of erythrocytes. Clinical Hemorheology and Microcirculation 31,
273-280.
Bailey CJ & Day C (1989). "Traditional plant medicines as treatments for diabetes,".
Diabetes Care 12, 553-564.
Barbetti F (1996). Pathophysiology of non-insulin-dependent diabetes and the search for
candidate genes: dangerous liaisons? Acta Diabetologica 33, 257-262.
Barnett AH (2005). Some recent advances in non-communicable diseases in the tropics
: 2. Diabetes mellitus in the tropics. Transactions of the Royal Society of Tropical
Medicine and Hygiene 85, 327-331.
Barter PJ, Nicholls S, Rye KA, Anantharamaiah GM, Navab M, & Fogelman AM
(2004). Antiinflammatory Properties of HDL. Circ Res 95, 764-772.
Baynes JW & Thorpe SR (2000). Glycoxidation and lipoxidation in atherogenesis. Free
Radical Biology and Medicine 28, 1708-1716.
Beard JL (2001). Iron Biology in Immune Function, Muscle Metabolism and Neuronal
Functioning. The Journal of Nutrition 131, 568S-580S.
Beckman JA, Creager MA, & Libby P (2002). Diabetes and Atherosclerosis. JAMA:
The Journal of the American Medical Association 287, 2570-2581.

Page 183
Bengtsson T, Stendahl O, & Andersson T (1986). The role of the cytosolic free Ca2+
transient for fMet-Leu-Phe induced actin polymerization in human neutrophils. Eur J
Cell Biol 42, 338-343.
Beretta-Piccoli C & Weidmann P (1982). Body sodium-blood volume state in
nonazotemic diabetes mellitus. Miner Electrolyte Metab 7, 36-47.
Berliner JA, Navab M, Fogelman AM, Frank JS, Demer LL, Edwards PA, Watson AD,
& Lusis AJ (1995). Atherosclerosis: Basic Mechanisms : Oxidation, Inflammation, and
Genetics. Circulation 91, 2488-2496.
Berliner S, Rogowski O, Rotstein R, Fusman R, Shapira I, & Bornstein NM (2000).
Activated polymorphonuclear leukocytes and monocytes in the peripheral blood of
patients with ischemic heart and brain conditions correspond to the presence of multiple
risk factors for atherothrombosis. Cardiology 94, 19-25.
Berridge MJ (1993). Inositol trisphosphate and calcium signalling. Nature 361, 315-
325.
Berridge MJ (1994). The biology and medicine of calcium signalling. Molecular and
Cellular Endocrinology 98, 119-124.
Berridge MJ (1995). Capacitative calcium entry. Biochem J 312, 1-11.
Berridge MJ, Lipp P, & Bootman MD (2000). The versatility and universality of
calcium signalling. Nat Rev Mol Cell Biol 1, 11-21.
Beshgetoor D & Hambidge M (1998). Clinical conditions altering copper metabolism in
humans. The American Journal of Clinical Nutrition 67, 1017S-1021S.
Bibbins-Domingo K, Chertow GM, Coxson PG, Moran A, Lightwood JM, Pletcher MJ,
& Goldman L (2010). Projected Effect of Dietary Salt Reductions on Future
Cardiovascular Disease. New England Journal of Medicine 362, 590-599.
Bierhaus A, Chevion S, Chevion M, Hofmann M, Quehenberger P, Illmer T, Luther T,
Berentshtein E, Tritschler H, Muller M, Wahl P, Ziegler R, & Nawroth PP (1997).
Advanced glycation end product-induced activation of NF-kappaB is suppressed by
alpha-lipoic acid in cultured endothelial cells. Diabetes 46, 1481-1490.
Bierman EL (1992). Atherogenesis in diabetes. Arterioscler Thromb 12, 647-656.

Page 184
Blake GJ (2004). Haemoglobin a1c level and future cardiovascular events among
women. Archives of Internal Medicine 164, 757-761.
Boris D (1988). Intracellular calcium, insulin secretion, and action. The American
Journal of Medicine 85, 44-58.
Chauhan G, Spurgeon J C, Tabassum R, Bhaskar S, Kulkarni R S, Mahajan A, Chavali
S, Kranthi Kumar M V, Prakash S, Dwivedi O P, Ghosh S, Yajnik C S, Tandon N,
Bharadwaj D, Chandak G R (2010). Impact of Common Variants of PPARG, KCNJ11,
TCF7L2, SLC30A8, HHEX, CDKN2A, IGF2BP2, and CDKAL1 on the Risk of Type 2
Diabetes in 5,164 Indians. Diabetes 59:2068–2074.
Clausen T, Elbrink J, Martin BR (1974). Insulin controlling calcium distribution in
muscle and fat cells. Acta Endocrinol 77, 137-143.
Cohn JN (2004). Introduction to Surrogate Markers. Circulation 109, IV-20.
Colditz GA, Willett WC, Stampfer MJ, Manson JE, Hennekens CH, Arky RA, &
Speizer FE (1990). Weight as a risk factor for clinical diabetes in women. Am J
Epidemiol 132, 501-513.
Cook JT, Page RC, Levy JC, Hammersley MS, Walravens EK, Turner RC (1993).
Hyperglycaemic progression in subjects with impaired glucose tolerance: association
with decline in beta cell function. Diabetes Research Laboratories, Radcliffe Infirmary,
Oxford, UK. Diabet Med 10, 321-326.
Cook VV & Hurley JS (1998). Prevention of Type 2 Diabetes in Childhood. Clinical
Pediatrics 37, 123-129.
Cornelius CC, Joseph MM, Don GB, & Ferriss JB (1998). Plasma homocysteine
concentrations in patients with type 1 diabetes. Diabetes Care 21, 1843.
Cornwell TL, Arnold E, Boerth NJ, & Lincoln TM (1994). Inhibition of smooth muscle
cell growth by nitric oxide and activation of cAMP-dependent protein kinase by cGMP.
Am J Physiol Cell Physiol 267, C1405-C1413.
Cronin CC, McPartlin JM, Barry DG, Ferriss JB, Scott JM, & Weir DG (1998). Plasma
homocysteine concentrations in patients with type 1 diabetes. Diabetes Care 21, 1843-
1847.
Page 185
Cunningham JJ, Aizhong F, Mearkle PL, & Glenn Brown R (1994). Hyperzincuria in
individuals with insulin-dependent diabetes mellitus: Concurrent zinc status and the
effect of high-dose zinc supplementation. Metabolism 43, 1558-1562.
Dabelea D (2007). The Predisposition to Obesity and Diabetes in Offspring of Diabetic
Mothers. Diabetes Care 30, S169-S174.
Danesh J, Collins R, & Peto R (2000). Lipoprotein(a) and Coronary Heart Disease :
Meta-Analysis of Prospective Studies. Circulation 102, 1082-1085.
Danesh J, Wheeler JG, Hirschfield GM, Eda S, Eiriksdottir G, Rumley A, Lowe GDO,
Pepys MB, & Gudnason V (2004). C-Reactive Protein and Other Circulating Markers
of Inflammation in the Prediction of Coronary Heart Disease. New England Journal of
Medicine 350, 1387-1397.
de Windt LJ, Cox K, Hofstra L, & Doevendans PA (2002). Molecular and genetic
aspects of cardiac fatty acid homeostasis in health and disease. Eur Heart J 23, 774-787.
Deckert T, Poulsen JE, & Larsen M (1978). Prognosis of diabetics with diabetes onset
before the age of 31. Diabetologia 14, 363-370.
DeFronzo RA (2006). Is insulin resistance atherogenic? Possible mechanisms.
Atherosclerosis Supplements 7, 11-15.
Dehghan A, Kardys I, de Maat MPM, Uitterlinden AG, Sijbrands EJG, Bootsma AH,
Stijnen T, Hofman A, Schram MT, & Witteman JCM (2007). Genetic Variation, C-
Reactive Protein Levels, and Incidence of Diabetes. Diabetes 56, 872-878.
Delaunay J (2007). The molecular basis of hereditary red cell membrane disorders.
Blood Reviews 21, 1-20.
Despres JP, Lemieux I, & Prud'homme D (2001). Treatment of obesity: need to focus
on high risk abdominally obese patients. BMJ 322, 716-720.
Diamanti-Kandarakis E, Piperi C, & Nicolopoulou-Stamati P (2007). Advanced
Glycation End Products in Polycystic Ovarian Syndrome. Reproductive Health and the
Environment., eds. Nicolopoulou-Stamati P, Hens L, & Howard CV, pp. 119-140.
Springer Netherlands.
Ding W, Chai Z, Duan P, Feng W, & Qian Q (1998). Serum and urine chromium
concentrations in elderly diabetics. Biological Trace Element Research 63, 231-237.

Page 186
Draznin B (1993). Cytosolic calcium and insulin resistance. Am J Kidney diseases 21,
32-38.
Draznin B, Lewis D, Houlder N, Sherman N, Adamo M, & Sussman K (1989).
Mechanism of insulin resistance induced by sustained levels of cytosolic free calcium in
rat adipocytes. Endocrinology 125, 2341-2349.
Draznin B, Sussman K, Kao M, Lewis D, & Sherman N (1987). The existence of an
optimal range of cytosolic free calcium for insulin-stimulated glucose transport in rat
adipocytes. J Biol Chem 262, 14385-14388.
DSouza A, Hussain M, Howarth F, Woods N, Bidasee K, & Singh J (2009).
Pathogenesis and pathophysiology of accelerated atherosclerosis in the diabetic heart.
Molecular and Cellular Biochemistry 331, 89-116.
Dube MC, Joanisse DR, Prud'homme D, Lemieux S, Bouchard C, Perusse L, Lavoie C,
& Weisnagel SJ (2006). Muscle adiposity and body fat distribution in type 1 and type 2
diabetes: varying relationships according to diabetes type. Int J Obes 30, 1721-1728.
Dunbar JC, Houser F, & Levy J (1989). Beta cell desensitization to glucose induced by
hyperglycemia is augmented by increased calcium. Diabetes Research and Clinical
Practice 7, 187-196.
Dunger DB, Petry CJ, & Ong KK (2007). Genetics of Size at Birth. Diabetes Care 30,
S150-S155.
Ekmekcioglu C, Prohaska C, Pomazal K, Steffan I, Schernthaner G, & Marktl W
(2001). Concentrations of seven trace elements in different hematological matrices in
patients with type 2 diabetes as compared to healthy controls. Biological Trace Element
Research 79, 205-219.
Erbey JR, Silberman C, & Lydick E (2000). Prevalence of abnormal serum alanine
aminotransferase levels in obese patients and patients with type 2 diabetes. The
American Journal of Medicine 109, 588-590.
Erdmann E (2005). Diabetes and cardiovascular risk markers. Current Medical
Research and Opinion 21, S21-S28.
Ernst E & Matrai A (1986). Altered red and white blood cell rheology in type II
diabetes. Diabetes 35, 1412-1415.

Page 187
Espino J, Bejarano I, Paredes S, Barriga C, Reiter R, Pariente J, & Rodriguez A (2011).
Melatonin is able to delay endoplasmic reticulum stress-induced apoptosis in leukocytes
from elderly humans. AGE 33, 497-507.
Espino J, Bejarano I, Redondo P, Rosado J, Barriga C, Reiter R, Pariente J, &
Rodriguez A (2010). Melatonin Reduces Apoptosis Induced by Calcium Signaling in
Human Leukocytes: Evidence for the Involvement of Mitochondria and Bax Activation.
Journal of Membrane Biology 233, 105-118.
Espino J, Mediero Ma, Lozano G, Bejarano I, Ortiz, Garcia J, Pariente J, & Rodriguez
A (2009). Reduced levels of intracellular calcium releasing in spermatozoa from
asthenozoospermic patients. Reproductive Biology and Endocrinology 7, 1-11.
Fasolato C, Hoth M, & Penner R (1993). A GTP-dependent step in the activation
mechanism of capacitative calcium influx. J Biol Chem 268, 20737-20740.
Federici M (2004). The strange case of G972R IRS-1 variant and diabetes. Do type 1
and type 2 diabetes share common genes? Molecular Genetics and Metabolism 81, 261-
262.
Fernández-Real JM, López-Bermejo A, & Ricart W (2002). Cross-Talk Between Iron
Metabolism and Diabetes. Diabetes 51, 2348-2354.
Festa A, Hanley AJG, Tracy RP, D'Agostino R, Jr., & Haffner SM (2003).
Inflammation in the Prediabetic State Is Related to Increased Insulin Resistance Rather
Than Decreased Insulin Secretion. Circulation 108, 1822-1830.
Fibrinogen Studies Collaboration (2005). Plasma Fibrinogen Level and the Risk of
Major Cardiovascular Diseases and Nonvascular Mortality: An Individual Participant
Meta-analysis . JAMA 294, 1799-1809.
Fleischhacker E, Esenabhalu VE, Spitaler M, Holzmann S, Skrabal F, Koidl B, Kostner
GM, & Graier WF (1999). Human diabetes is associated with hyperreactivity of
vascular smooth muscle cells due to altered subcellular Ca2+
distribution. Diabetes 48,
1323-1330.
Fontbonne A, Eschwège E, Ambien F, Richard J, Ducimetière P, Thibult N, Claude JR,
& Rosselin GE (1989). Hypertriglyceridaemia as a risk factor of coronary heart disease
mortality in subjects with impaired glucose tolerance or diabetes. Diabetologia 32, 300-
304.
Page 188
Ford ES (1999). Body mass index, diabetes, and C-reactive protein among U.S. adults.
Diabetes Care 22, 1971-1977.
Freedman JE, Loscalzo J, Barnard MR, Alpert C, Keaney JF & Michelson AD (1997).
Nitric oxide released from activated platelets inhibits platelet recruitment. J Clin Invest
350-356.
Frei B, Stocker R, & Ames BN (1988). Antioxidant defenses and lipid peroxidation in
human blood plasma. Proceedings of the National Academy of Sciences 85, 9748-9752.
Fujii S, Takemura T, Wada M, Akai T, & Okuda K (1982). Magnesium Levels in
Plasma, Erythrocyte and Urine in Patients with Diabetes Mellitus. Horm Metab Res 14,
161,162.
Fujimoto S (1987). Studies on the relationships between blood trace metal
concentrations and the clinical status of patients with cerebrovascular disease, gastric
cancer, and diabetes mellitus. Hokkaido Igaku Zasshi 62, 913-932.
Gabay C & Kushner I (1999). Acute-Phase Proteins and Other Systemic Responses to
Inflammation. New England Journal of Medicine 340, 448-454.
Gaczynska M, Judkiewicz L, & Szosland K (1993). Abnormal degradation of red cell
membrane proteins in diabetes. Cytobios 75, 7-11.
Gagliardino JJ & Rossi JPFC (1994). Ca2+
-ATPase in pancreatic islets: its possible role
in the regulation of insulin secretion. Diabetes/Metabolism Reviews 10, 1-17.
Galassi A, Reynolds K, & He J (2006). Metabolic Syndrome and Risk of
Cardiovascular Disease: A Meta-Analysis. The American Journal of Medicine 119, 812-
819.
Gallagher PG, Forget BG (1993). Spectrin genes in health and disease. Semin Hematol
30, 4-20.
Galli F, Piroddi M, Annetti C, Aisa C, Floridi E, & Floridi A (2005). Oxidative stress
and reactive oxygen species. Contrib Nephrol 149, 240-260.
Garber A J (2000). Attenuating cardiovascular risk factors in patients with type 2
diabetes. Am Fam Physician 62, 2633-2642.

Page 189
Gauthier TW, Scalia R, Murohara T, Guo Jp, & Lefer AM (1995). Nitric Oxide Protects
Against Leukocyte-Endothelium Interactions in the Early Stages of
Hypercholesterolemia. Arterioscler Thromb Vasc Biol 15, 1652-1659.
Geiszt M., Kaldi K., Szeberenyi J.B., Ligeti E (1995). Thapsigargin inhibits Ca2+
entry
in human neutrophil granulocytes. Biochem. J 305:525–528.
Genest J, Libby P (2007). Lipoprotein disorders and cardiovascular disease In: Libby P,
Bonow RO, Mann DL, Zipes DP, eds. Braunwald's Heart Disease: A Textbook of
Cardiovascular Medicine. 8th ed. Philadelphia, Pa: Saunders Elsevier; chap 42.
Gerich JE (2003). Contributions of Insulin-Resistance and Insulin-Secretory Defects to
the Pathogenesis of Type 2 Diabetes Mellitus. Mayo Clinic Proceedings 78, 447-456.
Ghiselli A, Serafini M, Maiani G, Azzini E, & Ferro-Luzzi A (1995). A fluorescence-
based method for measuring total plasma antioxidant capability. Free Radical Biology
and Medicine 18, 29-36.
Gimbrone MA, Nagel T, & Topper JN (1997). Biomechanical activation: an emerging
paradigm in endothelial adhesion biology. The Journal of Clinical Investigation 99,
1809-1813.
Giroix MH, Portha B, Kergoat M, Bailbe D, & Picon L (1983). Glucose insensitivity
and amino-acid hypersensitivity of insulin release in rats with non-insulin-dependent
diabetes. A study with the perfused pancreas. Diabetes 32, 445-451.
Goldin A, Beckman JA, Schmidt AM, & Creager MA (2006). Advanced Glycation End
Products. Circulation 114, 597-605.
Golik A, Cohen N, Ramot Y, Maor R, Moses R, & Weissgarten J (1993). Type II
diabetes mellitus, congestive heart failure, and zinc metabolism. Biol Trace Element Res
39, 171-175.
Gonzalez Flecha FL, Bermudez MC, Cedola NV, Gag Liardio JJ, & Rossi JPFC (1990).
Diabetes 39, 704-711.
Graham Lloyd J (1984). Red cell membrane proteins in insulin-dependent diabetes
differential effects of treatment with calcium and various proteases. Biochemical
Medicine 32, 398-403.

Page 190
Green DM, Ropper AH, Kronmal RA, Psaty BM, & Burke GL (2002). Serum
potassium level and dietary potassium intake as risk factors for stroke . Neurology 59,
314-320.
Grigoleit H G, Lehrach F, & Muller R (1973). Diabetic angiopathy and blood viscosity.
Acta Diabet Lat 10, 1311-1324.
Grillo MA & Colombatto S (2008). Advanced glycation end-products (AGEs):
involvement in aging and in neurodegenerative diseases. Amino Acids 35, 29-36.
Grundy SM (1997). Small LDL, Atherogenic Dyslipidemia, and the Metabolic
Syndrome. Circulation 95, 1-4.
Grundy SM, Benjamin IJ, Burke GL, Chait A, Eckel RH, Howard BV, Mitch W, Smith
SC, & Sowers JR (1999). Diabetes and Cardiovascular Disease. Circulation 100, 1134-
1146.
Gumbiner B, Van Cauter E, Beltz WF, Ditzler TM, Griver K, Polonsky KS, & Henry
RR (1996). Abnormalities of insulin pulsatility and glucose oscillations during meals in
obese noninsulin-dependent diabetic patients: effects of weight reduction. J Clin
Endocrinol Metab 81, 2061-2068.
Haffner SM & Ashraf T (2000). Predicting risk reduction of coronary disease in patients
who are glucose intolerant: a comparison of treatment with fenofibrate and other lipid-
modifying agents. Manag Care Interface 13, 52-58.
Haffner SM (2000). Sex hormones, obesity, fat distribution, type 2 diabetes and insulin
resistance: epidemiological and clinical correlation. Int J Obes Relat Metab Disord 24,
s56-58.
Hales CN & Barker DJP (2001). The thrifty phenotype hypothesis: Type 2 diabetes. Br
Med Bull 60, 5-20.
Halter JB, Kenneth Ward W, Porte D, Best JD, & Pfeifer MA (1985). Glucose
regulation in non-insulin-dependent diabetes mellitus: Interaction between pancreatic
islets and the liver. The American Journal of Medicine 79, 6-12.
Hammes HP, Weiss A, & Hess S (1999). Modification of vitronectin by advanced
glycation alters functional properties in vitro and the diabetic retina. Diabetologia 42,
728-736.

Page 191
Hanoune J, Chambaut AM, & Josipowicz A (1972). The glucose effect and cortisone
action upon rat liver and muscle protein metabolism. Archives of Biochemistry and
Biophysics 148, 180-184.
Hansson GK (2005). Inflammation, Atherosclerosis, and Coronary Artery Disease. N
Engl J Med 352, 1685-1695.
Harris EH (2005). Elevated Liver Function Tests in Type 2 Diabetes. Clinical Diabetes
23, 115-119.
Hart LM, De Knijff P, Dekker JM et al. (1999) Variants in the sulphonylurea receptor
gene:association of the exon 16 ±3t variant with Type II diabetes mellitus in the
Netherlands. Diabetologia 42: 617-620.
Hattori Y, Satoh H, Namatame T, Hattori S, & Kasai K (2006). A Patient With Extreme
Insulin Resistance Syndrome Treated With Pioglitazone. Diabetes Care 29, 2328-2329.
Hayashi H & Noda N (1997). Cytosolic Ca2+
concentration decreases in diabetic rat
myocytes. Cardiovascular Research 34, 99-103.
Hayashi T, Boyko EJ, Leonetti DL, McNeely MJ, Newell-Morris L, Kahn SE, &
Fujimoto WY (2003). Visceral Adiposity and the Prevalence of Hypertension in
Japanese Americans. Circulation 108, 1718-1723.
He FJ & MacGregor GA (2003). Review: Salt, blood pressure and the renin-angiotensin
system. Journal of Renin-Angiotensin-Aldosterone System 4, 11-16.
Hellman B, Gylfe E, Bergsten P, Grapengiesser E, Lund P, Berts A, Tengholm A,
Pipeleers D, & Ling Z (1994). Glucose induces oscillatory Ca2+
signalling and insulin
release in human pancreatic beta cells. Diabetologia 37, S11-S20.
Himsworth HP (1936). Diabetes Mellitus. Its differentiation into insulin-sensitive and
insulin-insenstive types. The Lancet 227, 127-130.
Hoang VM, Byass P, & Wall S (2003). Mortality from cardiovascular diseases in Bavi
District, Vietnam. Scandinavian Journal of Public Health 31, 26-31.
Holt RIG (2004). Diagnosis, epidemiology and pathogenesis of diabetes mellitus: an
update for psychiatrists. The British Journal of Psychiatry 184, s55-s63.
Honing MLH, Morrison PJ, Banga JD, Stroes ESG, & Rabelink TJ (1998). Nitric oxide
availability in diabetes mellitus. Diabetes Metab Rev 14, 241-249.
Page 192
Hori O, Brett J, Slattery T, Cao R, Zhang J, Chen JX, Nagashima M, Lundh ER, Vijay
S, Nitecki D, Morser J, Stern D, & Schmidt AM (1995). The Receptor for Advanced
Glycation End Products (RAGE) Is a Cellular Binding Site for Amphoterin. Journal of
Biological Chemistry 270, 25752-25761.
Hotamisligil GS & Spiegelman BM (1994). Tumor necrosis factor alpha: a key
component of the obesity-diabetes link. Diabetes 43, 1271-1278.
Howard R (1989). The messenger function of Ca2+
: from PTH action to smooth muscle
contraction. Bone and Mineral 5, 233-248.
Hu TH, Bei L, Qian ZM, Shen X (1999). Intracellular free calcium regulates the onset
respiratory burst in human neutrophils activated by phorbol myristate acetate. Cell
Signal; 11: 355-360.
Hu FB & Stampfer MJ (2003). Is Type 2 Diabetes Mellitus a Vascular Condition?
Arteriosclerosis, Thrombosis, and Vascular Biology 23, 1715-1716.
Hu FB, Manson JE, Stampfer MJ, Colditz G, Liu S, Solomon CG, & Willett WC
(2001). Diet, Lifestyle, and the Risk of Type 2 Diabetes Mellitus in Women. New
England Journal of Medicine 345, 790-797.
Ibanga I A, Usoro C A, & Nsonwu A C (2005). Glycaemic control in type 2 diabetics
and the mean corpuscular fragility. Niger J Med 14, 304-306.
Irshad M & Chaudhuri PS (2002). Oxidant-antioxidant system: role and significance in
human body. Indian J Exp Biol 40, 1233-1239.
Ishii H, Umeda F, Hashimoto T, Nawata H (1991). Increased intracellular calcium
mobilization in platelets from patients with type 2 (non-insulin-dependent) diabetes
mellitus- Diabetologia, 34(5):332-6.
Jaconi ME, Rivest RW, Schlegel W, Wollheim CB, Pittet D, & Lew PD (1988).
Spontaneous and chemoattractant-induced oscillations of cytosolic free calcium in
single adherent human neutrophils. J Biol Chem 263, 10557-10560.
Jakubczak B, Wasik M, Popko K, Demkow U (2006). Kinetics of calcium ion
concentration accompanying signal transduction in neutrophils from children with
increased susceptibility to infections. J Physiol Pharmacol; 57: 131-137.
Jakus V & Rietbrock N (2003). Advanced glycation end-products and the progress of
diabetic vascular complications. Physiol Res 53, 131-142.

Page 193
James VN (1962). Diabetes Mellitus: A "Thrifty" Genotype Rendered Detrimental by
"Progress"? Am J Hum Genet 14, 353-362.
Janicki PK, Horn JL, Singh G, Franks WT, & Franks JJ (1994). Diminished brain
synaptic plasma membrane Ca2+
-ATPase activity in rats with streptozocin-induced
diabetes: Association with reduced anesthetic requirements. Life Sciences 55, L359-
L364.
Jarrett RJ & Shipley MJ (1988). Type 2 (non-insulin-dependent) diabetes mellitus and
cardiovascular disease - putative association via common antecedents; further evidence
from the Whitehall Study. Diabetologia 31, 737-740.
Jeon CY, Lokken RP, Hu FB, & van Dam RM (2007). Physical Activity of Moderate
Intensity and Risk of Type 2 Diabetes. Diabetes Care 30, 744-752.
Johnson EL, Brosseau JD, Soule M, & Kolberg J (2008). Treatment of Diabetes in
Long-Term Care Facilities: A Primary Care Approach. Clinical Diabetes 26, 152-156.
Jones AF, Jennings PE, Wakefield A, Winkles JW, Lunec J, & Barnett AH (1988). The
fluorescence of serum proteins in diabetic patients with and without retinopathy.
Diabetic Med 5, 547-551.
Jones GL (1984). Red cell membrane proteins in insulin-dependent diabetes differential
effects of treatment with calcium and various proteases. Biochemical Medicine 32, 398-
403.
Judykay T (2007). Nutrition for reducing urea and creatinine in the blood. Diabetes
Care 27, 2191-2192.
Juntti-Berggren L, Larsson O, Rorsman P, Ammala C, Bokvist K, Wahlander K,
Nicotera P, Dypbukt J, Orrenius S, Hallberg A, & et al (1993). Increased activity of L-
type Ca2+
channels exposed to serum from patients with type I diabetes. Science 261,
86-90.
Kahn CR, Vicent D, Doria, A (1996) Genetics of non-insulin-dependent (Type-II)
diabetes mellitus. Annu Rev Med 47: 509-531
Kahn SE, Porte D Jr (1988). Islet dysfunction in non-insulin-dependent diabetes
mellitus. Am J Med 85, 4-8.

Page 194
Kaji Y, Oshika T, Amano S, Okamoto F, Koito W, & Horiuchi S (2006).
Immunohistochemical localization of advanced glycation end products in pinguecula.
Graefe's Archive for Clinical and Experimental Ophthalmology 244, 104-108.
Kannel WB, Castelli WP, Gordon T (1979). Cholesterol in the prediction of
atherosclerotic disease. New perspectives based on the Framingham study. Ann Intern
Med 85-91.
Kannel WB, Dawber TR, Kagan A, Revotskie N, & Stokes III J (1961). Factors of Risk
in the Development of Coronary Heart Disease--Six-Year Follow-up Experience.
Annals of Internal Medicine 55, 33.
Kasim-Karakas SE (2000). Ethnic differences in the insulin resistance syndrome. Am J
Clin Nutr 71, 670-671.
Kato S, Ishida H, Tsuura Y, Okamoto Y, Tsuji K, Horie M, Okada Y, & Seino Y
(1994). Increased calcium-channel currents of pancreatic cells in neonatally
streptozocin-induced diabetic rats. Metabolism 43, 1395-1400.
Kay MMB (1991). Band 3 in Aging and Neurological Disease. Annals of the New York
Academy of Sciences 621, 179-204.
Kaymaz AA, Tamer S, Albeniz I, Cefle K, Palanduz S, Ozturk S, & Salmayenli N
(2005). Alterations in rheological properties and erythrocyte membrane proteins in cats
with diabetes mellitus. Clinical Hemorheology and Microcirculation 33, 81-88.
Kazi T, Afridi H, Kazi N, Jamali M, Arain M, Jalbani N, & Kandhro G (2008). Copper,
Chromium, Manganese, Iron, Nickel, and Zinc Levels in Biological Samples of
Diabetes Mellitus Patients. Biological Trace Element Research 122, 1-18.
Keegan A, Walbank H, Cotter M, & Cameron N (1995). Chronic vitamin E treatment
prevents defective endothelium-dependent relaxation in diabetic rat aorta. Diabetologia
38, 1475-1478.
Kelley NW & Palella TD (1991). Gout and Other Disorders of Purine Metabolism.
Harrison's Principles of Internal Medicine. Ed. New York: McGraw Hill Book
Company, 12 ed., pp. 1834-1835.
Kelly KL, Deeney JT, Corkey BE (1989). Cytosolic free calcium in adipocytes. Distinct
mechanisms of regulation and effects on insulin action. J Biol Chem; 264: 12754-
12757.

Page 195
Kilhovd BK, Berg TJ, Birkeland KI, Thorsby P, & Hanssen KF (1999). Serum levels of
advanced glycation end products are increased in patients with type 2 diabetes and
coronary heart disease. Diabetes Care 22, 1543-1548.
Kilhovd BK, Giardino I, Torjesen PA, Birkeland KI, Berg TJ, Thornalley PJ, Brownlee
M, & Hanssen KF (2003). Increased serum levels of the specific AGE-compound
methylglyoxal-derived hydroimidazolone in patients with type 2 diabetes. Metabolism
52, 163-167.
King DE, Mainous AG, & Pearson WS (2002). C-Reactive Protein, Diabetes, and
Attendance at Religious Services. Diabetes Care 25, 1172-1176.
King DE, Mainous AG, Buchanan TA, & Pearson WS (2003). C-Reactive Protein and
Glycemic Control in Adults With Diabetes. Diabetes Care 26, 1535-1539.
King H, Aubert RE, & Herman WH (1998). Global burden of diabetes, 1995-2025:
prevalence, numerical estimates, and projections. Diabetes Care 21, 1414-1431.
Kiuchi K, Nejima J, Takano T, Ohta M, & Hashimoto H (2001). Increased serum
concentrations of advanced glycation end products: a marker of coronary artery disease
activity in type 2 diabetic patients. Heart 85, 87-91.
Ko GT, Chan JC, Tsang LW, & Cockram CS (2000). Combined use of fasting plasma
glucose and HbA1c predicts the progression to diabetes in Chinese subjects. Diabetes
Care 23, 1770-1773.
Koenig RJ, Peterson CM, Jones RL, Saudek C, Lehrman M, & Cerami A (1976).
Correlation of Glucose Regulation and Hemoglobin AIc in Diabetes Mellitus. New
England Journal of Medicine 295, 417-420.
Kojda G & Harrison D (1999). Interactions between NO and reactive oxygen species:
pathophysiological importance in atherosclerosis, hypertension, diabetes and heart
failure. Cardiovascular Research 43, 652-671.
Kraine MR & Tisch RM (1999). The role of environmental factors in insulin-dependent
diabetes mellitus: an unresolved issue. Environ Health Perspect 107, 777-781.
Kristiansen OP & Mandrup-Poulsen T (2005). Interleukin-6 and Diabetes. Diabetes 54,
S114-S124.
Kumar PJ & Clark M (2005). Diabetes Mellitus and other disorders of metabolism.
Kumar & Clark Clinical Medicine, pp. 1101-1130.

Page 196
Kumar PJ & Clark M (2007). Diabetes mellitus and other disorders of metabolism. In:
Kumar PJ, Clark M, editors. Textbook of Medicine. Saunders: London; pp. 1069-1122.,
Textbook of Medicine. Saunders: London ed., pp. 1069-1122.
Kung C M, Tseng Z L, & Wang H L (2009). Erythrocyte fragility increases with level
of glycosylated hemoglobin in type 2 diabetic patients. Clin Hemorheol Microcirc 43,
351.
Kusmic C, Picano E, Busceti CL, Petersen C, & Barsacchi R (2000). The antioxidant
drug dipyridamole spares the vitamin E and thiols in red blood cells after oxidative
stress. Cardiovascular Research 47, 510-514.
Laing S., Ellis M., & Greenhalgh R.M. (1991). Who should be investigated for occult
atherosclerotic disease? : New techniques, combined lesions and prevention.
Developments in cardiovascular medicine 319-334.
Lamarche B, Tchernof A, Moorjani S, Cantin B, Dagenais GR, Lupien PJ, & Despres
JP (1997). Small, Dense Low-Density Lipoprotein Particles as a Predictor of the Risk of
Ischemic Heart Disease in Men. Circulation 95, 69-75.
Larry W (1988). Free radicals and diabetes. Free Radical Biology and Medicine 5, 113-
124.
Leahy JL (1990). Natural History of Cell Dysfunction in NIDDM. Diabetes Care 13,
992-1010.
Lee HK (2001). Method of proof and evidences for the concept that mitochondrial
genome is a thrifty genome. Diabetes Research and Clinical Practice 54, S57-S63.
Lee HK, Song JH, Shin CS, Park DJ, Park KS, Lee KU, & Koh C-S (1998). Decreased
mitochondrial DNA content in peripheral blood precedes the development of non-
insulin-dependent diabetes mellitus. Diabetes Research and Clinical Practice 42, 161-
167.
Lee YY, Park KS, Pak YK, & Lee HK (2005). The role of mitochondrial DNA in the
development of type 2 diabetes caused by fetal malnutrition. The Journal of Nutritional
Biochemistry 16, 195-204.
Leinonen E, Hurt-Camejo E, Wiklund O, Hulten LM, Hiukka A, & Taskinen MR
(2003). Insulin resistance and adiposity correlate with acute-phase reaction and soluble
cell adhesion molecules in type 2 diabetes. Atherosclerosis 166, 387-394.
Page 197
Levy J & Gavin JRI (1995). Different genes for obesity are associated with insulin loss
of regulation of the membrane (Ca2+
+ Mg2+
)-ATPase in the obesity syndrome. Lessons
from animal models. International Journal of Obesity 19, 97-102.
Levy J & Rempinski D (1994). Decreased activity of (Ca2+
+ Mg2+
)-adenosine
triphosphatase (ATPase) and a hormone-specific defect in insulin regulation of ATPase
in kidney basolateral membrannes from obese fafa rats. Metabolism 43, 1055-1061.
Levy J (1999). Abnormal cell calcium homeostasis in type 2 diabetes mellitus.
Endocrine 10, 1-6.
Levy J, Gavin III JR, & Sowers JR (1994a). Diabetes mellitus: A disease of abnormal
cellular calcium metabolism? The American Journal of Medicine 96, 260-273.
Levy J, Gavin JR, Hammerman MR, & Avioli LV (1986). Ca2+
-Mg2+
-ATPase activity
in kidney basolateral membrane in non-insulin-dependent diabetic rats. Effect of
insulin. Diabetes 35, 899-905.
Levy J, Rempinski D, & Kuo TH (1994b). Hormone-specific defect in insulin
regulation of (Ca2+
+ Mg2+
)-adenosine triphosphatase activity in kidney membranes
from streptozocin non-insulin-dependent diabetic rats. Metabolism 43, 604-613.
Levy J, Suzuki Y, Avioli LV, Grunberger G, & Gavin JR3 (1988). Plasma membrane
phospholipid content in non-insulin-dependent streptozotocin-diabetic rats--effect of
insulin. Diabetologia 5, 315-321.
Levy J, Zemel MB, & Sowers JR (1989). Role of cellular calcium metabolism in
abnormal glucose metabolism and diabetic hypertension. The American Journal of
Medicine 87, S7-S16.
Levy J, Zhu Z, & Dunbar JC (1998). The effect of glucose and calcium on Ca2+
-
adenosine triphosphatase in pancreatic islets isolated from a normal and a non-insulin-
dependent diabetes mellitus rat model. Metabolism 47, 185-189.
Lew DP (1989). Receptor signalling and intracellular calcium in neutrophil activation.
Eur J Clin Invest 19, 338-346.
Lewis GF, Carpentier A, Adeli K, & Giacca A (2002). Disordered Fat Storage and
Mobilization in the Pathogenesis of Insulin Resistance and Type 2 Diabetes. Endocrine
Reviews 23, 201-229.

Page 198
Ley K (1996). Molecular mechanisms of leukocyte recruitment in the inflammatory
process. Cardiovascular Research 32, 733-742.
Li W, Shen S, Khatami M, & Rockey JH (1984). Stimulation of retinal capillary
pericyte protein and collagen synthesis in culture by high-glucose concentration.
Diabetes 33, 785-789.
Libby P, Ridker PM, & Maseri A (2002). Inflammation and Atherosclerosis.
Circulation 105, 1135-1143.
Lindgarde F, Vessby B, & Ahren B (2006). Serum cholesteryl fatty acid composition
and plasma glucose concentrations in Amerindian women. Am J Clin Nutr 84, 1009-
1013.
Lindsay RS (2009). Gestational diabetes: causes and consequences. The British Journal
of Diabetes & Vascular Disease 9, 27-31.
Little R, England J, Wiedmeyer H, Madsen R, Pettitt D, Knowler W, & Goldstein D
(1994). Glycated haemoglobin predicts progression to diabetes mellitus in Pima Indians
with impaired glucose tolerance. Diabetologia 37, 252-256.
Little RR (2003). Glycated Hemoglobin Standardization GÇô National
Glycohemoglobin Standardization Program (NGSP) Perspective. Clinical Chemistry
and Laboratory Medicine 41, 1191-1198.
Liuzzo G, Biasucci LM, Gallimore JR, Grillo RL, Rebuzzi AG, Pepys MB, & Maseri A
(1994). The Prognostic Value of C-Reactive Protein and Serum Amyloid A Protein in
Severe Unstable Angina. New England Journal of Medicine 331, 417-424.
Lloyd-Jones DM, Liu K, Tian L, & Greenland P (2006). Narrative Review: Assessment
of C-Reactive Protein in Risk Prediction for Cardiovascular Disease. Annals of Internal
Medicine 145, 35-42.
Lloyd-Jones DM, O'Donnell CJ, D'Agostino RB, Massaro J, Silbershatz H, & Wilson
PWF (2001). Applicability of Cholesterol-Lowering Primary Prevention Trials to a
General Population: The Framingham Heart Study. Arch Intern Med 161, 949-954.
Lorenzo A, Razzaboni B, Weir GC, & Yankner BA (1994). Pancreatic islet cell toxicity
of amylin associated with type-2 diabetes mellitus. Nature 368, 756-760.
Lowe GD (2004). Virchow's triad revisited: abnormal flow. Pathophysiol Haemost
Thromb 33, 455-457.

Page 199
Lux SE, John KM, & Ukena TE (1978). Diminished spectrin extraction from ATP-
depleted human erythrocytes. Evidence relating spectrin to changes in erythrocyte shape
and deformability. J Clin Invest 61, 815-827.
Madsen TE, Muhlestein JB, Carlquist JF, Horne BD, Bair TL, Jackson JD, Lappe JM,
Pearson RR, & Anderson JL (2005). Serum uric acid independently predicts mortality
in patients with significant, angiographically defined coronary disease. Am J Nephrol
25, 45-49.
Maechler P & Wollheim CB (2000). Mitochondrial signals in glucose-stimulated insulin
secretion in the beta cell. The Journal of Physiology 529, 49-56.
Mahler RJ & Adler ML (1999). Type 2 Diabetes Mellitus: Update on Diagnosis,
Pathophysiology, and Treatment. J Clin Endocrinol Metab 84, 1165-1171.
Mahmoud P, Massoud A, Ashraf A, & Esfandiar H (2008). Effect of Zinc
Supplementation on Microalbuminuria in Patients With Type 2 Diabetes: A Double
Blind, Randomized, Placebo-Controlled, Cross-Over Trial. Rev Diabet Stud 5, 102-109.
Mahtani MM, Widén E, Lehto M, Thomas J, McCarthy M, Brayer J, Bryant B, Chan G,
Daly M, Forsblom C, Kanninen T, Kirby A, Kruglyak L, Munnelly K, Parkkonen M,
Reeve-Daly MP, Weaver A, Brettin T, Duyk G, Lander ES, Groop LC (1996). Mapping
of a gene for type 2 diabetes associated with an insulin secretion defect by a genome
scan in Finnish families. Nat Genet 14, 90-94.
Malinow MR, Levenson J, Giral P, Nieto FJ, Razavian M, Segond P, Simon A. A 1995
Role of blood pressure, uric acid, and hemorheological parameters on plasma
homocysteine concentration. Atherosclerosis 114. 175-183. 1995.
Mallika V, Goswami B, & Rajappa M (2007). Atherosclerosis pathophysiology and the
role of novel risk factors: A clinicobiochemical perspective. Angiology 58, 513-522.
Maret W & Sandstead HH (2006). Zinc requirements and the risks and benefits of zinc
supplementation. Journal of Trace Elements in Medicine and Biology 20, 3-18.
Marhoffer W, Stein M, Maeser E, & Federlin K (1992). Impairment of
polymorphonuclear leukocyte function and metabolic control of diabetes. Diabetes
Care 15, 256-260.
Martin MJ, Hulley Sb, Browner Ws, Kuller Lh, Wentworth D. (1986). Serum cholesterol,
blood pressure, and mortality: implications from a cohort of 361,662 men. Lancet 933-
936.
Page 200
Mateo MC, Bustamante JB, Quiros JF, & Manchado OO (1975). A study of the
metabolism of zinc its metalloenzymes in diabetes mellitus. Biomedicine 23, 134-136.
Maxfield FR & Tabas I (2005). Role of cholesterol and lipid organization in disease.
Nature 438, 612-621.
Mayer-Davis EJ, D'Agostino R Jr, Karter AJ, Haffner SM, Rewers MJ, Saad M,
Bergman RN (1998). Intensity and amount of physical activity in relation to insulin
sensitivity: The insulin resistance atherosclerosis study. JAMA: The Journal of the
American Medical Association 279, 669-674.
Mayhew TM, Mwamengele GLM, Self TJ, & Travers JP (1994). Stereological studies
on red corpuscle size produce values different from those obtained using haematocrit-
and model-based methods. British Journal of Haematology 86, 355-360.
Mazzanti L, Faloia E, Rabini RA, Staffolani R, Kantar A, Fiorini R, Swoboda B, de
Pirro R, & Bertoli E (1992). Diabetes mellitus induces red blood cell plasma membrane
alterations possibly affecting the aging process. Clinical Biochemistry 25, 41-46.
McAuley KA, Williams SM, Mann JI, Goulding A, Chisholm A, Wilson N, Story G,
McLay RT, Harper MJ, & Jones IE (2002). Intensive Lifestyle Changes Are Necessary
to Improve Insulin Sensitivity. Diabetes Care 25, 445-452.
McCance DR, Pettitt DJ, Hanson RL, Jacobsson LTH, Knowler WC, & Bennett PH
(1994). Birth weight and non-insulin dependent diabetes: thrifty genotype, thrifty
phenotype, or surviving small baby genotype? BMJ 308, 942-945.
McDermott R (1998). Ethics, epidemiology and the thrifty gene: biological determinism
as a health hazard. Social Science & Medicine 47, 1189-1195.
McDonagh PF, Hokama JY, Copeland JG, & Reynolds JM (1997). The blood
contribution to early myocardial reperfusion injury is amplified in diabetes. Diabetes
1859-1867.
McManus LM, Bloodworth RC, Prihoda TJ, Blodgett JL, & Pinckard RN (2001).
Agonist-dependent failure of neutrophil function in diabetes correlates with extent of
hyperglycemia. J Leukoc Biol 70, 395-404.
Meece J (2007). Pancreatic islet dysfunction in type 2 diabetes: a rational target for
incretin-based therapies. Current Medical Research and Opinion 23, 933-944.

Page 201
Meerwaldt R, Links T, Zeebregts C, Tio R, Hillebrands JL, & Smit A (2008). The
clinical relevance of assessing advanced glycation endproducts accumulation in
diabetes. Cardiovascular Diabetology 7, 1-8.
Melchior T, Simonsen KW, Johannessen AC, & Binder C (1989). Plasma zinc
concentrations during the first 2 years after diagnosis of insulin-dependent diabetes
mellitus: a prospective study. Journal of Internal Medicine 226, 53-58.
Mene P, Pugliese G, Pricci F, Di Mario U, Cinotti GA, & Pugliese F (1993). High
glucose inhibits cytosolic calcium signaling in cultured rat mesangial cells. Kidney Int
43, 585-591.
Meng J, Sakata N, Takebayashi S, Asano T, Futata T, Nagai R, Ikeda K, Horiuchi S,
Myint T, & Taniguchi N (1998). Glycoxidation in aortic collagen from STZ-induced
diabetic rats and its relevance to vascular damage. Atherosclerosis 136, 355-365.
Mensah GA, Brown DW (2007). An Overview Of Cardiovascular Disease Burden In
The United States. Health Aff 26, 38-48
Michaely P & Bennett V (1995). The ANK Repeats of Erythrocyte Ankyrin Form Two
Distinct but Cooperative Binding Sites for the Erythrocyte Anion Exchanger. Journal of
Biological Chemistry 270, 22050-22057.
Miura J, Yamagishi Si, Uchigata Y, Takeuchi M, Yamamoto H, Makita Z, & Iwamoto
Y (2001). Serum levels of non-carboxymethyllysine advanced glycation endproducts
are correlated to severity of microvascular complications in patients with Type 1
diabetes. Journal of Diabetes and its Complications 17, 16-21.
Miyata T, Hori O, Zhang J, Yan SD, Ferran L, Iida Y, & Schmidt AM (1996). The
receptor for advanced glycation end products (RAGE) is a central mediator of the
interaction of AGE-beta2microglobulin with human mononuclear phagocytes via an
oxidant-sensitive pathway. Implications for the pathogenesis of dialysis-related
amyloidosis. J Clin Invest 98, 1088-1094.
Momiyama Y, Suzuki Y, Ohsuzu F, Atsumi Y, Matsuoka K, & Kimura M (1999).
Maternally transmitted susceptibility to non-insulin-dependent diabetes mellitus and left
ventricular hypertrophy. J Am Coll Cardiol 33, 1372-1378.
Monnier VM (1990). Nonenzymatic Glycosylation, the Maillard Reaction and the
Aging Process. Journal of Gerontology 45, B105-B111.

Page 202
Mooradian AD (2009). Dyslipidemia in type 2 diabetes mellitus. Nature Clinical
Practice Endocrinology & Metabolism 5, 150-159.
Morgan T, Adam W, Gillies A, Wilson M, Morgan G, & Carney S (1978).
Hypertension treated by salt restriction. The Lancet 311, 227-230.
Murray CJ & Lopez AD (1997). Alternative projections of mortality and disability by
cause 1990-2020: Global Burden of Disease Study. The Lancet 349, 1498-1504.
Myers J, Atwood JE, & Froelicher V (2003). Active Lifestyle and Diabetes. Circulation
107, 2392-2394.
Nakamura Y, Horii Y, Nishino T, Shiiki H, Sakaguchi Y, Kagoshima T, Dohi K,
Makita Z, Vlassara H, & Bucala R (1993). Immunohistochemical localization of
advanced glycosylation end products in coronary atheroma and cardiac tissue in
diabetes mellitus. Am J Pathol 143, 1649-1656.
Naraoka H, Ito K, Suzuki M, Naito K, & Tojo H (2005). Evaluation of H-FABP as a
marker of ongoing myocardial damage using hGH transgenic mice. Clinica Chimica
Acta 361, 159-166.
Narayan KM, Hanson RL, Pettitt DJ, Bennett PH, & Knowler WC (1996). A two-step
strategy for identification of high-risk subjects for a clinical trial of prevention of
NIDDM. Diabetes Care 19, 972-978.
Nigro J, Osman N, Dart AM, & Little PJ (2006). Insulin Resistance and
Atherosclerosis. Endocr Rev 27, 242-259.
Nilsson J, Joinge S, Neimann A, Reneland R, & Lithell H (1998). Relation between
plasma tumor necrosis factor-alpha and insulin sensitivity in elder men with non-
insulin-dependent diabetes mellitus. Arteriosclerosis, Thrombosis, and Vascular
Biology 18, 1199.
Nishigaki I, Hagihara M, Tsunekawa H, Maseki M, & Yagi K (1981). Lipid peroxide
levels of serum lipoprotein fractions of diabetic patients. Biochem Med 25, 373-378.
Nishikawa T, Edelstein D, Du XL, Yamagishi SI, Matsumura T, Kaneda Y, Yorek MA,
Beebe D, Oates PJ, Hammes HP, Glardino I, & Brownlee M (2000). Normalizing
mitochondrial superoxide production blocks three pathways of hyperglycaemic damage.
Nature 404, 787-790.

Page 203
Nosadini R, Sambataro M, Thomaseth K, Pacini G, Cipollina MR, Brocco E, Solini A,
Carraro A, Velussi M, & Frigato F (1993). Role of hyperglycemia and insulin resistance
in determining sodium retention in non-insulin-dependent diabetes. Kidney
International 44, 139-146.
Noto R, Alicata R, Sfogliano L, Neri S, & Bifarella M (1984). A study of cupremia in a
group of elderly diabetics. Acta Diabetologica 21, 79-85.
O'Brien RM & Granner DK (1991). Regulation of gene expression by insulin. Biochem
J 278, 609-619.
O'Brien SF, Powrie JK, & Watts GF (1997). Comparison of urinary albumin, retinol-
binding protein and N-acetyl beta-glucosaminidase as predictors of progression of low
level albuminuria in diabetes . Ann Clin Biochem 34, 202-204.
Ohlson L, Larsson B, Björntorp P, Eriksson H, Svärdsudd K, Welin L, Tibblin G,
Wilhelmsen L. (1988). Risk factors for Type 2 (non-insulin-dependent) diabetes
mellitus. Thirteen and one-half years of follow-up of the participants in a study of
Swedish men born in 1913. Diabetologia 31, 798-805.
Ohno H, Terayama K, & Yahata T (1985). Changes in zeta potential of the red cell
membrane in humans during acute exposure to cold. Japanese Journal of Experimental
Medicine 55, 207-209.
Ojuka EO (2004). Role of calcium and AMP kinase in the regulation of mitochondrial
biogenesis and GLUT4 levels in muscle. Proc Nutr Soc 63, 275-278.
Okamoto Y, Ishida H, Taminato T, Tsuji K, Kurose T, Tsuura Y, Kato S, Imura H, &
Seino Y (1992). Role of cytosolic Ca2+
in impaired sensitivity to glucose of rat
pancreatic islets exposed to high glucose in vitro. Diabetes 41, 1555-1561.
Orlov SN, Li JM, Tremblay J, & Hanet P (1995). Genes of intracellular calcium
metabolism and blood pressure control in primary hypertension. Semin Nephrol 15,
569-592.
Osuntokl A A, Fasanmade O A, Adekola A O, & Amira C O (2007). Lipid peroxidation
and erythrocyte fragility in poorly controlled type 2 diabetes mellitus. Nig Q J Hosp
Med 17, 148-151.
Ottolini MC, Hamburger EK, Loprieato JO, Coleman RH, Sachs HC, Madden R,
Brasseux C (2001). Complementary and alternative medicine use among children in the
Washington, DC area. Ambul Pediatr ;1:122-125.
Page 204
Panasenko OM, Vol'nova TV, Azizova OA, & Vladimirov YA (1991). Free radical
modification of lipoproteins and cholesterol accumulation in cells upon atherosclerosis.
Free Radic Biol Med 10, 137-148.
Parker DR, Weiss ST, Troisi R, Cassano PA, Vokonas PS, & Landsberg L (1993).
Relationship of dietary saturated fatty acids and body habitus to serum insulin
concentrations: the Normative Aging Study. Am J Clin Nutr 58, 129-136.
Parpart AK, Lorenz PB, Parpart ER, Gregg JP, & Chase AM (1946). The osmotic
resistance (fragility) of human red cells. Journal of Clinical Investigation 26, 636-640.
Patterson RL, van Rossum DB, & Gill DL (1999). Store-operated Ca2+
entry: evidence
for a secretion-like coupling model. Cell. Cell 98, 487-499.
Pearson TA, Mensah GA, Alexander RW, Anderson JL, Cannon RO, Criqui M, Fadl
YY, Fortmann SP, Hong Y, Myers GL, Rifai N, Smith SC, Taubert K, Tracy RP, &
Vinicor F (2003). Markers of Inflammation and Cardiovascular Disease. Circulation
107, 499-511.
Peppa M & Vlassara H (2005). Advanced glycation end products and diabetic
complications: a general overview. Hormones (Athens) 4, 28-37.
Peppa M, Uribarri J, & Vlassara H (2003). Glucose, Advanced Glycation End Products,
and Diabetes Complications: What Is New and What Works. Clinical Diabetes 21, 186-
187.
Perrone RD, Madias NE, & Levey AS (1992). Serum creatinine as an index of renal
function: new insights into old concepts. Clin Chem 38, 1933-1953.
Perry IJ, Wannamethee SG, & Shaper AG (1998). Prospective Study of Serum
Glutamyltransferase and Risk of NIDDM. Diabetes Care 21, 732-737.
Peters AL, Davidson MB, Schriger DL, & Hasselblad V (1997). A clinical approach for
the diagnosis of diabetes mellitus: an analysis using glycosylated hemoglobin levels.
Meta-analysis Research Group on the Diagnosis of Diabetes Using Glycated
Hemoglobin Levels. JAMA 276, 1246-1252.
Petersen OH, Petersen CCH, & Kasai H (1994). Calcium and hormone action. Annu Rev
Physiol 56, 297-319.
Petropoulos I, Margetis P, Antonelou M, Koliopoulos J, Gartaganis S, Margaritis L, &
Papassideri I (2007). Structural alterations of the erythrocyte membrane proteins in

Page 205
diabetic retinopathy. Graefe's Archive for Clinical and Experimental Ophthalmology
245, 1179-1188.
Pickup J, Mattock M, Chusney G, & Burt D (1997). NIDDM as a disease of the innate
immune system: association of acute-phase reactants and interleukin-6 with metabolic
syndrome X. Diabetologia 40, 1286-1292.
Pickup JC & Crook MA (1998). Is Type II diabetes mellitus a disease of the innate
immune system? Diabetologia 41, 1241-1248.
Pickup JC (2004). Inflammation and Activated Innate Immunity in the Pathogenesis of
Type 2 Diabetes. Diabetes Care 27, 813-823.
Piemonti L, Calori G, Mercalli A, Lattuada G, Monti P, Garancini MP, Costantino F,
Ruotolo G, Luzi L, & Perseghin G (2003). Fasting Plasma Leptin, Tumor Necrosis
Factor Receptor 2, and Monocyte Chemoattracting Protein 1 Concentration in a
Population of Glucose-Tolerant and Glucose-Intolerant Women. Diabetes Care 26,
2883-2889.
Pierce GN & Russell JC (1997). Regulation of intracellular Ca2+
in the heart during
diabetes. Cardiovascular Research 34, 41-47.
Pirat J C (1978). Diabetes mellitus and its degenerative complications — A prospective
study of 4.400 patients observed between 1947 and 1973. Diabetes Care 1, 168-188.
Polonsky KS, Sturis J, & Bell GI (1996). Non-Insulin-Dependent Diabetes Mellitus -- A
Genetically Programmed Failure of the Beta Cell to Compensate for Insulin Resistance.
N Engl J Med 334, 777-783.
Popko K, Winklewski P, Jakubczak B, Wasilewski R, Wasik M (2003). Changes in
intracellular calcium free and calcium stored balance in children granulocytes after
stimulation. Preliminary results. Centr Eur J Immunol; 28: 62-66.
Pozzan T, Lew DP, Wollheim CB, & Tsien RY (1983). Is cytosolic ionized calcium
regulating neutrophil activation? Science 221, 1413-1415.
Pradhan AD, Manson JE, Rifai N, Buring JE, & Ridker PM (2001). C-Reactive Protein,
Interleukin 6, and Risk of Developing Type 2 Diabetes Mellitus. JAMA: The Journal of
the American Medical Association 286, 327-334.

Page 206
Ramana Devi C H, V, Prasad MH, Reddy TP, & Reddy P P (1997). Glycosylation of
hemoglobin and erythrocyte membrane proteins mediated changes in osmotic fragility
of erythrocytes. Indian journal of Medical Sciences 51, 5-9.
Randriamampita C & Tsien RY (1993). Emptying of intracellular Ca2+
stores releases a
novel small messenger that stimulates Ca2+
influx. Nature 364, 809-814.
Rasmussen H (1986). The Calcium Messenger System. N Engl J Med 314, 1094-1101.
Rather LJ (1971). Disturbance of function (functio laesa): the legendary fifth cardinal
sign of inflammation, added by Galen to the four cardinal signs of Celsus. Bull N Y
Acad Med 47, 303-322.
Raz I, Havivi Y, & Yarom R (1988). Reduced negative surface charge on arterial
endothelium of diabetic rats. Diabetologia 31, 618-620.
Razz I & Haivivi E (1989). Trace elements in blood cells of diabetic subjects. Diabetes
Res 10, 1-4.
Reaven GM & Hoffman BB (1987). "A role for insulin in the aetiology and course of
hypertension?" . The Lancet 2, 435-437.
Repine JE, Clawson CC, & Goetz FC (1980). Bactericidal function of neutrophils from
patients with acute bacterial infections and from diabetics. J Infect Dis 142, 869-875.
Resnick LM, Laragh JH, Sealey JE, & Alderman MH (1983). Divalent Cations in
Essential Hypertension. New England Journal of Medicine 309, 888-891.
Ridker PM, Cushman M, Stampfer MJ, Tracy RP, & Hennekens CH (1997).
Inflammation, Aspirin, and the Risk of Cardiovascular Disease in Apparently Healthy
Men. N Engl J Med 336, 973-979.
Ridker PM, Hennekens CH, Buring JE, & Rifai N (2000). C-Reactive Protein and Other
Markers of Inflammation in the Prediction of Cardiovascular Disease in Women. N
Engl J Med 342, 836-843.
Ripsin CM, Kang H, & Urban RJ (2009). Management of Blood Glucose in Type 2
Diabetes Mellitus. American Family Physician 79, 29-36.
Roberts MA, Thomas MC, Fernando D, Macmillan N, Power DA, & Ierino FL (2006).
Low molecular weight advanced glycation end products predict mortality in

Page 207
asymptomatic patients receiving chronic haemodialysis. Nephrology Dialysis
Transplantation 21, 1611-1617.
Roe MW, Philipson LH, Frangakis CJ, Kuznestov A, Mertz RJ, & Lancaster ME
(1994). Defective glucose-dependent endoplasmic reticulum Ca2+
sequestration in
diabetic mouse islets of Langerhans 269, 18,279-18,282. J Biol Chem 269, 18-282.
Rogers ME, Williams DT, Niththyananthan R, Rampling MW, Heslop KE, & Johnston
DG (1992). Decrease in erythrocyte glycophorin sialic acid content is associated with
increased erythrocyte aggregation in human diabetes. Clin Sci 82, 309-313.
Rohn RD, Pleban P, & Jenkins LL (1993). Magnesium, zinc and copper in plasma and
blood cellular components in children with IDDM. Clinica Chimica Acta 215, 21-28.
Rolo AP & Palmeira CM (2006). Diabetes and mitochondrial function: Role of
hyperglycemia and oxidative stress. Toxicology and Applied Pharmacology 212, 167-
178.
Rosado JA & Sage SO (2000a). A role for the actin cytoskeleton in the initiation and
maintenance of store-mediated calcium entry in human platelets. Trends Cardiovasc
Med 10, 327-332.
Rosado JA & Sage SO (2000b). The actin cytoskeleton in store-mediated calcium entry.
J Physiol 526, 221-229.
Rosamond W, Flegal K, Friday G, Furie K, Go A, Greenlund K, Haase N, Ho M,
Howard V, Kissela B, Kittner S, Lloyd-Jones D, McDermott M, Meigs J, Moy C,
Nichol G, O'Donnell CJ, Roger V, Rumsfeld J, Sorlie P, Steinberger J, Thom T,
Wasserthiel-Smoller S, Hong Y, & for the American Heart Association Statistics
Committee and Stroke Statistics Subcommittee (2007). Heart Disease and Stroke
Statistics--2007 Update: A Report From the American Heart Association Statistics
Committee and Stroke Statistics Subcommittee. Circulation 115, e69-171.
Rosenbloom AL, Silverstein JH, Amemiya S, Zeitler P, & Klingensmith GJ (2008).
Type 2 diabetes mellitus in the child and adolescent. Pediatric Diabetes 9, 512-526.
Ross R & Harker L (1976). Hyperlipidemia and atherosclerosis. Science 193, 1094-
1100.
Ross R (1999). Atherosclerosis - An inflammatory disease. N Engl J Med 340, 115-126.

Page 208
Rowe J W, Tobin J D, Rosa R M, & Andres R (1980). Effect of experimental potassium
deficiency on glucose and insulin metabolism. Metabolism 29, 498-502.
Ruiz C, Alegria A, Barbera R, Farre R, & Lagarda J (1998). Selenium, zinc and copper
in plasma of patients with type 1 diabetes mellitus in different metabolic control states.
J Trace Elements Med Biol 12, 91-95.
Saha A, Adak S, Chowdhury S, & Bhattacharyya M (2005). Enhanced oxygen releasing
capacity and oxidative stress in diabetes mellitus and diabetes mellitus-associated
cardiovascular disease: A comparative study. Clinica Chimica Acta 361, 141-149.
Sakata N, Meng J, Jimi S, & Takebayashi S (1995). Nonenzymatic glycation and
extractability of collagen in human atherosclerotic plaques. Atherosclerosis 116, 63-75.
Salman AG, Mansour DEAA, Swelem AHA, Al-Zawahary WMA, & Radwan AA
(2009). Pentosidine GÇô A New Biochemical Marker in Diabetic Retinopathy.
Ophthalmic Research 42, 96-98.
Salomao M, Zhang X, Yang Y, Lee S, Hartwig JH, Chasis JA, Mohandas N, & An X
(2008). Protein 4.1R-dependent multiprotein complex: New insights into the structural
organization of the red blood cell membrane. Proceedings of the National Academy of
Sciences of the United States of America 105, 8026-8031.
Sargeant P, Farndale RW, & Sage S (1993). ADP- and thapsigarginevoked Ca2+
entry
and protein-tyrosine phosphorylation are inhibited by the tyrosine kinase inhibitors
genistein and methyl-2,5-dihydroxycinnamate in fura-2-loaded human platelets. J. Biol
Chem 268, 18151-18156.
Sarwar N, Danesh J, Eiriksdottir G, Sigurdsson G, Wareham N, Bingham S, Boekholdt
SM, Khaw KT, & Gudnason V (2007). Triglycerides and the Risk of Coronary Heart
Disease: 10 158 Incident Cases Among 262 525 Participants in 29 Western Prospective
Studies. Circulation 115, 450-458.
Sattar N, Murray HM, McConnachie A, Blauw GJ, Bollen ELEM, Buckley BM, Cobbe
SM, Ford I, Gaw A, Hyland M, Jukema JW, Kamper AM, MacFarlane PW, Murphy
MB, Packard CJ, Perry IJ, Stott DJ, Sweeney BJ, Twomey C, Westendorp RGJ,
Shepherd J, & for the PROSPER Study Group (2007). C-Reactive Protein and
Prediction of Coronary Heart Disease and Global Vascular Events in the Prospective
Study of Pravastatin in the Elderly at Risk (PROSPER). Circulation 115, 981-989.
Sattar N, Scherbakova O, Ford I, OGÇÖReilly DS, Stanley A, Forrest E, MacFarlane
PW, Packard CJ, Cobbe SM, & Shepherd J (2004). Elevated Alanine Aminotransferase
Predicts New-Onset Type 2 Diabetes Independently of Classical Risk Factors,

Page 209
Metabolic Syndrome, and C-Reactive Protein in the West of Scotland Coronary
Prevention Study. Diabetes 53, 2855-2860.
Sattar N, Wannamethee G, Sarwar N, Tchernova J, Cherry L, Wallace AM, Danesh J, &
Whincup PH (2006). Adiponectin and Coronary Heart Disease: A Prospective Study
and Meta-Analysis. Circulation 114, 623-629.
Scarborough P, Bhatnagar P, Wickramasinghe K, Smolina K, Mitchell C, Rayner M
(2010). British Heart Foundation, Coronary Heart Disease Statistics, 2010 Edition.
Schaffer SW & Mozaffari M (1996). Abnormal mechanical function in diabetes:
relation to myocardial calcium handling. Coronary Artery Disease 7, 109-115.
Schalkwijk CG, Baidoshvili A, Stehouwer CD, van Hinsbergh VW, & Niessen HW
(2004). Increased accumulation of the glycoxidation product Nepsilon-
(carboxymethyl)lysine in hearts of diabetic patients: generation and characterisation of a
monoclonal anti-CML antibody. Biochim Biophys Acta 1636, 82-89.
Schalkwijk CG, Chaturvedi N, Twaafhoven H, Van Hinsbergh VWM, Stehouwer CDA,
& the EUCLID Study Group (2002). Amadori-albumin correlates with microvascular
complications and precedes nephropathy in type 1 diabetic patients. European Journal
of Clinical Investigation 32, 500-506.
Schwartz RS, Madsen JW, Rybicki AC, & Nagel RL (1991). Oxidation of spectrin and
deformability defects in diabetic erythrocytes. Diabetes 40, 701-708.
Selhub J, Jacques PF, Bostom AG, D'Agostino RB, Wilson PWF, Belanger AJ, O'Leary
DH, Wolf PA, Schaefer EJ, & Rosenberg IH (1995). Association between Plasma
Homocysteine Concentrations and Extracranial Carotid-Artery Stenosis. The New
England Journal of Medicine 332, 286-291.
Sell DR & Monnier VM (1989). Structure elucidation of a senescence cross-link from
human extracellular matrix. Implication of pentoses in the aging process. Journal of
Biological Chemistry 264, 21597-21602.
Semba RD, Ferrucci L, Fink JC, Sun K, Beck J, Dalal M, Guralnik JM, & Fried LP
(2009). Advanced Glycation End Products and Their Circulating Receptors and Level
of Kidney Function in Older Community-Dwelling Women. American Journal of
Kidney Diseases 53, 51-58.
Sesti G, Sciacqua A, Cardellini M, Marini MA, Maio R, Vatrano M, Succurro E, Lauro
R, Federici M, & Perticone F (2005). Plasma Concentration of IGF-I Is Independently
Page 210
Associated With Insulin Sensitivity in Subjects With Different Degrees of Glucose
Tolerance. Diabetes Care 28, 120-125.
Sha'afi R I, Naccache P H, Molski T F, Borgeat P, & Goetzl E J (1981). Cellular
regulatory role of leukotriene B4: its effects on cation homeostasis in rabbit neutrophils.
J Cell Physiol 108, 401-408.
Shahar E, Chambless LE, Rosamond WD, Boland LL, Ballantyne CM, McGovern PG,
& Sharrett AR (2003). Plasma Lipid Profile and Incident Ischemic Stroke: The
Atherosclerosis Risk in Communities (ARIC) Study. Stroke 34, 623-631.
Short RA, Johnson RJ, & Tuttle KR (2005). Uric acid, microalbuminuria and
cardiovascular events in high-risk patients. Am J Nephrol 25, 36-44.
Shu L, Matveyenko AV, Kerr-Conte J, Cho JH, McIntosh CH, Maedler K: (2009).
Decreased TCF7L2 protein levels in type 2 diabetes mellitus correlate with
downregulation of GIP- and GLP-1 receptors and impaired beta-cell function. Hum Mol
Genet ;18:2388–2399
Sies H (1997). Oxidative stress: oxidants and antioxidants. Experimental Physiology 82,
291-295.
Sims TJ, Rasmussen LM, Oxlund H, & Bailey AJ (1996). The role of glycation cross-
links in diabetic vascular stiffening. Diabetologia 39, 946-951.
Singal PK, Bello-klein A, Farahmand F, & Sandhawatia V (2001). Oxidative stress and
functional deficite in diabetic cardiomyopathy. Adv Exp Med Biol 498, 213-220.
Singh R, Barden A, Mori T, & Beilin L (2001). Advanced glycation end-products: a
review. Diabetologia 44, 129-146.
Sivilotti MLA (2004). Oxidant stress and haemolysis of the human erythrocyte.
Toxicological Reviews 23, 169-188.
Sloop GD, Williams KJ, Tabas I, Weissberg PL, Bennett MR, & Ross R (1999).
Atherosclerosis -- An Inflammatory Disease. N Engl J Med 340, 1928-1929.
Snyder LM, Fortier NL, Trainor J, Jacobs J, Leb L, Lubin B, Chiu D, Shohet S, &
Mohandas N (1985). Effect of hydrogen peroxide exposure on normal human
erythrocyte deformability, morphology, surface characteristics, and spectrin-
hemoglobin cross-linking. J Clin Invest 76, 1971-1977.

Page 211
Snyder LM, Leb L, Piotrowski J, Sauberman N, Liu SC, & Fortier NL (1983).
Irreversible spectrin-haemoglobin crosslinking in vivo: a marker for red cell senescence.
British Journal of Haematology 53, 379-384.
Sobel BE & Schneider DJ (2005). Cardiovascular complications in diabetes mellitus.
Current Opinion in Pharmacology 5, 143-148.
Solini A, Di Virgilio F, Sfriso A, Bruseghin M, Crepaldi G, Nosadini R (1996).
Intracellular calcium handling by fibro- blasts from non-insulin dependent diabetic
patients with and without hypertension and microalbuminuria. Kidney international; 50
(2): 618-626.
Song SH & Hardisty CA (2008). Type 2 diabetes mellitus: a high-risk condition for
cardiovascular disease irrespective of the different degrees of obesity. Qjm-An
International Journal of Medicine 101, 875-879.
Sowers JR, Epstein M, & Frohlich ED (2001). Diabetes, Hypertension, and
Cardiovascular Disease : An Update. Hypertension 37, 1053-1059.
Speakman JR (2008). Thrifty genes for obesity, an attractive but flawed idea, and an
alternative perspective: the /`drifty gene/' hypothesis. Int J Obes 32, 1611-1617.
Srinivasan BT, Jarvis J, Khunti K, & Davies MJ (2008). Recent advances in the
management of type 2 diabetes mellitus: a review. Postgraduate Medical Journal 84,
524-531.
Steinberg D, Parthasarathy S, Carew TE, Khoo JC, & Witztum JL (1989). Beyond
cholesetrol: modification of low-density lipoprotein that increase its atherogenicity. N
Engl J Med 320, 915-924.
Stern MP (1995). Diabetes and cardiovascular disease: The 'common soil' hypothesis.
Diabetes 44, 369-374.
Straface E, Rivabene R, Masella R, Santulli M, Paganelli R, & Malorni W (2002).
Structural Changes of the Erythrocyte as a Marker of Non-Insulin-Dependent Diabetes:
Protective Effects of N-Acetylcysteine. Biochemical and Biophysical Research
Communications 290, 1393-1398.
Stringer MD, Gorog PG, Freeman A, & Kakkar VV (1989). Lipid peroxides and
atherosclerosis. BMJ 298, 281-284.

Page 212
Szmitko PE, Wang CH, Weisel RD, de Almeida JR, Anderson TJ, & Verma S (2003).
New Markers of Inflammation and Endothelial Cell Activation: Part I. Circulation 108,
1917-1923.
Tahara Y & Shima K (1995). Kinetics of HbA1c, Glycated Albumin, and Fructosamine
and Analysis of Their Weight Functions Against Preceding Plasma Glucose Level.
Diabetes Care 18, 440-447.
Takasawa S, Nata K, Yonekura H, & Okamoto H (1993). Cyclic ADP-ribose in insulin
secretion from pancreatic beta cells. Science 259, 370-373.
Takaya J, Iwamoto Y, Higashino H, Ishihara R, & Kobayashi Y (1997a). Increased
intracellular calcium and altered phorbol dibutyrate binding to intact platelets in young
subjects with insulin-dependent and nonGÇöinsulin-dependent diabetes mellitus.
Metabolism 46, 949-953.
Tames FJ, Mackness MI, Arrol S, Laing I, & Durrington PN (1992). Non-enzymatic
glycation of apolipoprotein B in the sera of diabetic and non-diabetic subjects.
Atherosclerosis 93, 237-244.
Tang S, Le-Tien H, Goldstein BJ, Shin P, Lai R, & Fantus IG (2001). Decreased In Situ
Insulin Receptor Dephosphorylation in Hyperglycemia-Induced Insulin Resistance in
Rat Adipocytes. Diabetes 50, 83-90.
Tanner MJA (1997). The structure and function of band 3 (AE1): Recent developments
(review). Molecular Membrane Biology 14, 155-165.
Targher G, Bertolini L, Scala L, Zoppini G, Zenari L, & Falezza G (2005). Non-
alcoholic hepatic steatosis and its relation to increased plasma biomarkers of
inflammation and endothelial dysfunction in non-diabetic men. Role of visceral adipose
tissue. Diabetic Medicine 22, 1354-1358.
Tessari P, Kiwanuka E, Coracina A, Zaramella M, Vettore M, Valerio A, & Garibotto G
(2005). Insulin in methionine and homocysteine kinetics in healthy humans: plasma vs.
intracellular models. Am J Physiol Endocrinol Metab 288, E1270-E1276.
Testafamarian B (1994). Free radicals in endothelial cell dysfunction. Free Radic Biol
Med 16, 383-391.
Thomas MC, Baynes JW, Thorpe SR, & Cooper ME (2005). The role of AGEs and
AGE inhibitors in diabetic cardiovascular disease. Curr Drug Targets 6, 453-474.

Page 213
Thomas MC, MacIsaac RJ, Tsalamandris C, & Jerums G (2004). Elevated iron indices
in patients with diabetes. Diabetic Medicine 21, 798-802.
Thompson A & Danesh J (2006). Associations between apolipoprotein B,
apolipoprotein AI, the apolipoprotein B/AI ratio and coronary heart disease: a literature-
based meta-analysis of prospective studies. Journal of Internal Medicine 259, 481-492.
Thorand B, Baumert J, Kolb H, Meisinger C, Chambless L, Koenig W, & Herder C
(2007). Sex Differences in the Prediction of Type 2 Diabetes by Inflammatory Markers.
Diabetes Care 30, 854-860.
Tian J, Chen JH, Li Q, He Q, & Lin WQ (2005). Lipid peroxidation in IgA
nephropathy and the effect of lipo-prostaglandin E1. J Nephrol 18, 243-248.
Timimi FK, Ting HH, Haley EA, Roddy MA, Ganz P, & Creager MA (1998). Vitamin
C Improves Endothelium-Dependent Vasodilation in Patients With Insulin-Dependent
Diabetes Mellitus. Journal of the American College of Cardiology 31, 552-557.
Ting HH, Timimi FK, Boles KS, Creager SJ, Ganz P, & Creager MA (1996). Vitamin C
improves endothelium-dependent vasodilation in patients with non-insulin-dependent
diabetes mellitus. J Clin Invest 97, 22-28.
Tomizawa H, Yamazaki M, Kunika K, Itakura M, & Yamashita K (1993). Association
of elastin glycation and calcium deposit in diabetic rat aorta. Diabetes Research and
Clinical Practice 19, 1-8.
Tsigos C, Papanicolaou DA, Kyrou I, Defensor R, Mitsiadis CS, & Chrousos GP
(1997). Dose-Dependent Effects of Recombinant Human Interleukin-6 on Glucose
Regulation. Journal of Clinical Endocrinology & Metabolism 82, 4167-4170.
Tso AWK, Xu A, Sham PC, Wat NMS, Wang Y, Fong CHY, Cheung BMY, Janus ED,
& Lam KSL (2007). Serum Adipocyte Fatty AcidGÇôBinding Protein as a New
Biomarker Predicting the Development of Type 2 Diabetes. Diabetes Care 30, 2667-
2672.
Tsuji K, Taminato T, Ishida H, Okamoto Y, Tsuura Y, Kato S, Kurose T, Okada Y,
Imura H, & Seino Y (1993). Selective impairment of the cytoplasmic Ca2+
response to
glucose in pancreatic cells of streptozocin-induced non-insulin-dependent diabetic rats.
Metabolism 42, 1424-1428.
Tuomilehto J, Lindstrom J, & Qiao Q (2005). Strategies for the prevention of type 2
diabetes and cardiovascular disease. Eur Heart J Suppl 7, D18-D22.
Page 214
Van Zwieten R, Bolscher BGJM, Schouten-Van Meeteren AYN, Hoffmann JJML, &
Roos D (1995). Determination of spectrin in erythrocytes: An important diagnostic test
in hereditary spherocytosis. Nederlands Tijdschrift voor Geneeskunde 139, 2256-2261.
Verchere CB, D'Alessio DA, Palmiter RD, Weir GC, Bonner-Weir S, Baskin DG, &
Kahn SE (1996). Islet amyloid formation associated with hyperglycemia in transgenic
mice with pancreatic beta cell expression of human islet amyloid polypeptide.
Proceedings of the National Academy of Sciences of the United States of America 93,
3492-3496.
Verma S & Anderson TJ (2002). Fundamentals of Endothelial Function for the Clinical
Cardiologist. Circulation 105, 546-549.
Vlassara H & Palace MR (2002). Diabetes and advanced glycation endproducts.
Journal of Internal Medicine 251, 87-101.
Vlassara H, Li YM, & Imani F (1996). Identification of galectin-3 as a high affinity
binding protein for advanced glycation end products (AGEs): a new member of the
AGE-receptor complex. Mol Med 1, 634-646.
Vlassara H, Valinsky J, Brownlee M, Cerami C, Nishimoto S, & Cerami A (1987).
Advanced glycosylation endproducts on erythrocyte cell surface induce receptor-
mediated phagocytosis by macrophages. A model for turnover of aging cells. The
Journal of Experimental Medicine 166, 539-549.
Volzke H, Gruska S, Vogelgesang D, Kerner W, Kraatz G, & Rettig R (2006).
Intracellular calcium and sodium-lithium countertransport in type 2 diabetic patients
with and without albuminuria. Endocrine Journal 53, 773-781.
Wacker WEC (1969). The biochemistry of magnesium*. Annals of the New York
Academy of Sciences 162, 717-726.
Wagle TJ (2010). Genderwise comparison of serum creatinine and blood sugar levels in
type 2 diabetic patients. Bombay Hospital J 52, 64-68.
Walter RMJ, Uriu-Hare JY, Olin KL, Oster MH, Anawalt BD, Critchfiel dJW, & Keen
CL (1991). Copper, zinc, manganese, and magnesium status and complications of
diabetes mellitus. Diabetes Care 11, 1050-1056.
Wannamethee SG, Lowe GDO, Rumley A, Cherry L, Whincup PH, & Sattar N (2007).
Adipokines and Risk of Type 2 Diabetes in Older Men. Diabetes Care 30, 1200-1205.

Page 215
Wannamethee SG, Lowe GDO, Shaper AG, Rumley A, Lennon L, & Whincup PH
(2005). Associations between cigarette smoking, pipe/cigar smoking, and smoking
cessation, and haemostatic and inflammatory markers for cardiovascular disease. Eur
Heart J ehi183.
Westermark P & Wilander E (1978). The influence of amyloid deposits on the islet
volume in maturity onset diabetes mellitus. Diabetologia 15, 417-421.
Whang R (1987). Magnesium deficiency: pathogenesis, prevalence, and clinical
implications. Am J Med 82, 24-29.
Willerson JT & Ridker PM (2004). Inflammation as a Cardiovascular Risk Factor.
Circulation 109, II-2.
Williams B & Schrier RW (1993). Effect of elevated extracellular glucose
concentrations on transmembrane calcium ion fluxes in cultured rat VSMC. Kidney Int
44, 344-351.
Wolff SP & Dean RT (1987). Glucose autoxidation and protein modification. The
potential role of 'autoxidative glycosylation' in diabetes. Biochem J 245, 243-250.
Wolff SP, Jiang ZY, & Hunt JV (1991). Protein glycation and oxidative stress in
diabetes mellitus and ageing. Free Radical Biology and Medicine 10, 339-352.
Wright DC, Hucker KA, Holloszy JO, & Han DH (2004). Ca2 and AMPK both mediate
stimulation of glucose transport by muscle contractions. Diabetes 53, 330-335.
Xu A, Wang Y, Xu JY, Stejskal D, Tam S, Zhang J, Wat NMS, Wong WK, & Lam
KSL (2006). Adipocyte Fatty Acid-Binding Protein Is a Plasma Biomarker Closely
Associated with Obesity and Metabolic Syndrome. Clin Chem 52, 405-413.
Yamauchi T, Tobe K, Tamemoto H, Ueki K, Kaburagi Y, Yamamoto-Honda R,
Takahashi Y, Yoshizawa F, Aizawa S, Akanuma Y, Sonenberg N, Yazaki Y, &
Kadowaki T (1996). Insulin signalling and insulin actions in the muscles and livers of
insulin-resistant, insulin receptor substrate 1-deficient mice. Mol Cell Biol 16, 3074-
3084.
Yan SD, Chen X, Fu J, Chen M, Zhu H, Roher A, Slattery T, Zhao L, Nagashima M,
Morser J, Migheli A, Nawroth P, Stern D, & Schmidt AM (1996). RAGE and amyloid-
[beta] peptide neurotoxicity in Alzheimer's disease. Nature 382, 685-691.

Page 216
Yoshinaga H & Kosaka K (1996). High glycosylated hemoglobin levels increase the
risk of progression to diabetes mellitus in subjects with glucose intolerance. Diabetes
Res Clin Pract 31, 71-79.
Yu JZ, Rodrigues B, & McNeill JH (1997). Intracellular calcium levels are unchanged
in the diabetic heart. Cardiovascular Research 34, 91-98.
Yudkin JS, Kumari M, Humphries SE, & Mohamed-Ali V (2000). Inflammation,
obesity, stress and coronary heart disease: is interleukin-6 the link? Atherosclerosis 148,
209-214.
Yudkin JS, Stehouwer CDA, Emeis JJ, & Coppack SW (1999). C-Reactive Protein in
Healthy Subjects: Associations With Obesity, Insulin Resistance, and Endothelial
Dysfunction : A Potential Role for Cytokines Originating From Adipose Tissue?
Arteriosclerosis, Thrombosis, and Vascular Biology 19, 972-978.
Zargar AH, Shah NA, Masoodi SR, Laway BA, Dar FA, Khan AR, Sofi FA, & Wani AI
(1998). Copper, zinc, and magnesium levels in non-insulin dependent diabetes mellitus.
Postgraduate Medical Journal 74, 665-668.
Zeggini E, McCarthy MI (2007) TCF7L2: the biggest story in diabetes genetics since
HLA? Diabetologia 50:1–4
Zhang R, Ma J, Xia M, Zhu H, & Ling W (2004). Mild Hyperhomocysteinemia Induced
by Feeding Rats Diets Rich in Methionine or Deficient in Folate Promotes Early
Atherosclerotic Inflammatory Processes. J Nutr 134, 825-830.
Zillich AJ, Garg J, Basu S, Bakris GL, & Carter BL (2006). Thiazide Diuretics,
Potassium, and the Development of Diabetes. Hypertension 48, 219-224.
Zimmet P, Shaw J, & Schneider H (2003). Guidelines for the Detection of Diabetes
Mellitus - Diagnostic Criteria and Rationale for Screening. Clin Biochem Rev 24, 77-80.
Zoppini G, Targher G, Chonchol M, Negri C, Stoico V, Pichiri I, Lippi G, Muggeo M,
& Bonora E (2010). Anaemia, independent of chronic kidney disease, predicts all-cause
and cardiovascular mortality in type 2 diabetic patients. Atherosclerosis 210, 575-580.

Page 217
Appendices
Page 218
Appendix 1
Poster presentation at “Physiology 2011”,
Physiological Society Meeting, University of Oxford,
11-14 July, 2011.

Page 219
Page 220
Appendix 2
Poster presentation at ―The 3rd International
Conference on Advanced Technologies and
Treatments for Diabetes‖, Basel, Switzerland, Feb
10-13, 2010.

Page 221

Page 222
Appendix 3
Poster presentation at ―Annual Graduate
Conference‖, University of Central Lancashire,
Preston, United Kingdom, June 2009.
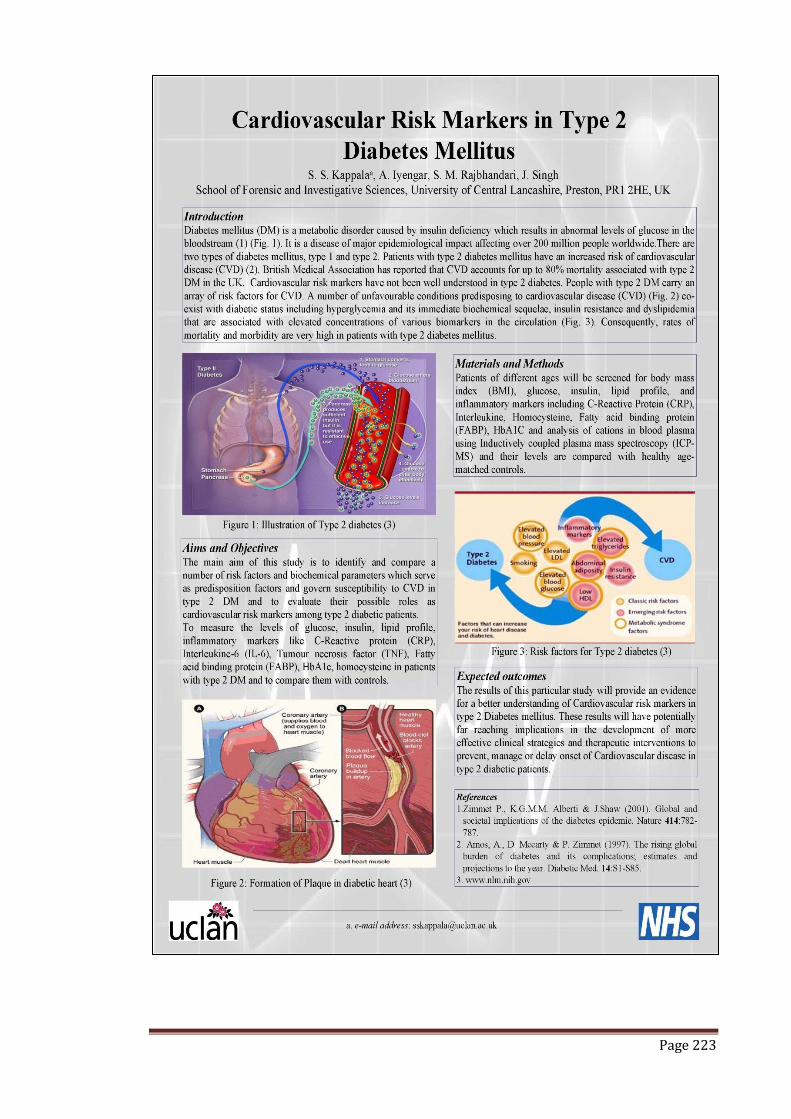
Page 223
Page 224
Appendix 4
Chemicals and Reagents
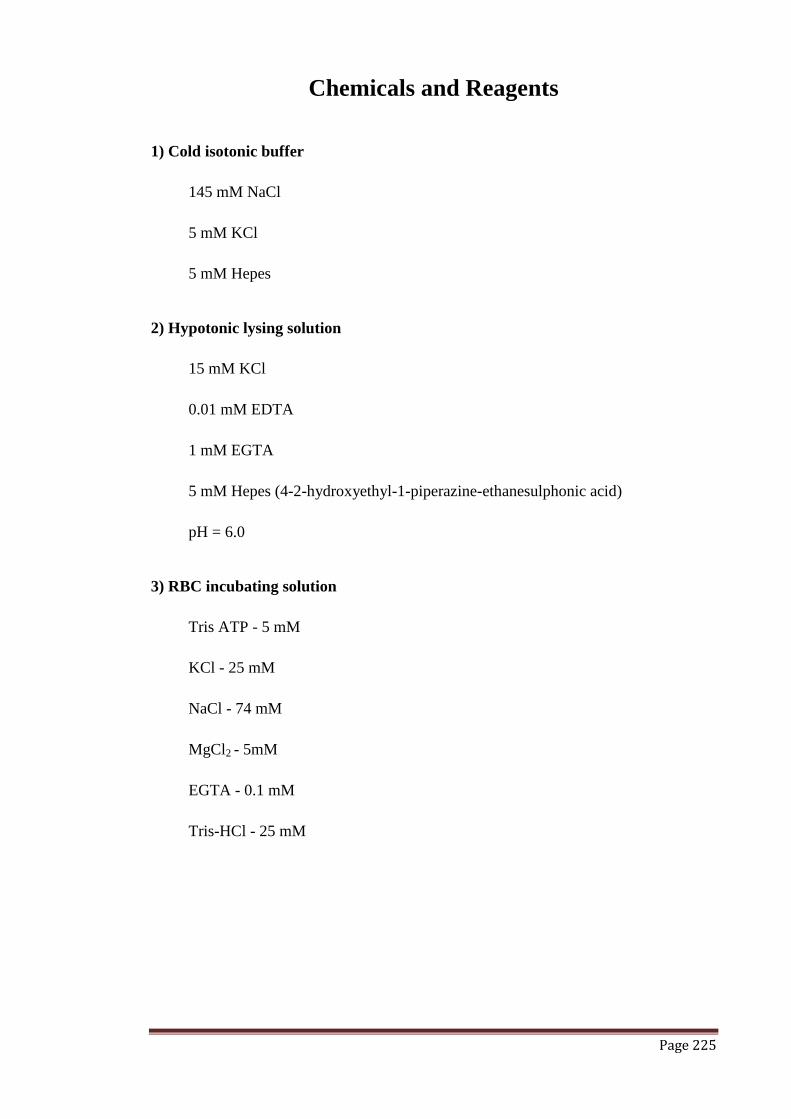
Page 225
Chemicals and Reagents
1) Cold isotonic buffer
145 mM NaCl
5 mM KCl
5 mM Hepes
2) Hypotonic lysing solution
15 mM KCl
0.01 mM EDTA
1 mM EGTA
5 mM Hepes (4-2-hydroxyethyl-1-piperazine-ethanesulphonic acid)
pH = 6.0
3) RBC incubating solution
Tris ATP - 5 mM
KCl - 25 mM
NaCl - 74 mM
MgCl2 - 5mM
EGTA - 0.1 mM
Tris-HCl - 25 mM

Page 226
Appendix 5
Conference Proceedings

Page 227

Page 228
Copyright © 2022 FDOKUMEN