Risk factors for Type 2 Diabetes Mellitus: - CORE
146
Risk factors for Type 2 Diabetes Mellitus: Metabolic Syndrome, Insulin Resistance and Primary Prevention. Muhammad Zafar Iqbal Hydrie Supervisor: Professor Akhtar Hussain Co-supervisor: Professor Abdul Basit University of Oslo Faculty of Medicine Institute of Health and Society Department of Community Medicine Section for International Health Doctoral Thesis
-
Upload
khangminh22 -
Category
Documents
-
view
0 -
download
0
Transcript of Risk factors for Type 2 Diabetes Mellitus: - CORE

Risk factors for Type 2 Diabetes Mellitus: Metabolic Syndrome, Insulin Resistance and Primary Prevention.
Muhammad Zafar Iqbal Hydrie
Supervisor:
Professor Akhtar Hussain
Co-supervisor:
Professor Abdul Basit
University of Oslo
Faculty of Medicine
Institute of Health and Society
Department of Community Medicine
Section for International Health
Doctoral Thesis

© Muhammad Zafar Iqbal Hydrie, 2012 Series of dissertations submitted to the Faculty of Medicine, University of Oslo No. 1269 ISBN 978-82-8264-171-5 All rights reserved. No part of this publication may be reproduced or transmitted, in any form or by any means, without permission. Cover: Inger Sandved Anfinsen. Printed in Norway: AIT Oslo AS. Produced in co-operation with Unipub. The thesis is produced by Unipub merely in connection with the thesis defence. Kindly direct all inquiries regarding the thesis to the copyright holder or the unit which grants the doctorate.
rgram
Typewritten Text
rgram
Typewritten Text
rgram
Typewritten Text
rgram
Typewritten Text
Acknowledgment
I am deeply grateful to my principal supervisor Professor Akhtar Hussain for his patience,
expert guidance, encouragement and support during my study period in Oslo. I also owe my
sincere heart felt gratitude to Professor Abdul Basit, my local supervisor and mentor for
having firm belief in me and for his valuable support and guidance through out my career.
This work would not have been possible without the support and contribution of a great
number of people. I would like to thank all of my colleagues in Pakistan who helped me in
the studies and supported me during the study period. I would like to thank all the
participants and volunteers for their contribution, and special thanks to my research team
who helped during the study. I would also like to thank all my co-authors for their
contribution to my publications.
I would also like to acknowledge the Norwegian State Education Loan Fund through the
Quota Programme and the department of International Health, University of Oslo for the
financial support that has enabled me to take up this programme. I also thank the
Norwegian Research Council for funding my research.
I have enjoyed working with the people at the Department of International Health and
special thanks to my teachers Prof. Gunnar Bjune and Prof. Johanne Sundby for their
valuable inputs. I would like to thank Ragnhild Beyrer, Line Løw, Vibeke Christie and other
staff members of the department for their kind help and cooperation during my stay. I
would also like to thank my classmates here in Norway, friends and relations for their well
wishes towards me
I am indebted to my wife for her constant cooperation and support during my time of study
here. It was a difficult time for her and I appreciate her efforts to take care of the family in
my absent as well as having to put up with me during this stressful period.
I am grateful to the encouragement and constant support of my sister during my study. My
mother’s inspiration and prayers helped me to look forward and words of wisdom of my
father has helped me during my study.
Abstract
Aims:
The purpose of the study was to identify the extent of metabolic syndrome on the basis of
ATP III and IDF definition in subjects aged 25 years and above from an urban population of
Karachi. Also to see the association of risk factors related to diabetes and metabolic
syndrome in this population. And finally to prove the hypothesis of intervention effect on
the onset of type 2 diabetes in a high risk urban population and evaluate the rate of
conversion of IGT to diabetes by these interventions in this population.
Methods:The epidemiological survey was designed to see the prevalence of metabolic syndrome and
its risk factors among 500 randomly selected households in Lyari, an urban area within
Karachi city in 2004 . We generated a computerized random sample of the households from
among the 85,520 households in Lyari Town. There were 11 union councils in Lyari Town
where the samples were taken and each union council had equal opportunity to be
represented in the sample selection. We expected approximately 1000 adult men and
women 25 years and above in the households selected in Lyari Town. If members of a
household that had been selected refused to consent to household interviews, we knocked
on the third door to the right of that house and seeked consent there. Out of the 85,520
households, 532 households were randomly selected and 867 adults 25 years old
consented to take part in the survey; 363 of these subjects gave blood samples.
The second study was a primary prevention trial which was started in the city of Karachi in
2006. It was a prospective randomized clinical trial (RCT) to assess the effect of intervention
for 18 months on high risk subjects. Nearly 2000 suspected high risk cases identified by a
questionnaire were to be invited to participate. Considering 30% IGT cases in high risk
individuals around 600 were expected to have IGT based on OGTT. The IGT cases were then
randomly allocated on three different arms, two preventive groups and one control group,
all with 200 participants (one of the preventive arms included metformin 500mg twice
daily). An estimated 5000 people attended the diabetes prevention lectures and visited the
screening camps and around 2300 people filled in the high risk questionnaire only 1825
were identified as high risk. Of these 1739 high risk subjects undertook a standardized oral
glucose tolerance test (OGTT) and 317 subjects were identified as having impaired glucose
tolerance (IGT group) and were randomized into the three groups.
Results: The prevalence of diabetes was 9.4%, whereas 5.6% had impaired fasting glucose (abnormal
glucose tolerance 15%). The prevalence of metabolic syndrome according to the IDF
definition and modified ATP III criteria was 34.8% and 49%, respectively. Inclusion of
modified waist circumference and specific body mass index (BMI) cut offs for Asians might
have helped in this increased prevalence of the metabolic syndrome.
Dietary data about specific food items was available for 867 adults. Participants also
completed a health and lifestyle questionnaire and 363 subjects provided fasting blood
samples for glucose and lipids. Dietary intake was assessed by a questionnaire to identify
consumption of 33 specific food items and the dietary patterns categorized into 6 food
groups was assessed by cluster analysis. Five dietary patterns were identified through
cluster analysis. Cluster 1 had the lowest proportion of persons with metabolic syndrome
i.e. 42.7% while cluster 2 had the highest percentage of metabolic syndrome subjects
(56.3%) (p=0.09). Consumption of fat and calorie dense foods was significantly higher
among highest risk group (cluster 2) compared to lowest risk group (cluster 1) (p = 0.0001).
The consumption of food groups containing fruit, milk and meat was also more than twice in
high risk compared to low risk group (p = 0.0001). Even within the same population there
are marked differences in dietary patterns and these apparently contribute to the risk of
developing metabolic syndrome.
Insulin Resistance (IR) was defined at 75th percentile cut off of insulin levels (9.25 U/mL)
and HOMA-IR (1.82). The 25th percentile cut off was used for defining IR in QUICKI (0.347)
and McAuley Index (6.77).
In the second study which was the primary prevention trial 273 subjects out of 317 subjects
completed the study giving a compliance rate of 86%. A total of 47 incident cases of
diabetes were diagnosed during the study. The overall incidence of diabetes was 4 cases per
1000 person-months with the incidence of diabetes as 8.6 cases in the control group, 2.5
cases in the Life Style Modification (LSM) group and 2.3 cases per 1000 person-months in
the LSM+drug group.

Conclusion:In the first study we observed high prevalence of metabolic syndrome irrespective of the
definition applied in this urban population. This may call for immediate action such as
preventive measures to halt the accelerating risk of diabetes and CVD which is leading to a
possible unparalleled rise in the cost of health care and human suffering.
To initiate a preventive program we need to make dietary changes within the population
and we found marked differences in dietary patterns which were apparently contribute to
the risk of developing metabolic syndrome in the same population. Dietary pattern studies
will help elucidate links between diet and disease and contribute to developing healthy
eating guidelines.
A common approach towards managing subjects with metabolic risk factors which could
help physicians would be able to identify IR cases earlier and defining IR reference values
identified from simple indirect methods would be of value in such cases. However larger
population based studies are needed to further define and validate the cutoff values defined
for insulin resistance in our population.
The primary prevention study was initiated after we had some baseline information from
our first epidemiological study and it showed that lifestyle intervention had a major impact
in preventing diabetes among IGT subjects in this region. However, addition of drug in the
intervention did not show any improved results. Resource constrain societies are challenged
with the additional burden of diabetes cost on their already ailing economy and such
lifestyle intervention approach would be of benefit in such communities. Therefore, we
recommend that lifestyle modification advice and follow-up should be incorporated in
primary health care.
Table of Contents
1 Chapter 1. Introduction ................................................................................................................ 13
1.1 Pakistan – Country Profile ..................................................................................................... 13
1.1.1 Geography: .................................................................................................................... 13
1.1.2 Population Demography: .............................................................................................. 14
1.1.3 People: .......................................................................................................................... 14
1.1.4 Education ...................................................................................................................... 14
1.1.5 Economy ........................................................................................................................ 14
1.1.6 Lifestyle and Physical Activity ....................................................................................... 14
1.1.7 Karachi ........................................................................................................................... 15
1.2 Global Burden of Chronic Non Communicable Diseases ...................................................... 15
1.2.1 Prevalence and Global trends of Diabetes .................................................................... 16
1.2.2 Diabetes in Pakistan ...................................................................................................... 17
1.3 Metabolic Syndrome (High Risk for Diabetes and CVD Epidemic) ........................................ 18
1.3.1 Definations of Metabolic Syndrome ............................................................................. 18
1.3.2 Prevalence of the Metabolic Syndrome ........................................................................ 21
1.3.3 Metabolic Syndrome in South Asians ........................................................................... 22
1.3.4 Metabolic Syndrome in Pakistan .................................................................................. 23
1.4 Associated Factors for Diabetes and Metabolic Syndrome .................................................. 23
1.4.1 Socio-demographic Factors ........................................................................................... 24
1.4.2 Overweight and Obesity ............................................................................................... 25
1.4.3 Nutritional transition .................................................................................................... 25
1.4.4 Physical Activity and Sedentary Lifestyle ...................................................................... 26
1.4.5 Glucose Intolerance (IGT and\or IFG) ........................................................................... 26
1.5 Follow-up studies of Metabolic Syndrome (Prediction of DM and CHD) ............................. 27
1.6 Intervention Epidemiology .................................................................................................... 28
1.7 Rationale or Statement of Problem ...................................................................................... 32
1.8 Research Questions and Objectives of the Study ................................................................. 33
1.8.1 Research Questions ....................................................................................................... 33
1.9 Justification of the Study ....................................................................................................... 34
2 Chapter 2: Material and Methods ................................................................................................ 35
2.1 Study Sites ............................................................................................................................. 35
2.2 Research Setting ................................................................................................................... 35
2.2.1 Epidemiological survey in Lyari town: ........................................................................... 35
2.2.2 Primary Prevention Study in Karachi city ...................................................................... 35
2.3 Study Population ................................................................................................................... 36
2.3.1 Lyari Town ..................................................................................................................... 36
2.3.2 Karachi City ................................................................................................................... 37
2.4 Sample Size ........................................................................................................................... 38
2.4.1 Lyari Town ..................................................................................................................... 38
2.4.2 Karachi City ................................................................................................................... 38
2.5 Research Design .................................................................................................................... 39
2.5.1 Lyari Town ..................................................................................................................... 39
2.5.2 Karachi City ................................................................................................................... 40
2.6 Lab Investigations: ................................................................................................................ 42
2.6.1 Blood and Urine Samples of Lyari Town Survey ........................................................... 42
2.6.2 Samples of Karachi City ................................................................................................. 43
2.7 Statistical analysis ................................................................................................................. 43
2.7.1 Lyari Data ...................................................................................................................... 43
2.7.2 Primary Prevention Study ............................................................................................. 44
2.8 Ethical Considerations ........................................................................................................... 45
2.8.1 Ethical Clearance ........................................................................................................... 45
2.8.2 Informed Consent ......................................................................................................... 45
3 Results ........................................................................................................................................... 46
3.1 Synopsis of Paper 1 ............................................................................................................... 46
3.2 Synopsis of Paper 2 ............................................................................................................... 47
3.3 Synopsis of Paper 3 ............................................................................................................... 48
3.4 Synopsis of Paper 4 ............................................................................................................... 49
3.5 Summary of the Results ........................................................................................................ 50
4 Discussion ...................................................................................................................................... 55
4.1 Methological Issues ............................................................................................................... 55
4.1.1 Choice of Study design .................................................................................................. 55
4.1.2 Sample size .................................................................................................................... 55
4.1.3 Error .............................................................................................................................. 56
4.2 Bias ........................................................................................................................................ 56
4.2.1 Selection bias ................................................................................................................ 56
4.2.2 Information bias ............................................................................................................ 57
4.2.3 Measurement bias ........................................................................................................ 57
4.3 Confounding .......................................................................................................................... 58
4.4 Internal validity ..................................................................................................................... 58
4.5 External validity ..................................................................................................................... 58
4.6 Strengths of the study ........................................................................................................... 59
4.7 Limitations of the study ........................................................................................................ 59
4.8 Discussion of the main results .............................................................................................. 60
4.8.1 Prevalence of Abnormal Glucose Tolerance ................................................................. 60
4.8.2 Prevalence of Metabolic syndrome – Different Definitions ......................................... 60
4.8.3 Prevalence of Metabolic syndrome according to modified ATP and IDF Definition .... 61
4.8.4 Dietary Trends in South Asians leading to Metabolic Syndrome .................................. 62
4.8.5 Defining Insulin Resistance ........................................................................................... 63
4.8.6 Primary Prevention Study ............................................................................................. 65
5 Implications of the results ............................................................................................................ 67
6 Conclusion ..................................................................................................................................... 69
7 References .................................................................................................................................... 70
8 Appendix I(Questionnaire of First Study) ...................................................................................... 82
9 Appendix II (Questionnaire of Second Study) ............................................................................... 96
10 Appendix III (Papers 1 – 4) ...................................................................................................... 108
List of Tables
Tabell 1: Global Burden: Prevalence and Projections of Diabetes and IGT, 2010 and 2030 ............... 16Tabell 2. Top 10 countries for numbers of people aged 20–79 years with diabetes in 2010 & 2030. . 17Tabell 3. Pakistan National Diabetes Survey ......................................................................................... 17Tabell 4. Previous criteria proposed for the diagnosis of metabolic syndrome ................................... 19Tabell 5. IDF and AHA/NHLBI ............................................................................................................ 20Tabell 6 Modifiable and non-modifiable risk factors and associated disorders for Type 2 diabetes ... 24Tabell 7 Summary of major diabetes intervention studies ................................................................... 29Tabell 8: Key features of selected published recommendations on prediabetes ................................ 31Tabell 9: Prevalence and 95 % CI of MS using modified ATP III and IDF definition by age and sex. ..... 50Tabell 10: Percentage of biochemical risk factors for Metabolic Syndrome ........................................ 50Tabell 11: Frequency of Consumption of food groups in Clusters ........................................................ 51Tabell 12: General characteristics of the study subjects ...................................................................... 52Tabell 13: Quartiles of fasting serum insulin, HOMA-IR, QUICKI and McAuley Index. ......................... 52Tabell 14: Baseline Characterstics of 1739 identified high risk subjects by questionnaire .................. 53Tabell 15: Baseline anthropometric and biochemical characteristics of the Randomized Groups ...... 54Tabell 16: Comparision of the outcome at 18 months in the four groups ........................................... 54
List of Figures
Figur 1 : Geographic Location of Pakistan ............................................................................................. 13Figur 2. Relative risk of CVD in normoglycemia, prediabetes and type 2 diabetes. (36) ...................... 18Figur 3. Insulin sensitivity (as box plots of the M/I) .............................................................................. 22Figur 4. Relative risk of developing diabetes in different categories of prediabetes. ................ 27Figur 5: Description of the 18 towns and 6 cantonments of Karachi. .................................................. 35Figur 6: Lyari Town ................................................................................................................................ 36Figur 7: Lyari Town 500 Households randomly selected ...................................................................... 36Figur 8: Metabolic syndrome in five Clusters according to Modified ATP III Definition ....................... 51Figur 9: Flowchart with recruitment of persons for the oral glucose tolerance test (OGTT) and screening and randomisation. .............................................................................................................. 53

List of Acronyms ADA American diabetes association AACE American Association of Clinical Endocrinology BMI Body mass index CHOD-PAP Cholesterol Oxidase – Para amino phenazone CHD Coronary Heart Disease CVD Cardiovascular Disease EGIR European Group for the Study of Insulin Resistance GOD-PAP Glucose Oxidase – Para amino phenazone GPO-PAP Glycerol Phosphate Oxidase –Para amino phenazone HOMA Homeostasis model assessment IDF International Diabetes Federation LDL Low density lipoprotein MS Metabolic Syndrome NCEP – ATP III National Cholesterol Education Program : Adult Treatment Panel HDL High density lipoprotein TGs Triglycerides T2DM Type 2 Diabetes Mellitus WHO World Health Organization
List of Papers 1. Paper 1
Prevalence of Metabolic Syndrome in Urban Pakistan (Karachi): Comparison of Newly
Proposed International Diabetes Federation and Modified Adult Treatment Panel III Criteria.
M. Zafar Iqbal Hydrie, A. Samad Shera, Asher Fawwad, Abdul Basit and Akhtar Hussain.
METABOLIC SYNDROME AND RELATED DISORDERS, Volume 7, Number 2, 2009.
2. Paper 2
Dietary Patterns Associated with Risk for Metabolic Syndrome in Urban Community of
Karachi Defined by Cluster Analysis.
M. Zafar Iqbal Hydrie, Abdul Basit, A. Samad Shera, Rubina Hakeem and Akhtar Hussain.
Pakistan Journal of Nutrition 9 (1): 93-99, 2010. ISSN 1680-5194.
3. Paper 3
Detecting Insulin Resistance in Pakistani Subjects by Fasting Blood Samples.
M. Zafar Iqbal Hydrie, Abdul Basit, Asher Fawwad, Muhammad Yakoob Ahmedani, A Samad
Shera and Akhtar Hussain.
Accepted in The Open Diabetes Journal.
4. Paper 4
Effect of intervention in subjects with high risk of Diabetes Mellitus in Pakistan.
M. Zafar Iqbal Hydrie, Abdul Basit, A Samad Shera and Akhtar Hussain.
To be submitted.

1 Chapter 1. Introduction
1.1 Pakistan – Country Profile The Islamic Republic of Pakistan was founded in 1947. East Pakistan (now Bangladesh)
seceded in 1971. Since independence there have been several military coups. The last was in
1999, when the chief of army staff, Pervez Musharraf, became the chief executive of
Pakistan. Mr Musharraf resigned as army chief in November 2007 and stood down as
president in August 2008. The general election that took place in February 2008 resulted in
a new coalition government led by the Pakistan People's Party and the Pakistan Muslim
League (Nawaz); the latter party withdrew from the government in August 2008 (1).
Pakistan is a poor and underdeveloped country. A brief overview of the country is given
below:
1.1.1 Geography: The country is located in South Asia, bordering the Arabian Sea, between India on the east
and Iran and Afghanistan on the west and China in the north. Geographic coordinates are 30
00 North and 70 00 East. Land area is 769,095 sq km. Population is 150 million according to
2007 official estimates. Pakistan is divided into four provinces, namely Sindh, Baluchistan,
Punjab and North-West Frontier Province (NWFP) recently renamed Pakhtoonkowah.
Pakistan features different types of landscape; ranging from desert in the south to high
mountains in the north. Climate is subtropical and cold in the highlands.
Figur 1 : Geographic Location of Pakistan
1.1.2 Population Demography: The population of Pakistan was 150 million in 2007 according to government statistics (2).
One third of the population lives in urban areas. Sex ratio is 1.05 male(s)/female for the
total population.
Population growth rate: 1.88%
Birth rate: 25.6 births/1,000 population
Death rate: 6.8 deaths/1,000 population
Life expectancy at birth for males is 64 years and for females is 68 years.
1.1.3 People: The five main ethnic groups are Punjabi, Sindhi, Pashtun (Pathan), Baloch and Muhajir
(immigrants from India at the time of partition and their descendants). More than 95% of
the population is Muslim. Main towns as per June 2003 estimates are Karachi: 10.1 millions,
Lahore: 5.6 millions and Faisalabad: 2.3 millions (1).
Languages: Urdu is the national language. English is widespread in business circles and as a
second language. Time is 5 hours ahead of GMT.
1.1.4 Education Education in Pakistan is mostly subsidized by the Government from primary schools to
higher education levels in public universities. The definition of literacy is taken as over 15
years of age and able to read and write. This level of literacy for the total population is
48.7% while it is 61.7% for males and 35.2% for females according to 2004 estimates (2).
1.1.5 Economy Pakistan’s economy depends mostly on agriculture. The GDP - per capita (PPP) of the
country was $2,600 according to 2006 estimates, but political instability, civil unrest and the
threat of terrorist violence have damaged the business operating environment since 2008.
The catastrophic flooding of August-September 2010 has only heightened this dependency.
Currency:
Pakistan rupee (PRs); PRs1 = 100 paisa. Average exchange rate in 2009: PRs 81.7:US$1
1.1.6 Lifestyle and Physical Activity Lifestyle of the people is different depending to rural and urban settings. Apart from
household work the women in the rural areas also help their men in the fields and in looking
after cattle. Compared to this the people in cities are exposed to a easier way of daily life.
Pakistani people do not have a tradition of doing recreational physical exercise apart from
the requirements of their daily work.
1.1.7 Karachi Karachi is the largest and most populous city in Pakistan. The population and demographic
distribution in the megacity has undergone numerous changes over the past 150 years. At
the time of independence on 14 August 1947, it became the capital city of Pakistan, with a
population about 450,000. However, the population rapidly grew with large influx of
refugees from neighbouring India (after the partition of British India). By 1951, the city
population had crossed one million mark and in the following decade, the rate of growth of
Karachi was over 80 percent. Today, the city has grown 60 times its size from 1947 when it
became the country's first capital (3).
Predominantly Urdu speaking, the refugees known as Muhajirs form the dominant ethnic
group in Karachi. It is the financial and commercial capital of Pakistan; accounting for a
lion's share of Pakistan's revenue generation (20% of the GDP of Pakistan).
1.2 Global Burden of Chronic Non Communicable Diseases While infectious diseases are still threatening people’s health, non-communicable diseases
(NCDs) – such as cardiovascular diseases, cancers, chronic respiratory diseases and diabetes
were responsible for 60% of all deaths globally in 2005 (estimated at 35 million deaths).
Total deaths from NCDs are projected to further increase by 17% over the next 10 years (4).
Low- and middle-income countries are most likely to be affected by these diseases, which
can be prevented by modifying common risk factors such as tobacco use, unhealthy diet,
physical inactivity and harmful use of alcohol.
Globally, cardiovascular diseases (CVD) are the number one cause of death with an
estimated 17 million people dying from cardiovascular disease in 2005, representing 30% of
all global deaths. About 80% of these deaths occurred in low- and middle income countries.
The high burden of CVD in developing countries is attributable both to the increased
incidence of these disorders as well as the relatively early age at which they occur (5-10).
The contribution of developing countries to the global burden of CVD in terms of disability
adjusted years of life lost was three times higher than that of developed countries (11).
The global prevalence of people with diabetes is 6.4%, affecting 285 million adults in 2010
and this will increase to 7.7% with 439 million adults affected by 2030 (12). Thus between
2010 and 2030, there will be a 69% increase in numbers of adults with diabetes in
developing countries and a 20% increase in developed countries (12). The greatest increase
of 195% is projected to be in India (12,13). The last two decades has seen an explosive
increase in the number of people diagnosed with diabetes worldwide and 75% of these are
from the developing countries (13). Unfortunately this trend of increasing prevalence of
diabetes and obesity is imposing a huge burden on our already fragile health-care systems
and this is likely to increase further in the future (14,15). Every year, 3.2 million people
around the world die from complications associated with diabetes. Type 2 diabetes has
become one of the major causes of premature illness and death, mainly through increased
risk of CVD which is responsible for 80 per cent of these deaths (12,16). World Health
Organization (WHO) projects that diabetes deaths will double between 2005 and 2030 (4).
1.2.1 Prevalence and Global trends of Diabetes Diabetes mellitus is the fourth or fifth leading cause of death in most high-income countries
and there is evidence suggesting that it is increasing in epidemic proportions in many newly
industrialized developing countries (4,12). Complications from diabetes are resulting in
increasing disability, reduced life expectancy and enormous health costs for every country
making diabetes one of the most challenging public health problems in the 21st century.
The low- and middle income countries (LMCs) face the greatest threat from the burden of
diabetes with 70% of new incident cases developing in these countries in the future (17,18).
Unfortunately, many countries are unaware of the magnitude and future burden due to the
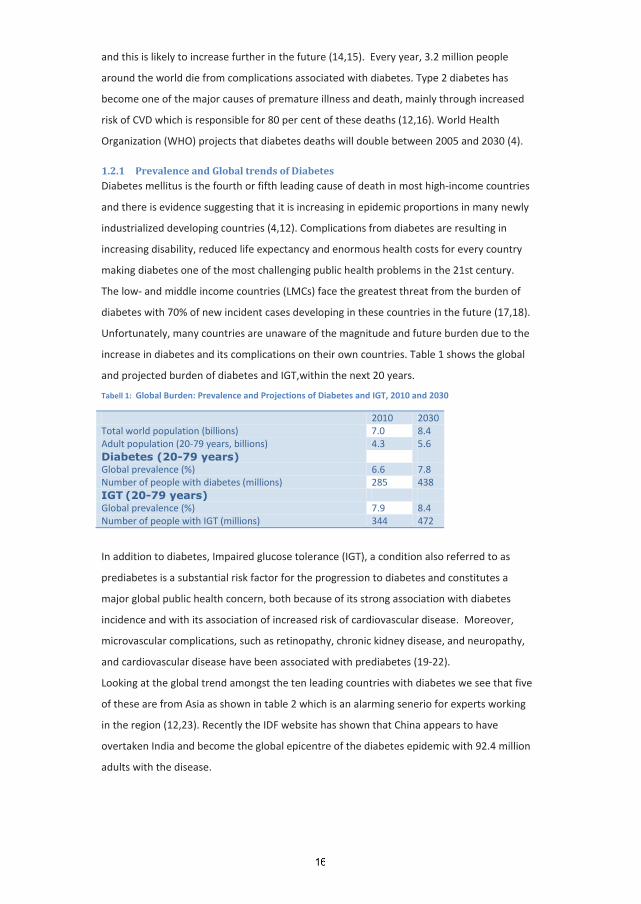
increase in diabetes and its complications on their own countries. Table 1 shows the global
and projected burden of diabetes and IGT,within the next 20 years.
Tabell 1: Global Burden: Prevalence and Projections of Diabetes and IGT, 2010 and 2030
2010 2030 Total world population (billions) 7.0 8.4 Adult population (20-79 years, billions) 4.3 5.6 Diabetes (20-79 years) Global prevalence (%) 6.6 7.8 Number of people with diabetes (millions) 285 438 IGT (20-79 years) Global prevalence (%) 7.9 8.4 Number of people with IGT (millions) 344 472
In addition to diabetes, Impaired glucose tolerance (IGT), a condition also referred to as
prediabetes is a substantial risk factor for the progression to diabetes and constitutes a
major global public health concern, both because of its strong association with diabetes
incidence and with its association of increased risk of cardiovascular disease. Moreover,
microvascular complications, such as retinopathy, chronic kidney disease, and neuropathy,
and cardiovascular disease have been associated with prediabetes (19-22).
Looking at the global trend amongst the ten leading countries with diabetes we see that five
of these are from Asia as shown in table 2 which is an alarming senerio for experts working
in the region (12,23). Recently the IDF website has shown that China appears to have
overtaken India and become the global epicentre of the diabetes epidemic with 92.4 million
adults with the disease.
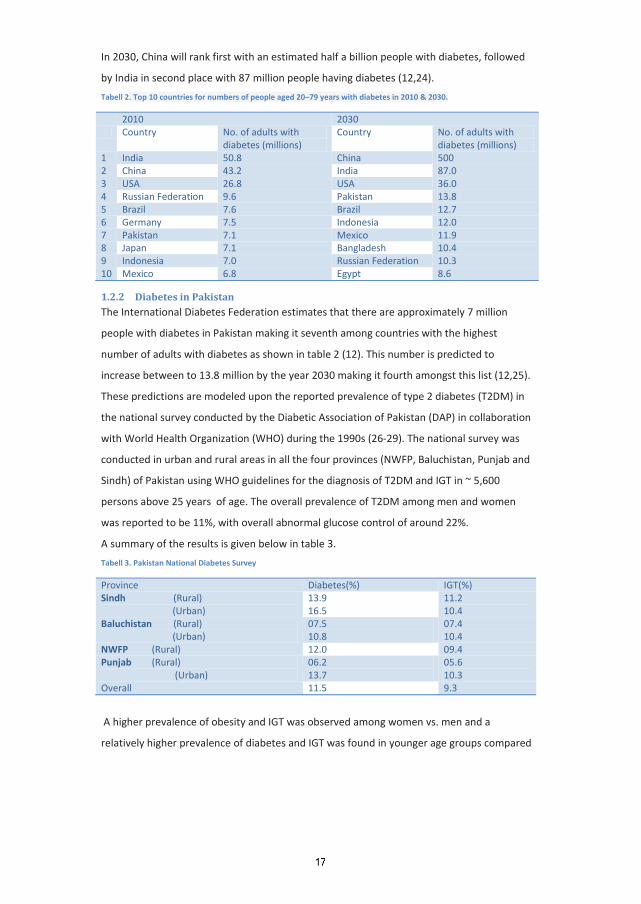
In 2030, China will rank first with an estimated half a billion people with diabetes, followed
by India in second place with 87 million people having diabetes (12,24).
Tabell 2. Top 10 countries for numbers of people aged 20–79 years with diabetes in 2010 & 2030.
2010 2030 Country No. of adults with
diabetes (millions) Country No. of adults with
diabetes (millions) 1 India 50.8 China 500 2 China 43.2 India 87.0 3 USA 26.8 USA 36.0 4 Russian Federation 9.6 Pakistan 13.8 5 Brazil 7.6 Brazil 12.7 6 Germany 7.5 Indonesia 12.0 7 Pakistan 7.1 Mexico 11.9 8 Japan 7.1 Bangladesh 10.4 9 Indonesia 7.0 Russian Federation 10.3 10 Mexico 6.8 Egypt 8.6
1.2.2 Diabetes in Pakistan The International Diabetes Federation estimates that there are approximately 7 million
people with diabetes in Pakistan making it seventh among countries with the highest
number of adults with diabetes as shown in table 2 (12). This number is predicted to
increase between to 13.8 million by the year 2030 making it fourth amongst this list (12,25).
These predictions are modeled upon the reported prevalence of type 2 diabetes (T2DM) in
the national survey conducted by the Diabetic Association of Pakistan (DAP) in collaboration
with World Health Organization (WHO) during the 1990s (26-29). The national survey was
conducted in urban and rural areas in all the four provinces (NWFP, Baluchistan, Punjab and
Sindh) of Pakistan using WHO guidelines for the diagnosis of T2DM and IGT in ~ 5,600
persons above 25 years of age. The overall prevalence of T2DM among men and women
was reported to be 11%, with overall abnormal glucose control of around 22%.
A summary of the results is given below in table 3.
Tabell 3. Pakistan National Diabetes Survey
Province Diabetes(%) IGT(%) Sindh (Rural) (Urban)
13.9 16.5
11.2 10.4
Baluchistan (Rural) (Urban)
07.5 10.8
07.4 10.4
NWFP (Rural) 12.0 09.4 Punjab (Rural) (Urban)
06.2 13.7
05.6 10.3
Overall 11.5 9.3
A higher prevalence of obesity and IGT was observed among women vs. men and a
relatively higher prevalence of diabetes and IGT was found in younger age groups compared
to western populations (26-29). Nearly half of the subjects did not know they had diabetes
before the surveys, a finding also seen in other population based studies worldwide (12).
1.3 Metabolic Syndrome (High Risk for Diabetes and CVD Epidemic) Over the last 3 decades, the prevalence of metabolic syndrome has been increasing steadily
in all populations globally (30,31). Despite the debate on use of the term ‘Metabolic
Syndrome’, its significance in helping identify subjects at high risk of developing type 2
diabetes and cardiovascular disease (CVD) is still recognized.
Subjects having metabolic syndrome have a 2–3 fold risk of cardiovascular disease and a five
fold risk of developing type 2 diabetes (32). It is estimated that nearly 20-25 per cent of the
world’s adult population has the metabolic syndrome and they are twice as likely to die
from a heart attack and three times likely to suffer from a heart attack or stroke compared
with people without the syndrome (32).
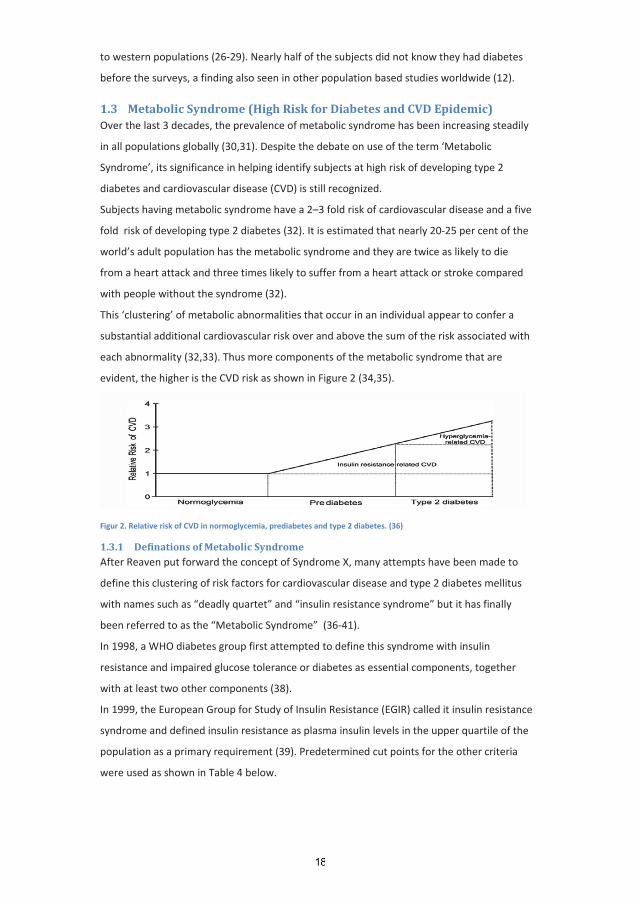
This ‘clustering’ of metabolic abnormalities that occur in an individual appear to confer a
substantial additional cardiovascular risk over and above the sum of the risk associated with
each abnormality (32,33). Thus more components of the metabolic syndrome that are
evident, the higher is the CVD risk as shown in Figure 2 (34,35).
Figur 2. Relative risk of CVD in normoglycemia, prediabetes and type 2 diabetes. (36)
1.3.1 Definations of Metabolic Syndrome After Reaven put forward the concept of Syndrome X, many attempts have been made to
define this clustering of risk factors for cardiovascular disease and type 2 diabetes mellitus
with names such as “deadly quartet” and “insulin resistance syndrome” but it has finally
been referred to as the “Metabolic Syndrome” (36-41).
In 1998, a WHO diabetes group first attempted to define this syndrome with insulin
resistance and impaired glucose tolerance or diabetes as essential components, together
with at least two other components (38).
In 1999, the European Group for Study of Insulin Resistance (EGIR) called it insulin resistance
syndrome and defined insulin resistance as plasma insulin levels in the upper quartile of the
population as a primary requirement (39). Predetermined cut points for the other criteria
were used as shown in Table 4 below.
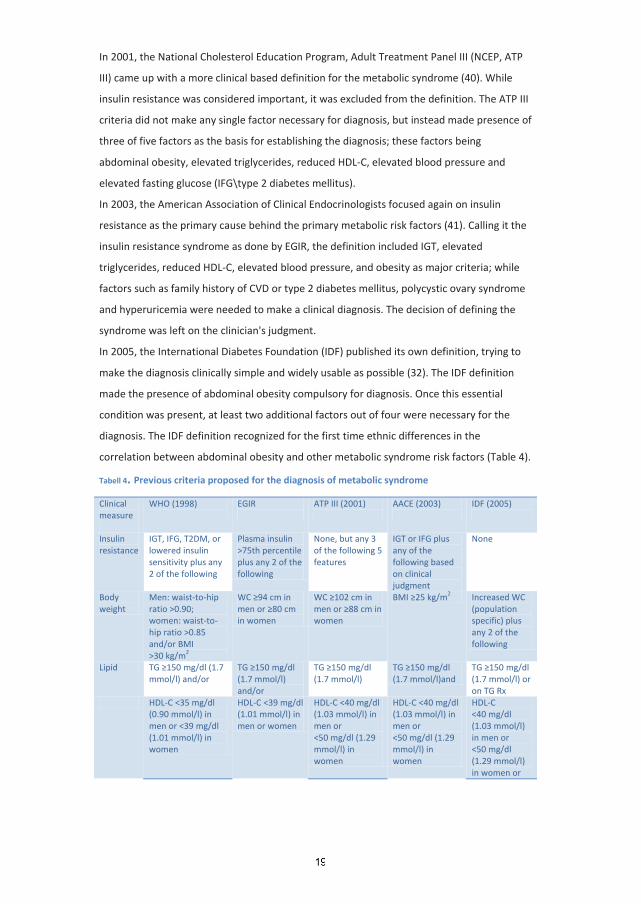
In 2001, the National Cholesterol Education Program, Adult Treatment Panel III (NCEP, ATP
III) came up with a more clinical based definition for the metabolic syndrome (40). While
insulin resistance was considered important, it was excluded from the definition. The ATP III
criteria did not make any single factor necessary for diagnosis, but instead made presence of
three of five factors as the basis for establishing the diagnosis; these factors being
abdominal obesity, elevated triglycerides, reduced HDL-C, elevated blood pressure and
elevated fasting glucose (IFG\type 2 diabetes mellitus).
In 2003, the American Association of Clinical Endocrinologists focused again on insulin
resistance as the primary cause behind the primary metabolic risk factors (41). Calling it the
insulin resistance syndrome as done by EGIR, the definition included IGT, elevated
triglycerides, reduced HDL-C, elevated blood pressure, and obesity as major criteria; while
factors such as family history of CVD or type 2 diabetes mellitus, polycystic ovary syndrome
and hyperuricemia were needed to make a clinical diagnosis. The decision of defining the
syndrome was left on the clinician's judgment.
In 2005, the International Diabetes Foundation (IDF) published its own definition, trying to
make the diagnosis clinically simple and widely usable as possible (32). The IDF definition
made the presence of abdominal obesity compulsory for diagnosis. Once this essential
condition was present, at least two additional factors out of four were necessary for the
diagnosis. The IDF definition recognized for the first time ethnic differences in the
correlation between abdominal obesity and other metabolic syndrome risk factors (Table 4).
Tabell 4. Previous criteria proposed for the diagnosis of metabolic syndrome
Clinical measure
WHO (1998)
EGIR
ATP III (2001)
AACE (2003)
IDF (2005)
Insulin resistance
IGT, IFG, T2DM, or lowered insulin sensitivity plus any 2 of the following
Plasma insulin >75th percentile plus any 2 of the following
None, but any 3 of the following 5 features
IGT or IFG plus any of the following based on clinical judgment
None
Body weight
Men: waist-to-hip ratio >0.90; women: waist-to-hip ratio >0.85 and/or BMI >30 kg/m
WC cm in men or cm in women
2
WC cm in men or cm in women
BMI kg/m Increased WC (population specific) plus any 2 of the following
2
Lipid TG mg/dl (1.7 mmol/l) and/or
TG mg/dl (1.7 mmol/l) and/or
TG mg/dl (1.7 mmol/l)
TG mg/dl (1.7 mmol/l)and
TG mg/dl (1.7 mmol/l) or on TG Rx
HDL-C <35 mg/dl (0.90 mmol/l) in men or <39 mg/dl (1.01 mmol/l) in women
HDL-C <39 mg/dl (1.01 mmol/l) in men or women
HDL-C <40 mg/dl (1.03 mmol/l) in men or <50 mg/dl (1.29 mmol/l) in women
HDL-C <40 mg/dl (1.03 mmol/l) in men or <50 mg/dl (1.29 mmol/l) in women
HDL-C <40 mg/dl (1.03 mmol/l) in men or <50 mg/dl (1.29 mmol/l) in women or
on HDL-C Rx Blood pressure
mmHg mmHg or on hypertension Rx
mmHg mmHg mmHg systolic or
mmHg diastolic or on hypertension Rx
Glucose IGT, IFG, or T2DM IGT or IFG (but not diabetes)
>110 mg/dl (6.1 mmol/l) (includes diabetes)
IGT or IFG (but not diabetes)
a
mg/dl (5.6 mmol/l) (includes diabetes)
Other Microalbuminuria Other features of insulin resistance
b a The 2001 definition identified fasting plasma glucose of mg/dl (6.1 mmol/l) as elevated. This was modified in 2004 to be mg/dl (5.6 mmol/l), in accordance with the American Diabetes Association's updated definition of IFG. b
Includes family history of type 2 diabetes mellitus, polycystic ovary syndrome, sedentary lifestyle, advancing age, and ethnic groups susceptible to type 2 diabetes mellitus.
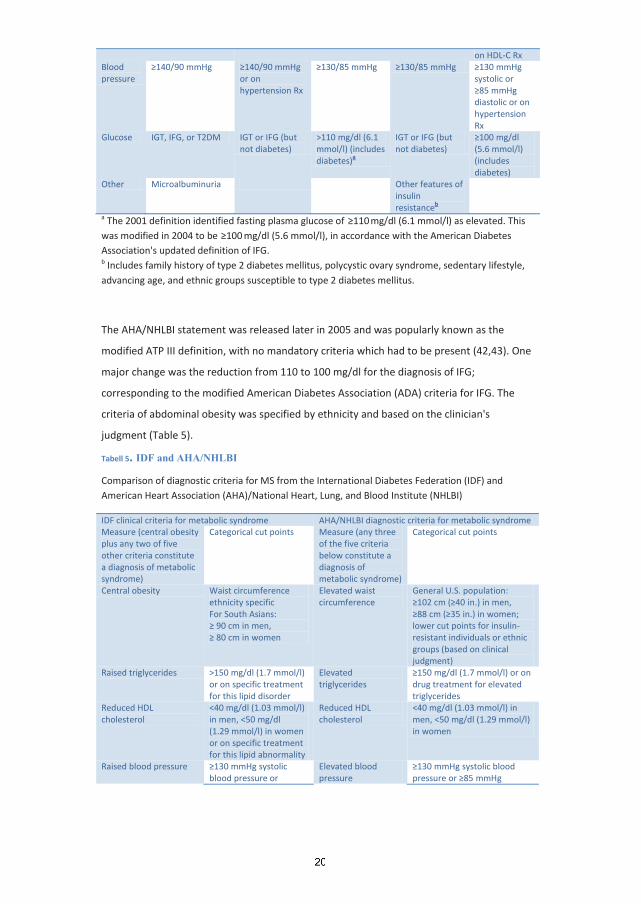
The AHA/NHLBI statement was released later in 2005 and was popularly known as the
modified ATP III definition, with no mandatory criteria which had to be present (42,43). One
major change was the reduction from 110 to 100 mg/dl for the diagnosis of IFG;
corresponding to the modified American Diabetes Association (ADA) criteria for IFG. The
criteria of abdominal obesity was specified by ethnicity and based on the clinician's
judgment (Table 5).
Tabell 5. IDF and AHA/NHLBI
Comparison of diagnostic criteria for MS from the International Diabetes Federation (IDF) and American Heart Association (AHA)/National Heart, Lung, and Blood Institute (NHLBI)
IDF clinical criteria for metabolic syndrome AHA/NHLBI diagnostic criteria for metabolic syndrome Measure (central obesity plus any two of five other criteria constitute a diagnosis of metabolic syndrome)
Categorical cut points
Measure (any three of the five criteria below constitute a diagnosis of metabolic syndrome)
Categorical cut points
Central obesity Waist circumference ethnicity specific For South Asians:
cm in men, cm in women
Elevated waist circumference
General U.S. population: cm ( in.) in men,
cm ( in.) in women; lower cut points for insulin-resistant individuals or ethnic groups (based on clinical judgment)
Raised triglycerides >150 mg/dl (1.7 mmol/l) or on specific treatment for this lipid disorder
Elevated triglycerides
mg/dl (1.7 mmol/l) or on drug treatment for elevated triglycerides
Reduced HDL cholesterol
<40 mg/dl (1.03 mmol/l) in men, <50 mg/dl (1.29 mmol/l) in women or on specific treatment for this lipid abnormality
Reduced HDL cholesterol
<40 mg/dl (1.03 mmol/l) in men, <50 mg/dl (1.29 mmol/l) in women
Raised blood pressure mmHg systolic blood pressure or
Elevated blood pressure
mmHg systolic blood pressure or mmHg
mmHg diastolic blood pressure or on treatment for previously diagnosed hypertension
diastolic blood pressure or on drug treatment for hypertension
Raised fasting glucose Fasting plasma glucose mg/dl (5.6 mmol/l)
or previously diagnosed type 2 diabetes
Fasting plasma glucose mg/dl (5.6 mmol/l) or
previously diagnosed type 2 diabetes
In the IDF and modified ATP III definations it was evident that ethnicity had a role in
influencing metabolic syndrome. Thus different ethnic backgrounds, diet and physical
activity, population age and sex structure and levels of nutrition, all have shown to influence
the prevalence of the metabolic syndrome (32,43). Although the precise increase in the risk
of developing NCDs may vary depending on the population being studied, from a clinical
viewpoint the presence of the metabolic syndrome places a person at higher risk for major
CVD events and/or T2DM (44). Taking this in a global prespective, it then becomes not only
a medical, but also a socio-economic need to take all steps necessary to try and prevent the
ravages which can be caused by T2DM and CVD (11,14,44).
1.3.2 Prevalence of the Metabolic Syndrome The widespread use of the different metabolic syndrome definitions has resulted in a large
number of studies describing different prevalence rates of the metabolic syndrome.
The prevalence of the ATP-III metabolic syndrome in the U.S. was initially reported in the
Third National Health and Nutrition Examination Survey (NHANES III, 1988–1994). The age-
adjusted prevalence was 23.7% (45–49). The contribution of the various components was
different among ethnic groups. Low HDL cholesterol, hyperglycemia and high triglycerides
made a significantly greater contribution in Mexican-Americans while arterial hypertension
was more prevalent in African-Americans. The prevalence of the ATP-III metabolic syndrome
was updated in the NHANES 1999–2000. The age-adjusted prevalence increased from 24.1%
to 27% (48). An increased prevalence was observed in younger women (< 40 years).
The WHO criteria was used mostly in European cohorts (46,49). The prevalence of the WHO
metabolic syndrome in non-diabetic subjects varied between 7 and 36% for men 40–55
years and between 5 and 22% for women of the same age group (49).
Associations between the metabolic syndrome, CHD, and diabetes have also been
established by an analysis of the cross-sectional NHANES III data on adults aged >50 years
(50). A stepwise increase in the prevalence of the metabolic syndrome was observed with
worsening glucose tolerance, and 86% of people with diabetes had the metabolic syndrome
(51). The prevalence of CHD was 19% in people with both the metabolic syndrome and
diabetes versus 9% in those with neither and 7.5% in the small percentage of the study
population that had diabetes but not the metabolic syndrome. These results suggest that for
most diabetic patients, cardiovascular risk is related not to diabetes itself but to the
concomitant presence of the metabolic syndrome (52).
The currently available definitions can be used as valuable tools for studying the disease
pattern, even these definitions include, in affected and non-affected subjects a
heterogeneous group of cases with a broad range of relative risks for future complications,
which need to be explored.
Finally, the metabolic syndrome could be considered as a prime target for preventive
medicine. Clearly, the emerging global epidemic of metabolic and vascular disease has
significant implications for the development of population based health promotion
strategies. Lifestyle modifications and weight loss programs are a key part of the program
because weight loss reduces the incidence of type 2 diabetes and a large percent of the
affected subjects had excess body weight (53). Thus preventive programs, properly designed
need to be implemented, otherwise we will continue to treat the majority of the cases when
they reach the steeper extreme of the road: where many present with the complications of
the metabolic syndrome such as diabetes complications and heart diseases.
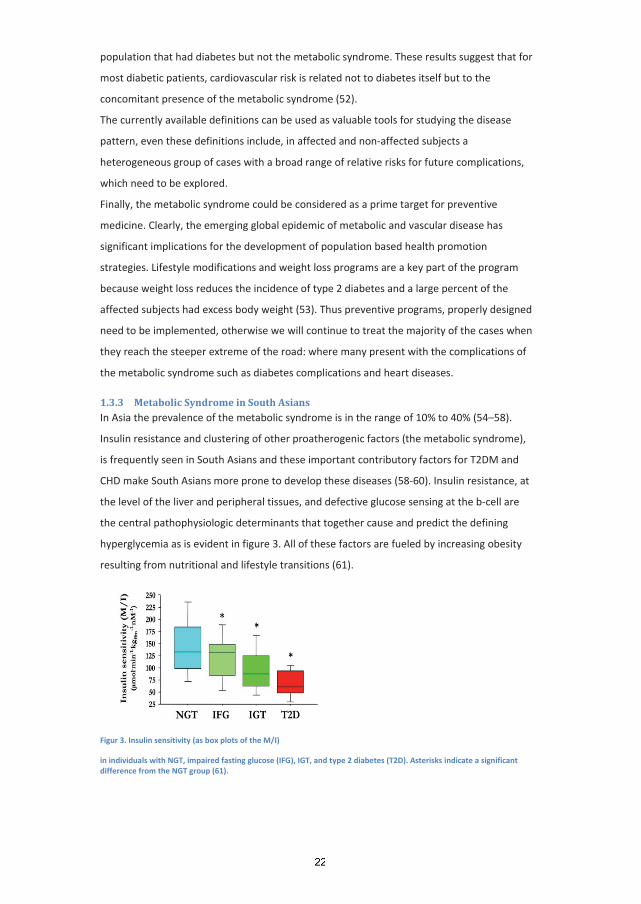
1.3.3 Metabolic Syndrome in South Asians In Asia the prevalence of the metabolic syndrome is in the range of 10% to 40% (54–58).
Insulin resistance and clustering of other proatherogenic factors (the metabolic syndrome),
is frequently seen in South Asians and these important contributory factors for T2DM and
CHD make South Asians more prone to develop these diseases (58-60). Insulin resistance, at
the level of the liver and peripheral tissues, and defective glucose sensing at the b-cell are
the central pathophysiologic determinants that together cause and predict the defining
hyperglycemia as is evident in figure 3. All of these factors are fueled by increasing obesity
resulting from nutritional and lifestyle transitions (61).
Figur 3. Insulin sensitivity (as box plots of the M/I)
in individuals with NGT, impaired fasting glucose (IFG), IGT, and type 2 diabetes (T2D). Asterisks indicate a significant difference from the NGT group (61).
Prevalence of obesity is rising in South Asia and this important factor is associated with
insulin resistance since a increase of over one third ideal body weight decreases insulin
sensitivity by 40% (62). There are other factors related to insulin resistance that also
increase susceptibility to CHD in South Asians such as high levels of proatherogenic small,
dense low-density lipoprotein (LDL) as observed in Asian Indians (63,64).
Studies from India shows that about one third of the urban population has the metabolic
syndrome and consequently the prevalence of T2DM has become double during the
previous 3 decades (57, 65-68). Around 15% of the global mortality from CVD is also
contributed by India and preventing metabolic syndrome could make a significant difference
in reducing this also (69). The Southall study done in UK demonstrated that despite being
matched for age and body mass index (BMI) with Caucasians, South Asian men had higher
waist: hip ratio, higher systolic blood pressure (BP), higher insulin levels after glucose load,
higher triglyceride levels and lower high density lipoprotein (HDL)-levels, all suggesting a
high prevalence of the Metabolic Syndrome (53). In addition, type 2 diabetes a CHD risk
equivalent was present in 20% of the South Asians compared to 5% of Caucasians adding to
the CVD risk burden (70). This only highlights the increased risk that south asians have at
lower thresholds and by making a diagnosis of the metabolic syndrome we might be able to
initiate lifestyle changes earlier, to reduce the risk of CVD and T2DM in this population.
1.3.4 Metabolic Syndrome in Pakistan Very few studies have looked at the prevalence of metabolic syndrome in Pakistan. One
study done in rural area of Pakistan showed that in total 40% of the subjects met the IDF
definition while 31% met the ATP III definition of the metabolic syndrome (71). Another
recent population based study carried out in an urban area, Karachi of Pakistan showed
metabolic syndrome at a prevalence of 34.8% according to the International Diabetes
Federation (IDF) definition and 49% by the modified National Cholesterol Education
Program, Adult Treatment Panel III (NCEP ATP III) criteria (72).
In another study done in 400 subjects at a tertiary cardiology unit in Pakistan, the
prevalence of the metabolic syndrome according to ATP III was 44% (73). While in another
study also done in Karachi, 46% type 2 diabetic subjects were found to have metabolic
syndrome according to the WHO definition (74).
1.4 Associated Factors for Diabetes and Metabolic Syndrome Rapid demographic and nutritional changes with increased life expectancy and more elderly
population is occuring globally. Most importantly, globalization of diets and consumption of
nontraditional fast foods is taking place at a very rapid pace especially in urban areas
(14,75). A progression of these transitions and changes in populations of many countries is
resulting in high prevalence of non-communicable diseases such as diabetes. Looking at
developing countries we see that rapid increase in western fast food outlets and increased
consumption of fried snacks is taking place (61,75). Furthermore, migration from villages to
cities is increasing in these countries resulting in nutritional imbalance, physical inactivity,
stress, and increased consumption of alcohol and tobacco (76-79). In addition, some
populations such as south asians are physically less active leading a increasingly sedentary
lifestyle which has further deterimental effects on their health (80-81).
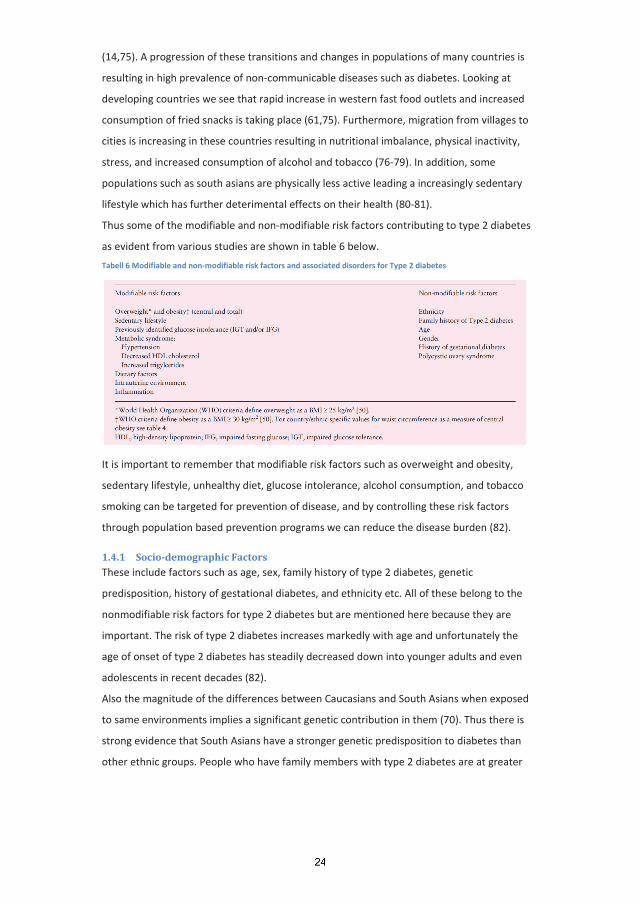
Thus some of the modifiable and non-modifiable risk factors contributing to type 2 diabetes
as evident from various studies are shown in table 6 below.
Tabell 6 Modifiable and non-modifiable risk factors and associated disorders for Type 2 diabetes
It is important to remember that modifiable risk factors such as overweight and obesity,
sedentary lifestyle, unhealthy diet, glucose intolerance, alcohol consumption, and tobacco
smoking can be targeted for prevention of disease, and by controlling these risk factors
through population based prevention programs we can reduce the disease burden (82).
1.4.1 Socio-demographic Factors These include factors such as age, sex, family history of type 2 diabetes, genetic
predisposition, history of gestational diabetes, and ethnicity etc. All of these belong to the
nonmodifiable risk factors for type 2 diabetes but are mentioned here because they are
important. The risk of type 2 diabetes increases markedly with age and unfortunately the
age of onset of type 2 diabetes has steadily decreased down into younger adults and even
adolescents in recent decades (82).
Also the magnitude of the differences between Caucasians and South Asians when exposed
to same environments implies a significant genetic contribution in them (70). Thus there is
strong evidence that South Asians have a stronger genetic predisposition to diabetes than
other ethnic groups. People who have family members with type 2 diabetes are at greater
risk for developing diabetes themselves as is evident from a study done in Pakistan which
showed that 45% people with diabetes had a positive family history of diabetes (83).
1.4.2 Overweight and Obesity Obesity has been identified as the single most important risk factor for Type 2 diabetes. The
WHO estimates that there are currently 1.1 billion people who are overweight with
estimations of over 1.5 billion by 2015 (84). Longitudinal studies have shown obesity to be a
powerful predictor for type 2 diabetes (84-85). This is further strenghten by the fact that
interventions aimed at reducing obesity also reduce the incidence of Type 2 diabetes.
The average BMI value in South Asians is lower than seen in white Caucasians, Mexican-
Americans, and blacks, but unfortunately South Asians have a higher percentage of body fat
compared to white Caucasians and blacks at this lower BMI values (57,59,70).
Because of this increased cardiovascular risk among Asian people occuring at lower waist
circumference compared to European populations, both the WHO and the IDF have
adopted the definition of overweight and obesity in Asians at a BMI of 23 kg/m2 or above
and 25 kg/m2 or above, respectively, while central obesity is defined as a waist
circumference of 90 cm or above in men and 80 cm or above in women (59).
1.4.3 Nutritional transition
Work patterns changing from heavy labour to sedentary due to increase in computerization
and mechanization, and improved transport have made an impact on human health (14).
These sedentary changes along with easy access to fast foods and empty calories have
resulted in increased rates of obesity and type 2 diabetes globally (44,84-86). Although it is
difficult to collect accurate dietary data, epidemiological studies indicate that a high calorie
and low dietary fibre intake with a high glycaemic load and low polyunsaturated to
saturated fat ratio contribute towards developing chronic diseases such as type 2 diabetes
and metabolic syndrome (61,867-88). Thus diet is a crucial aspect of lifestyle changes.
South Asians consume more carbohydrates compared to Europeans and this may lead to
hyperinsulinemia, postprandial hyperglycemia, hypertriglyceridemia and low HDL
cholesterol levels, all of which is probably due to insulin resistance (87). Particularly in South
Asians the increased carbohydrate and fat intake, along with decreased fiber intake likely
contributes to obesity, the metabolic syndrome and T2DM (61,87,89). Studies have shown
that high intake of whole grain foods or cereal fibers reduce the risk of diabetes and even
adjustments in diet composition without weight loss could improve hyperglycemia of
diabetes (90,91).

1.4.4 Physical Activity and Sedentary Lifestyle Physical activity has decreased over recent decades in many populations, and this is a major
contributor to the current global rise of obesity. Physical inactivity has been found to be an
independent predictor of Type 2 diabetes in both cross-sectional and longitudinal studies
(81,82).
Unfortunately South Asians have been found to be more sedentary compared to other
ethnic groups (80,92-97). Increasing sedentary lifestyle is attributed to increased
mechanization at workplaces and in household work. Leisure-time activities have also
shifted from outdoor play to indoor entertainment such as television and computer games
(94). Previously adolescents playing outdoor games regularly and doing household activities
had lower prevalence of been overweight, compared to 3 times higher in those not
participating in outdoor games (98). Even for equivalent degrees of obesity, more physically
active subjects have a lower incidence of diabetes.
1.4.5 Glucose Intolerance (IGT and\or IFG) Prediabetes includes the diagnostic categories of IFG and IGT, but is actually a band of
glucose concentrations over a continuum extending from conventional NGT to overt type 2
diabetes as shown below.
Prediabetes (IFG and/or IGT) should be viewed as a preclinical state in the natural history of
disordered glucose metabolism rather than as a distinctive clinical entity representing an
interim condition and as a risk factor prestaging (a) the development of diabetes (increased
risk for diabetes) and (b) an increase in cardiovascular and possibly microvascular
complications.
The transition from prediabetes to diabetes may take many years but can also be rapid
(99,100). Current estimates indicate that up to 70% subjects with prediabetes eventually
develop diabetes (101). The International Diabetes Federation estimates that some 344
million people have IGT worldwide in 2010, the vast majority of who live in low- and middle-
income countries. By 2030, the number of people with IGT is projected to increase to 472
million as shown in Table 1 (12).

Studies have observed that the risk of developing diabetes as well as the incidence of
diabetes is highest in individuals with combined IFG and IGT (Relative risk is 12-fold higher)
as shown in figure 4 below (100-102). The average risk of developing diabetes is about 5% to
10% per year in individuals with IFG or IGT compared with approximately 0.7% per year in
normoglycemic individuals (102).
Figur 4. Relative risk of developing diabetes in different categories of prediabetes.
Reference group is those with normal glucose tolerance (defined in each study). I-IGT, isolated IGT; I-IFG, isolated IFG; IGT 1 IFG, combined IFG and IGT. (102)
Diagnosing prediabetes helps to identify a segment of the population which is at increased
risk for developing both diabetes and CVD so that interventions can be initiated. Diagnosis
has traditionally been made by measuring blood glucose levels during either fasting or an
OGTT. Many high-risk subjects (pre-diabetes) have a clustering of other cardiovascular
disease risk factors, e.g. abdominal obesity, elevated levels of total triglycerides, low levels
of high-density lipoprotein (HDL) cholesterol and elevated blood pressure, commonly known
as the metabolic syndrome (31,32,42).
1.5 Follow-up studies of Metabolic Syndrome (Prediction of DM and CHD) Results from large, prospective studies suggest that the metabolic syndrome is an important
risk factor for CHD and type 2 DM, and it increases cardiovascular and total mortality (103).
A 12-year follow-up data of 2682 middle-aged finnish men showed that death from
cardiovascular disease was 2.9–4.2 times more likely among men with metabolic syndrome
than those without metabolic syndrome at start of study (104).
Since detecting subjects at risk of future disease and implementing programs to reduce the
risk of progression to disease is a fundamental objective of preventive medicine, the
metabolic syndrome can be used as a predictor to identify subjects at high risk of developing
CVD and diabetes. The dysglycemia of type 2 diabetes coexists with other metabolic
abnormalities such as obesity, dyslipidemia, and hypertension, leading one to postulate that
the increased CVD risk in subjects with prediabetes may be largely due to the coexistence of
other metabolic syndrome components (43).
Several studies have shown that the metabolic syndrome predicted T2DM independent of
other factors (105–109). Lorenzo et al. showed that the odds ratio (OR) using different
definitions of the metabolic syndrome (ATP III [OR 2.00], IDF [OR1.69]), and the World
Health Organization (WHO) [OR 1.73]) were almost similar in predicting incident CHD
independent of age, sex, ethnic origin, history of CHD and T2DM, non-HDL-C, smoking
status, and family history of myocardial infarction (110). Subjects free from CHD and/or CHD
risk equivalents, when evaluated with ATP III, IDF, and WHO definitions, were also shown to
have similar ORs for predicting CHD. Although some studies have shown that conventional
risk factors may also predict T2DM or CHD, it appears that the metabolic syndrome adds to
the prediction provided by individual components (111–114).
Sattar et al. showed strong association of the metabolic syndrome with diabetes (RR, 7.47)
in South Asians, however, with CHD it was less strong (RR, 1.27) (112). Forouhi et al. showed
higher cardiovascular risk in South Asians compared to white Caucasians (114). The
awareness of ethnicity as a potential independent risk factor for chronic disease has clinical
importance because lower thresholds would have to be considered when planning primary
prevention strategies in certain populations.
1.6 Intervention Epidemiology Importance of identifying ssubjects at high risk for developing diabetes has increased with
expansion of knowlegde from prevention trials that prevent or delay type 2 diabetes using
lifestyle modification or medication (82). The cardiometabolic risk factors, including
increased body mass index (BMI), blood pressure, and triglycerides, which often coexist in
subjects with IGT and IFG can be modified as shown by prevention studies.
Most interventions targeted preventing Type 2 diabetes by achieving and maintaining a
healthy body weight through a combination of dietary measures and physical activity in high
risk subjects (pre-diabetes group) (82). Dietary recommendations across studies are quite
similar, and stress reducing fat intake and increasing vegetable consumption with moderate
calorie restriction in overweight/obese populations. The approach used to promote
physical activity in the interventions range from providing exercise goals and advise on how
to increase daily physical activity, to providing weekly supervised exercise training sessions.
Most interventions recommend a minimum of 30–40 min of moderate physical activity on
all or most days of the week.
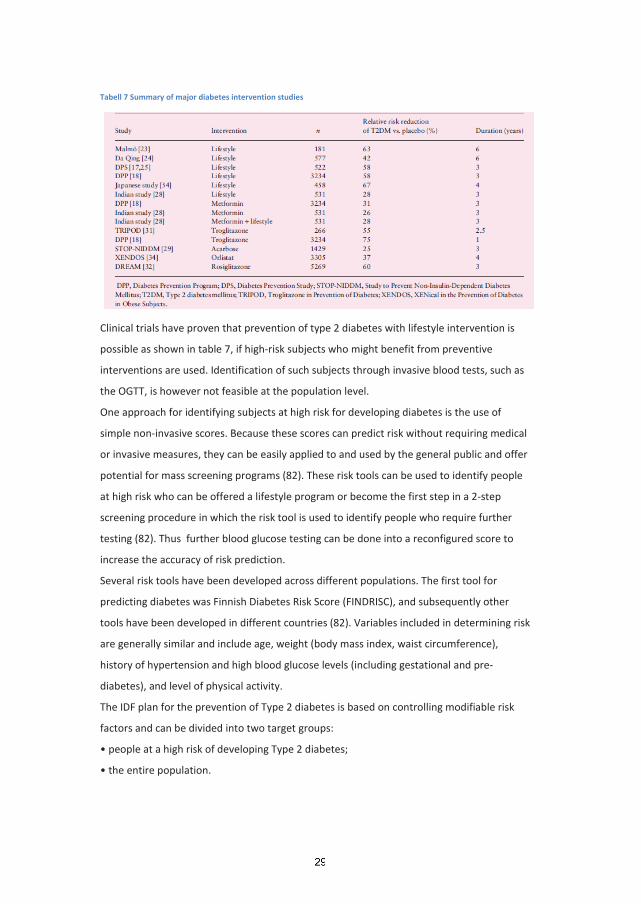
Tabell 7 Summary of major diabetes intervention studies
Clinical trials have proven that prevention of type 2 diabetes with lifestyle intervention is
possible as shown in table 7, if high-risk subjects who might benefit from preventive
interventions are used. Identification of such subjects through invasive blood tests, such as
the OGTT, is however not feasible at the population level.
One approach for identifying subjects at high risk for developing diabetes is the use of
simple non-invasive scores. Because these scores can predict risk without requiring medical
or invasive measures, they can be easily applied to and used by the general public and offer
potential for mass screening programs (82). These risk tools can be used to identify people
at high risk who can be offered a lifestyle program or become the first step in a 2-step
screening procedure in which the risk tool is used to identify people who require further
testing (82). Thus further blood glucose testing can be done into a reconfigured score to
increase the accuracy of risk prediction.
Several risk tools have been developed across different populations. The first tool for
predicting diabetes was Finnish Diabetes Risk Score (FINDRISC), and subsequently other
tools have been developed in different countries (82). Variables included in determining risk
are generally similar and include age, weight (body mass index, waist circumference),
history of hypertension and high blood glucose levels (including gestational and pre-
diabetes), and level of physical activity.
The IDF plan for the prevention of Type 2 diabetes is based on controlling modifiable risk
factors and can be divided into two target groups:
The high risk approach consists of 3 steps and is used in most primary prevention trials.
However, in planning national measures for the prevention of Type 2 diabetes, both groups
should be targeted simultaneously. In addition, it is important that all activities are tailored
to the specific local situation based on the cultural specifications.
Preventive measures should be particularly vigorous for those with family history of obesity,
T2DM, or premature CHD the so called high risk population. Overweight individuals and
those with abdominal obesity should be actively encouraged to lose weight by lifestyle
measures.
Research on metabolic syndrome in South Asians should be targeted; initially to observe the
prevalence of metabolic syndrome or high risk subjects in the community and to identify the
associated risk factors for diabetes and CVD. The metabolic syndrome should be considered
as a prime target for preventive medicine. The primary management goals of the metabolic
syndrome are to reduce the risks of cardiovascular disease and diabetes burden. This can be
followed by prospective intervention studies to ascertain the effect of intervention to
prevent T2DM in these high risk subjects.
A high prevalence of the metabolic syndrome in South Asians suggests a higher risk of
developing cardiovascular and diabetes in the future. Despite the challenges involved in
day-to-day life, the intervention to prevent diabetes is needed in Pakistan due to increased
inherent genetic predisposition, younger age of onset of disease, lack of capacity and
resources to treat the condition effectively at the primary health-care level.
Targeting subjects with IGT for lifestyle interventions focused around increasing activity and
altering dietary factors has been particularly effective and primary prevention trials have
produced significant results in people at high risk of diabetes. This has also lead to
recommendations been proposed by some for primary prevention in subjects with
prediabetes as shown in Table 8 below.
One of the major difficulties in translating knowledge generated by randomized clinical trials
(RCTs) is the inability to generalize to the practice setting as they were conducted in a
controlled environment. Attempting to translate interventions from studies into a practical
setting of diverse nature with less funding which leads to deviations from the initial
intervention protocols has resulted in a variety of new approaches which is a challenge for
public health experts.

Tabell 8: Key features of selected published recommendations on prediabetes
ADA Consensus Statement (2007)
Indian Health Services Guidelines for Care of Adults with Prediabetes and/or the Metabolic Syndrome in Clinical Settings (2006)
Australian Diabetes Society and Australian Diabetes Educators Association Position Statement (2007)
IFG FPG > 100 mg/dL (5.6 mmol/L) but < 126 mg/dL (7.0 mmol/L) and 2-h plasma glucose < 200 mg/dL (11.1 mmol/L)
FPG > 100 mg/dL (5.6 mmol/L) but < 126 mg/dL (7.0 mmol/L)
FPG > 110 mg/dL (6.1 mmol/L) but < 126 mg/dL (7.0 mmol/L) and 2-h plasma glucose < 140 mg/dL (7.8 mmol/L)
IGT FPG < 126 mg/dL (7.0 mmol/L) and 2-h plasma glucose > 140 mg/dL (7.8 mmol/L) but < 200 mg/dL (11.1 mmol/L)
2-h plasma glucose > 140 mg/dL (7.8 mmol/L) but < 200 mg/dL (11.1 mmol/L)
FPG < 126 mg/dL (7.0 mmol/L) and 2-h plasma glucose > 140 mg/dL (7.8 mmol/L) but < 200 mg/dL (11.1 mmol/L)
Who should be screened for diabetes?
Individuals with risk factors for diabetes should be screened for prediabetes
Annual testing of individuals at risk for developing diabetes
Incidental detection when screening for diabetes
Method of Screening
FPG
2-h OGTT if metformin therapy is considered
FPG
Optional 2-h OGTT if resources permit
Incidental detection when screening for diabetes
Recommended Treatment
Lifestyle modification for IFG or IGT Lifestyle modification and/or metformin for IFG and IGT and at least one of the following: age <60years, BMI >35kg/m2, family history of diabetes in first degree relatives, elevated triglycerides, reduced HDL-C, hypertension, HbA1c >6.0%
Lifestyle changes
Consideration of metformin on an individualized basis; depression screening and cardiovascular risk reduction also recommended
Intensive lifestyle intervention for a minimum of 6 months before consideration of pharmacotherapy
Follow-up Metformin treatment: semiannual HbA1c
Lifestyle intervention: annual follow-up
Monitor glucose values every 6 months
75-g OGTT, initially performed annually, then indivudualized retesting every 1-3 years
Data from American Diabetes Association. 2010 Standards of medical care in diabetes. Diabetes Care 2010;33(Suppl 1):511-61.

1.7 Rationale or Statement of Problem Pakistan has been undergoing demographic, epidemiological and nutritional transition for
the last few decades. Increased access to energy dense foodstuffs and reduced physical
activity has resulted due to so called “urbanization” and “westernization”. Pakistan is also
one of the top 10 countries with the most people with diabetes and this current state of
affairs will take it in the top 5 countries list by 2030 (12).
Since the metabolic syndrome is postulated to be a precurser of type 2 diabetes and CVD, it
seems that in view of the increasing prevalence of type 2 diabetes, there will be high
number of subjects with metabolic syndrome in Pakistan. Although the prevelance of
metabolic syndrome has been reported to be 44% to 46% in studies done in Pakistan, it has
been done in cardiac and diabetic subjects (75,76). No population based epidemiological
study had been done in the urban areas of Pakistan to find the prevalence of metabolic
syndrome and its associations with the risk factors of T2DM and CVD.
The current epidemiological study will help to assess the prevalence of metabolic syndrome
in the general population and look at the associated risk factors, as well as establishing
baseline cutoff values for insulin sensitivity. This will help in understanding the volatile high
risk situation of future disease burden and lay the foundation for planning intervention
studies of primary prevention of Type 2 diabetes and CVD.
Epidemiological evidence have suggested that unless effective prevention and control
programmes are started, the prevalence of diabetes will continue to rise globally (82). The
collective results of primary prevention trials have showed an average reduction of 51% in
new cases of diabetes in high risk subjects (82). Individuals usually at highest risk for
diabetes are those having prediabetes i.e. impaired fasting glucose (IFG) and aired
glucose tolerance (IGT) . Thus identifying high risk subjects and initiating lifestyle
intervention are important primary prevention strategies globally.
Since diabetes is increasing at a rapid rate in Pakistan with alarming consequences,
prevention is becoming highly relevant over here where subjects have increased inherent
genetic predisposition and younger age at onset of disease. We lack the resources to
effectively treat the condition at the primary healthcare level and also lack equitable access
to healthcare for treating the complications which arises from diabetes. This makes a strong
case for investment in diabetes prevention to reduce the future disease burden (44,72,82).

1.8 Research Questions and Objectives of the Study
1.8.1 Research Questions What is the prevalence of metabolic syndrome based upon WHO, ACE, EGIR, modified ATP
III and IDF definition in this Pakistani population?
What is the prevalence of diabetes and other forms of abnormal glucose tolerance in
subjects aged 25 years and above in Karachi, Pakistan?
What is the insulin resistance cutoffs for our population?
What is the distribution and relationship of diet with metabolic syndrome in this
population?
What is the rate of conversion of IGT to diabetes?
What effect does intervention (lifestyle modification and lifestyle modification with
metformin) has on the onset of type 2 diabetes in an urban setting?
1.8.1.1 Main Objective
To determine the prevalence of metabolic syndrome in a sample of adults aged 25
years and above from an urban population of Karachi.
To observe the rate of conversion of IGT to diabetes and to observe the impact of
intervention (lifestyle modification and combining lifestyle modification with
metformin) on the onset of type 2 diabetes in an urban population.
1.8.1.2 Specific Objectives
More specifically, the objectives of the two studies were to:
Estimate and compare the differences in prevalence of metabolic syndrome based upon
modified ATP III and IDF definition in Pakistani population.
Estimate the prevalence of diabetes and other forms of abnormal glucose tolerance and
association with metabolic syndrome.
Assess the relationships of diet with metabolic syndrome and its risk in this population.
To evaluate the impact of intervention with lifestyle modification.
To note the usefulness of adding an insulin sensitizer (Metformin 500 mg BD ) in this
population with lifestyle modification and register the benefits of combining them.
1.9 Justification of the Study
It has been noted that the features of Metabolic Syndrome may present up to 10 years
preceding Type 2 diabetes and CVD (103-110). Especially in South Asians having a high
prevalence of the Metabolic Syndrome may lead to a high diabetes and CVD incidence in the
coming decade (57,58).
The increasing prevalence of obesity in recent years along with metabolic syndrome has
increased the risk of developing Type 2 diabetes and CVD manifold. Identifying the risk
factors associated with Metabolic Syndrome is thus important if primary prevention
programs for diabetes and CVD are to be planned in the future.
The identification of risk factors especially modifiable ones would be a integral and vital part
of public health polices on prevention as longitudinal studies have shown that reducing
these risk factors delays or prevents the occurrence of disease in the future.
The clustering of these risk factors in the so called “metabolic syndrome” may also provide
the primary care physician an integrative view of linking conditions together so as to treat
these high risk subjects much earlier. This identification of cluster of risk factors may also
help in identifying high risk subjects in whom intervention can be done.
Once these high risk subjects are identified, initiating intervention in such primary
prevention program could be initiated and culturally adapted needs in such a pioneer
program would be observed and documented for future health policy planning.
Unless such culturally adapted effective primary prevention programmes are designed and
implemented, the prevalence of diabetes will continue to rise steeply.
The first step should be a primary prevention study of a smaller scale, the results of which
are to be analysed and if needed modified according to local needs to initiate local or
national health care policies.

2 Chapter 2: Material and Methods
2.1 Study Sites Two studies were consequently undertaken with different study designs; the first an
epidemiological survey in one area of karachi in 2004 followed by the second, a prospective
intervention study done between 2006-2009 in karachi.
The first was an epidemiological survey designed to see the prevalence of metabolic
syndrome and its risk factors among 500 randomly selected households in Lyari, an urban
area within Karachi city in 2004 . The second was a primary prevention study done in the
city of Karachi from 2006-2009. It was a prospective randomized clinical trial (RCT) to assess
the effect of intervention for 18 months on high risk subjects.
2.2 Research Setting
2.2.1 Epidemiological survey in Lyari town: The City of Karachi is divided into 18 towns as shown in figure 5 and Lyari Town is one of the
oldest and most densely populated part of Karachi city. Lyari’s approximately 700,000
residents form an extremely diverse community, representing almost every cultural and
ethnic groups found in Pakistan. There is a wide spectrum of socioeconomic groups.
2.2.2 Primary Prevention Study in Karachi city Karachi is the largest and most populous city in Pakistan. The City of Karachi is divided into
18 towns and 178 union councils. Today the population of this megacity is somewhere
around 16 million.
1. Lyari Town, 2. Saddar Town, 3. Jamshed Town, 4. Gadap Town, 5. SITE Town, 6. Kemari Town, 7. Shah Faisal Town, 8. Korangi Town, 9. Landhi Town, 10. Bin Qasim Town, 11. Malir Town, 12. Gulshan Town, 13. Liaquatabad Town, 14. North Nazimabad Town, 15. Gulberg Town, 16. New Karachi Town, 17. Orangi Town, 18. Baldia Town. A. Karachi Cantonment (Cantt.), B. Clifton Cantt, C. Korangi Creek Cantt, D. Faisal Cantt, E. Malir Cantt, F.
Manora Cantt.
Figur 5: Description of the 18 towns and 6 cantonments of Karachi.
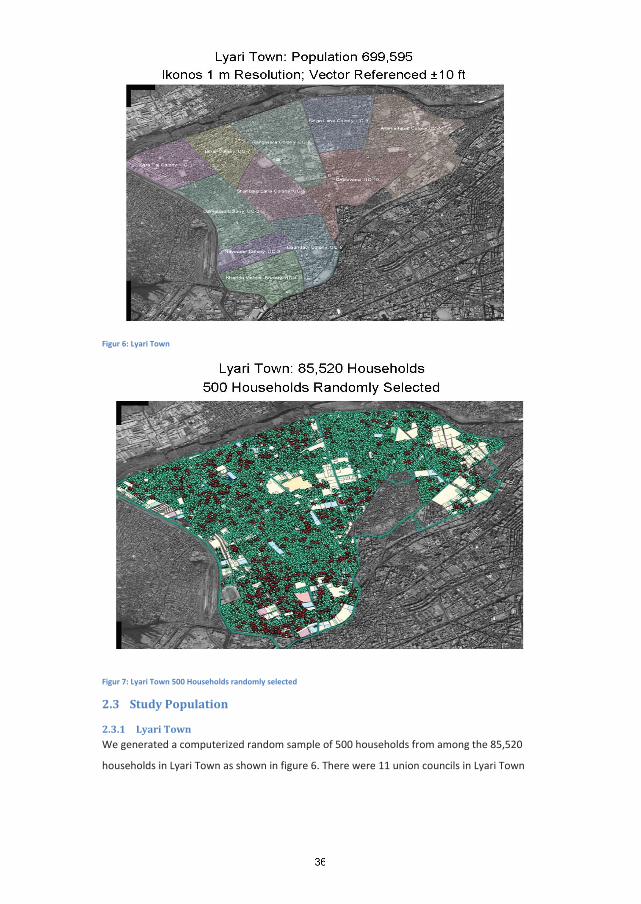
Figur 6: Lyari Town
Figur 7: Lyari Town 500 Households randomly selected
2.3 Study Population
2.3.1 Lyari Town We generated a computerized random sample of 500 households from among the 85,520
households in Lyari Town as shown in figure 6. There were 11 union councils in Lyari Town
where the samples were taken from ensuring that each union council had equal opportunity
to be represented in the sample selection. We expected approximately 1000 adult men and
women 25 years and above in the 500 households selected in Lyari Town as shown in figure
7. If members of a household that had been selected refused to consent to household
interviews, we knocked on the third door to the right of that house (while standing facing
the door of the original house) and seeked consent there. If we were refused again, we
knocked on the next consecutive door to the right and repeated this process until we had
enrolled a household from the neighbourhood of the original household selected.
2.3.1.1 Criteria for Inclusion and Exclusion All adults 25 years and above from the selected households who gave their informed
consent were included in the study.
Persons with physical or intellectual disabilities that precluded participation in the study
were excluded and also those who had resided in the current address for less than 6 months
before the survey.
2.3.2 Karachi City Karachi is the largest and most populous city of Pakistan. All the major ethnic groups of the
country are represented here. High risk questionnaires were distributed at the out patient
departments of health care centres to recruit the family members of known diabetes
subjects. Posters, banners and leaflets informing about the primary prevention program
were distributed throughout the city. Our team of health professionels also visited different
organizations and offices to generate awareness about our primary prevention program and
gave awareness lectures. Diabetes screening camps were also arranged at various public
places such as parks and community halls to create awareness about diabetes and inform
the general public about the prevention program.
2.3.2.1 Criteria for Inclusion and Exclusion Subjects over the age of 30 years who fulfilled the study criteria were included. Subjects
having IGT and no known diabetes were included.
Subjects with a debilitating disease or compromised condition such as cancer or hepatitis
etc, which could be a contraindication to participate in such a trial were excluded.
Those taking any medication which could affect their blood glucose levels such as beta
blockers for hypertension etc, or planning to get pregnant were also excluded from the
study.

2.4 Sample Size
2.4.1 Lyari Town In the planning phase of the study the following assumption was made by the research
group of the epidemiological survey;
Assuming that the prevalence of T2DM to be 11% in this population and the size of the
population from which the study sample is to be selected (persons 25 years and above in
Lyari Town) is 244,000. The worst acceptable result is ±1.5% from the true population value,
thus our study would require a sample of at least 713 individuals to have 80% power to
detect the true population value.
Individual members within households also reserve the right to refuse participation in the
study. Assuming a 10% refusal rate (by members within the household at the time of
interview) and another 10% refusal rate by those who decline to provide consent for a blood
test, we expected at least 810 individuals to participate in this study.
Since the prevalence of metabolic syndrome is assumed to be higher than that of diabetes
we believe this sample size would be sufficient for assessing metabolic syndrome in our
population.
In the field we were able to interview 867 individuals; more than the required number
needed but only 363 individuals gave blood samples leaving us with less than the required
numbers at the end of the study having 40 – 45% power to detect true population value.
2.4.2 Karachi City For the primary prevention study nearly 2000 suspected high risk cases identified by a high
risk questionnaire were to be invited to participate. Considering 30% IGT cases in high risk
individuals around 600 were expected to have IGT. The IGT cases were then to be randomly
allocated on three different arms, two preventive groups and one control group, all with 200
participants. With an expected conversion rate of nearly 30% T2DM in the control group (n
= 60) and an reduction of 15-20 % in the intervention group (n = 9 -12) the sample size will
be adequate considering ß = 0.20 and
Although an estimated 5000 people attended the diabetes prevention lectures and visited
the screening camps and around 2300 people filled in the high risk questionnaire only 1825
were identified as high risk on the basis of the questionairre. Of these 1739 high risk
subjects undertook a standardized oral glucose tolerance test (OGTT) and 317 subjects were
identified as having impaired glucose tolerance (IGT group) and were randomized into the
three groups.

2.5 Research Design
2.5.1 Lyari Town
2.5.1.1 Survey protocol and procedures The survey activities were conducted over a period of 6 months from July to December
2004. A Geographical Imaging Systems (GIS), previously developed for Lyari Town with
unique identification numbers ascribed to 85,520 households was used.
The survey activities were divided into two phases—the household interview plus physical
examination and blood sample collection.
A household was defined as including all those who shared a kitchen. Five hundred
households were randomly selected through the GIS software and maps to these
households were generated for 9 field teams. A field team comprised of one or two medical
students, a female health worker and a male health worker. Surveyors from the GIS teams
worked as guides for 2-3 teams in a given area. All teams and surveyors were supervised by
a medical doctor acting as the field coordinator.
2.5.1.2 Household census and interview Twelve medical students conducted these household visits with the assistance of 8 health
workers from Lyari Community Development Project – a local welfare organization. Once a
household was located, medical students identified themselves to the oldest male or female
member present and informed them of the objectives of the survey. All adults 25 years and
older were invited to participate after providing signed consent. In case of illiterate
participants, the consent form was read out to them and a thumb print procured in the
presence of a household member or neighbour as witness.
Field work entailed afternoon visits to the selected household by a field team (medical
students and health worker), introduction to the purpose of the research study, consent,
interviews and physical measurements (including weight, height, waist and hip
circumference, blood pressure).
The interviewers made a minimum of 2 visits and up to 5 visits before a household was
classified as a non contact. Where possible, at each participating household a personal
interview was conducted with every adult member aged 25 years and above who met the
eligibility requirements.
At the end of the household visit, all adults 25 years and above were asked to undertake an
8 hour fast for blood tests (fasting blood sugar and lipid profile) that was collected at home
on Saturday and Sunday mornings. All adults were provided with a urine collection bottle
and asked to collect a mid-stream urine specimen for tests (pus cells, proteinuria and
microalbuminuria) on the morning of their blood test date.
2.5.1.3 Questionnaire The adults present in each household were administered a survey form (Questionnaire)
which consisted of 3 main parts.
Part A collected information about the entire household and was same for all the persons
living in a specific household. It consisted of 4 sections.
Part B of the survey form collected information about personal and family history of the
persons in each household and consisted of 6 sections.
Part C collected anthropometric information about the individual persons and also lab
reports were written in this section.
Anthropometric data included measurements of weight, height, waist and hip
circumference. Participants were asked to wear light clothing and take off their shoes during
anthropometry measurements. Height was measured to the nearest cm and weight to the
nearest 0.1 Kg. Weight was taken with a standardized scale and height with a standardized
measuring stick. Waist circumference was measured as the mid point between the iliac crest
and the lower margin of the ribs.
Blood pressure was take by a medical student or doctor at least twice with 20 minute
intervals, after ensuring that at least 30 minutes had passed since tea or tobacco were last
consumed. A third BP measurement was taken if one or both of the first two readings were
above the cutoffs for a diagnosis of hypertension.
2.5.2 Karachi City
2.5.2.1 Study protocol This was a randomized clinical trial (RCT) conducted in subjects over 30 years of age who
were diagnosed as having IGT according to World health Organization criteria (38). The IGT
subjects were followed for a period of 18 months prospectively. Awareness about the
primary prevention program was disseminated through posters\banners and leaflets. Our
primary prevention team also visited different primary health care centres in the city to
generate awareness about our primary prevention program and held diabetes screening
camps at various public places such as parks and community halls.
To identify subjects from the general population who may be at increased risk of developing
type 2 diabetes, a questionnaire was asked to be filled in as the first step. This standardized
questionnaire asking about family history (parents or siblings with diabetes), high body
mass index, low physical activity, age > 40 years, hypertension, high cholesterol or
triglycerides and history of gestational diabetes or baby weighing > 3.5 Kg at birth was used
to identify high risk subjects at this initial step. Those identified as high risk were further
asked to undertake an Oral Glucose Tolerance Test (OGTT). Those subjects identified as
being IGT were stratified randomly by age into three different arms to ensure equal age
representation in all the arms of the intervention. The age stratification was 31- 40 years,
41–50 years, 51–60 years and > 60 years into each of the three groups.
2.5.2.2 Recruitment and Questionnaire A number of strategies starting with opportunistic screening at the 2 health care centres
involved in the study was initiated. With the aim to reach a greater audience our diabetes
prevention team arranged a series of 2-days awareness lectures at various places in the city
by going to offices, service organizations, work factories and visiting health care centres.
Lectures on diabetes and its prevention were delivered by the diabetes prevention team in
local language to the audience on the first day. The audience were asked to fill in the risk
questionnaire at the end of the first day. On the second day, screening of high risk subjects
was done according to results of the questionnaire and all high risk subjects were invited for
an OGTT.
During the time that the OGTT was done, all subjects underwent a detailed anthropometric
and medical examination as well as been asked questions about their socio-demographic,
physical activities and dietary habits including information on quantity and quality of meals
by a dietician and physical trainer. Weight, height, waist circumference and blood pressure
were measured at each scheduled visit. Weight and height was measured with the subjects
minimally clothed, without shoes, in a standing position. Waist circumference was measured
at the mid-point between the iliac crest and the costal arch. Blood pressure was measured
twice, 5 min apart, in a sitting position, and the average of the two was recorded.
2.5.2.3 Intervention and Randomization All subjects who agreed to participate in the study were randomized into three groups. First
group (Control Group) was given standard medical advice, second group (ILSM Group) was
given intensive lifestyle modification advice while thrid group (ILSM+Drug Group) was given
intensive lifestyle modification advice and metformin 500 mg twice daily. The subjects
assigned to their respective groups were followed till the close of the study.
The subjects in the control group were given general diet and exercise information at
baseline and followed at subsequent visits but no specific individual counselling was done.
The subjects in the intervention+drug group were given detailed advice about how to
achieve the intervention goals, which included reducing > 5 % of body weight loss via diet
control and physical exercise, total fat intake less than 30% of energy consumed, fiber intake
of 15g/1000 kcal, and moderate exercise for minimum 30 min/day. Frequent ingestion of
wholemeal products, vegetables and fruits, low-fat milk and meat products, and vegetable
oils rich in monounsaturated fatty acids was recommended. The subjects had sessions with
a dietician and physical trainer at each visit and they were individually guided and
encouraged to increase their level of physical activity. Endurance exercises such as walking,
jogging and cycling were recommended to increase fitness. Supervised, progressive and
individually tailored training advice was also offered to improve the functional capacity and
endurance of each individual. These interventions were based on reinforcing behaviour
modification via diet change and encouraging physical activity of each subject individually.
The subjects in the intervention+drug group were seen every 2 months by a medical doctor
for their drug adherence apart from the intervention advice.
2.5.2.4 Follow-up Reinforcement and counselling was done every 2 months in the intensive and
intensive+drug groups with visits to the medical officer, dietician and physical trainer. While
every 3 months the subjects in the control group were seen by the medical officer.
2.5.2.5 Primary Outcome: The primary outcome was defined as developing diabetes indicated by either fasting plasma
glucose of (> 125 mg\dl) and \or 2-hours plasma glucose of (>199 mg\dl) during 9 and 18
months follow-up by an OGTT (38). Subjects identified as having diabetes were excluded
from the study and given medical advice with referral to physicians for further follow-up.
2.6 Lab Investigations:
2.6.1 Blood and Urine Samples of Lyari Town Survey Specimens were collected at home on Saturdays and Sundays by five mobile teams
consisting of two phlebotomists each. At the time of blood collection, all participants were
asked to provide consent for blood tests for fasting blood glucose and lipid profile and urine
for proteinuria.
All blood samples were collected in two separate test tubes; a red cap vacutainer and green
cap sodium fluoride tube. A total of 12 cc of blood was taken from each patient. 10 cc was
place in the red vacutainer for analysis of Lipid profile and insulin serum levels and
remaining 2cc was placed in the green NaF test tube for analysis of fasting glucose.
Within 1 hour of collection the blood was centrifuged and separated. Tests were done by
the Vitalab Selectra Analyzer for Glucose, Cholesterol, Triglycerides, HDL-Cholesterol, LDL-
Cholesterol and Insulin levels. Fasting blood glucose and lipid profile were done by GOD PAP
method and CHOD PAP method respectively. Insulin levels were done by Elisa method.
Urine samples were collected from the respective subject on the morning of collection. They
were advised to keep the specimen in a cool and shaded area. Urine tests included a
qualitative determination of proteinuria and a quantitative measurement of
microalbuminuria.
2.6.2 Samples of Karachi City All IGT subjects in the primary prevention study had fasting lipid profile, fasting insulin
levels, OGTT and HbA1c done at 0, 9 and 18 months. At the interim 9-month visits,
confirmation of diabetes was made with OGTT. Plasma glucose was measured using the
glucose oxidase–peroxidase method. The fasting serum lipid profile was estimated using
standard enzymatic procedures. HbA1c was measured by HPLC using Biorad, a procedure
certified by the National Glycohemoglobin Standardization Program.
2.7 Statistical analysis
2.7.1 Lyari Data All data was recorded on forms developed using TeleForm® Version 6.01, an optical
character recognition software. Forms were scanned and verified using TeleForm® Version
6.01 and exported into an SQL database. Later this data was converted into the software
package SPSS version 11.5 (Statistical Package for Social Sciences) for analysis.
The main variables for analysis included age, gender, socioeconomic and ethnic groups,
fasting glucose and insulin levels, lipid profile, proteinuria and microalbuminuria,
hypertension, body mass index, waist-hip ratio, mid-abdominal circumference, smoking
exposure and family history of disease. Some of the other risk factors to be included in the
analysis were physical activity and diet.
The prevalence of metabolic syndrome was determined by simple percentages and with
95% confi dence intervals (CIs). For group comparisons, the chi-square test was performed;
the Student t-test was performed for continuous variables. A P value of <0.05 was
considered statistically significant. The age-specific distribution of prevalence of metabolic
syndrome was calculated for men and women separately and described in percentages. A
kappa test was done to examine the agreement among the defi nitions. All P values
presented are two tailed (Paper 1).
2.7.1.1 Dietary data: Dietary consumption was assessed by a 33 food items interviewer-administered semi
quantitative food-frequency questionnaire in the lyari town study. The food items were
categorized into 6 major food groups: Dairy, meat, fat and sweet, cereals, vegetables and
fruits groups. Out of the 363 subjects assessed for metabolic syndrome 362 completed the
food-frequency questionnaire.

We used cluster analysis to identify dietary patterns and to segregate subjects based on the
similarity of diet. We chose food variables because we wanted to identify food patterns
clusters. K-means cluster analysis was used to define clusters of subjects using the cluster
analysis option in SPSS. This procedure attempts to identify relatively homogeneous groups
of cases based on selected characteristics.
In K-means cluster analysis, the homogeneity of cases within a cluster is measured by the
total within-cluster sum of squares. Cluster memberships are determined by sequentially
moving cases from one cluster to another so that the total within-cluster sum of squares is
minimized. The algorithm requires the number of clusters to be specified prior to analysis. It
is possible to identify seeds using information derived from previous research. Five clusters
were defined and we investigated metabolic syndrome prevalence in each cluster and
compared the dietary patterns of the clusters with the lowest and highest prevalence of
metabolic syndrome (Paper 2).
2.7.1.2 Assessing insulin resistance Insulin resistance was assessed in 227 normal subjects by calculating HOMA, QUICKI and
McAuley Index indices by the following calculations:
HOMA-R = Insulin (Iu/ml) × glucose (mmol/l)/22.5
QUICKI = 1/ [log (fasting insulin) + log (fasting glucose)]
McAuley Index = Exp [2.63-028 ln (Insulin in Mu/l)-0.31ln (triglyceride in mmol/l).
Characteristics of the subjects according to gender were analyzed using an independent
sample t-test. Data was presented as quartiles of fasting insulin, HOMA-IR, QUICKI and
McAuley index to observe the various percentiles of insulin sensitivity and determine insulin
resistance according to defined standard protocols. The statistical analysis was conducted
using SPSS for Windows (version13, SPSS Inc., Chicago, IL, U.S.A.), and p <0.05 was
considered statistically significant (Paper 3).
2.7.2 Primary Prevention Study Mean and standard deviation are reported for continuous variables and inter-group
comparisons were tested by two tailed ANOVA in this study. Comparison of proportions was
by chi square analysis. The proportion of subjects developing diabetes in each group and
their comparison was also done by chi square analysis.
For the intervention measures, the absolute and relative risk reductions and 95% CIs of the
estimates and the number needed to treat to prevent diabetes in one person were
calculated. A p value <0.05 was considered significant. The statistical package SPSS (PASW
Statistics 18) was used for analyses (Paper 4).

2.8 Ethical Considerations
2.8.1 Ethical Clearance The study protocols of the epidemiological survey in Lyari Town and the Primary prevention
study in Karachi city were approved by the institutional review board of the Baqai Institute
of Diabetology and Endocrinology (BIDE).
The study protocols had also been sent to the Norwegian Ethics Committee for approval.
2.8.2 Informed Consent Informed consent is a prerequisite for all research involving human subjects. Verbally and in
writing, subjects were informed about the purpose and scope of both the studies
independently, the benefits and risks of the studies, how the results will be used and
reported and the method of confidentiality that will be used in reports. Since all the subjects
were interviewed from a structured questionnaire; questions did not probably change from
subject to subject.
All participants in both the studies were required to give their informed consent voluntarily
and the study was carried out in accordance with the Declaration of Helsinki as revised in
2000.
All participants reserved the right to withdraw from the study at any time, even if they have
previously given consent to be part of study. The findings were treated with highest possible
degree of confidentiality. Each subject was given a unique identity number.
After data collection was completed and the subjects had received their results the data was
anonymized. Names were deleted and the data could not be traced back to any specific
individual.

3 Results
3.1 Synopsis of Paper 1
Reference:
Prevalence of Metabolic Syndrome in Urban Pakistan (Karachi): Comparison of Newly
Proposed International Diabetes Federation and Modified Adult Treatment Panel III Criteria.
M. Zafar Iqbal Hydrie, A. Samad Shera, Asher Fawwad, Abdul Basit and Akhtar Hussain.
METABOLIC SYNDROME AND RELATED DISORDERS, Volume 7, Number 2, 2009.
Title: Prevalence of Metabolic Syndrome in Urban Pakistan (Karachi): Comparison of Newly
Proposed International Diabetes Federation and Modified Adult Treatment Panel III Criteria
Abstract:
The clustering of central obesity, dyslipidemia, hypertension, and hyperglycemia known as
metabolic syndrome has been associated with a two- to three-fold increase in type 2
diabetes (T2DM) and cardiovascular disease (CVD). It is recognized that the features of the
metabolic syndrome can be present 10 years preceding T2DM and CVD. The objective of our
study was to determine the prevalence of metabolic syndrome in adults aged 25 years and
older from an urban population of Karachi, Pakistan, according to the International Diabetes
Federation (IDF) definition and modified Adult Treatment Panel III (ATP III) criteria. This
study involved a survey conducted from July, 2004, to December, 2004, by generating a
computerized random sample of households in Lyari Town using a geographical imaging
system (GIS). Out of the 85,520 households, 532 households were randomly selected and
867 adults 25 years old consented to take part in the survey; 363 of these subjects gave
blood samples. The prevalence of diabetes was 9.4%, whereas 5.6% had impaired fasting
glucose (abnormal glucose tolerance 15%). The prevalence of metabolic syndrome
according to the IDF definition and modified ATP III criteria was 34.8% and 49%,
respectively. Inclusion of modified waist circumference and specifi c body mass index (BMI)
cut offs for Asians may help predict metabolic syndrome at an early stage. High prevalence
of metabolic syndrome was identified irrespective of the definition applied in this
population. This may call for immediate action to halt the accelerating risk of diabetes and
CVD that would lead to a possible unparalleled rise in the cost of health care and human
suffering.
3.2 Synopsis of Paper 2
Reference:
Dietary Patterns Associated with Risk for Metabolic Syndrome in Urban Community of
Karachi Defined by Cluster Analysis.
M. Zafar Iqbal Hydrie, Abdul Basit, A. Samad Shera, Rubina Hakeem and Akhtar Hussain.
Pakistan Journal of Nutrition 9 (1): 93-99, 2010. ISSN 1680-5194.
Title: Dietary Patterns Associated with Risk for Metabolic Syndrome in Urban Community of
Karachi Defined by Cluster Analysis.
Abstract: Dietary trends have been found to be related with metabolic syndrome in various
studies. To identify dietary patterns and study associations between the dietary patterns of
subjects with high and low risk of metabolic syndrome in a Karachi population. A group of
871 men and women were selected randomly from 532 households. Data about
consumption of specific foods was available for 867 adults. Participants completed a health
and lifestyle questionnaire and 363 subjects provided fasting blood samples for glucose and
lipids. Dietary intake was assessed by a questionnaire to identify consumption of 33 specific
food items and the dietary patterns categorized into 6 food groups was assessed by cluster
analysis. Five dietary patterns were identified through cluster analysis. Cluster 1 had the
lowest proportion of persons with metabolic syndrome i.e. 42.7% while cluster 2 had the
highest percentage of metabolic syndrome subjects (56.3%) (p = 0.09). Consumption of fat
and caloric dense foods was significantly higher among highest risk group (cluster 2)
compared to lowest risk group (cluster 1) (p = 0.0001). The consumption of food groups
containing fruit, milk and meat was also more than twice in high risk compared to low risk
group (p = 0.0001). Even within the same population there are marked differences in dietary
patterns and these apparently contribute to the risk of developing metabolic syndrome.
Dietary pattern studies will help elucidate links between diet and disease and contribute to
developing healthy eating guidelines.
3.3 Synopsis of Paper 3
Reference:
Detecting Insulin Resistance in Pakistani Subjects by Fasting Blood Samples.
M. Zafar Iqbal Hydrie, Abdul Basit, Asher Fawwad, Muhammad Yakoob Ahmedani, A Samad
Shera and Akhtar Hussain.
Accepted in The Open Diabetes Journal.
Title: Detecting Insulin Resistance in Pakistani Subjects by Fasting Blood Samples
ABSTRACT:
Background: Insulin Resistance has been identified as an independent risk factor for a
number of chronic diseases such as diabetes and cardiovascular diseases (CVD).
Objective : To identify a simple indirect method for detecting insulin resistance (IR) in our
population.
Methods: Geographical Imaging Systems (GIS) was used for randomly selecting the subjects.
For visiting the 532 households selected by GIS, 9 field teams were developed. A total of 871
subjects older than 25 years were approached by these teams out of which 867 agreed to
participate in the survey. IR was assessed in 227 normal subjects by fasting insulin, HOMA-
IR, QUICKI and McAuley Index.
Results: IR was defined at 75th percentile cut off of insulin levels (9.25 U/mL) and HOMA-IR
(1.82). The 25th
Conclusion: A common approach towards managing subjects with metabolic risk factors will
help identify IR earlier and using IR reference values identified from simple indirect methods
would be of value in such cases. However larger population based studies are needed to
further define and validate these cutoff values for insulin resistance.
percentile cut off was used for defining IR in QUICKI (0.347) and McAuley
Index (6.77).
3.4 Synopsis of Paper 4
Reference:
Effect of intervention in subjects with high risk of Diabetes Mellitus in Pakistan.
M. Zafar Iqbal Hydrie, Abdul Basit, A Samad Shera and Akhtar Hussain.
To be submitted.
Title: Effect of intervention in subjects with high risk of Diabetes Mellitus in Pakistan.
Abstract:
Aims: The aim of the study was to observe the rate of conversion from impaired glucose
tolerance (IGT) to diabetes following lifestyle modification program and a combination of
lifestyle modification and oral hypoglycaemic agent (metformin) compared to a control
population with 18 months follow up.
Methods: Around 40 screening camps were organized following a series of awareness
lectures at various places in the city. Nearly 5000 people attended these lectures offices,
organizations, factories, health care centres and visited the screening camps. Around 1825
subjects over 30 years of age were identified as high risk on the basis of a questionairre and
requested to undertake an oral glucose tolerance test (OGTT). Out of these1739 subjects
took the OGTT and 317 subjects were identified as having impaired glucose tolerance (IGT).
They were randomized into three groups. First group was given standard medical advice
(Control Group), second group was given intensive lifestyle modification advice (LSM Group)
while third group was given intensive lifestyle modification advice and metformin 500mg
twice daily (LSM+Drug Group).
Results: At the end of the study 273 subjects completed the study giving a compliance rate
of 86%. A total of 47 incident cases of diabetes were diagnosed during the study. The overall
incidence of diabetes was 4 cases per 1000 person-months with the incidence of diabetes as
8.6 cases in the control group, 2.5 cases in the Life Style Modification (LSM) group and 2.3
cases in the LSM+drug group.
Conclusions: This study showed that lifestyle intervention had a major impact in preventing
diabetes among IGT subjects in this region. However, addition of drug in the intervention
did not show any improved results. Resource constrain societies are challenged with the
additional burden of diabetes cost on their already ailing economy. Therefore, we
recommend that lifestyle modification advice and follow-up should be incorporated in
primary health care.
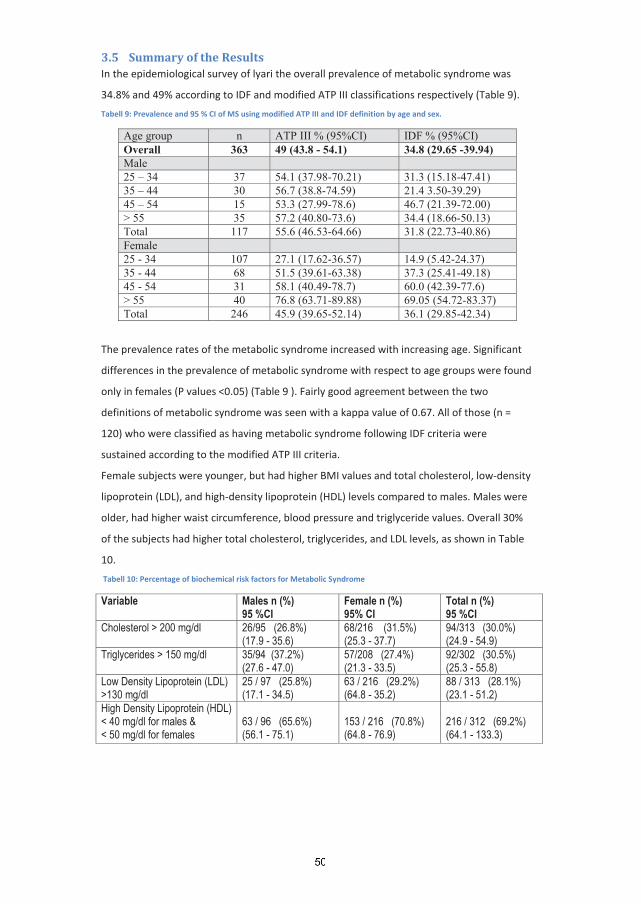
3.5 Summary of the Results In the epidemiological survey of lyari the overall prevalence of metabolic syndrome was
34.8% and 49% according to IDF and modified ATP III classifications respectively (Table 9).
Tabell 9: Prevalence and 95 % CI of MS using modified ATP III and IDF definition by age and sex.
Age group n ATP III % (95%CI) IDF % (95%CI)Overall 363 49 (43.8 - 54.1) 34.8 (29.65 -39.94)Male25 – 34 37 54.1 (37.98-70.21) 31.3 (15.18-47.41)35 – 44 30 56.7 (38.8-74.59) 21.4 3.50-39.29)45 – 54 15 53.3 (27.99-78.6) 46.7 (21.39-72.00)> 55 35 57.2 (40.80-73.6) 34.4 (18.66-50.13)Total 117 55.6 (46.53-64.66) 31.8 (22.73-40.86)Female25 - 34 107 27.1 (17.62-36.57) 14.9 (5.42-24.37)35 - 44 68 51.5 (39.61-63.38) 37.3 (25.41-49.18)45 - 54 31 58.1 (40.49-78.7) 60.0 (42.39-77.6)> 55 40 76.8 (63.71-89.88) 69.05 (54.72-83.37)Total 246 45.9 (39.65-52.14) 36.1 (29.85-42.34)
The prevalence rates of the metabolic syndrome increased with increasing age. Significant
differences in the prevalence of metabolic syndrome with respect to age groups were found
only in females (P values <0.05) (Table 9 ). Fairly good agreement between the two
definitions of metabolic syndrome was seen with a kappa value of 0.67. All of those (n =
120) who were classified as having metabolic syndrome following IDF criteria were
sustained according to the modified ATP III criteria.
Female subjects were younger, but had higher BMI values and total cholesterol, low-density
lipoprotein (LDL), and high-density lipoprotein (HDL) levels compared to males. Males were
older, had higher waist circumference, blood pressure and triglyceride values. Overall 30%
of the subjects had higher total cholesterol, triglycerides, and LDL levels, as shown in Table
10.
Tabell 10: Percentage of biochemical risk factors for Metabolic Syndrome
Variable Males n (%) 95 %CI
Female n (%) 95% CI
Total n (%) 95 %CI
Cholesterol > 200 mg/dl 26/95 (26.8%)(17.9 - 35.6)
68/216 (31.5%)(25.3 - 37.7)
94/313 (30.0%)(24.9 - 54.9)
Triglycerides > 150 mg/dl 35/94 (37.2%)(27.6 - 47.0)
57/208 (27.4%)(21.3 - 33.5)
92/302 (30.5%)(25.3 - 55.8)
Low Density Lipoprotein (LDL) >130 mg/dl
25 / 97 (25.8%)(17.1 - 34.5)
63 / 216 (29.2%)(64.8 - 35.2)
88 / 313 (28.1%)(23.1 - 51.2)
High Density Lipoprotein (HDL) < 40 mg/dl for males & < 50 mg/dl for females
63 / 96 (65.6%)(56.1 - 75.1)
153 / 216 (70.8%)(64.8 - 76.9)
216 / 312 (69.2%)(64.1 - 133.3)

Around 70% had low HDL levels, which is similar to that found in South Asian subjects
residing in Europe (53). The prevalence of diabetes was found to be 9.4%, while 5.6% had
impaired fasting glucose (Total abnormal glucose tolerance around 15%).
We used cluster analysis to look at the diet data of the Lyari epidemiological survey and we
identified five distinct groups in this population on the basis of cluster analysis. A total of 75
subjects (20.7%) were in cluster one, 71(19.6%) in cluster two, 64(17.8%) in cluster three,
85 (23.5%) in cluster four and 67 (18.5%) in cluster five. Frequency of consumption of each
food group in all the clusters is shown in Table 11.
Tabell 11: Frequency of Consumption of food groups in Clusters
Clusters 1 2 3 4 5 milk group 24 69 32 57 29 meat group 35 79 61 61 56 fat group 13 70 20 42 44 cereal group 76 91 90 92 81 vegetables group 72 94 83 93 82 fruit group 34 74 45 59 46 While looking for the proportion of subjects with metabolic syndrome in each cluster we
observed that cluster one had the lowest while cluster two had the highest percentage of
subjects with the metabolic syndrome (42.7% vs. 56.3%), with a p value of 0.09 as shown in
Figure 8.
Figur 8: Metabolic syndrome in five Clusters according to Modified ATP III Definition
Groups
47.848.25056.3
42.7
0
10
20
30
40
50
60
1st 2nd 3rd 4th 5th
%
The dietary pattern in cluster 2 was loaded with both healthy (milk, legumes, vegetables and
fruits) and unhealthy (refined grains, potatoes, meat and meat products , high fat dairy
products, snacks, sweet items and fruit juices) foods. Although healthy foods are reported
to be protective against the metabolic syndrome, the cluster's unhealthy diet constituents
had adverse effects on the metabolic markers which might have lead to the increased
prevalence of metabolic syndrome as seen in this study.

For analyzing the insulin resistance cutoff values, only those subjects with a fasting blood
glucose of < 100 mg/dl were included to ensure that our study population only had normal
glucose tolerance subjects. A total of 227 normoglycemic subjects (70 men and 157 women)
were selected from the lyari epidemiological survey. General characteristics of this group of
subjects are shown in Table 12.
Tabell 12: General characteristics of the study subjects
* P-value < 0.001 ** P-value < 0.005 *** P-value < 0.05
Females were significantly younger than males with lower waist circumference but higher
Body Mass Index (BMI). Mean fasting insulin and HOMA-IR was also higher in females while
other indices of insulin resistance were not much different in males and females.
The 75th percentile cut off was used as a value for defining insulin resistance for fasting
insulin levels (9.25 U/mL) and for HOMA-IR (1.82) while the 25th percentile was taken as cut
off for defining insulin resistance according to QUICKI (0.347) and for McAuley Index (6.77)
as shown in Table 13. These were taken as cutoff reference values for defining insulin
resistance in the normal population.
Tabell 13: Quartiles of fasting serum insulin, HOMA-IR, QUICKI and McAuley Index.
P25 P50 P75 Insulin 5.95 7.8 9.25 HOMA-IR 1.087 1.454 1.823 QUICKI 0.347 0.359 0.376 McAuley Index 6.77 7.046 7.33
SubjectMale n = (70)
Mean ± SD
Female n = (157)
Mean ± SD
Total n = (227)
Mean ± SD
Age (years)* 43.10 ± 12.95 36.87 ± 11.40 38.79 ± 12.21
Body Mass Index (kg/m2 22.35 ± 4.10) ** 25.09 ± 6.27 24.27 ± 6.07
Waist Circumference (cm) 87.42 ± 12.84 85.31 ± 14.09 85.96 ± 13.72
Systolic Blood Pressure (mmHg) 127.94 ± 19.95 121.73 ± 17.14 123.59 ± 19.55
Diastolic Blood Pressure (mmHg)* 84.70 ± 12.11 77.70 ± 12.87 79.79 ± 13.02
Cholesterol (mg/dl) 175.06 ± 44.02 178.72 ± 44.85 177.61 ± 44.53
Triglyceride (mg/dl)*** 160.58 ± 123.27 128.90 ± 66.33 138.39 ± 88.25
Low Density Lipoprotein (mg/dl) 108.22 ± 30.15 114.48 ± 32.56 112.59 ± 31.91
High Density Lipoprotein (mg/dl)*** 38.65 ± 11.52 43.48 ± 12.52 42.04 ± 12.40
Glucose (mg/dl) 80.80 ± 8.82 79.94 ± 10.63 80.21 ± 10.10
7.60 ± 2.78 8.40 ± 4.50 8.15 ± 4.05
HOMA 1.48 ± 0.58 1.61 ± 0.90 1.57 ± 0.81
QUICKI 0.36 ± 0.02 0.36 ± 0.03 0.36 ± 0.03
McAuley 7.09 ± 1.33 7.37 ± 1.48 7.29 ± 1.44
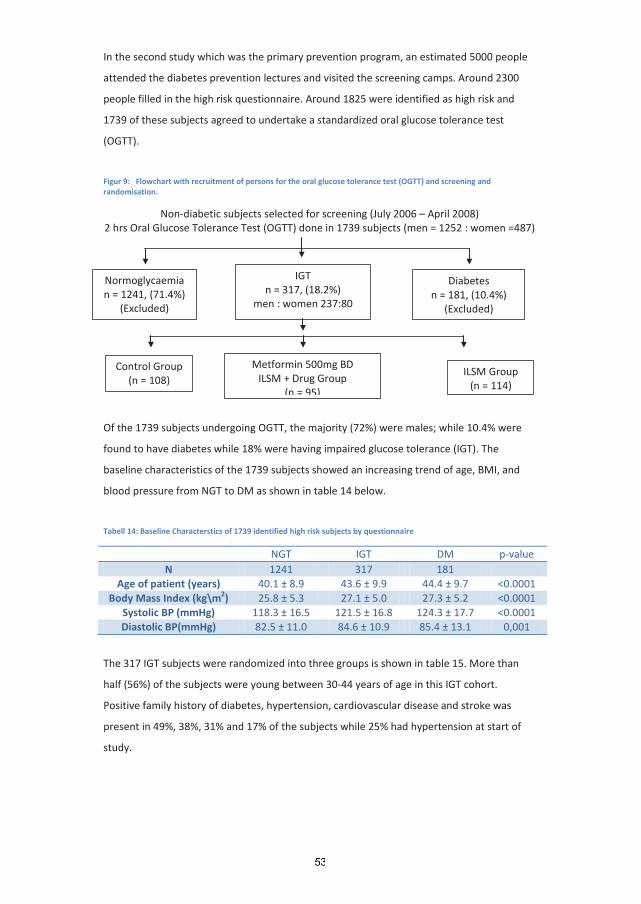
In the second study which was the primary prevention program, an estimated 5000 people
attended the diabetes prevention lectures and visited the screening camps. Around 2300
people filled in the high risk questionnaire. Around 1825 were identified as high risk and
1739 of these subjects agreed to undertake a standardized oral glucose tolerance test
(OGTT).
Figur 9: Flowchart with recruitment of persons for the oral glucose tolerance test (OGTT) and screening and randomisation.
Non-diabetic subjects selected for screening (July 2006 – April 2008) 2 hrs Oral Glucose Tolerance Test (OGTT) done in 1739 subjects (men = 1252 : women =487)
Of the 1739 subjects undergoing OGTT, the majority (72%) were males; while 10.4% were
found to have diabetes while 18% were having impaired glucose tolerance (IGT). The
baseline characteristics of the 1739 subjects showed an increasing trend of age, BMI, and
blood pressure from NGT to DM as shown in table 14 below.
Tabell 14: Baseline Characterstics of 1739 identified high risk subjects by questionnaire
NGT IGT DM p-value N 1241 317 181
Age of patient (years) 40.1 ± 8.9 43.6 ± 9.9 44.4 ± 9.7 <0.0001 Body Mass Index (kg\m2 25.8 ± 5.3 ) 27.1 ± 5.0 27.3 ± 5.2 <0.0001
Systolic BP (mmHg) 118.3 ± 16.5 121.5 ± 16.8 124.3 ± 17.7 <0.0001 Diastolic BP(mmHg) 82.5 ± 11.0 84.6 ± 10.9 85.4 ± 13.1 0,001
The 317 IGT subjects were randomized into three groups is shown in table 15. More than
half (56%) of the subjects were young between 30-44 years of age in this IGT cohort.
Positive family history of diabetes, hypertension, cardiovascular disease and stroke was
present in 49%, 38%, 31% and 17% of the subjects while 25% had hypertension at start of
study.
Control Group (n = 108)
ILSM Group (n = 114)
Normoglycaemia n = 1241, (71.4%)
(Excluded)
IGT n = 317, (18.2%)
men : women 237:80
Diabetes n = 181, (10.4%)
(Excluded)
Metformin 500mg BD ILSM + Drug Group
(n = 95)
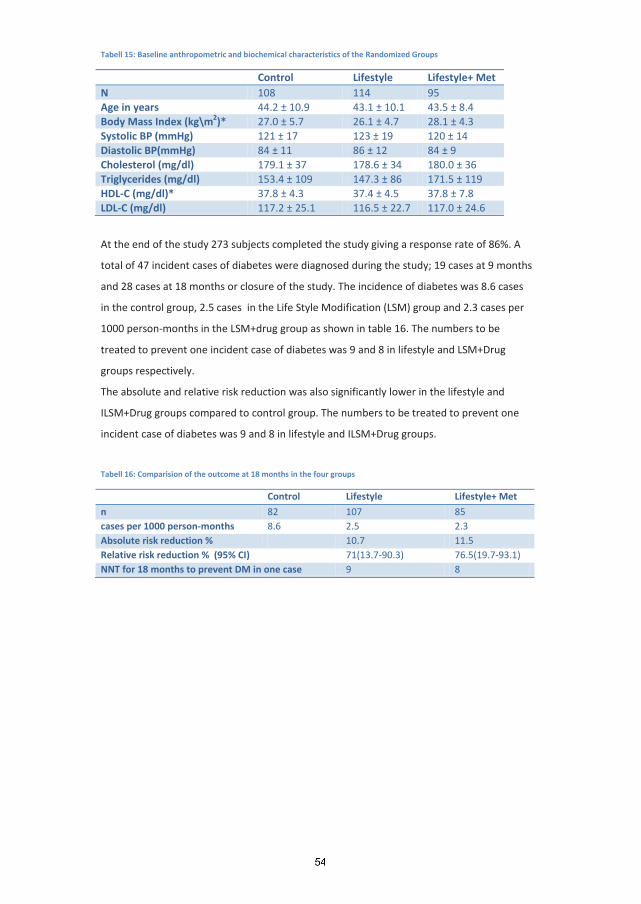
Tabell 15: Baseline anthropometric and biochemical characteristics of the Randomized Groups
Control Lifestyle Lifestyle+ Met N 108 114 95 Age in years 44.2 ± 10.9 43.1 ± 10.1 43.5 ± 8.4 Body Mass Index (kg\m2 27.0 ± 5.7 )* 26.1 ± 4.7 28.1 ± 4.3 Systolic BP (mmHg) 121 ± 17 123 ± 19 120 ± 14 Diastolic BP(mmHg) 84 ± 11 86 ± 12 84 ± 9 Cholesterol (mg/dl) 179.1 ± 37 178.6 ± 34 180.0 ± 36 Triglycerides (mg/dl) 153.4 ± 109 147.3 ± 86 171.5 ± 119 HDL-C (mg/dl)* 37.8 ± 4.3 37.4 ± 4.5 37.8 ± 7.8 LDL-C (mg/dl) 117.2 ± 25.1 116.5 ± 22.7 117.0 ± 24.6
At the end of the study 273 subjects completed the study giving a response rate of 86%. A
total of 47 incident cases of diabetes were diagnosed during the study; 19 cases at 9 months
and 28 cases at 18 months or closure of the study. The incidence of diabetes was 8.6 cases
in the control group, 2.5 cases in the Life Style Modification (LSM) group and 2.3 cases per
1000 person-months in the LSM+drug group as shown in table 16. The numbers to be
treated to prevent one incident case of diabetes was 9 and 8 in lifestyle and LSM+Drug
groups respectively.
The absolute and relative risk reduction was also significantly lower in the lifestyle and
ILSM+Drug groups compared to control group. The numbers to be treated to prevent one
incident case of diabetes was 9 and 8 in lifestyle and ILSM+Drug groups.
Tabell 16: Comparision of the outcome at 18 months in the four groups
Control Lifestyle Lifestyle+ Met
n 82 107 85 cases per 1000 person-months 8.6 2.5 2.3 Absolute risk reduction % 10.7 11.5 Relative risk reduction % (95% CI) 71(13.7-90.3) 76.5(19.7-93.1) NNT for 18 months to prevent DM in one case 9 8
4 Discussion
4.1 Methological Issues
4.1.1 Choice of Study design We undertook two studies and we had two separate study designs for them. A cross
sectional design was chosen for the first study which was an epidemiological survey. Cross
sectional studies are done for determining the prevalence of a disease and to study the
association of risk factors with the occurrence of disease. The aim is to describe individuals
in the population at a particular point in time and their history of exposure at that time.
Cross sectional studies do not present clear evidence on the relationship between risk
factors and disease since both are measured at the same time, making it difficult to
determine whether the risk factors are truly risk factors for the outcome or if they are
influenced by the outcome. However in terms of chronic diseases such as diabetes where
the causation of disease has been fairly well established, data from cross sectional survey
helps to develop or strengthen the hypothesis about the related risk factors. Thus this study
design was used for our survey as has also been done in majority of surveys to determine
the prevalence of chronic diseases, both in Pakistan and in other countries (12,23,26-29).
For our second study which was an intervention we used a randomized control trial (RCT)
design to study the effect of intervention in subjects with high risk of developing type 2
diabetes. We had three arms or groups with two intervention groups and one control group.
The groups had to be randomly selected from the target population, in this case IGT subjects
who had taken an OGTT. Similarity between the groups was needed to ensure that the only
difference between them at the outcome would be the effect of intervention we are trying
to observe. For this purpose we stratified the groups according to age to ensure similar age
distribution between the subjects in all the groups. Since the intervention included
counselling and motivating the subjects for lifestyle modification it could not be blinded as a
drug and placebo trial and the subjects as well as the researchers knew which individual was
enrolled in which group. This study design has been used in studies to observe the effect of
intervention of subjects at risk of developing diabetes (82).
4.1.2 Sample size For the lyari study we assumed that the lower limit prevalence of T2DM to be 11% in this
population. The size of the population from which the study sample was to be selected
(persons 25 years and older in Lyari Town) was 244,000, the worst acceptable result would
be ±1.5% from the true population value. Thus our study would require a sample of at least
713 individuals to have 80% power to detect the true population value. Based on the same

assumptions as used for T2DM (11%); hypertension (10% prevalence) and proteinuria (5%),
our study would have 80% power to detect the true value in a sample size of 727 and 778,
respectively.
If the sample size is insufficient, the statistical power would be low and we would not be
-error. The precision of the
estimate would also be low. In the field we were able to interview more than the required
sample size (n = 867) but people’s reluctance to have the blood tests left us with less than
the desired sample size (n = 363) at the end of the study. However since the prevalence of
metabolic syndrome is between 30 -45% in the general population the sample size enabled
us to analysis and interprets the results on most of the occasions.
For the intervention study nearly 2000 suspected high risk cases identified by a high risk
questionnaire were to be invited to participate. Considering 30% IGT cases in the high risk
individuals around 600 would likely to have IGT. The IGT cases will be randomly allocated on
three different arms, two preventive groups and one control group, all with 200
participants. With an expected conversion rate of nearly 30% T2DM in the control group (n
= 60) and an reduction of 15-20 % in the intervention group (n = 9 -12) the sample size will
be adequate considering ß = 0.20 and
4.1.3 Error Systemic error that modifies the result towards one direction is called bias. While random
error does not influence the results in only one direction, the effects of random error can go
either of the two ways. If a sample is large enough, the effect of random error will be
balanced. Type 1 error occurs when data leads us to believe that something is true when in
reality it is not. While type 2 error occurs when data leads us to believe that the null
hypothesis is not rejected, when in reality it is.
4.2 Bias
4.2.1 Selection bias Systematic introduction of error may occur during subject selection for the study and is
termed selection bias. This occurs when inclusion into a study is influenced by the
characteristics of the subjects which might also affect the outcome. By using a random
selection procedure we can minimize the selection bias by giving everybody the equal
chance to be selected. According to statistical point of view all observational studies have
built in bias but the challenge is to interpret how they affect the outcome of the research.

In our epidemiological study in Lyari, we recruited subjects by using Geographical
Information System (GIS). Lyari Town Geographical Information System was made by
Population Census Office, Statistics Bureau Sindh and National Database and Registration
Authority (NADRA) to define the geopolitical boundaries and population density of Lyari
Town (estimated 2004 population of 700,000). A year-long, detailed physical survey of Lyari
Town was undertaken using available plot maps. All household structures were given a
unique identification number, along with all health, education and other civic facilities
available to its residents. The new maps were finally digitized using a geo-referenced
satellite image of Lyari town. The Lyari Town GIS was used to assess indicators that may be
of interest to researchers, such as determining the community-based prevalence of chronic
diseases among adults as has been done by our group. Computerized random selection of
households by GIS removes the selection bias to an extend as we visited the specified
households instead of setting a camp in the locality to invite participants. Although we had
over representation of women since the survey was done on weekdays compared to males
as most of the men went to work on weekdays and were not home at the time of the
survey.
As for our intervention study, the IGT subjects were selected on the basis of the OGTT
results. This made selection specific to high risk subjects and we tried to ensure that all the
subjects in the groups had similar baseline characteristics. For this purpose we stratified
them according to age to try to ensure that all subjects had similar characteristics and ages
in all the groups.
4.2.2 Information bias Systematic error in collecting information from the subjects is termed information bias. By
asking questions differently and interpreting or coding information in different ways could
lead to information bias. In both our studies, all the team members and the field workers
were trained before the start of the studies as regards filling the questionnaires as well as
been checked periodically during the study to ensure that proper data entries were been
done according to protocol. The field workers in the epidemiological survey were from the
local community and they knew the local dialect and had an understanding of the cultural
norms. While for the intervention study the same prevention team followed all the subjects
to ensure the same quality of care and understanding throughout the study.
4.2.3 Measurement bias Since most of the survey form was in a structured interview questionnaire and subject to
response by participants, if a question was not answered a variable would be missing in the

final analysis. Thus variables had missing data in the interview section of the questionnaire if
the answer was not given.
As regards the anthropometry measurements certification course was arranged for the field
team of the lyari study for measuring height, weight and blood pressure at the National
Institute of Cardiovascular Diseases while for the intervention study it was done by health
professionals.
4.3 Confounding Confounding refers to the issue when a part of or the entire effect of a variable is influenced
by another supposedly causal variable. Controlling for confounding can be done either by
multivariate analysis or stratifying the data. In our epidemiological study we tried
minimizing confounding by using randomized computer based selection of the households
and study subjects. The effect of age and gender was minimized by doing stratified analysis.
However, some confounders might have not been controlled due to lack of data collection,
for example the diet section which was not very extensively covered in the form. In the
intervention study confounding between the groups was controlled by stratifying by age
during the randomization phase to ensure similar baseline characteristics in all subjects.
4.4 Internal validity If the results of a study are true for those who participated in the study, the results are
considered internally valid.
Internal validity is increased by reducing bias and controlling for confounding. We tried to
secure the internal validity of the survey by reducing the confounding effects and
measurement bias as mentioned above. To reduce confounding we also stratified some of
the results for age and gender where appropriate.
4.5 External validity In terms of generalization or external validity the findings of this study reflected the
scenario of urban Population. Lyari was chosen as it is one of the oldest, most densely
populated part of the city with its residents having a diverse community representing every
ethnic group found in Pakistan. The sex ratio was similar as for the country (male/female
ratio of 1.034 males for lyari vs.1.045 males for the country). The mean age for males in lyari
was 23.5 vs. 20.7 years for the country while for females it was 24.5 in lyari vs. 21 years for
the country; suggesting similar age and gender distribution for both populations. Given this
we believe that the findings of the study can be inferred on the general population and is
more likely to be externally valid for the population of Pakistan.
As regards the intervention study this was a selected high risk IGT group which can be
compared with the same high risk population of Pakistan.
4.6 Strengths of the study Lyari Town Geographical Information System was made to dynamically link the national
census database to a purpose built geographical information system (GIS) to define the
geopolitical boundaries and population density of Lyari Town. We generated a
computerized random sample of 532 households from among the 85,520 households in
Lyari Town. There were 11 union councils or subdivisions of Lyari Town where the samples
were taken from ensuring that each union council had equal opportunity to be represented
in the sample selection. We expected approximately 1000 adult men and women above 24
years of age in the selected households in Lyari. If members of a household that had been
selected refused to consent to household interviews, we followed a predefined protocol
until we had enrolled a household from the neighbourhood of the original household
selected.
Individual members within households also reserved the right to refuse participation in the
study. Assuming a 10% refusal rate (by members within the household at the time of
interview) and another 20% refusal rate by those who decline to provide consent for a blood
test, we expected at least 854 individuals to participate in this study.
As for the intervention study, this was from a high risk population which was selected based
on the results of the OGTT. Thus we had certain criteria for selection of subjects for the
study and we also tried to ensure uniformity within all the groups by stratifying for age in all
groups.
4.7 Limitations of the study Looking at the limitations of the study, the study design was cross sectional for the
epidemiological research survey, which is not the ideal design as cross sectional studies do
not present clear evidence on the relationship between risk factors and disease since both
are measured at the same time, making it difficult to determine whether the risk factors are
true factors for the outcome or if they are influenced by the outcome themselves. Also
despite being randomized by computer based GIS it was conducted in one selected area of
the city and had low number of subjects in the final analysis making us to state that the
results of the survey which is urban based needs to be interpreted with caution when
generalizing for the whole population of Pakistan.
As regards the prospective intervention study it was difficult to evaluate the compliance of
all the subjects during the follow up period. The specific target goals were recorded but the
diet and physical activity diaries were based on participants recall and subjective in nature.
The comprehensive follow up of the participants was made more difficult by the participants
being aware of their glycaemic status and maybe discussing this with other health
professionals.
4.8 Discussion of the main results The objective of the epidemiological study was to determine the prevalence of metabolic
syndrome and related risk factors in a representative sample of 25 years and older adults
from an urban population of Karachi. This study also helped to define some baseline values
for insulin levels in the normal population and try to assess insulin resistance which is a new
entity in Pakistan. This also helped to lay the foundation for the second study by showing
the poor dietary habits of our population and the need to have a intervention program in
our population; and thus leading to a intervention trial of primary prevention of Type 2
diabetes.
4.8.1 Prevalence of Abnormal Glucose Tolerance The overall prevalence of abnormal glucose tolerance was 15% in our lyari epidemiological
study, with the prevalence of diabetes to be 9.4%. The national survey conducted by the
Diabetic Association of Pakistan (DAP) in collaboration with the World Health Organization
(WHO) during the 1990s reported 11% prevalence of type 2 diabetes, with an overall
abnormal glucose tolerance of 22% (26–29). Conducted in both urban and rural areas of all
the four provinces of Pakistan, the national survey used WHO guidelines for the diagnosis of
T2DM and impaired glucose tolerance (IGT) in over 5,600 persons 25 years and older while
we used only the fasting criteria. By doing OGTT we might have yielded a higher prevalence
of abnormal glucose tolerance since more cases of IGT compared to 5.6% of IFG cases might
have been reported. Nearly 72% of the newly diagnosed subjects did not know they had
diabetes before the survey, a finding reported also in the national survey (12,26). The
mean age was highest in the subjects with diabetes followed by IFG and than normal
population, also seen in the national survey (26-29).
4.8.2 Prevalence of Metabolic syndrome – Different Definitions The prevalence of metabolic syndrome ranged from 8.2– 49% according to the definition
used in this survey. The prevalence of Metabolic Syndrome according to WHO and EGIR
criteria was low as compared to the other definitions probably due to both definitions using
a two stage screening process. Thus fewer subjects were classified as having the metabolic
syndrome. The percentage of subjects classified as having Metabolic Syndrome by ACE and
IDF modified criteria for Asians was high, similar to as reported in other studies (57,67,68).
When stratified by gender the prevalence was 2-3 folds higher in females by most of the
definitions, such as WHO definition (6.9% for males; 13.9% for females), by EGIR definition
(3.1% for males; 10.7% for females) and by IDF definition (31.8% for males; 36.1% for
females), while by modified ATP III it was more in males (55.6% for males; 45.9% for
females).
Each component of the risk cluster defining metabolic syndrome has variability because of
its regulation through genetic and acquired factors. The differences in the prevalence of the
various component of the metabolic syndrome were because of the difference in the cut-off
values used by the different definitions. The EGIR and ACE definitions did not include
diabetes while ATP III, WHO and modified IDF definitions included diabetes and IGT as one
of the components of MS. The EGIR in addition suggested fasting hyperinsulinemia (upper
25th percentile) as the necessary component of metabolic syndrome.
4.8.3 Prevalence of Metabolic syndrome according to modified ATP and IDF Definition The prevalence rate was relatively higher following modified ATP III criteria in our study
population. Other studies in the region have also showed high prevalence rates ranging
from 35.2% to 41% (68,116). Our study showed an alarming prevalence of 49% of the
metabolic syndrome in an urban Pakistani population according to modified ATP III criteria,
whereas hospital-based studies have shown a prevalence of 44% using the original ATP III
criteria (73,74,116). One reason for the observed higher rate of metabolic syndrome in this
study might be the use of modified cut-off criteria for BMI in Asians (115). Our study is
probably the first community-based study in an urban population on metabolic syndrome
with modified ATP III definitions of metabolic syndrome. Our study also showed a
prevalence of 34.8% of the metabolic syndrome according to the IDF definition compared to
26% in the Chennai Urban Rural Epidemiology Study done in India (67). A study conducted in
older subjects in Pakistan (aged 40 years and above) showed a prevalence rate of 45.9% in
males and 57.2% in females (117).
Differences by gender in subjects with metabolic syndrome are also evident from different
ethnic-based studies (48,67,118). The high prevalence of low HDL-C and obesity, as seen in
our women, has also been reported among Indian women and other South Asian women
(67,119,120). This may indicate similar lifestyle factors, such as food habits and less physical
activity, which may have influenced the outcome in women of Indian subcontinent.
The prevalence of metabolic syndrome increased with advancing age in both genders using
ATP III and IDF definitions, a trend seen in other studies done in South Asian and U.S.
populations (56,57,65,68). The study also shows that there is greater prevalence of
hypertension, obesity and low HDL in subjects with metabolic syndrome. Thus leading to the

conclusion that the contributing causes of this syndrome are similar everywhere. There
appears to be a very high prevalence of low HDL cholesterol in men and women in our
metabolic syndrome group (> 85%). A similarly high prevalence of low HDL cholesterol in
women was also seen in Indian studies (63).
The present study results are not comparable with any previous Pakistani study as metabolic
syndrome is a new entity and the modified IDF definition has only recently been introduced.
Thus we observed a high rate of metabolic syndrome in the urban population of Lyari Town
in the city of Karachi.
4.8.4 Dietary Trends in South Asians leading to Metabolic Syndrome The interaction between different components of diet as well as the consumption of
different food items contributes to the risk for metabolic syndrome and not one single
dietary component which is responsible for the association of diet with metabolic
syndrome. Thus overall dietary trends need to be observed in individuals as they consume a
mixture of different food items in a single meal, rather than isolated groups.
In the dietary section of our study low MS risk group (cluster 1) had lowest consumption of
all the food groups while the high MS risk group (cluster 2) had the highest consumption in
most of the food groups. This high food consumption seems to contribute to the high
prevalence of MS as seen in cluster 2. Looking at the food groups individually it appears that
the food items which were the most energy-dense had the highest consumption in cluster 2,
and probably influencing in creating an unhealthy dietary pattern which leads to increased
prevalence of MS.
It has been observed in other studies that the consumption of traditional food (low in
saturated fat, low in simple sugars and high in fibre) has declined recently and energy-dense
food (high in calories, carbohydrates and saturated fats and low in fibre) and non-traditional
energy-dense fast food are being increasingly consumed in South Asia (59,75).
Studies have also shown that South Asians have a high consumption of dairy products and
sugar compared to other populations (75,124). Although dairy consumption has been
inversely related to MS in some studies (125-127) more than twice dairy consumption was
seen in the high risk group. Looking further at the individual food items in the milk group it
was observed that the highest consumption was in cream\custard and ice cream\sweet
lassi; items which have a high fat and sugar content. Coincidently a high intake of fat, milk
products and sugars in various regions of India have shown to be associated with increased
cardiovascular mortality (128). Thus a combination of dairy products, with high fat and
sugars may influence the individual properties of food and produce a positive association

with metabolic syndrome. In our study these factors probably made dairy consumption lose
its protective effect in our subjects as documented elsewhere (127).
Red meat, organ meat and prawns from the meat group were consumed 3 to 5 times more
in cluster 2 compared to cluster 1. All of these food items are known to be high in saturated
fat, which has been adversely associated with cholesterol, blood pressure, obesity and
diabetes risk (129-131).
Similarly all the food items in fat & sweet group were consumed five times more in cluster 2
compared to cluster 1. Sweet products were consumed an alarming 13 times more in cluster
2 and they probably influenced the increased prevalence of MS in cluster 2 with their load of
empty calories in the diet.
South Asians consume more carbohydrates compared to Europeans and this may lead to
hyperinsulinemia, postprandial hyperglycaemia, hypertriglyceridemia and low HDL
cholesterol levels, all of which is probably due to insulin resistance (87). Processed cereals,
such as refined grains have been shown to be associated with an increased risk of the
components of the metabolic syndrome in The Malmö Diet and Cancer Study (132). In our
study refined grains were also consumed nearly twice in the high MS risk group (cluster 2).
Although nearly double consumption of raw vegetables was seen in cluster 2 compared to
cluster 1 and while double consumption of the fruit group was also seen in cluster 2, looking
at the individual food items in the fruit group it seems that the consumption of fruit juices
was 8 times more in cluster 2 compared to cluster 1 which would lead to extra empty
calories. Despite the fact that an inverse association between prevalent MS and intakes of
fruit and vegetables has been reported previously, the extra empty calories leads to
increased prevalence of MS undermining the protective effect of vegetables and fruits on
cluster 2 (130,133-134).
4.8.5 Defining Insulin Resistance Insulin Resistance (IR) is an acronym for a wide range of metabolic derangements with
convincing evidence that it is an independent risk factor for a number of chronic diseases
such as diabetes and cardiovascular diseases (CVD). Insulin resistance has also been
suggested as the primary cause leading to the clustering of risk factors such as glucose
intolerance, hypertension, elevated serum triglycerides, low serum HDL cholesterol and
central obesity which together have been labeled as the Metabolic syndrome (MS) (37).
Thus diagnosis of insulin resistance at the initial stages of a disease could be used as a
effective measure to prevent unfavourable outcome.
Researchers have suggested that a fasting insulin level at 75th percentile cutoff is accurate at
predicting insulin resistance in normal non diabetic population in some studies (135,136).
Fasting insulin levels at 75th percentile was also used as a cut off value in this study and this
value lies within the range observed in other studies (135,142,143).
Insulin resistance indices have been developed based on fasting blood samples (serum
insulin and glucose levels) which can be used as reference cutoffs defined for various
populations (135). The homeostasis model for insulin resistance (HOMA-IR), the quantitative
insulin sensitivity check index (QUICKI) and McAuley Index are commonly used surrogate
measures from these fasting values and have proven to be a reliable alternative to the
glucose clamp studies (136-138). Many studies using these simple indirect methods for
detecting insulin resistance have been reported (139-141).
4.8.5.1 Insulin resistance indices In 1985 Matthews was one of the pioneers to define homeostasis model for insulin
resistance (HOMA-IR) as a simple and reliable method for estimating insulin sensitivity from
fasting plasma glucose and insulin levels (138). The non-linearity of the model precludes an
exact algebraic solution, but estimations are possible by using mathematical
approximations:
HOMA-B = Insulin (mU/ml) × 20/ glucose (mmol/l) - 3.5
HOMA-R = Insulin (mU/ml) × glucose (mmol/l)/22.5
Low HOMA values indicate high insulin sensitivity, whereas high HOMA values indicate low
insulin sensitivity.
HOMA-IR values between 1.21 and 1.45 were reported for normal subjects by Matthews
(138). Many large population-based studies have used HOMA-IR to assess insulin sensitivity
and reported HOMA-IR to be around 2.6 on the basis of the 75th percentile (137, 140-142).
However lower HOMA-IR values have been observed in south asians with an Indian study
reporting HOMA-IR to be 1.93 at the 75th
Taking 75th percentile of HOMA-IR as a cut-off for insulin resistance we compared insulin
resistance group (HOMA-IR > 1.82) with non insulin resistance group (HOMA-IR < 1.82) and
observed that age, hypertension (systolic and diastolic blood pressure), being overweight (as
assessed by waist circumference or Body Mass Index), triglycerides and urinary micro-
albuminuria were increased in insulin resistant group compared to normal group while HDL
was decreased in the insulin resistant group. A large number of other epidemiological and
clinical studies have firmly established consistent correlations between anthropometric,
metabolic and homodynamic variables of insulin resistance. These variables include obesity,
unfavourable body fat distribution, glucose intolerance or type2 diabetes, hyperinsulinemia,
percentile while in our study it was observed to be
even lower at 1.82 (144).

low levels of HDL hypertriglyceridemia, high levels of LDL and hypertension; some of which
were also seen in our study.
Other researchers suggested QUICKI to be a better surrogate measure of insulin resistance
than HOMA-IR (139). The 25th percentile value of QUICKI was 0.347 in our study which lies
within the range reported for normal populations (0.33-0.372) by other researchers (142).
It has been suggested by some researchers that incorporating triglycerides in asian subjects
increases the likelihood of identifying insulin resistance (144). The index proposed by
McAuley for the diagnosis of insulin resistance does this by incorporating triglycerides in its
formula (135). We calculated McAuley index on the basis of the 25th percentile and in our
study the cutoff of McAuley index was 6.77.
Although determining insulin resistance by indirect methods is difficult due to the variability
of results, but the cut off values of IR determined can be used as a measure of insulin
resistance in Pakistani adults. It is hoped that a common approach towards managing
subjects with metabolic risk factors by using a single cutoff value will help save time and
improve clinical assessment by identifying such cases of insulin resistance earlier. Secondly
the clinical focus may shift from identifying the various risk factors separately towards
identifying insulin resistance by using reference values measured from these simple indirect
methods.
4.8.6 Primary Prevention Study Our results suggest that lifestyle intervention is highly effective in preventing high risk
individuals (IGT) from conversion to diabetes in this population. Adding oral hypoglycaemic
agent (metformin) in addition to lifestyle modification was not found to be advantageous
for prevention. These results are in line with previous studies done in other populations
(145-149).
The progression rate of IGT to diabetes in our control group was lower compared to Indian
and Chinese controls (8.2% per 12 months compared to 18.3% and 11.3% per 12 months
respectively) (145,146). But it was still significantly higher than seen in the Finnish (6% per
year) and DPP (11 per 100 person-years) studies (147-149). All subjects in the control group
also received general health advice about diet, nutrition and exercise at baseline and at
subsequent follow-up visits. This might have increased their diabetes risk awareness and
some subjects may have benefited from this advice. A absolute reduction of 10.7/100 was
seen in the intensive lifestyle group, which was greater than seen in IDPP (15.7/100) (145).
More number of subjects were needed to treat in order to prevent one case of diabetes in
the intensive group in our study (9 vs 6.4) compared to IDPP (145).
The baseline characteristics appear to be similar in our subjects compared to other Asian
studies (Mean age Indian 45.9±5.7 years, Chinese 45±9.1 years vs. our mean age 43.6±9.9
years) but had comparatively higher BMI (kg/m2) (Indian 25.8±3.5 kg/m2, Chinese 25.8±3.8
kg/m2 and ours 27.1±5.0 kg/m2) (145,146). Our subjects were younger and leaner
compared to the Finnish (age 55±7.0 years, BMI 31±4.6 kg/m2) and the American subjects
(age 50.6±10.7 years, BMI 34±6.7 kg/m2) (6;8). The follow-up period in our study was half in
duration (only 18 months) compared to the Indian, American and Finnish studies (145-149).
In our study the progression of IGT to diabetes was comparable to other Asian studies and
showed the effectiveness of lifestyle modification involving moderate physical activity and
diet modification to prevent diabetes in this population. Adding metformin had a slight
additional benefit but its impact was quite small with relative risk reduction decreasing by
5.5%, from 71% to 76.5% in the lifestyle modification+drug group. This difference was not
found to be statistically significant.
Our findings showed that in order to reduce the burden of diabetes epidemic, effective
primary prevention can be achieved through lifestyle modification. Therefore, it is suggested
that necessary policy development on the prevention of diabetes should emphasize on
lifestyle modification. The main motivation for the prevention of type 2 diabetes is that it
can prevent or delay the onset of diabetes and its complications, thereby reducing the life
entrenched financial burden and unnecessary human sufferings of diabetes on both the
individual and on the society at large. Developing countries have to face this additional
burden on their already ailing economy (150,151); therefore, primary prevention
programmes need to become a integral part of Primary Health Services and strategies for
reducing the diabetes burden at all levels.
5 Implications of the results
The prevalence of the metabolic syndrome was found to be between 12% - 49% using the
various definitions of metabolic syndrome. We focused on the modified ATP III and IDF
definitions as they provide an accessible diagnostic tool which is suitable for use and
establish a list of potential additional criteria that could be included in epidemiological
studies and other research into the metabolic syndrome.
The prevalence of metabolic syndrome increases with advancing age for both males and
females The study showed greater prevalence of hypertension, obesity and low HDL in
subjects with metabolic syndrome.
More than half of our study population does not do any sort of physical exercise and lead a
sedentary lifestyle. Similar contributing factors of this syndrome have been observed
elsewhere with obesity and sedentary lifestyle in the forerun. Bearing this in mind we
designed a diabetes prevention program to be implemented in our local population.
In several randomized trials, drug therapy has proven effective in the prevention of type 2
diabetes. However, drug intervention has been shown to be less effective than therapeutic
lifestyle interventions. Our study shows the efficacy of lifestyle modifications as a means of
primary prevention in a population having distinctive environmental conditions and genetic
propensity as was seen in the Indian Diabetes Prevention Programme for the Indian
population.
Our studies have helped to compile population based data, monitor disease trends, and
create an environment that will be conducive to promoting healthy lifestyles through multi-
sectorial, inter-disciplinary collaborations.
Recent Updates from the China DaQing Prevention Study, the Finnish Diabetes Prevention
Study, the American Diabetes Prevention Programme Outcome Study and the Look Ahead
Study have all shown that the most efficient way to manage diabetes and its complications
is to prevent diabetes in the first place. This in turn has lead to policy documents from
expert organizations such as The Disease Control Priorities project (DCP-2), the European
Society of Cardiology and European Association for the Study of Diabetes, the Canadian
Diabetes Association, the American Diabetes Association, and the International Diabetes

Federation, all recommending lifestyle changes such as weight loss and increased physical
activity for the prevention of T2DM among those with pre-diabetes (82,145,152-156).
Policy changes and community mobilization schemes need to be initiated. Lifestyle
modification programmes with particular emphasis on increasing physical activity (30
minutes of brisk walking), adhering to a balanced diet (high in fibre and low in fat), and
losing 5% body weight which has shown to reduce the risk of progression from impaired
glucose tolerance to diabetes need to be initiated.

6 Conclusion
Based on the findings of the epidemiological survey we implemented the primary
prevention trial since the metabolic syndrome should be considered as a prime target for
preventive medicine; and as the emerging global epidemic of metabolic and vascular disease
has significant implications for the development of population based health policies.
Despite the challenges involved in day-to-day life, the non-pharmacological lifestyle
modification approach to prevention of the metabolic syndrome is shown to be effective in
our study. A large number of lifestyle-related risk factors are associated with the metabolic
syndrome and diabetes as seen in the lyari survey. Therefore we need to increase people’s
awareness about these risk factors by seminars and public events and to highlight the
significant of a healthy lifestyle.
IDF and WHO have made recommendations for the development of nationwide surveillance
and prevention programmes against non-communicable diseases, including diabetes. The
results from our study can be used as a pilot project for launching such programs within the
communities making them relevant to our cultural needs, and help the government and
advocacy groups within the country to translate this evidence into culturally accepted
clinical practice to initiate a national diabetes prevention and control program.
In order to reduce the diabetes burden and stop treating the majority of the cases when
they reached the steeper extreme of the road a nationwide community based diabetes
primary prevention program needs to be started. This is important, particularly at a time
when the global epidemic of metabolic and vascular disease is emerging as a significant
public health challenge, with its consequences for diabetes and CVD.
7 References
1. URL: http://country.eiu.com/Pakistan
2. URL: http://www.statpak.gov.pk/fbs/content/pakistan-demographic-survey-2007
3. Url: http://en.wikipedia.org/wiki/Demographics_of_Karachi
4. http://www.who.int/healthinfo/global_burden_disease/en
5. Padmavati, S., Prevention of heart disease in India in the 21st century: need for a concerted effort. Indian Heart J, 2002. 54(1): p. 99-102.
6. Reddy, K.S., Cardiovascular diseases in India. World Health Stat Q, 1993. 46(2): p. 101-7.
7. Gupta, R., et al., Prevalence of coronary heart disease and coronary risk factors in an urban population of Rajasthan. Indian Heart J, 1995. 47(4): p. 331-8.
8. Kutty, V.R., et al., Prevalence of coronary heart disease in the rural population of Thiruvananthapuram district, Kerala, India. Int J Cardiol, 1993. 39(1): p. 59-70.
9. Gupta, R., Gupta V.P., and Ahluwalia N.S., Educational status, coronary heart disease, and coronary risk factor prevalence in a rural population of India. BMJ, 1994. 309(6965): p. 1332-6.
10.Singh, R.B. and Niaz M.A., Coronary risk factors in Indians. Lancet, 1995. 346(8977): p. 778-9.
11.Reddy, KS. and Yusuf, S. Emerging Epidemic of Cardiovascular Disease in Developing Countries Circulation, Feb 1998; 97: 596 - 601.
12.Diabetes Atlas, 4th
13.King, H., Aubert, R. & Herman, W. Global burden of diabetes, 1995-2025. Prevalence, numerical estimates and projections. Diabetes Care 21, 1414–1431 (1998).
edition, International Diabetes Federation, 2009.
14.Zimmet, P. Globalization, coca-colonization and the chronic disease epidemic: can the doomsday scenario be averted? J. Intern. Med. 247, 301–310 (2000).
15.American Diabetes Association. Economic consequences of diabetes mellitus in the U.S. in 1997. Diabetes Care 21, 296–309 (1998).
16.URL: http://www.cdc.gov/nchs/fastats/deaths.htm
17.Yach D et al, The Global Burden of Chronic Disease, JAMA. 2004; 291: 2616-2622.

18.Murray CLJ, Lopez AD. Global burden of disease, Harvard MA: Harvard School of Public Health 1996.
19.Coutinho M, Gerstein HC, Wang Y, et al. The relationship between glucose and incident cardiovascular events. Diabetes Care 1999;22:233–40.
20.Diabetes Prevention Program Research Group. The prevalence of retinopathy in impaired glucose tolerance and recent-onset diabetes in the Diabetes Prevention Program. Diabet Med 2007;24:137–44.
21.Sumner CJ, Sheth S, Griffin JW, et al. The spectrum of neuropathy in diabetes and impaired glucose tolerance. Neurology 2003;60:108–11.
22.Plantinga LC, Crews DC, Coresh J, et al. Prevalence of chronic kidney disease in US adults with undiagnosed diabetes or prediabetes. Clin J Am Soc Nephrol 2010;5:673–82.
23.Roglic G, King H, Diabetes in Asia, HKMJ 2000; 6: 10-11.
24.Shaw J.E., Sicree R.A., Zimmet P.Z. Global estimates of the prevalence of diabetes for 2010 and 2030 (2010) Diabetes Research and Clinical Practice, 87 (1), pp. 4-14
25.Wilde S et al, Global Prevention of Diabetes Estimates for the year 2000 and projections for 2030, Diabetic Care 2004; 27:1047-1054.
26.Shera AS, Rafique G, Khuwaja IA, Ara J, Baqai S, King H. Pakistan National Diabetes Survey: prevalence of glucose intolerance and associated factors in Shikarpur, Sindh province. Diabet Med 1995;12(12):1116-21.
27.Shera AS, Rafique G, Khwaja IA, Baqai S, Khan IA, King H, et al. Pakistan National Health Survey: prevalence of glucose intolerance and associated factors in North West Frontier Province (NWFP) ofPakistan. J Pak Med Assoc 1999; 49(9):206-11.
28.Shera AS, Rafique G, Khawaja IA, Baqai S, King H. Pakistan National Diabetes Survey: prevalence of glucose intolerance and associated factors in Balochistan province. Diabetes Res Clin Pract 1999;44(1):49-58.
29.Shera AS, Basit A, Fawwad A, Hakeem R, Ahmedani M Y, Hydrie M Z I, Khwaja I A. Pakistan National Diabetes Survey: prevalence of glucose intolerance and associated factors in the Punjab Province of Pakistan. Primary care diabetes 2010;4(2):79-83.
30.Alberti KG, Zimmet P, Shaw J; IDF Epidemiology Task Force Consensus Group. The metabolic syndrome- a new worldwide definition. Lancet 2005;366:1059-62.
31.Alberti KG, Zimmet P, Shaw J. Metabolic syndrome-a new world-wide definition. A Consensus Statement from the International Diabetes Federation. Diabet Med 2006 May;23(5):469-80.
32.International Diabetes Federation. The IDF consensus worldwide definition of the metabolic syndrome. Available at http://www.idf.org/webdata/docs/IDF_Metasyndrome_definition.pdf
33.Sattar N, Gaw A, Scherbakova O. Metabolic syndrome with and without creactive protein as a predictor of coronary heart disease and diabetes in the West of Scotland Coronary Prevention Study. Circulation 2003;108:414-9
34.Golden SH, Folsom AR, Coresh J et al. Risk factor grouping related to insulin resistance and their synergistic effects on subclinical atherosclerosis: the atherosclerosis risk in communities study. Diabetes 2002;51:3069-76.
35.Hu G, Qiao Q, Tuomilehto J et al for the DECODE Study Group. Prevalence of the metabolic syndrome and its relation to all-cause and cardiovascular mortality in nondiabetic European men and women. Arch Intern Med 2004;164:1066-76
36.Laakso M. Cardiovascular disease in type 2 diabetes from population to man to mechanisms. Diabetes Care 2010;33:442–9.
37.Reaven G. Banting lecture. Role of insulin resistance in human disease. Diabetes 1988;37:1595—607.
38.World Health Organization. Denition, diagnosis and classication of diabetes mellitus and its complications. Report of a WHO consultation; 1999.
39.Balkau B, Charles M. Comment on the provisional report from the WHO consultation. European Group for the Study of Insulin Resistance (EGIR). Diabet Med 1999;16:442—3.
40.Executive summary of the third report of the National Cholesterol Education Program (NCEP) Expert Panel on Detection, Evaluation, And Treatment of High Blood Cholesterol in Adults (Adult Treatment Panel III). JAMA 2001;285:2486—97.
41.Einhorn D, Reaven G, Cobin R, Ford E, Ganda O, Handelsman Y, et al. American College of Endocrinology position statement on the insulin resistance syndrome. Endocr Pract 2003;9:237—52.
42.Grundy S, Cleeman J, Daniels S, Donato K, Eckel R, Franklin B, et al. Diagnosis and management of the metabolic syndrome: an American Heart Association/National Heart, Lung, and Blood Institute scientific statement. Circulation 2005;112:2735—52.
43.Eckel R, Grundy S, Zimmet P. The metabolic syndrome. Lancet 2005;365:1415—28.
44.Zimmet, P. Alberti, K. G. M. M. Shaw, J. Global and societal implications of the diabetes epidemic. Nature. 2001 Dec 13;414(6865):782-7.
45.Resnick HE, Strong Heart Study Investigators. Metabolic syndrome in American Indians. Diabetes Care 2002;25:1246–1247.

46.Ilanne-Parikka P, Eriksson JG, Lindstrom J, Hamalainen H, Keinanen-Kiukaanniemi S, Laako M, Louheranta A, Mannelin M, Rastas M, Salminen V, Aunola S, Sundvall J, Valle T, Lahtela J, Uusitupa M, Tuomilehto J, on behalf of the Finnish Diabetes Prevention Study Group. Prevalence of the metabolic syndrome and its components: findings from a Finnish general population sample and the Diabetes Prevention Study cohort. Diabetes Care 2004;27:2135–2140.
47.Ford E, Giles W, Dietz W. Prevalence of the metabolic syndrome among US adults. JAMA 2002;287:356–359.
48.Ford ES, Giles W, Mokdad A. Increasing prevalence of the metabolic syndrome among US adults. Diabetes Care 2004;27:2444–2449.
49.Aguilar Salinas CA, Rojas R, Go´mez- -Torres JM, Franco A, Olaiz G, Rull JA, Sepulveda J. Analysis of the agreement between the World Health Organization criteria and the National Cholesterol Education Program-III definition of the metabolic syndrome: results from a population-based survey. Diabetes Care 2003;26:1635.
50.Alexander C, Landsman P, Teutsch S, Haffner S. Third National Health and Nutrition Examination Survey (NHANES III); National Cholesterol Education Program (NCEP), NCEP defined metabolic syndrome, diabetes, and prevalence of coronary heart disease among NHANES III participants age 50 years and older. Diabetes 2003;52:1210—4.
51.Isomaa B, Almgren P, Tuomi T, Forsen B, Lahti K, Nissen M, et al. Cardiovascular morbidity and mortality associated with the metabolic syndrome. Diabetes Care 2001;24:683—9.
52.de Simone G. State of the heart in the metabolic syndrome. Nutr Metab Cardiovasc Dis 2005;15:239—41.
53.McKeigue PM, Shah B, Marmot MG. Relation of central obesity and insulin resistance with high diabetes prevalence and cardiovascular risk in South Asians. Lancet 1991; 337: 382–386.
54.Misra A,Wasir JS, Pandey RM. An evaluation of candidate definitions of the metabolic syndrome in adult Asian. Indians. Diabetes Care 2005;28:398–403.
55.Patel A, Huang KC, Janus ED, Gill T, Neal B, Suriyawongpaisal P, Wong E, Woodward M, Stolk RP. Is a single definition of the metabolic syndrome appropriate?A comparative study of the USA and Asia. Atherosclerosis 2006;184:225–232.
56.Kim HM, Kim DJ, Jung IH, Park C, Park J. Prevalence of the metabolic syndrome among Korean adults using the new International Diabetes Federation definition and the new abdominal obesity criteria for the Korean people. CMAJ 2006;175:1071–1077.
57.Misra A, Misra R, Wijesuriya M. The metabolic syndrome in South Asians. In: Type 2 Diabetes in South Asians. Epidemiology, Risk Factors and Prevention. (Mohan V, Rao Gundu, HR, eds). Jaypee Bros; 2007: 76–96.
58.Misra A, Misra R, Wijesuriya M, Banerjee D. The metabolic syndrome in South Asians: continuing escalation & possible solutions. Indian J Med Res 2007;125:345–354
59.Misra A, Khurana L. Obesity and the metabolic syndrome in developing countries. J Clin Endocrinol Metab 2008;93:S9–S30.
60.Ferrannini E, Balkau B, Coppack SW, RISC Investigators, et al. Insulin resistance, insulin response, and obesity as indicators of metabolic risk. J Clin Endocrinol Metab 2007;92:2885–92.
61.Wasir JS, Misra A. The metabolic syndrome in Asian Indians: the impact of nutritional and socio-economic transition in India. Met Syndr Relat Disord 2004;2:14–23.
62.DeFronzo RA, Ferrannini E 1991 Insulin resistance. A multifaceted syndrome responsible for NIDDM, obesity, hypertension, dyslipidemia, and atherosclerotic cardiovascular disease. Diabetes Care 14:173-194.
63.Misra A, Luthra K, Vikram NK. Dyslipidemia in Asian Indians: Determinants and significance. J Assoc Physicians India 2004; 52:137–142.
64.Kulkarni KR, Markovitz JH, Nanda NC, Segrest JP. Increased prevalence of smaller and denser LDL particles in Asian Indians. Arterioscler Thromb Vasc Biol 1999;19:2749–2755.
65.Gupta A, Gupta R, Sarna M, Rastogi S, Gupta VP, Kothari K. Prevalence of diabetes, impaired fasting glucose and insulin resistance syndrome in an urban Indian population. Diabetes Res Clin Pract 2003;61:69–76.
66.Ramachandran A, Snehalatha C, Kapur A, Vijay V, Mohan V, Das AK, Rao PV, Yajnik CS, Prasanna Kumar KM, Nair JD. High prevalence of diabetes and impaired glucose tolerance in India: National Urban Diabetes Survey. Diabetologia 2001;44:1094–1101.
67.Mohan V, Shanthirani S, Deepa R, Premalatha A G, Sastry NG, Saroja R. Intra-urban differences in the prevalence of the metabolic syndrome in southern India—the Chennai Urban Population Study (CUPS No. 4). Diabet Med 2001;18:280–287.
68.Ramachandran A, Snehalatha C, Satyavani K, Sivasankari S, Vijay V. Metabolic syndrome in urban Asian Indian adults—a population study using modified ATP III criteria. Diabetes Res Clin Pract 2003;60:199–204.
69.Yousuf S, R.K., Stephan O, et al., Global burden of cardiovascular diseases. Part I: general considerations, the epidemiologic transition, risk factors, and impact of urbanization. Circulation, 2001. 104: p. 2746-2753.

70.Stephen JC and Sattar N. Impact of ethnicity on metabolic disturbance, vascular dysfunction and atherothrombotic cardiovascular disease. Diabetes, Obesity and Metabolism, 7, 2005, 463–470.
71.Zahid N, Claussen B, Hussain A. High prevalence of obesity, dyslipidemia and metabolic syndrome in a rural area in Pakistan. Diabetes Metabol Syndr: Clin Res Rev 2008;2:13–19.
72. Hydrie M Z I, Shera AS, Fawwad A, Basit A, Hussain A. Prevalence of Metabolic Syndrome in Urban Pakistan: (Karachi): Comparison of newly proposed IDF and modified ATP III Criterions. Met Syndr Relat Disord, 2009, 7(2): 119-124.
73. Wierzbicki AS, Nishtar S, Lumb PJ, Lambert-Hammill M, Turner CN, Crook MA, Marber MS, Gill J. Metabolic syndrome and risk of coronary heart disease in a Pakistani cohort. Heart 2005;91:1003–1007.
74. Sohail SMA, Faisal Z, Umar J. Metabolic syndrome in type-2 diabetes mellitus. Pakistan J Med Sci 2006;22:295–299.
75. Misra A, Khurana L, Isharwal S, Bhardwaj S. South Asian diets and insulin resistance. Br J Nutr 2009;10:465–473.
76. Misra A, Pandey RM, Devi JR, Sharma R, Vikram NK, Khanna N. High prevalence of diabetes, obesity and dyslipidaemia in urban slum population in northern India. Int J Obes Relat Metab Disord 2001;25:1722–1729.
77. Misra A, Pandey RM, Sharma R. Non-communicable diseases (diabetes, obesity and hyperlipidaemia) in urban slums. Natl Med J India 2002;15:242–244.
78. Misra A, Sharma R, Pandey RM, Khanna N. Adverse profile of dietary nutrients, anthropometry and lipids in urban slum dwellers of northern India. Eur J Clin Nutr 2001;55:727–734.
79. Mohan V, Shanthirani S, Deepa R, Premalatha A G, Sastry NG, Saroja R. Intra-urban differences in the prevalence of the metabolic syndrome in southern India—the Chennai Urban Population Study (CUPS No. 4). Diabet Med 2001;18:280–287.
80. Fischbacher CM, Hunt S, Alexander L. How physically active are South Asians in the United Kingdom? A literature review. J Public Health (Oxf) 2004;26:250–258.
81. Hayes L, White M, Unwin N, Bhopal R, Fischbacher C, Harland J, Alberti KG. Patterns of physical activity and relationship with risk markers for cardiovascular disease and diabetes in Indian, Pakistani, Bangladeshi and European adults in a UK population. J Public Health Med 2002;24:170–178.
82. Alberti KG, Zimmet P, Shaw J. International Diabetes Federation: a consensus on Type 2 diabetes prevention. Diabet Med. May 2007;24(5):451-463. DOI: 10.1111/j.1464-5491.2007.02157.x.
83. Basit A, Hydrie MZI, Hakeem R, Ahmedani MY, Masood Q. Frequency of chronic complications of type 2 diabetes. JCPSP 2004;2:79–83.
84. WHO. Obesity. Geneva: World Health Organization, 2006.
85. Chan J, Rimm E, Colditz G, Stamfler M, Willet W. Obesity, fat distribution and weight gain as risk factors for clinical diabetes. Diabetes Care 1994; 17: 961–969.
86. Hu FB, Manson JE, Stampfer MJ, Colditz G, Liu S, Solomon CG et al. Diet, lifestyle, and the risk of type 2 diabetes mellitus in women. N Engl J Med 2001; 345: 790–797.
87. Burden, M.L., Samanta A, Spalding D, Burden A C. A comparison of the glycaemic and insulinaemic effects of an Asian and a European meal. Pract Diabetes Int 1994;11: 208-211.
88. Esposito K, Marfella R, Ciotola M, Di Palo C, Giugliano F, Giugliano G, D’Armiento M, D’Andrea F, Giugliano D. Effect of a Mediterranean style diet on endothelial dysfunction and markers of vascular inflammation in the metabolic syndrome. JAMA 2004;292:1440–1446.
89. Hydrie, M.Z.I., A. Basit, A.S. Shera, R. Hakeem and A. Hussain, 2010. Dietary patterns associated with risk for metabolic syndrome in urban community of Karachi defined by cluster analysis. Pak. J. Nutr., 9: 93-99.DOI: 10.3923/pjn.2010.93.99URL: http://scialert.net/abstract/?doi=pjn.2010.93.99
90. Priebe M, van Binsbergen J, de Vos R, Vonk RJ. Whole grain foods for the prevention of type 2 diabetes mellitus. Cochrane Database of Systematic Reviews 2008, Issue 1. Art. No.: CD006061. DOI:10.1002/14651858.CD006061.pub2
91. Gannon MC, Nuttall FQ: Control of blood glucose in type 2 diabetes without weight loss by modification of diet composition. Nutr Metab(Lond) 2006, 3:16.
92. Dunstan DW, Salmon J, Owen N, Armstrong T, Zimmet PZ, Welborn TA et al. on behalf of the AusDiab Steering Committee. Physical activity and television viewing in relation to risk of ‘undiagnosed’ abnormal glucose metabolism in adults. Diabetes Care 2004; 27: 2603–2609.
93. Hu FB, Li TY, Colditz GA, Willett WC, Manson JE. Television watching and other sendentary behaviors in relation to risk of obesity and type 2 diabetes mellitus in women. J Am Med Assoc 2003; 289: 1785–1791.
94. Hu FB, Leitzmann MF, Stampfer MJ, Colditz GA, Willet WC, Rimm EB. Physical activity and television watching in relation to risk for type 2 diabetes mellitus in men. Arch Intern Med 2001; 161: 1542–1548.
95. Horne M, Speed S, Skelton D, Todd C. What do community-dwelling Caucasian and South Asian 60–70 year olds think about exercise for fall prevention? Age Ageing 2009;38:68–73.
96. Khunti K, Stone MA, Bankart J, Sinfield PK, Talbot D, Farooqi A, Davies MJ. Physical activity and sedentary behaviours of South Asian and white European children in inner city secondary schools in the UK. Fam Pract 2007;24:237–244.
97. Ghosh A. Effects of socio-economic and behavioural characteristics in explaining central obesity—a study on adult Asian Indians in Calcutta, India. Coll Anthropol 2006;30:265–271.
98. Laxmaiah A, Nagalla B, Vijayaraghavan K, Nair M. Factors affecting prevalence of overweight among 12- to 17-year-old urban adolescents in Hyderabad, India. Obesity (Silver Spring) 2007;15:1384–1390.
99. Nathan DM, Davidson MB, DeFronzo RA, et al. Impaired fasting glucose and impaired glucose tolerance. Diabetes Care 2007;30:753–9.
100. Ferrannini E, Nannipieri M, Williams K, et al. Mode of onset of type 2 diabetes from normal or impaired glucose tolerance. Diabetes 2004;53:160–5.
101. Aroda VR, Ratner R. Approach to the patient with prediabetes. J Clin Endocrinol Metab 2008;93(9):3259–65.
102. Santaguida PL, Balion C, Hunt D, et al. Diagnosis, prognosis, and treatment of impaired glucose tolerance and impaired fasting glucose. Evid Rep Technol Assess (Summ) 2005;128:1–11.
103. Grundy SM. Metabolic syndrome: connecting and reconciling cardiovascular and diabetes worlds. J Am Coll Cardiol 2006;47:1093—100.
104. Lakka H, Laaksonen D, Lakka T, Niskanen L, Kumpusalo E,.Tuomilehto J, et al. The metabolic syndrome and total and cardiovascular disease mortality in middle-aged men. JAMA 2002;288:2709—16.
105. Lorenzo C, Okoloise M, Williams K, Stern MP, Haffner SM. The metabolic syndrome as predictor of type 2 diabetes: The San Antonio heart study. Diabetes Care 2003;26:3153–3159.
106. Laaksonen DE, Lakka HM, Niskanen LK, Kaplan GA, Salonen JT, Lakka TA. Metabolic syndrome and development of diabetes mellitus: application and validation of recently suggested definitions of the metabolic syndrome in a prospective cohort study. Am J Epidemiol 2002;156:1070–1077.
107. Cameron AJ, Zimmet PZ, Soderberg S, Alberti KG, Sicree R, Tuomilehto J, Chitson P, Shaw JE. The metabolic syndrome as a predictor of incident diabetes mellitus in Mauritius. Diabet Med 2007;24:1460–1469.
108. Hanson RL, Imperatore G, Bennett PH, Knowler WC. Components of the “metabolic syndrome” and incidence of type 2 diabetes. Diabetes 2002;51:3120–3127.
109. Hanley AJ, Karter AJ, Williams K, Festa A, D’Agostino RB, Jr., Wagenknecht LE, Haffner SM. Prediction of type 2 diabetes mellitus with alternative definitions of the metabolic syndrome: The Insulin Resistance Atherosclerosis Study. Circulation 2005;112:3713–3721.
110. Lorenzo C, Williams K, Hunt KJ, Haffner SM. The National Cholesterol Education Program–Adult Treatment Panel III, International Diabetes Federation, and World Health Organization definitions of the metabolic syndrome as predictors of incident cardiovascular disease and diabetes. Diabetes Care 2007;30:8–13.
111. Resnick HE, Jones K, Ruotolo G, Jain AK, Henderson J, Lu W, Howard BV. Insulin resistance, the metabolic syndrome, and risk of incident cardiovascular disease in nondiabetic american indians: The Strong Heart Study. Diabetes Care 2003;26:861–867.
112. Sattar N, McConnachie A, Shaper AG, Blauw GJ, Buckley BM, de Craen AJ, Ford I, Forouhi NG, Freeman DJ, Jukema JW, Lennon L, Macfarlane PW, Murphy MB, Packard CJ, Stott DJ, Westendorp RG, Whincup PH, Shepherd J, Wannamethee SG. Can metabolic syndrome usefully predict cardiovascular disease and diabetes? Outcome data from two prospective studies. Lancet 2008;371:1927–1935.
113. Stern MP, Williams K, Haffner SM. Identification of persons at high risk for type 2 diabetes mellitus: do we need the oral glucose tolerance test? Ann Intern Med 2002;136:575–581.
114. Forouhi NG, Sattar N, Tillin T, McKeigue PM, Chaturvedi N. Do known risk factors explain the higher coronary heart disease mortality in South Asian compared with European men? Prospective follow-up of the Southall and Brent studies, UK. Diabetologia 2006;49:2580–2588.
115. WHO expert consultation. Appropriate body-mass index for Asian populations and its implications for policy and intervention strategies. The Lancet, 2004; 157-163.
116. Jahan F, Qureshi R, Borhany T, Hamza HB. Metabolic Syndrome: Frequency and Gender Differences at an Out - Patient Clinic. JCPSP 2007. 17 (1): 32-35.
117. Jafar TH; Qadri Z; Chaturvedi N. (Apr 2008). Coronary artery disease epidemic in Pakistan: more electrocardiographic evidence of ischaemia in women than in men. HEART. 94:408-413.
118. Ang LW, Ma S, Cutter J, Chew SK, Tanc CE, Tai ES. The metabolic syndrome in Chinese, Malays, and Asian Indians, factor analysis of data from 1998 Singapore National Health Survey. Diabet Res Clin Pract 2005;67:53–62.
119. Rajeev G, Prakash C, Deedwania A, Gupta SR, Raja BP, Kunal K. Prevalence of metabolic syndrome in an Indian urban population. Int J Cardiol 2004;97:257–261.
120. Ko GTC, Cockram CS, Chow CC, Yeung VTF, Chan WB, So WY, Chan NN, Chan JCN. High prevalence of metabolic syndrome in Hong Kong Chinese—Comparison of three diagnostic criteria. Diab Res Clin Pract 2005;69:160–168.
121. Basit A, Hydrie MZI, Ahmed K, Hakeem R. Prevalence of diabetes, impaired fasting glucose and associated risk factors in a rural area of Baluchistan province according to new ADA criteria. J Pak Med Assoc 2002;52:357–360.
122. Jafar TH, Chaturvedi N, Pappas G. Prevalence of overweight and obesity and their association with hypertension and diabetes mellitus in an Indo-Asian population. Can Med Assoc J 2006;175:1071-1077.
123. Hydrie MZI., Basit A, Hakeem R, Ahmadani MY, Masood MQ. Children’s health is insulin and lipid dependent. Pakistan J Nutri 2004;3:128–133.
124. Popkin, B.M., 2001. The nutrition transition and obesity in the developing world. J. Nutr., 131: 871-3S.
125. Azadbakht, L., P. Mirmiran, A. Esmaillzadeh and F. Azizi, 2005. Dairy consumption is inversely associated with the prevalence of the metabolic syndrome in Tehranian adults. Am. J. Clin. Nutr., 82: 523-530.
126. Mennen, L.I., L. Lafay, E.J.M. Feskens, M. Novak, P. Lepinay and B. Balkau, 2000. Possible protective effect of bread and dairy products on the risk of metabolic syndrome. Nutr. Res., 20: 335-347.
127. Pereira, M.A., D.R. Jacobs Jr., L. Van Horn, M.L. Slattery, A.I. Kartashov and D.S. Ludwig, 2002. Dairy consumption, obesity and the insulin resistance

syndrome in young adults: The CARDIA Study. JAMA., 287: 2081-2089.
128. Gupta, R., A. Misra, P. Pais, P. Rastogi and V.P. Gupta, 2006. Correlation of regional cardiovascular disease mortality in India with lifestyle and nutritional factors. Int. J. Cardiol., 108: 291-300.
129. Schaefer, E.J., 2002. Lipoproteins, nutrition and heart disease. Am. J. Clin. Nutr., 75: 191-212.
130. Appel, L.J., M.W. Brands, S.R. Daniels, N. Karanja, P.J. Elmer and F.M. Sacks, 2006. Dietary approaches to prevent and treat hypertension: A scientific statement from the American Heart Association. Hypertension, 47: 296-308.
131. Parillo, M. and G. Riccardi, 2004. Diet composition and the risk of type 2 diabetes: Epidemiological and clinical evidence. Br. J. Nutr., 92: 7-19.
132. Wirfalt, E., B. Hedblad, B. Gullberg, I. Mattisson, C. Andren, U. Rosander, L. Janzon and G. Berglund, 2001. Food patterns and components of the metabolic syndrome in men and women: A crosssectional study within the Malmo Diet and Cancer cohort. Am. J. Epidemiol., 154: 1150-1159.
133. Esmaillzadeh, A., M. Kimiagar, Y. Mehrabi, L. Azadbakht, F.B. Hu and W.C. Willett, 2006. Fruit and vegetable intakes, C-reactive protein and the metabolic syndrome. Am. J. Clin. Nutr., 84: 1489-1497.
134. Lichtenstein, A.H., L.J. Appel, M. Brands, M. Carnethon, S. Daniels, H.A. Franch, B. Franklin, P. Kris-Etherton, W.S. Harris, B. Howard, N. Karanja, M. Lefevre, L. Rudel, F. Sacks, L. Van Horn, M. Winston and J. Wylie-Rosett, 2006. Diet and lifestyle recommendations revision 2006: A scientific statement from the American Heart Association Nutrition Committee. Circulation, 114: 82-96.
135. McAuley KA, Williams SM, Mann JI, Walker RJ, Lewis-BarnedNJ, Temple LA, et.al. Diagnosing insulin resistance in the general population. Diabetes Care 2001; 24: 460-4.
136. Zofia R. Assessment of insulin sensitivity/resistance in epidemiological studies, Endocrine regulations, VOL. 37, 189–194, 2003.
137. Hanson RL, Pratley RE, Bogardus C, et al. Evaluation of simple indices of insulin sensitivity and insulin secretion for use in epidemiologic studies. Am J Epidemiol. 2000;151:190-198
138. Matthews DR, Hosker JP, Rudenski AS, Naylor BA, Treacher DF,TurnerRC. Homeostasis model assessment: insulin resistance and beta-cell function from fasting plasma glucose and insulin concentration in man. Diabetologia 1985; 28: 412-9.
139. Katz A, Nambi SS, Mather K, Baron AD, Follmann DA, SullivanG, et.al. Quantitative insulin-sensitivity check index: A simple, accurate method for assessing insulin sensitivity in humans. J Clin Endocrinol Metab 2000; 85: 2402-10.
140. Bonora E, Kiechl S, Willeit J, Oberhollenzer F, Egger G, TargherG, et.al. Prevalence of insulin resistance in metabolic disorders: the Bruneck Study. Diabetes 1998;47: 1643-9.
141. Yeni-Komshian H, Carantoni M, Abbasi F, Reaven GM. Relationship

between several surrogate estimates of insulin resistance and quantification of insulin-mediated glucose disposal in 490 healthy non-diabetic volunteers. Diabetes Care 2000; 23: 171-5.
142. Ascaso JF, Pardo S, Real JT, Lorente RI, Priego A, Carmena R. Diagnosing insulin resistance by simple quantitative methods in subjects with normal glucose metabolism. Diabetes Care 2003; 26: 3320-5.
143. Acosta AM, Escalona M et al. Determination of the insulin resistance index. Rev Med Chil. 2002 Nov; 130(11):1227-31.
144. Deepa R, Shanthirani CS, Premalatha G, Sastry NG, Mohan V.Prevalence of insulin resistance syndrome in a selected south Indian population--the Chennai Urban population study-7 [CUPS-7]. Indian J Med Res 2002;115:118-127.
145. Ramachandran A, Snehalatha C, Mary S, Mukesh B, Bhaskar AD, Vijay V. The Indian Diabetes Prevention Programme shows that lifestyle modification and metformin prevent type 2 diabetes in Asian Indian subjects with impaired glucose tolerance (IDPP-1). Diabetologia 2006 Feb;49(2):289-97.
146. Pan XR, Li GW, Hu YH, Wang JX, Yang WY, An ZX, et al. Effects of diet and exercise in preventing NIDDM in people with impaired glucose tolerance - The Da Qing IGT and diabetes study. Diabetes Care 1997 Apr;20(4):537-44.
147. Lindstrom J, Louheranta A, Mannelin M, Rastas M, Salminen V, Eriksson J, et al. The Finnish Diabetes Prevention Study (DPS): Lifestyle intervention and 3-year results on diet and physical activity. Diabetes Care 2003 Dec;26(12):3230-6.
148. Tuomilehto J, Lindstrom J, Eriksson JG, Valle TT, Hamalainen H, Ilanne-Parikka P, et al. Prevention of type 2 diabetes mellitus by changes in lifestyle among subjects with impaired glucose tolerance. N Engl J Med 2001 May 3;344(18):1343-50.
149. Knowler WC, Barrett-Connor E, Fowler SE, Hamman RF, Lachin JM, Walker EA, et al. Reduction in the incidence of type 2 diabetes with lifestyle intervention or metformin. New England Journal of Medicine 2002 Feb 7;346(6):393-403.
150. Within-trial cost-effectiveness of lifestyle intervention or metformin for the primary prevention of type 2 diabetes. Diabetes Care 2003 Sep;26(9):2518-23.
151. Lindgren P, Lindstrom J, Tuomilehto J, Uusitupa M, Peltonen M, Jonsson B, et al. Lifestyle intervention to prevent diabetes in men and women with impaired glucose tolerance is cost-effective. Int J Technol Assess Health Care 2007;23(2):177-83.
152. Orozco Leonardo J, Buchleitner Ana Maria, Gimenez-Perez Gabriel, Roqué i Figuls Marta, Richter Bernd, Mauricio Didac. Exercise or exercise and diet for preventing type 2 diabetes mellitus. DOI: 10.1002/14651858.CD003054.pub3 [3]. 2011. John Wiley & Sons, Ltd. Ref Type: Online Source
153. Narayan KM, Zhang P, Kanaya AM. Disease Control Priorities in Developing Countries. Diabetes: The Pandemic and Potential Solutions. 2nd ed. New York: Oxford Investment Press; 2006. p. 591-604.
154. Lindstrom J, Ilanne-Parikka P, Peltonen M, Aunola S, Eriksson JG, Hemio K, et al. Sustained reduction in the incidence of type 2 diabetes by lifestyle

intervention: follow-up of the Finnish Diabetes Prevention Study. Lancet 2006 Nov 11;368(9548):1673-9.
155. Ryden L, Standl E, Bartnik M, Van den Berghe G, Betteridge J, de Boer MJ, et al. Guidelines on diabetes, pre-diabetes, and cardiovascular diseases: executive summary. The Task Force on Diabetes and Cardiovascular Diseases of the European Society of Cardiology (ESC) and of the European Association for the Study of Diabetes (EASD). Eur Heart J 2007 Jan;28(1):88-136.
156. Canadian Diabetes Association 2008 Clinical Practice Summary for the Prevention and Management of Diabetes in Canada. 2011. Ref Type: Generic

8 Appendix I(Questionnaire of First Study)
Informed Consent
Diabetic Association of Pakistan and World Health Organization Collaborating Center
CONSENT FORMTitle of Research Project: Prevalence of Type 2 Diabetes and Associated Risk Factors among Adults 25 Years and Above in Urban Karachi
Explanation of Research Project:
PURPOSE OF STUDYThe doctors and health workers here are working with researchers at
• Diabetic Association of Pakistan and World Health Organization Collaborating Centre;
• Interactive Communications Research and Development Division;• Baqai Institute of Diabetology and Endocrinology• Lyari Community Development Project
to find out about diabetes and heart disease in adults. Your household has been selected randomly from a list of all households in Lyari / North Nazimabad. The researchers undertaking this survey would like to ask you to participate in this study.
PROCEDURESIf you agree we will ask you questions about
• your household and members of your household. • your lifestyle (e.g. diet, exercise) and existing conditions related to diabetes
and heart disease.
We will take measurements of your height, weight, hips, waist, abdomen and blood pressure. The doctors would like to take a blood sample from you after you have fasted overnight to test for high levels of glucose, lipids and liver enzymes. You will be informed of the glucose test results within 3 days but the results of some of the other tests will take longer.
Do you agree to provide blood to test for glucose, lipids and liver enzymes: Yes __; No ___
We would also like to store your blood sample to test for infections that might cause liver disease. The blood sample may be stored for up to 10 years. The samples will be stored in a manner that will not identify you by name. The results from these future tests may not be available to you.
Do you agree to let the blood sample be stored for up to 10 years for future research? Yes ____; No _____
The data from the study will be kept in an office in Karachi. Information about your child will be available only to people working on the study. We will keep the study information private to the extent possible by the laws of Pakistan. People responsible for making sure that the research is done properly may review your study records. This might include people from the Baqai Institute of Diabetology and Endocrinology and the Lyari Community Development Project.

RISKS AND DISCOMFORTSIf blood is taken the needle stick may cause some discomfort and bruising. BENEFITSThe test results will be given to you. Any doctors that you visit will benefit by finding out if you have diabetes or risk factors for diabetes and heart disease. This information will also help researchers and doctors in understanding the causes of diabetes and heart disease in adults in Lyari / North Nazimabad and to plan programs to prevent these diseases. If you do not have diabetes or risk factors for diabetes and heart disease, you will be able to continue your lifestyle knowing that you are at low risk. You will not receive any payment for participating in this study.
You are not forced to be in this study. You may leave the study at any time. If you decide not to be in the study, your care or relations with your doctors will not be changed in any way. You should ask the project coordinator any questions you may have about this study. You may ask him/her questions in the future if you do not understand anything. The researchers will tell you any new information that they may find out while you are in this study.
If you think being in the study has hurt you, you have not been treated fairly you can call the Principal Investigator Dr. A Samad Shera at 661-6890 (Karachi). You can also call the Project Coordinator Dr. Aamir Khan at 439-6254 (Karachi). You can also call Dr. Abdul Basit at the Baqai Institute of Diabetology and Endocrinology at 661-7234 (Karachi) and Mr. Abdur Rahim Moosvi at the Lyari Community Development Project at 752-1687 (Karachi).
If you agree to participate in this study please sing your name below.
Void One Year From Above DateNo. ___________________________Approved From ___________ to ___________
____________________________________________Signature ____________________________________Witness to Consent Procedures*____________________________________________Signature of Investigator
____________________________________________Date*Optional unless subject is illiterate, or unable to sign
Note: Signed copies of this form must be a) retained in file by the Principal Investigator, b) given to the participant and c) put in the patient’s medical record (when applicable).

Structured Interview Questionnaire (11 Pages)


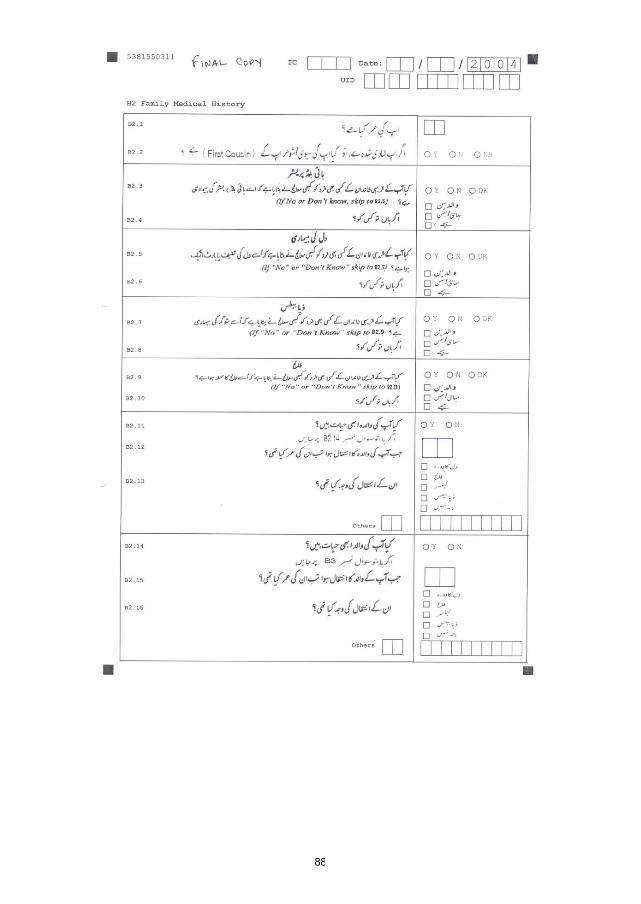
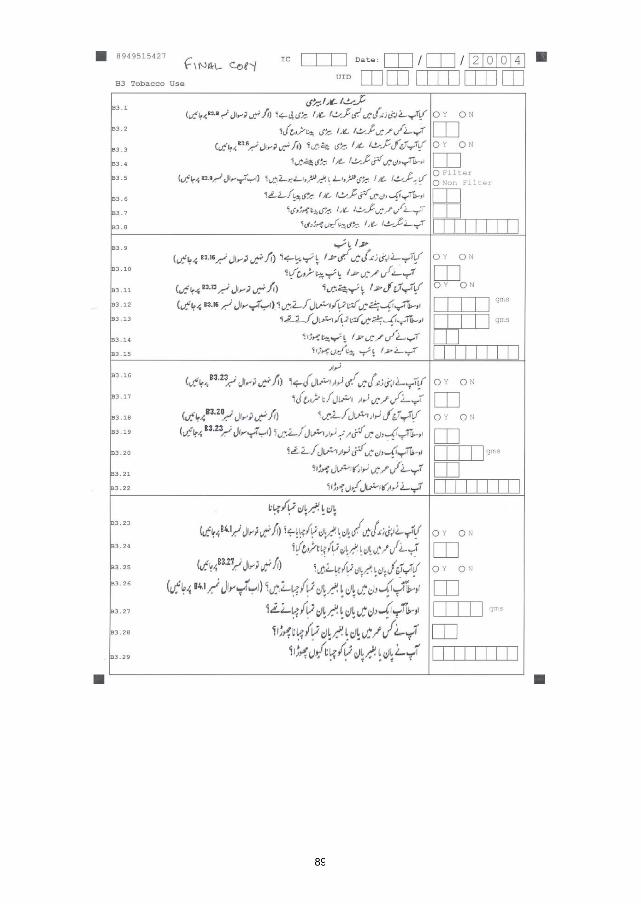


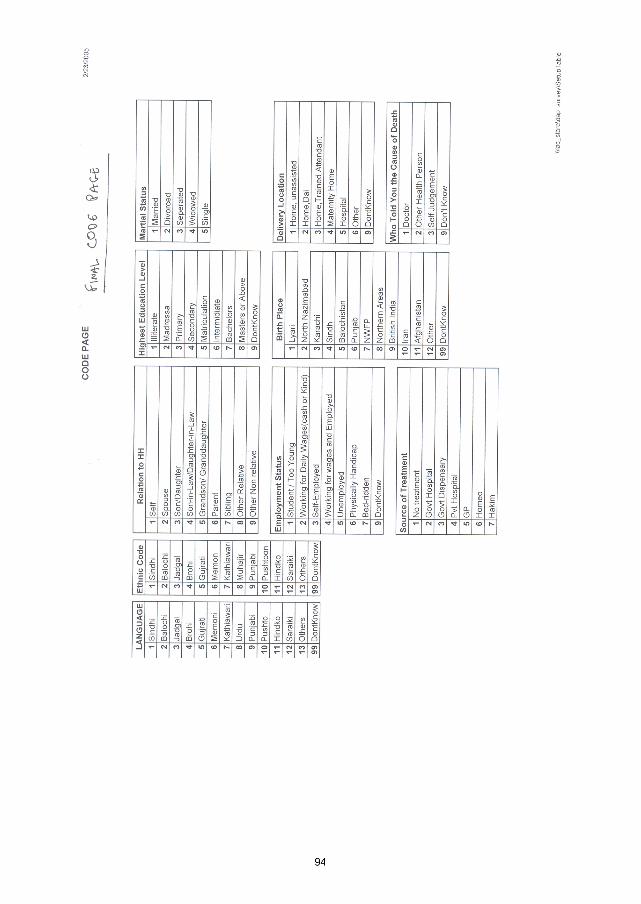

Approval of Local Ethics CommitteeREVIEW AND APPROVAL OF PREVALENCE OF DIABETES AND ASSOCIATED RISK FACTORS AMONG ADULTS 25 YEARS AND ABOVE IN URBAN KARACHI By INSTITUTIONAL REVIEW BOARDA: INFORMATION
Name and Address of Ethical Review Board:Institutional Review BoardBaqai Institute of Diabetology and Endocrinology, III- B, 3/17, Nazimabad No. 3, Karachi- 74600
Study Title:‘Prevalence of Diabetes and Associated Risk Factors among Adults 25 Years and Above in Urban Karachi’.
Name and Address of the Principal Investigator:Prof A. Samad Shera TI, SI, FRCP Honorary President IDFDirector WHO Collaborating CentreSecretary General DAP 5-E/3, Nazimabad, Karachi-74600Ph: + 92-21-6616890 Email: [email protected]
B: REVIEW
The following items have been reviewed in connection with the above study to be conducted by the above investigator:
ProtocolInformed Consent DocumentQuestionnaire / Patient Information Sheet
Conditionally approved (specify required modification here or in accompanying letter):• Final Questionnaire to be submitted in local language ‘Urdu’ before start of study.• Consent Form in Local Language ‘Urdu’.
Date of IRB Approval: June 9, 2004Dr. Shakil BaigChairman,
Institutional Review BoardINSTITUTIONAL REVIEW BOARD MEMBERS
Name Profession Address/Ph #
• Dr. Shakil Baig M.B.B.S., M.R.C.P. Consultant Rheumatologist• Dr. Abdul Basit M.B.B.S., M.R.C.P. Consultant Diabetologist & Endocrinologist Baqai Institute of • Dr. Yakoob Ahmedani M.B.B.S.,FCPS Consultant Physician Diabetology and • Dr.Mohiuddin Waseem M.B.B.S,D.A.B.I.M.Consultant Diabetologist & Endocrinologist Endocrinology• Dr M Zafar Iqbal Abbasi Administrator BIDE Ph.: 6617234-5• Mufti Fazal Karim Non-Organizational Member / Non-Medical Member

9 Appendix II (Questionnaire of Second Study)
Diabetes Prevention StudyDiabetic Association of Pakistan
Baqai Institute of Diabetology and Endocrinology University of Oslo
Questionnaire
1.1 Date: 1.2 : Registration No:
1.3 Name: S/o, W/o, D/o
1.4 Date of Birth 1.5 Age: (in years)
1.6 Sex: Male= 1, Female= 2. 1.7 Marital Status: Married=1, Single =2, Widow=3
1.8 Address:
District
1.9 Phone Number Home: Mobile:
Date of visit Type of visit Advisor Focus
d d m m y y
1. Individual2. Group3. Short contact (phone,
letter, e-mail etc.)
1. Nurse2. Physician3. Physiotherapist4. Dietitian5. Psychologist6. Other
1. Diet / weight loss 2. Exercise 3. Smoking withdrawal4. Other
1.10 Occupation:
Administrative/Professional =1, Business=2, Skilled Labour=3, Manual Labour=4
Home Duties =5,Unemployed=6, Pensioner=7, Others =8
1.11 Education :
Illiterate =1 Only Read & Write=2 Primary =3 Secondary =4, Matric/ SSC =5 , Inter/HSC=6, Graduate=7, Specialty=8 (specify)
1.11b Education in Number of Years
1.12 Socio-economic History: Are you Earner = 1 or Dependent = 2
Total family monthly income from all sources
Rs.< 5000/- =1. Rs. 5000 – 10,000/- =2, Rs. 10,000 – 20,000/- = 3, Rs. 20,000 – 30,000/- = 4, > Rs. 30,000/- = 5

No. of Earners No. of Dependents
1.13 Community:
Mohajir = 1, Punjabi = 2, Sindh = 3, Pathan = 4, Balochi = 5, Makrani=6, Memon = 7, Others (Specify) = 8
2 Personal History
Serial
Family History in first degree relative (Parents, Siblings & Children)
Disease Subjects No =1, Yes =2, 1 Diabetes 2 Hypertension 3 Ischemic Heart Disease 4 Stroke 5 Others
2.2 Any addiction: Niswar = 1, Cigarettes = 2, Biri = 3, Chews Tobacco = 4, Huqqa = 5, Alcohol = 6, Other = 7
3 History of past illness:
Please circle correct response
3.1 Has a doctor ever told you that you have; If yes are you currently, Medicine name taking any medications High blood pressure. Yes No Yes No Angina Yes No Yes No Heart Attack Yes No Yes No Stroke. Yes No Yes No Foot ulceration. Yes No Yes No Hyperlipidemia Yes No Yes No Claudation Yes No Yes No Depression Yes No Yes No Others Specify Yes No Yes No Obstetric History (Women Only) Number of Live Births Number of Still Births Number of miscarriages Number of abortions
4 Blood Glucose Result Lab Serial No
4.1 How many hours since last food or drink, except water? Hours =
4.2 Fasting Blood Glucose Levels =4.3Time of Glucose Drink = Hours, minutes.Time of 2nd Sample
4.4 Two hours Blood Glucose levels =
Initials B Physical Examination

5.1 Height (cm) 5.2 Weight (kg) 5.3. BMI (kg/m2)
5.4 Waist circumference (cm) 5.5. Hip circumference (cm) 5.6 WHRatiocm
6. Blood pressure (mmHg)6.1 First measurement (systolic/diastolic)
/6.2 Second measurement (systolic/diastolic)
/6.3 Third measurement (systolic/diastolic)
Right Left
7 Visual Acuity 8 Eye Examination (Fundoscopy)
(Code of 8.1 & 8.2: Nil=0, 1 to 5=1, 6 to 10=2, 11+ =3, Retina not visible=9) 8.1 Microdots 8.2 Blot Haemorrhages (Code of 8.3, 8.4 & 8.5 : Absent = 0, Present = 1, Retina not visible = 9) 8.3 Exudates (hard) 8.4 Exudates (soft) 8.5 Vitreous Haemorrhage (Code of 8.6: Nil=0, Peripheral=1, Disc=2, RP=3, Retina not seen=9) 8.6 New vessels (Code of 8.7 : Nil=0, mild=1, Retina not seen clearly=2 ,lens removed=3) 8.7 Cataracts 9 Limb Examination9.1 Pulses (Code of 9.1: normal =0, diminshed =1, absent =2, amputation = 9)
9.1a Femoral 0 1 2 9 0 1 2 9 9.1b Popliteal 0 1 2 9 0 1 2 9 9.1c Dorsalis pedis 0 1 2 9 0 1 2 9 9.1d Tibialis posterior 0 1 2 9 0 1 2 9 9.2 Sensation (Code of 9.2: normal=0, diminshed=1, absent=2, amputation=9) 9.2a Touch with 10gm monofilament 0 1 2 9 0 1 2 9 9.2b Vibration with 128 Hz tuning fork 0 1 2 9 0 1 2 9 9.3 Reflexes (Code of 9.3 : present =0,diminshed = 1, absent=2,amputation = 9) 9.3a Knee 0 1 2 9 0 1 2 9 9.3b Ankle 0 1 2 9 0 1 2 9
cm , kg ,
,cm
/
0 1 2 3 9 0 1 2 3 9
0 1 2 3 9 0 1 2 3 9
0 1 90 1 9 0 1 9
0 1 9 0 1 9
0 1 9 0 1 9
0 1 2 3 9 0 1 2 3 9
0 1 2 3 0 1 2 3
Food
Fre
quen
cy Q
uest
ionn
aire
Dat
e of
Vis
itD
ate
of V
isit
Dat
e of
Vis
itQ
uant
ity/D
ay/w
k/m
thN
ever
<1 M
thR
ecom
men
dA
sses
sR
ecom
men
dA
sses
sR
ecom
men
dA
sses
sB
raek
fast
Bre
ad /
Cha
ppat
i *Pa
rath
a *
Pape
y *
Bisc
uits
*
Bun
*Eg
g *
Egg
whi
tes
*Ja
m /
jelli
es **
*M
arga
rine
***
Tea
**M
ilk **
Any
othe
r / n
othi
ngM
id m
orni
ngFr
uit (
with
or w
ithou
t sk
in) *
Bisc
uits
*C
hana
y /lo
bia/
lent
ils *
*po
p-co
rn *
*ba
kery
bis
cuits
**An
yoth
er /n
othi
ng *
*Lu
nch
Sala
d **
Cha
ppat
i */ R
ice*
*ve
geta
ble(
cook
ed) *
*D
aal *
*M
eat *
fish/
chic
ken
*or
gan
mea
t *A
nyot
her /
noth
ing

Food
Fre
quen
cy Q
uest
ionn
aire
Dat
e of
Vis
itD
ate
of V
isit
Dat
e of
Vis
itQ
uant
ity/D
ay/w
k/m
thN
ever
<1 M
thR
ecom
men
dA
sses
sR
ecom
men
dA
sses
sR
ecom
men
dA
sses
sTe
a tim
eBi
scui
ts *
fried
item
s *
Tea
**A
nyot
her /
noth
ing
Din
ner
Sala
d **
Cha
ppat
i * R
ice
**ve
geta
ble(
cook
ed) *
*D
aal *
*M
eat *
fish/
chic
ken
*or
gen
mea
t *A
nyot
her /
noth
ing
Bed
tim
eM
ilk **
Frui
t (w
ith o
r with
out
skin
) *A
nyot
her /
not
hing
Tota
l Cal
orie
sTo
tal F
atTy
pe o
f Fat
Eat
ing
out
Ref
ined
CH
O *
In n
umbe
rs**
In c
ups
***
In te
aspo
ons

Physical Activity Questions Response Code Activity at work
1
Does your work involve vigorous-intensity activity that causes large increases in breathing or heart like [carrying or lifting heavy loads, digging or construction work] for at least 10 minutes continuously?
Yes 1 No 2 If No, go to P 4
P1
2 In a typical week, on how many days do you do vigorous-intensity activities as part of your work?
Number of days P2
3 How much time do you spend doing vigorous-intensity activities at work on a typical day?
Hours : minutes
P3 (a-b)
4 Does your work involve moderate-intensity activity that causes small increases in breathing or heart rate such as brisk walking [or carrying light loads] for at least 10 minutes continuously?
Yes 1 No 2 If No, go to P 7
P4
5 In a typical week, on how many days do you do moderate-intensity activities as part of your work?
Number of days P5
6 How much time do you spend doing moderate-intensity activities at work on a typical day?
Hours : minutes
P6 (a-b)
Travel to and from places
7 Do you walk or use a bicycle (pedal cycle) for at least 10 minutes continuously to get to and from places?
Yes 1 No 2 If No, go to P10
P7
8 In a typical week, on how many days do you walk or bicycle for at least 10 minutes continuously to get to and from places?
Number of days
P8
9 How much time do you spend walking or bicycling for travel on a typical day?
Hours : minutes
P9
Recreational activities
10
Do you do any vigorous-intensity sports, fitness or recreational (leisure) activities that cause large increases in breathing or heart rate [running or football,] for at least 10 minutes continuously?
Yes 1 No 2 If No, go to P13
P10
11 In a typical week, on how many days do you do vigorous-intensity sports, fitness or (leisure) activities?
Number of days P11
12 How much time do you spend doing vigorous-intensity sports, fitness or recreational activities on a typical day?
Hours : minutes
P12
13
Do you do any moderate-intensity sports, fitness or recreational (leisure) activities that causes a small increase in breathing or heart rate such as brisk walking, (cycle, swimming, volleyball) for at least 10 minutes continuously?
Yes 1 No 2 If No, go to P16
P13
14 In a typical week, on how many days do you do moderate-intensity sports, fitness or recreational (leisure) activities?
Number of days P14
15 How much time do you spend doing moderate-intensity sports, fitness or recreational (leisure) activities on a typical days?
Hours : minutes
P15
Sedentary behaviour
16 How much time do you usually spend sitting or reclining on a typical day?
Hours : minutes
P16

PHYSICAL ACTIVITY RECOMMENDATION
Registration No.
Date
1)
2)
3)
4)
PHYSICAL ACTIVITY RECOMMENDATION
Registration No.
Date
1)
2)
3)
4)
PHYSICAL ACTIVITY RECOMMENDATION
Registration No.
Date
1)
2)
3)
4)
FLEXIBILITY EXERCISE:
STRENGTH TRAINING:
CARDIO RESPIRATORY EXERCISES:

Lab Investigations Registration No:
BLast Visit
Physical Examination
5.1 Height (cm) 5.2 Weight (kg) 5.3. BMI (kg/m2)
5.4 Waist circumference (cm) 5.5. Hip circumference (cm) 5.6 WHRatiocm
6. Blood pressure (mmHg)6.1 First measurement (systolic/diastolic)
/6.2 Second measurement (systolic/diastolic)
/6.3 Third measurement (systolic/diastolic)
Last Visit Right Left 7 Visual Acuity 8 Eye Examination (Fundoscopy)
(Code of 8.1 & 8.2: Nil=0, 1 to 5=1, 6 to 10=2, 11+ =3, Retina not visible=9) 8.1 Microdots 8.2 Blot Haemorrhages (Code of 8.3, 8.4 & 8.5 : Absent = 0, Present = 1, Retina not visible = 9) 8.3 Exudates (hard) 8.4 Exudates (soft) 8.5 Vitreous Haemorrhage (Code of 8.6: Nil=0, Peripheral=1, Disc=2, RP=3, Retina not seen=9) 8.6 New vessels (Code of 8.7 : Nil=0, mild=1, Retina not seen clearly=2 ,lens removed=3) 8.7 Cataracts
9 Limb Examination
Date 0 months 9 months* 18 months Remarks
OGTT – Fasting BS mg/dlOGTT – 2 Hrs Postprandial BS mg/dlFasting Total Lipids mg/dlTotal Cholesterol mg/dlTriglyceride mg/dlHDL mg/dlLDL mg/dl Fasting Insulin LevelsHbA1c %
cm , kg ,
,cm
/
0 1 2 3 9 0 1 2 3 9
0 1 2 3 9 0 1 2 3 9
0 1 90 1 9 0 1 9
0 1 9 0 1 9
0 1 9 0 1 9
0 1 2 3 9 0 1 2 3 9
0 1 2 3 0 1 2 3
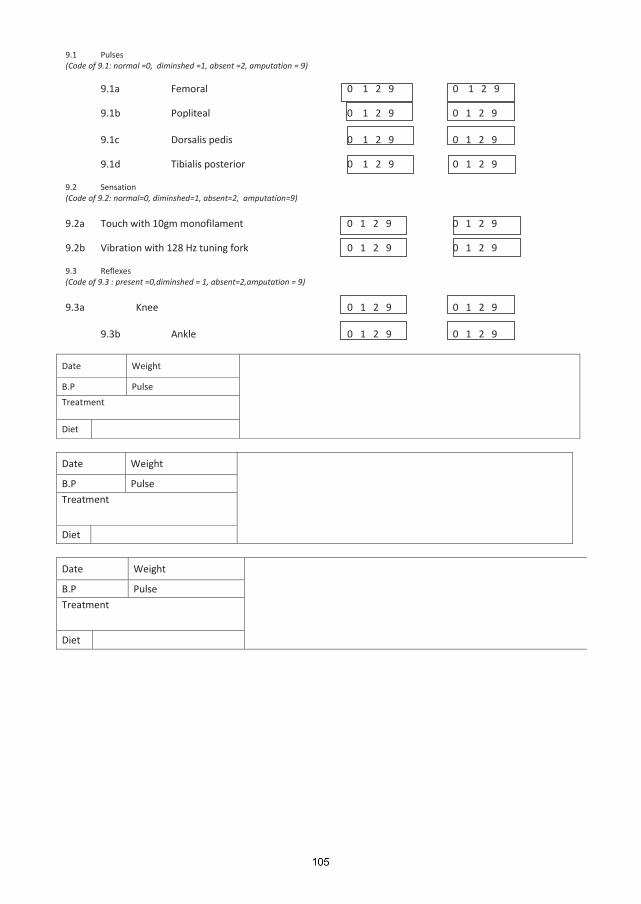
9.1 Pulses (Code of 9.1: normal =0, diminshed =1, absent =2, amputation = 9)
9.1a Femoral 0 1 2 9 0 1 2 9 9.1b Popliteal 0 1 2 9 0 1 2 9 9.1c Dorsalis pedis 0 1 2 9 0 1 2 9 9.1d Tibialis posterior 0 1 2 9 0 1 2 9 9.2 Sensation (Code of 9.2: normal=0, diminshed=1, absent=2, amputation=9) 9.2a Touch with 10gm monofilament 0 1 2 9 0 1 2 9 9.2b Vibration with 128 Hz tuning fork 0 1 2 9 0 1 2 9 9.3 Reflexes (Code of 9.3 : present =0,diminshed = 1, absent=2,amputation = 9) 9.3a Knee 0 1 2 9 0 1 2 9 9.3b Ankle 0 1 2 9 0 1 2 9
Date Weight
B.P Pulse
Treatment
Diet
Date Weight
B.P Pulse
Treatment
Diet
Date Weight
B.P Pulse
Treatment
Diet
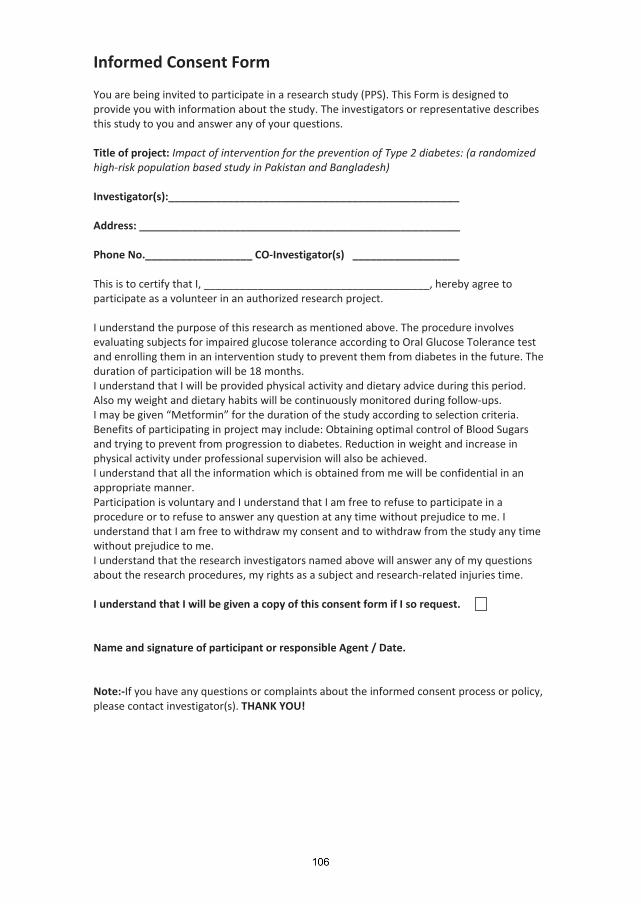
Informed Consent Form You are being invited to participate in a research study (PPS). This Form is designed to provide you with information about the study. The investigators or representative describes this study to you and answer any of your questions. Title of project: Impact of intervention for the prevention of Type 2 diabetes: (a randomized high-risk population based study in Pakistan and Bangladesh) Investigator(s):_________________________________________________ Address: ______________________________________________________ Phone No.__________________ CO-Investigator(s) __________________ This is to certify that I, ______________________________________, hereby agree to participate as a volunteer in an authorized research project. I understand the purpose of this research as mentioned above. The procedure involves evaluating subjects for impaired glucose tolerance according to Oral Glucose Tolerance test and enrolling them in an intervention study to prevent them from diabetes in the future. The duration of participation will be 18 months. I understand that I will be provided physical activity and dietary advice during this period. Also my weight and dietary habits will be continuously monitored during follow-ups. I may be given “Metformin” for the duration of the study according to selection criteria. Benefits of participating in project may include: Obtaining optimal control of Blood Sugars and trying to prevent from progression to diabetes. Reduction in weight and increase in physical activity under professional supervision will also be achieved. I understand that all the information which is obtained from me will be confidential in an appropriate manner. Participation is voluntary and I understand that I am free to refuse to participate in a procedure or to refuse to answer any question at any time without prejudice to me. I understand that I am free to withdraw my consent and to withdraw from the study any time without prejudice to me. I understand that the research investigators named above will answer any of my questions about the research procedures, my rights as a subject and research-related injuries time. I understand that I will be given a copy of this consent form if I so request. Name and signature of participant or responsible Agent / Date. Note:-If you have any questions or complaints about the informed consent process or policy, please contact investigator(s). THANK YOU!


10 Appendix III (Papers 1 – 4)
119
METABOLIC SYNDROME AND RELATED DISORDERSVolume 7, Number 2, 2009© Mary Ann Liebert, Inc.Pp. 119–124DOI: 10.1089/met.2008.0055
Prevalence of Metabolic Syndrome in Urban Pakistan (Karachi): Comparison of Newly Proposed International
Diabetes Federation and Modified Adult Treatment Panel III Criteria
M. Zafar Iqbal Hydrie, M.Phil.,1,* A. Samad Shera, F.R.C.P.,2 Asher Fawwad, M.Phil.,3 Abdul Basit, F.R.C.P.,4 and Akhtar Hussain, D.Sc.5
Abstract
The clustering of central obesity, dyslipidemia, hypertension, and hyperglycemia known as metabolic syndrome has been associated with a two- to three-fold increase in type 2 diabetes (T2DM) and cardiovascular disease (CVD). It is recognized that the features of the metabolic syndrome can be present 10 years preceding T2DM and CVD. The objective of our study was to determine the prevalence of metabolic syndrome in adults aged 25 years and older from an urban population of Karachi, Pakistan, according to the International Diabetes Federation (IDF) defi nition and modifi ed Adult Treatment Panel III (ATP III) criteria. This study involved a survey con-ducted from July, 2004, to December, 2004, by generating a computerized random sample of households in Lyari Town using a geographical imaging system (GIS). Out of the 85,520 households, 532 households were randomly selected and 867 adults ≥25 years old consented to take part in the survey; 363 of these subjects gave blood samples. The prevalence of diabetes was 9.4%, whereas 5.6% had impaired fasting glucose (abnormal glucose tolerance 15%). The prevalence of metabolic syndrome according to the IDF defi nition and modifi ed ATP III cri-teria was 34.8% and 49%, respectively. Inclusion of modifi ed waist circumference and specifi c body mass index (BMI) cut offs for Asians may help predict metabolic syndrome at an early stage. High prevalence of metabolic syndrome was identifi ed irrespective of the defi nition applied in this population. This may call for immediate action to halt the accelerating risk of diabetes and CVD that would lead to a possible unparalleled rise in the cost of health care and human suffering.
Introduction
The modern era has seen the rise of computerization and mechanization, with improved transport result-
ing in changes in lifestyle from active to sedentary and thus making an enormous impact on human health.1 The rise in metabolic syndrome has been partly related to the achieve-ments in public health during the 20th century, with people
living longer owing to elimination of many of the commu-nicable diseases.2
Over the last 20 years, focus on the metabolic syndrome has gradually increased, and studies have shown that the prevalence of metabolic syndrome is steadily increasing in all populations worldwide, recognizing this as one of the major global public health challenges of recent times.3 The
1 Department of International Health, Institute of General Practice and Community Medicine, Faculty of Medicine, University of Oslo,
Norway.2
World Health Organization Collaborating Centre, Diabetic Association of Pakistan, Nazimabad, Karachi, Pakistan.3
Research Department, Baqai Institute of Diabetology and Endocrinology, Nazimabad, Karachi, Pakistan.4
Department of Medicine, Medical Unit-IV, Baqai Medical University and Baqai Institute of Diabetology and Endocrinology, Nazimabad, Karachi, Pakistan.
5 Faculty of Medicine University of Oslo, Institute of General Practice and Community Medicine, Department of International Health,
Oslo, Norway.*
Present address: Baqai Institute of Diabetology and Endocrinology, Nazimabad, Karachi, Pakistan.
07-MET-2009_0055.indd 119 4/21/2009 6:56:52 PM

HYDRIE ET AL.120
in Pakistan to identify the potential for prevention of life-threatening diseases like diabetes and CVD. However, a few small-scale studies have been conducted. Such studies conducted in hospital patients have shown a prevalence rate of 44%4; another study conducted amongst diabetic patients showed a prevalence of metabolic syndrome of 46%.14
These studies were all specifi c, high-risk group-based studies. To the best of our knowledge, only one community-based epidemiological study on the prevalence of metabolic syndrome has been reported from a rural area of Pakistan.15 According to International Diabetes Federation (IDF) and Adult Treatment Panel III (ATP III) defi nition, 40% and 31% had metabolic syndrome, respectively. Hence the study reported here is the fi rst community-based prevalence survey of metabolic syndrome in an urban population of Pakistan. Furthermore, we have also examined the concor-dances between the IDF defi nition and modifi ed ATP III cri-teria for metabolic syndrome.
high prevalence of metabolic syndrome and cardiovascu-lar disease (CVD) risk factors have been reported in South Asians.4–8 Although more than one fi fth of the world popu-lation lives in South Asia, very few studies have been done on metabolic syndrome in this part of the world. Amongst those in India, the prevalence rates of metabolic syndrome were reported to be higher than 40%.4 It is estimated that a population with metabolic syndrome is three times as likely to have and twice as likely to die from a heart attack or stroke compared to people without the syndrome.9 In addition, peo-ple with metabolic syndrome have a fi ve-fold greater risk of developing type 2 diabetes (T2DM).10 We looked at the prev-alence of Metabolic Syndrome according to International Diabetes Federation (IDF) and Modifi ed Adult Treatment Panel III (ATPIII) criterions as given in Table 1.10,11
Studies have shown a high prevalence of T2DM and CVD in South Asians.7,8,12,13 Very few studies have looked at the prevalence of metabolic syndrome in the general population
Table 1. Diagnostic Criteria for the Metabolic Syndrome from the International Diabetes Federation (IDF)10 and American Heart Association (AHA)/National Heart, Lung, and Blood Institute (NHLBI)11
AHA/NHLBI diagnostic criteria for metabolic IDF clinical criteria for metabolic syndrome syndrome
Measure (central obesity plus any two Measure (any three of fi ve other criteria of the fi ve criteria constitute a diagnosis below constitute a of metabolic diagnosis of syndrome) Categorical cut points metabolic syndrome) Categorical cut points
Central obesity Waist circumference Elevated waist General U.S. population: ethnicity specifi c circumference ≥102 cm (≥40 in.) in men, For South Asians: ≥88 cm (≥35 in.) in women; ≥90 cm in men, lower cut points for insulin- ≥80 cm in women resistant individuals or ethnic groups (for South Asians: ≥90 cm in men, ≥80 cm in women)Raised triglycerides >150 mg/dL Elevated triglycerides ≥150 mg/dL (1.7 mmol/L) or (1.7 mmol/L) or on on drug treatment for specifi c treatment for this elevated triglycerides lipid disorder Reduced high- <40 mg/dL Reduced high-density <40 mg/dL (1.03 mmol/L) in density lipoprotein (1.03 mmol/L) in men, lipoprotein men, <50 mg/dL cholesterol <50 mg/dL cholesterol (1.29 mmol/L) in women (1.29 mmol/L) in women or on specifi c treatment for this lipid abnormality Raised blood ≥130 mmHg systolic Elevated blood ≥130 mmHg systolic blood pressure blood pressure or pressure pressure or ≥85 mmHg ≥85 mmHg diastolic diastolic blood pressure or on blood pressure or on drug treatment for treatment for previously hypertension diagnosed hypertension Raised fasting Fasting plasma glucose Raised fasting Fasting plasma glucose glucose ≥100 mg/d1L glucose ≥100 mg/dL (5.6 mmol/L) or (5.6 mmol/L) or previously diagnosed type 2 previously diagnosed type diabetes 2 diabetes
07-MET-2009_0055.indd 120 4/21/2009 6:56:52 PM

PREVALENCE OF METABOLIC SYNDROME IN URBAN PAKISTAN 121
(BMI) was calculated as a ratio of weight (kg) to height in meters squared. Waist circumference was measured at the minimum circumference between the lower border of the ribs and iliac crest on the midaxillary line, and hip cir-cumference was measured at the greatest protrusion of the buttocks just below the iliac crest The measurements were taken in centimeters, and the waist-to-hip ratio (WHR) was calculated as waist/hip circumference.
Blood pressure was measured with a special precaution to reduce the variation of blood pressure value with resting values: individuals were requested to take 10 minutes rest at a sitting position before measuring the blood pressure. We used standard cuffs for an adult-fi tted mercury sphygmo-manometer for all individuals to minimize the difference. Two blood pressure readings were taken, and a mean value was used for the fi nal measurements.
Laboratory assays
At the end of the household visit, all adults 25 years and older were asked to undertake an 8-hour fast for blood tests (fasting blood glucose and lipid profi le) that was collected at home on weekends. Within 1 hour of blood collection, the samples were centrifuged and separated. All selected parameters of blood lipids (total cholesterol, triglycerides, high-density lipoprotein cholesterol [HDL-C] and low-den-sity cholesterol [LDL-C]) and blood glucose estimation were performed using a Vitalab Selectra autoanalyzer. Fasting blood glucose and lipid profi les were done by the glucose oxidase GOD PAP method and cholesterol CHOD PAP method, respectively. Fasting insulin levels were measured, but these will be presented elsewhere.
Criteria for metabolic syndrome
Diagnostic criteria for the metabolic syndrome were from the IDF10 and American Heart Association (AHA)/National Heart, Lung, and Blood Institute (NHLBI) (Table 1).11
Statistical analysis
All data were recorded on forms developed using TeleForm® Version 6.01, an optical character recognition software. Later this data was converted into the software package Statistical Package for Social Sciences (SPSS, version 11.5) for analysis. The prevalence of metabolic syndrome was determined by simple percentages and with 95% confi dence intervals (CIs). For group comparisons, the chi-square test was performed; the Student t-test was performed for contin-uous variables. A P value of <0.05 was considered statisti-cally signifi cant. The age-specifi c distribution of prevalence of metabolic syndrome was calculated for men and women separately and described in percentages. A kappa test was done to examine the agreement among the defi nitions. All P values presented are two tailed.
Results
Description of anthropometric and biochemical param-eters are provided in Table 2. Female subjects were younger but had higher BMI values and total cholesterol, low-density lipoprotein (LDL), and high-density lipoprotein (HDL) lev-els. Males were older and had higher waist circumference,
Materials and Methods
Study area and population
The survey activities were conducted over a period of 6 months from July, 2004, to December, 2004. The Lyari Town Geographical Information System (GIS) was made by the Population Census Offi ce, Statistics Bureau Sindh, and a research organization to defi ne the geopolitical boundaries and population density of Lyari Town (estimated 2004 pop-ulation, 700,000). This was done by dynamically linking the national census database to a purpose-built GIS. This GIS ascribed unique identifi cation numbers to 85,520 house-holds, which was the initial criteria for studying the prev-alence of metabolic syndrome among randomly selected households in Lyari.
The rationale for choosing Lyari Town for this study was that its residents comprise a multiethnic community that includes the major ethnic groups found in Pakistan. There is similarly a wide spectrum of socioeconomic groups in the area that could possibly be representative of the general population.
Methodology
The ethical approval for this survey was given by Institutional Review Board (IRB) of Baqai Institute of Diabetology and Endocrinology. The survey activities were divided into two phases, the household interview plus phys-ical examination and blood sample collection. Amongst the initial households selected, 532 households were randomly selected through the GIS software and maps. These house-holds were then generated into nine fi eld segments, which were the responsibility of nine fi eld teams. A fi eld team comprised of one or two medical students, a female health worker, and a male health worker. All teams and survey-ors were supervised by a medical doctor acting as the fi eld coordinator.
If members of a selected household were absent or refused to participate, then the third door to the right of that house (while standing facing the door of the original house) was approached and consent to participate was sought. In case of further denial or absence, the next consecutive door to the right was selected. All adults 25 years and older were invited to participate after providing signed consent. In the case of illiterate participants, the consent form was read out to them and a thumbprint was procured in the presence of a household member or neighbor as witness.
By following this procedure, a total of 871 persons >25 years were approached, out of which 867 persons partic-ipated in the survey (response rate, 99.5%). These people were interviewed by the fi eld teams, and their anthropo-metric measures were performed and blood samples were collected. Of these, 363 persons gave blood, producing a response rate of 42% for blood collection.
Anthropometry
Anthropometric and demographic information was collected during interview. Weight, height, waist, and hip circumference were measured with the participants in standing position wearing light clothes and no shoes. The weight was taken to the nearest 0.1 kg by a digital bathroom scale and height was taken to the 0.1 cm. Body mass index
07-MET-2009_0055.indd 121 4/21/2009 6:56:52 PM
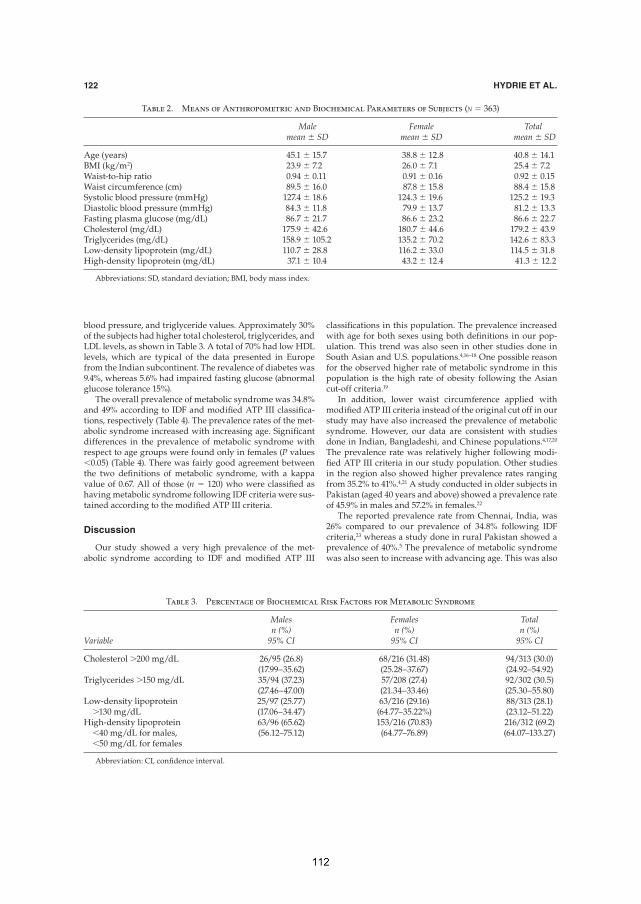
HYDRIE ET AL.122
classifi cations in this population. The prevalence increased with age for both sexes using both defi nitions in our pop-ulation. This trend was also seen in other studies done in South Asian and U.S. populations.4,16–18 One possible reason for the observed higher rate of metabolic syndrome in this population is the high rate of obesity following the Asian cut-off criteria.19
In addition, lower waist circumference applied with modifi ed ATP III criteria instead of the original cut off in our study may have also increased the prevalence of metabolic syndrome. However, our data are consistent with studies done in Indian, Bangladeshi, and Chinese populations.4,17,20 The prevalence rate was relatively higher following modi-fi ed ATP III criteria in our study population. Other studies in the region also showed higher prevalence rates ranging from 35.2% to 41%.4,21 A study conducted in older subjects in Pakistan (aged 40 years and above) showed a prevalence rate of 45.9% in males and 57.2% in females.22
The reported prevalence rate from Chennai, India, was 26% compared to our prevalence of 34.8% following IDF criteria,23 whereas a study done in rural Pakistan showed a prevalence of 40%.5 The prevalence of metabolic syndrome was also seen to increase with advancing age. This was also
blood pressure, and triglyceride values. Approximately 30% of the subjects had higher total cholesterol, triglycerides, and LDL levels, as shown in Table 3. A total of 70% had low HDL levels, which are typical of the data presented in Europe from the Indian subcontinent. The revalence of diabetes was 9.4%, whereas 5.6% had impaired fasting glucose (abnormal glucose tolerance 15%).
The overall prevalence of metabolic syndrome was 34.8% and 49% according to IDF and modifi ed ATP III classifi ca-tions, respectively (Table 4). The prevalence rates of the met-abolic syndrome increased with increasing age. Signifi cant differences in the prevalence of metabolic syndrome with respect to age groups were found only in females (P values <0.05) (Table 4). There was fairly good agreement between the two defi nitions of metabolic syndrome, with a kappa value of 0.67. All of those (n = 120) who were classifi ed as having metabolic syndrome following IDF criteria were sus-tained according to the modifi ed ATP III criteria.
Discussion
Our study showed a very high prevalence of the met-abolic syndrome according to IDF and modifi ed ATP III
Table 2. Means of Anthropometric and Biochemical Parameters of Subjects (N = 363)
Male Female Total mean ± SD mean ± SD mean ± SD
Age (years) 45.1 ± 15.7 38.8 ± 12.8 40.8 ± 14.1BMI (kg/m2) 23.9 ± 7.2 26.0 ± 7.1 25.4 ± 7.2Waist-to-hip ratio 0.94 ± 0.11 0.91 ± 0.16 0.92 ± 0.15Waist circumference (cm) 89.5 ± 16.0 87.8 ± 15.8 88.4 ± 15.8Systolic blood pressure (mmHg) 127.4 ± 18.6 124.3 ± 19.6 125.2 ± 19.3Diastolic blood pressure (mmHg) 84.3 ± 11.8 79.9 ± 13.7 81.2 ± 13.3Fasting plasma glucose (mg/dL) 86.7 ± 21.7 86.6 ± 23.2 86.6 ± 22.7Cholesterol (mg/dL) 175.9 ± 42.6 180.7 ± 44.6 179.2 ± 43.9Triglycerides (mg/dL) 158.9 ± 105.2 135.2 ± 70.2 142.6 ± 83.3Low-density lipoprotein (mg/dL) 110.7 ± 28.8 116.2 ± 33.0 114.5 ± 31.8High-density lipoprotein (mg/dL) 37.1 ± 10.4 43.2 ± 12.4 41.3 ± 12.2
Abbreviations: SD, standard deviation; BMI, body mass index.
Table 3. Percentage of Biochemical Risk Factors for Metabolic Syndrome
Males Females Total n (%) n (%) n (%)Variable 95% CI 95% CI 95% CI
Cholesterol >200 mg/dL 26/95 (26.8) 68/216 (31.48) 94/313 (30.0) (17.99–35.62) (25.28–37.67) (24.92–54.92)Triglycerides >150 mg/dL 35/94 (37.23) 57/208 (27.4) 92/302 (30.5) (27.46–47.00) (21.34–33.46) (25.30–55.80)Low-density lipoprotein 25/97 (25.77) 63/216 (29.16) 88/313 (28.1) >130 mg/dL (17.06–34.47) (64.77–35.22%) (23.12–51.22)High-density lipoprotein 63/96 (65.62) 153/216 (70.83) 216/312 (69.2) <40 mg/dL for males, (56.12–75.12) (64.77–76.89) (64.07–133.27) <50 mg/dL for females
Abbreviation: CI, confi dence interval.
07-MET-2009_0055.indd 122 4/21/2009 6:56:52 PM
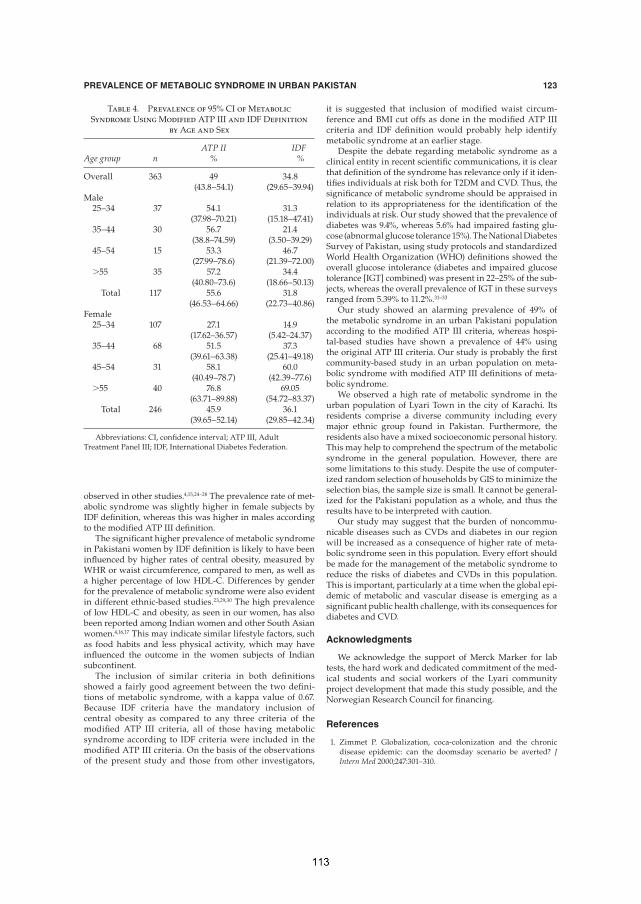
PREVALENCE OF METABOLIC SYNDROME IN URBAN PAKISTAN 123
it is suggested that inclusion of modifi ed waist circum-ference and BMI cut offs as done in the modifi ed ATP III criteria and IDF defi nition would probably help identify metabolic syndrome at an earlier stage.
Despite the debate regarding metabolic syndrome as a clinical entity in recent scientifi c communications, it is clear that defi nition of the syndrome has relevance only if it iden-tifi es individuals at risk both for T2DM and CVD. Thus, the signifi cance of metabolic syndrome should be appraised in relation to its appropriateness for the identifi cation of the individuals at risk. Our study showed that the prevalence of diabetes was 9.4%, whereas 5.6% had impaired fasting glu-cose (abnormal glucose tolerance 15%). The National Diabetes Survey of Pakistan, using study protocols and standardized World Health Organization (WHO) defi nitions showed the overall glucose intolerance (diabetes and impaired glucose tolerance [IGT] combined) was present in 22–25% of the sub-jects, whereas the overall prevalence of IGT in these surveys ranged from 5.39% to 11.2%.31–33
Our study showed an alarming prevalence of 49% of the metabolic syndrome in an urban Pakistani population according to the modifi ed ATP III criteria, whereas hospi-tal-based studies have shown a prevalence of 44% using the original ATP III criteria. Our study is probably the fi rst community-based study in an urban population on meta-bolic syndrome with modifi ed ATP III defi nitions of meta-bolic syndrome.
We observed a high rate of metabolic syndrome in the urban population of Lyari Town in the city of Karachi. Its residents comprise a diverse community including every major ethnic group found in Pakistan. Furthermore, the residents also have a mixed socioeconomic personal history. This may help to comprehend the spectrum of the metabolic syndrome in the general population. However, there are some limitations to this study. Despite the use of computer-ized random selection of households by GIS to minimize the selection bias, the sample size is small. It cannot be general-ized for the Pakistani population as a whole, and thus the results have to be interpreted with caution.
Our study may suggest that the burden of noncommu-nicable diseases such as CVDs and diabetes in our region will be increased as a consequence of higher rate of meta-bolic syndrome seen in this population. Every effort should be made for the management of the metabolic syndrome to reduce the risks of diabetes and CVDs in this population. This is important, particularly at a time when the global epi-demic of metabolic and vascular disease is emerging as a signifi cant public health challenge, with its consequences for diabetes and CVD.
Acknowledgments
We acknowledge the support of Merck Marker for lab tests, the hard work and dedicated commitment of the med-ical students and social workers of the Lyari community project development that made this study possible, and the Norwegian Research Council for fi nancing.
References
1. Zimmet P. Globalization, coca-colonization and the chronicdisease epidemic: can the doomsday scenario be averted? J Intern Med 2000;247:301–310.
observed in other studies.4,15,24–28 The prevalence rate of met-abolic syndrome was slightly higher in female subjects by IDF defi nition, whereas this was higher in males according to the modifi ed ATP III defi nition.
The signifi cant higher prevalence of metabolic syndrome in Pakistani women by IDF defi nition is likely to have been infl uenced by higher rates of central obesity, measured by WHR or waist circumference, compared to men, as well as a higher percentage of low HDL-C. Differences by gender for the prevalence of metabolic syndrome were also evident in different ethnic-based studies.23,29,30 The high prevalence of low HDL-C and obesity, as seen in our women, has also been reported among Indian women and other South Asian women.4,16,17 This may indicate similar lifestyle factors, such as food habits and less physical activity, which may have infl uenced the outcome in the women subjects of Indian subcontinent.
The inclusion of similar criteria in both defi nitions showed a fairly good agreement between the two defi ni-tions of metabolic syndrome, with a kappa value of 0.67. Because IDF criteria have the mandatory inclusion of central obesity as compared to any three criteria of the modifi ed ATP III criteria, all of those having metabolic syndrome according to IDF criteria were included in the modifi ed ATP III criteria. On the basis of the observations of the present study and those from other investigators,
Table 4. Prevalence of 95% CI of MetabolicSyndrome Using Modified ATP III and IDF Definition
by Age and Sex
ATP II IDFAge group n % %
Overall 363 49 34.8 (43.8–54.1) (29.65–39.94)Male 25–34 37 54.1 31.3 (37.98–70.21) (15.18–47.41) 35–44 30 56.7 21.4 (38.8–74.59) (3.50–39.29) 45–54 15 53.3 46.7 (27.99–78.6) (21.39–72.00) >55 35 57.2 34.4 (40.80–73.6) (18.66–50.13) Total 117 55.6 31.8 (46.53–64.66) (22.73–40.86)Female 25–34 107 27.1 14.9 (17.62–36.57) (5.42–24.37) 35–44 68 51.5 37.3 (39.61–63.38) (25.41–49.18) 45–54 31 58.1 60.0 (40.49–78.7) (42.39–77.6) >55 40 76.8 69.05 (63.71–89.88) (54.72–83.37) Total 246 45.9 36.1 (39.65–52.14) (29.85–42.34)
Abbreviations: CI, confi dence interval; ATP III, Adult Treatment Panel III; IDF, International Diabetes Federation.
07-MET-2009_0055.indd 123 4/21/2009 6:56:52 PM

HYDRIE ET AL.124
20. Rahim MA, Azad Khan AK, Sayeed MA, Akhtar B, Nahar Q, Ali SMK, Hussain A. Metabolic syndrome in rural Bangladesh: Comparison of newly proposed IDF, modifi ed ATP III and WHO criteria and their agreements. Diabetes Metabol Syndr: Clin Res Rev 2007;1:251–257.
21. Jahan F, Qureshi R, Borhany T, Hamza HB. Metabolic syndrome: frequency and gender differences at an Out-Patient clinic. J Coll Physicians Surg Pak 2007;17:32–35.
22. Jafar Th, Qadri Z, Chaturvedi N. Coronary artery disease ep-idemic in Pakistan-more electrocardiographic evidence of is-chemia in women than in men. Heart 2007.
23. Deepa M, Pradeepa R, Rema M, Mohan A, Deepa R, Shanthirani S, Mohan V. The Chennai Urban Rural Epidemiology Study (CURES)—study design and methodology (urban component) (CURES-I). J Assoc Physicians India 2003;51:863–870.
24. Wang JJ, Hu G, Miettinen HE, Tuomilehto J. The metabolic syndrome and incident diabetes: Asessment of four suggested defi nitions of the metabolic syndrome in a Chinese popula-tion with high post prandial glucose. Horm Metab Res 2004;36: 708–715.
25. Moran MR, Vazquez BS, Violanie R, Romero FG. Metabolic syndrome among children and adolescents aged 10-18 years. Diabetes Care 2004;27:2516–2517.
26. Balkau B, Charles MA, Drivsholm T, Johnsen KB, Wareham N, Yudkin JS, Morris R, Zavaroni I, van Dam R, Feskins E, Gabriel R, Diet M, Nilsson P, Hedblad B. Frequency of the WHO met-abolic syndrome in European cohorts, and an alternative def-inition of an insulin resistance syndrome. Diabetes Care 2002, 28:364–376.
27. Misra A, Wasir JS, Pandey RM. An evaluation of candidate defi nitions of the metabolic syndrome in adult Asian Indians. Diabetes Care 2005;28: 398-403.
28. World Health Organization. Physical Status: The Use and Interpretation of Anthropometry. Report of a WHO Expert Committee. Geneva: WHO Technical Report Series No. 854; 1995.
29. Ford ES,. Giles WH. A comparison of prevalence of the meta-bolic syndrome using two proposed defi nitions. Diabetes Care 2003;26:575–581.
30. Ang LW, Ma S, Cutter J, Chew SK, Tanc CE, Tai ES. The meta-bolic syndrome in Chinese, Malays, and Asian Indians, factor analysis of data from 1998 Singapore National Health Survey. Diabet Res Clin Pract 2005;67:53–62.
31. Shera AS, Rafi que G, Khuwaja IA, Ara J, Baqai S, King H. Pakistan National Diabetes Survey: prevalence of glucose in-tolerance and associated factors in Shikarpur, Sindh province. Diabet Med 1995;12:1116–1121.
32. Shera AS, Rafi que G, Khwaja IA, Baqai S, Khan IA, King H. Pakistan National Health Survey:prevalence of glucose intol-erance and associated factors in North West Frontier Province (NWFP) of Pakistan. J Pak Med Assoc 1999;49:206–211.
33. Shera AS, Rafi que G, Khawaja IA, Baqai I, King H. Pakistan National Diabetic Survey: Prevalence of glucose intolerance and associated factors in Balochistan province. Diabetes Res Clin Pract 1999;44:49–58.
Address reprint requests to:M. Zafar Iqbal Hydrie, M.Phil.
Baqai Institute of Diabetology and EndocrinologyPlot No. 1-2, II-B, Block 2
Nazimabad, Karachi 74600Pakistan
E-mail: [email protected] or [email protected]
2. Henneken G, Buring J. Epidemiology in Medicine. Boston: Little, Brown; 1987.
3. Alberti KG, Zimmet P, Shaw J, IDF Epidemiology Task Force Consensus Group. The metabolic syndrome—a new worldwide defi nition. Lancet 2005;366:1059–1062.
4. Ramachandran A, Snehalatha C, Satyavani K, Sivasankari S, Vijay V. Metabolic syndrome in urban Asian Indian adults—a population study using modifi ed ATP III criteria. Diab Res Clin Pract 2003;60:199–204.
5. Wierzbicki AS, Nishtar S, Lumb PJ, Lambert-Hammill M, Turner CN, Crook MA, Marber MS, Gill J. Metabolic syndrome and risk of coronary heart disease in a Pakistani cohort. Heart 2005;91:1003–1007.
6. Chow CK, Naidu S, Raju K, Raju R, Joshi R, Sullivan D, Celermajer DS, Neal BC. Signifi cant lipid, adiposity and metabolic abnor-malities amongst 4535 Indians from a developing region of rural Andhra Pradesh. Atheroesclerosis 2008;196:943–952.
7. Basit A, Hydrie MZI, Ahmed K, Hakeem R. Prevalence of diabetes, impaired fasting glucose and associated risk factors in a rural area of Baluchistan province according to new ADA criteria. J Pak Med Assoc 2002;52:357–360.
8. Jafar Th, Jafary FH, Jessani S, Chaturvedi N. Heart disease ep-idemic in Pakistan: women and men at equal risk. Am Heart J 2005;150:221–226.
9. Sarkar S, Das M, Mukhopadhyay B, Chakrabarti CS, Majumder PP. High prevalence of metabolic syndrome and its correlates in two tribal populations of India and the impact of urbanization. Indian J Med Res 2006;123:679–686.
10. International Diabetes Federation. The IDF consensus world-wide defi nition of the metabolic syndrome. Accessed at http://www.idf.org/webdata/docs/IDF_Metasyndrome_definition.pdf.
11. Grundy S, Cleeman J, Daniels S, Donato K, Eckel R, Franklin B et al. Diagnosis and management of the metabolic syndrome: an American Heart Association/National Heart, Lung, and Blood Institute scientifi c statement. Circulation 2005;112: 2735–2752
12. Hussain A, Rahim MA, Azad Khan AK, Ali SMK. Type 2 diabetes in rural and urban population: diverse prevalence and associ-ated risk factors in Bangladesh. Diabet Med 2005;22:931–937.
13. Ramachandran A, Snehalatha C, Kapur A, Vijay V, Mohan V, Das AK, Rao PV, Yajnik CS, Prasanna KS, Nair JD. High prevalence of diabetes and impaired glucose tolerance in India: National urban diabetes survey. Diabetologia 2001;44:1094–1101.
14. Ashraf SMS, Ziauddin F, Jahangeer U. Metabolic syndrome in type-2 diabetes mellitus. Pak J Med Sci 2006;22:295–299.
15. Zahid N, Claussen B, Hussain A. High prevalence of obe-sity, dyslipidemia and metabolic syndrome in a rural area in Pakistan. Diabetes Metabol Syndr: Clin Res Rev 2008;2:13–19.
16. Rajeev G, Prakash C, Deedwania A, Gupta SR, Raja BP, Kunal K. Prevalence of metabolic syndrome in an Indian urban popula-tion. Int J Cardiol 2004;97:257–261.
17. Ko GTC, Cockram CS, Chow CC, Yeung VTF, Chan WB, So WY, Chan NN, Chan JCN. High prevalence of metabolic syndrome in Hong Kong Chinese—Comparison of three diagnostic cri-teria. Diab Res Clin Pract 2005;69:160–168.
18. Thomas GN, Ho S-Y, Edward ED, Karen SLL, Hedley JA, Lam TH, for the Hong Kong Cardiovascular Risk Factor Prevalence Study Steering Committee. The US National Cholesterol Education Programme Adult Treatment Panel III (NCEP ATP III) prevalence of the metabolic syndrome in a Chinese popula-tion. Diab Res Clin Pract 2005;67:251–257.
19. Western Pacifi c Regional Offi ce of the World Health Organization, The International Obesity Task Force. The Asia-Pacifi c Perspective: Redefi ning Obesity and Its Treatment. Sydney: Health Communication Australia Pty Limited; 2000.
07-MET-2009_0055.indd 124 4/21/2009 6:56:52 PM


Pakistan Journal of Nutrition 9 (1): 93-99, 2010ISSN 1680-5194© Asian Network for Scientific Information, 2010
Corresponding Author: M. Zafar Iqbal Hydrie, Institute of General Practice and Community Medicine, Faculty of Medicine, Universityof Oslo, Oslo, Norway
93
Dietary Patterns Associated with Risk for Metabolic Syndrome in Urban Community of Karachi Defined by Cluster Analysis
M. Zafar Iqbal Hydrie , Abdul Basit , A. Samad Shera , Rubina Hakeem and Akhtar Hussain1,2 2 3 2,4 1
Institute of General Practice and Community Medicine, 1
Faculty of Medicine, University of Oslo, Oslo, NorwayBaqai Institute of Diabetology and Endocrinology, Baqai Medical University, Karachi, Pakistan2
WHO Collaborating Centre, Diabetic Association of Pakistan3
Raana Liaqat Ali Khan Government College of Home Economics, Pakistan 4
Abstract: Dietary trends have been found to be related with metabolic syndrome in various studies. Toidentify dietary patterns and study associations between the dietary patterns of subjects with highand low risk of metabolic syndrome in a Karachi based community. A group of 871 men and women wereselected randomly from 532 households. Data about consumption of specific foods was available for 867adults. Participants completed a health and lifestyle questionnaire and 363 subjects provided fasting bloodsamples for glucose and lipids. Dietary intake was assessed by a questionnaire to identify consumption of33 specific food items and the dietary patterns categorized into 6 food groups was assessed by clusteranalysis. Five dietary patterns were identified through cluster analysis. Cluster 1 had the lowest proportionof persons with metabolic syndrome i.e. 42.7% while cluster 2 had the highest percentage of metabolicsyndrome subjects (56.3%) (p = 0.09). Consumption of fat and caloric dense foods was significantly higheramong highest risk group (cluster 2) compared to lowest risk group (cluster 1) (p = 0.0001). Theconsumption of food groups containing fruit, milk and meat was also more than twice in high risk comparedto low risk group (p = 0.0001). Even within the same population there are marked differences in dietarypatterns and these apparently contribute to the risk of developing metabolic syndrome. Dietary patternstudies will help elucidate links between diet and disease and contribute to developing healthy eatingguidelines.
Key words: Dietary patterns, cluster analysis, metabolic syndrome, South Asians
INTRODUCTIONHigh prevalence of metabolic syndrome andCardiovascular Disease (CVD) risk factors have beenreported worldwide especially in South Asians(Ramachandran et al., 2003; Wierzbicki et al., 2005;Basit et al., 2002; Jafar et al., 2005). Metabolic Syndrome(MS) has been shown to be a good marker of futuredisease risk and it is estimated that subjects withmetabolic syndrome are three times more likely to haveand twice as likely to die from a heart attack or strokecompared to people without the syndrome (Sarkar et al.,2006). Similarly, people with metabolic syndrome havea five-fold increased risk of developing type 2 diabetes.Although dietary intake has been linked to individualcomponents of MS or the outcome diseases such asdiabetes and cardiovascular diseases, the dietarypatterns which may lead to the development ofmetabolic syndrome have not been specified. In recentyears there has been increasing interest in theidentification of dietary patterns as consumed bypopulations to better understand the association of dietwith chronic diseases (Schwerin et al., 1982; Randall et
al., 1990). During the last two decades, there has beensignificant changes in society’s life style habits withincrease in unhealthy eating, sedentary activities andsmoking (Panagiotakos et al., 2003). These habits havefueled the epidemic of obesity, which is an important riskfactor for diabetes, cardiovascular diseases,hypertension and dyslipidemia all of which may bepreceded by metabolic syndrome (Basit and Shera,2008).The 1990-1994 National Health Survey of Pakistanshowed that overall 25% of the population wasoverweight or obese. The factors significantly associatedwith obesity were increasing age, being female, highereducation, urban residence, high economic status anda high intake of meat (Jafar et al., 2006). Knowledge ofspecific food patterns is important for relating diet tonutritional status and for the identification of groups atrisk of under-or over consumption of specific food items(Tucker et al., 1992). Several studies have shown that adopting a dietarypattern characterized by high intake of red meat, refinedgrains, snacks, sweets and fried foods contribute to the
Pak. J. Nutr., 9 (1): 93-99, 2010
94
increased prevalence of type 2 diabetes (Song et al., Diabetology and Endocrinology. The survey activities2004; Schulze et al., 2003; Van et al., 2002). Whilst were divided into two phases, the household interviewadopting a dietary pattern characterized by high based on questionnaire and blood sample collection.consumption of non-refined cereals, fruits and The questionnaire included demographical details, dietvegetables, a moderate intake of dairy products, poultry and physical activity questions and anthropometricand fish and a low intake of red meat contribute towards measurements.a reduced prevalence of type 2 diabetes, metabolic Around 532 households were randomly selectedsyndrome and cardiovascular disease (Kris-Etherton etal., 2001; Trichopoulou et al., 2003; Chrysohoou et al.,2004).Thus understanding the food patterns around whichdiets are formed is important for meal planning andnutritional counseling. Cross-sectionally, dietary intakerich in whole-grain foods have been linked to a lowerprevalence of metabolic syndrome (Sahyoun et al., 2006;McKeown et al., 2004; Esmaillzadeh et al., 2005). Dairyintake has been inversely associated with metabolicsyndrome (Azadbakht et al., 2005; Mennen et al., 2000;Pereira et al., 2002). Greater intakes of fruit andvegetables have been associated with a lowerprevalence of metabolic syndrome (Esmaillzadeh et al.,2006). No association has been found betweenmetabolic syndrome and intakes of meat and fish(Mennen et al., 2000).In cross-sectional dietary pattern analysis, a greaterprevalence of MS was found among consumers ofempty calorie dietary patterns, whereas a lowerprevalence was found among those consuming ahealthy dietary pattern (Esmaillzadeh et al., 2007;Sonnenberg et al., 2005). There are no clear recommendations regarding dietaryguidelines for the prevention of metabolic syndrome inpersons at risk. The present study will help to evaluatethe relationship between dietary intake and the risk ofdeveloping MS. Cluster analysis offers advantages overthe alternative quantitative approaches as it aims toidentify distinct, relatively homogeneous groups basedupon selected attributes (the dietary variables) (Hu,2002).The aim of the present study is to identify dietary patternswithin a general population sample of urban Pakistanisubjects. We also aim to report the associationsbetween dietary patterns and prevalence of metabolicsyndrome which is a precursor for the development ofCardiovascular Disease (CVD) and glucose intolerance.
MATERIALS AND METHODSThe survey was conducted from July 2004 to December2004 over a period of 6 months. The Lyari TownGeographical Information System (GIS) was used in thissurvey which ascribed unique identification numbers to85,520 households in Lyari, where the study onprevalence of metabolic syndrome amongst selectedhouseholds was undertaken (Hydrie et al., 2009).The ethical approval for the Lyari survey was given by theInstitutional Review Board (IRB) of Baqai Institute of
through the GIS software and maps. All adults older than25 years were invited to participate after providing signedconsent. By following this procedure, a total of 871persons were approached, out of which 867 personsparticipated in the survey (response rate: 99.5%). Thesepeople were interviewed by the field teams and theiranthropometric measures taken. Of these, 363 personsgave blood samples, producing a response rate of 42%for blood collection.
Anthropometry: Weight, height, waist, and hipcircumference were measured with the subjects instanding position wearing light clothes and no shoes.The weight was taken to the nearest 0.1 kg by a digitalbathroom scale and height was taken to the 0.1 cm.Body Mass Index (BMI) was calculated as a ratio ofweight (kg) to height in meters squared. Waistcircumference was measured at the minimumcircumference between the lower border of the ribs andiliac crest on the midaxillary line and hip circumferencewas measured at the greatest protrusion of the buttocksjust below the iliac crest The measurements were takenin centimeters and the Waist-to-Hip Ratio (WHR) wascalculated as waist/hip circumference. Blood pressurewas measured twice by using a mercurysphygmomanometer, with individuals requested to sitfor 10 min before measuring the blood pressure as aspecial precaution to minimize blood pressurevariations and a mean value taken for the finalmeasurements.
Laboratory assays: All subjects were asked toundertake an 8 h fast for blood tests (fasting bloodglucose and lipid profile) that were collected at home onweekends (Hydrie et al., 2009). All selected parametersof blood lipids (total cholesterol, triglycerides, HighDensity Lipoprotein Cholesterol [HDL-C] and Low-Density Cholesterol [LDL-C]) and blood glucoseestimation were performed using a Vitalab Selectraautoanalyzer. Fasting blood glucose and lipid profileswere done by the glucose oxidase GOD PAP methodand cholesterol CHOD PAP method, respectively.
Criteria for metabolic syndrome: Diagnostic criteria forthe metabolic syndrome were taken from the AmericanHeart Association (AHA)/National Heart, Lung and BloodInstitute (NHLBI) (Table 1) (Grundy et al., 2005).

Pak. J. Nutr., 9 (1): 93-99, 2010
95
Table 1: AHA/NHLBI diagnostic criteria for metabolic syndromeMeasure (any three of the five criteria belowconstitute a diagnosis of metabolic syndrome) Categorical cut points Elevated waist circumference U.S. population: >102 cm in men, >88 cm in women; lower cut points for insulin-
resistant individuals or ethnic groups. For South Asians: >90 cm in men, >80 cm inwomen
Elevated triglycerides >150 mg/dl (1.7 mmol/l) or on drug treatment for elevated triglyceridesReduced HDL cholesterol <40 mg/dl (1.03 mmol/l) in men, <50 mg/dl (1.29 mmol/l) in womenElevated blood pressure >130 mmHg systolic blood pressure or >85 mmHg diastolic blood pressure or on drug
treatment for hypertensionRaised fasting glucose Fasting plasma glucose >100 mg/dl (5.6 mmol/l) or previously diagnosed type 2
diabetes
Dietary data: Dietary consumption was assessed by a33 food items interviewer-administered semiquantitative food-frequency questionnaire. The fooditems were categorized into 6 major food groups: Dairy,meat, fat and sweet, cereals, vegetables and fruitsgroups. Out of the 363 subjects assessed for metabolicsyndrome 362 completed the food-frequencyquestionnaire.
Statistical analysis: We used cluster analysis to identifydietary patterns and to segregate subjects based on thesimilarity of diet. We chose food variables because wewanted to identify food patterns clusters. K-meanscluster analysis was used to define clusters of subjectsusing the cluster analysis option in SPSS. Thisprocedure attempts to identify relatively homogeneousgroups of cases based on selected characteristics.In K-means cluster analysis, the homogeneity of caseswithin a cluster is measured by the total within-clustersum of squares. Cluster memberships are determinedby sequentially moving cases from one cluster toanother so that the total within-cluster sum of squares isminimized.The algorithm requires the number of clusters to bespecified prior to analysis. It is possible to identify seedsusing information derived from previous research. Five clusters were defined. We investigated metabolicsyndrome prevalence for each cluster and compared thedietary patterns of the clusters with the lowest andhighest prevalence of metabolic syndrome.
RESULTSWe identified five distinct groups in this population onthe basis of cluster analyses. A total of 75 participants(20.7%) were in cluster 1, 71 (19.6%) in cluster 2, 64(17.8%) in cluster 3, 85 (23.5%) in cluster 4 and 67(18.5%) in cluster 5. Frequency of consumption of eachfood group in all the clusters is shown in Table 2. Analyzing for proportion of subjects with metabolicsyndrome in each cluster it was observed that cluster 1had the lowest proportion of persons with metabolicsyndrome while cluster 2 had the highest percentage ofmetabolic syndrome subjects (42.7% vs. 56.3%) with ap value of 0.09 compared to the other clusters as shownin Fig. 1.
Table 2: Frequency of consumption of food groups in clusters (%)Clusters--------------------------------------------------------1 2 3 4 5
Milk group 24 69 32 57 29Meat group 35 79 61 61 56Fat group 13 70 20 42 44Cereal group 76 91 90 92 81Vegetables group 72 94 83 93 82Fruit group 34 74 45 59 46
Fig. 1: Metabolic syndrome in five clusters according tomodified ATP III definition
Comparing the food items in milk group it was observedthat the consumption in cluster 2 (high risk group) wastwice compared to cluster 1 (low risk group), the greatestconsumption was in cream\custard (7.6 times) and icecream\sweet lassi (5 times) as shown in Fig. 2. In meat group the consumption of red meat, organ meat,prawns and eggs in cluster 2 was 3-5 times comparedto cluster 1 as shown in Fig. 3. There was five times increased consumption of thesweet and fat group in cluster 2 compared to cluster 1as shown in Fig. 4. In the cereal group there was not much difference in theconsumption of legumes and fried rice in both theclusters but around 1.6 times more consumption ofnaans (refined grain) was seen in cluster 2 compared tocluster 1 (Fig. 5). In the vegetable group there was also not muchdifference in the consumption of cooked vegetables and

Pak. J. Nutr., 9 (1): 93-99, 2010
96
Fig. 2: Comparison of groups with regards to milk group
Fig. 3: Comparison of groups with regards to meatgroup
Fig. 4: Comparison of groups with regards to fat andsweet group
cooked potatoes in both clusters but the consumption ofraw vegetables was almost double in cluster 2compared to cluster 1 (Fig. 6). In the fruit group both clusters showed high Fig. 7: Comparison of groups with regards to fruit groupconsumption of fruits but 8 times more consumption offruit juices was seen in cluster 2 compared to cluster 1 its components. Rather it is the interaction betweenas shown in Fig. 7. different components of diet as well as the consumption
DISCUSSIONMetabolic Syndrome (MS) has been identified as aprecursor of predicting future disease andunderstanding how MS can be influenced by overalldietary pattern as an entity is valuable. No individual dietary component is wholly responsiblefor the association of diet with metabolic syndrome and
Fig. 5: Comparison of groups with regards to cerealgroup
Fig. 6: Comparison of groups with regards to vegetablegroup
of different food items which contribute to the risk formetabolic syndrome. Thus overall dietary trends needsto be observed as individuals consume a mixture ofdifferent food items in a single meal, rather than isolatedgroups.To our knowledge, this is the first investigation to lookinto major dietary patterns and its association with themetabolic syndrome by cluster analysis.

Pak. J. Nutr., 9 (1): 93-99, 2010
97
In this study low MS risk group (cluster 1) had lowest to insulin resistance (Burden et al., 1994). Processedconsumption of all the food groups while the high MS cereals, such as refined grains have been shown to berisk group (cluster 2) had highest consumption in most associated with an increased risk of the components ofof the food groups. This high food consumption may the metabolic syndrome in The Malmö Diet and Canceralso contribute to the high prevalence of MS as seen in Study (Wirfalt et al., 2001). Similarly in our study refinedcluster 2. grains were consumed nearly twice in the high MS riskLooking at the food groups individually it appears that group (cluster 2).the food items which were the most energy-dense had Almost double consumption of raw vegetables wasthe highest consumption in cluster 2 and this probably seen in cluster 2 compared to cluster 1. Similarly thehad the most influence in creating an unhealthy dietary overall double consumption of the fruit group was seenpattern which may lead to increased prevalence of MS. in cluster 2. An inverse association between prevalentIt has been observed in other studies that the MS and intakes of fruit and vegetables has beenconsumption of traditional food (low in saturated fat, low reported previously (Esmaillzadeh et al., 2006). Alsoin simple sugars and high in fibre) has declined recently consumption of diets high in fruit and vegetables hasand energy-dense food (high in calories, carbohydrates been associated with lower blood pressure (Appel et al.,and saturated fats and low in fibre) and non-traditional 2006) and a better lipid profile (Lichtenstein et al., 2006).energy-dense fast food are being increasingly Looking at the individual food items in the fruit group itconsumed in South Asia (Misra et al., 2009; Misra and was observed that the consumption of fruit juices whichKhurana, 2008). accounts to empty calories was 8 times more in clusterStudies have shown that South Asians have a high 2 compared to cluster 1. As mentioned earlier emptyconsumption of dairy products and sugar compared to calories in diet may lead to increased prevalence of MS;other populations (Misra et al., 2009; Popkin, 2001). the increased consumption of fruit juices probablyAlthough dairy consumption has been inversely related undermined the protective effect which vegetables andto MS in some studies (Azadbakht et al., 2005; Mennen fruits may have in cluster 2.et al., 2000; Pereira et al., 2002) more than twice dairy In summary the dietary pattern in cluster 2 was loadedconsumption was seen in the high risk group. Looking with both healthy (milk, legumes, vegetables and fruits)further at the individual food items in the milk group it and unhealthy (refined grains, potatoes, meat and meatwas observed that the highest consumption was in products, high fat dairy products, snacks, sweet itemscream\custard and ice cream\sweet lassi; items which and fruit juices) foods. Although the healthy foods havehave a high fat and sugar content. Coincidently a high been reported to be protective against the metabolicintake of fat, milk products and sugars in various regions syndrome, the cluster's unhealthy diet constituents havein India has also shown to be associated with increased adverse effects on metabolic markers which may lead tocardiovascular mortality (Gupta et al., 2006). Thus a increased prevalence of MS. combination of dairy products, with high fat and sugars A limitation to consider in the interpretation of our resultsmay influence the individual properties of the food andproduce a positive association with metabolicsyndrome. In our study these factors probably madedairy consumption lose its protective effect in oursubjects as documented elsewhere. Red meat, organ meat and prawns from the meat groupwere consumed 3-5 times more in cluster 2 comparedto cluster 1. All of these food items are known to be highin saturated fat, which has been adversely associatedwith cholesterol (Schaefer, 2002), blood pressure (Appelet al., 2006), obesity and diabetes risk (Parillo andRiccardi, 2004). Similarly all the food items in fat and sweet group wereconsumed five times more in cluster 2 compared tocluster 1. Sweet products were consumed at analarming 13 times more in cluster 2 and they probablyinfluenced the increased prevalence of MS in cluster 2with their load of empty calories in the diet. South Asians consume more carbohydrates comparedto Europeans and this may lead to hyperinsulinemia,postprandial hyperglycemia, hypertriglyceridemia andlow HDL cholesterol levels, all of which is probably due
is the use of an FFQ containing only 33 items, thusrestricting the number of food items needed tocharacterize usual dietary intake. Furthermore, for somefood groups such as dry fruits, low consumption and anarrow range of values among consumers may haveprevented us from detecting a relationship if one waspresent. Moreover, reporting biases may have occurred.Although we acknowledge these limitations, otherstudies have indicated that there is reasonable validityand reliability of food groups and major dietary patternsobtained from FFQs. Another limitation of our study is its cross-sectionalnature. Thus, the association observed between thesedietary patterns and the metabolic syndrome needs tobe confirmed in prospective analyses. Furthermore wecannot generalize our findings to Pakistani populations,since only one area within an urban city was used for thesample population.However, participants in the current study reflectedalmost all major ethnic groups of Pakistan so that abroad range of dietary habits were represented. Mostprevious studies relating MS to diet have focused on a

Pak. J. Nutr., 9 (1): 93-99, 2010
98
single food group. Thus, a major strength of our study is Esmaillzadeh, A., M. Kimiagar, Y. Mehrabi, L. Azadbakht,that all six major food groups have been covered in theFFQ.Thus we need to further explore the development of amethod which accurately measures an individual’soverall diet quality and quantity and this is a prerequisitefor further research regarding the relationship betweendiet and metabolic syndrome. Further research isrequired in larger prospective populations to be able tovalidate the findings of this study and improve ourunderstanding of the association of diet with MS.
ACKNOWLEDGEMENTSWe acknowledge the support of Merck Pakistan Pvt Ltdfor lab tests. We acknowledge the hard work anddedicated commitment of the medical students andsocial workers of Lyari community development projectwhich made this study possible. Finally we acknowledgethe Norwegian Research Council for financing.
REFERENCESAppel, L.J., M.W. Brands, S.R. Daniels, N. Karanja, P.J.
Elmer and F.M. Sacks, 2006. Dietary approaches toprevent and treat hypertension: A scientificstatement from the American Heart Association.Hypertension, 47: 296-308.
Azadbakht, L., P. Mirmiran, A. Esmaillzadeh and F. Azizi,2005. Dairy consumption is inversely associatedwith the prevalence of the metabolic syndrome inTehranian adults. Am. J. Clin. Nutr., 82: 523-530.
Basit, A. and A.S. Shera, 2008. Prevalence of Metabolicsyndrome in Pakistan. J. Metabolic Syndrome andRelated Disorder, 6: 171-175.
Basit, A., M.Z.I. Hydrie, K. Ahmed and R. Hakeem, 2002.Prevalence of diabetes, impaired fasting glucoseand associated risk factors in a rural area ofBaluchistan province according to new ADA criteria,J. Pak. Med. Assoc., 52: 357-360.
Burden, M.L., A. Samanta, D. Spalding and A.C. Burden,1994. A comparison of the glycaemic andinsulinaemic effects of an Asian and a Europeanmeal. Pract Diabetes Int., 11: 208-211.
Chrysohoou, C., D.B. Panagiotakos, C. Pitsavos, U.N.Das and C. Stefanadis, 2004. Adherence to theMediterranean diet attenuates inflammation andcoagulation process in healthy adults: The ATTICAStudy. J. Am. Coll. Cardiol., 44: 152-158.
Esmaillzadeh, A., P. Mirmiran and F. Azizi, 2005. Whole-grain consumption and the metabolic syndrome: Afavorable association in Tehranian adults. Eur. J.Clin. Nutr., 59: 353-362.
Esmaillzadeh, A., M. Kimiagar, Y. Mehrabi, L. Azadbakht,F.B. Hu and W.C. Willett, 2006. Fruit and vegetableintakes, C-reactive protein and the metabolicsyndrome. Am. J. Clin. Nutr., 84: 1489-1497.
F.B. Hu and W.C. Willett, 2007. Dietary patterns,insulin resistance and prevalence of the metabolicsyndrome in women. Am. J. Clin. Nutr., 85: 910-918.
Grundy, S., J. Cleeman, S. Daniels, K. Donato, R. Eckeland B. Franklin, 2005. Diagnosis and managementof the metabolic syndrome: An American HeartAssociation/National Heart, Lung and BloodInstitute scientific statement. Circulation, 112: 2735-2752.
Gupta, R., A. Misra, P. Pais, P. Rastogi and V.P. Gupta,2006. Correlation of regional cardiovasculardisease mortality in India with lifestyle andnutritional factors. Int. J. Cardiol., 108: 291-300.
Hu, F.B., 2002. Dietary pattern analysis: A new directionin nutritional epidemiology. Current Opinion inLipidology, 13: 3-9.
Hydrie, M.Z.I, A.S. Shera, A. Fawwad, A. Basit and A.Hussain, 2009. Prevalence of metabolic syndromein urban Pakistan: (Karachi): Comparison of newlyproposed IDF and modified ATP III Criterions. J.Metabolic Syndrome Related Disorder, 7: 119-124.
Jafar, T.H., F.H. Jafary, S. Jessani and N. Chaturvedi,2005. Heart disease epidemic in Pakistan: Womenand men at equal risk. Am. Heart J., 150: 221-226.
Jafar, T.H., N. Chaturvedi and Pappas Gregory, 2006.Prevalence of overweight and obesity and theirassociation with hypertension and diabetesmellitus in an Indo-Asian population. Can. MedicalAssoc. J., Vol. 175.
Kris-Etherton, P., R.H. Eckel and B.V. Howard, 2001.AHA Science Advisory: Lyon Diet Heart Study.Benefits of a Mediterraneanstyle, NationalCholesterol Education Program/American HeartAssociation Step I Dietary Pattern on CardiovascularDisease. Circulation, 103: 1823-1825.
Lichtenstein, A.H., L.J. Appel, M. Brands, M. Carnethon,S. Daniels, H.A. Franch, B. Franklin, P. Kris-Etherton, W.S. Harris, B. Howard, N. Karanja, M.Lefevre, L. Rudel, F. Sacks, L. Van Horn, M. Winstonand J. Wylie-Rosett, 2006. Diet and lifestylerecommendations revision 2006: A scientificstatement from the American Heart AssociationNutrition Committee. Circulation, 114: 82-96.
McKeown, N.M., J.B. Meigs, S. Liu, E. Saltzman, P.W.Wilson and P.F. Jacques, 2004. Carbohydratenutrition, insulin resistance and the prevalence ofthe metabolic syndrome in the FraminghamOffspring Cohort. Diabetes Care, 27: 538-546.
Mennen, L.I., L. Lafay, E.J.M. Feskens, M. Novak, P.Lepinay and B. Balkau, 2000. Possible protectiveeffect of bread and dairy products on the risk ofmetabolic syndrome. Nutr. Res., 20: 335-347.

Pak. J. Nutr., 9 (1): 93-99, 2010
99
Misra, A., L. Khurana, S. Isharwal and S. Bhardwaj, Schwerin, H.S., J.L. Stanton, J.L. Smith, A.M. Riley Jr. and2009. South Asian diets and insulin resistance. Br.J. Nutr., 101: 465-473.
Misra, A. and L. Khurana, 2008. Obesity and themetabolic syndrome in developing countries. J.Clin. Endocrinol. Metab., 93 (11 suppl 1): S9-30.
Panagiotakos, D.B., C. Chrysohoou and C. Pitsavos,2003. The prevalence of Clinical and BiomedicalMarkers Related to Cardivascular Disease: Designa Preliminary Results from the ATTICA Study.Hellenic J. Cardiol., 44: 308-316.
Parillo, M. and G. Riccardi, 2004. Diet composition andthe risk of type 2 diabetes: Epidemiological andclinical evidence. Br. J. Nutr., 92: 7-19.
Pereira, M.A., D.R. Jacobs Jr., L. Van Horn, M.L. Slattery,A.I. Kartashov and D.S. Ludwig, 2002. Dairyconsumption, obesity and the insulin resistancesyndrome in young adults: The CARDIA Study.JAMA., 287: 2081-2089.
Popkin, B.M., 2001. The nutrition transition and obesityin the developing world. J. Nutr., 131: 871-3S.
Ramachandran, A., C. Snehalatha, K. Satyavani, S.Sivasankari and V. Vijay, 2003. Metabolic syndromein urban Asian Indian adults- a population studyusing modified ATP III criteria. Diab. Res. Clin.Pract., 60: 199-204.
Randall, E., J.R. Marshall, S. Graham and J. Brasure,1990. Patterns in food use and their associationswith nutrient intakes. Am. J. Clin. Nutr., 52: 739-745.
Sahyoun, N.R., P.F. Jacques, X.L. Zhang, W. Juan andN.M. McKeown, 2006. Whole-grain intake isinversely associated with the metabolic syndromeand mortality in older adults. Am. J. Clin. Nutr., 83:124-131.
Sarkar, S., M. Das, B. Mukhopadhyay, C.S. Chakrabartiand P.P. Majumder, 2006. High prevalence ofmetabolic syndrome and its correlates in two tribalpopulations of India and the impact of urbanization.In. J. Med. Res., 123: 679-686.
Schulze, M.B., J.E. Manson, W.C. Willett and F.B. Hu,2003. Processed meat intake and incidence of Type2 diabetes in younger and middle-aged women.Diabetologia, 46: 1465-1473.
B.E. Brett, 1982. Food, eating habits and health: Afurther examination of the relationship between foodeating patterns and nutritional health. Am. J. Clin.Nutr., 35 (Suppl. 5): 1319-1325.
Schaefer, E.J., 2002. Lipoproteins, nutrition and heartdisease. Am. J. Clin. Nutr., 75: 191-212.
Song, Y., J.E. Manson, J.E. Buring and S. Liu, 2004. Aprospective study of red meat consumption andtype 2 diabetes in middle-aged and elderly women:the women's health study. Diabetes Care, 27: 2108-2115.
Sonnenberg, L., M. Pencina, R. Kimokoti, P. Quatromoni,B.H. Nam, R. D’Agostino, J.B. Meigs, J. Ordovas, M.Cobain and B. Millen, 2005. Dietary patterns and themetabolic syndrome in obese and non-obeseFramingham women. Obes. Res., 13: 153-162.
Trichopoulou, A., T. Costacou, C. Bamia and D.Trichopoulos, 2003. Adherence to a Mediterraneandiet and survival in a Greek population. N. Engl. J.Med., 348: 2599-2608.
Tucker, K.L., G.E. Dallal and D. Rush, 1992. Dietarypatterns of elderly Boston-area residents defined bycluster analysis. J. Am. Diet. Assoc., 92: 1487-1491.
Van Dam, R.M., W.C. Willett, E.B. Rimm, M.J. Stampferand F.B. Hu, 2002. Dietary fat and meat intake inrelation to risk of type 2 diabetes in men. DiabetesCare, 25: 417-424.
Wierzbicki, A.S., S. Nishtar, P.J. Lumb, M. Lambert-Hammill, C.N. Turner, M.A. Crook, M.S. Marber andJ. Gill, 2005. Metabolic syndrome and risk ofcoronary heart disease in a Pakistani cohort. Heart,91: 1003-1007.
Wirfalt, E., B. Hedblad, B. Gullberg, I. Mattisson, C.Andren, U. Rosander, L. Janzon and G. Berglund,2001. Food patterns and components of themetabolic syndrome in men and women: A cross-sectional study within the Malmo Diet and Cancercohort. Am. J. Epidemiol., 154: 1150-1159.
1
Title:Detecting Insulin Resistance in Pakistani Subjects by Fasting Blood Samples
AUTHORS:Author for CorrespondenceM. Zafar Iqbal Hydrie, M.philPhD studentDepartment of International HealthInstitute of General Practice and Community MedicineFaculty of Medicine, University of Oslo, Norway.Email: [email protected] , [email protected] Institute of Diabetology and EndocrinologyPlot No. 1-2, II-B, Nazimabad No2, Karachi-74600Phone: 92 21 36688897, 92 21 36608565, 92 21 36707179Fax: 92 21 36608568
Abdul Basit, F.R.C.P.Professor of Medicine,Department of MedicineBaqai Institute of Diabetology and EndocrinologyBaqai Medical University
Asher Fawwad, M.philAssistant Professor of BiochemistryResearch DepartmentBaqai Institute of Diabetology and EndocrinologyBaqai Medical University
Muhammad Yakoob Ahmedani, FCPS.Professor of Medicine,Department of MedicineBaqai Institute of Diabetology and EndocrinologyBaqai Medical University.
A Samad Shera, F.R.C.P.Honorary President (IDF), Secretary General (DAP),Director WHO Collaborating Centre.Diabetic Association of Pakistan5-E / 3, Nazimabad, Karachi-74600, Pakistan.
Akhtar Hussain, D.ScProfessorUniversity of Oslo, Faculty of MedicineInstitute of General Practice and Community MedicineDepartment of International HealthP.O Box 1130 BlindernN- 0317 Oslo – Norway
2
ABSTRACT:
BackgroundInsulin Resistance has been identified as an independent risk factor for a number of chronic diseases such as diabetes and cardiovascular diseases (CVD).ObjectiveTo identify a simple indirect method for detecting insulin resistance (IR) in our population. Methods: Geographical Imaging Systems (GIS) was used for randomly selecting the subjects. For visiting the 532 households selected by GIS, 9 field teams were developed. A total of 871 subjects older than 25 years were approached by these teams out of which 867 agreed to participate in the survey. IR was assessed in 227 normal subjects by fasting insulin, HOMA-IR, QUICKI and McAuley Index.Results:IR was defined at 75th percentile cut off of insulin levels (9.25 U/mL) and HOMA-IR (1.82).
The 25th percentile cut off was used for defining IR in QUICKI (0.347) and McAuley Index(6.77).Conclusion: A common approach towards managing subjects with metabolic risk factors will help identifyIR earlier and using IR reference values identified from simple indirect methods would be of value in such cases. However larger population based studies are needed to further define and validate these cutoff values for insulin resistance. Key words: Insulin Resistance, Fasting Blood Levels, Metabolic Syndrome, Pakistani,HOMA, QUICKI, McAuley Index
INTRODUCTIONInsulin Resistance (IR) is an acronym for a wide range of metabolic derangements with convincing evidence that it is an independent risk factor for a number of chronic diseases such as diabetes and cardiovascular diseases (CVD). Insulin resistance has also been suggested as the primary cause leading to the clustering of risk factors such as glucose intolerance, hypertension, elevated serum triglycerides, low serum HDL cholesterol and central obesity which together have been labeled as Metabolic syndrome (MS) (1). Elevated insulin levels are believed to accelerate the development of atherosclerosis and isconsidered to be a key cause of cardiovascular pathologies in metabolic syndrome (2-3). High death rates from coronary heart diseases have been associated with insulin resistance and metabolic syndrome (4). It has also been observed that reduction in insulin resistance improves glycaemic control and favourably modifies other components of the metabolicsyndrome (5). Thus diagnosis of insulin resistance at the initial stages of a disease could be used as a effective measure to prevent unfavourable outcome, including reduction of cardiovascular morbidity and mortality. Unfortunately reliable methods for measuring insulin resistance in vivo such as the hyper-insulinemic euglycemic clamp and minimal-model approximation of the metabolism of glucose (MMAMG) are time-consuming, complicated and require expensive equipment for epidemiological research as well as for clinical practice (6 -8).For this purpose insulin resistance indices have been developed based on fasting blood samples (serum insulin and glucose levels) which are used as reference cutoffs defined for various populations (9). The homeostasis model for insulin resistance (HOMA-IR), thequantitative insulin sensitivity check index (QUICKI) and McAuley Index are commonly used surrogate measures from these fasting values and have proven to be a reliable alternative

3
to the glucose clamp studies (8, 10-11). Many studies using these simple indirect methods for detecting insulin resistance have been reported (12-14).Studies done in Pakistani population comparing hypertensive subjects with normal subjects,showed high levels of insulin in hypertensive subjects (p<0.001), likewise children having family history of cardiovascular disease had higher insulin levels compared to children with family history of diabetes, while fasting insulin and cholesterol levels was significantly higher in diabetic subjects compared to controls in another Pakistani study with a p value of <0.01.(15-17).Although the prevalence of metabolic syndrome has been reported in Pakistani population, no population based study measuring insulin resistance in Pakistani adults have been reported to our knowledge (18-20). Because of the lack of information on insulin resistance in our local population we decided to determine the reference cut off values of IR indices from our community based epidemiological study done previously (20).
MATERIALS AND METHODSStudy area and populationThe survey was conducted from July 2004 to December 2004. Geographical Imaging Systems (GIS) was developed for Lyari Town with unique identification numbers ascribed to households and the prevalence of metabolic syndrome was studied by random selection of these households (20).MethodologyThe ethical approval for this survey was given by Institutional Review Board (IRB) of Baqai Institute of Diabetology and Endocrinology. The survey activities were divided into two phases - the household interview plus physical examination and blood sample collection, both have been described in detail previously (20). Nine field teams visited the 532 households which were selected by GIS and approached a total of 871 subjects > 25 years of age out of which 867 agreed to participate in the survey. Anthropometric and demographic information was collected during the interview. Waist and hip circumference was measured and blood pressure taken twice by using mercury sphygmomanometer.
Laboratory assaysAll adults > 25 years were asked to undertake a 10 hours fast for blood tests (fasting blood glucose, lipid profile and insulin levels) for which blood samples were collected on weekends. Blood samples were given by 363 persons out of the 867 adults who took part in the survey.All selected parameters of blood lipids (total cholesterol, triglycerides, HDL- cholesterol and LDL-Cholesterol) and blood glucose estimation was done using auto-analyzer Vitalab Selectra. Fasting blood glucose and lipid profile were done by GOD PAP method and CHOD PAP method respectively.
InsulinFasting insulin was measured by enzyme linked immunosorbent assay (ELISA) based on the sandwich principle. The specificity of antibodies or cross reactivity of the kit to the proinsulin was zero percent. The analytical sensitivity of the assay was found to be 1.76 uIU/ml. Assessing insulin resistanceInsulin resistance was assessed in 227 normal subjects by calculating HOMA, QUICKI and McAuley Index indices as follows:HOMA-R = Insulin (Iu/ml) × glucose (mmol/l)/22.5QUICKI = 1/ [log (fasting insulin) + log (fasting glucose)]McAuley Index = Exp [2.63-028 ln (Insulin in Mu/l)-0.31ln (triglyceride in mmol/l)

4
STATISTICAL ANALYSISCharacteristics of the subjects according to gender were analyzed using an independent sample t-test. Data was presented as quartiles of fasting insulin, HOMA-IR, QUICKI and McAuley index to observe the various percentiles of insulin sensitivity and determine insulin resistance according to defined standard protocols.The statistical analysis was conducted using SPSS for Windows (version13, SPSS Inc., Chicago, IL, U.S.A.), and p<0.05 was considered statistically significant.
RESULTSSubjects with fasting blood sugars < 100 mg/dl were taken as having normal glucose tolerance. A total of 227 normoglycemic subjects (70 men and 157 women) were selected from the survey population.General characteristics of the study participants are shown in Table 1. Females were significantly younger than males with lower waist circumference but higher Body Mass Index (BMI). Mean total cholesterol and LDL cholesterol was higher in females compared to males.Mean fasting insulin and HOMA-IR was also higher in females while other indices of insulin resistance were not much different in males and females. Males had significantly higher blood pressure compared to females.The 75th percentile cut off was used as a value for defining insulin resistance for fasting insulin levels (9.25 U/mL) and for HOMA-IR (1.82) while the 25th percentile was taken as cut off for defining insulin resistance according to QUICKI (0.347) and for McAuley Index (6.77)as shown in Table 2.
DISCUSSIONIn this study females had higher fasting insulin levels compared to males; internationally there are contrasting studies about gender based insulin differences with some showing higher insulin resistance in one gender compared to the other (21). Researchers have suggested that a fasting insulin level at 75th percentile cutoff is accurate at predicting insulin resistance in normal non diabetic population in some studies (4,9). Fasting insulin levels at 75th percentile was thus used as a cut off value in this study and this value lies within the range observed in other studies (4,9,22). In 1985 Matthews was one of the pioneers to define HOMA-IR as a simple and reliable method for estimating insulin sensitivity from fasting plasma glucose and insulin levels (11). HOMA-IR values between 1.21 and 1.45 were reported for normal subjects by Matthews (11).Many large population-based studies have used HOMA-IR to assess insulin sensitivity and reported HOMA-IR to be around 2.6 on the basis of the 75th percentile (4,10,13,14). However lower HOMA-IR values have been observed in south asians with an Indian study reporting HOMA-IR to be 1.93 at the 75th
Other researchers suggested QUICKI to be a better surrogate measure of insulin resistance than HOMA-IR (12). The 25th percentile value of QUICKI was 0.347 in our study which lies within the range reported for normal populations (0.33-0.372) by other researchers (4, 24).
percentile while in our study it was observed to be even lower at 1.82 (23).
It has been suggested by some that incorporating triglycerides in asian subjects increases the likelihood of identifying insulin resistance (25). The index proposed by McAuley for the diagnosis of insulin resistance incorporates triglycerides in its formula (9). Thus we calculated McAuley index on the basis of the 25th percentile and in our study the cutoff of McAuley index was 6.77. Thus we calculated the cut off values for defining insulin resistance in our population by using simple fasting blood levels of insulin and glucose.
5
However our study had a few limitations. Firstly, the diagnosis of insulin resistance was based only on a single test of fasting blood glucose and insulin levels. Hyperinsulinemic euglycemicclamp studies were not performed to correlate the findings of indirect methods of insulinresistance with the gold standard test in this case. However, WHO has suggested that the 75th
percentile cutoff of insulin can be used for epidemiological studies, which was done in this study (26). Although the sample size was small and generalizing the cutoff values for Pakistani population have to be taken with caution, the randomization of the sample was done by GIS which reduces bias in sample selection. Thirdly, although insulin assays can varyconsiderably depending on cross-reaction with proinsulin, in this study human insulin-specific radioimmunoassay was used which has no significant cross-reactivity with proinsulin thereby minimizing the interference by proinsulin (27).Determining cutoff values of IR by indirect measures could help in identifying insulin resistant subjects in clinical practice on account of their simplicity and clinicians may be able to use this simple test as an initial screening tool to identify such subjects. Thus clinicians may intervene earlier in insulin resistant subjects to prevent the development of type 2 diabetes, hypertension and cardiovascular diseases in such subjects. However since the values are not universally applicable because of the variability of values studied in different populations we need to have specific population based studies and this was such an attempt in the Pakistani population. Studies have shown that when compared with the insulin sensitivity value obtained by the MMAMG method the sensitivity of McAuley was observed to be significantly higher than that of HOMA-IR or QUICKI (4,9). However HOMA-IR has been most widely studied as an indirect method for IR and has been considered by many researchers to be a good measure of IR (4,7).Although determining insulin resistance by indirect methods is difficult due to the variability of results, but the cut off values of IR determined can be used as a measure of insulin resistance in Pakistani adults.It is hoped that a common approach towards managing subjects with metabolic risk factors by using a single cutoff value will help save time and improve clinical assessment by identifying such cases of insulin resistance earlier. Secondly the clinical focus may shift from identifying the various risk factors separately towards identifying insulin resistance by using reference values measured from these simple indirect methods.However larger population based studies are needed to further define and validate these cutoff values for insulin resistance in this south asian population.
ACKNOWLEDGEMENTSWe acknowledge the support of Merck Pakistan for lab tests, the hard work and dedicated commitment of the medical students and social workers of the Lyari Community Development Project that made this study possible and the Norwegian Research Council for financing.

6
REFERENCES
1. Reaven GM. Banting lecture Role of insulin resistance in human disease. Diabetes 1988; 37: 1595-607.
2. Despres JP, Lamarche B, Mauriege P, Cantin B, Dagenais GR, Moor-jani S et.al.Hyperinsulinemia as an independent risk factor for ischemic heart disease. N Engl J Med 1996; 334: 952-7.
3. Facchini FS, Hua N, Abbasi F, Reaven GM. Insulin resistance as a predictor of age-related diseases. J Clin Endocrinol Metab 2001;86: 3574-8.
4. Ascaso JF, Pardo S, Real JT, Lorente RI, Priego A, Carmena R. Diagnosing insulin resistance by simple quantitative methods in subjects with normal glucose metabolism. Diabetes Care 2003; 26: 3320-5.
5. IDF Press Conference: The IDF consensus worldwide definition of the metabolic syndrome. Available from: URL: http://www.idf.org/webdata/docs/IDF_Metasyndrome_definition.pdf. [Accessed 3 February 2006].
6. Vijay J, Eric SK, Paul EJ, David AH, Stephen LA, Biological Variation of Homeostasis Model Assessment-Derived Insulin Resistance in Type 2 Diabetes . Diabetes care vo25 number11, nov 2002
7. DeFronzo RA, Toin JD, Andres R. Glucose clamp technique: A method for quantifying insulin secretion and resistance. Am J Physiol1979; 237: 214-23.
8. Zofia R. Assessment of insulin sensitivity/resistance in epidemiological studies, Endocrineregulations, VOL. 37, 189–194, 2003.
9. McAuley KA, Williams SM, Mann JI, Walker RJ, Lewis-BarnedNJ, Temple LA, et.al.Diagnosing insulin resistance in the general population. Diabetes Care 2001; 24: 460-4.
10. Hanson RL, Pratley RE, Bogardus C, et al. Evaluation of simple indices of insulin sensitivity and insulin secretion for use in epidemiologic studies. Am J Epidemiol. 2000;151:190-198
11. Matthews DR, Hosker JP, Rudenski AS, Naylor BA, Treacher DF,Turner RC. Homeostasis model assessment: insulin resistance and beta-cell function from fasting plasma glucose and insulin concentration in man. Diabetologia 1985; 28: 412-9.
12. Katz A, Nambi SS, Mather K, Baron AD, Follmann DA, SullivanG, et.al.Quantitative insulin-sensitivity check index: A simple, accurate method for assessing insulin sensitivity in humans. J Clin Endocrinol Metab 2000; 85: 2402-10.
13. Bonora E, Kiechl S, Willeit J, Oberhollenzer F, Egger G, TargherG, et.al. Prevalence of insulin resistance in metabolic disorders: the Bruneck Study. Diabetes 1998;47: 1643-9.

7
14. Yeni-Komshian H, Carantoni M, Abbasi F, Reaven GM. Relationship between several surrogate estimates of insulin resistance and quantification of insulin-mediated glucose disposal in 490 healthy non-diabetic volunteers. Diabetes Care 2000; 23: 171-5.
15. Bano AK, Begum M, Hussain R. Fasting blood level of insulin in non-obese and non-diabetic patients with essential hypertension Pakistan J Med Res Mar 2004;43(1):5-7.
16. M. Z.I. Hydrie, A. Basit, N. Badaruddin , M.Y. Ahmedani. Diabetes risk factors in middleincome Pakistani school children. Pakistan Journal of Nutrition 3(1): 2004; 43-49
17. Butt IF, Aslam M, Khan FA, Ayub M. Plasma Insulin and Platelet Functions in Diabetes Mellitus J Coll Physicians Surg Pak May 2000;10(5):182-4.
18. Zahid N, Claussen B, Hussain A. High prevalence of obesity, dyslipidemia and metabolic syndrome in a rural area in Pakistan Diabetes & Metabolic Syndrome: Clinical Research & Reviews (2008) 2, 13 - 19,
19. Basit A. Shera AS. Prevalence of Metabolic syndrome in Pakistan. Journal of Metabolic Syndrome & Related Disorder, 2008, 6(3):171-175.
20. Hydrie MZI, Shera AS, Fawwad A, Basit A, Hussain A. Prevalence of MetabolicSyndrome in Urban Pakistan: (Karachi): Comparison of newly proposed IDF and modified ATP III Criterions. Journal of Metabolic Syndrome & Related Disorder 2009; 7(2):39-44
21. Mittendorfer B. Insulin resistance: sex matters. Curr Opin Clin Nutr Metab Care 2005; 8: 367-72
22. Acosta AM, Escalona M et al. Determination of the insulin resistance index. Rev Med Chil. 2002 Nov; 130(11):1227-31
23. Deepa R, Shanthirani CS, Premalatha G, Sastry NG, Mohan V.Prevalence of insulin resistance syndrome in a selected south Indian population--the Chennai Urban population study-7 [CUPS-7]. Indian J Med Res 2002;115:118-127.
24. Hrebicek J, Janout V, Malincikova J, Horakova D, Cizek L. Detection of insulin resistance by simple quantitative insulin sensitivity check index QUICKI for epidemiological assessment and prevention.J Clin Endocrinol Metab 2002; 87: 144-7.
25. Snehalatha C, Satyavani K, Sivasankari S, Vijay V, Ramachandran A: Serum triglycerides as a marker of insulin resistance in non-diabetic urban Indian. Diabetes Res Clin Prac 69:205–206, 2005
26. Alberti KG, Zimmer PZ. Definition, diagnosis and classification of diabetes mellitus and its complications: Part 1: diagnosis and classification of diabetes mellitus provisional report of a WHO Consultation. Diabet Med 1998; 15: 539-53.
27. Robbins DC, Andersen L, Bowsher R, Chance R, Dinesen B, FrankB, et.al. Report of the American Diabetes Associations task force on standardization of the insulin assay. Diabetes 1996; 45: 242-56.
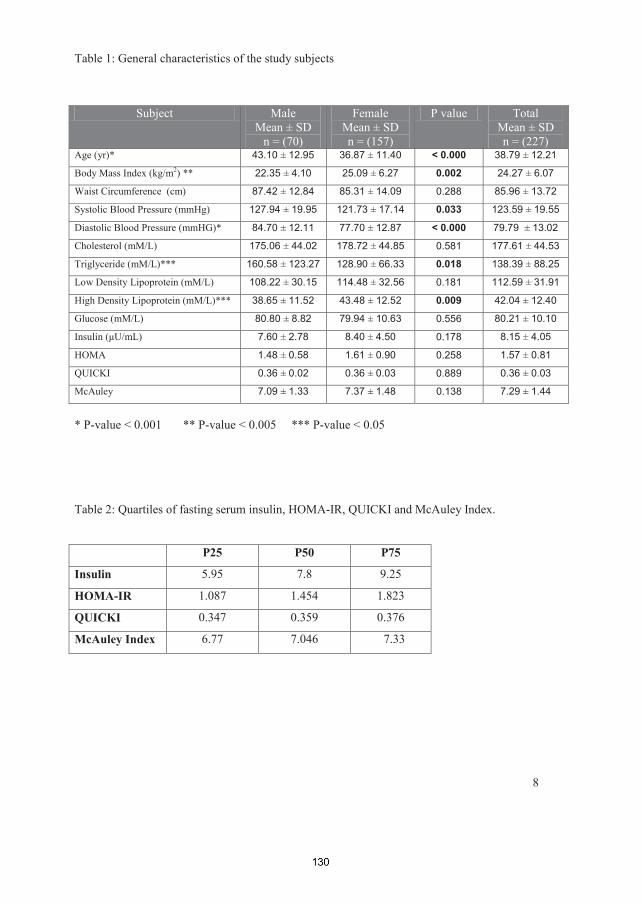
8
Table 1: General characteristics of the study subjects
* P-value < 0.001 ** P-value < 0.005 *** P-value < 0.05
Table 2: Quartiles of fasting serum insulin, HOMA-IR, QUICKI and McAuley Index.
P25 P50 P75
Insulin 5.95 7.8 9.25
HOMA-IR 1.087 1.454 1.823
QUICKI 0.347 0.359 0.376
McAuley Index 6.77 7.046 7.33
Subject MaleMean ± SD
n = (70)
FemaleMean ± SDn = (157)
P value TotalMean ± SDn = (227)
Age (yr)* 43.10 ± 12.95 36.87 ± 11.40 < 0.000 38.79 ± 12.21
Body Mass Index (kg/m2) ** 22.35 ± 4.10 25.09 ± 6.27 0.002 24.27 ± 6.07
Waist Circumference (cm) 87.42 ± 12.84 85.31 ± 14.09 0.288 85.96 ± 13.72
Systolic Blood Pressure (mmHg) 127.94 ± 19.95 121.73 ± 17.14 0.033 123.59 ± 19.55
Diastolic Blood Pressure (mmHG)* 84.70 ± 12.11 77.70 ± 12.87 < 0.000 79.79 ± 13.02
Cholesterol (mM/L) 175.06 ± 44.02 178.72 ± 44.85 0.581 177.61 ± 44.53
Triglyceride (mM/L)*** 160.58 ± 123.27 128.90 ± 66.33 0.018 138.39 ± 88.25
Low Density Lipoprotein (mM/L) 108.22 ± 30.15 114.48 ± 32.56 0.181 112.59 ± 31.91
High Density Lipoprotein (mM/L)*** 38.65 ± 11.52 43.48 ± 12.52 0.009 42.04 ± 12.40
Glucose (mM/L) 80.80 ± 8.82 79.94 ± 10.63 0.556 80.21 ± 10.10
7.60 ± 2.78 8.40 ± 4.50 0.178 8.15 ± 4.05
HOMA 1.48 ± 0.58 1.61 ± 0.90 0.258 1.57 ± 0.81
QUICKI 0.36 ± 0.02 0.36 ± 0.03 0.889 0.36 ± 0.03
McAuley 7.09 ± 1.33 7.37 ± 1.48 0.138 7.29 ± 1.44

Effect of intervention in subjects with high risk of Diabetes Mellitus in Pakistan.
Running title:Effect of intervention in high risk subjects of DM in Pakistan
Author List : Author for CorrespondenceHydrie M Z I,PhD studentSection of International HealthDepartment of Community MedicineInstitute of Health and SocietyFaculty of Medicine, University of Oslo, Norway.Contact:Email: [email protected] , [email protected] Institute of Diabetology and EndocrinologyPlot No. 1-2, II-B, Nazimabad No2, Karachi-74600Phone: +47-45009204, +9221- 36707179Fax: +9221-36608568
Basit A,Professor of Medicine,Department of MedicineBaqai Institute of Diabetology and EndocrinologyBaqai Medical UniversityPlot No. 1-2, II-B, Nazimabad No2, Karachi-74600
Shera S A,Honorary President (IDF), Secretary General (DAP),Director WHO Collaborating Centre.Diabetic Association of Pakistan5-E / 3, Nazimabad, Karachi-74600, Pakistan.
Hussain AProfessorUniversity of Oslo, Faculty of MedicineInstitute of Health and SocietyDepartment of Community MedicineSection of International HealthP.O Box 1130 BlindernN- 0317 Oslo – Norway

Abstract:
Aims: The aim of the study was to observe the rate of conversion from impaired glucose
tolerance (IGT) to diabetes following lifestyle modification program and a combination of
lifestyle modification and oral hypoglycaemic agent (metformin) compared to a control
population with 18 months follow up.
Methods: Around 40 screening camps were organized at places such as organizations,
factories and health care centre. Nearly 5000 people attended lectures and visited the
screening camps. Of these 2300 filled a high risk questionairre and 1825 subjects over 30
years of age were identified as high risk. They were requested to undertake an oral glucose
tolerance test (OGTT). Out of these 1739 subjects took the OGTT and 317 subjects were
identified as having impaired glucose tolerance (IGT). They were randomized into three
groups. First group was given standard medical advice (Control Group), second group was
given intensive lifestyle modification advice (LSM Group) while third group was given
intensive lifestyle modification advice and metformin 500mg twice daily (LSM+Drug
Group).
Results: At the end of the study 273 subjects completed the study giving a compliance rate of
86%. A total of 47 incident cases of diabetes were diagnosed during the study. The overall
incidence of diabetes was 4 cases per 1000 person-months with the incidence of diabetes as
8.6 cases in the control group, 2.5 cases in the Life Style Modification (LSM) group and 2.3
cases in the LSM+drug group.
Conclusions This study showed that lifestyle intervention had a major impact in preventing
diabetes among IGT subjects in this region. However, addition of drug in the intervention did
not show any improved results. Resource constrain societies are challenged with the
additional burden of diabetes cost on their already ailing economy. Therefore, we recommend
that lifestyle modification advice and follow-up should be incorporated in primary health care.
Keywords: IGT, primary prevention, diabetes, lifestyle intervention, metformin.
Introduction:The prevalence of diabetes is increasing globally and the burden of the disease is making it one of the most challenging public health problem of the 21st century with Asia as the epicentre (1;2). It is increasing in epidemic proportions with one person developing diabetes every five seconds globally (1;2). Once diabetes develops it causes disability, increased health costs to the person and reduced life expectancy with somebody dying from diabetes every ten seconds in the world (2). Thus diabetes is a chronic debilitating disease causing life long complications such as heart disease, blindness, kidney damage and foot amputations. The most dramatic increase in type 2 diabetes is occuring in genetically predisposed populations where rapid and major lifestyle changes are taking place. These include changes in diet and reduction in physical activity, with consequent increase in the prevalence of obesity leading to increased burden of diabetes (2;3). Diabetes leads to increased morbidity and mortality, with the only way to reduce this is to prevent it from developing.
Randomized controlled trials have shown that progression to diabetes can be reduced in people at identifiable risk through interventions (2-4). Thus evidence from clinical trials suggest that subjects at risk of developing diabetes can prevent or delay the onset of type 2 diabetes by lifestyle modification or medication (2;3). A number of studies done in China, Finland, USA and India have demonstrated the importance of healthier lifestyle in preventingor reducing the occurrence of diabetes (3;5-9). The collective results of such prevention studies showed an average reduction of 51% in new cases of diabetes (4). Studies from Finland and USA showed that the most powerful way to prevent the occurrence of diabetes was to modify lifestyle condusive to improved metabolic health (6-8).
Most intervention studies targeted diabetes prevention by achieving and maintaining a healthy body weight through a combination of dietary measures and physical activity in high risk subjects (2). However, based on genetics and defining cardio-metabolic state including level of obesity, fat deposition pattern and dietary habits in different populations, this intervention strategy may need to be revised. For example, different ethnic groups have different body mass index (BMI) cutoffs which may have a varied effect on intervention as evident in the Indian study where risk reduction rate of 28% was seen compared to 58% risk reduction of diabetes in the Finnish and USA studies (7-10).
One limitation of the study in India was that the subjects were recruited from the local railway company and most of them were vegeterians. South Asians are a heterogenous group based ondifferent religious and cultural practices including food habits and they are genetically different. Studies have also noted dietary differences within the ethnic groups in South Asians(11;12). For example, the diet of South Asians (mainly Punjabi) studied in Scotland was found to have large differences between Muslim and non-Muslim groups, with Muslims more likely to eat meat and less likely to eat fruit and cooked vegetables than non-Muslims (13).This difference was also seen in another study between Muslims and Hindus (probably due to their vegetarianism) (14). This difference in diet due to ethnicity and religion may have a effect on intervention strategies and needs to be further explored to better understand the effect of intervention programs in these communities.
Therefore we conducted this intervention study in the largest city (Karachi) of Pakistan amongst the general population where most of the people were muslim and non vegeterian.The main aim of the study was to observe the rate of conversion from IGT to diabetes following lifestyle modification program and a combination of lifestyle modification and oral
hypoglycaemic agent (metformin) compared to a control population with 18 months follow up.
Methodology:Location:Karachi is the largest and most populous city of Pakistan. All the major ethnic groups of the country are represented here with Muhajirs forming the dominant ethnic group in Karachi.Our primary prevention team visited different primary health care centres within the city togenerate awareness and distributed educational leaflets about our primary prevention program.
Study ProcedureA number of strategies starting with opportunistic screening at 2 different out patient clinics was adopted to secure participation of the general population and create awareness about diabetes prevention. With the aim to reach a larger audience our diabetes prevention team arranged a series of 2-days awareness lectures at various places in the city by going to offices, service organizations, factories and visiting health care centres. Lectures on diabetes and its prevention were delivered by the prevention team in local language to the audience on the first day. The audience were asked to fill a risk questionnaire at the end of the first day. On the second day, screening of high risk subjects was done according to results of the questionnaire and all high risk subjects were invited for an OGTT. During the time OGTT was done, all the subjects underwent a detailed anthropometric and medical examination as well as been asked about their socio-demographic, physical activities and dietary habits including information on quantity and quality of meals by a dietician and physical trainer.
Design of the study:This was a randomized clinical trial (RCT) conducted in subjects over 30 years of age who were diagnosed as having IGT according to World health Organization criteria (15). The IGT subjects were followed for a period of 18 months prospectively.
A questionnaire was filled as the first step to identify subjects from the overall population who may be at an increased risk of developing type 2 diabetes. . This standardized questionnaire included (a) family history (parents or siblings with diabetes), (b) high body mass index, (c) low physical activity, (d) age, (e) hypertension, (f) high cholesterol or triglycerides (g) history of gestational diabetes or birth weight > 3.5 Kgs. Those identified as high risk (n=1825) were requested to undergo an Oral Glucose Tolerance Test (OGTT). Of these 1739 came for the OGTT giving a response rate of 95.3%. Subjects with 2 hour glucose levels between 140 to 199 mg/dl were identified as having impaired glucose tolerance (IGT)and were requested to participate in the study. Those who were diagnosed with diabetes (n=181) were referred to respective hospitals for further medical care.
After taking informed consent, the participants were randomized by age stratas (31- 40 years, 41–50 years, 51–60 years and > 60 years) into three different arms. This was to ensure equal age representation in all the arms of the intervention. The three groups as shown in the flowchart were followed for 18 months (Figure 1). First group was given standard medical advice (Control Group), second group was given intensive lifestyle modification advice (LSM Group) while third group was given intensive lifestyle modification advice and metformin(LSM+Drug Group).

SubjectsAn estimated 5000 people attended the diabetes prevention lectures and visited the screening camps. Of these 2300 filled a high risk questionairre and 1825 were identified as high risk subjects which were requested to undertake a standardized oral glucose tolerance test (OGTT). Around 1739 agreed and out of these 317 subjects were identified as having impaired glucose tolerance (IGT group).
Of the 1739 subjects who underwent OGTT, 72% were males, 10.4% were found to have diabetes and 18% were having impaired glucose tolerance (IGT). The baseline characteristics of the 1739 subjects showed an increasing trend in terms of age, BMI, and blood pressure from NGT to DM as shown in table 1 below.
InvestigationsAll IGT subjects had fasting lipid profile, fasting insulin levels, OGTT and HbA1c done at 0, 9 and 18 months. At the interim 9-month visit, confirmation of diabetes was made with OGTT. Plasma glucose was measured using the glucose oxidase–peroxidase method. The fasting serum lipid profile was estimated using standard enzymatic procedures. HbA1c was measured by HPLC using Biorad, a procedure certified by the National Glycohemoglobin Standardization Program. Weight, height, waist circumference and blood pressure were measured at each scheduled visit. All the subjects in the IGT cohort were seen after the OGTT tests and randomized into one of the three groups at baseline (0 week). They were followed according to their assigned groups and seen every two months by the primary prevention team. At 9 and 18 months blood tests were done to confirm their glucose status and assess their biochemical parameters. Weight and height was measured with the subjects minimally clothed, without shoes, in a standing position. Waist circumference was measured at the mid-point between the iliac crest and the costal arch. Blood pressure was measured twice, 5 min apart, in a sitting position, and the average of the two readings were recorded.
Intervention and RandomizationAll subjects who agreed to participate in the study were randomized into three groups as shown in figure 1. The subjects assigned to their respective groups were followed till the endof the study.
Subjects in the intervention group were given detailed advice about how to achieve the intervention goals, which included reduction of > 5 % of body weight loss via diet control and physical exercise, total fat intake less than 30% of energy consumed, fiber intake of 15g/1000 kcal, and moderate exercise for minimum 30 min/day. Frequent ingestion of wholemeal products, vegetables and fruits, low-fat milk and meat products, and vegetable oils rich in monounsaturated fatty acids was recommended. The subjects had sessions with a dietician and physical trainer at each visit and they were individually counselled to increase their level of physical activity. Endurance exercises such as walking, jogging and cycling were recommended to improve fitness. Supervised, individually tailored training advice was also offered to improve the physical fitness of each individual. These interventions were based on reinforcing behaviour modification via diet change and encouraging physical activity in each subject.
Subjects in the control group were given general diet and exercise information at baseline and followed at subsequent visits but no specific individual counselling was done. While subjects in the intervention+drug groups were also seen every 2 months by a medical doctor for their drug adherence.
Follow-upReinforcement and counselling was done every 2 months in all groups with the intensive groups seen by the medical officer, dietician and physical trainer, while the control group seen only by the medical officer as described in detail elsewhere (16).
Primary Outcome:The primary outcome was defined as developing diabetes indicated by either fasting plasma glucose of (> 125 mg\dl) and \or 2-hours plasma glucose of (>199 mg\dl) confirmed at 9 & 18 months follow-up by an OGTT (15). Subjects identified as having diabetes were excluded from the study and given medical advice with referral to physicians for further follow-up.
EthicsThe project was approved by BIDE ethics committee and the Norwegian Research Council.All high risk subjects gave written informed consent at the start of the study. Records were kept for any adverse effects occurring during the course of the study.
StatisticsMean and standard deviation were reported for continuous variables and inter-group comparisons were tested by two tailedanalysis. The proportion of subjects developing diabetes in each group and their comparison
For the intervention measures, the absolute and relative risk reductions and 95% CIs of the estimates and the number needed to treat to prevent diabetes in one person were calculated. A p value <0.05 was considered significant. The statistical package SPSS (PASW Statistics 18) was used for analyses.
Results:The IGT subjects (317) were randomized into three groups as shown in table 2. More than half (56%) of the subjects were between 30-44 years of age in the IGT cohort while 36% of the subjects were unskilled\skilled manual labourers. Positive family history of diabetes, hypertension, cardiovascular disease and stroke was present in 49%, 38%, 31% and 17% of the subjects respectively while 25% had hypertension at the start of the study.
During the course of the study, the mean body weight and waist circumference decreased in the LSM and LSM+Drug groups while it increased in the control group as shown in figure 2 and 3.
At the end of the study 273 subjects completed the study giving a response rate of 86%. Atotal of 47 incident cases of diabetes were diagnosed during the study; 19 cases at 9 months and 28 cases at 18 months or closure of the study. The overall incidence of diabetes was 4cases with 8.6 cases in the control group, 2.5 cases in the Life Style Modification (LSM) group and 2.3 cases per 1000 person-months in the LSM+drug group as shown in table 3. The numbers to be treated to prevent one incident case of diabetes was 9 and 8 in lifestyle and LSM+Drug groups respectively.
Adverse Events:Overall 44 subjects dropped out or were lost to follow up. In the control group there were 2 deaths while 24 subjects dropped out during the study. In the lifestyle modification group 8 subjects refused to continue the study and dropped out. In the LSM+Drug group 5 subjects stopped taking the drug either due to side effects of the drug such as gastrointestinal problems
or complaining of weakness probably due to hypoglycemia while 5 subjects refused to follow due to personal reasons and were lost to follow up.Discussion: Our data suggest that lifestyle intervention is highly effective in preventing high risk individuals (IGT) from conversion to diabetes in this population. Adding oral hypoglycaemic agent (metformin) in addition to lifestyle modification was not found to be advantagious for the prevention. Our data is in line with the previous studies done in other population (6-9).
The progression rate of IGT to diabetes in our control subjects was lower compared to Indian and Chinese controls (8.2% per 12 months compared to 18.3% and 11.3% per 12 monthsrespectively) (5;9). But this was significantly higher than seen in the Finnish (6% per year)and DPP (11 per 100 person-years) studies (5;7;8). All subjects in the control group also received general health advice about diet, nutrition and exercise at baseline and at subsequent follow-up visits. This may have helped to increase their awareness about their diabetes risk and some subjects may have benefited from the advice or made subsequent lifestyle modifications due to this. A absolute reduction of 10.7/100 was seen in the intensive lifestyle group, which was greater than seen in IDPP (15.7/100) (9). More number of subjects were needed to treat in order to prevent one case of diabetes in the intensive group (9 vs 6.4) in our study compared to IDPP (9).
Looking at the baseline characteristics it appears that our subjects were similar in age as other Asian studies (Mean age Indian 45.9±5.7 years, Chinese 45±9.1 years and ours 43.6±9.9years) but had comparatively higher BMI (kg/m2) (Indian 25.8±3.5, Chinese 25.8±3.8 and ours 27.1±5.0) (5;9). However our subjects were still younger and leaner compared to the Finnish (age 55±7.0 years, BMI 31±4.6) and the American subjects (age 50.6±10.7 years, BMI 34±6.7) (6;8). The follow-up period in our study was nearly half in duration (only 18 months) compared to the Indian, American and Finnish studies (6-8).
In our study the progression of IGT to diabetes was comparable to other Asian studies and it showed the effectiveness of lifestyle modification involving moderate physical activity and diet modification to prevent diabetes in this population. Adding metformin had an additional benefit but its impact was quite small with the relative risk reduction of 5.5%, from 71% to 76.5% in the lifestyle modification+drug group. This difference was not found to be statistically significant.
Our results showed that to reduce the burden of diabetes epidemic, effective primary prevention can be achieved through lifestyle modification. Therefore, it is suggested that necessary policy development on the prevention of diabetes should emphasis on the lifestylemodification. Recent Updates from the China DaQing Prevention Study, the Finnish Diabetes Prevention Study, the American Diabetes Prevention Programme Outcome Study and the Look Ahead Study have all shown that the most efficient way to manage diabetes and its complications is to prevent diabetes in the first place. This in turn has lead to policy documents from expert organizations such as The Disease Control Priorities project (DCP-2), the European Society of Cardiology and European Association for the Study of Diabetes, the Canadian Diabetes Association, the American Diabetes Association, and the International Diabetes Federation, all recommending lifestyle changes such as weight loss and increased physical activity for the prevention of T2DM among those with pre-diabetes (2;9;17-21).
The main motivation for the prevention of type 2 diabetes is that it can prevent or delay the onset of diabetes and its complications, thereby reducing the life entrenched financial burden
and unnecessary human sufferings of diabetes on both the individual and on the society at large. Developing countries have to face this additional burden on their already ailing economy (22;23); therefore, primary prevention programmes need to become a integral part of Primary Health Services and strategies for reducing the diabetes burden at all levels.Acknowledgement: We acknowledge the support of the many people in various organizations who agreed to participate in our program, the hard work and dedicated commitment of the members of our primary prevention team and participants of the prevention program who made this study possible and the Norwegian Research Council for financing.
Reference List
(1) International Diabetes Federation. The Diabetes Atlas, e-Atlas. 2011. Ref Type: Online Source
(2) Alberti KG, Zimmet P, Shaw J. International Diabetes Federation: a consensus on Type 2 diabetes prevention. Diabet Med 2007 May;24(5):451-63.
(3) Hussain A, Claussen B, Ramachandran A, Williams R. Prevention of type 2 diabetes: A review. Diabetes Research and Clinical Practice 2007 Jun;76(3):317-26.
(4) Marrero DG. The prevention of type 2 diabetes: an overview. J Diabetes Sci Technol 2009;3(4):756-60.
(5) Pan XR, Li GW, Hu YH, Wang JX, Yang WY, An ZX, et al. Effects of diet and exercise in preventing NIDDM in people with impaired glucose tolerance - The Da Qing IGT and diabetes study. Diabetes Care 1997 Apr;20(4):537-44.
(6) Lindstrom J, Louheranta A, Mannelin M, Rastas M, Salminen V, Eriksson J, et al. The Finnish Diabetes Prevention Study (DPS): Lifestyle intervention and 3-year results on diet and physical activity. Diabetes Care 2003 Dec;26(12):3230-6.
(7) Tuomilehto J, Lindstrom J, Eriksson JG, Valle TT, Hamalainen H, Ilanne-Parikka P, et al. Prevention of type 2 diabetes mellitus by changes in lifestyle among subjects with impaired glucose tolerance. N Engl J Med 2001 May 3;344(18):1343-50.
(8) Knowler WC, Barrett-Connor E, Fowler SE, Hamman RF, Lachin JM, Walker EA, et al. Reduction in the incidence of type 2 diabetes with lifestyle intervention or metformin. New England Journal of Medicine 2002 Feb 7;346(6):393-403.
(9) Ramachandran A, Snehalatha C, Mary S, Mukesh B, Bhaskar AD, Vijay V. The Indian Diabetes Prevention Programme shows that lifestyle modification and metformin prevent type 2 diabetes in Asian Indian subjects with impaired glucose tolerance (IDPP-1). Diabetologia 2006 Feb;49(2):289-97.
(10) Misra A, Misra R, Wijesuriya M. Type 2 Diabetes in South Asians. Epidemiology,Risk Factors and Prevention. In: Mohan V, Rao Gundu, editors. The metabolic syndrome in South Asians. 2007 ed. Jaypee Bros; 2011. p. 76-96.
(11) Malhotra SL, Majumdar RS. Heart disease in Asians. BMJ 1988 Oct 15;297(6654):977.
(12) Bhopal R. What is the risk of coronary heart disease in South Asians? A review of UK research. J Public Health Med 2000 Sep;22(3):375-85.
(13) Williams R, Bhopal R, Hunt K. Coronary risk in a British Punjabi population: comparative profile of non-biochemical factors. Int J Epidemiol 1994 Feb;23(1):28-37.
(14) Bose K, Mascie-Taylor CGN. The association between age, smoking, physical activity and diet with total cholesterol in adult Caucasian and migrant Pakistani males. Bulletins et M+®moires de la Soci+®t+® d'anthropologie de Paris 1997;267-78.
(15) Gavin JR, Alberti KGMM, Davidson MB, DeFronzo RA, Drash A, Gabbe SG, et al. Report of the Expert Committee on the diagnosis and classification of diabetes mellitus. Diabetes Care 2000 Jan;23:S4-S19.
(16) Faisal F, Asghar S, Hydrie M Z I, Fawwad A, Basit A, Shera A S, et al. Depression and Diabetes in High-Risk Urban Population of Pakistan. The Open Diabetes Journal 2010;3:1-5.
(17) Lindstrom J, Ilanne-Parikka P, Peltonen M, Aunola S, Eriksson JG, Hemio K, et al. Sustained reduction in the incidence of type 2 diabetes by lifestyle intervention: follow-up of the Finnish Diabetes Prevention Study. Lancet 2006 Nov 11;368(9548):1673-9.
(18) Ryden L, Standl E, Bartnik M, Van den Berghe G, Betteridge J, de Boer MJ, et al. Guidelines on diabetes, pre-diabetes, and cardiovascular diseases: executive summary. The Task Force on Diabetes and Cardiovascular Diseases of the European Society of Cardiology (ESC) and of the European Association for the Study of Diabetes (EASD). Eur Heart J 2007 Jan;28(1):88-136.
(19) Canadian Diabetes Association 2008 Clinical Practice Summary for the Prevention and Management of Diabetes in Canada. 2011.
Ref Type: Generic
(20) Orozco Leonardo J, Buchleitner Ana Maria, Gimenez-Perez Gabriel, Roqué i Figuls Marta, Richter Bernd, Mauricio Didac. Exercise or exercise and diet for preventing type 2 diabetes mellitus. DOI: 10.1002/14651858.CD003054.pub3 [3]. 2011. John Wiley & Sons, Ltd.
Ref Type: Online Source
(21) Narayan KM, Zhang P, Kanaya AM. Disease Control Priorities in Developing Countries. Diabetes: The Pandemic and Potential Solutions. 2nd ed. New York: Oxford Investment Press; 2006. p. 591-604.
(22) Within-trial cost-effectiveness of lifestyle intervention or metformin for the primaryprevention of type 2 diabetes. Diabetes Care 2003 Sep;26(9):2518-23.
(23) Lindgren P, Lindstrom J, Tuomilehto J, Uusitupa M, Peltonen M, Jonsson B, et al. Lifestyle intervention to prevent diabetes in men and women with impaired glucose tolerance is cost-effective. Int J Technol Assess Health Care 2007;23(2):177-83.

FIGURE 1: Flowchart with recruitment of persons for the oral glucose tolerance test(OGTT) and screening and randomisation.
5000 subjects attended the awareness lectures
2300 Subjects filled the High risk questionairre
1825 Subjects were identified for screening (July 2006 – April 2008)
2 hrs Oral Glucose Tolerance Test (OGTT) undertaken in 1739 (men = 1252 : women =487)
Control Group (n = 108) ILSM Group (n = 114)
Normoglycaemia (n = 1241)(71.4% Excluded)
IGT n = 317, (18.2%)men : women 237:80
Diabetes (n = 181)(10.4% Excluded)
ILSM + Drug Group (n = 95)Metformin 500 mg BD
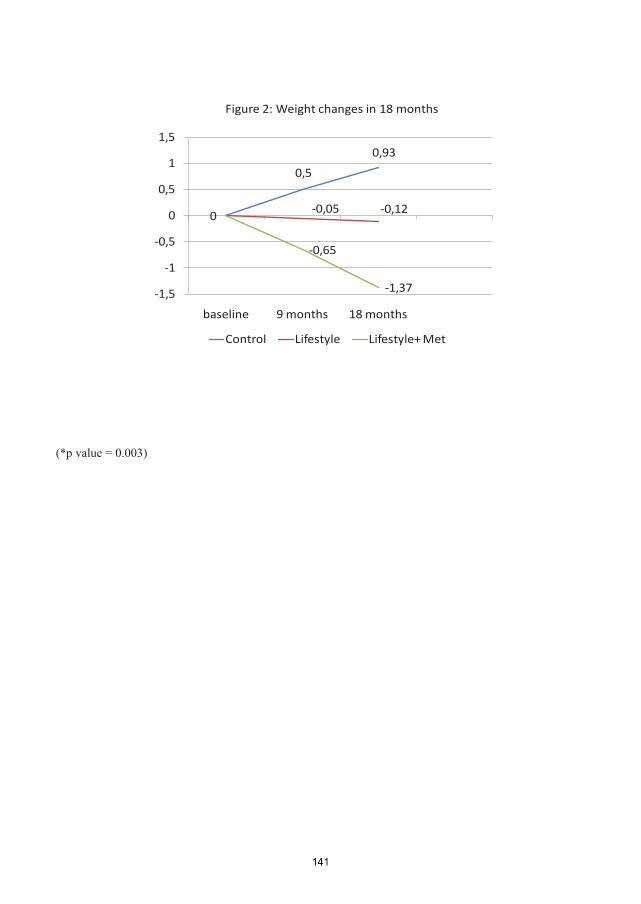
0,5
0,93
-0,05 -0,120
-0,65
-1,37-1,5
-1
-0,5
0
0,5
1
1,5
baseline 9 months 18 months
Control Lifestyle Lifestyle+ Met
Figure 2: Weight changes in 18 months
(*p value = 0.003)
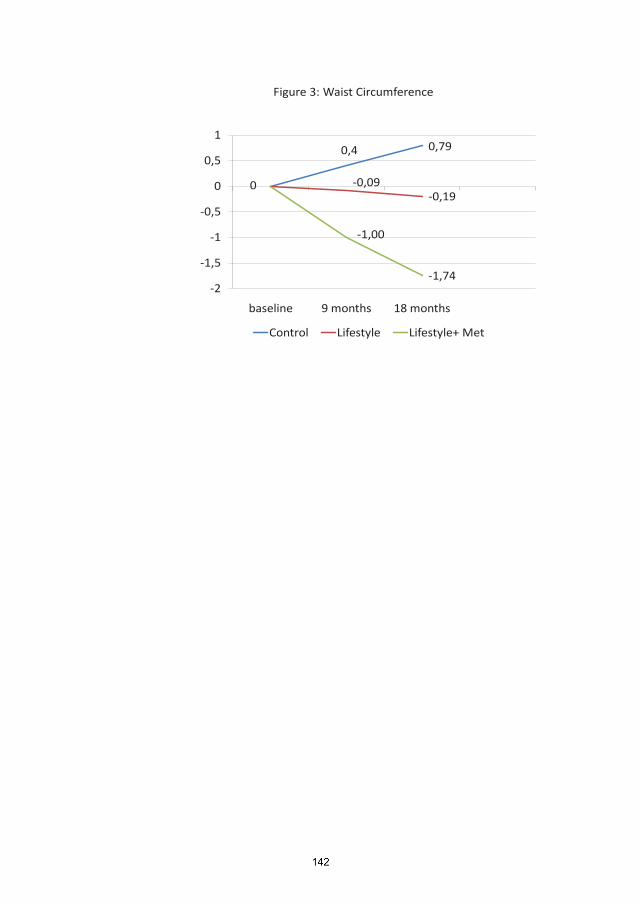
0,4 0,79
-0,09-0,19
0
-1,00
-1,74-2
-1,5
-1
-0,5
0
0,5
1
baseline 9 months 18 months
Control Lifestyle Lifestyle+ Met
Figure 3: Waist Circumference
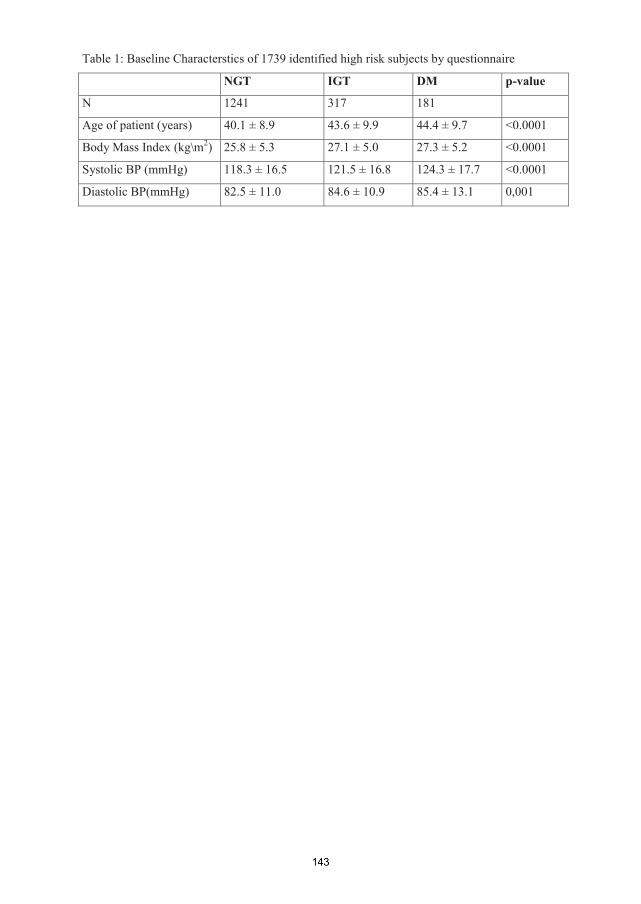
Table 1: Baseline Characterstics of 1739 identified high risk subjects by questionnaire
NGT IGT DM p-value
N 1241 317 181
Age of patient (years) 40.1 ± 8.9 43.6 ± 9.9 44.4 ± 9.7 <0.0001
Body Mass Index (kg\m2) 25.8 ± 5.3 27.1 ± 5.0 27.3 ± 5.2 <0.0001
Systolic BP (mmHg) 118.3 ± 16.5 121.5 ± 16.8 124.3 ± 17.7 <0.0001
Diastolic BP(mmHg) 82.5 ± 11.0 84.6 ± 10.9 85.4 ± 13.1 0,001

Table 2: Baseline Characteristics of the 317 Subjects in the IGT CohortControl Lifestyle Lifestyle+ Met
N 108 114 95
Age in years 44.2 ± 10.9 43.1 ± 10.1 43.5 ± 8.4
Body Mass Index (kg\m2) 27.0 ± 5.7 26.1 ± 4.7 28.1 ± 4.3
Systolic BP (mmHg) 121 ± 17 123 ± 19 120 ± 14
Diastolic BP(mmHg) 84 ± 11 86 ± 12 84 ± 9
Cholesterol (mg/dl) 179.1 ± 37 178.6 ± 34 180.0 ± 36
Triglycerides (mg/dl) 153.4 ± 109 147.3 ± 86 171.5 ± 119
HDL-C (mg/dl)* 37.8 ± 4.3 37.4 ± 4.5 37.8 ± 7.8
LDL-C (mg/dl) 117.2 ± 25.1 116.5 ± 22.7 117.0 ± 24.6

Table 3: Comparision of the outcome at 18 months in the four groups Control Lifestyle Lifestyle+ Met
N 82 107 85
cases per 1000 person-months 8.6 2.5 2.3
Absolute risk reduction % 10.7 11.5
Relative risk reduction % (95% CI) 71(13.7-90.3) 76.5(19.7-93.1)
NNT for 18 months to prevent DM in one case 9 8