Physical Activity and Mortality in Individuals With Diabetes Mellitus
Upload
khangminh22Category
view
6download
0

Nutritional Management of Diabetes Mellitus and
Dysmetabolic Syndrome

Nutritional Management ofDiabetes Mellitus andDysmetabolic Syndrome
EditorsJ.P. Bantle, Minneapolis, MN, USAG. Slama, Paris, France
Nestlé Nutrition Workshop Series Clinical & Performance Program, Vol. 11
Nestec Ltd., 55 Avenue Nestlé, CH–1800 Vevey (Switzerland) S. Karger AG, P.O. Box, CH–4009 Basel (Switzerland) www.karger.com
© 2006 Nestec Ltd., Vevey (Switzerland) and S. Karger AG, Basel (Switzerland). All rights reserved.This book is protected by copyright. No part of it may be reproduced, stored in a retrieval system, ortransmitted, in any form or by any means, electronic, mechanical, photocopying, or recording, orotherwise, without the written permission of the publisher.
Printed in Switzerland on acid-free paper by Reinhardt Druck, BaselISSN 1422–7584ISBN-10: 3–8055–8095–9ISBN-13: 978–3–8055–8095–3
Library of Congress Cataloging-in-Publication Data
Nutritional management of diabetes mellitus and dysmetabolic syndrome/ editors, J.P. Bantle, G. Slama.
p. ; cm. – (Nestlé Nutrition Workshop series. Clinical & perfor-mance program ; v. 11)
Includes bibliographical references and index.ISBN 3-8055-8095-9 (hard cover : alk. paper)1. Diabetes mellitus–Diet therapy. 2. Diabetes mellitus–Nutritional
aspects. 3. Metabolic syndrome–Diet therapy. 4. Metabolic syndrome–Nutritional aspects. I. Bantle, John P., 1947- . II. Slama, G.III. Nestlé Nutrition Institute. IV. Series: Nestlé Nutrition workshopseries. Clinical & performance programme ; v. 11.[DNLM: 1. Diabetes Mellitus–diet therapy. 2. Metabolic Syndrome
X–diet therapy. W1 NE228C v.11 2006 / WK 818 N9769 2006]RC662.N893 2006616.4�620654–dc22
2006010085
Basel · Freiburg · Paris · London · New York ·
Bangalore · Bangkok · Singapore · Tokyo · Sydney
The material contained in this volume was submitted as previously unpublished material, except inthe instances in which credit has been given to the source from which some of the illustrative materialwas derived.
Great care has been taken to maintain the accuracy of the information contained in the volume.However, neither Nestec Ltd. nor S. Karger AG can be held responsible for errors or for anyconsequences arising from the use of the information contained herein.

V
Contents
VII Foreword
XI Contributors
The Dysmetabolic Syndrome
1 The Dysmetabolic Syndrome: Epidemiology and
Etiology
Sauerwein, H.P. (The Netherlands)
15 Traditional Chinese Medicine in the Treatment of Diabetes
Zhao, H.-L.; Tong, P.C.Y.; Chan, J.C.N. (Hong Kong, SAR, China)
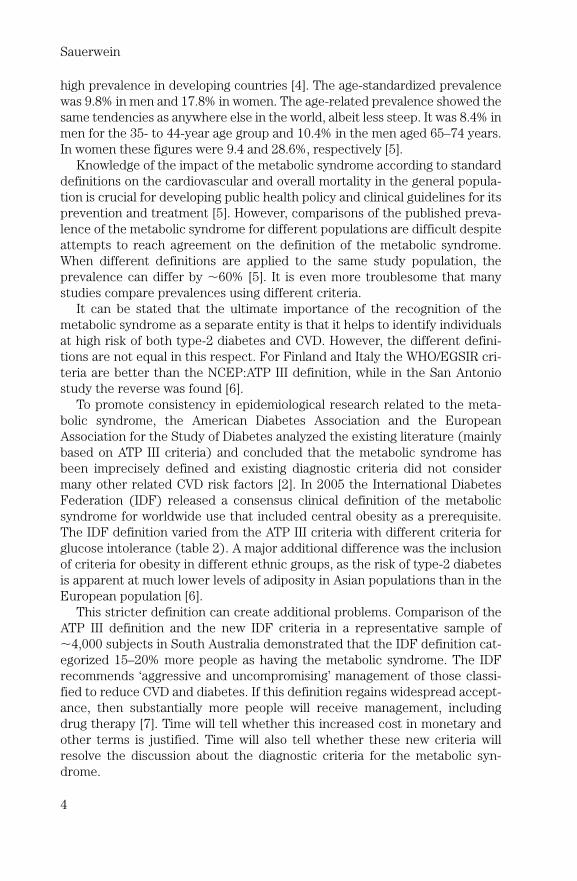
31 Pharmacological and Surgical Intervention for the
Prevention of Diabetes
Chiasson, J.-L. (Canada)
Glycemic Effect of Carbohydrates
43 The Glycemic Index: Methodology and Use
Kendall, C.W.C.; Augustin, L.S.A.; Emam, A.; Josse, A.R.; Saxena, N.;Jenkins, D.J.A. (Canada)
57 The Argument against Glycemic Index:
What Are the Other Options?
Franz, M.J. (USA)
73 Low Glycemic Index Foods Should Play a Role in Improving
Overall Glycemic Control in Type-1 and Type-2 Diabetic
Patients and, More Specifically, in Correcting Excessive
Postprandial Hyperglycemia
Slama, G.; Elgrably, F.; Kabir, M.; Rizkalla, S. (France)

83 Is Fructose the Optimal Low Glycemic Index Sweetener?
Bantle, J.P. (USA)
Beyond Glycemic Control
97 Optimal Diet for Glycemia and Lipids
Knowler, W.C. (USA)
107 Antioxidants and Diabetes
Mooradian, A.D. (USA)
127 Dietary and Body Weight Control: Therapeutic Education,
Motivational Interviewing and Cognitive-Behavioral
Approaches for Long-Term Weight Loss Maintenance
Golay, A. (Switzerland)
Diabetes in the Life Cycle
139 The Accelerator Hypothesis: A Unifying Explanation
for Type-1 and Type-2 Diabetes
Wilkin, T.J. (United Kingdom)
155 Diet and Medical Therapy in the Optimal Management of
Gestational Diabetes Mellitus
Metzger, B.E. (USA)
171 Do Meal Replacement Drinks Have a Role in
Diabetes Management?
Ditschuneit, H.H. (Germany)
The Role of Drugs and Diet Therapy – Alone and Together
183 Physical Activity in Prevention and Management of
Obesity and Type-2 Diabetes
Hill, J.O.; Stuht, J.; Wyatt, H.R.; Regensteiner, J.G. (USA)
197 The Role of Lifestyle Modification in Dysmetabolic
Syndrome Management
Foreyt, J.P. (USA)
207 Critical Review of the International Guidelines:
What Is Agreed upon – What Is Not?
Katsilambros, N.; Liatis, S.; Makrilakis, K. (Greece)
219 Subject Index
Contents
VI

VII
Foreword
Globally, the number of persons with diabetes and at risk of diabetes andcardiovascular disease is reaching epidemic proportions. Over the nextdecade the number is expected to grow by 25%, largely driven by the risingprevalence of obesity and inactivity. The World Health Organization (WHO)estimates that 200 million persons worldwide will have diabetes by 2010, andthat number will reach 330 million by 2025. The problem is especially seriousin Asia where there are 90 million people with diabetes. This includes four ofthe world’s five largest populations with diabetes: India, 33 million peoplewith diabetes; China, 23 million; Pakistan, 9 million, and Japan, 7 million. TheWHO predicts that in less than a decade, 60% of the worldwide populationwith diabetes will be in Asia.
It is with these facts in mind that Nestlé Nutrition chose the topic ‘NutritionalManagement of Diabetes Mellitus and the Dysmetabolic Syndrome’ for the11th Nestlé Nutrition Clinical and Performance Program Workshop Series,and the site, Hangzhou, China. Unless action is taken to change the predictedpath of diabetes, the disease will become a huge economic burden – bothfrom direct healthcare costs and indirect costs due to a decline in workplaceproductivity, as well as losses due to premature morbidity and mortality.Therefore, individuals at risk of diabetes must be identified, and preventionand suitable treatment interventions implemented.
With Nestlé Nutrition’s interest in nutrition, and the superb expertise ofour chairmen, Prof. John Bantle and Prof. Gerard Slama, a program was devel-oped highlighting the scientific evidence examining the impact of lifestyle,which includes both nutritional management and physical activity, in the pre-vention and treatment of diabetes. Although the optimal diet for diabetes hasnot yet been defined, because the optimal study has not yet been done, thereis general agreement that the nutritional recommendations of the variousinternational diabetes organizations are reasonable. There was also generalagreement that nutrition and lifestyle management must be individualized foreach person to enhance the potential for a successful outcome.

We thank our superb chairmen, our expert speakers, and especially ourhosts from Nestlé China, specifically KeLan Liu and Kelly Gao and their team,for their wonderful organization and attention to so many logistical details. Itis due to their efforts that participants from around the globe were able toparticipate in a stimulating workshop and some wonderful Chinese culture.
Patricia S. Anthony, MS, RD
Manager, Clinical ServicesHealthCare NutritionNestec Ltd., Vevey, Switzerland
Foreword
VIII

11th Nestlé Nutrition WorkshopClinical & Performance ProgramHangzhou, China, October 30–November 3, 2005


XI
Contributors
Chairpersons and Speakers
Prof. John P. Bantle
Division of Endocrinology andDiabetesDepartment of MedicineUniversity of Minnesota420 Delaware Street SEMinneapolis, MN 55455USAE-Mail [email protected]
Prof. Jean-Louis Chiasson
Research Center – CHUM (Hôtel Dieu)3850 St. Urbain StreetMontréal, Qué. H2W 1T7CanadaE-Mail [email protected]
Dr. Herwig H. Ditschuneit
Medizinische UniversitätsklinikUniversitätsklinikum UlmRobert-Koch-Strasse 8DE–89081 UlmGermanyE-Mail [email protected]
Prof. John P. Foreyt
Behavioral Medicine Research CenterBaylor College of Medicine6655 Travis Street, Suite 320Houston, TX 77030USAE-Mail [email protected]
Marion J. Franz, MS, RD,CDE
Nutrition Concepts by Franz, Inc.6635 Limerick DriveMinneapolis, MN 55439USAE-Mail [email protected]
Prof. Alain Golay
Service of Therapeutic Education forChronic Diseases Diabetes – ObesityDepartment of Community MedicineUniversity Hospital of Geneva24, rue Micheli-du-CrestCH–1211 Geneva 14SwitzerlandE-Mail [email protected]
Dr. James O. Hill
Center for Human NutritionUniversity of ColoradoSchool of MedicineCampus Box 263Denver, CO 80262USAE-Mail [email protected]
Prof. Nicholas Katsilambros
Laiko General HospitalAgiou Thoma 17 Street (Goudi)GR–11527 AthensGreeceE-Mail [email protected]

XII
Contributors
Prof. Cyril W.C. Kendall
Department of Nutritional SciencesFaculty of MedicineUniversity of TorontoClinical Nutrition and Risk FactorModification CenterSt. Michael’s HospitalToronto, Ont. M5S 3E2CanadaE-Mail [email protected]
Prof. William C. Knowler
Diabetes Epidemiology and ClinicalResearch SectionNational Institute of Diabetes andDigestive and Kidney Diseases1550 E Indian School RoadPhoenix, AZ 85014USAE-Mail [email protected]
Prof. Boyd E. Metzger
Northwestern University15-735 Tarry Building303 East Chicago AvenueChicago, IL 60611USAE-Mail [email protected]
Dr. Arshag D. Mooradian
Division of EndocrinologySaint Louis University1402 S. Grand BlvdSt. Louis, MO 63104USAE-Mail [email protected]
Prof. Hans Peter Sauerwein
Department of Endocrinology andMetabolismF5-170Meibergdreef 9NL–1105 AZ AmsterdamThe NetherlandsE-Mail [email protected]
Prof. Gérard Slama
Department of DiabetesHôtel Dieu Hospital1, place du Parvis Notre DameFR–75004 ParisFranceE-Mail [email protected]
Prof. Terence Wilkin
Department of MedicinePostgraduate Medical SchoolLevel 7, Derriford HospitalPlymouth PL6 8DHUKE-Mail [email protected]
Dr. Hailu Zhao
Department of Medicine andTherapeuticsPrince of Wales HospitalNgan Shing Street 30-32Shatin, Hong Kong, SARChinaE-Mail [email protected]
Moderators
Dr. Peter C.Y. TongPrince of Wales HospitalShatin, Hong Kong, SARChinaE-Mail [email protected]
Prof. Mingdao ChenShanghai Institute of Endocrine andMetabolic Diseases197 Ruijin Road II
Shanghai 200025ChinaE-Mail [email protected]
Prof. Zuzhi Fu
Medicine Sun Yet-Sen UniversityNo. 135, Xin Gang Xi RoadGuangzhou 510275China

XIII
Contributors
Invited attendees
Dr. Daniel Giannella Neto / BrazilProf. Catherine Field / CanadaProf. Donglian Cai / ChinaProf. Jialun Chen / ChinaProf. Xiafei Chen / ChinaProf. Zongyi Ding / ChinaProf. Sheng Ge / ChinaProf. Renming Hu / ChinaProf. Linong Ji / ChinaProf. Wiing Jia / ChinaProf. Zhimin Liu / ChinaProf. Rongli Qian / ChinaProf. Jianqin Sun / ChinaProf. Mengli Sun / ChinaProf. Haoming Tian / ChinaProf. Jianping Weng / ChinaProf. Manying Xu / ChinaProf. Huixia Yang / ChinaProf Yongnian Yang / ChinaProf. Demin Yu / ChinaProf. Serge Halimi / FranceDr. Patrick Serog / FranceProf. Elisabeth Steinhagen-Thiessen /
GermanyMs. King Chi, June Chan / Hong Kong
Mr. Yung Kind, David Chan / HongKong
Ms. Tsui Fun, Lornea Cheung / HongKong
Dr. Chun Chung Chow / Hong KongMs. Wai Shan, Wendy Tam / Hong KongDr. Johanes Casay Chandrawinata /
IndonesiaProf. Khalid Abdul Khadir / MalaysiaDr. Francisco Lagrutta / PanamaDr. Carlos Velarde / PanamaDr. Roberto Mirasol / PhilippinesDr. Rosa Allyn Sy / PhilippinesDr. Saddah Eshki / Saudi ArabiaDr. Chee Fang Sum / SingaporeDr. Kaushik Ramaiya / South AfricaDr. Gabriel Olveira / SpainProf. Lee-Ming Chuant / TaiwanDr. Chao-Hung Wang / TaiwanDr. Natapong Kosachunhaunun /
ThailandDr. Apussanee Boonyavarakul /
ThailandDr. Nattachet Plengvidhya / ThailandDr. Linda Wilkin / UK
Prof. Low-Thone Ho
Taipei VHG: 201Shih-Pai Road, Section 2TaipeiTaiwanE-Mail [email protected]
Prof. Hongding Xiang
Department of EndocrinePeking Union Medical CollegeHospitalNo. 1, Shuai Fu YuanDongcheng DistrictBeijing 100730ChinaE-Mail [email protected]
Nestlé Nutrition
participants
Mrs Penelope Small / AustraliaDr. Olivier Ballevre / ChinaMrs. Bénédicte Sentenac / FranceMs. Mandy Ma / Hong KongMr. Satoru Okada / JapanMs. Jean Ang / MalaysiaMrs. Amelita Valenzuela / PhilippinesMs. Ai-joo, Alicia Ng / SingaporeMrs Patricia Anthony / SwitzerlandDr. Denis Barclay / SwitzerlandMr. Dominique Brassart / Switzerland
Nestlé Nutrition
Participants
Dr. Jason Chieh Chou / SwitzerlandProf. Ferdinand Haschke / SwitzerlandDr. Natalia Leonova / SwitzerlandDr. Eduardo Schiffrin / SwitzerlandDr. Thomas Schweizer / SwitzerlandMr. Pierre Wuersch / SwitzerlandMs. Patricia Lee / TaiwanMr. Keith Colin-Thome / ThailandMs. Wirudchada Suttayakom /
ThailandMs. Fabienne Le Tadic / UK


The Dysmetabolic Syndrome:Epidemiology and Etiology
H.P. Sauerwein
Department of Endocrinology and Metabolism, Academic Medical Centre, Amsterdam, The Netherlands
AbstractThe metabolic syndrome is a common metabolic disorder that results from the
increasing prevalence of obesity. It also refers to a clustering of specific cardiovasculardisease risk factors whose underlying pathophysiology is thought to be related to insulinresistance with an excessive flux of fatty acids implicated. Opinions have varied as towhether the metabolic syndrome should be defined to indicate mainly insulin resist-ance, the metabolic consequences of obesity, risk of cardiovascular disease, or simply acollection of statistically related factors. Based on these different viewpoints 4 defini-tion sets of the metabolic syndrome are formulated. The pros and cons of each of themare extensively discussed. A major role in the etiology of the metabolic syndrome isascribed to the occurrence of insulin resistance. Data are provided that insulin resist-ance can worsen the expression of this syndrome, but cannot have a primary role.Therefore, insulin resistance is not the main player of the metabolic syndrome, but cen-tral obesity is. Free fatty acid induced insulin resistance is found and induced by centralobesity. The metabolic syndrome is a cluster of abnormalities in which each of themdeserves its own (maximal) treatment to diminish the risk for cardiovascular disease.
Copyright © 2006 Nestec Ltd., Vevey/S. Karger AG, Basel
Definition, Epidemiology and Its Problems
The metabolic syndrome is a common metabolic disorder that results fromthe increasing prevalence of obesity. It also refers to a clustering of specificcardiovascular disease (CVD) risk factors, whose underlying pathophysiologyis thought to be related to insulin resistance with excessive flux of fatty acidsimplicated. A pro-inflammatory state probably contributes to the syndrome
Bantle JP, Slama G (eds): Nutritional Management of Diabetes Mellitus and Dysmetabolic Syndrome.Nestlé Nutr Workshop Ser Clin Perform Program, vol 11, pp 1–13,Nestec Ltd., Vevey/S. Karger AG, Basel, © 2006.
1
The Dysmetabolic Syndrome

[1, 2]. Until 1998 an internationally recognized definition did not exist. In thatyear a WHO consultation proposed a set of criteria (diabetes mellitus orimpaired fasting glycemia or insulin resistance plus 2 or more of obesity, dys-lipidemia, hypertension, or microalbuminuria). Subsequently, the NationalCholesterol Education Program’s Adult Treatment Panel III (NCEP:ATP III; 3or more of obesity, dyslipidemia, hypertension or impaired fasting plasma glu-cose) and the European Group for the Study of Insulin Resistance (EGSIR;insulin resistance plus 2 or more of obesity, dyslipidemia, hypertension orimpaired fasting plasma glucose) have formulated definitions. The WHOdefinition and that of EGSIR agree that they both include either glucoseintolerance or insulin resistance as an essential component. However, for theNCEP:ATP III definition, this criterion is not included [1] (table 1). Despitethese differences in definition, they also have major similarities. All includedyslipidemia, hypertension and a parameter for obesity.
Confusion about the relevance of considering the metabolic syndrome as aseparate disease entity relates to differences in opinion regarding its definition.Opinions have varied as to whether the metabolic syndrome should be definedto indicate: (1) mainly insulin resistance; (2) the metabolic consequences of
Sauerwein
2
Table 1. Comparison of definitions of the metabolic syndrome
WHO EGSIR ATP III
Diabetes or IFG or IGT Fasting insulin:or IR (clamp) top 25% non-diabetics
Plus 2 of the Plus 2 of the 3 or more of the
following: following: following:BMI �30 Waist �94 cm (male) Waist �102 cm (male)or �80 cm (female) �88 cm (female)WHR �0.9 (male); �0.85 (female)TG �1.7 mmol/l TG �2.0 mmol/l TG �1.7 mmol/lor orHDL �0.9 mmol/l (male) HDL �1.0 mmol/l HDL �1.0 mmol/l (male)�1.0 mmol/l (female) �1.3 mmol/l (female)Blood pressure Blood pressure Blood pressure
�140/90 mm Hg �140/90 mm Hg �140/90 mm Hgor antihypertensive or antihypertensivemedication medication
Albumin excretion FPG �6.1 mmol/l FPG �6.1 mmol/l�20 �g/min
ATP III � National Cholesterol Education Program’s Adult Treatment Panel III(NCEP:ATP III); BMI � body mass index; EGSIR � European Group for the Study of Insulin Resistance; FPG � fasting plasma glucose concentration; IFG � impairedfasting plasma glucose; IGT � impaired glucose tolerance; IR � insulin resistance;TG � plasma triglyceride concentration; WHR � waist-hip ratio.

obesity; (3) the risk of CVD, or (4) simply as a collection of statistically relatedfactors.
In 1988, it was proposed that individuals displaying the cluster of abnor-malities associated with insulin resistance/compensatory hyperinsulinemia(glucose intolerance, hypertriglyceridemia, low high-density lipoprotein andessential hypertension) were at a significantly increased risk of CVD. Becausethe importance of insulin resistance and the associated abnormalities werenot widely appreciated as CVD risk factors at that time, the cluster of associ-ated abnormalities was subsumed under the rubric of syndrome X. Since theintroduction of the concept of syndrome X considerable information hasevolved relevant to the role of insulin resistance in human disease. This hasresulted in two somewhat disparate approaches to thinking about the clinicalimplications of insulin resistance and its consequences. One view recognizesthat the abnormalities related to insulin resistance have broadened consider-ably, and the adverse clinical outcomes extend beyond type-2 diabetes melli-tus and CVD. Because CVD is recognized to be just one of the multiple clinicalsyndromes, it seemed appropriate to replace the term syndrome X by theterm ‘insulin resistance syndrome’. The cardiologic community (ATP III) rec-ognized the importance of a ‘constellation of lipid and non-lipid risk factors ofmetabolic origin’ to be important as CVD risk factors, added abdominal obe-sity to the abnormalities initially proposed to comprise syndrome X, desig-nated this cluster as the metabolic syndrome and stated ‘this syndrome isclosely related to insulin resistance’. However, on the other hand, the statedpurpose of ATP III was to provide criteria to make the clinical diagnosis ofmetabolic syndrome, not to provide a physiological construct to explain whyinsulin-resistant subjects are at increased CVD risk [3]. This divergentapproach (simple criteria for the diagnosis of metabolic syndrome andemphasis on a physiological construct to explain why insulin-resistant sub-jects are at increased CVD risk) was greatly enhanced by their diagnostic cri-teria. As shown in table 1, only three of their criteria are necessary todiagnose the metabolic syndrome. This leaves the possibility that a lean glu-cose-tolerant subject can be labelled as being a patient with the metabolicsyndrome. It is obvious that this divergent approach causes major problemsfor epidemiological studies and treatment.
Because of its ease for use, the NCEP:ATP III criteria are used most fre-quently. In those studies the prevalence varies in urban populations from 8%(India) to 24% (USA) in men, and from 7% (France) to 43% (Iran) in women.A very consistent finding is that the prevalence of the metabolic syndrome ishighly age-dependent. This pattern is clear in Iran where the prevalence is�10% for both men and women in the 20- to 29-year age group, rising to 38 and67%, respectively, in the 60- to 69-year age group. Similarly, in a French popula-tion, the prevalence rises from �5.6% in the 30- to 39-year age group to 17.5% inthe 60- to 64-year age group. The prevalence data for the USA are comparable tothose for Iran [1]. A recent study in 15,540 Chinese adults confirmed the rather
The Dysmetabolic Syndrome: Epidemiology and Etiology
3
high prevalence in developing countries [4]. The age-standardized prevalencewas 9.8% in men and 17.8% in women. The age-related prevalence showed thesame tendencies as anywhere else in the world, albeit less steep. It was 8.4% inmen for the 35- to 44-year age group and 10.4% in the men aged 65–74 years.In women these figures were 9.4 and 28.6%, respectively [5].
Knowledge of the impact of the metabolic syndrome according to standarddefinitions on the cardiovascular and overall mortality in the general popula-tion is crucial for developing public health policy and clinical guidelines for itsprevention and treatment [5]. However, comparisons of the published preva-lence of the metabolic syndrome for different populations are difficult despiteattempts to reach agreement on the definition of the metabolic syndrome.When different definitions are applied to the same study population, theprevalence can differ by �60% [5]. It is even more troublesome that manystudies compare prevalences using different criteria.
It can be stated that the ultimate importance of the recognition of themetabolic syndrome as a separate entity is that it helps to identify individualsat high risk of both type-2 diabetes and CVD. However, the different defini-tions are not equal in this respect. For Finland and Italy the WHO/EGSIR cri-teria are better than the NCEP:ATP III definition, while in the San Antoniostudy the reverse was found [6].
To promote consistency in epidemiological research related to the meta-bolic syndrome, the American Diabetes Association and the EuropeanAssociation for the Study of Diabetes analyzed the existing literature (mainlybased on ATP III criteria) and concluded that the metabolic syndrome hasbeen imprecisely defined and existing diagnostic criteria did not considermany other related CVD risk factors [2]. In 2005 the International DiabetesFederation (IDF) released a consensus clinical definition of the metabolicsyndrome for worldwide use that included central obesity as a prerequisite.The IDF definition varied from the ATP III criteria with different criteria forglucose intolerance (table 2). A major additional difference was the inclusionof criteria for obesity in different ethnic groups, as the risk of type-2 diabetesis apparent at much lower levels of adiposity in Asian populations than in theEuropean population [6].
This stricter definition can create additional problems. Comparison of theATP III definition and the new IDF criteria in a representative sample of�4,000 subjects in South Australia demonstrated that the IDF definition cat-egorized 15–20% more people as having the metabolic syndrome. The IDFrecommends ‘aggressive and uncompromising’ management of those classi-fied to reduce CVD and diabetes. If this definition regains widespread accept-ance, then substantially more people will receive management, includingdrug therapy [7]. Time will tell whether this increased cost in monetary andother terms is justified. Time will also tell whether these new criteria willresolve the discussion about the diagnostic criteria for the metabolic syn-drome.
Sauerwein
4

Etiology
Medical science usually defines a syndrome as an ‘aggregate of symptomsand signs associated with any morbid process, and constituting together thepicture of disease’. The specific signs and symptoms are usually caused by aunifying underlying pathology, and their components confer a risk that is dif-ferent from the sum of its parts. This definition does not seem to be applied inthe discussions about the pathophysiology of the metabolic syndrome. In thisdiscussion sometimes cause and effect are reversed, especially about therelation between free fatty acids (FFAs) and insulin sensitivity [1].
It has been stated that accumulating evidence strongly indicates thatinsulin resistance is the common pathogenetic factor for the individual com-ponents of the metabolic syndrome and explains the trait cluster [2, 8]. Inmany of the studies on the relation between insulin resistance and the occur-rence of metabolic syndrome, surrogate measures of insulin resistance wereused and these measures often loaded on more than one of the underlyingfactors. Few studies have examined the associations between the metabolicsyndrome and direct measures of insulin sensitivity as the euglycemic-hyperinsulinemic clamp or the frequently sampled intravenous glucose toler-ance test. Applying those techniques, still strong associations have been foundbetween low insulin sensitivity and the metabolic syndrome in non-diabeticsubjects. Subjects with ATP III- or WHO-defined metabolic syndrome had
The Dysmetabolic Syndrome: Epidemiology and Etiology
5
Table 2. Comparison of definitions of the metabolic syndrome by IDF and ATP III
Parameter IDF criterion Comparison to ATP III
Obesity Waist circumference: Differentethnic specificity
Triglycerides TG �1.7 mmol/l Sameorspecific treatment
HDL Male: �1.0 mmol/l Samefemale: �1.3 mmol/lorspecific treatment
Hypertension Blood pressure: �130/85 mm Hg Sameorspecific treatment
Glucose FPG: �5.6 mmol/l More strictorpreviously diagnosed diabetes mellitus
ATP III � National Cholesterol Education Program’s Adult Treatment Panel III(NCEP:ATP III); FPG � fasting plasma glucose concentration; IDF � InternationalDiabetes Federation; IGT � impaired glucose tolerance; TG � plasma triglycerideconcentration.

5- to 10-fold increased risks of being in the lowest quartile of directly meas-ured insulin sensitivity [9]. It has been concluded that these observationsprovide strong support for the notion that individuals with the metabolic syn-drome are insulin-resistant and this disorder may be at the core of the clusterof metabolic abnormalities that characterizes the syndrome [9]. Although theconclusion that ‘insulin resistance may be at the core of cluster of abnormali-ties’ is carefully formulated and does not state that insulin resistance is thecause of the metabolic syndrome, the implicit suggestion is that it is. Is thisconclusion justified? In other words, can the cluster of abnormalities togetherforming the metabolic syndrome be explained by diminished insulin action? Aseries of arguments will be provided to prove that this is not true.
In order to fulfill its role as a unifying underlying pathology, insulin resist-ance should not only be strongly related to the metabolic syndrome, butshould also be present in every patient with the metabolic syndrome. Thisrequirement is not fulfilled. In the definition proposed by WHO and EGSIR acentral role is given to insulin resistance; however, according to the ATP III cri-teria, the existence of glucose intolerance or insulin resistance is not a prereq-uisite for diagnosis of the metabolic syndrome and ATP III criteria have a lowsensitivity for identifying insulin resistance with dyslipidemia in non-diabeticindividuals at increased risk for CVD [8]. This suggests that it could be possiblethat subjects diagnosed as having the metabolic syndrome do not have thisabnormality which is considered to be essential for development of this syn-drome. This suggestion proved to be true. In a study of 443 healthy volunteersin the USA, in whom insulin sensitivity was measured with the gold standard,it was shown that �21% of the subjects evaluated met the ATP III criteria foridentification of the metabolic syndrome. Approximately two thirds of thesesubjects were insulin-resistant. This shows a high correlation between themetabolic syndrome and insulin resistance, but more importantly it also showsthat �30% were insulin-sensitive [10]. A recent study, reported in the Annalsof Internal Medicine on 258 obese non-diabetic subjects, showed that 78% ofthose with the metabolic syndrome were insulin-resistant and 48% withinsulin resistance met the criteria of the metabolic syndrome, again values toolow for insulin resistance to be a cause of the syndrome [11].
Another approach could be to show that treatment of insulin resistancealone will cure or improve the abnormalities of the metabolic syndrome. Thereare no data showing this. Treatment of the metabolic syndrome is treatment ofits different components. There are no data showing that treatment of all itscomponents adds something extra above this. There are also no data showingthat treatment of one component ‘cures’ the other components [1]. It has beensuggested that peroxisome proliferator-activated receptor-� agonists could beideal agents for managing the metabolic syndrome, as they reduce insulinresistance by influencing FFA flux. Systematic studies are lacking, but even iftreatment with this agent alone improves or cures the metabolic syndrome,this cannot be used as an argument for insulin resistance being the core player
Sauerwein
6

in the development of the metabolic syndrome. These agents have pleiotropiceffects far beyond improving insulin resistance [12].
The third approach to explore the role of insulin resistance in the develop-ment of the metabolic syndrome is to look at studies on long-term insulinadministration and the development of the metabolic abnormalities of themetabolic syndrome. Insulin inhibits glucose production and stimulates glu-cose uptake – oxidation and glycogen synthesis in the insulin-sensitive tis-sues, muscle and adipose tissue. Suppression of production and stimulationof oxidation of glucose require less insulin than stimulation of uptake. In thetraditionally glucocentric view of insulin resistance, a defect in insulin actionrequires more insulin than usual to maintain normal glucose fluxes [13]. Inthis glucocentric view it is ignored that insulin has many more regulatorytasks than those related to glucose metabolism. Another important functionof insulin is suppression of lipolysis. Less insulin is required for suppression oflipolysis (suppression of FFA flux) than for regulation of glucose metabolism[14]. Numerous data have shown that lipids and especially high FFA levels willinduce insulin resistance. There is now a growing appreciation that a chronicelevation in FFA levels is an early event that contributes to the developmentof insulin resistance [1, 15]. Insulin resistance will further increase FFA levels,and this can worsen insulin resistance again. In this way insulin resistance canworsen the metabolic abnormalities, but is never the primary contributor.
The relation between insulin resistance and hypertension seems to be wellestablished [1]. Resistance to the metabolic effects of insulin and compensa-tory hyperinsulinemia have been postulated to mediate human essentialhypertension, especially when associated with obesity. Evidence supportingthis hypothesis has come mainly from epidemiological studies showing corre-lations between insulin resistance, hyperinsulinemia, and blood pressure, andfrom short-term studies suggesting that insulin has renal and sympatheticeffects that could raise blood pressure if the effects were sustained. However,there have been no studies demonstrating a direct causal relationship betweenchronic hypertension and insulin resistance or hyperinsulinemia in humans.The few long-term studies that have been conducted in dogs and humans donot support the hypothesis that hyperinsulinemia causes hypertension orpotentiates the hypertensive effects of other pressor agents such as angiotensinII or increased adrenergic tone. To the contrary, multiple studies in dogs andhumans suggest that the vasodilator action of insulin tends to reduce bloodpressure. Although resistance to insulin’s metabolic effects has been sug-gested to be essential for hyperinsulinemia to cause hypertension, chronicincreases in plasma insulin concentrations do not cause hypertension in dogsor humans, even in the presence of insulin resistance. Recent studies havefurther shown that the blood pressure-lowering effects of anti-hyperglycemicagents, initially believed to lower blood pressure by decreasing insulin resist-ance, may be unrelated to their effects on insulin sensitivity. Obesity appearsto be a key factor in accounting for correlations between insulin resistance,
The Dysmetabolic Syndrome: Epidemiology and Etiology
7

hyperinsulinemia, and hypertension, but increased blood pressure in obesitydoes not appear to be mediated by insulin resistance and hyperinsulinemia[16]. Even in full-blown metabolic syndrome insulin resistance contributesonly modestly to the increased prevalence of hypertension [17].
These data point to new upcoming pathophysiological findings aboutextra-adrenal cortisol production in adipose tissue. Within adipose tissue, theenzyme 11�-hydroxysteroid dehydrogenase type-1 interconverts inactiveglucocorticoid cortisone and cortisol. In vivo, it is the reductase activity thatis believed to predominate, generating cortisol in an autocrine/paracrine man-ner within the adipocyte microenvironment. An increasing amount of datashows that cortisol production by adipose tissue is increased in obesity andcontributes to insulin resistance. Induction of weight loss reverses thesechanges [18]. These data suggest that insulin resistance is the consequence ofabnormalities induced by local cortisol overproduction, a consequence ofobesity. Based on these data, the suggestion crops up that insulin resistanceis therefore not the main player in the pathophysiology of the metabolic syn-drome, but a consequence of obesity.
An exception in this series of arguments against the primary role of insulinresistance in the pathogenesis of the components of the metabolic syndromeis hypertriglyceridemia. Literature data indicate that this abnormality iscaused by overproduction and reduced clearance of very low-density lipopro-tein, both processes regulated by insulin. Overproduction of very low-densitylipoprotein will lower high-density lipoprotein [19].
Conclusion
It is clear that more than one distinct pathophysiological process underliesthe clinical expression of the metabolic syndrome, and insulin resistance canin some sense be related to them but seems to be less prominent than usuallystated in literature. Adipose tissue is an active metabolic organ. An increasein the size of this organ with consequent changes in its metabolism can read-ily explain the features of the metabolic syndrome. Therefore, insulin resist-ance is not the main player in the metabolic syndrome, but central obesity is.FFA-induced insulin resistance is found and induced by central obesity. Thesame holds true for hypertension.
References
1 Eckel RH, Grundy SM, Zimmet PZ: The metabolic syndrome. Lancet 2005;365:1415–1428.2 Kahn R, Buse J, Ferrannini E, Stern M: The metabolic syndrome: time for a critical appraisal.
Joint statement from the American Diabetes Association and the European Association forthe Study of Diabetes. Diabetes Care 2005;28:2289–2304.
3 Reaven GM: The insulin resistance syndrome: definition and dietary approaches to treatment.Annu Rev Nutr 2005;25:391–406.
Sauerwein
8

4 Gu D, Reynolds K, Wu X, et al: Prevalence of the metabolic syndrome and overweight amongadults in China. Lancet 2005;365:1398–1405.
5 Lakka HM, Laaksonen DE, Lakka TA, et al: The metabolic syndrome and total and cardiovas-cular disease mortality in middle-aged men. JAMA 2002;228:2709–2716.
6 Alberti KGMM, Zimmet P, Shaw J: The metabolic syndrome-a new worldwide definition.Lancet 2005;366:1059–1062.
7 Adams RJ, Appleton S, Wilson DH, et al: Population comparison of two clinical approaches tothe metabolic syndrome. Diabetes Care 2005;28:2777–2779.
8 Liao Y, Kwon S, Shaughnessy S, et al: Critical evaluation of adult treatment panel III in identi-fying insulin resistance with dyslipidemia. Diabetes Care 2004;27:978–983.
9 Hanley AJG, Wagenknecht LE, D’Agostino RB, et al: Identification of subjects with insulinresistance and �-cell dysfunction using alternative definitions of the metabolic syndrome.Diabetes 2003;52:2740–2747.
10 Cheal KL, Abbasi F, Lamendola C, et al: Relationship to insulin resistance of the adult treat-ment panel III diagnostic criteria for identification of the metabolic syndrome. Diabetes2004;53:1195–1200.
11 McLaughlin T, Abbasi F, Cheal K, et al: Use of metabolic markers to identify overweight indi-viduals who are insulin resistant. Ann Intern Med 2003;39:802–809.
12 Staels B, Fruchart JC: Therapeutic roles of peroxisome proliferators-activated receptor ago-nists. Diabetes 2005;54:2460–2470.
13 Rizza RA, Mandarino LJ, Gerich JE: Dose-response characteristics for effects of insulin onproduction and utilization of glucose in man. Am J Physiol 1981;240:E630–E639.
14 Nurjhan N, Campbell PJ, Kennedy FP, et al: Insulin dose-response characteristics for suppres-sion of glycerol release and conversion to glucose in humans. Diabetes 1986;35:1326–1331.
15 Boden G, Laakso M: Lipids and glucose in type 2 diabetes. What is cause and effect. DiabetesCare 2004;27:2253–2259.
16 Hall JE, Brands MW, Zappe DH, Alonso Galicia M: Insulin resistance, hyperinsulinemia,and hypertension: causes, consequences, or merely correlations? Proc Soc Exp Biol Med1995;208:317–329.
17 Hanley AJG, Karter AJ, Festa A, et al: Factor analysis of metabolic syndrome using directlymeasured insulin sensitivity. The insulin resistance atherosclerosis study. Diabetes 2002;51:2642–2647.
18 Tomlinson JW, Moore JS, Clark PMS, et al: Weight loss increases 11�-hydroxysteroiddehydrogenase type 1 expression in human adipose tissue. J Clin Endocrinol Metab 2004;89:2711–2716.
19 Taskinen MR: Diabetic dyslipidaemia: from basic research to clinical practice. Diabetologia2003;46:733–749.
Discussion
Dr. Bantle: Could you say a little bit about the associations between the differentdefinitions of metabolic syndrome and cardiovascular disease? It would seem to methat the definition to use is the one that is the best predictor of events.
Dr. Sauerwein: In my presentation I showed data that in Finland the Europeanstandards are better, but that in Holland, despite being close to Finland, the Americanones are better predictors of cardiovascular disease, indicating that we need to rede-fine our diagnostic criteria. For reliable prediction and comparison of published datawe need one definition. That is why the International Diabetes Federation (IDF) cameup with a lot of new data, but they include so many things that we have to wait forproof of their validity.
Dr. Bantle: Is there any evidence that this definition works as a predictor of futureevents?
Dr. Sauerwein: It was just promoted. There is always a debate between the peo-ple who are in charge of one definition and those defending the other one.
The Dysmetabolic Syndrome: Epidemiology and Etiology
9

Dr. Katsilambros: If I understood properly, you said that bariatric surgery doesnot improve hypertension. There is the so-called SHO study, a Scandinavian obesitystudy, which is perhaps the largest in the world and with a long follow-up, in whichdifferent kinds of operations were performed. After 2, 6 and 8 years the hypertensionrate was lower when compared to the starting point before operation. However, after10 years the rate again increased back to the beginning [1]. But even 10 years after theoperation these people were still considerably obese and any benefit was not very last-ing, and also, at least in this population, aging was another factor adding to the preva-lence and incidence of obesity. So in my opinion at least, your statement about therebeing no relation to hypertension with regard to bariatric surgery is perhaps not thebest way to express that, but I may be wrong.
Dr. Sauerwein: The data I showed are from that Swedish study. What the slideshowed is that the incidence of hypertension has returned to baseline after 10 years.When insulin resistance is the common denominator, this dissociation cannot occurunless, as you suggested, a new mechanism for the induction of hypertension developsin this time period. This is a possibility, but pathophysiological data in favor of this arelacking. I think that other mechanisms like local cortisol production in abdominal fatdeserve real consideration. Many people are considering insulin resistance and meta-bolic syndrome to be more or less synonymous. I am of the opinion that we need amore subtle approach.
Dr. Chiasson: I thought that your discussion was very interesting, and certainlyKahn et al. [2] have gone through this questioning of the metabolic syndrome. I think itis good that we raise questions about whether this is really a metabolic syndrome or justfactors that are in parallel but totally independent, or whether they have a commonbackground. So if I understand correctly, insulin resistance may not be the commondenominator but you believe that the free fatty acids (FFAs) could be. FFA requiresobesity to increase the plasma level. I was just wondering if the increase in FFA in obe-sity or under any other circumstances was not in fact due to insulin resistance, becauseotherwise you would expect the physiological level of insulin to be able to maintain inhi-bition on lipolysis. How do you explain this discrepancy that you are trying to propose?
Dr. Sauerwein: What I did not share with you is that fat in the diet has no influ-ence on insulin resistance. I was part of a study were we consumed eucaloric dietswith either 85% fat or 85% carbohydrate as the energy source for 14 days withouthardly any induction of insulin resistance [3, 4]. The same holds true for diabetics [5].So it is not just the fat or (FFA) fatty acids themselves, but the induction of obesitywith excess fatty acids taken up by muscle, �-cells, etc., that induces insulin resist-ance. Induction of insulin resistance will induce a vicious cycle in which insulin resist-ance will stimulate FFA release, as you described. This will aggravate insulinresistance. However the starting point must be excess intake and obesity. Eucaloricfat intake is less of a problem.
Dr. Chiasson: I am not sure I understand correctly. I was under the impressionthat deposition of fat and triglyceride in the muscle and other tissues was related toinsulin resistance and the increase in FFA in the circulation.
Dr. Sauerwein: This is true, but what I want to stress are the initial changes. Mostof the studies are cross-sectional, ignoring the sequence of events. Confusion can alsobe ascribed to definition problems. A high fat diet is sometimes called a eucaloric dietwith a high percentage of fat in it, but more frequently a hypercaloric diet has addi-tional fat. This distinction is not always made, but is important as our data show.
Dr. Hill: You emphasized the importance of adipose tissue. We used to think thatadipose tissue was pretty uninteresting and now we know it secretes many interestingproducts. Do you think products coming from fat cells will be found to be helpful inunderstanding the metabolic syndrome?
Sauerwein
10

Dr. Sauerwein: This is a confusing area. You have to realize that morbid obesity isnot always synonymous with major metabolic abnormalities. About 20% of the mor-bidly obese subjects are metabolically healthy [6]. I am not aware of any study focus-ing on the differences in expression of all those factors in morbidly obese subjectswith and without major metabolic abnormalities, but I am convinced that the hor-mones produced by adipose tissue will have a major influence. However, I think it istoo early now to make a statement about this.
Dr. Ditschuneit: Do you think that lipolysis and concentrations of FFAs may be atarget for treating metabolic syndrome?
Dr. Sauerwein: Inhibition of lipolysis improves insulin resistance [7]. Howeversuppression of lipolysis is only part of the story. The main problem is excess intake.With excess intake FFA will be stored in adipose tissue and muscle, inducing insulinresistance [8]. Even storage in adipose tissue, beyond a certain amount, inducesinsulin resistance, as adipose tissue increasing in size will attract macrophages [9].This will induce a kind of local inflammation, increasing the degree of insulin resist-ance [10].
Dr. Slama: I think that there is ambiguity about the metabolic syndrome explain-ing the controversy, which is where we are now. The point is that the metabolic syn-drome was first recognized by clinicians as a cluster of signs and symptoms associatedwith more complications in the future, all the complications we know. Then it wasdecided that the definition needs to have thresholds so that it is easier to recognizesuch a symptom. Now we ask, is that the best way to predict diabetes? Is that the bestway to predict cardiovascular disease? Of course not. There is a very good equation,the Framingham equation, to predict cardiovascular complications; then there is abetter equation, the score put forward by Hafner, to predict diabetes but it was notintended for that. The proposal that metabolic syndrome causes complications doesnot mean that the reverse is true. We don’t want to say that the definition of metabolicsyndrome is the universal way to diagnose or predict diabetes or cardiovascular dis-ease; we say that a cluster of people or a subgroup of people affected by such and suchsigns will be at a higher risk of cardiovascular disease and diabetes. In other words, Ithink that in the natural history between a normal situation toward vascular complica-tions or diabetes, there is something which is early on, which is a definition of themetabolic syndrome at the very beginning, then the disease progresses and thenFramingham or other predictors are better indicators, but on the shorter run. On thelong run perhaps when it is time to put preventive measures into action, it is the meta-bolic syndrome, and for Framingham and such this is the time not of prevention but ofearly treatment. What is your opinion?
Dr. Sauerwein: I completely agree with you. It is a cluster of abnormalities, noth-ing less, but definitely nothing more.
Dr. T. Wilkin: I think one of the difficulties is that we impose the problem uponourselves. We apply categorization to what are continuous variables. If there are 4 or 5continuous variables and we apply categorization then individuals are bound to havevery different levels, some of which will satisfy the categories and others which won’t.As long as we try to categorize what is continuous, we are going to have this problem.
Dr. Sauerwein: I agree.Dr. Chieh Chou: I have a question related to the role of obesity in metabolic syn-
drome because in the case of diabetes with obesity, in patients with moderate weightloss, an improvement in the disease is often seen. So perhaps removing fat from theliver or muscle would really improve insulin resistance. What do you think?
Dr. Sauerwein: I agree. When people are storing their fat in the only place whereit should be (in certain subcutaneous areas), they have no problems related to glucoseintolerance. Translocation of fat by thiazolidediones to those areas improves glucose
The Dysmetabolic Syndrome: Epidemiology and Etiology
11

tolerance even despite the well-known increase in body weight [11]. Another problemis the unexplained relationship between abdominal obesity and insulin resistance. Itwas always thought that FFAs flowing from the intra-abdominal cavity to the liverwould induce insulin resistance, but quantitatively the contribution of the intra-abdominal-based FFA to total FFA flux proved to be around 20% [12].
Dr. Mingdao Chen: The American Diabetes Association (ADA) and the EuropeanAssociation for the Study of Diabetes (EASD) statement for ‘metabolic syndrome’ isquite different from that of the IDF. The ADA and EASD tried to say that the meta-bolic syndrome is only a cluster of a few factors or risks, it is not even a syndrome.However, a syndrome means several different signs and symptoms together, a situa-tion surely suited to the metabolic syndrome. Which definition do you support?
Dr. Sauerwein: I think it is a cluster of a few factors, which have proven in thepast to be predictors of cardiovascular disease. In that sense it is alright, but we shouldnot draw pathophysiological conclusions from epidemiological data.
Dr. Mingdao Chen: Perhaps they just mean this is not a disease.Dr. Sauerwein: Yes, that is what I tried to say.Dr. Slama: One of the difficulties with the metabolic syndrome is blood pressure.
The definition of metabolic syndrome gives a blood pressure of �130 mm Hg, but thesituation is absolutely not the same if the blood pressure is 130 or 180 mm Hg. In bothcases the definition is upheld, but 130 mm Hg would be normal for people other thanthose with a cluster, and 180 mm Hg is abnormal whether cluster or no cluster. So forme the real interest of the definition of the metabolic syndrome is those people whohave all or most of the items of the cluster in the near normal range but become abnor-mal because they have a cluster. Of course if a patient has a blood pressure of 180 mmHg, a blood glucose of 200, 5 g triglyceride, he doesn’t need to be labeled metabolicsyndrome, he is badly sick. So the real interest of the metabolic syndrome is those whoare just close to the thresholds and will not be considered as having a disease point bypoint, item by item, but are really affected because they have most of them.
Dr. Sauerwein: That is absolutely correct, but the problem is that this is beingignored in the literature.
References
1 Sjostrom L, Lindroos AK, Peltonen M, et al, Swedish Obese Subjects Study Scientific Group:Lifestyle, diabetes, and cardiovascular risk factors 10 years after bariatric surgery. N Engl JMed 2004;351:2683–2693.
2 Kahn R, Buse J, Ferrannini E, Stern M, American Diabetes Association, European Associationfor the Study of Diabetes: The metabolic syndrome: time for a critical appraisal: joint state-ment from the American Diabetes Association and the European Association for the Study ofDiabetes. Diabetes Care 2005;28:2289–2304.
3 Bisschop PH, Pereira Arias AM, Ackermans MT, et al: The effects of carbohydrate variation inisocaloric diets on glycogenolysis and gluconeogenesis in healthy men. J Clin EndocrinolMetab 2000;85:1963–1967.
4 Bisschop PH, de Metz J, Ackermans MT, et al: Dietary fat content alters insulin-mediatedglucose metabolism in healthy men. Am J Clin Nutr 2001;73:554–559.
5 Allick G, Bisschop PH, Ackermans MT, et al: A low-carbohydrate/high-fat diet improvesglucoregulation in type 2 diabetes mellitus by reducing postabsorptive glycogenolysis. J ClinEndocrinol Metab 2004;89:6193–6197.
6 Sims EA: Are there persons who are obese, but metabolically healthy? Metabolism 2001;50:1499–1504.
7 Bajaj M, Suraamornkul S, Romanelli A, et al: Effect of a sustained reduction in plasma freefatty acid concentration on intramuscular long-chain fatty Acyl-CoAs and insulin action intype 2 diabetic patients. Diabetes 2005;54:3148–3153.
Sauerwein
12

8 Miles JM, Park YS, Walewicz D, et al: Systemic and forearm triglyceride metabolism: fate oflipoprotein lipase-generated glycerol and free fatty acids. Diabetes 2004;53:521–527.
9 Weisberg SP, McCann D, Desai M, et al: Obesity is associated with macrophage accumulationin adipose tissue. J Clin Invest 2003;112:1796–1808.
10 Xu H, Barnes GT, Yang Q, et al: Chronic inflammation in fat plays a crucial role in the devel-opment of obesity-related insulin resistance. J Clin Invest 2003;112:1821–1830.
11 Mayerson AB, Hundal RS, Dufour S, et al: The effects of rosiglitazone on insulin sensitivity,lipolysis, and hepatic and skeletal muscle triglyceride content in patients with type 2 dia-betes. Diabetes 2002;51:797–802.
12 Miles JM, Jensen MD: Counterpoint: visceral adiposity is not causally related to insulin resist-ance. Diabetes Care 2005;28:2326–2328.
The Dysmetabolic Syndrome: Epidemiology and Etiology
13


Traditional Chinese Medicine in theTreatment of Diabetes
Hai-Lu Zhao, Peter C.Y. Tong, Juliana C.N. Chan
Department of Medicine and Therapeutics, Prince of Wales Hospital, The Chinese University of Hong Kong, Hong Kong, SAR, China
AbstractThis review focuses on the efficacy and safety of Chinese medicine in the treatment
of type-2 diabetes. Included were 84 controlled clinical studies of type-2 diabetestreated with Chinese medicine for at least 1 month. Reported outcomes were: symptomrelief; improvement in glycemia, insulin resistance and secondary failure, and adverseevents. Symptom relief was achieved in most (�80%) of the patients receiving Chinesemedicine. Compared with orthodox drugs, Chinese medicine had a 1.2-fold (95% CI1.2–1.3) increase in symptom relief. The relative risk of achieving a fasting blood glu-cose of �7.3 mmol/l or a postprandial blood glucose of �8.2 mmol/l was: 3.0 (95% CI1.4–6.5) for Chinese medicine plus diet versus diet; 2.0 (95% CI 1.4–3.0) for Chinesemedicine versus placebo; 1.8 (95% CI 1.4–2.3) for combined Chinese medicine andorthodox drugs versus Yuquan Wan (a classic Chinese herbal formula for diabetes), 1.5(95% CI 1.4–1.7) for combined Chinese medicine and orthodox drugs vs. orthodoxdrugs, and 1.3 (95% CI 1.2–1.5) for Chinese medicine versus orthodox drugs. A fastingblood glucose of �8.2 mmol/l plus symptom relief was observed in 71–100% of thepatients with secondary failure to oral anti-diabetic drugs. Serious adverse eventsincluding hypoglycemic coma and death were caused by adulteration with orthodoxdrugs, erroneous substitution, self-meditation, overdoses, and improper preparation.Chinese herbal medicine should be used cautiously with doctors’ prescription andfollow-up. Long-term clinical studies may disclose the effectiveness of Chinese medi-cine in reducing the mortality and morbidity of diabetic complications.
Copyright © 2006 Nestec Ltd., Vevey/S. Karger AG, Basel
Diabetes mellitus is a group of complex diseases characterized by chronichyperglycemia due to defects in insulin secretion, insulin action, or both.The long-term damage of chronic hyperglycemia of diabetes occurs in vari-ous organs, especially the eyes, kidneys, nerves, heart, and blood vessels.Type-2 diabetes is the most prevalent form of diabetes that often coexists
Bantle JP, Slama G (eds): Nutritional Management of Diabetes Mellitus and Dysmetabolic Syndrome.Nestlé Nutr Workshop Ser Clin Perform Program, vol 11, pp 15–29,Nestec Ltd., Vevey/S. Karger AG, Basel, © 2006.
15

with other metabolic components such as obesity, hypertension and dyslipi-demia. In China, type-2 diabetes is increasing in epidemic dimensions. In2002 the National Survey on the Status of Nutrition and Health of theChinese People conducted in adults over the age of 18 years revealed anincreased morbidity from overweight (22.8% and 200 million, prevalenceand total number), obesity (7.1% and 60 million), hypertension (18.8% and160 million), impaired fasting glucose (1.9% and 20 million), diabetes (2.6%and 27 million), and dyslipidemia (18.6% and 160 million) [1]. The preva-lence of metabolic syndrome is approximately 13% in the Chinese popula-tion [1, 2].
In parallel to the epidemic trend of diabetes and metabolic syndrome, theintegration of traditional Chinese medicine (TCM) into the management ofdiabetes and metabolic syndrome has also grown. In hospital clinics, over70% of adult patients with type-2 diabetes used both TCM and Western med-icine [3, 4]. Over a 25-year period between 1981 and 2005, 511 clinical trials ofTCM included 33,274 patients with type-2 diabetes. The majority (96%) ofthe patients had integrated treatment with TCM and Western medicines [5].This review expounds evidence from clinical and pharmacological studies ofTCM in the treatment of diabetes.
The clinical studies included in this review meet the following criteria [6]:(1) controlled trials; (2) adult participants (18 years or older) with type-2diabetes; (3) documented diagnostic criteria of type-2 diabetes; (4) interven-tion of TCM including Chinese herbal medicines and Chinese proprietarymedicines for a duration of at least 1 month; (5) outcomes of all-cause mor-tality, cardiocerebrovascular events, quality of life, symptom-relief rate andnormalization of blood glucose, and (6) adverse events (death, stroke, hypo-glycemia, liver toxicity, kidney damage). Major findings from relevant mecha-nistic and pharmacological studies were highlighted to provide insightexplanations of clinical efficacy. Electronic databases on Wan Fang data (827Chinese medical journals by July, Week 3, 2005), Cochrane Library (2ndQuarter, 2005), and MEDLINE (1966 to July, Week 2, 2005) were searchedusing the index terms for type-2 diabetes, clinical trials and Chinese medi-cine. Relative risk (RR) with 95% confidential interval (CI) was used toexpress data extracted from the controlled trials of TCM.
Traditional Chinese Medicine
TCM is both an art and a science of patient-centered healing with com-bined attention to body, mind, and spirit. Knowledge of TCM has beenenriched for over 4,000 years of observation, investigation and clinical experi-ence. The philosophy of TCM is rooted in Chinese cultures of Taoism (to fol-low nature’s way) and Confucius (to nurture humanity and morality) and thereligion of Buddhism (to free from suffering). Traditionally, TCM doctors are
Zhao/Tong/Chan
16

usually pharmacists and pharmacologists who themselves identify and collectherbs, prepare formulation and follow up their patients. Most of the publishedclinical trials of TCM were conducted by TCM doctors.
TCM includes Chinese herbal medicine (CHM), acupuncture and special-ized disciplines of surgery, orthopedics, pediatrics, and obstetrics and gyne-cology. Qigong (energy practice), Tuina (massage), Chinese martial arts,and diet per se are not representatives of TCM, although diet therapy is animportant modality in disease management. Chinese herbs and herbal prod-ucts are not necessarily the same term of TCM. In literature, TCM is charac-terized by individualized treatments based on the differentiation of syndrome(Zheng).
CHM is the major modality in TCM practice. A prescription for CHMusually refers to a compound recipe (Fu Fang) that consists of principal,assistant, adjuvant, and guiding herbs to maximize therapeutic effects andminimize toxic effects. Ingredients in a CHM prescription are individualizedand changed on a weekly basis to tailor for the patient’s age, gender, symp-toms, anthropological characters, geological location and living environment.From a literature review, approximately 1,200 recipes and 150 herbs for dia-betes, metabolic syndrome and associated complications have been docu-mented since 1980 [5, 7–9]. Table 1 lists the Chinese herbs and classic recipescommonly used in clinical trials in diabetes and diabetic complications [5, 7, 8].Although the bioactive components of most medicinal herbs remain unknown,several kinds of chemical compounds have reported properties for loweringblood glucose, increasing insulin secretion, and improving insulin resistance[7, 10]. The compounds extracted from Chinese herbal medicines includeflavonoids, xanthones, triterpenoids, alkaloids, glycosides, alkyldisulfides,aminobutyric acid derivatives, guanidine, polysaccharides, peptides, and min-erals [7, 10, 11].
Symptom Relief
TCM is particularly effective in symptom relief. A systemic review of 6 clin-ical trails by Liu et al. [6] reported that most of the type-2 diabetic patientsreceiving CHM experienced an improvement in symptoms of dry mouth,polyphagia, polydipsia, polyuria, fatigue, sweating, constipation, numb limbs,and low back pain (table 2). Improvement rates were higher in patientsreceiving CHM than those treated with antidiabetic drugs (table 2). Afterusing either CHM alone or integrated CHM and Western medicine for at least2 months, symptoms also substantially improved in most (�80%) of thepatients with diabetic complications. Reported complications include diabeticgastroparesis [12–16], nephropathy [17–25], neuropathy [26–44], retinopathy[45–47], gangrene [48, 49], peripheral vascular disease [50–52], and myocar-dial infarction [53].
Traditional Chinese Medicine in the Treatment of Diabetes
17

Zhao/Tong/Chan
18
Table 1. Traditional Chinese medicine for diabetes mellitus
SSiinnggllee hheerrbbss –– CChhiinneessee PPiinn YYiinn aanndd EEnngglliisshh nnaammeeBai Zhu Ovate atractylodesBai Shao White peony rootBan Xia PinelliaBian Dou Hyacinth beanCan E Silkworm mothCang Zhu Atractylodes rootChai Hu Bupleurum rootChi Shao Red Peony rootChi Xiao Dou AdsukibeanChuan Xiong Ligusticum rootDa Huang RhubarbDan Pi Moutan barkDan Shen Salvia rootDang Gui AngelicaDang Shen Codonopsis rootDi Gu Pi Lycium root barkDu Zhong Eucommia barkE Zhu ZedoaryFu Ling PoriaGan Cao Liquorice rootGe Gen Pueraria rootGou Ji Cibotium rootHuai Niu Xi Achyranthes rootHuang Bai Phellodendron barkHuang Jing Polygonatum rootHuang Lian Coptis rootHuang Qi Astragalus rootHuang Qin Scutellaria rootJiang Can SilkwormJin Ying Zi Cherokee rose fruitLi He Litchee pitMai Dong Ophiopogon tuberNiu Bang Zi Arctium seedRen Shen GinsengSan Qi Notoginseng rootSang Pi Mulberry root barkSang Piao Xiao Mantis egg-case powderSang Shen Zi MulberrySang Ye Mulberry leafSha Ren Amomum fruitShan Dou Gen Root of straight sophoraShan Yao Dioscorea rootShan Zha Crataegus fruitShan Zhu Yu Asiatic cornelian cherry fruitShe Chuang Zi Cnidium seedSheng Di Huang Dried rehmannia rootSheng Shai Shen Panax ginsengShi Gao GypsumShi Hu Dendrobium

Traditional Chinese Medicine in the Treatment of Diabetes
19
Table 1. (continued)
Shu Di Huang Cooked rehmannia rootTai Zi Shen Pseudostellaria rootTao Ren Peach kernelTian Dong Arisaema tuberTian Hua Fen Trichosanthes rootWu Wei Zi Schisandra berryXi Yang Shen American ginsengXian Ling Pi Epimedium herbXuan Shen Scrophularia rootYi Mi Coix seedYi Mu Cao LeonurusYu Zhu Solomon’s seal rootZe Xie Alisma tuberZhi Mu Anemarrhena rootZhu Ling Polyporus
CCllaassssiicc rreecciippeess aanndd iinnggrreeddiieennttss –– CChhiinneessee PPiinn YYiinn aanndd EEnngglliisshh nnaammeeBaihu Tang Shi Gao (gypsum)(white tiger decoction) Zhi Mu (wind-weed rhizome)
Gan Cao (prepared licorice root)Geng Mi (polished round-grained nonglutious rice)
Buyang Huanwu Tang 1) Huang Qi (astragalus root)(decoction invigorating 2) Dang Gui (Chinese angelica root)Yang for recuperation) 3) Chi Shao (red peony root)
4) Chuan Xiong (Chuanxiong rhizome)5) Tao Ren (peach kernel)6) Hong Hua (safflower)7) Di Long (earthworm)
Liuwei Dihuang Wan Shu Di Huang (prepared rhizome of rehmannia)(bolus of rehmannia six) Shan Zhu Yu (dogwood fruit)
Shan Yao (dried Chinese yam)Ze Xie (oriental water plantain)Fu Ling (poria)Mu Dan Pi (mountain bark)
Shen Qi Wan Di Huang (dried rehmannia)(bolus invigorating the Shan Yao (Chinese yam)kidney Qi) Shan Zhu Yu (dogwood fruit)
Ze Xie (oriental water plantain)Fu Ling (poria)Mu Dan Pi (mountain bark)Gui Zhi (cinnamon twig)Fu Zi (prepared aconite root)
Yu Quan Wan Ge Gen (pueraria root)(jade spring bolus) Tian Hua Fen (trichosanthes root)
Mai Dong (ophiopogon tuber)Sheng Di Huang (dried rehmannia root)Geng Mi (polished round-grained nonglutinous rice)Gan Cao (prepared licorice root)Wu Wei Zi (schisandra berry)

Glycemic Control
Most of the clinical trials showed that CHM recipes were effective inglycemic control [6]. Glycemic control was measured with surrogate parame-ters including fasting and postprandial blood glucose and glycosylated hemo-globin (HbA1c) [6]. Normalization of blood glucose was defined by a fastingblood glucose of �7.3 mmol/l or a postprandial blood glucose of �8.2 mmol/l[6]. Data from 78 controlled clinical trials showed the rate of normalizingblood glucose was higher in diabetic patients using CHM compared withcontrol subjects (table 3) [6]. As a whole CHM appeared at least as effectiveas orthodox antidiabetic drugs in reducing blood glucose and HbA1c [6]. Theblood glucose-lowering effects of CHM are probably related to enhancedinsulin secretion [6] and improved insulin resistance [54].
Secondary Failure to Antidiabetic Drugs
Secondary failure to antidiabetic drugs substantially limits the effective-ness of Western drugs in the management of diabetes. Clinical trails haverevealed that CHM and acupuncture in combination with Western medicineare effective in rescuing the secondary failure in patients with type-2 dia-betes. Table 4 shows rates of improvement in glycemic control, as defined bya fasting plasma glucose of �8.2 mmol/l plus symptom relief. The improve-ment rate was higher in patients (total number � 300) treated with inte-grated Chinese and Western medicine than those (total number � 296)receiving Western medicine alone in 5 controlled trials (RR � 1.1, 95% CI1.02–1.18, p � 0.01) [55–59].
Zhao/Tong/Chan
20
Table 2. Improvement rates (%) of diabetic symptoms in 35 clinical trials of Chinesemedicine
Chinese Western RR p valuemedicine medicine (95% CI)
Dry mouth 91.7 (1,587/1,730) 74.6 (930/1,247) 1.2 (1.19–1.27) �0.0001Polyphagia/polydipsia/
Polyuria 91.2 (1,484/1,616) 74.2 (827/1,114) 1.2 (1.19–1.28) �0.0001Fatigue 89.2 (1,650/1,849) 70.0 (897/1,281) 1.3 (1.23–1.33) �0.0001Sweating 89.5 (1,359/1,518) 70.1 (794/1,122) 1.3 (1.23–1.33) �0.0001Constipation 91.1 (1,327/1,456) 71.3 (724/1,155) 1.3 (1.22–1.32) �0.0001Numb limbs 91.8 (1,305/1,427) 72.9 (806/1,105) 1.3 (1.21–1.30) �0.0001Low back pain 89.9 (1,418/1,578) 72.9 (841/1,153) 1.2 (1.19–1.28) �0.0001

Traditional Chinese Medicine in the Treatment of Diabetes
21
Table 3. Normalization of fasting blood glucose levels in 78 trials
Number Normalization Relative risk p value Numberof patients % (95% CI) of trials
Chinese medicine � 30 60 (n � 18) 3.0 0.0033 1diet (1.39–6.50)
Diet 30 20 (n � 6)
Chinese medicine 226 28.3 (n � 64) 2.0 0.0002 6(1.38–2.99)
Placebo 222 14.0 (n � 31)
Chinese medicine 1,546 52.9 (n � 813) 1.3 �0.0001 19(1.22–1.47)
Oral antidiabetic 918 39.2 (n � 360)drugs
Chinese medicine � 2,735 48.3 (n � 1,321) 1.5 �0.0001 48oral antidiabetic (1.36–1.73)drugs
Oral antidiabetic 2,088 30.7 (n � 640)drugs
Chinese medicine � 1,045 41.0 (n � 428) 1.8 �0.0001 4oral antidiabetic (1.44–2.31)drugs
Yu Quan Wan 258 22.5 (n � 58)
Normalization of blood glucose is defined by a fasting blood glucose of �7.3 mmol/lor a postprandial blood glucose of �8.2 mmol/l [6].
Table 4. Efficacy of Chinese medicine in rescuing secondary failure to oral antidiabeticdrugs
Controlled trial Efficacy rate % (n) Reference
Xiao Ke Wan 82.7 (81/98) Shi [56], 2000Glibenclamide 64.1 (41/64)Yiqi Yangyin � tolbutamide � 93.3 (56/60) Wang and Hu [57], 2001
metforminTolbutamide � metformin 67.9 (38/56)Acupucture � Berberine � yeast � 100 (80/80) Xue and Li [58], 2001
glibenclamide � metforminGlibenclamide � metformin 100 (80/80)Insulin 87.5 (35/40)Jiaweitaohechengqitang 73.2 (30/41) Zhu et al. [59], 2002Metformin 75.7 (28/37)Jiaweitaohechengqitang 71.4 (15/21) Chen et al. [55], 2004Rosiglitazone 73.7 (14/19)
Efficacy is defined by a fasting blood glucose of �8.2 mmol/l plus symptomsrelieving.

Adverse Effects
CHM is well tolerated and relatively safe in clinical use. Adverse reactionsrelated to CHM use are uncommon. Approximately 5% of the total adverseevents and drug-related deaths are caused by the use of CHM. Most of thetrials in diabetes and metabolic syndrome revealed no adverse effects duringCHM treatment [6]. Nonserious adverse events associated with CHM treat-ment included diarrhea, abdominal pain, nausea, and loss of appetite [6].
The blood glucose-lowering effect of CHM may turn into adverse eventssuch as hypoglycemia if misused. For example, Xiao Ke Wan is a widelyused drug composed of six herbs (Di Huang, Ge Gen, Huang Qi, Shan
Yao, Tian Hua Fen, Wu Wei Zi) and 0.25 mg glyburide. The drug is indi-cated for type-2 diabetic patients with a deficiency syndrome of both Yin
and Qi. It is estimated that the incidence of hypoglycemia is 5% in Xiao Ke
Wan users [60, 61]. The risk of hypoglycemia is even alarming in elderly sub-jects, individuals with impaired hepatic and renal function, patients withacute infection, and in patients who concomitantly use insulin or otherantidiabetic drugs [62]. Among 311 incidental cases with hypoglycemiareported in 15 clinical studies, 92 (29.6%), 9 (2.9%), 76 (24.4%), and 113(36.3%) were caused by using Xiao Ke Wan, CHM, insulin and oral anti-diabetic drugs, respectively [60, 61]. Moreover, patients with Xiao Ke Wan-induced hypoglycemia had a high risk of death (3.3%) and stroke (9.8%)[63]. Therefore, extreme caution should be taken to prevent hypoglycemiaand other serious adverse events when the Chinese herbal medicine is con-comitantly used with orthodox drugs [64, 65].
Conclusions
TCM is an individualized treatment based on differentiation of the syn-drome. CHM as a whole is effective and relatively safe in relieving symptoms,controlling hyperglycemia, and rescuing secondary failure in patients with dia-betes. Long-term controlled clinical investigations will disclose the effective-ness of Chinese medicine in reducing the mortality and morbidity of chroniccomplications in patients with diabetes. The majority of Chinese patients withdiabetes use both Chinese medicine and orthodox drugs. In parallel to the epi-demic tend of diabetes and increased use of integrated Chinese and Westernmedicine, herb-drug interactions may substantially occur when herbs are mis-used. Overdoses, improper preparation, erroneous substitution, adulterationwith Western drugs or heavy metals, and self-meditation in using CHM cancause serious problems including hypoglycemic coma and death. Chinese medi-cine should be used cautiously following doctors’ prescription and supervision.Doctors should always obtain a complete history on the use of both Chinesemedicine and Western drugs in the clinical assessment and prescription.
Zhao/Tong/Chan
22

Acknowledgements
We thank Dr. Sui Yi for her assistance in the literature search and data analysis.This paper is dedicated to the late Prof. Julian A.J.H. Critchley.
References
1 Ministry of Health People’s Republic of China: The 4th National Survey of Nutrition and Healthof the Chinese People. http://www.moh.gov.cn/statistics/year2004/. Accessed on 6 June 2005.
2 Li ZY, Xu GB, Xia TA: Prevalence rate of metabolic syndrome and dyslipidemia in a large pro-fessional population in Beijing. Atherosclerosis 2006;184:188–192.
3 Chen Q, Zhao HL, Tong PCY, et al: Chinese herbal medicine in diabetes management (P1962).Diabetes Metab 2003;29(suppl):S170.
4 Zhao HL, Chen Q, Hao AZ, et al: Prescription frequency of herbal medicines in Chinesepatients with type 2 diabetes mellitus. Atherosclerosis 2003;181(suppl):337–338.
5 Chen DY, Ge JY, Zhou DS, et al: Review of 23139 patients with type 2 diabetes treated Chinesemedicine (in Chinese). Chin Arch Chin Med 2003;21:1225–1228.
6 Liu JP, Zhang M, Wang WY, Grimsgaard S: Chinese herbal medicines for type 2 diabetes melli-tus. Cochrane Database Syst Rev 2004, CD003642.
7 Bailey CJ, Day C: Traditional plant medicines as treatments for diabetes. Diabetes Care1989;12:553–564.
8 Zhou L, Zhou XF, Fu C, Wang Q: Chinese herbs in 271 compound recipes for diabetes (inChinese). N J Trad Chin Med 2004;36:40–41.
9 Lin L: Progress in diabetes research of traditional Chinese medicine; in Lin L (ed):Diabetology of Integrated Chinese and Western Medicine. Beijing, China Medical Science &Technology Publishing House, 1999, pp 15–33.
10 Li WL, Zheng HC, Bukuru J, De Kimpe N: Natural medicines used in the traditional Chinesemedical system for therapy of diabetes mellitus. J Ethnopharmacol 2004;92:1–21.
11 Jia W, Gao WY, Xiao PG: Antidiabetic drugs of plant origin used in China: compositions, phar-macology, and hypoglycemic machanisms. China J Chin Mat Med 2003;28:108–113.
12 Cai W: Clinical observation of 82 patients with diabetic gastroparesis treated with Xuefuzhuyudecoction (in Chinese). Jiangxi J Trad Chin Med 2004;35:27.
13 Dai HL, Song GQ: Clinical observation of 25 patients with diabetic gastroparesis treated withcombination of Chinese and western medicine (in Chinese). Shandong J Trad Chin Med2004;23:351–352.
14 Liang H, Sun YK: Combined treatment with Chinese and western medicine for diabetic gas-troparesis: a report of 106 cases (in Chinese). Chin J Folk Med 2004;12:4–5.
15 Qiu YM, Shan JW, Hu TC: Controlled study of Banxiaxiexin decoction in 35 patients with dia-betic gastroparesis (in Chinese). Fujian J Trad Chin Med 2004;35:24.
16 Tian BP, Hu B: Treatment with Chinese medicine based on differentiation of syndrome in 48patients with diabetic gastroparesis (in Chinese). Liaoning J Trad Chin Med 2004;31:725–726.
17 Du X, Jin MW: Diyutangshen tablet for diabetic nephropathy of deficiency of Yin and Qi withinternal heat and blood stasis (in Chinese). Chin J Pract Chin Mod Med 2004;4:3584–3586.
18 Jha V, Chugh KS: Nephropathy associated with animal, plant, and chemical toxins in the trop-ics. Semin Nephrol 2003;23:49–65.
19 Zheng JQ, Li H, Lv SG: Integrated treatment with Chinese and western medicine in 86 type 2diabetic patients with nephropathy (in Chinese). Fujian Med J 2004;26:123–124.
20 Sun WS, Wu XL, Qiao CL, Liu R: Clinical study on effect of Tongluo capsule in treating dia-betic nephropathy caused chronic renal failure (in Chinese). Chin J Integr Chin West Med2004;24:704–706.
21 Dong KL, Li LM, Li GC: Clinical observation of combined treatment with Chinese and westernmedicine in 60 patients with diabetic nephropathy (in Chinese). Hunan J Trad Chin Med2004;20:25–27.
22 Fu XJ, Zhang HE, Liu JH, et al: Clinical study of Qi Zhi formula in early diabetic nephropathy(in Chinese). Chin J Integr Chin West Med Nephrol 2004;5:535–536.
Traditional Chinese Medicine in the Treatment of Diabetes
23

23 Meng HL: Clinical observation of combined treatment with Chinese and western medicine in45 patients with diabetic nephropathy (in Chinese). Forum Trad Chin Med 2004;19:40.
24 Huang BT, Tian YQ: Clinical observation of Tangshenning II in diabetic nephropathy: a reportof 43 cases. New J Trad Chin Med 2004;36:36–37.
25 Huang MH, Gan XB, Chen JS: Clinical observation of Shen Kang I and II in diabetic nephropa-thy (in Chinese). Chin J Integr Chin West Med Nephrol 2004;5:409–410.
26 Abuaisha BB, Costanzi JB, Boulton AJ: Acupuncture for the treatment of chronic painfulperipheral diabetic neuropathy: a long-term study. Diabetes Res Clin Pract 1998;39:115–121.
27 Qian ZR, Zhong XL, Fang YA: Traditional Chinese medicine combined with Western medicinein the treatment of diabetic peripheral neuropathy (in Chinese). Zhong Xi Yi Jie He Za Zhi1987;7:131, 140–142.
28 Xu XF, Xu W: Treating 42 diabetic peripheral neuropathy with Chinese – western method (inChinese). Inner Mongolia Med J 2004;36:182–183.
29 Lv YH: Jiangtang Tongluo Tang in treatment of 35 diabetic patients with neuropathy (inChinese). Trad Chin Med Res 2004;17:42.
30 Wang XZ: Treatment with Xianteng Huoluo Yin in 30 cases of diabetic patients with neuropa-thy – clinical report (in Chinese). Beijing J Trad Chin Med 2004;23:289–291.
31 Zhang ZH, Li P: Huangqi Guizhi Wuwu Tang in treatment of 34 cases with diabetic neuropathy(in Chinese). J Pract Trad Chin Med 2004;20:4.
32 Gao YS: Buyang Huanwu Tang in treatment of 70 cases with diabetic neuropathy (inChinese). Hunan J Trad Chin Med 2004;20:19–20.
33 Li P: Yiqi Yangyin Huoxue Tang in treatment of 80 cases with diabetic neuropathy (inChinese). J Sichuan Trad Chin Med 2004;22:44.
34 Mu JP: Clinical observation of integrated traditional Chinese and western medicine in treatmentof 97 cases with diabetic neuropathy (in Chinese). J Sichuan Trad Chin Med 2004;22: 34–35.
35 Xu SS: Clinical observation of Wenyang Huayu meathod in treatment of old diabetic neuropa-thy (in Chinese). Liaoning J Trad Chin Med 2004;31:376.
36 Gao Z: Integrated traditional Chinese and western medicine in treatment of 34 cases withmultiple diabetic neuropathy (in Chinese). Jiangxi J Trad Chin Med 2004;25–27:25.
37 Zhou J, Wu JL, Zhang YX, Wu ST: Yiqi Huoxue Tongmai Tang in treatment of 70 cases withdiabetic peripheral neuropathy (in Chinese). J Chin Med Pharmacol Inform 2004;11:153–154.
38 Meng HL: Huoshen Buxue Tang in treatment of 39 cases with diabetic neuropathy (inChinese). Forum Trad Chin Med 2004;19:31–32.
39 Zhang DF: Tangluotong in treatment of 100 cases with diabetic peripheral neuropathy (inChinese). Trad Chin Med Res 2004;17:34.
40 Hu YH, Sun ZX, Li J, Wu ST: Clinical observation of integrated traditional Chinese and west-ern medicine in treatment of diabetic peripheral neuropathy (in Chinese). Chin Sci TechnolChin Med 2004;11:111–112.
41 Yu HY: Integrated traditional Chinese western medicine in treatment of 55 cases with diabeticneuropathy (in Chinese). Ji Lin J Trad Chin Med 2004;25:35.
42 Xiao W: Treatment of diabetic neuropathy of lower limbs with acupuncture, cupping andhypoglycemic agents: a report of 38 cases (in Chinese). J Anhui Trad Chin Med Coll2004;23:22–24.
43 Peng JS: Combination of Dengzhanhuasu and Nimodipine in treatment of 52 cases of diabeticmultiple neuropathy (in Chinese). J Chin Phys 2004;6:130–131.
44 Dou ZX: Juanbi Tongluo capsules in treatment of 36 cases with diabetic peripheral neuropa-thy (in Chinese). Forum Trad Chin Med 2004;19:33.
45 Zhou XD, You ML, Luo LL: Clinical observation of combined treatment with Zhuyu Huoxuedecoction and urokinase in diabetic patients with vitreous hematoma (in Chinese).Guangming J Trad Chin Med 2004;19:27–29.
46 Wei W, Wei CH: Clinical observation of integrated traditional Chinese and western medicine intreatment of diabetic retinopathy and macula edema (in Chinese). Jiangsu J Trad Chin MedPharmacol 2004;25:35.
47 Wang YC, Mao QB, Li JH, et al: Clinical observation of traditional Chinese medicine based ondifferentiation of syndrome in diabetic retinopathy (in Chinese). Mod J Integr Trad Chin WestMed 2004;13:1018–1019.
48 Li JS: Clinical observation on 45 cases of diabetic gangrene treated by the combination ofChinese medicine and west medicine (in Chinese). Forum Trad Chin Med 2004;19:36.
Zhao/Tong/Chan
24

49 Xia JC, Zhai S, Yang XZ: Clinical observation on 24 cases of diabetic gangrene treated by thecombination of Chinese medicine and west medicine (in Chinese). Hunan Guid J Trad ChinMed 2004;10:24–25.
50 He X: Tongluo Huoxue decoction in treatment of 37 cases with diabetic vascular changes oflower limbs (in Chinese). J Zhejiang Univ Trad Chin Med 2004;28:53–54.
51 Wang YJ, Wang XK, Chen LP: Effects of Danggui Sini decoction and Lulutong injection ontreating diabetes leg arteriosclerosis obliterans (in Chinese). Chin J Basic Med Trad Chin Med2004;10:60–62.
52 Zhang GH, Lin XZ: Buyang Huanwu decoction in treatment of early diabetic peripheral vas-cular changes: clinical observation of 61 cases (in Chinese). J Henan Univ Chin Med2004;19:61.
53 Wang RP, Zhou HP: Controlled study of Gegenyin in 60 diabetic patients with myocardialinfarction (in Chinese). Chin Arch Chin Med 2004;22:361–362.
54 Cheng JT, Liu IM, Chi TC, et al: Metformin-like effects of Quei Fu Di Huang Wan, a Chineseherbal mixture, on streptozotocin-induced diabetic rat. Horm Metab Res 2001;33:727–732.
55 Chen P, Zhu ZZ, Lang JM, et al: Jiaweitaohechengqitang for secondary failure to sulfonylureain type 2 diabetes (in Chinese). Chin J Integr Trad West Med 2004;24:585–588.
56 Shi MY: Xiao Ke Wan and glibenclamide for secondary failure to sulfonylurea in type 2 dia-betes (in Chinese). Anhui J Trad Chin Med 2000;13:173–175.
57 Wang JS, Hu WJ: Yiqi Yangyin Recipe for diabetic patients with secondary failure to sulfony-lurea (in Chinese). Chin J Clin Healthcare 2001;4:188–189.
58 Xue RJ, Li PZ: Integrated treatment withacupucture and Western medicine for secondary fail-ure in type 2 diabetes (in Chinese). Liaoning J Trad Chin Med 2001;28:40–41.
59 Zhu ZZ, Xiong MQ, Lin AZ, et al: Jiaweitaohechengqitang improves insulin resistance in type2 diabetic patients with secondary failure to sulfonylurea (in Chinese). Chin J Inform TradChin Med 2002;9:25–27.
60 Li XW, Tang SW, Yan YH, et al: Analysis on hypoglycemia in the subjects with diabetes (inChinese). Acta Acad Med Zun Yi 2002;25:423–424.
61 Cheng GL, Zhang RF: Clinical analysis of 88 cases with hypoglycemia (in Chinese). J JinzhouMed Coll 2004;25:58.
62 Zhang WH: Hypoglycemia in 17 cases treated with anti-diabetic agents (in Chinese). ClinMisdiagn Misther 2003;16:144–145.
63 Dai JP: Xiao Ke Wan induced hypoglycemic coma in 20 cases (in Chinese). J Xianning MedColl 2001;15:67.
64 Chan TY, Chan JC, Tomlinson B, Critchley JA: Chinese herbal medicines revisited: a HongKong perspective. Lancet 1993;342:1532–1534.
65 Tomlinson B, Chan TY, Chan JC, et al: Toxicity of complementary therapies: an eastern per-spective. J Clin Pharmacol 2000;40:451–456.
Discussion
Dr. Katsilambros: I enjoyed your lecture very much. As I don’t come from China Ihave no idea about rehmannia. What kind of substance is it? How long can rehmanniabe administered for type-2 diabetes? What were the results with regard to glycemia,metabolic factors, complications, and other factors including mortality and survival?What was the greatest length of time that this medication could be given to type-2 dia-betic people?
Dr. Zhao: In contrast to chemical drugs synthesized with monomers, traditionalChinese medications contain lots of plant-derived substances and compounds includ-ing alkaloids, flavonoids, glycosides, peptides, saponins, triterpenoids and xanthones[1]. Compounds purified from Chinese herbal medicines are disappointing because oftheir decreased therapeutic effects and increased toxicity when compared to the tra-ditional Chinese decoction. I speculate that all six herbs in the rehmannia recipework synergistically to enhance the body’s self-healing capacity in correcting multiple
Traditional Chinese Medicine in the Treatment of Diabetes
25

metabolic abnormalities. Animal studies have shown that Cornus officinalis is themajor contributor to the hypoglycemic action of rehmannia six [2]. In type-2 diabeticrats, an alcohol extract of cornus improved glucose tolerance associated with an eleva-tion in the blood insulin level [3] and enhanced muscle GLUT4 expression [4]. In strep-tozotocin-induced diabetic rats, iridoid glucoside of the cornus extract attenuatedmicroalbuminuria and glomerular damage [5]. In the clinical practice of traditionalChinese medicine, a minimal 1-month duration of treatment is required for patientswith type-2 diabetes to show the benefits of symptom relief and improved glycemicand other metabolic control [6, 7]. Intervention with rehmannia six and lifestyle modi-fication for 18–24 months significantly prevent the development of type-2 diabetesfrom impaired glucose tolerance [8, 9]. In a 3-month controlled clinical trial of 68 type-2 diabetic patients with microalbuminuria, combined treatment with rehmannia sixand captopril was better than captopril alone in delaying renal treatment [10]. To myknowledge, no clinical data are available regarding the efficacy of Chinese medicineson mortality and survival. Treatment is not the most important concept of traditionalChinese medicine. The most important thing for our physicians is the right judgment.If the right judgment is made as well as a very early diagnosis, then with some medicalprescription there is a better chance of successful treatment of the patient.
Dr. Chiasson: I also enjoyed your presentation very much and I think that it showshow one can take advantage of these thousands of years of experience with traditionalChinese medicine and bring it to the clinical bedside with a better understanding ofhow it works. Is there any effort being made to try to isolate the active ingredients inrehmannia six? You said that the toxicity may be increased by purification, but Ithought that toxicity was due mainly to the heavy metal in those plants. All plants willcarry different ingredients depending on where they grow, so the substances withinthe plant can vary. How is the dosage of rehmannia six decided upon?
Dr. Zhao: Traditional medicine is widely used in most counties and communities.Significant efforts have been directed toward the safe and effective practice of thishistory-proven medicine. Today it is relatively easy to combine Chinese with modernWestern medicine. However, it is very difficult to validate these two medical systemsin terms of one another. Firstly, traditional Chinese medicines are defined neither bychemical structures nor by indications of specific diseases. Instead, traditionalChinese medicines are characterized by four properties of cold, hot, cool or warm, fiveflavors of bitter, pungent, salty, sour or sweet, and four actions in the downward (low-ering), upward (lifting), outward (floating) or inward (sinking) directions [11]. A clas-sic prescription of traditional Chinese medications usually contains several herbs tohelp the body to restore homeostasis. In the case of the rehmannia six recipe, thedosages are 24 g rehmannia, 12 g of cornus and dioscorea, and 9 g of mutan bark,alisma and poria. All six raw herbs are prepared in decoction and are taken orally 2–3times/day. The dosages may be modified individually, tailored to the patient’s clinicalconditions. This time-honored antidiabetic remedy has proven efficacy and safety pro-files. In contrast, chemical substances purified with all the modern technologies weremore toxic and even less effective compared with the classic preparation of decoction.The development of new chemical drugs from Chinese medications is a great chal-lenge. Secondly, Chinese medicines are mostly derived from natural products ofplants, animals and minerals. Due to environmental pollution, widespread use ofchemical fertilizers and pesticides, the population explosion, overspending and otherreasons, large numbers of wild plants and animals are endangered, and the naturalresources for Chinese medications have decreased. Moreover, heavy metal contamina-tions [12], adulteration with chemical drugs, and abuse of Chinese medications are theeminent problems associated with increased severe adverse events. Genetic hetero-geneity was found in the marketing of Chinese herbs including rehmannia [13].To assure the safety and effectiveness of Chinese medications, good agricultural,
Zhao/Tong/Chan
26

manufacturing and clinical practices are implemented. Despite the shared therapeuticgoals, traditional Chinese medicine and modern Western medicine use significantlydifferent approaches in the treatment of diabetes. Traditional Chinese medicine is aholistic and individualized treatment in terms of diagnosis, prescription, medication,and dosages.
Dr. T. Wilkin: Early in your presentation you showed us a slide suggesting that theinsulin level rose when rehmannia six was given, and in the latter part of your presen-tation that insulin resistance fell. This is conceptually very important in the manage-ment of type-2 diabetes because the view is generally held that stimulation of insulinis perhaps not the appropriate approach but that insulin sensitization would rather beappropriate. Can you tell us which is happening, and which is the more dominant fac-tor because the glucocentric view is probably not the one that we would tend to gowith?
Dr. Zhao: Thank you for your comments. You have just highlighted that rehmanniasix improves glycemia by enhancing insulin secretion and decreasing insulin resist-ance. It is very true that improvement of insulin resistance is central to the manage-ment of the metabolic syndrome.
Dr. Slama: I recall a study perhaps 15 years ago here in China in the region ofBeijing and Shanghai. It was a study between France and China, trying to compare tra-ditional medicine and a Western drug called glibenclamide in type-2 diabetic people.There were 3 groups, and in fact randomization was according to centers and notpatients. At some centers patients were treated only with glibenclamide, other centerstreated patients only with traditional Chinese medicine, and the third group of cen-ters, most interestingly, combined the two approaches. We found that after 6 monthsglibenclamide was efficient in improving blood glucose control, and that the tradi-tional treatment didn’t do anything significant in terms of blood glucose control but,most interestingly, the combination of the two treatments did better than gliben-clamide alone.
Dr. Zhao: Thank you for sharing your findings. Traditional Chinese medicine mayhave limited advantages in lowering blood glucose. Beyond the glucocentric view,Chinese medicine can contribute to the prevention of diabetes in high-risk individuals,prevention of diabetic complications, relieving symptoms, reducing drug resistanceand toxicities, and rescuing secondary failure to chemical drugs [14]. In our survey of3,904 patients with diabetes, 93% used both Chinese and Western medicines [15]. Theadvantage of integrative medicine is unclear [16].
Dr. Slama: Would you agree that we have a double task when treating diabeticpatients. The first one is the prevention of macrovascular complications, but also wehave to fight against blindness, neuropathy and nephropathy, and only by lowering theblood glucose level can we reach this goal. So really we should act on both sides toprevent macro- and microvascular complications and also focus on blood glucose-lowering agents.
Dr. Zhao: I agree with you that high blood glucose is a risk factor associated withthe development of macro- and microvascular complications. In a systematic review of66 randomized trials involving 8,302 subjects, some Chinese herbal medicines showhypoglycemic effects in type-2 diabetes [17]. Novel hypoglycemic agents might beidentified from enriched Chinese medications. But the focus of traditional Chinesemedicine is not glucose. The ultimate goal of Chinese medications is to help the bodyto restore balances for maintaining health.
Dr. Halimi: I have a question about insulin secretion or insulin sensitivity in yourstudies with rehmannia six. You have shown that, in normal Wistar rats receiving thisplant, insulin levels are multiplied about 5 times. Then you presented some datarelated to diabetes prevention in patients with impaired glucose tolerance, or dys-metabolic syndrome, all subjects having normal or subnormal fasting blood glucose
Traditional Chinese Medicine in the Treatment of Diabetes
27

levels. Did they exhibit hypoglycemic episodes with rehmannia six or did they onlynormalize glycemia and insulinemia? Is this situation comparable to sulfonylureas ormetformin?
Dr. Zhao: The philosophical basis of traditional Chinese medicine is the dynamicbalance of Yin-Yang. Eating too much and exercising too little cause imbalancesreflected by syndromes of deficiency and excess in diabetes. In the rehmannia sixrecipe, the deficient syndrome of Yin is supplemented by the herbs rehmannia,dioscorea, and cornus, whereas the excessive syndrome of Yang is cleared by the otherthree herbs, mutan bark, alisma, and poria. The approaches of Chinese and Westernmedicine to healing are completely different. With our ignorance of the philosophicalbasis, it is impossible to make critical judgments of Chinese medicine using theWestern approach.
Dr. Gerasimidi-Vazeou: Is the dose of rehmannia six you tested in animal studiesequivalent to the one you gave to humans? What is the toxicity of the ingredients?Have you performed any toxicity experiments?
Dr. Zhao: Repeated oral administration of rehmannia six at dosages of 26 mg/kgfor 3 days significantly improved insulin resistance in obese Zucker rats [18]. Thecorresponding clinical dose of each single herb is 8 g of rehmannia, 4 g of cornusand dioscorea, and 3 g of mutan bark, alisma and poria. Each ingredient herb is poten-tially toxic. However, when the six herbs are prepared as a decoction, adverse eventsare rare and minor. The major problem associated with rehmannia six is overuse.
Dr. Gerasimidi-Vazeou: You said that the ingredients of the recipe changeaccording to the physician’s estimate of his patients. In animal studies you used a stan-dardized recipe but what about humans? What happens with the dosage of severalingredients you use to make the recipe for every single patient? How do you changethe dosage of the ingredients, and how much is this standardized?
Dr. Zhao: Documented in the China Pharmacopoeia 2000 are the standards fortraditional Chinese medicines. One gram of rehmannia six should contain at least1.0 mg of paeonol (Dan Pi Fen).
Dr. Gerasimidi-Vazeou: What I am trying to ask you is whether there are consis-tent standardized ingredients in the recipe you use for humans because you said thatyou change the ratio between ingredients? What about the data related to the humanstudies you presented, have you tested a standard recipe or not?
Dr. Zhao: Paeonol is the standard ingredient extracted from mutan bark.Dr. Bantle: I have a question about the rehmannia six supply. Where does it come
from? Is it made by pharmaceutical companies? What other sort of preparation does itundergo?
Dr. Zhao: There are over 10 manufacturers producing rehmannia six with differ-ent dosage forms. Rehmannia six may be prepared as a decoction by boiling the sixherbs.
Dr. Hill: You mentioned that almost 77% of the population use both traditional andWestern medicine. Does this mean that a lot of the physicians are trained in both, ordoes it mean that people go both to a traditional physician and a Western medicinephysician?
Dr. Zhao: Doctors may prescribe both Chinese and Western medicine. Westernmedicines are available both by prescription and ‘over the counter’, as is also the casefor Chinese medicines. Alternatively, patients can also see physicians who practicetraditional Chinese medicine as well as Western medical doctors.
Dr. Hill: Are there many physicians who are trained in both traditional andWestern medicine?
Dr. Zhao: In mainland China, most doctors have been trained in both Chinese andWestern medicine. General hospitals in China provide services in both Western andtraditional Chinese medicine. So the patients can benefit from both systems.
Zhao/Tong/Chan
28

Dr. Mingdao Chen: Most doctors are trained in Western style medicine butthey still use the traditional Chinese medicine to complement Western medicine. Theylearn traditional Chinese medicine at university, as I did, over several months. I usetraditional Chinese medicine to supplement normal treatment, and on the other handthe traditional Chinese medical doctors also use Western medicine. This system is par-ticularly important in China and the patients benefit from this system.
Dr. Zhao: Indeed, two opinions are better than one. In the future I expect to see anincrease in adverse events and drug interactions published in the literature because ofthe increased use of combined traditional Chinese and Western medicine.
References
1 Li WL, Zheng HC, Bukuru J, De Kimpe N: Natural medicines used in the traditional Chinesemedical system for therapy of diabetes mellitus. J Ethnopharmacol 2004;92:1–21.
2 Liou SS, Liu IM, Hsu SF, Cheng JT: Corni fructus as the major herb of Die-Huang-Wan for low-ering plasma glucose in Wistar rats. J Pharm Pharmacol 2004;56:1443–1447.
3 Qian DS, Luo L, He M, et al: Therapeutic effect of alcohol extract of Cornus officinalis Sieb. etZucc on postmeal insulin and blood glucose concentrations in NIDDM rats. J Nantong UnivMed Sci 2000;20:337–339.
4 Qian DS, Zhu YF, Zhu Q: Effect of alcohol extract of Cornus officinalis Sieb. et Zucc on GLUT4expression in skeletal muscle in type 2 (non-insulin-dependent) diabetic mellitus rats (inChinese). Zhongguo Zhong Yao Za Zhi 2001;26:859–862.
5 Xu HQ, Zhu YF, Zhu Q: Protecting effect of iridoid glycoside in Fructus corni officinalis onexperimental diabetic nephropathy. J Nangjing Univ Tradit Chin Med 2003;19:342–344.
6 Li Y: Rehmannia six and an anti-diabetic decoction in the treatment of 158 patients with type2 diabetes. Liaoning J Tradit Chin Med 2000;27:252–253.
7 Xi YP: Combined treatment with rehmannia six and metformin in 48 patients with type 2 dia-betes. Anhui J Tradit Chin Med 2002;14:5.
8 Zeng YH, Chen F, Wang YS, et al: Combined treatment with traditional Chinese and Westernmedicines in subjects with impaired glucose tolerance. Chin J Integr Med Gastroenterol2000;8:196–198.
9 Wang H, Liang X, Yu XM, Zuo Y: Rehmannia six in the treatment of impaired glucose toler-ance. Liao Ning J Tradit Chin Med 2002;29:58–59.
10 Chen JL, Ling FM: Combined treatment with rehmannia six and captopril in diabetic patientswith microalbuminuria. New J Tradit Chin Med 2004;36:26–27.
11 Zhang E-Q: The Chinese Materia Medica. Shanghai, Shanghai College of Traditional ChineseMedicine Press, 1992.
12 Ma SM, Huang ZY, Wang QE, et al: Determination of harmful elements in rehmannia six bymicrowave digestion and inductively coupled plasma mass spectrometry. J Guangxi NormUniv 2003;20:136–137.
13 Yuan M, Hong Y: Heterogeneity of Chinese medical herbs in Singapore assessed by fluores-cence AFLP analysis. Am J Chin Med 2003;31:773–779.
14 Chen P, Zhu ZZ, Lang JM, et al: Clinical observation on effect of Yiqi Yangyin Huoxue Tongfuprinciple in treating diabetes mellitus type 2 of secondary failure to sulfonylurea agents (inChinese). Zhongguo Zhong Xi Yi Jie He Za Zhi 2004;24:585–588.
15 Chen Q, Zhu ZZ, Lang JM, et al: Chinese herbal medicine in diabetes management (P1962).Diabetes Metab 2003;29(suppl):170.
16 Shi ZX: Peculiar clinical dominance of integrative Chinese and Western medicine (inChinese). Zhongguo Zhong Xi Yi Jie He Za Zhi 2005;25:101–102.
17 Liu JP, Zhang M, Wang WY, Grimsgaard S: Chinese herbal medicines for type 2 diabetes mellitus.Cochrane Database Syst Rev 2005; CD003642; DOI 003610.001002/14651858; CD140036242.pub14651852.
18 Wu YC, Hsu JH, Liu IM, et al: Increase of insulin sensitivity in diabetic rats received die-huang-wan, a herbal mixture used in Chinese traditional medicine. Acta Pharmacol Sin2002;23:1181–1187.
Traditional Chinese Medicine in the Treatment of Diabetes
29


Pharmacological and SurgicalIntervention for the Preventionof Diabetes
Jean-Louis Chiasson
Research Group on Diabetes and Metabolic Regulation, Research Center, Centre hospitalier de l’Université de Montréal and Department of Medicine, Université de Montréal, Montreal, Que., Canada
AbstractThe increasing prevalence of diabetes is reaching epidemic proportion worldwide.
Because of the associated morbidity and mortality, it is exerting major pressure on thehealthcare system. With a better understanding of the pathophysiology of type-2 dia-betes, the concept of primary prevention has emerged. A number of studies have con-firmed that intensive lifestyle modification was very effective in the prevention ofdiabetes in the impaired glucose tolerance (IGT) population. However, maintaininglong-term lifestyle modification is a major challenge. It is, therefore, important to haveother strategies, either pharmacological or surgical, that can be used as an adjunct oralternative to lifestyle modification. The Chinese study showed that metformin andacarbose could reduce the risk of diabetes by 65 and 83%, respectively, in IGT subjects.The efficacy of metformin was confirmed by the Diabetes Prevention Program (31%risk reduction) and that of acarbose by the STOP-NIDDM trial (36% risk reduction) ina similar high-risk population. The TRIPOD study showed that troglitazone couldreduce the risk of diabetes by 55% in Hispanic women with a history of gestational dia-betes. And more recently, the XENDOS study showed that orlistat could reduced therisk of diabetes by 37% in obese subjects when used as an adjunct to an intensivelifestyle program. Three studies have suggested that bariatric surgery in morbidlyobese subjects could reduce the risk of diabetes to near zero. Furthermore, a numberof studies have examined the effect of a renin angiotensin aldosterone system inhibitor,as well as statin and hormone replacement therapy on the prevention of type-2 dia-betes in high-risk subjects as secondary outcomes and have suggested that they couldbe of potential benefit. The accumulating evidence is now overwhelming. Yes, diabetescan be prevented or delayed in high-risk populations. With this new information, weneed to design new strategies to screen high-risk populations and to implement thenew treatments that have proven effective in the prevention of type-2 diabetes.
Copyright © 2006 Nestec Ltd., Vevey/S. Karger AG, Basel
Bantle JP, Slama G (eds): Nutritional Management of Diabetes Mellitus and Dysmetabolic Syndrome.Nestlé Nutr Workshop Ser Clin Perform Program, vol 11, pp 31–42,Nestec Ltd., Vevey/S. Karger AG, Basel, © 2006.
31

We are facing a worldwide explosion in the prevalence of type-2 diabetesmellitus [1]. Because it is associated with high morbidity and excess mortalityimposing a major burden on healthcare cost [2–4], it is definitely one of themajor challenges of the 21st century.
Though it is generally accepted that type-2 diabetes develops in genet-ically susceptible individuals, it is also recognized that it is usually precipi-tated by environmental factors such as sedentary lifestyle and obesity [5, 6].These factors contribute to the development of insulin resistance and, inthose subjects with limited �-cell mass capacity, probably genetically deter-mined, to the development of glucose intolerance, initially impaired glucosetolerance (IGT), and eventually type-2 diabetes [7]. This understanding of thepathophysiology of glucose intolerance served as the rationale for the con-cept of the prevention of type-2 diabetes. This concept has now been con-firmed by a number of prospective trials that have shown that bothnon-pharmacological and pharmacological treatments as well as bariatric sur-gery in a high-risk population with IGT could prevent, or at least delay, theprogression to diabetes.
The evidence for pharmacological and surgical intervention as a meansto prevent or delay the progression of IGT to type-2 diabetes is reviewedhere.
Pharmacological Interventions for the Prevention
of Diabetes as Primary Endpoint
Insulin resistance overstresses the � cells and, in genetically susceptibleindividuals, results in a reduction in their capacity to secrete insulin. Thiscombination of impaired insulin action and secretion will favor the develop-ment of IGT, a prediabetic state characterized by postprandial hyper-glycemia. This moderate postprandial hyperglycemia is sufficient to induceglucose toxicity and further contribute to the progression of IGT to dia-betes. Therefore, it was hypothesized that any pharmacological interven-tion that would decrease insulin resistance and/or the stress on the � cellscould potentially prevent or delay the progression of IGT to type-2 diabetes.Overall, 5 randomized controlled trials have examined the effect of druginterventions on the prevention of diabetes in IGT subjects as a primaryoutcome (table 1).
The Chinese study published in 2001 examined the effect of acarboseand metformin on the incidence of type-2 diabetes in 321 subjects with IGTover a 3-year period [8]. Both acarbose and metformin were effective inreducing the risk of diabetes by 83% (p � 0.0001) and 65% (p � 0.0002),respectively, compared to an incidence of 11.6% in the control group(table 1). The efficacy of both drugs in preventing type-2 diabetes was veryimpressive.
Chiasson
32

The efficacy of metformin in reducing the risk of diabetes in IGT subjectswas confirmed by the Diabetes Prevention Program published in 2002 [9]. Inthis study, 3,234 subjects with IGT were randomized to a lifestyle program,metformin 850 mg b.i.d. or placebo b.i.d., and followed for 2.8 years. Overall,metformin reduced the risk of diabetes by 31% (p � 0.001) based on 2 oralglucose tolerance tests (OGTTs) compared to an incidence of 11.0%/year inthe placebo group (table 1). However, it was less effective in the older sub-jects (�60 years) and the less obese (body mass index �35 kg/m2) [9].
The efficacy of acarbose was also confirmed by the Study to PreventNIDDM trial, also published in 2002 [10]. In this international trial, 1,368 sub-jects with IGT were randomized to acarbose 100 mg or placebo t.i.d. withmeals and followed for an average of 3.3 years. Based on 1 OGTT, acarbosereduced the risk of diabetes by 25% (p � 0.0015) compared to an incidenceof 12.1%/year in the placebo group. If the diagnosis of diabetes was based on2 OGTTs as now recommended by the American Diabetes Association [11],the drug was associated with a 36.4% reduction in the risk of diabetes(p � 0.0003; table 1). The beneficial effect was seen independent of age, gen-der or body mass index.
Also published in 2002, the TRIPOD study examined the effect of troglitazoneon the prevention of diabetes in Hispanic women (n � 236) with a history ofgestational diabetes [12]. The overweight women were randomized to placebo ortroglitazone 400 mg o.d. and followed for 2.5 years. Troglitazone reduced the riskof diabetes by 55% (p � 0.009) compared to the placebo group (incidence �
12.1%/year; table 1). Though troglitazone proved to be an effective drug for pre-vention of diabetes, it was discontinued because of liver toxicity.
Pharmacological and Surgical Intervention for the Prevention of Diabetes
33
Table 1. Pharmacological interventions for the prevention of type-2 diabetes as aprimary outcome
Study Number Intervention Duration Incidence of Riskof subjects of study diabetes in reduction
years control group %%/year
The Chinese 261 Acarbose 3.0 11.6 83study [8] Metformin 3.0 65
The DPP study [9] 2,155 Metformin 2.8 11.0 31The STOP-NIDDM 1,368 Acarbose 3.3 12.1 36
trial [10]The TRIPOD 236 Troglitazone 2.5 12.1 55
study [12]The XENDOS 3,305 Orlistat 4.0 2.25a 37
study [13]
aOnly 21% had IGT and both groups were submitted to an intensive lifestyle-modification program.
More recently, the Xenical in the Prevention of Diabetes in Obese SubjectsStudy assessed the effect of orlistat as an adjunct to a lifestyle-modificationprogram on the prevention of diabetes in obese non-diabetic subjects [13].Overall, 3,305 subjects were submitted to an intensive lifestyle program; only21% had IGT. They were also randomized to orlistat 120 mg or placebo t.i.d.with meals. Both groups lost weight, but it was more important in the orlistatgroup (5.8 versus 3.0 kg; p � 0.001). Orlistat resulted in a 37% reduction inthe risk of diabetes compared to an incidence of 2.25%/year in the placebogroup (p � 0.003; table 1). Despite methodological problems with the study,it does support a preventive effect of orlistat on the development of diabetesin a high-risk population.
The evidence that pharmacological intervention can prevent or delay theprogression of IGT to diabetes is overwhelming (fig. 1). This is definitely true formetformin and acarbose. It is also true for troglitazone but unfortunately it isliver toxic and has been taken off the market. It is hoped that the other thiazo-lidinediones will also be as effective in decreasing the incidence of diabetes inhigh-risk populations. Current studies are now testing rosiglitazone and pioglita-zone [14]. Xenical is very likely effective in decreasing weight and thus reducingthe risk of diabetes. However, methodological problems, such as the high dropout rate and the carry forward analysis, make the study difficult to interpret.
Bariatric Surgery
We still have very few data on the use of bariatric surgery in massively obesesubjects on the prevention of diabetes. Three studies, however, have sufficient
Chiasson
34
Rela
tive r
isk r
ed
uctio
n (%
)
Metformin Acarbose Troglitazone Orlistat
35
42
55
37
0
20
40
60
80
100
Fig. 1. Non-pharmacological and pharmacological interventions on the prevention oftype-2 diabetes as a primary outcome. The histograms represent the population-adjusted mean risk reduction where there is more than one intervention trial.

data on the prevention of diabetes that are interesting and worth discussing(table 2).
Pories et al. [15] submitted 608 morbidly obese patients to gastric bypassand followed them prospectively for 7.6 years. Among these patients, 152 hadIGT at baseline and, interestingly, only 2 progressed to diabetes for an annualincidence of 0.17%. Unfortunately, there was no control group (table 2).
Long et al. [16] also examined the effect of gastric bypass on the incidenceof diabetes in 109 morbidly obese subjects with IGT. As controls, they used 27subjects with IGT who also had morbid obesity but did not undergo surgeryfor personal or other non-medical reasons. After an average follow-up of 4.8years, the annual incidence of diabetes in the experimental group was 0.15%compared to 4.6% in the control group (table 2). This remains a non-randomizedstudy and selection bias cannot be ruled out.
More recently, Sjöstrom et al. [17] published the Swedish Obese Subjectsstudy on 4,047 morbidly obese subjects who underwent bariatric surgery.Though this is not a randomized study, all subjects were attributed matchedcontrols. At the end of the 2-year follow-up, the annual incidence of diabetesin the subjects who underwent bariatric surgery was 0.10% compared to 3.2%in the controls (table 2). It is not clear how many subjects had IGT at baseline.
Though these studies in morbidly obese subjects with or without IGT werenot randomized, the data are convincing that bariatric surgery resulting in sus-tained weight loss is an acceptable and effective alternative in reducing the riskof type-2 diabetes.
Other Pharmacological Interventions for the
Prevention of Diabetes as Secondary Outcome
Other studies have also examined the effect of other drugs on the preven-tion of diabetes in high-risk populations as secondary outcome.
At least 10 studies have assessed the effect of angiotensin-convertingenzyme inhibitors and angiotensin receptors antagonists on the prevention of
Pharmacological and Surgical Intervention for the Prevention of Diabetes
35
Table 2. Bariatric surgery and the prevention of type-2 diabetes
Study Number of subjects Duration of Weight loss Incidence of(surgery/control) follow-up % diabetes, %/year
years after surgery
Pories et al. [15] 152/– 7.6 33a 0.17Long et al. [16] 109/27 5.8 52b 0.15SOS study [17] 517/539 10.0 16a 0.10
aPercent body weight.bPercent excess body weight.

diabetes as secondary objective (table 3) [18–21]. Eight of these studiesfound a significant reduction in the incidence of new cases of diabetes by therenin angiotensin aldosterone system inhibitors based on fasting plasma glu-cose. The relative risk reduction varied between 14 and 87% with an overallmean adjusted for population of 25.6% (fig. 2).
Pravastatin and estrogen/progesterone replacement therapy are two otherdrugs that have also shown potential for the prevention of type-2 diabetes(fig. 2). The West of Scotland Coronary Prevention Study examined the effectof pravastatin on the development of diabetes as a secondary endpoint [22].After a follow-up of 4.8 years, pravastatin was associated with a 30% riskreduction of diabetes (p � 0.036) [23]. The Heart and Estrogen/progestinReplacement Study [24] also examined the effect of estradiol 0.625 mg plus
Chiasson
36
Table 3. Other pharmacological interventions and the prevention of type-2 diabetesas secondary outcome
Study Intervention Number Duration of Comparator Risk p valueof follow-up reductionsubjects years %
Renin angiotensin aldosterone system inhibitorsCAPPP [18] Captonil 10,413 6.1 Diuretic 14 0.039
and/or�-blockers
STOP-HTN2 Enalapril/ 3,930 6.0 �-blocker 15 NS[19] lisinopril
LIFE [20] Losartan 7,598 4.8 �-blocker 25 0.001HOPE [21] Ramipril 5,720 4.5 Placebo 34 �0.001ALLHAT Lisinopril 33,357 4.9 Diuretic 30 �0.001
[26] Ca2� channelblocker
SOLVD [27] Enalapril 391 2.9 Placebo 74 �0.001ALPINE Candesartan 393 1.0 Diuretic � 87 0.03
[28] �-blockerSCOPE Candesartan 4,964 3.7 Placebo 19 0.09
[29]CHARM Candesartan 7,601 2.0 Placebo 19 �0.001
[30]VALUE Valsartan 15,245 4.2 Diuretic/ 23 �0.001
[31] �-blocker
StatinWOSCOPS Pravastatin 5,974 4.8 Placebo 30 0.036
[23]
Hormone replacement therapyHERS [32] Estradiol 2,763 4.1 Placebo 35 0.006
0.625 mgProgesterone
2.5 mg

medroxyprogesterone acetate 2.5 mg versus placebo on the development ofdiabetes over a 4-year period based on fasting plasma glucose. The hormonereplacement therapy was associated with a 35% risk reduction for diabetes(p � 0.006).
All these studies are interesting and do suggest the potential benefit of thesedrugs in the prevention of diabetes. But as a secondary outcome, they can onlybe considered as generating a hypothesis and need to be confirmed in prospec-tive studies in which the prevention of diabetes will be the primary outcome.
Conclusion
It is now established that type-2 diabetes can be prevented or delayedthrough a lifestyle-modification program or pharmacological intervention.Since weight reduction and exercise is difficult to maintain in the long-term,it is important to have pharmacological agents such as acarbose, metforminand probably orlistat that have been shown to be effective in reducing the riskof diabetes in high-risk populations. These can be used as an adjunct or analternative to lifestyle modification. Bariatric surgery can also be used as aneffective alternative in morbidly obese subjects to prevent diabetes.
A number of studies have suggested that other drugs, such as reninangiotensin aldosterone system inhibitors, statins and hormone replacementcould also be of potential benefit for the prevention of diabetes. These, how-ever, need to be confirmed in prospective trials. Some are currently beingtested in ongoing trials. The DREAM study is testing ramipril and rosiglita-zone [14], the NAVIGATOR study nateglinide and valsartan [25], and finally,
Pharmacological and Surgical Intervention for the Prevention of Diabetes
37
Rela
tive r
isk r
ed
uctio
n (%
)
ACEI�ARA Statin
Estrogen/
progestin
25.630
35
0
20
40
60
80
100
Fig. 2. Pharmacological interventions and the prevention of type-2 diabetes as asecondary outcome. The histograms represent the population-adjusted mean riskreduction where there is more than one intervention trial.

ACT NOW is assessing pioglitazone in preventing the progression of IGT totype-2 diabetes.
With this new knowledge, strong recommendations have to be made toscreen and treat IGT. These new strategies should help to attenuate theworldwide burden of diabetes.
Acknowledgement
We are grateful to Susanne Bordeleau for preparing the manuscript and illustrations.
References
1 Wild S, Roglic G, Green A, et al: Global prevalence of diabetes: estimates for the year 2000 andprojections for 2030. Diabetes Care 2004;27:1047–1053.
2 Klein R, Klein BEK, Moss SE: Relation of glycemic control to diabetic microvascular compli-cations in diabetes mellitus. Ann Intern Med 1996;124:90–96.
3 de Marco R, Locatelli F, Zoppini G, et al: Cause-specific mortality in type 2 diabetes. TheVerona Diabetes Study. Diabetes Care 1999;22:756–761.
4 American Diabetes Association: Economic consequences of diabetes mellitus in the US in1997. Diabetes Care 1998;21:296–309.
5 Zimmet PZ: The pathogenesis and prevention of diabetes in adults. Genes, autoimmunity, anddemography. Diabetes Care 1995;18:1050–1064.
6 Kahn SE, Porte D Jr: Pathophysiology of type II diabetes mellitus; in Porte D Jr, Sherwin RS(eds): Diabetes Mellitus. Stamford, Appleton & Lange, 1996, pp 487–512.
7 Lillioja S, Bogardus C: Obesity and insulin resistance: lessons learned from the Pima Indians.Diabetes Metab Rev 1988;4:517–540.
8 Yang W, Lixiang L, Jinwu Q, et al: The preventive effect of acarbose and metformin on the pro-gression to diabetes mellitus in the IGT population: a 3-year multicenter prospective study.Chin J Endocrinol Metab 2001;17:131–136.
9 Knowler WC, Barrett-Connor E, Fowler SE, et al: Reduction in the incidence of type 2 dia-betes with lifestyle intervention or metformin. N Engl J Med 2002;346:393–403.
10 Chiasson JL, Josse RG, Gomis R, et al: Acarbose for prevention of type 2 diabetes mellitus: theSTOP-NIDDM randomised trial. Lancet 2002;359:2072–2077.
11 Report of the Expert Committee on the Diagnosis and Classification of Diabetes Mellitus.Diabetes Care 1997;20:1183–1197.
12 Buchanan TA, Xiang AH, Peters RK, et al: Preservation of pancreatic beta-cell function andprevention of type 2 diabetes by pharmacological treatment of insulin resistance in high-riskHispanic women. Diabetes 2002;51:2796–2803.
13 Torgerson JS, Hauptman J, Boldrin MN, Sjostrom L: XENical in the prevention of diabetes inobese subjects (XENDOS) study: a randomized study of orlistat as an adjunct to lifestylechanges for the prevention of type 2 diabetes in obese patients. Diabetes Care 2004;27:155–161.
14 Gerstein HC, Yusuf S, Holman R, et al: Rationale, design and recruitment characteristics of alarge, simple international trial of diabetes prevention: the DREAM trial. Diabetologia2004;47:1519–1527.
15 Pories WJ, Swanson MS, MacDonald KG, et al: Who would have thought it? An operationproves to be the most effective therapy for adult-onset diabetes mellitus. Ann Surg 1995;222:339–352.
16 Long SD, O’Brien K, MacDodnald KG Jr, et al: Weight loss in severely obese subjects preventsthe progression of impaired glucose tolerance to type II diabetes. Diabetes Care 1994;17:372–375.
17 Sjöstrom L, Lindroos AK, Peltonen M, et al: Lifestyle, diabetes, and cardiovascular risk factors10 years after bariatric surgery. N Engl J Med 2004;351:2683–2693.
Chiasson
38

18 Niklason A, Hedner T, Niskanen L, Lanke J: Development of diabetes is retarded by ACE inhi-bition in hypertensive patients – a subanalysis of the Captopril Prevention Project (CAPPP).J Hypertens 2004;22:645–652.
19 Hansson L, Lindholm LH, Ekbom T, et al: Randomised trial of old and new antihypertensivedrugs in elderly patients: cardiovascular mortality and morbidity the Swedish Trial in OldPatients with Hypertension-2 study. Lancet 1999;354:1751–1756.
20 Lindholm LH, Ibsen H, Borch-Johnsen K, et al: Risk of new-onset diabetes in the LosartanIntervention for Endpoint reduction in hypertension study. J Hypertens 2002;20:1879–1886.
21 Yusuf S, Gerstein H, Hoogwerf B, et al: Ramipril and the development of diabetes. JAMA2001;286:1882–1885.
22 Shepherd J, Cobbe SM, Ford I, et al: Prevention of coronary heart disease with pravastatin inmen with hypercholesterolemia. West of Scotland Coronary Prevention Study Group. N EnglJ Med 1995;333:1301–1307.
23 Freeman DJ, Norrie J, Sattar N, et al: Pravastatin and the development of diabetes mellitus:evidence for a protective treatment effect in the West of Scotland Coronary Prevention Study.Circulation 2001;103:357–362.
24 Hulley S, Grady D, Bush T, et al: Randomized trial of estrogen plus progestin for secondaryprevention of coronary heart disease in postmenopausal women. Heart and Estrogen/prog-estin Replacement Study (HERS) Research Group. JAMA 1998;280:605–613.
25 Scheen AJ: Prevention of type 2 diabetes mellitus through inhibition of the renin-angiotensinsystem. Drugs 2004;64:2537–2565.
26 ALLHAT Officers and Coordinators for the ALLHAT Collaborative Research Group. TheAntihypertensive and Lipid-Lowering Treatment to Prevent Heart Attack Trial: major out-comes in high-risk hypertensive patients randomized to angiotensin-converting enzymeinhibitor or calcium channel blocker vs. diuretic: The Antihypertensive and Lipid-LoweringTreatment to Prevent Heart Attack Trial (ALLHAT). JAMA 2002;288:2981–2997.
27 Vermes E, Ducharme A, Bourassa MG, et al: Enalapril reduces the incidence of diabetes inpatients with chronic heart failure: insight from the Studies Of Left Ventricular Dysfunction(SOLVD). Circulation 2003;107:1291–1296.
28 Lindholm LH, Persson M, Alaupovic P, et al: Metabolic outcome during 1 year in newlydetected hypertensives: results of the Antihypertensive Treatment and Lipid Profile in aNorth of Sweden Efficacy Evaluation (ALPINE study). J Hypertens 2003;21:1563–1574.
29 Lithell H, Hansson L, Skoog I, et al: The Study on Cognition and Prognosis in the Elderly(SCOPE): principal results of a randomized double-blind intervention trial. J Hypertens2003;21:875–886.
30 Pfeffer MA, Swedberg K, Granger CB, et al: Effects of candesartan on mortality and morbidity inpatients with chronic heart failure: the CHARM-Overall programme. Lancet 2003;362:759–766.
31 Julius S, Kjeldsen SE, Weber M, et al: Outcomes in hypertensive patients at high cardiovascu-lar risk treated with regimens based on valsartan or amlodipine: the VALUE randomised trial.Lancet 2004;363:2022–2031.
32 Kanaya AM, Herrington D, Vittinghoff E, et al: Glycemic effects of postmenopausal hormonetherapy: the Heart and Estrogen/progestin Replacement Study. A randomized, double-blind,placebo-controlled trial. Ann Intern Med 2003;138:1–9.
Discussion
Dr. Katsilambros: My compliments for this nice presentation. Please allow me avery specific question. If a close relative of yours had impaired glucose tolerance, was 50years old, and had a body mass index (BMI) of 34, this person would then either have tochange his lifestyle or take drugs. The question at this point, would you also give himdrugs if he changed his lifestyle? But if this person was not willing at all to change hislifestyle towards the better, would you subscribe drugs straight from the beginning?
Dr. Chiasson: That is an interesting question and certainly a problem that we areor will be faced with. After looking at the data of the Diabetes Prevention Program(DPP), the Diabetes Prevention Study (DPS) and the Dutchen study, there is no
Pharmacological and Surgical Intervention for the Prevention of Diabetes
39

doubt that the lifestyle modification program should be first-line treatment of pre-diabetic states. Of course if people are open to that, want to lose weight, want to exercise,I think that has to be supported through prescription as well as through counseling.However, in this population, which I would follow over time, if I see that plasma glu-cose starts to increase gradually despite these measures, I would consider pharmaco-logical intervention. In Canada those are the guidelines. We are not sure what thefailings are of the lifestyle modification program. Of course if we follow plasma glu-cose, whether it be fasting or after 75 g glucose, and it keeps increasing, then weshould add drugs. Metformin and acarbose have been shown to be effective. I think thepostprandial glucose is a very strong predictor of progression to diabetes. Personally Idon’t think that even in patients who are unwilling to change their lifestyle I wouldstart with medication because I don’t think that medication and then overindulgingwould be of any benefit, at least in the long-term. We all have the responsibility to bevery convincing, follow the patients and encourage them to comply to a well-designedlifestyle modification program. And on top of that I would do exactly as for cooperativepatients and would most likely end up adding some drugs. I think the drugs are thereas an alternative, certainly in combination with lifestyle modification, although there isno study showing that this is going to be more effective. One would suspect that, butagain if they operate with the same mechanism, perhaps not, we don’t know.
Dr. Ditschuneit: With bariatric surgery remarkable amounts of weight loss can beachieved. The weight loss is 30% in the Swedish Obese Subjects study, and after 10years it is still 16%. How can we explain that some of these patients, although theyremain obese, will not develop diabetes after being operated? Is there a range of BMIin which the risk of diabetes is particularly low or high?
Dr. Chiasson: I will answer the second part of your question first. I don’t think thatbariatric surgery cures diabetes. I don’t think that we have any cure for diabetes,though there is in most cases a normalization of the plasma glucose, certainly the fast-ing plasma glucose. However if the patients are challenged, the first phase insulin secre-tion still remains totally out of proportion; so the basic problem is still there. Why dothey respond to this huge amount of weight loss, much more than with diet alone? Mysimple view on the subject is that the pancreas is still able to compensate for so muchinsulin resistance, and by doing that insulin resistance is decreased to a level where the�-cell can compensate for the insulin resistance. That is my simple explanation for whydespite the fact that they are still obese there is a normalization of plasma glucose.
Dr. Hill: I think we have to consider the economics of all this. For example, if youperformed bariatric surgery on everybody in the US who qualifies with a BMI above40, the cost would be more than the total health care dollars spent by the US. So it isprobably one reason the surgeons won’t take over the world in this area. But even withdrugs, xenical costs about USD 100/month. As diabetes is increasing, can you perhapsaddress how we can afford these kinds of approaches to its management?
Dr. Chiasson: First regarding surgery, you are right, bariatric surgery costs a lot,but it is quite well known that in the US and in Canada there has been a huge increaseover the last 5 years at least for bariatric surgery. There is a large population and a hugemarker for this type of approach because obesity has become a major problem. But thegovernment, at least in Canada where we have a national medicare system, would neverpay for any bariatric surgery. Regarding the economics, I have not seen economic stud-ies done with orlistat, I know that it has been done with metformin and acarbose, and Iknow that for those two drugs that are on the market at the present time the cost:ben-efit ratio is positive. Even the studies that have only looked at intervention have nottaken into account the long-term complications. If you add that in, then it is even morecost-effective. So yes, I think it would be cost-effective to do some prevention study. Ithink it would pay for the government, at least in Canada, to pay for a year at a gymrather than paying for the costs of obesity and diabetic complications in the long-term.
Chiasson
40

Dr. Hill: But then you have to get them to use the gym.Dr. Slama: I would like to challenge the answer you gave to Dr. Katsilambros who
asked you if you would give drugs to those patients who are not willing to lose weightor modify their lifestyle. You answer was you do not want them to overindulge. Do youreally think that those patients who do not lose weight overindulge; do you really thinkthat those patients who are not able to exercise regularly overindulge? Could you tellus how much the mean weight loss is in your regular patients on a large cohort; howmuch exercise you obtain in your cohort of patients? I don’t have the results from mypractice, but it is my opinion that very few patients really lose weight in the long-term.Should we not give them drug therapy just because they don’t lose weight?
Dr. Chiasson: I think that is an over-interpretation of my statement. Like you, Ithink my success is very low, and that obesity comes from overindulging. I don’t thinkthat obesity appeared in Europe during the Second World War, so it comes fromoverindulging. The second thing is that the group that Dr. Katsilambros mentioned,somebody who does not want to stick to a diet, and those are usually the people whodo overindulge. That is a different thing. I am not saying that I would not give themdrugs; what I am saying is that in cooperative patients it very easy, they want to loseweight, and despite the fact that they don’t lose much weight, they go on a diet even ifthey maintain their weight and do exercise a little bit more than they did, that will bebeneficial. By following the plasma glucose I then decide when to start with pharma-cological intervention. In the other patients I have to work harder to convince themthat it is important, but I will do exactly the same thing.
Dr. Slama: Work harder but without too much hope because we know whatresults we can obtain. I agree of course that they are overindulging once in their life.
Dr. Chiasson: That is true, but if you put diabetics on a diet and follow them, evenif they don’t lose weight the blood sugar will come down. Most of the time it is becausethey have better eating habits even if they don’t lose weight. That in itself, and Istrongly believe in the postprandial plasma glucose. I strongly believe that if the diet isjust modified, and I will not talk about glycemic index or fibers but I think they shouldbe part of the diet, if the postprandial plasma glucose is reduced, I think just there along-term beneficial effect should be seen, even if the patient doesn’t lose weight, butif the plasma glucose is followed it should tell you when to start drug intervention.
Dr. Slama: So on this point we agree. But you cannot link your prescription to theresults obtained beforehand on lifestyle modification. Of course you only need to pre-scribe drugs for those people exhibiting some adherence to your principles, trying theirbest whatever the results, and when you are convinced that they are trying their best.
Dr. Chiasson: Yes, as I said how do you define diet? I think that is a problem. Thisbeing said, I think that the plasma glucose should dictate the prescription.
Ms. Franz: Your earlier comment that people with diabetes have improved bloodglucose levels even without weight loss because of better eating habits is of interest. Ithas been suggested that a reduced energy intake is more important than weight lossfor improving insulin resistance [1]. Do you think the reduction in diabetes in subjectsundergoing bariatric surgery is just as likely from their reduced food intake as it isfrom their weight loss?
Dr. Chiasson: Definitely they eat a lot less because they have a small stomach.One of the problems is that in most of the studies the metabolic assessment has notbeen done properly, and that is a major problem. Very often we don’t have a good eval-uation beforehand and we don’t have a good follow-up after bariatric surgery. But nowthere are some very interesting things being done using laparoscopy; the ileum isbeing changed and put right after the stomach. There are a lot of interesting thingsbeing done, but again that would still remain for a morbidly obese population.
Dr. Halimi: I have two questions. First in contrast to the lifestyle intervention inthe DPP study and the Study to Prevent NIDDM, do you think that metformin and
Pharmacological and Surgical Intervention for the Prevention of Diabetes
41

acarbose do not prevent diabetes, but represent an early treatment of type 2? Secondwith regard to acarbose, do you think that it could be an indirect effect via gut factors?
Dr. Chiasson: I didn’t want to get involved in this discussion as to whether it istreatment or prevention of diabetes. Of course it is a good question and I don’t thinkwe can answer it. Certain drugs are being tested and it is going to be very difficult.Metformin and thiazolidinediones (TZDs) have long-term effects; it takes 2–3 monthsto have a maximum effect, and I presume it takes 2–3 months to see the effect disap-pear. So it will be difficult unless the patients are followed over time to tell whetherthe disease is being treated or prevented. With acarbose it is different because acar-bose is not absorbed, it decreases the postprandial, that is the main effect. It does nothave any impact on the oral glucose tolerance test. The oral glucose tolerance test stillremains a valid diagnostic tool. We all know that acarbose and all the �-glucose inhibitorsincrease GLIT-1, but whether that has an impact on prevention, we don’t know;whether it has an impact on reducing the emptying of the stomach, we don’t know. Itwould be very difficult to study that with acarbose. I doubt very much that it has aneffect on the regeneration of the �-cell. It is an interesting concept; I think it works inrats, but I don’t think it works in humans. I have seen data in rats with �-glucosidaseinhibitors that show exactly the same regeneration of the �-cell as TZD. So one has tobe very careful in interpreting the data from rat to human. There are still lots of openquestions; there are other factors, gut factors, short chain fatty acid and all this kind ofthing that could be involved, but we don’t have the answer yet. But independent of allthat, whether we treat early diabetes or prevent diabetes, if we delay the complicationsby 5 or 10 years that will reduce the burden on the health care system.
Dr. Jialun Chen: Thank you very much for your comprehensive review. You men-tioned the TRIPOD study, and we now know that there are two other studies withtroglitazone. The duration of the intervention is only 10 months. Compared with theplacebo group there was a risk reduction of diabetes of 75%. The subgroup study fromDenver and Philadelphia continued the DPP study. They have completed the studyafter 3 years and the risk reduction was 88%. It is very impressive, and I would like toknow your opinion about this issue.
Dr. Chiasson: I am not familiar with the TZD study. The only studies that I amaware of are the DREAM study, in which I am participating, and the Fronso studywhich is ongoing at the present time. But so far we don’t have any data from thosestudies. There was also the Proactive study which is a study in diabetes. In the DPP,and you will correct me if I am wrong, the troglitazone arm was very effective, it had a75% risk reduction when the drug was discontinued. But when the drug was testedlater on, it went back up to the incidence equivalent to the control group. The TRIPODstudy, in which Buchanan tried to make a big thing about the prolonged effect oftroglitazone, was based on 6 events and to me 6 events can fall anywhere over an 8-month period. So I think that most of the drugs as well as the non-pharmacologicalinterventions only work if they are followed them or if you take them.
Reference
1 Assali AR, Ganor A, Beigel Y, et al: Insulin resistance in obesity: body-weight or energybalance? J Endocrinol 2001;171:293–298.
Chiasson
42

The Glycemic Index: Methodology and Use
Cyril W.C. Kendall, Livia S.A. Augustin, Azadeh Emam,
Andrea R. Josse, Nishta Saxena, David J.A. Jenkins
Department of Nutritional Sciences, Faculty of Medicine, University of Toronto, and ClinicalNutrition and Risk Factor Modification Center, St. Michael’s Hospital; Toronto, Ont., Canada
AbstractThe glycemic index concept owes much to the dietary fiber hypothesis that fiber
would reduce the rate of nutrient absorption and increase the value of carbohydratefoods in the maintenance of health and treatment of disease. However, properties andcomponents of food other than its fiber content contribute to the glycemic andendocrine responses postprandially. The aim of the glycemic index classification offoods was therefore to assist in the physiological classification of carbohydrate foodswhich, it was hoped, would be of relevance in the prevention and treatment of chronicdiseases such as diabetes. Over the past two decades low glycemic index diets havebeen reported to improve glycemic control in diabetic subjects, to reduce serum lipidsin hyperlipidemic subjects and possibly to aid in weight control. In large cohort stud-ies, low glycemic index or glycemic load diets (glycemic index multiplied by total car-bohydrate) have also been associated with higher levels of high-density lipoproteincholesterol, reduced C-reactive protein concentrations and with a decreased risk ofdeveloping diabetes and cardiovascular disease. More recently, some case-control andcohort studies have also found positive associations between the dietary glycemicindex and the risk of colon, breast and other cancers. While the glycemic index con-cept continues to be debated and there remain inconsistencies in the data, sufficientpositive findings have emerged to suggest that the glycemic index is an aspect of dietof potential importance in the treatment and prevention of chronic diseases.
Copyright © 2006 Nestec Ltd., Vevey/S. Karger AG, Basell
The glycemic index concept combines the concepts of the dietary fiberhypothesis and the insulin-resistance syndrome in an attempt to find dietary
Bantle JP, Slama G (eds): Nutritional Management of Diabetes Mellitus and Dysmetabolic Syndrome.Nestlé Nutr Workshop Ser Clin Perform Program, vol 11, pp 43–56,Nestec Ltd., Vevey/S. Karger AG, Basel, © 2006.
43
Glycemic Effect of Carbohydrates

strategies to prevent and manage chronic disease (diabetes, coronary heartdisease – CHD). The original dietary fiber hypothesis predicted that differentcarbohydrate foods would result in different physiological responses, notably,lower postprandial glycemic responses for the same amount of carbohydratefrom high fiber, less processed foods. By the mid 1970s, viscous fibers wereshown to effectively blunt both postprandial glucose and insulin responses[1]. Shortly thereafter, different low fiber starchy carbohydrate foods wereshown to have different effects on the blood glucose response curve in bothhealthy and diabetic subjects [2]. In the early 1980s, it was considered impor-tant to start to systematically document differences between carbohydratefoods to allow a more rational form of carbohydrate exchange and to providephysiological information on foods rather than simply theoretical assessmentsbased on macronutrient and fiber composition. The glycemic index was there-fore developed to address these needs [3].
Glycemic Index Methodology
The glycemic index assesses the blood glucose response of a fixed amountof available carbohydrate (generally 50 g) from a test food to the sameamount of available carbohydrate from a standard food (glucose or whitebread). Both test and standard foods were taken by the same subject in orderto account for individual variation. The test food’s blood glucose responsearea was then expressed as a percentage of the standard’s. In general, theinsulin responses observed for particular foods were found to be similar to theglycemic responses they elicited [4]. It also appeared that the rate of digestionof the food was a major determinant of the observed glycemic response [5].Thus, when foods were digested in vitro, the rate of liberation of the carbohy-drate products of digestion over 3–5 h reflected the blood glucose area in vivo[5]. A range of intrinsic and extrinsic factors which alter the rate of gastro-intestinal motility, digestion and absorption of starchy foods was found toresult in differences in glycemic index including the nature of the starch,cooking, particle size, the presence of fiber, fat and proteins [6]. Foods withlower glycemic indices were often the starchy staples of traditional cultures,such as pasta, whole grain pumpernickel breads, cracked wheat or barley,rice, dried peas, beans and lentils. In fact it appeared that the traditional useof low glycemic index carbohydrate foods in the diet was particularly true forthose cultures which are now experiencing high rates of diabetes, such as thePima Indians and the Australian Aborigines, and where the change to highglycemic index foods has been a recent phenomenon [7]. Obviously otherlifestyle factors, including reduced physical activity and increased obesityalso play a major role in increasing diabetes risk. Nevertheless, it was specu-lated that the desire for sweetness, resulting from rapid carbohydrate break-down of refined starches in the mouth, has resulted in the selection of rapidly
Kendall/Augustin/Emam/Josse/Saxena/Jenkins
44

digested and hence high glycemic index foods as cultures become more afflu-ent. Thus high glycemic index foods are potentially a further dietary factorfavoring the development of chronic disease.
Criticisms of the Glycemic Index Concept
It has been argued that the glycemic index lacks clinical utility becausedifferences in glycemic indices between foods are lost once these foods aretaken in a mixed meal [8]. This observation may in part be explained by thefact that when a mixed meal consists of several carbohydrate sources, theeffect of the lower glycemic index component is diluted in proportion to theamount of carbohydrate from the other foods. It is therefore essential that themixed meal glycemic index be properly calculated [9]. It has also been saidthat the addition of small amounts of fat to the meal greatly alter the glycemicresponse. However studies where 8–24 g fat was fed in mixed meals containing38–104 g carbohydrate had little effect on the predicted glycemic response[10]. Furthermore while large deviations in the dietary macronutrient profilemay occur from time to time in the lives of individuals, these differences arelikely to average out over time.
It has also been argued that the glycemic index is a difficult concept toexplain to the public and that it will add further needless complication andpotential dietary restriction in management and prevention of diseases andthat perhaps the modest gains that may be achieved are therefore not justi-fied [11]. For the public, however, the glycemic index may simply be used as atool for selecting better quality starchy foods. Over time it is hoped that thedevelopment of new low glycemic index foods will expand the range ofchoices to be selected not simply for the glycemic index but also for the factthat the foods in question may have a range of other health advantages.Obviously a certain amount of dietary understanding is required. Thus,carrots with a high glycemic index are not to be excluded from the diet. It isrealized that there are other considerations relevant to the consumption ofcarrots and that the glycemic index is not significant in a low calorie foodwhich contains high levels of other desirable factors (i.e. fiber, vitamins, min-erals, etc.).
Metabolic Effects of Low Glycemic Index Foods
It has been hypothesized that the health benefits of low glycemic indexfoods are due to their metabolic effects, specifically their ability to slow therate at which glucose is absorbed from the small intestine (fig. 1). Studiesin healthy men have demonstrated some of the metabolic effects of reducingthe rate of absorption, for example, when glucose solution was sipped at an
The Glycemic Index: Methodology and Use
45

even rate over 180 min (sipping), as opposed to being taken as a bolus [12]. A marked economy in insulin secretion with sipping was seen along withlower serum free fatty acid (FFA) levels compared to the bolus (fig. 2). Inpart, this improvement, also observed after feeding low glycemic index meals,may be the result of sustained tissue insulinization, suppression of FFA releaseand the absence of a counter-regulatory endocrine response [12]. Other stud-ies using low glycemic index meals have demonstrated an improved secondmeal effect reminiscent of the Staub-Traugott effect (where the first mealimproves the glucose tolerance of the second meal) and related the improvedpostprandial glycemia of the second standard meal to prolonged suppressionof FFA levels [13].
Increased food frequency has also been shown to reduce glycemic andinsulinemic responses over the day in diabetic subjects and in longer termstudies has been associated with reduced fasting blood lipid concentrationsdespite consumption of the same foods at the same 24-hour caloric intake[14]. However, spreading the nutrient load does not appear to increase thethermogenic effect of diets, which would favor weight reduction.
It is therefore possible that some of the advantages in glycemia and fastingblood lipids seen after prolonging absorption by reducing the rate of absorp-tion such as by sipping or by increasing the dietary meal frequency, mayrelate simply to reduced fluxes in nutrient uptake and less perturbation of theendocrine environment.
Kendall/Augustin/Emam/Josse/Saxena/Jenkins
46
a b
Fig. 1. Spreading the nutrient load. Hypothetical effect on of a low glycemic indexmeal (a) versus a high glycemic index meal (b) on gastrointestinal absorption ofcarbohydrate. Reproduced with permission by the American Journal of ClinicalNutrition. © Am Clin Nutr. American Society for Nutrition.

The Glycemic Index: Methodology and Use
47
60
8
6
4
2
0
0 120 180 240Blo
od
glu
co
se (m
mo
l/l)
60
400
200
0
0 120 180 240Seru
m insulin
(p
mo
l/l)
Pla
sm
a G
IP (p
mo
l/l)
Time (min)
60
100
50
0
0 120 180 240
Seru
m C
-pep
tid
e (p
mo
l/l)
60
1,500
500
0
0 120 180 240
1,000
60
600
400
200
0
0 120 180 240
Seru
m F
FA
(µ
mo
l/l)
Fig. 2. Mean � SE blood glucose, serum free fatty acid (FFA), insulin, and C-peptide;and plasma gastric inhibitory polypeptide (GIP) after taking glucose solution (50 g in700 ml water) as a bolus over 5 min at time 0 (�) or sipping the same solution over0–3.5 h at an even rate (�).

Clinical Effects of Low Glycemic Index Approaches
In diabetes (types 1 and 2) the majority of studies (10 of 14; table 1) haveshown improvements in glycosylated proteins [15]. Where it has been assessed,improvements in clotting factors and reductions in low-density lipoprotein cho-lesterol and triglycerides have also been reported, particularly in individualswith elevated blood lipids [15]. These reductions have been achieved despite nosignificant change in body weight. A recent meta-analysis examined the datafrom several randomized trials that assessed the efficacy of low glycemic indexdiets to control glycemia [16]. Seven of the 10 studies included in this analysisfound improvements in glycemic control with a mean reduction in hemoglobinA1c (HbA1c) of 0.43% compared to the high glycemic index diet [16]. Thesedata, though not in themselves definitive, are encouraging.
Drug therapies which reduce the rate of glucose absorption have also beenshown to be effective in the control of diabetes and its complications. �-Glucosidase inhibitors such as acarbose, which reduce the rate of absorptionof starch, sucrose, and to a lesser extent maltose, have been shown in large,multicenter trials to result in a significant reduction in HbA1c in type-2
Kendall/Augustin/Emam/Josse/Saxena/Jenkins
48
Table 1. Clinical trials assessing the effect of low glycemic index (GI) diets onglycosylated proteins in type-1 and 2 diabetes mellitus
Diabetes n Duration Change Change in Type of type weeks in diet glycosylated glycosylated
GI valuea proteins, % protein
I 7 6 �12 �19*,b HbA1cI 8 3 �14 �18*,b FructosamineI 9 2 �27 �6.5c FructosamineI 54 24 �20 �5.5c HbA1cI 104 52 �1.2 �6.5*,c HbA1cII 8 2 �23 �6.6*,b HbA1c
�2.6c
II 16 12 �14 �11*,b HbA1cII 6 6 �28 �8*,c FructosamineII 15 2 �27 �3.4*,c FructosamineII 25 12 �5 �11*,b FructosamineII 20 3 �31 �5.9*,b HbA1c
�2.5*,c FructosamineII 28 4 �20 �1.8c FructosamineI and II 18 5 �26 �13*,c FructosamineI and II 24 4 �5 �3c HbA1c
*Significant effect: p � 0.05.aFrom high GI diet (reference food: white bread).bTreatment difference from baseline (within low GI treatment).cEnd-point difference (between treatments).

diabetes [17, 18]. Furthermore, use of acarbose in patients with diabetes inthe context of the UK Prospective Diabetes Study, improved glucose control,expressed as reduced HbA1c, to a degree similar to that achieved by currenthypoglycemic therapy (e.g. metformin and sulfonylurea) [19]. Finally, in theSTOP-NIDDM trial subjects with impaired glucose tolerance who received100 mg acarbose three times daily showed a significantly reduced rate of con-version to diabetes versus the control group [20].
Findings of this nature provide additional encouragement that the princi-ple of spreading the nutrient load by dietary means, in addition to altering theamount and nature of the macronutrients, may one day play a role in modify-ing glycemia in the management of diabetes.
Epidemiological Evidence for the Health
Effects of Low Glycemic Index Diets
Studies using the NHANES III database and also a British study havedemonstrated a negative relationship between the glycemic index and high-density lipoprotein cholesterol suggesting low glycemic index diets may pre-serve high-density lipoprotein cholesterol and have a positive effect inreducing CHD risk [21, 22]. In this respect both the Nurses Study and theHealth Professionals Study have shown potential benefits in relation to dia-betes incidence and CHD risk dependent on the dietary glycemic index [21, 23].Of particular interest in terms of CHD was the observation that below a bodymass index of 23 kg/m2 there was no association of the dietary glycemic indexwith CHD, suggesting that the effect of the dietary glycemic index may beincreasingly important in those with a greater degree of insulin resistance.
Situations where insulin resistance and insulin-like growth factors havebeen implicated are the so-called diet-related cancers – colon, breast andprostate [21]. It has been hypothesized that the risk of these cancers may beincreased by insulin resistance [21]. Recently an Italian case-control studyreported that the dietary glycemic index was related to colon cancer risk: thehigher the glycemic index the greater the risk. Of particular interest was thefinding that the association was only significant for white bread (high glycemicindex food) which contrasted with pasta (low glycemic index food) where noassociation existed [21].
The epidemiological literature therefore provides further support for therole of low glycemic index diets in chronic disease prevention.
Diet, Lifestyle and Diabetes Control
The value of diet and lifestyle change including the incidence of type-2diabetes mellitus has been clearly demonstrated in three recent studies with
The Glycemic Index: Methodology and Use
49

reductions of 30–50% in diabetes incidence in high-risk groups [24–26]. TheDiabetes Prevention Program trial found that diet and lifestyle reduced thediabetes incidence by 58% and was more effective than metformin at 31%risk reduction [24]. Epidemiological studies, notably the Nurses Health Study,attributed 91% of the risk of type-2 diabetes to five major diet and lifestylefactors which included regular exercise, a body mass index of �25 kg/m2,cereal fiber and consumption of low glycemic index diets [25].
Importance of Glycemic Control in Diabetes
Based on the Diabetes Control and Complications Trial data in type-1 dia-betes [27], it was considered that improved glycemic control would help inthe prevention of diabetes-associated complications [28]. This view has beenconfirmed by the results of the UK Prospective Diabetes Study in type-2 dia-betes [19]. Loss of excess body weight continues to be a goal for patientswith type-2 diabetes to improve blood glucose control and serum lipidprofiles. Furthermore, in view of the threefold to fourfold increased risk ofCHD that accompanies diabetes mellitus, additional strategies are sought tonormalize a constellation of CHD risk factors (table 2), including serumlipids.
Recently the American Diabetes Association (ADA) stated that the ‘regu-lation of blood glucose to achieve near-normal levels is a primary goal in themanagement of diabetes, and, thus, dietary techniques that limit hyper-glycemia following a meal are likely important in limiting the complicationsof diabetes’ [29]. The ADA added that ‘a recent analysis of the randomizedcontrolled trials that have examined the efficacy of the glycemic index onoverall blood glucose control indicates that the use of this technique canprovide an additional benefit over that observed when total carbohydrate isconsidered alone’ [29]. However, with reference to the glycemic index, theADA concluded that ‘the relationship between glycemic index and glycemic
Kendall/Augustin/Emam/Josse/Saxena/Jenkins
50
Table 2. Coronary heart disease risk factors associated in type-2 diabetes mellitus
1 Low high-density lipoproteins (high triglycerides)2 Modified low-density lipoproteins (glycosylated, oxidized, acetylated)3 Raised blood pressure4 Raised uric acid levels (a primary factor or simply an indicator of other
abnormalities?)5 Raised serum free fatty acid levels6 Raised insulin levels7 Raised factors VII and VIII, fibrinogen, and plasminogen activator inhibitor,
and low tissue plasminogen activator levels

load and the development of type-2 diabetes remains unclear at this time’ [29].So while there is general agreement on the importance of glycemic control incontrolling diabetes and preventing its associated complications and somerecognition of the importance of controlling postprandial hyperglycemia, the glycemic index concept remains of interest but is at present not fullyaccepted.
Future Directions
Within the last few years considerable interest has developed in the linksbetween insulin resistance, the generation of reactive oxygen species, tissuedamage and the liberation of pro-inflammatory cytokines and acute phaseproteins, which appear to be involved in the development and progression ofboth diabetes and CHD. There is some research that indicates that theglycemic index may play a role in this sequence of events. In one study C-reactive protein has been found to relate to high glycemic load diets [15].Studies have also demonstrated that the postprandial rise in glucose is asso-ciated with depression of serum antioxidants [30] including lycopene andvitamin E. Data indicate that the higher the level of postprandial glycemia thegreater the depression of serum antioxidants [30]. The concept is evolvingthat increased insulin resistance may result from oxidative stress. Supple-menting subjects with the antioxidant vitamin E has been shown to improveglycemic control. Studies such as these suggest a possible beneficial role forlow glycemic index diets through reducing oxidative damage. However, weare still in the early stages of this research area and longer term studies willbe required to better define the relevance of these interesting new findingsand what significance the glycemic index concept may have in it.
Conclusion
The dietary glycemic index concept supports a role for the rate of carbo-hydrate digestion in the prevention and treatment of chronic disease, includ-ing those diseases which have been highlighted in the dietary fiber andinsulin-resistance syndrome hypotheses. This concept should not be seen asparticularly radical at a time when pharmacological approaches to slowingabsorption, notably the �-glycoside hydrolase inhibitors, are now accepted inthe management of diabetes. Further longer term efficacy studies as well aseffectiveness studies are required to better determine the importance of theglycemic index in the regulation of blood glucose and the prevention of dia-betic complications, particularly in relations to CHD risk factors. The possiblerole of the glycemic index in decreasing postprandial oxidative stress andpro-inflammatory processes also merits further investigation.
The Glycemic Index: Methodology and Use
51

References
1 Jenkins DJ, Leeds AR, Gassull MA, et al: Decrease in postprandial insulin and glucose con-centrations by guar and pectin. Ann Intern Med 1977;86:20–23.
2 Crapo PA, Reaven G, Olefsky J: Plasma glucose and insulin response to orally administeredsimple and complex carbohydrates. Diabetes 1976;25:741–747.
3 Jenkins DJ, Wolever TM, Taylor RH, et al: Glycemic index of foods: a physiological basis forcarbohydrate exchange. Am J Clin Nutr 1981;34:362–366.
4 Wolever TM, Bolognesi C: Source and amount of carbohydrate affect postprandial glucoseand insulin in normal subjects. J Nutr 1996;126:2798–2806.
5 Jenkins DJ, Ghafari H, Wolever TM, et al: Relationship between rate of digestion of foods andpost-prandial glycaemia. Diabetologia 1982;22:450–455.
6 Thorne MJ, Thompson LU, Jenkins DJ: Factors affecting starch digestibility and the glycemicresponse with special reference to legumes. Am J Clin Nutr 1983;38:481–488.
7 Thorburn AW, Brand JC, Truswell AS: Slowly digested and absorbed carbohydrate in tradi-tional bushfoods: a protective factor against diabetes? Am J Clin Nutr 1987;45:98–106.
8 Coulston, AM, Hollenbeck CB, Swislocki Al, Reaven GM: Effect of source of dietary carbohy-drate on plasma glucose and insulin responses to mixed meals in subjects with NIDDM.Diabetes Care 1987;10:395–400.
9 Wolever TM, Nuttall FQ, Lee R, et al: Prediction of the relative blood glucose response ofmixed meals using the white bread glycemic index. Diabetes Care 1985;8:418–428.
10 Wolever TM, Bolognesi C: Prediction of glucose and insulin responses of normal subjects afterconsuming mixed meals varying in energy, protein, fat, carbohydrate and glycemic index. J Nutr 1996;126:2807–2812.
11 Coulston AM, Reaven GM: Much ado about (almost) nothing. Diabetes Care 1997;20:241–243.12 Jenkins DJ, Wolever TM, Ocana AM, et al: Metabolic effects of reducing rate of glucose inges-
tion by single bolus versus continuous sipping. Diabetes 1990;39:775–781.13 Jenkins DJ, Wolever TM, Taylor RH, et al: Slow release dietary carbohydrate improves second
meal tolerance. Am J Clin Nutr 1982;35:1339–1346.14 Jenkins DJ, Wolever TM, Vuksan V, et al: Nibbling versus gorging: metabolic advantages of
increased meal frequency. N Engl J Med 1989;321:929–934.15 Jenkins DJ, Jenkins AL, Augustin LS, Kendall CW: Dietary therapy in type 2 diabetes mellitus:
spreading the nutrient load; in LeRoith D, Taylor SI, Olefsky JM (eds): Diabetes Mellitus: A Fundatmental and Clinical Text, ed 3. Philadelphia, Lippincott Williams & Wilkins, 2004, pp 1085–1097.
16 Brand-Miller J, Hayne S, Petocz P, Colagiuri S: Low-glycemic index diets in the manage-ment of diabetes: a meta-analysis of randomized controlled trials. Diabetes Care 2003;26:2261–2267.
17 Chiasson JL, Josse RG, Hunt JA, et al: Efficacy of acarbose in the treatment of patients withnon-insulin-dependent diabetes mellitus. A multicenter controlled clinical trial. Ann InternMed 1994;121:928–935.
18 Rodger NW, Chiasson JL, Josse RG, et al: Clinical experience with acarbose: results of aCanadian multicentre study. Clin Invest Med 1995;18:318–324.
19 Holman RR, Cull CA, Turner RC: A randomized double-blind trial of acarbose in type 2 dia-betes shows improved glycemic control over 3 years (UK Prospective Diabetes Study 44).Diabetes Care 1999;22:960–964.
20 Chiasson JL, Josse RG, Gomis R, et al: Acarbose for prevention of type 2 diabetes mellitus: theSTOP-NIDDM randomised trial. Lancet 2002;359:2072–2077.
21 Augustin LS, Franceschi S, Jenkins DJ, et al: Glycemic index in chronic disease: a review. EurJ Clin Nutr 2003;56:1049–1071.
22 Frost G, Leeds AA, Doré CJ, et al: Glycaemic index as a determinant of serum HDL-cholesterolconcentration. Lancet 1999;353:1045–1048.
23 Salmeron J, Manson JE, Stampfer MJ, et al: Dietary fiber, glycemic load, and risk of non-insulin-dependent diabetes mellitus in women. JAMA 1997;277:472–477.
24 Knowler WC, Barrett-Connor E, Fowler SE, et al: Reduction in the incidence of type 2 dia-betes with lifestyle intervention or metformin. N Engl J Med 2002;346:393–403.
25 Hu FB, Manson JE, Stampfer MJ, et al: Diet, lifestyle, and the risk of type 2 diabetes mellitusin women. N Engl J Med 2001;345:790–797.
Kendall/Augustin/Emam/Josse/Saxena/Jenkins
52

26 Tuomilehto J, Lindstrom J, Eriksson JG, et al: Prevention of type 2 diabetes mellitus by changesin lifestyle among subjects with impaired glucose tolerance. N Engl J Med 2001;344:1343–1350.
27 The effect of intensive treatment of diabetes on the development and progression of long-termcomplications in insulin treated diabetes mellitus. The Diabetes Control and ComplicationsTrial Research Group. N Engl J Med 1993;329:977–986.
28 Franz MJ, Horton ES, Bantle JP, et al: Nutrition principles for the management of diabetesand related complications. Diabetes Care 1994;17:490–518.
29 Sheard NF, Clark NG, Brand-Miller JC, et al: Dietary carbohydrate (amount and type) in theprevention and management of diabetes: a statement by the American Diabetes Association.Diabetes Care 2004;27:2266–2271.
30 Ceriello A, Bortolotti N, Motz E, et al: Meal-generated oxidative stress in type 2 diabeticpatients. Diabetes Care 1998;21:1529–1533.
Discussion
Dr. Knowler: You started your talk by showing the effects of frequent small mealscompared to larger meals in saying that the glycemic index (GI) concept evolved fromthis. Doesn’t that suggest that it might be just as easy to change meal frequency to fre-quent small meals rather than focusing on the GI for food? Might the same thing beaccomplish more easily?
Dr. Kendall: I think that this could be a viable approach to try to decrease thepostprandial rise in blood glucose. So you can sip your drinks or eat a number of smallmeals a day and that would be an effective strategy but obviously you want to have ahealthy diet if you are doing this. We want to give people as many choices as possible.However, trying to get people to eat 3 meals a day is pretty tough, so trying to getthem to eat 17 meals a day would probably be a bit tougher.
Dr. Mooradian: You started out defining the GI as essentially derived from thearea under the curve of a test carbohydrate against a reference carbohydrate such aswhite bread or glucose, but you ended up focusing your discussion on the kinetics ofglucose absorption and low GI of slowly absorbed food. How would this slow absorp-tion change the area under the curve?
Dr. Kendall: When carbohydrate is slowly absorbed then the glucose rise is notgoing to be as large, the insulin will be secreted and will clear the glucose from theblood as well. Again it is the very high glucose peaks which appear to be most damag-ing. This is when the oxidative reactions are occurring.
Dr. Mooradian: Are you assuming that if the influx of glucose is slower theninsulin will be more effective?
Dr. Kendall: The glucose peak just won’t be the same and the level of insulinsecretion won’t be the same either. I think that was demonstrated in the slide shownwhere glucose was given either as a bolus or sipped throughout the day. Not only wasthe peak glucose reduced, peak insulin was reduced and serum C peptide was alsoreduced, as was C peptide excretion [1].
Dr. Mooradian: That is not a fair comparison. It is a quantitative effect; if you aretaking less carbohydrate you are going to have less glucose.
Dr. Kendall: In that study the same amount of carbohydrate was provided, thatwas the point. So if the same amount of carbohydrate is given as a bolus or sippedthroughout the day, the latter induces less insulin secretion [1].
Dr. Katsilambros: We know that acarbose also delays carbohydrate absorption.Do you know of any study comparing high GI with low acarbose versus low GI withplacebo, or no acarbose?
Dr. Kendall: It would be nice to do the low acarbose plus low GI study. I don’tbelieve it has been compared, at least not that I am aware of. But again if you reduce
The Glycemic Index: Methodology and Use
53

the rate of glucose absorption with acarbose, you get a similar effect that hopefully isachieved with a low GI diet.
Dr. Schiffrin: How do you assess the oxidative reaction after the hyperglycemicpeak? What biomarkers are studied?
Dr. Kendall: It can be assessed in a number of different ways. The study presentedwas conducted in Italy, by Ceriello [2]. He has been looking at different measures ofoxidative stress, so it could be as simple as looking at some antioxidant, vitamins orcarotinoids. We know that diabetic subjects tend to have lower levels of antioxidantsin their blood, so there are a number of different measures that can be looked at.
Dr. Halimi: How do you explain that despite a lower insulin response with low GIfoods there is no benefit on body weight?
Dr. Kendall: We are actually talking about two different things. In tightly con-trolled studies of the GI we are trying to maintain body weight, as this would otherwisebe a confounder by affecting insulin sensitivity and fasting glucose. To address yourquestion we need free-living studies, where subjects are allowed to lose weight, com-paring high GI diets with low GI diets. We have seen this in a weight loss study con-ducted by Raatz et al. [3]. However, when you are achieving significant weight loss bycontrolling energy intake, often both study groups achieve similar results and itbecomes difficult to detect differences in insulin resistance and fasting glucose.
Dr. Slama: Can I add something to this question? First of all I don’t see any reasonwhy people exhibiting less hyperglycemia and less hyperinsulinemia should loseweight because all the calories which are ingested are metabolized and the net energybalance is exactly the same whatever the blood glucose excursion. We have just fin-ished a study done on a Weightwatcher population and we tried to see if people eatinglow GI food lose weight. In fact there was exactly the same weight loss in the two pop-ulations with high and with low GI; the only difference was satiety. The people on lowGI said that it was much easier to follow the diet rather than the high GI because ofsatiety. So there is no reason to lose weight more than to equal the energy intake butit is an easier way to follow the diet.
Dr. Kendall: I think that is a good point. Many low GI foods are whole foods, theenergy density would tend to be lower. If you look at low GI food you actually do get anincreased excretion or malabsorption of starch as well. There is a correlation betweenlow GI foods and increased starch excretion.
Dr. Jianqin Sun: I have a question regarding the low GI for the lower body massindex. I would like to know what the mechanism for the weight loss is. My secondquestion is with regard to the GI classification in terms of low, median and high; itseems a little different from the reference described in the literature.
Dr. Kendall: The second question first. I was using the bead index, so to use theglucose index you have to multiply those numbers by 0.7. The reason for weight losswith low GI? Again low GI diets tend to contain many whole foods; they tend to behigher in fiber as well, so this may be responsible for the increased weight loss.
Dr. Jianqin Sun: Is there any evidence for the energy expenditure differencebetween the low GI diet and the high GI diet?
Dr. Kendall: I don’t think it has been looked at very carefully. There have beensome studies looking at postprandial association with appetite. If you look at a lunchintake after a low versus a high GI breakfast, the amount of food consumed after thelow GI breakfast tends to be lower [4].
Dr. Katsilambros: I would like to come back to Dr. Slama’s comment about thesame weight loss between low and high GI diets in humans. I recall a study published3 years ago in rats fed high and low GI diets. These animals are a good model becauseexactly the same amount of energy can be given to them, and we are not sure whathappens in humans. All the experimental animals on a low GI diet lost more weight.
Kendall/Augustin/Emam/Josse/Saxena/Jenkins
54

We shouldn’t ignore these studies. Certainly with humans it does not seem to happenbut again we don’t know how strictly humans adhere to the given instructions.
Dr. Kendall: Again we tend to think that all carbohydrates are available or that allprotein and fat are absorbed and I don’t think we are that efficient in absorbing all thenutrients that we take in. We have recently run a study looking at nut intake at 3 differentdoses and on the highest nut intake there is an excretion of about 60 kcal/day with thehigh nuts and approximately 15–20% of the energy from nuts was not absorbed [5]. Thisrepresents a significant proportion of the diet. This may be one of the reasons why wholefoods, intact particles, are extremely healthy. Not only is there reduced absorption ofsome nutrients but they are then reaching the large intestine. What happens to that foodsystem in the large intestine? We know it is quite good for the bacteria and it may have amyriad of other biochemical and physiological effects that are extremely healthy.
Dr. Katsilambros: It might be a good explanation. Are there any observations con-cerning physical activity and energy and movements, automatic movements of the mus-cles on the one diet and on the other diet? This could at least explain the animal findings.
Dr. Kendall: That is a good point. The GI has been looked at in terms of energyperformance and with the low GI diet at least in some studies there seems to beincreased performance [6]. I think this is an area that has not really been looked atvery carefully.
Dr. Slama: I would like to add something to what Dr. Katsilambros said, and laterI will show some results from an animal study. You are right that rats gained lessweight during the first weeks and then caught up, and at 5 weeks finished up withexactly the same body weight.
Mr. Wuersch: This was one of our concerns 20 years ago when we started thisproject on the GI: What role does the availability of the nutrients play? When we taketwo extremes, for example potato or pulses, which have a GI ratio of roughly 1–2 or1–2.5, we find that 10% of the carbohydrate is not absorbed in the pulses, which isconfirmed by the resistant starch analysis. This means that on the diet side, it repre-sents a maximum of 5% of the energy intake, so it comes back to your 80 caloriesroughly for a daily intake. Consequently this difference is probably not so significantand it has nothing to do or only marginally to do with the GI measured [7].
Dr. Kendall: I think that is also an important point. So while there is a loss of car-bohydrate in some low GI foods, this does not account for the dramatic reduction in GIin the food. However that 5% loss in calories in terms of weight maintenance could beextremely important. We tend to gain 0.45 kg a year, 0.9 kg a year, it is a very slow pro-gression in terms of weight gain. The balance between weight maintenance and weightgain is very finely tuned, so anything that can help us to excrete some energy could beextremely important.
Dr. T. Wilkin: I am not sure this question is a sensible one. You are obliged to usethe GI because of the individual variation you would otherwise get. So what you areleft with are relative, comparative data. How big is the range in absolute terms thatyou get between different foods? Is that a meaningful question? There could be rela-tive differences but they could be very narrow differences in absolute terms.
Dr. Kendall: No, the absolute difference can be quite large. Nuts have an extremelylow GI of around 20 or so, and pasta will have a GI of around 60, mash potatoes arearound 100, boiled potatoes may be slightly less than 100.
Dr. T. Wilkin: That tells me there is a ratio of 6 or 7 to 1 across the range, but isthat what is that meant in absolute terms?
Dr. Kendall: Yes, a range of about 6- to 7-fold which is quite large. So there is vari-ation from day to day in someone’s response to particular foods. We are still dealingwith a black box, and if you look at some of the studies in saturated fat reduction, themajority of subjects reduce their low-density lipoprotein (LDL) cholesterol but there
The Glycemic Index: Methodology and Use
55

are still some subjects who raise their LDL. So I don’t think you would interpret thosedata as saturated fat is good for the majority but not for those two individuals. Youexpect differences in response between individuals at particular times. The personwho had an increase in LDL with decreased saturated fat on one occasion will mostlikely have a decrease in LDL with decreased saturated fat on most occasions.
Dr. Gerasimidi-Vazeou: I would like to ask you whether there are any long-termstudies regarding the effect of GI diets on HbA1c in type-1 diabetic patients?
Dr. Kendall: I don’t believe any very long-term studies have been undertaken intype-1 diabetic subjects. Most of the studies have been conducted in type-2 diabetes andmost have not been of great length, typically around 12 weeks. I know with the increasedinterest in carbohydrates and GI, more longer-term studies are in progress. So I thinkwe will begin to see data from these longer-term studies in the next year or two.
Dr. Bantle: I think the GI is largely predictable based on three main determinantswhich are fiber, fat and fructose. I ask you to comment on whether you think that istrue. I would also like to ask you about the effect on the GI when you combine nutri-ents in a meal. In fact, does this not substantially diminish the difference among foodsof different GIs?
Dr. Kendall: If there are large amounts of fat in a meal and large amounts of pro-tein, that can affect the glycemic response, but typically these are not at a level thatwill have a significant effect. We have looked at the glycemic responses to nuts, whichare high in fat. A standard white bread control was provided with 0, 28, 56, or 85 g ofnuts, and there was always a significant reduction at the 56- and 85-gram level. Butthis is a dramatic level of nuts, 56 and 85 g [8]. So although you can see an effect, it isnot typically seen for most meals. In terms of a fiber effect, foods that have high levelsof soluble fiber will have a reduced glycemic response. Although the same is not truefor non-viscous fiber. For example whole wheat bread, brown bread or grains thathave been finely ground will have the same GI as white bread. So food form is impor-tant as is the nature of starch. Pasta, which is also made from wheat flour, has a muchlower glycemic response than does brown or white bread.
References
1 Jenkins DJ, Wolever TM, Ocana AM, et al: Metabolic effects of reducing rate of glucose inges-tion by single bolus versus continuous sipping. Diabetes 1990;39:775–781.
2 Ceriello A: Postprandial hyperglycemia and diabetes complications: is it time to treat?Diabetes 2005;54:1–7.
3 Raatz SK, Torkelson CJ, Redmon JB, et al: Reduced glycemic index and glycemic load dietsdo not increase the effects of energy restriction on weight loss and insulin sensitivity in obesemen and women. J Nutr 2005;135:2387–2391.
4 Anderson GH, Woodend D: Effect of glycemic carbohydrates on short-term satiety and foodintake. Nutr Rev 2003;61:S17–S26.
5 Kendall CW, Ellis PR, Marchie A, et al: Lipid bioavailability from almonds: implications for car-diovascular health and weight loss – a randomized controlled dose-response study (abstract).Ann Nutr Metab 2003;47:617.
6 Kirwan JP, Cyr-Campbell D, Campbell WW, et al: Effects of moderate and high glycemic indexmeals on metabolism and exercise performance. Metabolism 2001;50:849–855.
7 Schweizer TF, Andersson H, Langkilde AM, et al: Nutrients excreted in ileostomy effluentsafter consumption of mixed diets with beans or potatoes. II. Starch, dietary fibre and sugars.Eur J Clin Nutr 1990;44:567–575.
8 Kendall CW, Marchie A, Parker TL, et al: Effect of nut consumption on postprandial starchdigestion – a dose-response study (abstract). Ann Nut Metab 2003;47:636.
Kendall/Augustin/Emam/Josse/Saxena/Jenkins
56

The Argument against Glycemic Index:What Are the Other Options?
Marion J. Franz
Nutrition Concepts by Franz, Inc., Minneapolis, MN, USA
AbstractThere is debate among professionals regarding the use of the glycemic index (GI) for
meal planning. In type-1 diabetes, there are 4 studies (average duration �4 weeks) com-paring high versus low GI diets; none reported improvements in HbA1c, and although 2reported improvements in fructosamine, 2 reported no differences. In type-2 diabetes,there are 12 studies (average duration �5 weeks); 3 reported improvements in HbA1cand fructosamine, 5 reported no differences in HBA1c, and 3 reported no differences infructosamine. In adults, there is limited evidence that a low GI diet is beneficial forweight loss or satiety. Three epidemiologic studies reported that a low GI/glycemic load(GL) is associated with a reduced risk of developing diabetes or prevalence of insulinresistance; however, 5 studies report no association between GI/GL and the risk ofdeveloping diabetes, fasting insulin or insulin resistance, or adiposity. In general, thetotal amount of carbohydrate in a meal is the primary meal-planning strategy for peoplewith diabetes. The GI can be used as an adjunct for the fine tuning of postprandial bloodglucose responses. Other food/meal-planning interventions have been shown to be moreeffective than the use of the GI.
Copyright © 2006 Nestec Ltd., Vevey/S. Karger AG, Basel
Carbohydrates can be classified based on their chemical structure and/orbased on their physiological effects. Based on chemical structure the majordietary carbohydrate groups are: sugars, starch, and fiber. Defining carbohy-drates by chemical structure, however, does not take into account their phys-iologically differing responses, such as differences in satiety value, gastricemptying times, and effects on glucose and insulin levels. To better definephysiological responses, the concept of a glycemic index (GI) was developedby David Jenkins and colleagues in the 1970s. The GI is defined as the rela-tive area under the postprandial glucose curve comparing 50 g of digestible
Bantle JP, Slama G (eds): Nutritional Management of Diabetes Mellitus and Dysmetabolic Syndrome.Nestlé Nutr Workshop Ser Clin Perform Program, vol 11, pp 57–72,Nestec Ltd., Vevey/S. Karger AG, Basel, © 2006.
57

carbohydrate from a test food to 50 g of carbohydrate ingested from 50 g of astandard food – pure glucose or white bread. As defined, the GI takes intoaccount only the type of carbohydrate in food and ignores the total amount ofcarbohydrate in a typical food serving, although both the type and amount ofcarbohydrate influence the postprandial and insulin responses of a giveningested food [1]. In an attempt to compare the glucose-raising effect of foodswith their widely differing amounts of carbohydrate, the glycemic load (GL)was developed. The GL is defined as the GI multiplied by the grams of carbo-hydrate in a specific portion of a carbohydrate-containing food or meal. Forexample, although carrots have a high GI, because they contain relativelysmall amounts of carbohydrate they have a low GL.
Perhaps the most widely held belief in regard to carbohydrates and dia-betes has been the assumption that the response to food carbohydrates wasbased on the chemical composition, e.g. sugars versus starches. However,about 20 studies have reported that when subjects are allowed to choose froma variety of starches and sugars, the glycemic response is identical as long as the total amount of carbohydrate is kept constant [2]. Therefore, theAmerican Diabetes Association concluded that with regard to the effects ofcarbohydrate on glucose concentrations, the total amount of carbohydrate inmeals and snacks is a key strategy [3].
Definitions of a Low, Medium, or High GI Food or Diet
In general, if the GI number of a food is higher than 70, the food is consid-ered to have a ‘high’ GI value. If the number is lower than 55, it has a ‘low’ GI.Medium GI foods have GIs in the range of 55–70. But because the methodsused to calculate GI are not always standard (e.g. glucose and bread are bothused for comparison), knowing the exact GI number may not be as importantas knowing if a food is a ‘low’, ‘moderate’, or ‘high’ GI food.
In general, low GI foods include non-starchy vegetables, fruits, dairy prod-ucts, lentils and sugars such as fructose and lactose. Moderate GI foods areunprocessed grains and mixed dishes. High GI foods are refined grains andpotatoes. Table 1 lists examples of low, moderate, and high GI foods.
The GI of foods can be modified by changing the nature of starch (e.g.increasing amylopectin or decreasing amylose or by combing starch with pro-tein [gluten]); altering cooking methods (e.g. reducing the extent of gela-tinization or cooling to prevent retrogradation); using larger particle or piecesize, adding some acids such as those in vinegar and lemon juice; adding solu-ble fibers such as psyllium, or by adding or substituting lactose, fructose, orsucrose for starch or glucose.
It is likely that most people already eat a moderate GI diet. In the NursesHealth Study, the lowest quintile of GI for women was 64 and in the high-est quintile 77, a difference of only 13 units [4]. In the Health Professional
Franz
58

Study, GI was 65 in the lowest quintile for men and 79 in the highest, again adifference of only 14 units [5]. In the Insulin Resistance and AtherosclerosisStudy, the average caloric intake was reported to be 1,987 kcal/day with220 g/day of digestible carbohydrate, 19 g/day of fiber, and an average GI of 58and an average GL of 128 [6]. It is unknown if further lowering of the GI canbe achieved long-term. Such small differences suggest that it may be bothimpractical and unreasonable to drive the GI down in the general population.In the only 1-year study published thus far, one group of individuals attemptedto follow a low GI diet while the other group ate their usual foods [7]. Atthe end of the year there was no significant difference in the GI betweengroups.
Problems with the GI – Methodology and Variability
If foods do have different glycemic responses, why the controversy? Severalproblems with the methodology used to determine GI have been cited [1]. Asnoted above, 50 g of digestible carbohydrate from foods is used to determinethe GI. Although this would seem logical, in reality it does not reflect the actualamounts of carbohydrate contributed by individual foods in the usual diet. Asmentioned, foods that in usual portion sizes contribute minimal amounts of car-bohydrate, despite having a high GI, would not elicit much of a glycemicresponse. And conversely, foods such as pizza may have a lower GI number, butthe usual portion size consumed would contribute a considerably greateramount of total carbohydrate resulting in a higher GL.
The GI only measures glucose above the beginning fasting glucose. If itmeasured what occurs naturally, the fasting glucose value would decreaseover time and the area under the curve (AUC) would be greater. Therefore,some researchers favor the use of the whole AUC as the real measure of glu-cose availability [1]. If the AUC is calculated in this manner, the differences in
The Argument against Glycemic Index
59
Table 1. Examples of low, moderate, and high glycemic index (GI) foods
Low GI foods Moderate GI foods High GI foods
Whole grain breads Rye bread White breadBran cereals Frosted flakes Corn flakesFruit Soft drinks WatermelonNon-starchy vegetables Ice cream Instant mashed potatoesMilk Sucrose Sports drinks Ice cream premium Pasta Baked potatoes Reduced fat yogurt Soups CarrotsOatmeal (slow cook oats) Pizza RiceLentils/baked beans Candy bars Bagels

GIs between foods are greatly attenuated. For example, a person with a fast-ing glucose of 75 mg/dl (4.2 mmol/l) ingests two foods, one with a GI of 100and the other a GI of 72. If the GI were calculated by using the whole glucoseAUC instead of only the area above the fasting glucose, the values would be 100and 92, respectively. The difference changes from 29 to 8 units. Furthermore,the GI is measured in the morning, after an overnight fast. Several studieshave reported that if the GI is measured after lunch, the differences in GIwould be considerably less than after breakfast.
A major problem, however, is the reproducibility and variability of the glu-cose response. Reproducibility of the glucose response in the same subjecthas not been adequately studied, and the individual blood glucose responseto any food or meal is highly variable, both within and between individuals –ranging from 23 to 54% [1, 8]. Values for the GI of foods are broad. For example,Australian potatoes have a GI of 87–101, placing them in the high GI group. Inthe United States and Canada potatoes have a GI ranging from 56 to 77, plac-ing them in the moderate GI group [9]. GI values for boiled rice vary from 45to 112. Bananas range from 30 to 70, partially depending on their degree ofripeness. The GI from different types of spaghetti varies even more widely.White, durum-wheat semolina spaghetti varies from 45 to 65, depending onthe length of cooking time. Even prepared foods vary greatly. For exampleAll-Bran cereal ranged from 30 in Australia to 51 in Canada, and corn chipsvaried from 72 in 1985 to 42 in 1998 [10].
Testing of blood glucose before and after eating a particular food by anindividual may be the best way to determine an individual’s glycemicresponse. However, this may not be accurate either as rarely do individualseat only one food at a meal. The glucose response to a meal is determinedfirst of all by the total amount of carbohydrate in a meal and secondly by thecombination of carbohydrate foods in a meal. If a high GI food is eaten incombination with a low GI food, the GI response will be moderate. For exam-ple, a high GI cereal eaten with milk will have a moderate GI response.Adding fat to potatoes can also change their GI response. The GI response toa particular food can also be lowered by eating less of the food. Protein in themeal does not affect the glycemic response [11], whereas large amounts offat may.
Another major problem is that the GI is not the best indicator of healthyfood choices. Although many healthy foods have a low GI (whole grains,fruits, vegetables, legumes, dairy products), there are also foods of question-able value with low or moderate GI values. For example, soft drinks, candies,sugars, and high fat foods fall into this questionable category. The GI of foodscan be lowered by adding or substituting sugars, especially fructose, sugaralcohols, or fat.
In addition, the insulin response to a given food is not linear and is not con-sistently related to either the carbohydrate content or glycemic effect of food[12]. The insulin response to a 100-gram portion of a particular food is not
Franz
60

double that of the GI standard of 50 g. Although GI is relatively constantacross different populations (lean, obese, impaired glucose tolerance, dia-betes), the insulin responses vary widely [13]. Postprandial insulin responsesto isocaloric amounts of food are not closely related to either the carbohy-drate content or the glycemic effects of food; the glycemic response accountsfor only 23% of the variability in insulin [12]. Thus, GI may not be a goodmarker to predict insulin response.
GI and Diabetes – Treatment and Prevention
Although different carbohydrates do produce differing glycemicresponses, to be of benefit clinically, this benefit should translate into long-term improvements in glycemia or lipids. Table 2 summarizes the researchcomparing high versus low GI diets on glucose and lipid outcomes in studieswith a minimum duration of 2 weeks [14–28]. Examining the data reveals noclear trend in outcome benefits. A meta-analysis of GI diets in persons withdiabetes reported a reduction in HbA1c by 0.4% units (a 7.4% decrease) from
The Argument against Glycemic Index
61
Table 2. Summary of high versus low glycemic index diets in diabetes
Outcome Type-1 diabetes Type-2 diabetes(4 studies; 36 subjects; (12 studies; 175 subjects;�4 weeks duration) �5 weeks duration)
low GI diet no difference low GI diet no differencesignificantly between significantly betweenbetter diets better diets
HbA1c 0 2 (n � 19) 3 (n � 42) 5 (n � 67)[14, 16] [19, 27, 28] [16, 18, 23, 25, 26]
Fructosamine 2 (n � 15) 2 (n � 21) 3 (n � 41) 3 (n � 54)[14, 15] [16, 17] [20, 21, 24] [18, 22, 23]
FPG 0 3 (n � 27) 1 (n � 12) 10 (n � 153)[14, 15, 16] [27] [16, 18, 19–25, 28]
Insulin 1 (n � 8) 2 (n � 21) 1 (n � 10) 3 (n � 49)requirements/ [15] [16, 17] [26] [19, 23, 27]levels
Cholesterol 1 (n � 7) 2 (n � 20) 4 (n � 53) 5 (n � 69)[14] [15, 16] [20, 21, 24, 27] [16, 18, 19, 22, 28]
Triglycerides 1 (n � 12) 2 (n � 15) 2 (n � 31) 8 (n � 113)[16] [14, 15] [16, 22] [18, 19–21, 24,
25, 27, 28]HDL 0 3 (n � 27) 1 (n � 21) 7 (n � 91)
[14–16] [23] [16, 18, 20, 22, 24, 27, 28]
LDL – – 1 (n � 12) 7 (n � 116)[27] [18, 20, 22–25, 28]

low GI diets compared to high GI diets and a reduction in HbA1c from base-line by 0.35% units [29]. However, included in the meta-analysis are two stud-ies not included in table 2. In the study by Gilbertson et al. [7], there were nosignificant differences in the GI of the diets at study end in the study arms.Thus, it is questionable if the lowering of the GI in one study arm can beattributed to differences in GI. In the study by Giacco et al. [30], 50 g of fiberare included in the low GI group. Fiber and GI are not necessarily the sameand therefore it is unknown if the effect on glucose response is due to the lowGI of the diet or to the fiber content. These two studies account for 47% ofthe total subjects in the meta-analysis.
Early epidemiological studies suggest that a low GI/GL diet may play arole in the prevention of diabetes [4, 5]. Table 3 summarizes the outcomesfrom later studies and from countries other than the United States. Whereas,3 studies report a positive association between low GI/GL diets and the riskof developing diabetes or insulin resistance, 5 do not. Interestingly, in 3 stud-ies fiber was positively associated with insulin sensitivity, whereas GI/GLwas not.
Franz
62
Table 3. Epidemiologic studies on glycemic index (GI), glycemic load (GL), and fiberand effect on insulin resistance and risk of diabetes
Positive association Negative association
Nurses Health GI/GL associated Iowa Women’s No association GI/GLStudy 1997 [4] with risk of Study 2000 [31] and risk developing
developing diabetesdiabetes
Health Professional GI/GL associated Zutphen Elderly No associationStudy with risk Study 2000 [32] between GI and
fasting insulinFramingham GI/GL associated Atherosclerosis Risk No association
Offspring with prevalence in Communities between GI/GL withCohort 2004 [33] of insulin Study (ARIC) insulin-resistant
resistance 2002 [34] diseases; fiberbeneficial association
Inter99 Study No association2005 [35] between GI/GL and
insulin resistance;fiber beneficially associated withinsulin resistance
Insulin No associationResistance and between GI/GL andAtherosclerosis insulin sensitivity Study (IRAS) and adiposity; fiber 2005 [6] beneficial association

The Argument against Glycemic Index
63
GI and Weight Loss and Appetite
Although many of the popular diet books promote the use of low GI foodsin their diets, there is minimal evidence to suggest that a low GI diet con-tributes to weight loss. The diet books claim that high GI foods are digestedrapidly causing blood glucose to surge and an oversecretion of insulin, bothcontributing to insulin resistance, increased appetite, overeating, and weightgain. However, figure 1 illustrates the glucose response to carbohydrate loadscontaining 50 g of glucose from dextrose, rice, corn, potato, and bread [36].Although the peak responses differ slightly they occur at approximately thesame time. Furthermore, the actual change in glucose is only �20 mg/dl(1 mmol/l). Reporting the results in percentage of change as is done with theGI often distorts the small to modest changes in glycemic responses. Actualchanges in postprandial glucose levels would be more useful.
In reviewing weight changes in the 12 studies in persons with type-2 dia-betes in table 2, one study reported more weight loss on the high GI diet, 1study reported more weight loss on the low GI diet although the calories werealso less in that arm, and 10 studies reported no differences in weight loss.Heilbronn et al. [25] asked the question does reducing the GI of a high carbo-hydrate diet confer a benefit during energy restriction. After 4 weeks of anenergy-restricted diet, subjects were randomized to a low or a high GI diet.There was no difference in weight loss between the groups.
Raben [37] reviewed weight loss on high versus low GI diets and concludedthat no clear pattern of difference between low and high GI in terms ofdecreased food intake or weight loss is shown. In 20 studies (6 days to 6 months in duration), the average weight loss in 4 studies was 1.5 kg on thelow GI diet, in 2 studies 1.6 kg on a high GI diet, and in 14 studies there was nodifference in weight loss between the high and the low GI diets. It was con-cluded that there was no evidence that low GI foods are superior to high GIfoods for long-term body weight control.
On the other hand, Pawlak et al. [38] concluded that based on epidemio-logical evidence and a small weight loss study in adolescents there was sup-port for a role of the GI in disease prevention and treatment, weight loss andsatiety. Their hypothesis is that recommended lower intakes of dietary fatfor weight loss has actually contributed to the increase in obesity, and thatreduced dietary fat results in compensatory increases in the consumption ofhigh GI carbohydrate, principally refined starchy foods and concentratedsugar. Because they are rapidly digested such foods cause a large increasein postprandially glucose and insulin causing a decrease in satiety andweight gain.
The recently released US Dietary Guidelines for Americans, however,strongly recommend calorie control to manage body weight. They state:‘When it comes to weight control, calories do count – not the proportions ofcarbohydrate, fat and protein in the diet. . . . The healthiest way to reduce

calorie intake is to reduce one’s intake of added sugars, solid fats, and alcohol– they all provide calories, but they do not provide essential nutrients.’
Potential Benefits and Problems to Food Companies
Incorporating the GI to Foods
The current low carbohydrate diet fad is phasing out and, therefore, foodcompanies may be looking for a new marketing approach. With the currentpublicity regarding the GI in diet books and by many health providers, itwould appear logical to think that knowing the GI of foods would be useful.The low fat diet approach stopped working when food companies flooded themarket with low fat foods that were not necessarily lower in calories. Thesame can be said regarding the low carb approach. Instead of avoiding carbo-hydrate foods which would lead to a reduction in calories the market becameflooded with low carbohydrate (net carbohydrate, low impact carbohydrate)foods that also were not necessarily lower in calories. This can potentiallyhappen to low GI foods as well.
The methodology for determining the GI has been criticized and each foodmust be tested individually. This requires food companies to invest financialresources into GI testing of their food products. The GI must be tested inhumans and cannot be determined from data bases.
Companies that have foods with a naturally low GI have an advantage if thelow GI movement catches on. The type of food companies most likely to benefitare companies with whole grain or unprocessed starch foods and dairy products.
Franz
64
80
90
100
110
120
130
140
150
0 15 30 45 60 75 90 105 120 135 150 165 180
Potato Dextrose Corn Rice Bread
Time (min)
Glu
co
se (m
g/d
l)
Fig. 1. Glucose response to 50 g of digestible carbohydrate from dextrose, rice, corn,potato and bread. Reprinted with permission from Crapo et al. [31].

The problem with the low GI approach will be similar to the problems thatoccurred with the development of low fat and low carbohydrate foods. Foodcompanies can develop low GI foods. This can be done by adding or substitut-ing sugars, especially fructose, and fat to foods. However, this may change the‘healthy’ image of low GI foods and turn off health providers and potentiallythe public to low GI foods.
The Argument against Glycemic Index
65
Table 4. Randomized controlled trials and outcome studies: outcomes from medicalnutrition therapy (MNT) for type-2 and type-1 diabetes
Type of study HbA1c decreases Interventions
MNT studies in type-2 diabetes
UK Prospective 1.9% Reduced energy/fat intakeDiabetesStudy Group [40]
Franz et al. [41] 0.9% (4-year duration) Reduced energy/fat intake1.7% (newly diagnosed)
Goldhaber-Fiebert 1.8% Portion control and et al. [42] healthier food substitutions
Ziemer et al. [43] 1.9% Healthy food choicesLemon et al. [44] 1.7% Carbohydrate counting
and simplified meal plans
MNT in diabetes self-management training studies (DSMT) in type-2 diabetes
Sadur et al. [45] 1.3% Healthy food choices for improved glycemia
Rickheim et al. [46] 2% (newly diagnosed) Carbohydrate countingPolonsky et al. [47] 2.3% intensive DSMT Reduced energy/fat/
1.7% standard DSMT carbohydrateBanister et al. [48] 1.5% Basic nutrition concepts/
individualized mealplanning strategies
MNT in type-1 diabetes management
Delahanty and 0.9% DCCT who followed meal Halford [49] plan (carbohydrate
counting) �90% of the time compared to those �45% of the time
Kulkarni et al. [50] 1% (newly diagnosed) Carbohydrate counting and exchange lists
Pieber et al. [51] 1.2% Carbohydrate counting/adjusting insulin dosebased on carbohydrate intake
DAFNE Study 1% Carbohydrate counting/Group [52] adjusting insulin dose
based on carbohydrate intake

What Might Be More Helpful?
Randomized controlled trials and outcome studies of medical nutritiontherapy (MNT) in the treatment of type-1 and type-2 diabetes have reportedimproved HbA1c levels of approximately 1–2% units (a 15–22% decrease);however, low GI diets compared to high GI diets have only been shown tolower HbA1c by �0.4% (7% decrease) [29]. MNT in these studies is providedby dietitians/nutritionists as MNT only or as MNT in combination with dia-betes self-management training [39]. Interventions for type-2 diabetesinclude reduced energy intake, reduced fat/carbohydrate intake, carbohy-drate counting and basic nutrition and healthy food choices for improvedglycemia. Interventions for type-1 diabetes include carbohydrate countingand matching insulin doses to planned carbohydrate intake. Outcomes of theintervention are known by 3 months. Table 4 summarizes randomized con-trolled trials and outcome studies of MNT in type-1 and type-2 diabetes.Therefore it has been recommended that interventions demonstrated to havethe greatest effect on overall glycemic control be implemented first [53].Individuals with diabetes who can understand and benefit from the conceptof low GI foods may be able to use pre- and post-meal blood glucose monitor-ing to fine tune their food choices.
Until research demonstrates long-term benefits for people with diabetes inthe use of the GI, making food choices should be kept as easy and simple aspossible. Understanding what foods are carbohydrates, knowing portionsizes, and knowing how many servings to select for meals, and, if desired, forsnacks, will benefit the majority of the people with diabetes and can increasevariety and flexibility in food choices.
References
1 Pi-Sunyer FX: Glycemic index and disease. Am J Clin Nutr 2002;76:290S–298S.2 Franz MJ, Bantle JP, Beebe CA, et al: Evidence-based nutrition principles and recommenda-
tions for the treatment and prevention of diabetes and related complications. Diabetes Care2002;25:148–198.
3 Sheard NF, Clark NG, Brand-Miller JC, et al: Dietary carbohydrate (amount and type) in theprevention and management of diabetes. A statement by the American Diabetes Association.Diabetes Care 2004;27:2266–2271.
4 Salmeron J, Manson JE, Stampfer MJ, et al: Dietary fiber, glycemic load and risk of non-insulin-dependent diabetes mellitus in women. JAMA 1997;277:472–477.
5 Salmeron J, Ascherio A, Rimm EB, et al: Dietary fiber, glycemic load, and risk of NIDDM inmen. Diabetes Care 1997;20:545–550.
6 Liese A, Schulz M, Fang F, et al: Dietary glycemic index and glycemic load, carbohydrate andfiber intake, and measures of insulin sensitivity, secretion, and adiposity in the InsulinResistance Atherosclerosis Study. Diabetes Care 2005;28:2832–2838.
7 Gilbertson HR, Brand-Miller JC, Thorburn AW, et al: The effect of flexible low glycemic indexdietary advice versus measured carbohydrate exchange diets on glycemic control in childrenwith type 1 diabetes. Diabetes Care 2001;24:1137–1143.
8 Wolever TM, Vorster HH, Bjorck I, et al: Determination of the glycaemic index of foods: inter-laboratory study. Eur J Clin Nutr 1998;52:924–928.
Franz
66

9 Fernandes G, Velangi A, Wolever TMS: Glycemic index of potatoes commonly consumed inNorth America. J Am Diet Assoc 2005;105:557–562.
10 Foster-Powell K, Holt SHA, Brand-Miller JC: International table of glycemic index andglycemic load values: 2002. Am J Clin Nutr 2002;76:5–56.
11 Franz MJ: Protein and diabetes: much advice, little research. Curr Diab Rep 2002;2:457–464.12 Holt SHA, Brand-Miller JC, Petocz P: An insulin index of foods: the insulin demand generated
by 1000-kg portions of common foods. Am J Clin Nutr 1997;66:1264–1276.13 Wolever TMS, Chiasson J-L, Hunt JA, et al: Similarity of relative glycaemic but not relative
insulinaeic responses in norm, IGT, and diabetic subjects. Nutr Res 1998;18:1667–1676.14 Collier GR, Giudici S, Kalmusky J, et al: Low glycaemic index starchy foods improve glu-
cose control and lower serum cholesterol in diabetic children. Diabetes Nutr Metab 1988;1:11–19.
15 Fontveille AM, Acosta M, Rizkalla SW, et al: A moderate switch from high to low glycaemic-index diets for 3 weeks improve metabolic control of type I (IDDM) diabaetic subjects.Diabetes Nutr Metab 1988;1:139–143.
16 Fontvieille AM, Rizkalla SW, Penformis A, et al: The use of low glycaemic index foodsimproves metabolic control of diabetic subjects over five weeks. Diabet Med 1992;9:444–450.
17 Lafrance L, Rabasa-Lhoret R, Poisson D, et al: The effects of different glycaemic index foodsand dietary fibre intake on glycaemic control in type 1 diabetic patients on intensive insulintherapy. Diabet Med 1998;15:972–978.
18 Jenkins DJA, Wolever TMS, Buckley G, et al: Low glycemic index starchy foods in the diabeticdiet. Am J Clin Nutr 1988;48:248–254.
19 Brand JC, Colagiuri S, Crossman D, et al: Low glycemic index foods improve long-termglycemic control in NIDDM. Diabetes Care 1991;14:95–101.
20 Wolever TMS, Jenkins DJA, Vuksan V, et al: Beneficial effects of low-glycemic index diet intype 2 diabetes. Diabet Med 1992;9:451–458.
21 Wolever TMS, Jenkins DJA, Vuksan V, et al: Beneficial effect of low-glycaemic index diet inoverweight NIDDM. Diabetes Care 1992;15:562–564.
22 Frost G, Wilding S, Beecham J: Dietary advice based on the glycaemic index improves dietaryprofiles and metabolic control in type 2 diabetic patients. Diabet Med 1994;11:397–401.
23 Luscome ND, Noakes M, Clifton PM: Diets high and low in glycemic index versus highmonounsaturated fat diets: effects on glucose and lipid metabolism in NIDDM. Eur J Clin Nutr1999;53:473–478.
24 Jarvi A, Karlstrom B, Grandfeldt Y, et al: Improved glycaemic control and lipid profile and nor-malized fibrinolytic activity on a low glycemic index diet in type 2 diabetic patients. DiabetesCare 1999;22:10–18.
25 Heilbronn LK, Noakes M, Clifton PM: The effect of high- and low glycemic index energyrestricted diets on plasma lipid and glucose profiles in type 2 diabetic subjects with varyingglycemic control. J Am Coll Nutr 202:21:120–127.
26 Komindr S, Lerdvutrisopon N, Ingsriswang S, et al: Effect of long-term intake of Asian foodwith different glycemic indices on diabetic control and protein conservation in type 2 diabeticpatients. J Med Assoc Thai 2001;84:85–97.
27 Rizkalle SW, Taghrid L, laromiguiere M, et al: Improved plasma glucose control, whole-bodyglucose utilization, and lipid profile on a low-glycemic index diet in type 2 diabetic men.Diabetes Care 2004;27:1866–1872.
28 Jimenez-Cruz A, Bacardi-Gascon M, Turnbull WH, et al: A flexible, low-glycemic indexMexican-style diet in overweight and obese subjects with type 2 diabetes improves metabolicparameters during a 6-week treatment period. Diabetes Care 2003;26:1967–1970.
29 Brand-Miller J, Hayne S, Petocz P, Colagiuri S: Low-glycemic index diets in the managementof diabetes: a meta-analysis of randomized controlled trials. Diabetes Care 2003;26:2466–2468.
30 Giacco R, Pariool M, Rivellese AA, et al: Long-term dietary treatment with increased amountsof fiber-rich, low-glycemic index natural foods improves blood glucose control and reducesthe number of hypoglycemic events in type 1 diabetic patients. Diabetes Care 2000;23:1461–1466.
31 Meyer KA, Kushi LH, Jacobs DR Jr, et al: Carbohydrates, dietary fiber, and incident type 2 dia-betes in older women. Am J Clin Nutr 2000;71:921–930.
The Argument against Glycemic Index
67

32 Feskens EJ, Loeber JG, Kromhout D: Diet and physical activity as determinants of hyperinsu-linemia: the Zutphen Elderly Study. Am J Epidemiol 1994;140:350–360.
33 McKeown NM, Meigs JB, Liu S, et al: Carbohydrate nutrition, insulin resistance, and theprevalence of the metabolic syndrome in the Framingham Offspring Cohort. Diabetes Care2004;27:538–546.
34 Stevens J, Ahn K, Juhaeri, et al: Dietary fiber intake and glycemic index and incidence ofdiabetes in African-American and white adults: the ARIC study. Diabetes Care 2002;25:1715–1721.
35 Lau C, Faerch K, Glumer C, et al: Dietary glycemic index, glycemic load, fiber, simple sugars,and insulin resistance: the Inter99 study. Diabetes Care 2005;28:1397–1403.
36 Crapo PA, Reaven G, Olefsky J: Postprandial plasma-glucose and -insulin responses to differ-ent complex carbohydrates. Diabetes 1977;26:1178–1183.
37 Raben A: Should obese patients be counseled to follow a low-glycaemic index diet? No. ObesRev 2002;3:245–256.
38 Pawlak DB, Ebbeling CB, Ludwig DS: Should obese patients be counseled to follow a low-glycaemic index diet? Yes. Obes Rev 2002;3:235–243.
39 Pastors JG, Franz MJ, Warshaw H, et al: How effective is medical nutrition therapy in diabetescare? J Am Diet Assoc 2003;103:827–831.
40 UK Prospective Diabetes Study 7: Response of fasting plasma glucose to diet therapy in newlypresenting type II diabetic patients, UKPDS Group. Metabolism 1990;39:905–912.
41 Franz MJ, Monk A, Barry B, et al: Effectiveness of medical nutrition therapy provided bydietitians in the management of non-insulin-dependent diabetes mellitus: a randomized, con-trolled clinical trial. J Am Diet Assoc 1995;95:1009–1017.
42 Goldhaber-Fiebert JD, Goldhaber-Fiebert SN, Tristan ML, Nathan DM: Randomized con-trolled community-based nutrition and exercise intervention improves glycemia and cardio-vascular risk factors in type 2 diabetic patients in rural Costa Rica. Diabetes Care 2003;26:24–29.
43 Ziemer DC, Berkowitz KJ, Panayioto RM, et al: A simple meal plan emphasizing healthy foodchoices is as effective as an exchange-based meal plan for urban African Americans with type2 diabetes. Diabetes Care 2003;26:1719–1724.
44 Lemon CC, Lacey K, Lohse B, et al: Outcomes monitoring of health, behavior, and quality oflife after nutrition intervention in adults with type 2 diabetes. J Am Diet Assoc 2004;104:1805–1815.
45 Sadur CN, Moline N, Costa M, et al: Diabetes management in a health maintenanceorganization. Efficacy of care management using cluster visits. Diabetes Care 1999;22:2011–2017.
46 Rickheim PL, Weaver TW, Flader JL, Kendall DM: Assessment of group versus individual dia-betes education: a randomized study. Diabetes Care 2002;25:269–274.
47 Polonsky WH, Earles J, Smith S, et al: Integrating medical management with diabetes self-management training: a randomized control trial of the Diabetes Outpatient IntensiveTreatment program. Diabetes Care 2003;26:2048–2053.
48 Banister NA, Jastrow ST, Hodges V, et al: Diabetes self-management training program in acommunity clinic improves patient outcomes at modest cost. J Am Diet Assoc 2004;104:807–810.
49 Delahanty LM, Halford BN: The role of diet behaviors in achieving improved glycemic controlin intensively treated patients in the Diabetes Control and Complications Trial. Diabetes Care1993;16:1453–1458.
50 Kulkarni K, Castle G, Gregory R, et al: Nutrition Practice Guidelines for Type 1 DiabetesMellitus positively affect dietitian practices and patient outcomes. The Diabetes Care andEducation Dietetic Practice Group. J Am Diet Assoc 1998;98:62–70.
51 Pieber TR, Brunner GA, Schnedl WJ, et al: Evaluation of a structured outpatient group edu-cation program for intensive insulin therapy. Diabetes Care 1995;18:625–630.
52 DAFNE Study Group: Training in flexible, intensive insulin management to enable dietaryfreedom in people with type 1 diabetes: dose adjustment for normal eating (DAFNE) ran-domised controlled trial. BMJ 2002;325:746.
53 Franz MJ: The glycemic index: not the most effective nutrition therapy intervention. DiabetesCare 2003;26:2466–2468.
Franz
68

Discussion
Dr. Katsilambros: Ms. Franz and Dr. Slama, I understand that existing studies inhumans comparing low versus high glycemic index (GI) diets do not show any real weightchange. However, during the previous discussion I mentioned that there are experimen-tal animal studies that do show a weight change between low and high GI diets. I havefound the slide from the study and with your permission I would like to show it.
Ms. Franz: While Dr. Katsilambros gets ready to show the slide, I would like tomake a comment on satiety studies. Although subjects may report feeling more satis-fied after consuming different meals, this doesn’t always translate into eating fewercalories. For example, Stubbs et al. [1] in a 1-day study reported that although subjec-tive hunger was less after a high protein breakfast compared to a high fat or high car-bohydrate breakfast, lunch time intake 5 h later and energy intake for the rest of theday were similar after all three breakfasts. Currently the majority of research on sati-ety is very short-term and the effect of satiety on future calorie intake is rarely stud-ied. While we wait for the slide does anyone else have a comment or questions?
Dr. Slama: I would like to make three brief comments and ask you one question.To be fair you should quote Razels and Crapo and for European people Otto andSpater who published these results in 1973. They were first published in German andthen in French, but they can still be found in Medline. The second thing is you saidsomething which seems wrong to me: you say that adding milk to a portion of cerealswill decrease the blood glucose. If you add a portion of skin milk to 50 g cereal, this willincrease but not decrease blood glucose, unless you are using caribou milk which isvery rich in lipids.
Ms. Franz: Thank you for your comment. What I meant to say is that if you com-bine a high GI cereal with milk, a low GI food, you lower the GI of the meal. The highGI of the cereal or the low GI of milk is not maintained and instead you have a moder-ate GI response.
Dr. Slama: My third remark is that we proponents of the low GI do not claim thatthe GI concept should be substituted by another concept, but it should be added toanother concept. So my question is: how as a clinician can you make this claim if youhave not tried it yourself?
Ms. Franz: I have used the concept of differing glycemic responses from foodswith many patients. For example, when examining food and glucose records you oftenfind glucose responses that do not seem to make sense by just looking at the totalamount of carbohydrate eaten. A possible explanation may be that different carbohy-drate foods do have differing glucose responses even when the total amount of carbo-hydrate is the same. If persons with diabetes observe that some foods consistentlycause their post-meal glucose response to be higher than other foods, even whenkeeping the carbohydrate amount consistent, the next time they eat that food theycan try eating less of it or, if on insulin, increase their insulin dose. So I agree with theconcept that foods with equal amounts of carbohydrate may have differing post-mealglucose responses which can be helpful to patients. They can use their food and glu-cose test records to make food choices that can beneficially lower their post-meal glu-cose responses.
Dr. Slama: You don’t need to explain your concept to the patient. You only have tosay eat that rather than that when you have the occasion or the choice. You don’t haveto explain the area under the curve and the ratio and to multiply by the age. You onlyhave to give some very simple advice.
Ms. Franz: As a clinician, I am reluctant to suggest to patients that they shouldnot eat potatoes because they have a high GI when I am not confident this is true. Forexample, while potatoes from Australia appear to have a high GI of 87–101, potatoes
The Argument against Glycemic Index
69
tested in the US and Canada had a moderate GI of 56–77 [2]. Therefore, my problemwith the GI is with the variability and reliability of the published GI values.
Dr. Slama: Try it yourself and you will be convinced.Dr. Katsilambros: This is a slide published in 2002 and these are rats studied over
32 weeks, not for 1 week. You see an enormous difference in weight, about 75 g at theend of 30 weeks. The upper line is high GI, the lower line is low GI. 75 g in a rat issomething like 20 kg in a man. Still I absolutely agree and I expect that in humans thisis not the case. But again in humans we are not absolutely sure how strictly the dietcan be kept unless it is made in the laboratory and under close supervision. Finally Iabsolutely agree with you and Dr. Slama that this is an additive dietary treatment, it isnot an alternative.
Dr. Mooradian: What was the strain of rats used in the study?Dr. Katsilambros: I don’t remember.Dr. Mooradian: Because the strain makes a difference in terms of growth. One has to
interpret these data as favorable in terms of weight reduction versus stunting of growth.Ms. Franz: Were the diets comparable in digestible or available carbohydrate and
calories?Dr. Mooradian: I guess to be able to interpret that slide you need to know
whether the rats were pair-fed and had exactly the same amount of calorie intake.Dr. Katsilambros: Yes, I show isoenergetic.Dr. Eshki: When looking at nutrition tools for diabetes, such as the carbohydrate
count, GI and other nutrition tools, I believe all these methods are very effective.When providing consultation to patients, their diet must be customized. For instance,when an individual visits a tailor to have a suit made, the tailor is going to take themeasurements and all other factors before customizing the suit. With my patients, Ilook at several factors, such as culture, lifestyle conditions, the patient’s onset, peakand duration of medication and the dietary history, and based on that I customize theproper diet. I see all nutrition tools as useful and don’t deny the effectiveness of oneover the other. My question is, do you think the GI can be helpful in some way?
Ms. Franz: Yes, as I mentioned previously the GI can be a helpful tool for patientswho keep food and blood glucose records. However, as a clinician my first priority is toprovide a framework that patients can use to plan food choices and meals and that isbased on what the individual with diabetes feels is feasible and realistic for them toimplement. In managing diabetes, how much a person eats is more important thanwhat he/she eats. Just because a food has a low GI does not mean people with diabetescan eat unlimited portions of that food without affecting their blood glucose levels.Portions do count! I have found it helpful if patients understand what foods containcarbohydrate; what are average carbohydrate portion sizes, and how many carbohy-drate servings to eat for meals or snacks, if desired. To plan food choices and mealspeople with diabetes can use carbohydrate counting, exchange lists, or experience.People with diabetes use their own experience to determine what works for them andwhat doesn’t, and the GI concept may help explain some of their experiences. If targetblood glucose goals are not being met, decisions need to be made to determine ifchanges in food intake or in medical therapy (i.e. medications) are needed.
Dr. Hill: It is very interesting to have these two talks back to back. While we canchange people’s diets in the short-term, it is difficult to do this over the long-term. Thequestion in my mind is whether the GI is a useful tool for long-term improvement ofdiets. Are people following the GI diet eating healthily? Do people know what to dowith the message given by the GI? Are people able to stick with this concept morethan other concepts? The best example is the recent Atkins diet craze which in theshort-term is great at producing weight loss but in the long-term it doesn’t seem to beable to do this.
Franz
70

Ms. Franz: There is little, if any, evidence that people with diabetes can in thelong-term change the GI of their usual diet. In a 1-year study, children in the low GIgroup did have significantly better HbA1c levels than the group using a carbohydrateexchange diet [3]. However, the study reported no differences in mean GI between the2 groups at study end and even the authors stated it was difficult to attribute thedifference in HbA1c to diet when there was no apparent difference in the mean GI.The majority of studies comparing low and high GI diets have been short-term.Furthermore, it is likely that most people already eat a moderate GI diet and it is notknown if this can be changed long-term to a low GI diet.
Dr. Hill: Some people have suggested putting the GI on food labels. As an educa-tor, how do you think the population would handle that?
Ms. Franz: You would have to ask somebody from a country where GI values areincluded on a food label as to the usefulness of this information. As an educator, I findthe most useful information on the food label to be the serving size expressed in por-tions that patients can understand and the total grams of carbohydrate in that servingsize. Total calories and grams of fat, saturated fat and protein in the serving size arealso useful information.
Dr. Slama: I would like to make some comments on what has been said. First of allwe do not promote chocolate, ice cream, pizza, because they have a low GI. We do notleave people with a list of low GI food, but with a list of low GI healthy food. If time isshort one must do what one can, but for me nutritional education is a long runningprocess. I do not tell my patient’s right away that now they have to learn what the GIis. I come with it later on when I want to tune the results. So really it is a process whichwe have to take with precaution and time.
Ms. Franz: I would agree with you. Most patients need support long-term to makeand maintain lifestyle changes and part of that support over time may be fine tuningsome of their food choices using the GI concept. My concern is when low GI foods arepromoted to the public as being healthy food choices, and low GI food become ‘good’foods and high GI foods become ‘bad’ foods.
Dr. Slama: I agree that you have to take care of the amount of carbohydrate. Butalready diagnosed diabetic people are eating less carbohydrate than they should, andnot too much.
Ms. Franz: That is an interesting comment about how much carbohydrate peoplewith diabetes should be and are eating. In this regard, I find the report from the UnitedKingdom Prospective Diabetes Study on estimated dietary intakes of interest. Theintent of the nutrition intervention was to encourage patients to eat 50–55% of theirenergy intake as carbohydrate, protein 10–15%, and fat 30–35%. Despite the intensiveintervention, patients reported a similar proportion of their energy intake as carbohy-drate (43%) as the general population, protein intake 21%, and fat 37% [4]. Malesreported an estimated energy intake of �1,800 kcal/day and females �1,450 kcal/day.This suggests that people with diabetes eat a moderate carbohydrate diet and do noteat either a high or a low carbohydrate diet.
Dr. Gerasimidi-Vazeou: Regarding type-1 diabetic patients, taking only carbo-hydrate measurement and GI into consideration and omitting fat consumption is notsufficient to improve glycemic control. This is also true judging from the experienceat our center. We live in a real world and our patients do not always follow oursuggestions. Perhaps we should also take fat consumption into considerationbecause we know that in Western countries the latter is over 30% of the daily calorieintake.
Ms. Franz: I certainly agree with you. Patients with both type-1 and type-2 dia-betes need also to pay attention to total caloric intake as well as the total meat and fatservings they eat. You can’t just focus on carbohydrates.
The Argument against Glycemic Index
71

References
1 Stubbs RJ, van Wyk MC, Johnstone AM, Harbron CG: Breakfasts high in protein, fat or carbo-hydrate: effect on within-day appetite and energy balance. Eur J Clin Nutr 1996;50:409–417.
2 Fernandes G, Velangi A, Wolever TM: Glycemic index of potatoes commonly consumed inNorth America. J Am Diet Assoc 2005;105:557–562.
3 Gilbertson HR, Brand-Miller JC, Thorburn AW, et al: The effect of flexible low glycemic indexdietary advice versus measured carbohydrate exchange diets on glycemic control in childrenwith type 1 diabetes. Diabetes Care 2001;24:1137–1143.
4 Eeley EA, Stratton IM, Hadden DR, et al: UKPDS 18: estimated dietary intake in type 2 dia-betic patients randomly allocated to diet, sulphonylurea or insulin therapy. UK ProspectiveDiabetes Study Group. Diabet Med 1996;13:656–662.
Franz
72

Low Glycemic Index Foods Should Playa Role in Improving Overall GlycemicControl in Type-1 and Type-2 DiabeticPatients and, More Specifically, inCorrecting Excessive PostprandialHyperglycemia
Gérard Slama, Fabienne Elgrably, Morvarid Kabir,
Salwa Rizkalla
Department of Diabetes, Hôtel Dieu Hospital, University René Descartes, Paris V andAssistance Publique, Hôpitaux de Paris, Paris, France
AbstractThere is a large bulk of evidence that using low glycemic index (GI) foods has a
very significant impact on the amelioration of metabolic disturbances observed indiabetic and/or hyperlipidemic patients and in subjects affected by the metabolicsyndrome. Studies bringing convincing evidence against this concept are very rareif any. Improvement is observed not only in postprandial blood glucose and insulinvariations but also in circulating plasma lipid levels and the morphology and functionof adipocytes. Using the concept of low GI foods in diet counseling of diabetic patientsis not exclusive of other measures to improve postprandial and overall blood glucosecontrol. On the contrary, the use of low GI foods should be considered as one of othermeans and tools available to improve diabetes control (such as other dietary modifica-tions, use of specific and nonspecific drug therapy altering postprandial blood glu-cose). Among these therapies, the most promising ones are �-glucosidase inhibitors,glynides, rapid insulin analogues and in the near future the GLP1 analogue. Again, allthese classes of drugs could be associated with one another in order to obtain a post-prandial delta excursion target of not below 20 and not above 40–50 mg/dl bloodglucose.
Copyright © 2006 Nestec Ltd., Vevey/S. Karger AG, Basel
Bantle JP, Slama G (eds): Nutritional Management of Diabetes Mellitus and Dysmetabolic Syndrome.Nestlé Nutr Workshop Ser Clin Perform Program, vol 11, pp 73–81,Nestec Ltd., Vevey/S. Karger AG, Basel, © 2006.
73

Introduction
Increasing postprandial plasma glucose and insulin excursions areassumed to increase the severity of diabetes and to be independent predic-tors of the risk of atherosclerotic diseases and adiposity. Many possible con-nections have been found between postprandial events and the developmentof diabetes complications [1]. Lowering postprandial plasma glucose andinsulin responses are relevant in preventing and managing diabetes mellitus[2, 3]. Therefore, interventions to reduce postprandial plasma glucose andinsulin spikes are one of the essential goals in the therapeutic strategy indiabetic patients and could reduce the risk of developing cardiovascularcomplications.
There is growing recognition that the postprandial glycemic [4, 5] and insu-linemic [6] responses to different foods may vary despite equal amounts oftotal absorbable carbohydrates. This concept is in favor of using low glycemicindex (GI) carbohydrates.
The notion of GI was proposed more than 20 years ago by Jenkins et al. [5]as a practical way to classify carbohydrate-containing foods according totheir effect on postprandial blood glucose rather than according to the merecarbohydrate content. The GI is defined as the incremental area under theblood glucose response curve of a 50-gram carbohydrate portion of a testfood expressed as a percent of the response to the same amount of carbohy-drate from a standard food (glucose or white bread) taken by the samesubject [7].
In practice the actual carbohydrate load from a normal portion varies con-siderably. It is well known now that both type and amount of carbohydrateinfluence the glycemic response [8, 9]. In order to address this problem, theconcept of glycemic load was introduced. Glycemic load, calculated as theamount of carbohydrate in one serving multiplied by the GI of the food, allowscomparisons of the likely glycemic effects of realistic portions of differentfoods [10].
All the centers worldwide, where the experimental and clinical use of lowGI foods has been tested, enthusiastically use diet counseling of diabetic orhyperlipidemic patients and even normal subjects at risk of cardiovasculardiseases. A large number of studies has in fact demonstrated the efficiencyof diet counseling as regards the use of low GI foods in these patients. Morestriking effects were noted in the improvement of postprandial bloodglucose excursions and, consequently, in glycated hemoglobin, in fastingplasma lipids, particularly triglyceride levels and, marginally, total and LDLcholesterol. We will give below some insights into a few of our clinical andexperimental studies on this topic. At this stage, we would like to point outthat the use of low GI foods is only part of a more general strategy toimprove postprandial blood glucose hyperglycemia and thus overall bloodglucose control.
Slama/Elgrably/Kabir/Rizkalla
74

Impact of Using Low GI Foods on the Metabolic Disturbances
Observed in Certain Categories of Patients
Many papers have been published on the use of low GI foods in type-2 dia-betic patients and a smaller number in type-1 subjects. Recently, Brandt-Milleret al. [11] looked at 14 studies altogether in a meta-analysis, comprising a totalof 356 subjects (203 with type-1 diabetes and 153 with type-2 diabetes). Theydemonstrated that low GI diets reduced HbA1c by 0.43% points over andabove that produced by high GI diets. Our findings are perfectly corroboratedby these observations.
Low GI diets were also found to have beneficial effects on plasma lipids. Intwo well-controlled studies in type-2 diabetic subjects [12, 13], there was areduction of LDL cholesterol and an improvement of the capacity for fibrinol-ysis (PAI-1) with a low GI diet compared with a high GI diet. Plasma free fattyacids were also found to be lowered by low GI diet [13]. These metabolic effectswould be predicted to promote insulin sensitivity and to reduce the risk ofCVD.
Very significant results have also been observed using low GI foods inhyperlipidemic subjects. Some papers are now published studying the use oflow GI diets in subjects affected by the metabolic syndrome with very encour-aging results.
It should be firmly stressed that none of the clinicians convinced by thepractical utility of the above concept are claiming that it is the only way toimprove metabolic control. Rather, most of us consider the use of low GIfoods as only part of a more general strategy to correct abnormal postprandialhyperglycemia where all the means should be considered as not excludingeach other.
Means and Tools to Improve Excessive
Postprandial Blood Glucose Excursions
The means and tools to improve excessive postprandial blood glucoseexcursions belong to one of three categories: dietary manipulations, nonspe-cific and specific drug interventions.
Dietary Manipulations
The dietary manipulations to improve postprandial blood glucose levelsinclude: (1) global limitations of carbohydrate intake but not below 45% of thedaily caloric needs, (2) dividing the carbohydrate-rich foods into differentsnacks and meals, and (3) limitation of the carbohydrate intake in meals knownto be particularly hyperglycemic, like breakfasts, with a shift towards othermeals known to be less hyperglycemic, very often lunches and afternoon
Low Glycemic Index Foods in Diabetic Patients
75

snacks. In the same line, foods rich in dietary fibers and/or with low GI shouldbe considered.
Drugs Not Specifically Affecting Postprandial
Blood Glucose Excursions
In this category, we find metformin, thiazolidinediones, short- or long-actingsulfonylureas and long-acting insulin. These drugs mainly affect the fasting andinterprandial blood glucose levels with a minimal or no effect on the relativeelevation of postprandial blood glucose levels compared to the preprandialblood glucose levels; in other words, the above drugs modify the set point of thedaily blood glucose curve without significantly affecting the postprandial incre-mental levels.
Drugs Specifically Affecting Postprandial Blood
Glucose Excursions
The three main therapies used to improve specifically postprandial bloodglucose excursions are �-glucosidase inhibitors, glinides and bolus prepran-dial administration of rapid insulin. • �-glucosidase inhibitors (Glucor®) are very effective drugs. They are
wrongly regarded as drugs difficult to use due to undesirable gastrointesti-nal side effects. A strategy of a very progressive introduction of low dosetablets with a slowly progressive increase over weeks most of the time per-mits a very good tolerance profile. We recommend to start with as low as25 mg once a day for 2 or 3 weeks with an increase step by step, meal bymeal, and to stop the increase for one given meal if unbearable flatulenceoccurs or if the target postprandial delta (blood glucose) excursion isattained, i.e. between 30 and 50 mg/dl. This strategy often leads to some-thing like 100 mg Glucor being prescribed before breakfast, 25 mg beforelunch and 50 mg before dinner.
• Glinides (Novonorm®, Starlix®) are also often considered as weak oralhyoglycemic agents but seem to us compounds which are very easy tohandle and which are perfect as a second-line treatment in addition to �-glucosidase inhibitors or as first-line therapy.
• Bolus preprandial administration of rapid insulin: The most frequent useof preprandial bolus insulin is, nowadays, given using rapid insulin ana-logues (Humalog®, NovoRapid®, Apidra®). These kinds of insulin areadministered either with a syringe, a pen or a pump. Less common ways ofadministering preprandial insulin bolus are the intranasal or the pul-monary routes of administration. These methods have yet to be fullyinvestigated to become widely used.
Other drugs are very promising in specifically modifying postprandialblood glucose levels, particularly GLP-1 and amyline analogues.
Slama/Elgrably/Kabir/Rizkalla
76

Personal Clinical and Experimental Data Using
the Concept of Low GI Foods
Clinical Data
Utilization of Low GI Foods in Type-1 and/or Type-2 Diabetic PatientsAt least three of our studies have addressed this topic:
• The first one published in 1988 by Fontvieille et al. [14] was done on a smallgroup of type-1 diabetic patients. This study demonstrated that 3 weeks ofa low GI food-enriched diet compared to a high GI diet, in a crossoverdesign, induced a significant improvement in plasma fructoseamine levelsin spite of a small but significant decrease in daily insulin needs.
• Another study by the same authors [15] was conducted with the samecrossover methodology in a mixed type-1 and type-2 population of dia-betic subjects over a period of 5 weeks. This study showed a reduction of11% in fasting glycemia, 13% in fructoseamine and 20% in triglycerides.
• Our most recent study by Rizkalla et al. [13] was conducted in a group of11 type-2 diabetic subjects and demonstrated that a 4-week low GI dietresulted in: (1) an improvement of plasma glucose control, (2) a decreaseof whole body glucose utilization (measured by the euglycemic hyperinsu-linemic clamp), (3) a decrease of some lipid profiles and (4) a reduction inthe capacity for fibrinolysis.
In slightly overweight subjects, however, we demonstrated that 5 weeks oflow GI foods were able to decrease total fat mass and to improve the plasmalipid profile rather than to improve plasma glucose control [16].
Experimental Data
Our first experimental work in this field consisted of designing a method totest the concept in animals (i.e. in rats: to validate the GI concept in acuteconditions). We, thus, conditioned the rats to consume any presented mealwithin the next 5 min if they wanted to eat after an overnight fast. Differentfoods were then tested, i.e. glucose powder, different foods rich in amyloseor resistant starch (like mung beans), and different types of corn starch rich inamylopectin (like waxy corn starch). We demonstrated that the classificationof starchy foods utilized in human nutrition was also done experimentally [17].
Consequently, we aimed to evaluate the chronic consequences of consum-ing low and high GI foods in rats. We used diabetic (STZ-n2: low streptozotocindose injected on the 2nd day after birth) and nondiabetic male Sprague-Dawley rats. They were fed either a low or a high GI diet for 3 and 12 weeks. Atthe end of the nutritional periods, the activity and gene expression of differentproteins, in different tissues, implicated in glucose and lipid metabolism wereevaluated. Four of our studies all produced the same type of results: eachstudy gave a more mechanistic explanation than the preceding one.
Low Glycemic Index Foods in Diabetic Patients
77

• Glucose metabolism was improved in diabetic and nondiabetic rats; thepostprandial insulin profiles were lower with low GI foods.
• Circulating lipid levels: The most reproducible result observed with low GIwas a significant reduction of plasma cholesterol and triglyceride levels.
• Size of adipocytes, metabolism and gene expression: Again, the mostreproducible result observed in all types of experimental animals was areduction in the diameter of the adipocytes in rats fed a low GI diet com-pared to those fed a high GI diet. These adipocytes during the low GIperiod were more metabolically active with an ex vivo increase in insulin-stimulated 14C-glucose transport and oxidation but a decrease in lipogenesis[18]. A decrease in the activity and gene expression of lipogenic enzymeswas also found [19]. Leptin levels as well as its gene expression in epididy-mal adipose tissue were found to be decreased just before the increase inadiposity in the high GI fed rats [20].
Conclusion
(1) There is a large bulk of evidence that using low GI foods has a greatlysignificant impact on the amelioration of the metabolic disturbancesobserved in diabetic and/or hyperlipidemic patients and in subjectsaffected by the metabolic syndrome. Studies showing convincing evi-dence against this concept are very rare if any.
(2) Improvement is observed not only of postprandial blood glucose andinsulin variations but also of circulating plasma lipid levels and of themorphology and function of adipocytes.
(3) Using the concept of low GI foods in the diet counseling of diabeticpatients does not exclude other measures to improve postprandial andoverall blood glucose control. On the contrary, the use of low GI foodsshould be considered as one among other means and tools available toimprove diabetes control (such as other dietary modifications, and useof specific and nonspecific drug therapies altering postprandial bloodglucose). Among these therapies, the most promising ones are �-glucosidase inhibitors, glinides, rapid insulin analogues and in the nearfuture GLP-1 analogues. Again, all these classes of drugs could be asso-ciated with one another in order to obtain a postprandial delta excur-sion target not below 20 and not above 40–50 mg/dl blood glucose.
References
1 Ceriello A: The possible role of postprandial hyperglycaemia in the pathogenesis of diabeticcomplications. Diabetologia 2003;46(suppl 1):M9–M16.
2 Liu S, Willet W, Stampfer M, et al: Prospective study of dietary glycemic load, carbohydrateintake, and risk of coronary heart disease in US women. Am J Clin Nutr 2000;71:1455–1461.
Slama/Elgrably/Kabir/Rizkalla
78

3 Bonora E, Muggeo M: Postprandial blood glucose as a risk factor for cardiovascular disease intype II diabetes: the epidemiological evidence. Diabetologia 2001;44:2107–2114.
4 Crapo A, Insel J, Sperling M, Kolterman G: Comparison of serum glucose, insulin andglucagon responses to different types of complex carbohydrate in noninsulin-dependent dia-betic patients. Am J Clin Nutr 1981;34:184–190.
5 Jenkins D, Wolever T, Taylor H, et al: Glycemic index of foods: a physiological basis for carbo-hydrate exchange. Am J Clin Nutr 1981;34:362–366.
6 Bornet FRJ, Costagliola D, Rizkalla SW, et al: Insulinemic and glycemic indexes of six starch-richfoods taken alone and in a mixed meal by type 2 diabetes. Am J Clin Nutr 1987;45:588–595.
7 FAO/WHO: Carbohydrates in human nutrition. Report of a joint FAO/World HealthOrganization Expert Consultation. FAO Food and Nutrition, 1998, paper 66.
8 Wolever T, Mehling C: Long-term effect of varying the source or amount of dietary carbohy-drate on postprandial plasma glucose, insulin, triacylglycerol, and free fatty acid concentra-tions in subjects with impaired glucose tolerance. Am J Clin Nutr 2003;77:612–621.
9 Barclay A, Brand-Miller J, Wolever T: Glycemic index, glycemic load, and glycemic responseare not the same. Diabetes 2005;28:1839–1840.
10 Schulze M, Liu S, Rimm E, et al: Glycemic index, glycemic load, and dietary fiber intake and inci-dence of type 2 diabetes in younger and middle-aged women. Am J Clin Nutr 2004;80:348–356.
11 Brand-Miller J, Hayne S, Petocz P, Colagiuri S: Low-glycemic index diets in the management ofdiabetes: a meta-analysis of randomized controlled trials. Diabetes Care 2003;26:2261–2267.
12 Jarvi A, Karlstrom B, Granfeldt Y, et al: Improved glycemic control and lipid profile and nor-malized fibrinolytic activity on a low-glycemic index diet in type 2 diabetic patients. DiabetesCare 1999;22:10–18.
13 Rizkalla S, Taghrid L, Laromiguiere M, et al: Improved plasma glucose control, whole-bodyglucose utilization, and lipid profile on a low-glycemic index diet in type 2 diabetic men: a ran-domized controlled trial. Diabetes Care 2004;27:1866–1872.
14 Fontvieille A, Acosta M, Rizkalla S, et al: A moderate switch from high to low glycemic indexfoods for 3 weeks improves the metabolic control of type 1 (IDDM) diabetic subjects.Diabetes Nutr Metab 1988;1:139–143.
15 Fontvieille A, Rizkalla S, Penfornis A, et al: The use of low glycemic index foods improvesmetabolic control of diabetic patients over five weeks. Diabet Med 1992;9:1–7.
16 Bouché C, Rizkalla S, Luo J, et al: Five week, low-glycemic index diet decreases total fat massand improves plasma lipid profile in moderately overweight nondiabetic subjects. DiabetesCare 2002;25:822–828.
17 Lerer-Metzger M, Rizkalla S, Luo J, et al: Effect of long-term low-glycemic index starchy foodon plasma glucose and lipid concentrations and adipose tissue cellularity in normal and dia-betic rats. Br J Nutr 1996;75:723–732.
18 Kabir M, Rizkalla S, Champ M, et al: Dietary amylose-amylopectin starch content affectsglucose and lipid metabolism in adipocytes of normal and diabetic rats. J Nutr 1998;128:35–43.
19 Kabir M, Rizkalla S, Quignard-Boulangé A, et al: A high glycemic index starch diet affects lipidstorage-related enzymes in normal and to a lesser extent in diabetic rats. J Nutr 1998;128:1878–1883.
20 Kabir M, Guerre-Millo M, Laromigiere M, et al: Negative regulation of leptin by chronic highglycemic index starch diet. Metabolism 2000;49:764–769.
Discussion
Dr. Katsilambros: Congratulations, I think that especially the study on adipocytesis very important. I would like to ask you if the low or high index diets in the rat wereisoenergetic or were the rats fed ad libitum.
Dr. Slama: They were fed ad libitum.Dr. Katsilambros: That is the difference then.Dr. Slama: Yes, and the amount of carbohydrate was higher, 70% than the regular
diet in the normal rats.
Low Glycemic Index Foods in Diabetic Patients
79

Dr. Katsilambros: It can be hypothesized that those rats on a low carbohydratediet finally ate more calories than those on a high carbohydrate diet. In this sense thismight explain the difference in your findings and the findings which I presented in theprevious talk. This is 100% confirmed, it was in the past, it is in the present, and it willbe in the future.
Dr. Schiffrin: Regarding the changes that you described in adipose tissue, wasthere more or less macrophage infiltration following the diet?
Dr. Slama: The macrophage story in adipose tissue is very recent, at least to myknowledge. When we did the study we didn’t look at that. Perhaps in the future we willdissect, but for adipose tissue volume, adipose activity, tissue activity, it is certain, theadipocytes; but the macrophage I don’t know.
Dr. Chiasson: I was just wondering are you interpreting the decrease in the size ofthe adipocyte due to a decrease in the insulin level?
Dr. Slama: No, because it has also been observed in insulinopenic rats at least, butI don’t know why it is so. Perhaps the disposition of the free fatty acids plays a majorrole. The free fatty levels are really much less after the low glycemic index diet. I thinkthat you know better than I the role which is supposed to be played by free fatty acids.We, as doctors and also as physiologists, have been used to studying life at a steadystate, at a basal level, but probably the most important aspect of nutrition is postpran-dial. It seems obvious that nutrition does things also postprandially, and the hypothe-sis of Ceriello [1] and others on oxidative stress and many other aspects should alsoplay a role. I don’t know exactly what the major determinant of the phenomenon is,but in one study on animals it has been observed every time, and this is probably themost striking effect of a low glycemic index, the effect on adipocytes.
Dr. Chiasson: In the postprandial profile between carbohydrate alone or within amixed meal, you showed that the mixed meal had a lower rise in postprandial plasmaglucose. Do you think that this is due only to the difference in the insulin profile?
Dr. Slama: It could be due to dilution of the calories; it could be due more cer-tainly to increased fat intake, and perhaps also to protein intake and insulin secretion.So it is probably a mixed phenomenon which I can’t fully explain, but the fact is hereand it is well documented in the literature.
Dr. Chiasson: What is well documented? Are you saying that it modifies theabsorption?
Dr. Slama: It is well demonstrated that when you eat a mixed meal, you obtain alower glucose increase for the same amount of carbohydrate.
Dr. Chiasson: Yes, but usually that is mainly due to the disposition of glucoserather than to the absorption.
Dr. Slama: No idea; I have not seen that. If you say so I will look at the results, butI have not measured that. It is said that fat decreases stomach emptying and it plays arole, but perhaps it is also absorbed in the gut.
Dr. Chiasson: We have looked at absorption, labeling the carbohydrate, andwhether it was given alone or within a mixed meal. We had exactly the same absorp-tion profile, suggesting that the differences would be more in the disposition of theglucose absorbed and the insulin response. If you have fat in your meal then you wouldexpect that you are creating insulin resistance and it will go higher up and so thatcould explain the lower profile within the mixed meal.
Dr. Halimi: I have a comment regarding the possible limits of the glycemic indexwhich is based on the measure of peripheral glycemia and insulinemia, i.e. post-hepatic glycemia and post-hepatic insulinemia. However, we know that the liver playsa major role in normal people, which is quite different in the metabolic syndrome, insteatosis and in type-2 diabetes. Yet the glycemic index cannot take into account therespective roles of the different tissues (gut, liver, peripheral) involved in this com-plex process.
Slama/Elgrably/Kabir/Rizkalla
80

Dr. Slama: There are two things. First, in the first part of this morning’s sessionthe question was raised on peak value, raising time and negative part, etc. I think thatthe postprandial blood glucose excursion should be seen as a disturbance in a veryfinely tuned system, and the postprandial excursion is perhaps an overflow of thecapability of the body to really maintain blood glucose around 1 g. It is an overflow. Sothe less brutal the disturbance is, the easier it will be for the body to maintain. To sus-tain what I am saying I refer to work we have done and published in a confidentialreview of nutrition in small laboratory pigs with Lang et al. [2, 3]. I don’t remember allthe details but these pigs had a catheter in the carotid artery and another in the portalvein. These pigs were put on glucose clamp and they had a tube in the stomach toreally know what we were addressing. With the low glycemic index, the blood glucoseexcursion was lower and all the glucose was absorbed, as seen by the glucose clampbut not by blood glucose excursion. It is also the same on the insulin level in the portalvein but not in the peripheral vein.
Dr. Jianquin Sun: I have a question regarding some of the inconsistent resultsfrom different clinical trials in terms of glycemic control or lipid profile. Could youexplain what is the reason for that result?
Dr. Slama: I think that we can also discuss paper by paper but I have not read allthe papers so I cannot really answer your question. As I already said there are lowglycemic index foods and low glycemic index foods. For example, as we already said,pizza and chocolate bars have very low glycemic index but in my opinion they are notto be recommended as daily foods. So if in one study they use such foods and in othersthey do not, of course the results will be totally different. So we have to look very care-fully at every methodological aspect: the way the glycemic index of foods was calcu-lated, the way the food was administered, and so on. So I cannot give a general answerto your important question. Because of course these critics are addressed to theglycemic index, not reproducibility, variability. For me this is not really convincing.Why should the glycemic food, starchy food, give exactly the same value? But dayafter day it makes a difference, and in all the studies I have seen and done myself, Ihave never seen a discrepancy.
References
1 Ceriello A: Postprandial hyperglycemia and diabetes complications: is it time to treat?Diabetes 2005;54:1–7.
2 Lang V, Vaugelade P, Bernard F, et al: Euglycemic hyperinsulinemic clamp to assess posthep-atic glucose appearance after carbohydrate loading. 1. Validation in pigs. Am J Clin Nutr1999;69:1174–1182.
3 Lang V, Bornet FR, Vaugelade P, et al: Euglycemic hyperinsulinemic clamp to assess posthep-atic glucose appearance after carbohydrate loading. 2. Evaluation of corn and mung beanstarches in healthy men. Am J Clin Nutr 1999;69:1183–1188.
Low Glycemic Index Foods in Diabetic Patients
81


Is Fructose the Optimal Low GlycemicIndex Sweetener?
John P. Bantle
Division of Endocrinology and Diabetes, Department of Medicine, University of Minnesota, MN, USA
AbstractFructose is a monosaccharide which is abundant in nature. It is the sweetest nat-
urally occurring carbohydrate. The availability of fructose increased substantiallywhen it became possible in the 1960s to economically produce high fructose syrupsfrom corn starch and other starches. Such high fructose syrups are now used tosweeten soft drinks, fruit drinks, baked goods, jams, syrups and candies. The mostrecent data available suggest that fructose consumption is increasing worldwide.Fructose presently accounts for about 10% of average total energy intake in theUnited States. Studies in both healthy and diabetic subjects demonstrated that fruc-tose produced a smaller postprandial rise in plasma glucose and serum insulin thanother common carbohydrates. Substitution of dietary fructose for other carbohy-drates produced a 13% reduction in mean plasma glucose in a study of type-1 andtype-2 diabetic subjects. However, there is concern that fructose may aggravatelipemia, particularly in men. In one study, daylong plasma triglycerides (estimated bydetermining the area under response curves) in healthy men was 32% greater duringa high fructose diet than during a high glucose diet. There is also concern that fruc-tose may be a factor contributing to the growing worldwide prevalence of obesity.Increasing fructose consumption is temporally associated with the increase in obesity.Moreover, on theoretical grounds, dietary fructose might increase energy intake.Fructose stimulates insulin secretion less than does glucose and glucose-containingcarbohydrates. Since insulin increases leptin release, lower circulating insulin andleptin after fructose ingestion might inhibit appetite less than consumption of othercarbohydrates and lead to increased energy intake. However, there is not yet any con-vincing experimental evidence that dietary fructose does increase energy intake.Although evidence that fructose has adverse effects is limited, adding fructose in largeamounts to the diet may be undesirable, particularly for men. Fructose that occursnaturally in fruits and vegetables is a modest component of energy intake and shouldnot be of concern.
Copyright © 2006 Nestec Ltd., Vevey/S. Karger AG, Basel
Bantle JP, Slama G (eds): Nutritional Management of Diabetes Mellitus and Dysmetabolic Syndrome.Nestlé Nutr Workshop Ser Clin Perform Program, vol 11, pp 83–95,Nestec Ltd., Vevey/S. Karger AG, Basel, © 2006.
83

Fructose is a six-carbon monosaccharide which is abundant in nature.Free fructose is present in honey, dates, figs, apples, grapes and most berries.An additional, important quantitative natural source of fructose is the disac-charide sucrose which is composed of equimolar quantities of fructose andglucose. When ingested by humans, fructose is absorbed by an active trans-port system but at a slower rate than is glucose [1]. Co-ingestion of glucoseincreases intestinal absorptive capacity for fructose. In the absence of glu-cose, human intestinal capacity to absorb fructose appears to be quite vari-able with some people unable to completely absorb 30- to 40-gram quantities[1]. Those individuals unable to completely absorb ingested fructose are atrisk for diarrhea and other gastrointestinal side effects.
The first several steps in fructose and glucose metabolism differ signifi-cantly. Fructose stimulates only modest insulin secretion and does notrequire the presence of insulin to enter cells [2]. Avidly taken up by hepaticcells, fructose is rapidly converted to fructose-1-phosphate and bypassesthe early rate-limiting steps of glucose metabolism. Fructose-1-phosphate ismainly converted to lactate, glucose and glycogen [3]. Gluconeogenesisfrom fructose is increased by starvation and poorly controlled diabetes.Fructose may also form acetyl CoA which is used in fatty acid synthesis.Enhanced activity of lipogenic enzymes with chronic fructose feeding maypromote hepatic triglyceride production and output of VLDL particles.Presumably, energy intake must be excessive for fructose to stimulatelipogenesis.
Fructose is the sweetest tasting naturally occurring carbohydrate (table1). Advances in technology in the 1960s made possible the production ofinexpensive high fructose syrups from corn starch [4]. Corn is an abundantworldwide source of starch. To make high fructose syrups, corn starch is firstseparated from other corn by-products by wet milling. Next the starch isdigested with mineral acid and amylase to form glucose. The enzyme glucoseisomerase is then used to convert glucose to fructose. A syrup containing42% fructose is the first product of this process. Through chromatographicenrichment, 55 and 90% high fructose syrups can then be produced. The55% high fructose syrup has taste and sweetness equivalent to sucrose.Because of sweetness and low cost, high fructose syrups found commercialapplication. In the mid 1980s, 55% high fructose syrup was adopted by thecarbonated-beverage industry and became the predominant sweetener insoft drinks.
The United States has from the beginning been the world’s largest pro-ducer of high fructose corn syrups but Japan, Canada, South Korea, China,Argentina, and other countries are also significant producers [5]. In Asia, tapi-oca starch and broken rice are used in production of high fructose syrups.High fructose syrups are widely used in soft drinks, fruit drinks, baked goods,jams, syrups and candies. In 1977–1978, average fructose intake was esti-mated to be 37 g per day, accounting for �8% of total energy intake in the
Bantle
84

United States [6]. In 1987–1988, fructose intake had increased to 39 g perday, accounting for �9% of energy intake [7] and in 1988–1994, it had furtherincreased to 55 g per day, accounting for �10% of energy intake [8].Approximately one third of fructose came from fruits, vegetables and othernatural sources and two thirds were added to beverages and foods in the diet.A similar trend toward substantial caloric sweetener and fructose consump-tion is occurring worldwide [9].
There has long been interest in the metabolic effects of fructose, particu-larly in people with diabetes. Studies in diabetic subjects done in the 1970sand 1980s demonstrated that fructose-containing test meals produced smallerpostprandial increases in plasma glucose than test meals containing isocaloricamounts of sucrose, glucose and starch [10–12]. Jenkins et al. [13] greatlyexpanded our knowledge about the differences in response to dietary carbo-hydrates with the development of the glycemic index of foods. Glycemicindex was defined as the increase in plasma glucose area from 0 to 120 minafter ingestion of 50 g of available carbohydrate from a test food compared to50 g of carbohydrate from a reference food such as glucose. The glycemicindices of carbohydrate-containing foods vary substantially, with fructosehaving a particularly low glycemic index (table 2).
In an effort to further evaluate the potential for fructose to lower post-prandial plasma glucose, we developed five test meals containing differentcarbohydrates and fed the meals to healthy and diabetic volunteers [14].The meals contained nearly identical amounts of carbohydrate, protein andfat but a different test carbohydrate which accounted for 24 or 25% of totalcalories. The test carbohydrates were glucose, fructose, sucrose, potatostarch and wheat starch. Plasma glucose and serum insulin were measuredbefore and at intervals for 240 min after the meals. In healthy volunteers,type-1 diabetic volunteers and type-2 diabetic volunteers, the fructosemeal produced the smallest postprandial increment in plasma glucose andthe smallest increment in postprandial glucose area (fig. 1). The fructosemeals also produced the smallest increment in serum insulin in healthyand type-2 diabetic volunteers but the differences among meals were notsignificant.
Fructose: Optimal Sweetener?
85
Table 1. Sweetness relative to sucrose [4]
Substance Relative sweetness
Fructose 117High fructose syrup – 90% 106Sucrose 100High fructose syrup – 55% 99High fructose syrup – 42% 92Glucose 67

Since fructose has an agreeable taste similar to that of sucrose and sincefructose produces a smaller postprandial rise in plasma glucose than othercommon carbohydrates, fructose seemed to be an excellent candidate for asweetening agent in the diabetic diet. To test this possibility, we studied 12type-1 and 12 type-2 diabetic subjects who were fed three isocaloric diets for8 days each using a randomized, crossover design [15]. The three diets provided,
Bantle
86
30,000
25,000
20,000
15,000
10,000
5,000
0F S P
Healthy
subjects
Type-1
diabetics
Type-2
diabetics
W G
Are
a incre
ments
in p
lasm
a g
luco
se (m
in·m
g/d
l)
F S P W GF S P W G
Fig. 1. Area increments in plasma glucose (mean � SEM) after test meals indicatedas follows: fructose (F), sucrose (S), potato (P), wheat (W) and glucose (G) [from 14].
Table 2. Glycemic indices of selected carbohydrate-containing foods[from 13]
Food Glycemic index Food Glycemic index
Instant potato 80 Banana 62White rice 72 Apple 39White bread 69 Orange juice 46Frozen peas 51 Glucose 100Sweet corn 59 Sucrose 59Carrots 92 Fructose 20Lentils 29 Skim milk 32Kidney beans 29 Ice cream 36
Reference food was 50 g glucose.

respectively, 21% of energy as fructose, 23% of energy as sucrose, and almostall carbohydrate energy as starch with less than 5% of energy derived fromfructose and sucrose. All meals were prepared in a metabolic kitchen andprovided to subjects. The fructose diet resulted in significantly lower 1- and2-hour postprandial plasma glucose levels, overall mean plasma glucose, andurinary glucose excretion than did the starch diet. The reductions in meanplasma glucose with the fructose diet were 24% in type-1 diabetic subjectsand 7% in type-2 diabetic subjects. Of note, the fructose diet increased post-prandial lactate. There were no differences between the sucrose and starchdiets in any of the measure of glycemic control in either subject group.
It next seemed important to extend the period of dietary intervention withfructose to see if beneficial effects on glycemia persisted and to look for poten-tial adverse effects. Accordingly, we compared isocaloric high fructose (20% ofenergy derived from fructose) and high starch diets (less than 3% of energyderived from fructose) in 6 type-1 and 12 type-2 diabetic subjects using acrossover design [16]. Both study diets were composed of common foods. Allmeals were prepared in a metabolic kitchen and provided to subjects for 28days. The diets were well received by all subjects. Mean plasma glucose, urineglucose and serum glycosylated albumin were all lower during the fructosediet than during the starch diet. On day 28 of the fructose diet, mean plasmaglucose was 13% lower than on day 28 of the starch diet. However, of concern,fasting serum LDL cholesterol on day 28 of the fructose diet was 11% higherthan the corresponding value for LDL cholesterol on day 28 of the starch diet.
Thus, a diet in which fructose was substituted for other carbohydrates waspleasant to eat and resulted in reduced glycemia in people with diabetes butappeared to have an adverse effect on serum LDL cholesterol. This raisedconcern about fructose as a sweetening agent in the diabetic diet. This find-ing also raised concern about the potential effects of dietary fructose in thegeneral population since, in the United States and many other countries, fruc-tose is a significant source of dietary energy [9]. Several studies did not findadverse effects of dietary fructose on serum lipids in healthy subjects [17–19].However, these studies either compared fructose to sucrose or were outpa-tient studies that did not provide meals to subjects. Since sucrose is com-posed of 50% fructose, it is not an optimal reference. Moreover, rigorouscontrol of nutrient intake requires the provision of meals. Thus, these studiesmay not be reliable in assessing the effects of dietary fructose on serum lipids.
Two studies which compared a high fructose diet to a diet nearly devoid offructose and established rigorous control of nutrient intake by providing all foodto subjects both reported adverse effects of fructose on serum lipids [20, 21].Hallfrisch et al. [20] reported that high fructose diets consumed for 5 weeksincreased fasting plasma LDL cholesterol in healthy and hyperinsulinemicmen and increased fasting plasma triglycerides in hyperinsulinemic men.Reiser et al. [21] found that a high fructose diet consumed for 5 weeksincreased fasting plasma LDL cholesterol in healthy men and fasting plasma
Fructose: Optimal Sweetener?
87

triglycerides in both healthy and hyperinsulinemic men. These two well-donestudies suggested that dietary fructose does adversely affect serum lipids, atleast in men. Women were not included in either study.
In an effort to gain additional insight into the effects of fructose on plasmalipids, we compared high and low fructose diets in 24 healthy volunteers (12men and 12 women; 6 of each gender age �40 years and 6 of each gender age�40 years) [22]. All subjects consumed two isocaloric diets for 6 weeks. Onediet provided 17% of energy as fructose. The other diet was sweetened withglucose and was nearly devoid of fructose. Diet order was assigned randomlyusing a balanced, crossover design. Both diets were composed of commonfoods and contained nearly identical amounts of carbohydrate, protein, fat,fiber, cholesterol and saturated, monounsaturated and polyunsaturated fattyacids. All meals were prepared in the metabolic kitchen of the University ofMinnesota General Clinical Research Center. The fructose diet resulted inhigher fasting total and LDL plasma cholesterol at day 28 but this effect didnot persist at day 42 (table 3). The plasma triglyceride responses to the dietsdiffered by gender. The fructose diet had no significant effect on fasting orpostprandial plasma triglycerides in women (table 3, fig. 2). However, in men,the fructose diet produced significantly higher fasting and postprandialplasma triglycerides. This effect persisted through day 42. On day 42 of thefructose diet, daylong plasma triglycerides (estimated by determining thearea under the response curves) in men was 32% greater than during the glu-cose diet. We concluded that diets high in added fructose may be undesirable,particularly for men. Glucose may be a suitable replacement sugar.
Another potential concern about fructose is its association with increasedenergy intake and obesity. Worldwide trends in per capita consumption ofcaloric sweeteners (of which high fructose syrups are a major component)demonstrated an increase from 232 kcal/day in the year 1962 to 306 kcal/dayin the year 2000 [9]. In the United States, caloric sweeteners accounted for16% of energy intake in the year 1996 [9]. About 43% of the caloric sweeten-ers came from soft drinks and fruit drinks.
Several authors have suggested that dietary fructose may play a role in theworldwide increase in obesity prevalence [23, 24]. Their reasons for implicatingfructose are principally two. The first is the association, mentioned above,between increasing consumption of fructose and increasing obesity. The secondis the theoretical possibility that dietary fructose increases energy intake. Clearlydietary fructose stimulates insulin secretion less than glucose and glucose-containing carbohydrates. Insulin stimulates leptin release from adipocytes [25]and circulating insulin and leptin concentrations were thus lower after ingestionof fructose-containing meals than after ingestion of glucose-containing meals inhealthy women [26]. However, energy intake by the women was not greater dur-ing the fructose-containing meals. Nevertheless, lower circulating insulin andleptin after fructose consumption might inhibit appetite less than consumptionof other carbohydrates and lead to an increase in food intake.
Bantle
88

Consistent with the idea that dietary fructose might increase energy intakeare data from Ludwig et al. [27] which demonstrated an association betweenconsumption of sugar-sweetened drinks and obesity in children. Further evi-dence is provided by Raben et al. [28] who fed overweight subjects supple-ments of either sucrose or artificial sweeteners for 10 weeks. The subjectswho consumed sucrose demonstrated increases in energy intake, body weight,fat mass and blood pressure. However, it is important to point out that sub-jects in the sucrose group were ‘instructed’ to consume 2 g sucrose/kg bodyweight daily (�23% of energy intake) and were provided with the necessarysucrose-sweetened beverages and foods to do so. Thus, the increased sucroseintake was not spontaneous. These two studies were the main evidence citedby the World Health Organization when implicating sugars as a cause of obe-sity and to justify their recommendation that free sugar consumption be lessthan 10% of total daily energy intake [29].
Fructose: Optimal Sweetener?
89
Table 3. Effects of the two study diets on mean fasting plasma lipids [22]
Day
14 28 42
Plasma cholesterol, mmol/lFructose diet 4.53 4.61 4.30Glucose diet 4.43 4.30 4.22pa 0.154 �0.001 0.169
Plasma LDL cholesterol, mmol/lFructose diet 2.67 2.69 2.49Glucose diet 2.59 2.49 2.49pa 0.256 �0.001 0.756
Plasma HDL cholesterol, mmol/lFructose diet 1.35 1.37 1.30Glucose diet 1.40 1.37 1.30pa 0.077 0.897 0.965
Plasma triglycerides, mmol/lWomen
Fructose diet 0.97 1.02 0.93Glucose diet 0.88 0.99 0.97pa 0.298 0.810 0.631
MenFructose diet 1.32 1.30 1.25Glucose diet 1.12 1.03 0.95pa 0.018 0.001 �0.001
The means for each endpoint have a common SE based on the appropriaterepeated-measures ANOVA error term; to convert cholesterol to mg/dl, multiply by38.6; to convert triglycerides to mg/dl, multiply by 88.5.
aBecause 6 paired comparisons of this endpoint were made (all data not shown),only p � 0.008 (0.05/6) should be considered significant at the 0.05 level.

Although increasing fructose consumption is temporally associated with theincreasing worldwide prevalence of obesity, there is little or no evidence provingcause and effect. In the US, increasing energy intake was associated withincreased restaurant and fast-food meals and increased consumption of saltysnacks and pizza as well as soft drinks [30]. Decreased physical activity is alsoalmost certainly a factor in the increasing prevalence of obesity. To demonstratethat dietary fructose is important in causing obesity, it would be necessary toconduct a clinical trial demonstrating that fructose caused a spontaneous increasein energy intake. Given fructose’s availability, low cost and pleasant taste, such aclinical trial might provide important new information.
In summary, fructose is a naturally occurring sugar with a pleasant taste. Itproduces a smaller postprandial rise in plasma glucose than other common car-bohydrates and thus may be a useful sweetening agent in the diabetic diet.However, dietary fructose appears to have adverse effects on plasma lipids.Moreover, there is concern that dietary fructose may stimulate energy intakeand promote weight gain and obesity. Thus, adding large amounts of fructose tothe diet may be undesirable. Nevertheless, concern about fructose should notextend to the naturally occurring fructose in fruits and vegetables. These arehealthy foods which provide only a modest amount of fructose in most diets.
References
1 Riby JE, Fujisawa T, Kretchmer N: Fructose absorption. Am J Clin Nutr 1993;58:748S–753S.2 Henry RR, Crapo PA: Current issues in fructose metabolism. Annu Rev Nutr 1991;11:21–39.
Bantle
90
2.5
2.0
1.5
1.0
0.5
a bClock time (h), day 42
7:30
Mean p
lasm
a t
riacylg
lycero
l (m
mo
l/l)
9:30
11:3
0
14:0
0
16:0
0
19:0
0
23:0
02:
005:
00
2.5
2.0
1.5
1.0
0.5
Clock time (h), day 42
7:30
Mean p
lasm
a t
riacylg
lycero
l (m
mo
l/l)
9:30
11:3
0
14:0
0
16:0
0
19:0
0
23:0
02:
005:
00
*
*
**
*
Fig. 2. Mean plasma triacylglycerol (triglyceride) concentrations in women (aa) andmen (bb) during the 24-hour metabolic profiles on day 42 of the fructose ( ) andglucose (------) diets. Significant difference (*) between the two points is shown,p � 0.006 (0.05/9, Bonferroni adjustment for multiple comparisons). To converttriglycerides to mg/dl, multiply by 88.5 [from 22].

3 Mayes PA: Intermediary metabolism of fructose. Am J Clin Nutr 1993;58:744S–765S.4 Hanover LM, White JS: Manufacturing, composition and applications of fructose. Am J Clin
Nutr 1993;58:724S–732S.5 Vuilleumier S: Worldwide production of high-fructose syrup and crystalline fructose. Am J
Clin Nutr 1993;58:733S–736S.6 Park YK, Yetley EA: Intake and food sources of fructose in the United States. Am J Clin Nutr
1993;58:737S–747S.7 Sigman-Grant M, Keast DR: Addendum to Am J Clin Nutr 1995;62(suppl):178S–194S. Am J
Clin Nutr 1997;65:1572–1574.8 Bialostosky K, et al: Dietary intake of macronutrients, micronutrients and other dietary con-
stituents: United States 1988–94. National Center for Health Statistics. Vital Health Stat2002;11(245):1–156.
9 Popkin BM, Nielsen SJ: The sweetening of the world’s diet. Obes Res 2003;11:1325–1332.10 Akerblom HK, Siltanen I, Kallio AK: Does dietary fructose affect the control of diabetes in
children? Acta Med Scand Suppl 1972;548:195–202.11 Crapo PA, Kolterman OG, Olefsky JM: Effects of oral fructose in normal, diabetic, and
impaired glucose tolerance subjects. Diabetes Care 1980;3:575–581.12 Akgun S, Ertel NH: A comparison of carbohydrate metabolism after sucrose, sorbitol, and
fructose meals in normal and diabetic subjects. Diabetes Care 1980;3:582–585.13 Jenkins DJA, Wolever TMS, Tayler RH, et al: Glycemic index of foods: a physiologic basis for
carbohydrate exchange. Am J Clin Nutr 1981;34:362–366.14 Bantle JP, Laine DC, Castle GW, et al: Postprandial glucose and insulin responses to meals con-
taining different carbohydrates in normal and diabetic subjects. N Engl J Med 1983;309:7–12.15 Bantle JP, Laine DC, Thomas W: Metabolic effects of dietary fructose and sucrose in types 1
and 2 diabetic subjects. JAMA 1986;256:3241–3246.16 Bantle JP, Swanson JE, Thomas W, Laine DC: Metabolic effects of dietary fructose in diabetic
subjects. Diabetes Care 1992;15:1468–1476.17 Crapo PA, Kolterman OG: The metabolic effects of 2-wk fructose feeding in normal subjects.
Am J Clin Nutr 1984;39:525–534.18 Bossetti BM, Kocher LM, Moranz JF, Falko JM: The effects of physiologic amounts of simple
sugars on lipoprotein, glucose and insulin levels in normal subjects. Diabetes Care 1984;7:309–312.
19 Koh ET, Ard NF, Mendoza F: Effects of fructose feeding on blood parameters and blood pres-sure in impaired glucose-tolerant subjects. J Am Diet Assoc 1988;88:932–938.
20 Hallfrisch J, Reiser S, Prather ES: Blood lipid distribution of hyperinsulinemic men consum-ing three levels of fructose. Am J Clin Nutr 1983;37:740–748.
21 Reiser S, Powell AS, Scholfield DJ, et al: Blood lipids, lipoproteins, apoproteins, and uric acidin men fed diets containing fructose or high-amylase cornstarch. Am J Clin Nutr 1989;49:832–839.
22 Bantle JP, Raatz SK, Thomas W, Georgopoulos A: Effects of dietary fructose on plasma lipidsin healthy subjects. Am J Clin Nutr 2000;72:1128–1134.
23 Elliott SS, Keim NL, Stern JS, et al: Fructose, weight gain and the insulin resistance syn-drome. Am J Clin Nutr 2002;76:911–922.
24 Bray GA, Nielsen SJ, Popkin BM: Consumption of high-fructose corn syrup in beverages mayplay a role in the epidemic of obesity. Am J Clin Nutr 2004;79:537–543.
25 Saad MF, Khan A, Sharma A, et al: Physiological insulinemia acutely modulates plasma leptin.Diabetes 1998;47:544–549.
26 Teff KL, Elliott SS, Tschop M, et al: Dietary fructose reduces circulating insulin and leptin,attenuates postprandial suppression of ghrelin, and increases triglycerides in women. J ClinEndocrinol Metab 2004;89:2963–2972.
27 Ludwig DS, Peterson KE, Gortmaker SL: Relation between consumption of sugar-sweeteneddrinks and childhood obesity: a prospective, observational analysis. Lancet 2001;357:505–508.
28 Raben A, Vasilaras TH, Moller AC, Astrup A: Sucrose compared with artificial sweeteners: dif-ferent effects on ad libitum food intake and body weight after 10 wk of supplementation inoverweight subjects. Am J Clin Nutr 2002;76:721–729.
29 Waxman A: The WHO global strategy on diet, physical activity and health: the controversy onsugar. Development 2004;47:75–82.
30 Nielsen SJ, Siega-Riz AM, Popkin BM: Trends in energy intake in U.S. between 1977 and 1996:similar shifts seen across age groups. Obes Res 2002;10:370–378.
Fructose: Optimal Sweetener?
91

Discussion
Dr. Katsilambros: A long time ago I learned personally from Prof. AlexanderMargot that when patients come in at the beginning in a state of uncontrolled dia-betes, it is quite undesirable and contraindicated to provide fructose because it ismuch more readily converted to glucose in uncontrolled diabetes. Is this also youropinion? The second comment refers to personal studies done many years ago when Iwas an assistant. Patients with hepatitis B were given fructose orally, once in the acutestage and again in the recovery stage. Glucose and fructose were measured separately.In the first acute phase there was fructose intolerance; the curve was high anddelayed. Then in the recovery phase a considerable improvement in this curve wasobserved. This means that fructose intolerance was due to the diminished capacity ofthe liver to transform fructose to glucose. The related question now refers to yourobservation that men and women have large differences with regard to the triglycerideincrease; that in men triglycerides were much higher than in women. Are you surethat these men were not drinkers?
Dr. Bantle: Let me answer the first question which is about the effect of fructosein poorly controlled diabetes. I think you are absolutely correct. If fructose is fed tosomeone with poorly controlled diabetes, there is a greater rise in plasma glucose thanin people who have well-controlled diabetes. But I think if you look at the response ofsuch a person to ingested glucose, it is also greatly increased and in fact the glycemicresponse to fructose is somewhat less than glycemic response to glucose in that situa-tion. It is true, however, that more fructose is converted to glucose in poorly con-trolled diabetes. Your second point about the use of fructose as a test for liver disease,I cannot answer. I don’t have experience with that. Please, what was the last question?
Dr. Katsilambros: The fact that triglycerides were higher in men. Usually thesemen are volunteers and in many countries including yours these volunteers are paid,and certainly some of them are drinkers. With women this is not the case and it mightpossibly make a difference.
Dr. Bantle: This might make a difference but we screened subjects carefully for ahistory of alcohol consumption. They were to avoid alcohol during the period of studybut I cannot guarantee they did. We were quite certain they ate what we asked themto eat, but whether or not they used alcohol I can’t say for certain. They were solidMinnesotan citizens who pretty much do what you ask them to if they say they will. Iwill tell you a story about our study. One day I was called by one of the nurses to comeand talk to one of the subjects. When I came into the room, the woman was crying. Shesaid she had to tell me that she had eaten something that wasn’t in the study diet. Sheconfessed to have eaten 2 Cherios, and then she started crying again. I was fairly con-fident the data from that woman were reliable. But I can’t verify that some of our sub-jects didn’t consume alcohol. One would hope that any effect of alcohol was evenlydistributed between both treatments so that the randomization process would havereduced or eliminated any effect.
Dr. T. Wilkin: If I recall a review I read some months ago now, the averageAmerican child is consuming something between 60 and 80 g of fructose from sodadrinks alone in the course of the day, whereas if left to the natural sources of fruit andvegetables it might be between 10 and 15 g. Even if your evidence is such that youobserve nothing special about the action of fructose, there was a huge increase in thenumber of calories that have been consumed as a result of fructose ingestion and thelink between obesity and fructose can surely be argued still to be there.
Dr. Bantle: Yes, and perhaps the problem with fructose is it tastes good and ispleasant to consume. The overall problem may be that we are victims of our own suc-cess with abundant food that tastes good and is inexpensive. Several years ago
Bantle
92

McDonalds was implicated in the outbreak of obesity and they may have a similar sortof problem. They make food that tastes good and is inexpensive. That may be as muchthe problem as the specific food type. I would not implicate fructose until we have bet-ter evidence. For instance, sucrose might do the same thing, and if we decided tosweeten drinks with glucose, it would potentially do the same thing.
Dr. T. Wilkin: In your data of the 42-day study you showed us I think 14, 28 and 42days, but I don’t think you showed us the time zero, and I wondered if the levels oftime zero or levels of day 42 had returned to what they were at time zero.
Dr. Bantle: The lipid values?Dr. T. Wilkin: Cholesterol values.Dr. Bantle: There were baseline values obtained. The main thing that happened
was that lipids got better on the glucose diet which would suggest that the baselinediet was high in fructose.
Dr. Golay: Do you have more details concerning the group of women: age, hor-mone replacement, etc.?
Dr. Bantle: The women were picked so that 6 were under 40 and 6 were over 40.We looked at age in both men and women and could find no effect, although the sub-ject sample size was small. Both in younger men and older men, the triglyceride valueswere higher on the fructose diet. In older and younger women there was no effect ofthe fructose diet on triglycerides. I don’t recall the hormonal status but I think most ofthe older women were postmenopausal. We did not stop any replacement therapythey were receiving so we cannot speak much on the effect of estrogens based on thisstudy.
Dr. Metzger: I am also interested in the differences between the men and women.Is there any difference in the handling of fructose between men and women?
Dr. Bantle: Not that I know of and I am not sure there was a real difference in ourstudy. In the study from Elliott et al. [1] that I showed, the women did have a rise intriglycerides when given a high fructose diet. However, there was more fructose, 30%of energy for 1 day, and I think that is an important issue.
Dr. Slama: I had a similar experience as you many years ago and I came to the sameconclusion. But for women I have not looked at that carefully; perhaps I missed some-thing but I could go back to my data. Having a large experience with animal models Ican say that when you feed rats large amounts of sucrose or fructose then a massiveinfiltration of fat is seen everywhere. What is striking is that the liver is twice the size ofthat of the control rat, and this liver is half fat and half glycogen. The same but lessstriking observation can be made in the muscle; there is a lot of fat in the muscle and alot of glycogen which could be utilized by sportsmen. This is so true that not only webut also others are routinely using an insulin-resistant rat model: fructose fat rats.
Dr. Bantle: I think you made a good point. Fructose is very lipogenic in animalmodels although many of the animal studies have employed very high fructose intakes,between 30 and 70% of energy. I think a key point that is not commonly reported is theenergy balance of the animals. That is, with excess energy, fructose is much morelipogenic and there are more adverse effects on lipids than with an energy-deficientdiet where most of the fructose is burned as it is consumed. But that hasn’t beenstudied.
Dr. Slama: I can add that we observed this even pair-fed rats; they have the samebody weight but much more fat and glycogen in the liver than control rats. So it is notonly a question of energy and free access to palatable food, it is a question of metabo-lism and you have shown that the fructose is prone to conduct rather to glycogenand/or to lipids rather than going back to glucose.
Dr. Bantle: I don’t doubt the observation but I have difficulty to explain how, ifthey are truly pair-fed and getting isocaloric diets, they would produce and store more
Fructose: Optimal Sweetener?
93

fat on one diet than on the other, no matter what the source of energy. Perhaps thereis something about fructose that affects metabolism.
Dr. Hill: I have a comment and a question. First I think it is very dangerous tocorrelate specific things in the environment with changes in obesity rates. There areso many things that correlate. Along those lines, it is disturbing to hear everybodyblaming the obesity epidemic on fructose with such little data. My question relates toDr. Slama’s question. One of the concerns is that fructose may be producing insulinresistance in the liver and that could lead to weight gain and obesity. Are there dataavailable that this may be a pathway to link fructose with obesity?
Dr. Bantle: This is a good question and I am afraid I am not aware of any data.Perhaps someone in the audience is. Is anyone aware of such data?
Dr. Slama: No, because really in animals you can feed them with 70% caloriescoming from fructose.
Dr. Bantle: Regarding your comment Dr. Hill, I think that the liquid sweetenersmay in fact be more a problem than solid sweeteners. That is, all the calories that weget through soft drinks may in fact be highly undesirable.
Dr. Chiasson: I remember that Dr. Reaven was using that specific animal model tocreate hypertension and also insulin resistance. I was just wondering whether in yourexperience the subjects did develop any change in the blood pressure?
Dr. Bantle: We did monitor blood pressure carefully and could not demonstrateany difference between the two diets in blood pressure. I too read Dr. Reaven’s studieswith interest. I think he used 70% fructose in his rat models.
Dr. Halimi: As Dr. Slama’s group with the same animal model, we found the samethings: a huge amount of visceral fat, a large liver with steatosis, and hypertension.Fructose increases plasma triglycerides in men but not in women, and not to the sameextent in all populations, more subjects with metabolic syndrome. When plasmatriglyceride increases, what happens to the low-density lipoprotein particle size in thestudies mentioned?
Dr. Bantle: We did not measure the particle size in our studies and I am not awareof anyone who has. So again, I am afraid I can’t answer the question based on anyexperience or data.
Dr. Slama: I find Dr. Halimi’s comment very interesting. Could you not apply thedefinition of metabolic syndrome to both populations in your population and see ifthere is a trend towards more frequent metabolic syndrome in men than in women?
Dr. Bantle: You mean retrospectively go back and look at the data and definethose in the groups who had metabolic syndrome. This is an interesting idea. I thinkwe did have a range of body mass indexes. So it may be possible for us to do that andsee if it was those with higher body mass indexes and metabolic syndrome who hadthe more significant response to fructose. It is a good idea, thank you.
Dr. T. Wilkin: Given the data on hepatic infiltration in the animals, did you havethe opportunity to look at inflammatory markers?
Dr. Bantle: We had the opportunity but we didn’t take it. In retrospect, I wish we had.Dr. Mooradian: Just a caution to those of us who do a lot of cell culture studies:
fructose is a very nasty substance and it has a lot of cell toxicity. I have concerns aboutthis fructose intake even though the effect on glycemia and lipids seems to be modestwithin the range of fructose consumed day to day. But at least in the cell culture fieldfructose is by far a much more toxic substrate than glucose is. I wonder if we are miss-ing some additional effects of fructose when we just focus on glucose and the lipideffect of this sugar.
Dr. Bantle: That is a good point and there may be other effects of fructose, as yetnot defined, that are adverse. I would use the opportunity to point out that we werelooking at 17% of energy as fructose which is something like the 90th percentile ofintakes in the United States. It was quite a high fructose intake but 10% of the people
Bantle
94

in the United States consume that much or more. I am of the opinion that putting thismuch fructose into the energy stream is perhaps not a good idea. We suggested glu-cose would be a suitable replacement but it turns out that glucose is much less sweetthan fructose. The amount you have to put in to make a soft drink taste like it doesnow would give 50% more calories. Recipes that employ sucrose or high fructose cornsyrup would have to be changed in terms of preparation, amounts, baking time,caramelization and all sorts of factors. These would become problems that would needto be solved.
Dr. Halimi: Just another comment about the high fructose diet in rats. It is notconfirmed in human studies but in rats there is also a huge increase in many oxidativestress parameters and this parallels insulin resistance [2, 3]. It would be very interest-ing to examine the situation in humans, with a high fructose intake as the currentintake in the US, to measure the oxidative stress in these populations.
Dr. Bantle: I agree, more study in fructose is clearly needed to see if what happensin animals also happens in humans.
Dr. Mooradian: Just to follow up on Dr. Halimi’s point: tomorrow I am going toshow data specifically on the effect of fructose in oxidation. Fructose is 7- to 8-foldmore pro-oxidant compared to glucose.
Dr. Slama: Have you seen convincing data that 50:50% mixing of glucose and fruc-tose is the same as sucrose in terms of the metabolic effect?
Dr. Bantle: No, I don’t know of any such data. My assumption is that, since 55%fructose corn syrup contains nearly equal amounts of glucose and fructose, it wouldhave the same effect as sucrose.
Dr. Slama: I am not sure really but there might be some data proving the reverse.I think that the problem comes from your country because you are not producingsucrose or only very small amounts, and so you are producing your natural sweeten-ers, corn syrup, whereas in other countries sucrose is widely used.
Dr. Bantle: I agree, we are part of the problem. Where I come from, as soon as youleave the city, there is corn as far as the eye can see in all directions.
Dr. Slama: So you may have some trouble in your country to pick up all.Dr. Bantle: Corn is a good thing in most respects.Dr. Halimi: Just some information, very interesting in my opinion. In cooperation
with a center specialized in animal feeding, we have confirmed that a high fructosediet is able to induce insulin resistance in male rats. But this diet does not induceinsulin resistance in females [4]. Second, when the same diet, very rich in fructose, isreproduced using honey, then there is no insulin resistance. This could be due toantioxidative substances in the honey [5].
References
1 Elliott SS, Keim NL, Stern JS, et al: Fructose, weight gain and the insulin resistance syn-drome. Am J Clin Nutr 2002;76:911–922.
2 Faure P, Rossini E, Wiernsperger N, et al: An insulin sensitizer improves the free radical defensesystem potential and insulin sensitivity in high fructose-fed rats. Diabetes 1999;48:353–357.
3 Faure P, Roussel A, Coudray C, et al: Zinc and insulin sensitivity. Biol Trace Elem Res1992;32:305–310.
4 Busserolles J, Mazur A, Gueux E, et al: Metabolic syndrome in the rat: females are protectedagainst the pro-oxidant effect of a high sucrose diet. Exp Biol Med (Maywood) 2002;227:837–842.
5 Busserolles J, Gueux E, Rock E, et al: Substituting honey for refined carbohydrates pro-tects rats from hypertriglyceridemic and prooxidative effects of fructose. J Nutr 2002;132:3379–3382.
Fructose: Optimal Sweetener?
95


Optimal Diet for Glycemia and Lipids
William C. Knowler
National Institute of Diabetes and Digestive and Kidney Diseases, Phoenix, AZ, USA
AbstractConcentrations of glucose and lipids in the blood have important health implica-
tions and are influenced by dietary intake. Dietary intake and energy expenditure reg-ulate body weight, which is also an important determinant of health. Thus it would beimportant to determine the optimal diet for affecting blood glucose and lipids andbody weight. Many professional health organizations in different countries have madedietary recommendations that include caloric restriction when needed to prevent orreverse overweight or obesity, limitation of saturated and trans fat, and emphasis onfruits and vegetables. These professional groups have not recommended extremelylow carbohydrate or extremely low fat diets, despite much popular interest and recentresearch in these approaches. In several clinical trials, diet and exercise interventionsprevented or delayed the development of type-2 diabetes. These trials showed thevalue of diet interventions, but did not attempt to determine which dietary approachwas optimal. Clinical trials attempting to determine the optimal diet suffer from smallsample sizes, short follow-up, and poor follow-up of participants. Therefore, the opti-mal balance between the total fat and carbohydrate contents and the optimal types offats and carbohydrates remain unknown.
Copyright © 2006 Nestec Ltd., Vevey/S. Karger AG, Basel
Introduction
Dietary intake influences concentrations of glucose and lipids in the blood,both of which have important health implications. Hyperglycemia in personswith diabetes often leads to symptoms that can be relieved by lowering the bloodglucose concentrations. Thus, dietary changes (caloric restriction or changingthe composition) may help to relieve symptoms, although drug therapy is oftenalso needed, especially with extreme hyperglycemia. Diabetes, a disease thatcarries substantial morbidity from microvascular, macrovascular and nervedamage as well as higher mortality rates, is defined by hyperglycemia. Among
Bantle JP, Slama G (eds): Nutritional Management of Diabetes Mellitus and Dysmetabolic Syndrome.Nestlé Nutr Workshop Ser Clin Perform Program, vol 11, pp 97–105,Nestec Ltd., Vevey/S. Karger AG, Basel, © 2006.
97
Beyond Glycemic Control
people with diabetes, the degree of hyperglycemia accelerates the developmentof these complications, especially microvascular complications such as retinopa-thy and nephropathy. Among non-diabetic persons, the degree of hyperglycemiapredicts subsequent development of diabetes and cardiovascular disease.
Dyslipidemia is rarely symptomatic, so the motivation for changing serumlipids by dietary or other means is for long-term prevention of diseases asso-ciated with dyslipidemia. Serum concentrations of lipids, particularly choles-terol and its low-density lipoprotein and high-density lipoprotein fractions,are related to development of cardiovascular diseases.
Because caloric intake and energy expenditure jointly determine change inbody weight, dietary intake is one of the key components in the prevention or treatment of overweight or obesity, which in turn are associated with many chronic diseases, including type-2 diabetes and cardiovascular diseases.Therefore, the consumption of diets with favorable effects on glycemia, lipids,and body weight has the potential of improving health. Because of the increasingimportance of cardiovascular disease as the leading cause of death in China [1],the dietary effects on cardiovascular disease are important to this nation.
Current Dietary Guidelines
A number of national or professional health organizations have recom-mended guidelines for healthy diets, either for general health or focused onspecific aims such as controlling obesity or diabetes, or preventing heart dis-ease. Most current guidelines emphasize limitation of caloric consumptionfrom fats. For example, the Chinese Ministry of Health guidelines for preven-tion and control of overweight and obesity in adults included moderatecaloric restriction plus physical activity with an emphasis on diets with low fatcontent, complex carbohydrates (including cereals), and fresh fruits and veg-etables [2]. In the setting of dyslipidemia, they also recommend limitation ofsaturated fat and cholesterol.
The American Diabetes Association published a technical review of dietaryguidelines for people with or at high risk of developing diabetes [3]. Recomm-endations for people with either type-1 or type-2 diabetes were to includecarbohydrates from whole grains, fruit, vegetables, and low-fat milk. Lessthan 10% of calories should be derived from saturated fat, and about 10%should come from polyunsaturated fat. In the typical American diet that con-tains more than the recommended amount of saturated fat, the calories fromsaturated fat should be replaced by calories from carbohydrate and monoun-saturated fat, with the combination of the two making up 60–70% of dietaryintake. Interestingly, there was insufficient evidence to recommend howmuch of this combination should be carbohydrate and monounsaturated fat. Another controversial point for which they found insufficient evidencewas the glycemic index of foods. Thus, they made no recommendation
Knowler
98

regarding choosing foods based on the glycemic index. This technical reviewalso contained recommendations concerning energy balance and obesity [3].The reviewers concluded that prescription of weight-loss diets alone wasunlikely to produce sustained weight loss, but structured programs includingexercise and behavioral modification could produce sustained weight loss of5–7%. The effectiveness of this type of program was, in fact, shown in theDiabetes Prevention Program clinical trial [4].
Similar, though not identical, dietary recommendations were made by theDiabetes and Nutrition Study Group of the European Association for theStudy of Diabetes [5] and the American Heart Association [6]. Notably, noneof these guidelines from professional health organizations recommendedhigh-fat low-carbohydrate diets, or extremely low-fat diets (�10% of calo-ries), despite the recent interest in such diets (see below).
Dietary Effects on Mortality
Despite the abundance of dietary guidelines, it is hard to find evidence thatdietary composition has major effects on longevity. In the Malmö Diet andCancer Study, all-cause mortality rates were not significantly related to the fatcontent of the diet in either men or women [7]. The rate of death attributable tocardiovascular disease, however, was significantly inversely related to dietaryfat intake in men, but not in women. The EPIC study evaluated dietary intakeas a predictor of mortality among over 70,000 people at least 60 years of age in10 European countries [8]. Instead of evaluating simple dietary composition(i.e. percent of calories from fat, carbohydrate, protein, and alcohol), they con-structed a ‘Mediterranean diet score’ reflecting the dietary composition previ-ously shown in Greece to be associated with longevity. The score was derivedfrom points for answering dietary questions on consumption of various types offoods. Higher scores, indicating dietary composition more like that of the tradi-tional ‘Mediterranean diet’, were derived from high consumption of vegetables,legumes, fruits, cereals, fish, and unsaturated fat relative to saturated fat; lowconsumption of meat and dairy products, and moderate alcohol consumption.The score was inversely and approximately linearly related to subsequent mor-tality. This suggested that throughout Europe, mortality rates were lower inthose eating the ‘Mediterranean diet’. This favorable diet is described notspecifically by fat and carbohydrate content, but by types of foods. A higherscore may depend more on type of fat consumed rather than total quantity.
Diabetes Prevention Clinical Trials
The degree of body weight relative to height, commonly expressed as thebody mass index, is a strong predictor of the development of type-2 diabetes [9].
Optimal Diet for Glycemia and Lipids
99

This observation led to the obvious hypothesis that weight loss might lower aperson’s risk of developing type-2 diabetes. Three large randomized clinical tri-als have tested the hypothesis that dietary change in persons at high risk oftype-2 diabetes can reduce the incidence of diabetes during a treatment periodof several years. The first two employed diet and exercise interventions com-pared with each other [10] or combined [11]. The third, the US DiabetesPrevention Program, used a structured program of diet and exercise modifica-tion designed to produce weight loss compared with a program of diet andexercise advice only [4, 12]. It also included two pharmacologic treatment armsthat will not be discussed here. Lifestyle modification lowered the incidencerate of diabetes in all three of these clinical trials [4, 10, 11]. The diet interven-tion in the Diabetes Prevention Program started with a reduction of fat to lessthan 25% of caloric intake [4, 12]. This was followed, when necessary, by totalcaloric restriction. Emphasis was put on self-monitoring of diet, exercise, andweight, and case managers were used to help each individual make the appro-priate changes. The goal was gradual weight loss of 0.5–1 kg/week with a long-term goal of loss of 7% of body weight. This intervention resulted in a 58%reduction of the incidence rate of diabetes during a treatment and follow-upperiod averaging 2.8 years/participant [4]. The weight-loss intervention alsoresulted in a significant fall in serum triglycerides compared with the advice-only group [13]. Total and low-density lipoprotein cholesterol were also low-ered, but not to an extent significantly different from the advice-only group.
The Diabetes Prevention Program followed only one diet and exerciseapproach to weight loss. Although it was successful compared with the advice-only group, this study did not evaluate different dietary approaches. Thus it isnot known whether the weight loss induced in the Diabetes PreventionProgram was due to the fat reduction, or whether other approaches to limitingcaloric intake and increasing energy expenditure would have been more orless successful. It is likely that weight loss per se has more important effects onglycemia and lipids than does the type of diet used to achieve weight loss.
Other Evidence for Dietary Effects
Although the technical review published by the American DiabetesAssociation found insufficient evidence for recommending food selectionbased on the glycemic index [3], there is some evidence suggesting that alower glycemic index (effect of a food on raising the blood glucose) orglycemic load (a product of the amounts of food with their glycemic indices)may reduce the incidence of type-2 diabetes. The Health Professional Follow-up Study of Men reported that neither glycemic load nor cereal fiber intakealone was strongly related to subsequent diabetes. The combination of lowcereal fiber intake and high glycemic load, however, was associated with anapproximate doubling of the risk of developing diabetes [14].
Knowler
100

There has also been substantial controversy regarding the potential bene-fits of several recently popular diets, especially those with extremes of fat andcarbohydrate content. A recent randomized controlled clinical trial attemptedto evaluate four such diet plans ranging from the lowest carbohydrate andhighest fat content (the Atkins diet) to the lowest fat and highest carbohy-drate content (the Ornish diet) [15]. Forty persons were randomized to eachof the four diets and followed for 1 year. As is typical in many published dietclinical trials, the dropout rate was high, making interpretation difficult,because dropping out of a weight loss trial may not be random but related tosuccess with weight loss. Perhaps because of the dropout problem and thelimited sample sizes, there were no significant differences between the treat-ment groups in weight loss or changes in lipids or other cardiovascular riskfactors. Such studies, directly comparing different diet regimens for longerperiods of time, but with larger sample sizes and more complete follow-up ofall participants regardless of weight loss, are needed to provide firm evidencefor recommending the optimal diet.
Concern has been raised recently that the rapidly increasing consumptionof high fructose corn syrup in the United States, due to its becoming themajor sweetener used in beverages since the 1970s, is a major contributor tothe increasing prevalence of obesity in the United States [16]. Reported con-sumption of sweetened beverages predicted the incidence of diabetes in theNurses Health Study, in which persons reporting consumption of at least 1beverage/day had about double the incidence rate of diabetes as those report-ing such consumption less than once per month [17].
Conclusions
Currently the answer to the question of what is the optimal diet forglycemia and lipids is unknown. The best way to answer this question will befrom randomized clinical trials comparing different diet plans, along the linesof the clinical trial of the four diets described above [15]. Such studies shouldbe larger and have at least several years of follow-up. Most important (andmost difficult) will be assuring that almost all participants remain under follow-up throughout the study.
In the opinion of the author, it is best to avoid overweight or obesity, and tolimit saturated and trans fat, and high-fructose sweeteners. There is insuffi-cient evidence to recommend the optimal balance between total fat and car-bohydrate contents of the diet.
References
1 He J, Gu D, Wu X, et al: Major causes of death among men and women in China. N Engl J Med2005;353:1123–1134.
Optimal Diet for Glycemia and Lipids
101

2 Chen C, Lu FC, Department of Disease Control, Ministry of Health, PR China: The guidelinesfor prevention and control of overweight and obesity in Chinese adults. Biomed Environ Sci2004;17(suppl):1–36.
3 Franz MJ, Bantle JP, Beebe CA, et al: Evidence-based nutrition principles and recommenda-tions for the treatment and prevention of diabetes and related complications. Diabetes Care2002;25:148–198.
4 Knowler WC, Barrett-Connor E, Fowler SE, Diabetes Prevention Program Research Group:Reduction in the incidence of type 2 diabetes with lifestyle intervention or metformin. N EnglJ Med 2002;346:393–403.
5 Mann JI, De Leeuw I, Hermansen K, et al: Evidence-based nutritional approaches to the treat-ment and prevention of diabetes mellitus. Nutr Metab Cardiovasc Dis 2004;14:373–394.
6 Kraus RM, Eckel RH, Howard B, et al: American Heart Association Scientific Statement: AHADietary Guidelines. Circulation 2000;102:2284–2299.
7 Leosdottir M, Nilsson PM, Nilsson J-Å, et al: Dietary fat intake and early mortality patterns –data from the Malmö Diet and Cancer Study. J Intern Med 2005;258:153–165.
8 Trichopoulou A, Orfanos P, Norat T, et al: Modified Mediterranean diet and survival: EPIC-elderly prospective cohort study. BMJ 2005;330:991.
9 Knowler WC, Pettitt DJ, Savage PJ, Bennett PH: Diabetes incidence in Pima Indians: contri-butions of obesity and parental diabetes. Am J Epidemiol 1981;113:144–156.
10 Pan X-R, Li G-W, Wang J-X, et al: Effects of diet and exercise in preventing NIDDM in peoplewith impaired glucose tolerance: the Da Qing IGT and Diabetes Study. Diabetes Care 1997;20:537–544.
11 Tuomilehto J, Lindstrom J, Eriksson JG, et al: Prevention of type 2 diabetes mellitus bychanges in lifestyle among subjects with impaired glucose tolerance. N Engl J Med 2001;344:1343–1350.
12 Diabetes Prevention Program Research Group: The Diabetes Prevention Program (DPP):description of the lifestyle intervention. Diabetes Care 2002;25:2165–2171.
13 Ratner R, Goldberg R, Haffner S, Diabetes Prevention Program Research Group: Impact ofintensive lifestyle and metformin therapy on cardiovascular disease risk factors in the dia-betes prevention program. Diabetes Care 2005;28:888–894.
14 Salmeron J, Ascherio A, Rimm EB, et al: Dietary fiber, glycemic load, and risk of NIDDM inmen. Diabetes Care 1997;20:545–550.
15 Dansinger ML, Gleason JA, Griffith JL, et al: Comparison of the Atkins, Ornish, Weight Watchers,and Zone diets for weight loss and heart disease risk reduction. JAMA 2005;293:43–53.
16 Bray GA, Nielsen SJ, Popkin BM: Consumption of high-fructose corn syrup in beverages mayplay a role in the epidemic of obesity. Am J Clin Nutr 2004;79:537–543.
17 Schultze MB, Manson JE, Ludwig DS, et al: Sugar-sweetened beverages, weight gain, and inci-dence of type 2 diabetes in young and middle-aged women. JAMA 2004;292:927–934.
Discussion
Dr. T. Wilkin: The difficulty you had with your conclusions may reflect the initialslides which are very challenging. You showed us the exponential increase in type-2diabetes with body mass index and the lack of effect of various amounts of fat in thediet, at least in one study. If you are looking at the problem as to whether it is dietarycontent or body mass, then the issue is surely one of tolerance. If you can tolerate thefats and if you can tolerate the glucose, and that by and large is related to body massand adipocyte capacity, then you could probably get away with a healthy and a varieddiet or what some might consider an unhealthy diet, whereas if you have gained theweight and lost the adipocyte capacity and lost the glucose tolerance, then your abil-ity to tolerate becomes narrower and narrower. So what I took from your talk was a farstronger emphasis on body mass than on what the diet actually contains.
Dr. Knowler: That is also my feeling, but I might add that this is in terms of type-2diabetes, not necessarily of dyslipidemia. In terms of risk of diabetes, the body weight
Knowler
102

or body mass index is by far the most important. As long as people can limit theirweight or overweight people can reduce their weight then the specific dietary compo-nents may be less important. An important question for diabetes prevention is: what isthe best approach to loosing weight? Unfortunately there is no easy answer for thatquestion.
Dr. Hill: One of the mistakes I think we make in the US is basing general recom-mendations on results from weight loss studies. For example Dr. Golay demonstratedthat if you fix calories during food restriction the dietary composition is not an impor-tant determinant of the amount of weight loss. However, in most cases calorie intake isnot fixed when people try to lose weight. Many people who go on the Atkins diet lose alot of weight probably because they eat less. For dietary fat, lots of data suggest thatthe higher fat in the diet the more energy you are likely to consume. So it is dangerousto base population recommendations on short-term weight loss results. My question iswhether or not you think that the optimum diet should vary with physical activity? Isthe optimum diet for a sedentary person different than for someone who gets regularphysical activity?
Dr. Knowler: That is very likely but I actually don’t know how I would change therecommendation for the very active person. A person can be very active comsumingeither a high fat or high carbohydrate diet.
Dr. Hill: If you are very physically active and are burning a lot of fat, the optimumamount of fat in the diet could be higher than for a sedentary person.
Dr. Knowler: It could be, but I don’t know what it is.Dr. Field: The Diabetes Prevention Program (DPP) trial is our best evidence that
diet influences outcome or prevention. An argument that is raised for the implemen-tation of intensive lifestyle intervention for the prevention of type-2 diabetes is theconsiderable cost. Do you think that this approach is feasible based on the number ofpeople at risk?
Dr. Knowler: When you are asking about feasibility and cost, are you referring toeffort to prevent diabetes or treat diabetes, because the answer might be different?
Dr. Field: To prevent.Dr. Knowler: Again I can’t give you the answer for that for sure. Two economic
analysis of the DPP have been published this year in the Annals of Internal Medicine,one by the DPP itself, one by an outside group, and they came to very different con-clusions [1, 2]. The DPP analysis concluded that the DPP style intervention, specifi-cally the intensive lifestyle intervention, did give good health value for money spentand, in terms of quality of life years improved, was comparable or favorable to manythings that are standard medical practices. The other paper [2] came to very differentconclusions that it was just not economically feasible at all. And the major differencesI think, these were both exercises in modeling disease progression and cost. Theyprojected well beyond the data in the DPP because they were projecting what wouldhappen over 30 years, and whenever you are projecting out 30 years, obviously whatyou get depends on what you assume is going to happen in those 30 years.
Dr. Bantle: As we discuss diet, perhaps I can ask your thoughts about the growingbody of evidence that suggests that energy intake, energy expenditure and bodyweight are all centrally regulated by the hypothalamus and under rigorous control. Iam bothered by the thought that when we ask patients to override this control systemby force of will, we are asking them to do something that is very difficult.
Dr. Knowler: I think that central control is also subject to external influences. Thefact that there have been huge changes in obesity in virtually all countries of the worldmeans that things are changing due to outside influences.
Dr. Huixia Yang: Some studies from Prof. Barker mentioned that birth weight ismost important for diabetes and other chronic diseases. In the DPP study we don’t
Optimal Diet for Glycemia and Lipids
103

know the patients’ relation to birth weight. In the patients with low birth weight,meaning intrauterine growth retardation, perhaps diabetes also increases. I justwant to know the relation of lifestyle changes in diabetes to the incidence of otherthings.
Dr. Knowler: Unfortunately I can’t comment about that because we didn’t havethose data in the DPP.
Dr. Huixia Yang: I just wanted to confirm the Barker hypothesis becauseProf. Barker mentioned that a lot of chronic diseases may be of fetal origin.
Dr. Knowler: I can’t comment on that, regarding the DPP. In our studies of thePima Indians, we do know the birth weight of many people and we could confirm thathypothesis in the people with very low birth weights had a higher risk of diabetes, butso did the people with a high birth weight, but for very different reasons. The infantswho had very high birth weight tended to be born from mothers who had diabetes dur-ing the pregnancy, and that it puts them at very high risk. The infants with very lowbirth weight tended to be the offspring of diabetic fathers. Some of that effect mayalso be genetic, the people in the extremes of birth weight are inheriting differentgenetic susceptibility factors. But I think a very important thing is that the extremes ofbirth weight associated with greater diabetes risk included only about 10% of the pop-ulation. Over about 90% of the range of birth weight there was no effect on subse-quent risk of diabetes. Therefore the extremes of birth weight are very important forthe individuals in those extremems, at least in our population but they are not fre-quent enough to explain diabetes in that population.
Dr. T. Wilkin: Could I just return to Dr. Bantle’s question about the hypothalamusand setting, which I think is a very interesting one. I wonder whether the way in whichour hypothalami are set relates to a far distant evolutionary period in which the expo-sure to food was very different than it is now. Perhaps the setting was far more relatedto carbohydrate content than to fat content, and as far as I understand, fat has very lit-tle anorexic effect in any case. So I wonder if our setting points are simply unrelated tothe food type exposure that we have nowadays and therefore unresponsive to.
Dr. Ditschuneit: You mentioned the guidelines for an optimal diet and that twoservings fish per week is optimal. I think that it has something to do with n-3 and n-6fatty acids and that they may play a role in cardiovascular disease. I would like you tocomment on the role of n-3 and n-6 fatty acids and the relation between these twofatty acids.
Dr. Knowler: As you point out I think the predominant evidence is that these fattyacids would be beneficial in terms of cardiovascular disease. I am not aware of datathat they would have direct effects on either body weight or risk of diabetes. Certainlyfrom the standpoint of cardiovascular health I think the evidence would favor the n-3and n-6 fatty acids from fish and some vegetable sources, and that is why they are puton several groups’ recommendations. An anecdotal observation, which is not very sci-entific is that two of the countries in the world that generally have the world’s lowestmortality rates, are Japan and Sweden. Both have very high fish intakes, but very dif-ferent diets in many other respects. The commonality of fish consumption is an inter-esting observation.
Dr. Gerasimidi-Vazeou: Is there any evidence about the impact of high fat-highprotein diets on factors related to endothelial function like tumor necrosis factor-�,interleukin-6, C-reactive proteins, as the weight and the lipids have always been theendpoints of studies on the Atkins diet?
Dr. Knowler: Unfortunately I don’t know the answer to that question.Dr. Hill: The studies that have been published on the Atkins diet have not looked
at that. They have looked at total cholesterol, low-density lipoprotein cholesterol,high-density lipoprotein and triglycerides. We are doing a study right now collectingthose data but we won’t have any results for a while.
Knowler
104

Dr. Mingdao Chen: From your first several slides you put the carbohydrate plusmonounsaturated fatty acids together, two substances which are not falling into thesame category. What is the ratio between carbohydrate and monounsaturated fattyacids?
Dr. Knowler: Ms. Franz or Dr. Bantle might want to respond to that question,because I took this from their paper. There has been a lot of agreement that saturatedand trans-saturated fat are unhealthy and should be limited. The question is if you aregoing to limit them, what do you replace them with? The two obvious choices are car-bohydrate or polyunsaturated and monounsaturated fats. The monounsaturated fattend to be neutral in terms of their effects on dyslipidemia. There is some evidencethat in some people very high carbohydrate diets may contribute to hypertriglyc-eridemia. So I think the view is that if you are going to reduce saturated fats, themonounsaturated fats are may be a good thing to replace them with. A particular rec-ommendation was one that the sum of carbohydrate and monounsaturated fats shouldbe 60 or 70%. Might I just ask Ms. Franz to comment more specifically what sherecommends?
Ms. Franz: The American Diabetes Association is in the process of updating theirnutrition recommendations. In regard to percentages for macronutrient distributionwe could find no evidence to support ideal percentages from macronutrients. Supportis given to the Dietary Reference Intakes report that recommends meeting the body’snutritional needs while minimizing the risk of chronic diseases. Adults should consume45–65% of total energy from carbohydrate, 20–35% from fat, and 10–35% from protein[3]. Saturated fat intake should be �7% of total calories and intake of trans fat shouldbe minimized. Either mono- or polyunsaturated fats can be used to replace saturatedfats in the diet.
Dr. L. Wilkin: No one as mentioned dietary salt. I am wondering if there is not arelationship between salty snacks and the consumption of sweetened drinks, espe-cially among young people? So if we could cut the salt, would we not reduce theamount of soda that they drink?
Dr. Knowler: That is a good question. Specifically I didn’t address dietary saltbecause I am not aware of data of it having direct effects on glycemia or lipids, whichwas my charge. But you are right, salt in the diet is very often correlated to fat in thesesalty snacks so it is an example of changing one aspect of diet, it is hard to isolatedietary components because they are also correlated.
References
1 Herman WH, Hoerger TJ, Brandle M, et al, Diabetes Prevention Program Research Group:The cost-effectiveness of lifestyle modification or metformin in preventing type 2 diabetes inadults with impaired glucose tolerance. Ann Intern Med 2005;142:323–332.
2 Eddy DM, Schlessinger L, Kahn R: Clinical outcomes and cost-effectiveness of strategies formanaging people at high risk for diabetes. Ann Intern Med 2005;143:251–264.
3 Institute of Medicine: Dietary Reference Intakes for Energy, Carbohydrate, Fiber, Fat, FattyAcids, Cholesterol, Protein, and Amino Acids. Washington, National Academies Press, 2002.
Optimal Diet for Glycemia and Lipids
105


Antioxidants and Diabetes
Arshag D. Mooradian
Division of Endocrinology, Diabetes, and Metabolism, Department of Internal Medicine, St. Louis University School of Medicine, St. Louis, MO, USA
AbstractOverproduction of superoxide by the mitochondrial electron transport chain is the
common link between the various pathways of glucotoxicity. The increased oxidativebyproducts in diabetes are the result of a glucose-induced increase in the productionof reactive oxygen species and decreased antioxidant defense capacity. Several epi-demiologic observations indicate an inverse association between vitamin E intake andcoronary heart disease (CHD). There are several limitations in such studies includingthe fact that they rely on food questionnaires and dietary recalls. Large interventionaltrials have yielded inconsistent results. Of concern is that, in some of these studiesthere was a greater incidence of lung cancer or CHD. These observations underscorethe potential hazards of consuming large amounts of antioxidants. At the presenttime, given the inconsistencies of the studies available, the widespread supplementa-tion with pharmacological doses of antioxidants should be discouraged. Future studiesshould focus on identifying reliable markers of oxidation to incorporate these meas-urements in the clinical interventional trial.
Copyright © 2006 Nestec Ltd., Vevey/S. Karger AG, Basel
Introduction
Despite the advances made in the management of diabetes, people withuncontrolled hyperglycemia continue to suffer from dire complications. Oneof the most serious complications of diabetes is cardiovascular disease (CVD)[1]. Although there are multiple potential causes for increased risk of prema-ture CVD in diabetes, increased oxidative stress has emerged as an importanttherapeutic target to reduce the burden of this complication. Indeed, it ispossible that overproduction of superoxide by the mitochondrial electrontransport chain is the common link between the various pathways of gluco-toxicity [2]. Thus, it is plausible that identifying agents that can reduce oxida-
Bantle JP, Slama G (eds): Nutritional Management of Diabetes Mellitus and Dysmetabolic Syndrome.Nestlé Nutr Workshop Ser Clin Perform Program, vol 11, pp 107–125,Nestec Ltd., Vevey/S. Karger AG, Basel, © 2006.
107

tive load would reduce the risk of developing diabetic complications includingCVD. Hence, the continued interest in antioxidant therapy in diabetes hasgenerated a voluminous scientific literature. In this communication thepotential mechanisms of increased oxidative load in diabetes will be reviewedand the currently available large trials of antioxidants in reducing diseaseburden will be critically evaluated. Finally the arguments in favor or againstantioxidant supplementation will be discussed.
Increased Oxidative Load in Diabetes: the Role of Hyperglycemia
Many but not all studies have found increased accumulation of oxidationbyproducts in diabetes. Lipid peroxidation byproducts such as exhaled ethaneor pentane, malondialdehyde, conjugated dienes and F2-isoprostanes areincreased in diabetic subjects and in animal models of diabetes [for review see 3, 4]. Similarly, oxidation byproducts of proteins and deoxynucleic acids(DNA) are increased.
The mechanisms underlying the increased oxidative byproducts indiabetes are multiple. These mechanisms can be generally classified aseither a consequence of a glucose-induced increase in the production ofreactive oxygen species (ROS), decreased antioxidant defense capacity, orthe inability to eliminate the oxidized byproducts efficiently. The latteris not supported by as much experimental evidence as the former twomechanisms.
Through glycolysis, glucose is converted to pyruvate that enters the tricar-boxylic acid cycle, increasing the electron transport chain and, in the process,ROS is produced. This process has been shown to occur in several studies ofendothelial as well as other cell cultures. Glucose-induced ROS productioncan be ameliorated with both conventional, such as vitamin C and E [5], andunconventional antioxidants, such as statins [6] and carvedelol [7]. It is note-worthy that in these experimental conditions the rate of ROS productiondecreases after the second or third hour of treatment suggesting that adap-tive mechanisms are activated to ameliorate the initial surge of oxidativeactivity. These adaptations may originate at nuclear and extranuclear sites ofaction. Several genes are now identified that have antioxidant response ele-ments (AREs) in the promoter region. The antioxidant response gene familyinvolves at least six genes on at least two different chromosomes. Examplesinclude nicotinamide adenine dinucleotide phosphate (NADPH) quinone oxi-doreductase I and II (hNQO1 and hNQO2) genes that can mount a coordi-nated response to oxidant stress [8]. Other AREs have been identified andbeen shown to respond to conventional antioxidants sometimes downregulat-ing gene products that have cardioprotective properties [9]. Thus thegenomic response to oxidants and antioxidants could have both protectiveand deleterious consequences.
Mooradian
108

In addition to being a substrate for cellular respiration, glucose can induceROS generation through multiple pathways including the promotion of glycationof proteins and activation of protein kinase C (PKC) activity [2]. Furthermore,glucose has auto-oxidative potential that has been demonstrated in cell-freesystems [10]. In comparison to other simple sugars, fructose has the mostpotent auto-oxidative potential while deoxyribose has the least capacity ofauto-oxidation [10].
Chronic hyperglycemia can also promote oxidative stress through interfer-ence with antioxidant defense systems. Diabetic individuals, especially thosewho are poorly controlled, are likely to develop multiple micronutrient defi-ciencies some of which have antioxidant activities [3, 11]. Of all the potentialantioxidant deficiencies, depletion of the intracellular content of ascorbatecan occur because of direct inhibition of the cellular uptake of dehydroascor-bate by glucose [12]. Nevertheless, the effect of uncontrolled hyperglycemiaon antioxidant defense capacity extends beyond individually known micronu-trients [13]. The precise metabolic pathway by which hyperglycemia reducesthe antioxidative defense capacity is not completely clear, but appears to beat least partly secondary to overconsumption of antioxidants in the presenceof increased production of ROS.
Antioxidants and Disease Outcome: Observational Studies
Observational studies correlating potential health benefits with the con-sumption of antioxidants are summarized in table 1.
Several epidemiologic observations indicate an inverse association betweenvitamin E intake and CHD. For example, the Iowa Women’s Health Study(n � 34,486) [14], Nurses’ Health Study (n � 87,245) [15], and HealthProfessionals Follow-Up Study (men only; n � 39,910) [16] revealed that sub-jects in the highest quintile of vitamin E consumption from food and supple-ments had relative CHD risks of 0.78, 0.59, and 0.59, respectively, afteradjustment for confounding variables such as age. The Nurses’ Health study[15] showed a decreased risk of coronary artery disease in women who tookvitamin E supplements for more than 2 years. However, in this study womenwho took the supplements had a slightly better cardiovascular risk profile atbaseline. It is also probable that people who choose the vitamin supplementshad healthier lifestyle.
The National Health and Nutrition Examination Survey (NHANES) I [17]concluded that there was an inverse association of vitamin C intake in malesand all causes of death and CVDs. In this study diabetes and hypertensionwere not included as potential confounding variables.
The Rotterdam study [18] and the Bruneck study [19] have observed thebeneficial effects of carotenoid intake. However in the Rotterdam study,lifestyle variables were not taken into consideration and in the Bruneck study
Antioxidants and Diabetes
109

Moorad
ian
110 Table 1. A select list of observational studies of the role of antioxidants
Study Study Study design Antioxidants assessed Results of studypopulation and follow-up
time
Dwyer et al. [20] 573 persons 18-month Vitamin C and vitamin E Vitamin C supplement �857Los Angeles aged 40–60 years follow-up intake determined by mg/day was associated withAtherosclerosis 24-hour recall, and plasma increased intima media thicknessStudy levels of antioxidants (IMT) of the common carotid
arteries; whereas vitaminE supplement of �443 IU/daywas associated with reducedprogression. 18-month change inIMT was inversely related tothe 3 measured oxygenatedcarotenoids (lutein, �-cryptoxanthin, zeaxanthin) andone hydrocarbon carotenoid,�-carotene
D’Odorico et al. [19] 392 randomly 5-year follow-up Plasma levels of carotenoids, �- and �-carotene plasma levelsBruneck study selected men vitamins A and E were were inversely associated
and women determined. Atherosclerosis with the prevalence ofaged 45–65 years was assessed by duplex atherosclerosis of carotid
ultrasound and femoral arteries
Ford et al. (23)a 1,010 controls; Cross-sectional Plasma level of �-Carotene and to lesser degreeNHANES III 277 persons with carotenoids measured cryptoxanthin and lycopene were
impaired glucose inversely correlated with thetolerance degree of glucose tolerance230 diabetic abnormality. All the carotenoidspatients aged were inversely related to40–74 years fasting insulin concentration

An
tioxidan
ts and
Diabetes
111
Klipstein-Grobusch 4,802 participants 4-year Food frequency High �-carotene intake but notet al. [18]a of Rotterdam follow-up questionnaire for vitamin C or E was associatedRotterdam Study aged 55–95 years assessment of dietary with decreased incidence of
antioxidant intake myocardial infarction
Will et al. [21]a 237 diabetics Cross-sectional Vitamin C serum levels After adjustment for covariates,NHANES III 1,803 nondiabetics were assayed mean concentration of serum
aged 40–74 years vitamin C did not differ according to diabetes status
Mayer-Davis et al. 387 type-2 Cross-sectional and 24-hour dietary recall No protective effect of antioxidant[22]a, SLVDS diabetics aged longitudinal 4-year intake on diabetic retinopathy.
20–74 years follow-up Potential harmful effect of vitaminE and carotenoid in certainsubset of diabetics
Coudray et al. [30]a 1,389 persons Cross-sectional with Laboratory values of Selenium and vitamin E levelsEVA study aged 59–71 years a 4-year follow-up selenium, vitamin were increased in those subjects
E and carotenoids with lipemia. In diabetics andwere analyzed hypertensive subjects the
carotenoids were reduced
Mayer-Davis et al. 520 persons IRAS: cross-sectional; Vitamin C assessed by food Vitamin C intake did not seem[31]a, IRAS from IRAS and SLVDS: cross- frequency interview in IRAS to be associated with CVD riskand SLVD 422 from SLVDS sectional and and 24-hour dietary recall among diabetics
longitudinal design interview in SLVDS
Sanchez-Lugo et al. 1,151 persons Cross-sectional Intake of vitamins E and Intake of vitamins E and C had no[32]a, IRAS from IRAS group C estimated from food correlation with insulin sensitivity
aged 40–69 years frequency questionnaire
Jacques et al. [33] 247 women 10- to 12-year Intake of vitamin C was Use of vitamin C supplements Nurses’ Health aged 56–71 follow-up assessed by food for more than 10 years was Study years frequency questionnaire associated with a 77% lower
and vitamin C supplement prevalence of early lens opacities consumption data and 83% lower prevalence of
moderate lens opacities

Moorad
ian
112
Kushi et al. [14] 34,486 7-year follow-up Dietary intake of Vitamin E intake was found Iowa Women’s Post-menopausal vitamins A, E and C to be protective against CAD.Health Study women aged from food sources and Vitamin C and A intake had
55–69 years supplements was no impact on CADevaluated with a questionnaire
Losonczy et al. 11,178 �8- to 9-year Vitamin E and C All cause mortality and CAD[24]a, EPESE aged 67–105 years follow-up supplements taken mortality was reduced in those
was determined by taking �-tocopherol vs. those medication and who were not. Simultaneous use supplementation of vitamin C and E was history associated with lower risk of
mortality
Gaziano et al. [25] 1,299 elderly Mean of 4.75 Dietary carotene intake Fatal myocardial infarction wasMassachusetts Massachusetts years follow-up was assessed with a lower among those who were inHealth Care residents who were food diary the highest quartile forPanel Study 66 years or older consumption of carotene-
containing food
Salonen et al. [26]a 944 men aged 4-year follow-up Plasma concentration of There was an inverse Kuopio Ischaemic 42–60 years �-tocopherol was association observed Heart Disease Risk measured between the �-tocopherol andFactor study the risk of developing
diabetes mellitus
Knekt et al. [27] 5,133 Finnish Longitudinal study Carotene, vitamins C and Inverse relationship betweenmen and women with a 14-year and E consumption dietary vitamin E and coronary aged 30–60 years follow-up were estimated by mortality was observed. Some
the dietary history inverse correlation of coronary
Table 1. (continued)
Study Study Study design Antioxidants assessed Results of studypopulation and follow-up
time

An
tioxidan
ts and
Diabetes
113
mortality for vitamin C and carotenoids was observed only in women
Rimm et al. [16] 39,910 US male 4-year follow-up Carotene, vitamins Higher intake of supplemental Health health professionals C and E assessed and possibly dietary vitamin EProfessionals Study 40–75 years of age with questionnaires was associated with a
significantly lower risk of CAD
Shoff et al. [28]a 2,152 participants Cross-sectional Intake of vitamins E, C and In people with diabetes noBeaver Dam Eye aged 43–84 years carotene was determined association between HbA1c and Study with dietary questionnaires vitamins E, C and �-carotene
intake was found
Stampfer et al. [15] 87,245 female 8-year follow-up Vitamins E, C and carotene Women who took vitamin E forNurses’ Health Study nurses aged intake assessed with more than 2 years were at
34–59 years questionnaires decreased risk of CAD
Enstrom et al. [17] 11,348 non- 10-year follow-up Vitamin C intake measured Inverse association betweenNHANES I institutionalized with food frequency and vitamin C intake and all cause
US adults aged supplement questionnaire mortality and CVD in males.25–74 years No definite relation between
vitamin C consumption andindividual cancers
Gey and Puska [29] Groups of about Cross-sectional Plasma levels of vitamins Plasma levels of vitamins E andIschemic heart 100 apparently A, C, E, �-carotene, and A were inversely related to thedisease in cross- healthy males aged selenium risk of ischemic heart diseasecultural epidemiology 40–49 years from
different regions ofEurope
Reproduced with some modifications from Hasanain and Mooradian [3].CAD � Coronary artery disease; CVD � cardiovascular disease; EPESE � Established Population for Epidemiologic Studies of
the Elderly; EVA � Etude du Vieillissement Arterial; HbA1c � hemoglobin A1c; IRAS � Insulin Resistance Atherosclerosis Study;NHANES � National Health and Nutrition Examination Survey; SLVD � San Luis Valley Diabetes Study.
aThese studies included a significant number of subjects with diabetes or insulin resistance.

Mooradian
114
the subjects with lower �- and �-carotene levels tended to be older and weresmoking more in comparison to those with higher plasma levels of �- and �-carotenes.
Other observational trials [20–33] are also listed in table 1.There are sev-eral well-known limitations of the epidemiological studies. Often the con-founding variables are difficult to identify to be able to make the necessarystatistical adjustments. Vitamin intake in these studies is usually determinedthrough notoriously unreliable food questionnaires and dietary recalls.Furthermore, it is also difficult to isolate the exact component of the diet thatmight have had an impact on a particular outcome.
Antioxidants and Disease Outcome: Interventional Trials
There are many small short-term interventional trials showing a highlyvariable effect of antioxidant supplementation on markers of oxidation, glu-cose disposal and vascular reactivity. Differences in study design, the typeand preparation of antioxidants used and lack of information as to the oxida-tive state of the population studied may explain some of the discrepancies inthe outcome of these studies. However, the true clinical role of antioxidanttherapy has to be evaluated in large randomized, double-blind and placebo-controlled studies.
Some of the larger interventional studies that have been published aresummarized in table 2. The outcomes of these studies are not always consis-tent. The Cambridge Heart Antioxidant Study (CHAOS) [34] and AntioxidantSupplementation in Atherosclerosis Prevention (ASAP) study [35] found abeneficial effect of vitamin E intake. The randomization of subjects in theCHAOS trial was fraught with problems, the number of events was small andthe follow-up interval was short. The study population in the ASAP trial mayhave been deficient in vitamin E at baseline, and therefore the results of thisstudy cannot be generalized to people with adequate vitamin E stores. In thisstudy, the progression of carotid atherosclerosis was reduced only in thegroup of men who were smokers and consumed both vitamin E (136 IU) andvitamin C (250 mg) daily [35]. It is likely that the smokers are under greateroxidative stress hence they benefited the most from the antioxidants. Thevalidity of the randomization and consumption of the vitamin supplements ineach group was confirmed by showing that the plasma levels of �-tocopheroland ascorbate were appropriately increased by approximately 50–90% inthose subjects who were randomized to receive the supplements [35].
Another trial showing the potential benefits of antioxidants was theNutrition intervention trials in Linxian, China [36]. In this trial 29,548 Chineseparticipants were assigned to one of following combinations of supplements:(a) retinol 5,000 IU � zinc 22.5 mg; (b) riboflavin 3.2 mg � niacin 40 mg; (c)ascorbic acid 120 mg � molybdenum 30 �g, or (d) �-carotene 15 mg � selenium

An
tioxidan
ts and
Diabetes
115
Table 2. Large clinical trials conducted to delineate the role of antioxidant vitamins in preventing disease states
Study Study Study design Antioxidants assessed Results of studypopulation and follow-up
de Gaetano et al. 4,495 Italians Randomized, Vitamin E 300 mg/day Vitamin E showed no benefit[43]a at risk of CVD placebo-controlledPrimary Prevention 3.6-year follow-upProject
Yusuf et al. [37]a 2,545 women Double-blinded, Vitamin E 400 IU/day Vitamin E showed no benefitHOPE trial 6,996 men randomized trial for a mean of 4.5 years
55 years or older with a two by twoat high risk of CVD factorial design
Salonen et al. [35] 520 men and Randomized, Subjects were given one The progression ofASAP postmenopausal double-blind, of the following treatments atherosclerosis was reduced in
women aged placebo-controlled, (a) 91 mg d-�-tocopherol male participants who were45–69 years 3-year follow-up (b) 250 mg slow-release smokers and were assigned to
vitamin C the combined treatment of(c) combination of above, or vitamin E and C(d) placebo
Lee et al. [44] 39,876 women Randomized, �-carotene 50 mg, There was no harm or benefitWomen’s Health aged 45 years or double-blind, vitamin E 600 IU, and demonstrated in the subjectsStudy older placebo-controlled. aspirin 100 mg given on receiving the �-carotene
Treated for 2.1 years alternate days either and followed for 2 alone or in various additional years combinations of the three
GISSI trial [38]a 11,324 Italian Randomized, Patients were assigned to Vitamin E conferred no GISSI-P patients surviving placebo-controlled, receive n-3 polyunsaturated significant benefit
recent (�3 months) with a 3.5-year fatty acid 1 g daily,MI follow-up vitamin E 300 mg daily,
both or none
Hennekens 22,071 male Randomized, �-carotene 50-mg tablets �-carotene had no adverseet al. [45] physicians double-blind, given on alternate days or beneficial effect even after

Moorad
ian
116
Physician Health aged 40–84 years placebo-controlled, 12 years of supplementationStudy I 12-year follow-up
Omenn et al. [41] 18,314 men and Randomized, Patients either received 30 mg There was no cardioprotective CARET women at high risk double-blind, of �-carotene and 25,000 IU effect of combination of
of lung cancer placebo-controlled retinal palmitate taken daily or �-carotene and vitamin A.trial placebo Increased incidence of lung
cancer was observed in patientson supplementation
Stephens et al. [34]a 2002 patients with Randomized, Patients either received 400 Participants receiving 400 IU butCHAOS angiographically double-blind, or 800 IU of vitamin E or not 800 IU vitamin E had a
proven coronary placebo-controlled placebo reduced rate of non-fatal MIatherosclerosis. with a 1.4-year
follow-up
ATBC trial [39] 29,133 male Randomized, �-tocopherol 50 mg/day and There was an increasedsmokers double-blind, �-carotene 20 mg/day, given incidence of lung cancer andaged 50–69 years placebo-controlled alone or in combination cardiovascular events observed
with 5–8 years in patients taking carotene.follow-up There was slightly more
incidence of hemorrhagic strokesin patients on vitamin E
Blot et al. [36] 29,584 Chinese Double-blind, Daily supplementation with Reduction in total mortality,Nutrition intervention participants randomized, one of the following: in cancer death and incidencetrials in Linxian, aged 40–69 years placebo-controlled, (a) Retinol 5,000 IU � especially for stomach cancerChina 5.4-year follow-up zinc 22.5 mg was seen in patients on the
Table 2. (continued)
Study Study Study design Antioxidants assessed Results of studypopulation and follow-up

An
tioxidan
ts and
Diabetes
117
(b) Riboflavin 3.2 mg � combination regimen ofniacin 40 mg �-carotene, selenium and
(c) Ascorbic acid 120 mg � �-tocopherolmolybdenum 30 �g
(d) �-carotene 15 mg �selenium 50 �g ��-tocopherol 30 mg
Lee et al. [46] 39,876 healthy Randomized, Vitamin E 600 IU and Vitamin E did not decrease Women’s Health women aged double blind, aspirin 100 mg given on risk of CHDStudy 45 years or older placebo-controlled, alternate days
2 2 factorial design, followed up for an average of 10.1 years
Reproduced with some modifications from Hasanain and Mooradian [3].ATBC � Alpha-Tocopherol Beta Carotene; ASAP � Antioxidant Supplementation in Atherosclerosis Prevention; CARET � Beta
Carotene and Retinol Efficacy Trial; CVD � cardiovascular disease; GISSI-P � Gruppo Italiano per lo Studio della Sopravivenzanell’Infarto miocardico-Prevenzione; MI � myocardial infarction.
a These studies included a significant number of subjects with diabetes or insulin resistance.
50 �g � �-tocopherol 30 mg. Supplementation with �-carotene, vitamin E,and selenium was associated with a significant reduction in mortality, mostlysecondary to the reduced rate of gastric cancers [36]. However, the subjectsin this study may have had some nutritional deficiencies at baseline. Anotherlimitation of the study is that the precise component of the antioxidant supple-ment that was responsible for the beneficial outcome could not be ascertained.It is possible that the combination of the three antioxidants synergized theantioxidant properties of each other.
Several other large randomized trials, such as the Heart OutcomesPrevention Evaluation (HOPE) study [37], the GISSI-P (Gruppo Italiano perlo Studio della Sopravivenza nell’Infarto miocardico-Prevenzione) trial [38]and the Alpha-Tocopherol, Beta Carotene Cancer Prevention (ATBC) study[39] and the Heart Protection trial (HPS) [40] failed to demonstrate any sig-nificant cardioprotective effect of vitamin E either alone or in combinationwith vitamin C and �-carotene. Of concern is that in the ATBC trial [39], therewas a greater incidence of lung cancer observed in a subset of men who weresmokers and who were taking vitamin A supplements. Similar observationswere made in the �-Carotene and Retinol Efficacy Trial (CARET) [41] wherethe incidence of lung cancer was increased in patients who were smokers orwho had a history of asbestos exposure and were on vitamin A supplementa-tion. These observations underscore the potential hazards of consuming largeamounts of antioxidants. It is also disconcerting that antioxidants such asvitamin C, vitamin E, �-carotene and selenium may hamper the beneficialeffects of simvastatin and niacin on lipid profile [42].
Additional interventional trials [43–46] are listed in table 2. The mostrecently published study is that of Women’s Health Study [46]. In this studyvitamin E supplements (600 mg every other day) did not protect healthy womenagainst heart attacks, stroke or cancer.
The preponderance of evidence in these interventional trials, unlike that ofthe observational trials, suggests that supplementation with conventionalantioxidants, notably vitamin E, does not reduce the risk of CVD. However,the outcome of interventional studies may vary depending on the baselinenutritional status of the study population. Furthermore increased consump-tion of vitamins does not always translate into effective absorption and avail-ability at critical cellular targets.
Antioxidant Supplementation: Pros and Cons
There are several misconceptions regarding the benefit of supplementingdiet with pharmacologic doses of antioxidants. A common misconception isthat overweight people are well fed and are not at risk for micronutrient defi-ciencies. The lay public is under the impression that since supplements arenatural products, they must be safe, and since they are available over the
Mooradian
118

Antioxidants and Diabetes
119
counter, they must have the approval of the government agencies. Many alsoerroneously believe that antioxidant supplementation will achieve healthbenefits when conventional therapies fail. The arguments in favor of andagainst use of antioxidant supplementation are summarized in table 3. Thefact that many, both in the industrialized world as well as in developing coun-tries, do not consume a balanced diet that contains fresh fruits and vegeta-bles, and the fact that antioxidants in small amounts appear to be safe,supplementation of the diet with modest amounts of conventional antioxi-dants may be justifiable. On the other hand, the fact that the body regulatesthe absorption and excretion of micronutrients, the concern about encourag-ing poor dietary habits and potential long-term toxicity and teratogenicity [3, 4],especially in certain groups of people, are arguments against routine supple-mentation of the diet with pharmacological doses of antioxidants.
In a recent meta-analysis of 7 randomized trials of vitamin E and 8 trials of�-carotene treatment concluded that at the present time there is no convinc-ing evidence for any beneficial effects of vitamin E or �-carotene on cardio-vascular morbidity and mortality [47]. In this analysis, �-carotene led to asmall but significant increase in all-cause mortality (7.4 vs. 7.0%, p � 0.003)and a slight increase in cardiovascular death (3.4 vs. 3.1%, p � 0.003) under-scoring the concerns about the indiscriminate use of antioxidants in healthmaintenance.
Conclusions and Recommendations
Diabetes mellitus is associated with increased tissue content of oxidationbyproducts and reduced antioxidant defense system. Hyperglycemia appears tobe a necessary and sufficient cause for inducing excessive production of ROS.
Epidemiological studies have shown a correlation between dietary or sup-plemental intake of antioxidants and the reduced incidence of CVD. Howeverinterventional studies using select antioxidant supplements have failed to
Table 3. The arguments for and against the use of antioxidant supplementation
For Against
(a) Many do not consume a balanced diet (a) Supplementation will encourageconsumption of a poor diet
(b) It may prevent heart disease, infection, (b) Body regulates micronutrientdiabetes and cancer absorption and excretion
(c) In small amounts it is harmless (c) The evidence for health benefits issmall if any, and often contradictory(e.g. �-carotene and lung cancer)
(d) No long-term toxicity data

show significant benefits from supplementation and in some studies thepotential for adverse outcomes has emerged. A common limitation in all the currently available interventional trials is the lack of measurements of theoxidative load of the study population, baseline micronutrient status and thelack of a marker of oxidation that can be monitored throughout the study toascertain the bioavailability and efficacy of the supplements tested. At thepresent time given the inconsistencies in the studies available, the wide-spread supplementation with pharmacological doses of antioxidants shouldbe discouraged. Future studies should focus on identifying reliable markers ofoxidation to incorporate these measurements in clinical interventional trials,and to further develop novel antioxidants that reduce oxidative burst insteadof functioning like conventional antioxidants that scavenge ROS after theyhave been produced.
References
1 Mooradian AD: Cardiovascular disease in type 2 diabetes mellitus: current managementguidelines. Arch Intern Med 2003;163:33–40.
2 Brownlee M: The pathobiology of diabetic complications: a unifying mechanism. Diabetes2005;54:1615–1625.
3 Hasanain B, Mooradian AD: Antioxidants and their influence in diabetes. Curr Diab Rep2002;2:448–456.
4 Hasnain B, Mooradian AD: Recent trials of antioxidant therapy: what should we be telling ourpatients? Cleve Clin J Med 2004;71:327–334.
5 Horani MH, Haas MJ, Mooradian AD: Rapid adaptive down regulation of oxidative burstinduced by high dextrose in human umbilical vein endothelial cells. Diabetes Res Clin Pract2004;66:7–12.
6 Haas MJ, Horani MH, Parseghian SA, Mooradian AD: Statins prevent dextrose-induced endothe-lial barrier dysfunction possibly through inhibition of superoxide formation. Diabetes 2006;55:474–479.
7 Horani MH, Haas MJ, Mooradian AD: Suppression of hyperglycemia-induced superoxide for-mation and endothelin-1 gene expression by carvedilol. Am J Ther 2006;213:2–7.
8 Jaiswal AK: Regulation of genes encoding NAD(P)H: quinone oxidoreductases. Free RadicBiol Med 2000;29:254–262.
9 Mooradian AD, Haas MJ, Wadud K: Ascorbic acid and �-tocopherol down regulateapolipoprotein AI gene expression in HepG2 and Caco–2 cell lines. Metab Clin Exp 2006;55:159–167.
10 Wehmeier KR, Mooradian AD: Autooxidative and antioxidative potential of simple carbohy-drates. Free Radic Biol Med 1994;17:83–86.
11 Mooradian AD: Micronutrients in diabetes mellitus; in Ioannides C, Flatt PR (eds): Drugs,Diet and Disease. Mechanistic Approaches to Diabetes. Englewood Cliffs, Prentice Hall, 1995,vol 2, pp 183–200.
12 Mooradian AD: Effect of ascorbate and dehydroascorbate on tissue uptake of glucose.Diabetes 1987;36:1001–1004.
13 Mooradian AD: The antioxidative potential of cerebral microvessels in experimental diabetesmellitus. Brain Res 1995;671:164–169.
14 Kushi LH, Folsom AR, Prineas RJ, et al: Dietary antioxidant vitamins and death from coronaryheart disease in postmenopausal women. N Engl J Med 1996;334:1156–1162.
15 Stampfer MJ, Hennekens CH, Manson JE, et al: Vitamin E consumption and the risk of coro-nary disease in women. N Engl J Med 1993;328:1444–1449.
16 Rimm EB, Stampfer MJ, Ascherio A, et al: Vitamin E consumption and the risk of coronaryheart disease in men. N Engl J Med 1993;328:1450–1456.
Mooradian
120
Antioxidants and Diabetes
121
17 Enstrom JE, Kanim LE, Klein MA: Vitamin C intake and mortality among a sample of theUnited States population. Epidemiology 1992;3:194–202.
18 Klipstein-Grobusch K, Geleijnse JM, den Breeijen JH, et al: Dietary antioxidants and risk ofmyocardial infarction in the elderly. The Rotterdam Study. Am J Clin Nutr 1999;69:261–266.
19 D’Odorico A, Martines D, Kiechl S, et al: High plasma levels of alpha- and beta-carotene areassociated with a lower risk of atherosclerosis: results from the Bruneck study. Atherosclerosis2000;153:231–239.
20 Dwyer JH, Paul-Labrador MJ, Fan J, et al: Progression of carotid intima-media thickness andplasma antioxidants: the Los Angeles Atherosclerosis Study. Arterioscler Thromb Vasc Biol2004;24:313–319.
21 Will JC, Ford ES, Bowman BA: Serum vitamin C concentrations and diabetes: findings fromthe Third National Health and Nutrition Examination Survey, 1988–1994. Am J Clin Nutr1999;70:49–52.
22 Mayer-Davis EJ, Bell RA, Reboussin BA, et al: Antioxidant nutrient intake and diabeticretinopathy: the San Luis Valley Diabetes Study. Ophthalmology 1998;105:2264–2270.
23 Ford ES, Will JC, Bowman BA, Narayan KMV: Diabetes mellitus and serum carotenoids: find-ings from the Third National Health and Nutrition Examination Survey. Am J Epidemiol1999;149:168–176.
24 Losonczy KG, Harris TB, Havlik RS: Vitamin E and vitamin C supplement use and risk of allcause and coronary heart disease mortality in older persons: the Established Population forEpidemiologic Studies of the Elderly. Am J Clin Nutr 1996;64:190–196.
25 Gaziano JM, Manson JE, Branch LG, et al: A prospective study of consumption of carotenoidsin fruits and vegetables and decreased cardiovascular mortality in the elderly. Ann Epidemiol1995;5:255–260.
26 Salonen JT, Nyyssonen K, Tuomainen TP, et al: Increased risk of non-insulin dependent dia-betes mellitus at low plasma vitamin E concentrations: a four year follow up study in men.BMJ 1995;311:1124–1127.
27 Knekt P, Reunanen A, Jarvinen R, et al: Antioxidant vitamin intake and coronary mortality ina longitudinal population study. Am J Epidemiol 1994;139:1180–1189.
28 Shoff SM, Mares-Perlman JA, Cruickshanks KJ, et al: Glycosylated hemoglobin concentra-tions and vitamin E, vitamin C, and beta carotene intake in diabetic and non-diabetic olderadults. Am J Clin Nutr 1993;58:412–416.
29 Gey KF, Puska P: Plasma vitamins E and A inversely correlated to mortality from ischemicheart disease in cross-cultural epidemiology. Ann NY Acad Sci 1989;570:268–282.
30 Coudray C, Roussel AM, Mainard F, et al: Lipid peroxidation level and antioxidant micronutri-ent status in a pre-aging population; correlation with chronic disease prevalence in a FrenchEpidemiological Study (Nantes, France). J Am Coll Nutr 1997;16:584–597.
31 Mayer-Davis EJ, Monaco JH, Marshall JA, et al: Vitamin C intake and cardiovascular disease riskfactors in persons with non-insulin-dependent diabetes mellitus. From the Insulin ResistanceAtherosclerosis Study and the San Luis Valley Diabetes Study. Prev Med 1997;26:277–283.
32 Sanchez-Lugo L, Mayer-Davis EJ, Howard G, et al: Insulin sensitivity and intake of vitamins Eand C in African, Hispanic, and non-Hispanic white men and women: the Insulin Resistanceand Atherosclerosis Study (IRAS). Am J Clin Nutr 1997;66:1224–1231.
33 Jacques PF, Taylor A, Hankinson SE, et al: Long-term vitamin C supplement use and preva-lence of early age related lens opacities. Am J Clin Nutr 1997;66:911–916.
34 Stephens NG, Parsons A, Schofield PM, et al: Randomized, controlled trial of vitamin E inpatients with coronary disease: Cambridge Heart Antioxidant Study. Lancet 1996;347:781–786.
35 Salonen JT, Nyyssonen K, Salonen R, et al: Antioxidant Supplementation in AtherosclerosisPrevention (ASAP) study: a randomized trial of the effect of vitamins E and C on 3-year pro-gression of carotid atherosclerosis. J Intern Med 2000;248:377–386.
36 Blot WJ, Li JY, Taylor PR, et al: Nutrition intervention trials in Linxian, China: supplementa-tion with specific vitamin/mineral combinations, cancer incidence, and disease specific mor-tality in the general population. J Natl Cancer Inst 1993;85:1483–1492.
37 Yusuf S, Dagenais G, Pogue J, et al: Vitamin E supplementation and cardiovascular events inhigh-risk patients. The Heart Outcomes Prevention Evaluation Study Investigators. N Engl JMed 2000;342:154–160.
38 GISSI-Prevenzione Investigators: Dietary supplements with n-3 poly unsaturated fatty acidsand vitamin E after myocardial infarction: results of the GISSI-Prevention Trial. Lancet1999;354:447–455.

39 The Alpha-Tocopherol, Beta Carotene Cancer Prevention Study Group: The effect of vitaminE and beta carotene on the incidence of lung cancer and other cancers in male smokers. NEngl J Med 1994;330:1029–1035.
40 Heart Protection Study Collaborative Group: MRC/BHF Heart Protection Study of antioxidantvitamin supplementation in 20,536 high-risk individuals: a randomized placebo-controlledtrial. Lancet 2002;360:23–33.
41 Omenn GS, Goodman GE, Thornquist MD, et al: Risk factors for lung cancer and for interven-tion effects in CARET: the Beta Carotene and Retinol Efficacy Trial. J Natl Cancer Inst1996;88:1550–1559.
42 Brown BG, Zhao XQ, Chait A, et al: Simvastatin and niacin, antioxidant vitamins, or the com-bination for the prevention of coronary disease. N Engl J Med 2001;345:1583–1592.
43 de Gaetano G, Collaborative Group of the Primary Prevention Project: Low dose aspirin andvitamin E in people at cardiovascular risk: a randomized trial in general practice. Lancet2001;357:89–95.
44 Lee IM, Cook NR, Manson JE, et al: Beta-carotene supplementation and incidence of cancerand cardiovascular disease: the Women’s Health Study. J Natl Cancer Inst 1999;91:2102–2106.
45 Hennekens CH, Buring JE, Manson JE, et al: Lack of effect of long-term supplementation withbeta carotene on the incidence of malignant neoplasms and cardiovascular disease. N Engl JMed 1996;334:1145–1149.
46 Lee IM, Cook NR, Gaziano JM, et al: Vitamin E in the primary prevention of cardiovasculardisease and cancer: the Women’s Health Study: a randomized controlled trial. JAMA 2005;294:56–65.
47 Vivekananthan DP, Penn MS, Sapp SK, et al: Use of antioxidant vitamins for the prevention ofcardiovascular disease: meta-analysis of randomized trials. Lancet 2003;361:2017–2023.
Discussion
Dr. Schiffrin: You have mentioned different antioxidants such as vitamin C andvitamin E. What about the status of other intracellular antioxidants such as glu-tathione? Is it possible that giving glutathione precursors, such as cysteine or proteinsrich in cysteine, can improve the glutathione cellular status? This is my first question.What about the administration of arginine? In fact arginine as a substrate of endothe-lial nitric oxide synthase and a precursor of nitric oxide may well modify the endothe-lial status. My last question is whether the redox status in diabetes in addition toaltering endothelial function could also have an influence on the immune system suchas the level of macrophage activation that in turn may increase the inflammatorystress in this type of patient. Is the glutathione status of these patients known?
Dr. Mooradian: Glutathione is a very important antioxidant and indeed there aresome studies showing that glutathione stores might be reduced in diabetes, especiallyin uncontrolled diabetes, but these are small studies. There are no studies showingthat interventions or replacement with glutathione or its substrates, precursors,would have an impact on any long-term outcome. But the clinicians in the room wouldknow that those intermediates have been used to protect the kidney from other dam-age during the administration of contrast agents and drug-related hepatic disease,which is another disease entity that involves oxidative stress. So at the moment theshort answer is that glutathione precursors are not involved or have not been used ininterventional trials to show any outcome measures. Your second question about argi-nine and endothelial nitric oxide synthase is interesting because it does have somebeneficial effects on endothelial cell function, but also remember that one of thesources of oxidative stress is nitric oxide and proteins are modified with nitric oxide.So there is a fine balance whether you are going to achieve a favorable effect withsupplementation or not. By the way arginine and a lot of biochemical molecules,including simple molecules such as creatinine or uric acid, all have very important
Mooradian
122

Antioxidants and Diabetes
123
antioxidant activity. In that sense it may have some additional effect as an antioxidant.Again, there are actually no interventional trials on the immune system andmacrophage activation, but there are experimental data on the role of macrophages inpromoting atherosclerosis, and obviously that is highlighted by the story on myeloper-oxidase as a key enzyme in promoting atherosclerosis. I am not aware of any interven-tional trial targeting myeloperoxidase to prevent premature atherosclerosis. Butprobably that will come eventually because it is a very hot area of investigation.
Dr. Halimi: Could you say some words regarding the zinc status, the tissue con-tents of zinc in human diabetic patients? With my group I did some studies on this topicin rats with insulin resistance induced by a high fructose diet. Zinc plasma and tissueconcentrations were found to be very low, furthermore zinc supplementation was ableto normalize insulin sensitivity in these animals. What is your opinion about the loss ofzinc in diabetic patients, perhaps in urine partly due to glycosuria, diuretics?
Dr. Mooradian: There is a lot of literature on the issue of zinc and as Dr. Halimimentioned, diabetic individuals, especially those with uncontrolled hyperglycemia andthose on diuretic therapy, tend to have excessive excretion of zinc in the urine. Butwhen the zinc stores are measured, be it in plasma or intracellularly as in white or redcells, it is highly variable; sometimes it is normal, sometimes it is high, sometimes it islow, so there is really no consistent effect. One of the reasons is that zinc metabolismis a good example of what I mentioned in terms of the organism protecting itselfagainst micronutrient deficiency. Once there are losses of zinc in the urine, the gutabsorption of zinc is multiplied, it increases several fold. Zinc absorption in diabeticindividuals is actually quite high for various reasons. One is that the transporters areupregulated, and also the intestinal mucosal area in diabetes, especially in uncon-trolled diabetes, is vastly expanded. They tend to absorb zinc much more efficientlythan an average individual; so even though they are losing zinc they are also absorbingzinc quite a bit, and therefore they may not have any zinc deficiency. The problemwith zinc deficiency or the determination of zinc deficiency is that we really don’t havereliable methods of measuring zinc. Certainly measuring the elemental zinc in plasmaor intracellular zinc may not be the best indicator. There are some new methods nowthat enable estimation of zinc status by measuring certain gene products that aremodulated by zinc, but again they have not really caught on in clinical practice. Zinc isan important element in terms of diabetes management, but it doesn’t seem that easyto produce zinc deficiency.
Dr. Eshki: Do you believe that controlling for upper levels or recommendedallowances on both macro- and micronutrients is essential before looking at specificoxidants and their effect on diabetes?
Dr. Mooradian: Are you asking about daily recommended intakes (DRIs) and thevariety of nomenclatures in that regard, whether it is recommended dietaryallowances or dietary guidelines and dietary recommended ranges? Your point was tofirst look at the dietary intakes and then see if supplementation on top is useful?
Dr. Eshki: The reason I am asking is because normally when dealing with traumapatients under stress, some physicians ask me why I don’t use zinc because they heardthat zinc is good at this point. What I tell them is that for me the optimal is to reach theDRI for the patient, and then look at other factors. But when we say, alright, start thisway, it is going to become more confusing because we are going to end up with a bagof supplements.
Dr. Mooradian: Yes, I understand what you are saying and I fully subscribe tothat. In terms of limiting supplementation or intake to the DRIs rather than tryinglarge amounts of micronutrients and supplements. I think at the moment that wouldbe the most rationale thing to recommend.
Dr. Tong: I noticed that a lot of dietary recommendations do suggest that patientswith cardiovascular disease increase their intake of vegetables and fruits. One of the

Mooradian
124
reasons is because it has been claimed that they can get antioxidant products fromvegetables and fruits. Are you aware of any study that has looked at the antioxidativecapacity in patients taking different proportions of vegetables or different amounts offruits?
Dr. Mooradian: Again the optimal way of getting antioxidants is to consume goodlooking and good tasting food, that would be vegetables and fruits, and I agree withthat recommendation. But in terms of evidence in interventional trials, we have thesame problems we were discussing this morning and yesterday that it is very hard toimplement an interventional trial with a dietary change and sustain that dietarychange over a prolonged period of time in a large number of individuals to be able toshow that a particular dietary intervention is effective. At the moment I suspect that itshould remain a commonsense approach, a consensus approach. I think people haveto emphasize the importance of acquiring antioxidants through dietary means andhealthy food choices. But it doesn’t mean that we should not be continuing to look foreffective antioxidants in pill form, and if it has any health protective effect that willobviously be a welcome addition to the diet.
Dr. Tong: Vitamin E, e.g. some antioxidants from vegetables or natural products,are they going to be different in terms of the isoforms compared to pharmaceuticalpreparations of vitamin E?
Dr. Mooradian: I suspect that it is probably true that the antioxidants in food aredifferent from the more purified elements that are available in pill form from the phar-maceutical industry. The antioxidants in food are very complex since a whole series ofcompounds has variable degrees of antioxidant activities but is a very rich mixture ofcompounds. When you select one compound as the candidate element to introduce asa supplement, you are at risk of either choosing the one that may not have as muchefficacy as the others when they are all in conjunction, or the one that may end uphaving some toxicity as well. I don’t want to discourage people from pursuing andlooking into specific components of the diet that have important antioxidant activitiesthat may be useful pharmaceutically.
Dr. Hill: The large epidemiological studies provide one way to look at this issue,but is anyone doing the clinical trials with fewer numbers of subjects and with morecontrol, where the oxidative state is measured with interventions such as withincreased fruit and vegetable consumption or supplements?
Dr. Mooradian: It should be done, but as yet it has not been done and that is themajor problem in the field. We have been doing study after study with very primitivetools and the results are not always reliable, so we need to have better clinical trialsdesigned.
Dr. Chiasson: All these interventional trials are definitely very disappointing andas a matter of fact there is only the CHAOS study, which is questionable as you men-tioned. You did mention that one of the problems is that the antioxidant capacity ofthe subjects was not measured. But do you really think that that is the problem? Whydo you think that all these interventional studies are totally negative?
Dr. Mooradian: I suspect that there are various potential reasons: one is that theright antioxidants are not being used, but conventional antioxidants are. As I men-tioned these are interceptors or scavengers rather than real agents that reduce oxida-tive stress. It is possible that perhaps the dosing is inadequate, as we have no ideawhat the appropriate dose will be for these conventional agents to have an effect onoxidative stress. The third potential limitation is that this is a process that takes yearsand years to develop, and these studies, usually in the range of 4, 5, 6 years, may notbe long enough to show the benefit of antioxidant supplementation. What really isneeded are studies that go on for 15, 20 years to see an effect. So that is a very difficultpoint to prove or disprove.

Antioxidants and Diabetes
125
Dr. Jianqin Sun: I have three questions. What is the role of the phytochemicalsubstances in antioxidative stress? There are many supplements in either a natural oran artificial form. Which do you think is better; is one better than the other? And thethird question, it is quite common that many people take supplements. Should supple-ments be taken for a long time or for a short time?
Dr. Mooradian: The first question is about phenols and naturally occurringantioxidants which are extremely important, there is no question about that, andthere are a lot of them. The question is are they effective in the long run: I really don’tknow. People have been promoting the use of phenol-containing products, and obvi-ously one of my favorite sources of that would be red wine. Again, there is no clear evi-dence though that it really makes a big difference. There is a lot of evidence inexperimental models in cell cultures preventing oxidation. The other issue of whetherthe antioxidant should come from natural sources or from pharmaceutical sources: Ireally don’t know the answer. My naïve thinking is that it should not make a difference.If you have an effective compound, whether it is packaged in the food or packaged ina pill, it should not make a difference. The problem is we don’t know what that effec-tive compound is, so that is where the problem arises. The third question about theduration of treatment is even more difficult. One of the criticism of these interven-tional trials is that they have not been long enough. So if I see people who are takingsupplements, what I do is to ask them to try to limit the supplements to within what Iconsider to be a reasonably safe margin. In other words if they are taking 1,000 mgvitamin E, I ask them to cut it back to less than 400 mg/day and negotiate a happymedium. The same with carotene and certainly with the retinol. Retinol certainlyshould not exceed 10,000 or even 8,000 units/day. This is especially an issue for womenof reproductive age because retinol in high concentrations is associated with signifi-cant teratogenicity. Those women who are taking supplements and planning a pregnancyhave to be careful to avoid that. They should be on folate and calcium supplements,possibly a little bit of iron supplementation, but not high concentrations of retinol.
Dr. Bantle: In North America the most commonly taken antioxidant supplement isvitamin E, As a participant in a physician’s health study, there is one chance in two Ipersonally am taking it. So I would like to ask what your thoughts are about the recentmeta-analysis suggesting that vitamin E may actually increase mortality rates.
Dr. Mooradian: You have raised a very important issue that mortality appears tobe increased with vitamin E use in this recent meta-analysis. Having said that, I have avery negative bias against meta-analyses in general. I have always said that meta-analysis is to analysis as metaphysics is to physics, and it is really very difficult to com-pile the data. I understand there are ways of improving your analysis if you are carefuland take all the factors into consideration. But nevertheless meta-analyses are likeobservational trials, they are very good in terms of generating hypotheses. Again itraises the spectra that perhaps indiscriminate use of antioxidants is not the wisestthing to do, and it brings to the forefront the potential that there might be some toxi-city involved with the use of very large doses of antioxidants. But I would not drop outof the study because of that meta-analysis; just continue taking your vitamin E, Iguess, if you are taking it already.


Dietary and Body Weight Control:Therapeutic Education, MotivationalInterviewing and Cognitive-BehavioralApproaches for Long-Term Weight LossMaintenance
Alain Golay
Service of Therapeutic Education for Chronic Diseases, Diabetes, Obesity, Department of Community Medicine, University Hospital of Geneva, Switzerland
AbstractA diet always induces weight loss in the short term. The loss does not depend on
the dietary composition but rather on the caloric deficit. However, a drastic diet ofteninduces binge eating disorders and can lead to a weight gain in the long term. A cognitive-behavioral-nutritional approach allows lasting weight loss and best results with low fat diets in the long term. Therapeutic education is a patient-centered humanisticapproach which allows patients to be actors in their own treatment and own diet toimprove their success in losing weight and their quality of life. Motivational interview-ing and cognitive-behavioral approaches are perfect complements to therapeutic edu-cation for long-term weight loss maintenance. Finally, the best diet is the one that thepatient can follow in the long term.
Copyright © 2006 Nestec Ltd., Vevey/S. Karger AG, Basel
Which Diet to Recommend? Low Carbohydrate or Low Fat?
Is the choice of diet really important? A number of controlled studies [1–3]have all proved the same effectiveness, when the caloric intakes are similar,with a balanced diet, a diet poor in carbohydrates and a dissociated diet, overa 6-week or 6-month period (fig. 1).
Over 24 weeks, Samaha et al. [4] compared low carbohydrate and low fat dietsin 132 obese patients with a body mass index of 43 kg/m2 and a high prevalence
Bantle JP, Slama G (eds): Nutritional Management of Diabetes Mellitus and Dysmetabolic Syndrome.Nestlé Nutr Workshop Ser Clin Perform Program, vol 11, pp 127–137,Nestec Ltd., Vevey/S. Karger AG, Basel, © 2006.
127

of diabetes (39%) or metabolic syndrome (43%). The patients in the low carbo-hydrate group (maximum 30 g carbohydrates/day) lost significantly more weight(p � 0.002) than those in the low fat group (500 kcal/day reduction of totalenergy intake, with a maximum of 30% fat/day). However, Samaha’s study wasthen supplemented by a follow-up of the same patients over 48 weeks [5]: no sig-nificant weight loss difference was found between the 2 groups (fig. 2), nor anylipid modification.
How to Maintain Weight Loss?
In the National Weight Control Registry in the United States [6], the main-tenance of a 5.5-kg weight loss over 5.5 years was achieved through the
Golay
128
7.8 � 0.5
kg
Balanced Dissociated
Weight loss
6.7 � 0.5
kg
Low in
carbohydrates 30%
Rich in fat 45%
Sufficient in protein 25%
Rich in
carbohydrates 45%
Low in fat 30%
Sufficient in protein 25%
Weight lossWeight loss
7.2 � 0.6
kg
Low
carbohydrates
Rich in
carbohydrates 45%
Low in fat 30%
Sufficient in protein 25%
Fig. 1. Diets of different compositions and weight loss. Adapted from Alford et al. [1]and Golay et al. [2].
0
�2
�4
�6
�8
�10
�12
0 6 12
Low fat
Low
carbohydrate
Weig
ht
loss (kg
)
Time (months)
Fig. 2. Low fat and low carbohydrate diets and weight loss. Adapted from Golay et al. [3] and Samaha et al. [4].

combination of a balanced diet and sustained physical activity (40 min/day).Another study [7] confirms that combining a diet and exercise is more effec-tive than dieting alone. Moreover, physical activity can equally help maintainthe weight lost [8, 9].
In addition, it is recognized today that diets poor in fats are more effectivein maintaining weight loss over a long period of time [10]. On the contrary, adiet rich in fat induces overconsumption and weight gain through a feeling ofnon-satiety and the highly caloric content of fats [11].
Overall, patients who have undertaken repeated diets quickly regain thekilos they have lost. When facing the yo-yo phenomenon, eating disordersshould be investigated. This is associated with a feeling of restriction, nibblingor compulsions, and has the effect of making patients feel guilty and reducingtheir self-esteem. Behavioral work, combined with a hypocaloric diet and a pro-gram of physical activity, allows weight loss to be maintained [12]. It involvesonly a small loss of weight but helps alleviate eating disorders, depression andanxiety. A prospective study with a 5-year follow-up [13] confirms that thismultidisciplinary approach is entirely beneficial in the long term. Fifty per-cent of patients maintained their weight loss, and even continued to loseweight. Lately, Wadden et al. [14] confirmed that the combination of medica-tion and group lifestyle modification resulted in more weight loss than eithermedication or lifestyle modification alone.
In conclusion, there is no miracle diet, whatever the current fashion wouldhave us believe. The best diet is one that the patient can follow in the longterm. Therefore, it is necessary to draw up dietary advice which is adapted tothe individual, combined where possible with teaching about physical activityand, perhaps, cognitive-behavioral therapy. It is important to rule out dietswhich are too strict and restrictive if we are to avoid eating disorders andweight regain. However, the 3F formula – Fat-Free and Fit – is known to bethe most effective approach in the long term for all our patients.
Therapeutic Patient Education to Improve
Diet Compliance
Therapeutic education is a ‘patient-centered’ humanistic approach whichnot only allows patients to be actors in their own treatment and diet toimprove their quality of life and success in losing weight, but also to reducepotential complications.
Therapeutic education of obese and diabetic patients has been carried outsuccessfully for a number of years [13–16]. Its efficiency has been demon-strated on a number of occasions and it has been adapted to other chronic illnesses such as chronic bronchopneumopathy [17], sleep apnea syndrome[18, 19], cardiovascular illnesses [20], etc. This branch of medicine assumed a
Diet and Obesity
129

definite identity with the publication of the first official definition in a WHOexpert report [21].
Can Therapeutic Patient Education be Therapeutic?
The first effect of therapeutic education (fig. 3) is an improvement inpatients’ quality of life. Healthcare professionals too often tend to forget this;their overriding aim is to improve therapeutic compliance and reduce compli-cations. With therapeutic education, an 80% reduction in amputations linkedto diabetes has been observed [22].
Increasing patients’ knowledge is not the only function of therapeutic edu-cation; in fact, its main aim is to make them aware of their problem (whetherthis involves diagnosis or risk factors) so that they take these notions onboard and act more closely on the doctor’s recommendations. That is whenthe doctor’s teaching becomes ‘therapeutic’; not only does he/she increasepatients’ knowledge and improve his/her quality of life, but he/she guidesthem through the long-term treatment of their problem. Thus, the patientsbecome co-therapists.
Therapeutic education not only aims to increase patients’ skills and knowl-edge, but also to modify their behavior in the long term. Furthermore, itspedagogical approaches are complemented by psychosocial models and bycognitive-behavioral type psychological approaches [12]. For more than 10 years
Golay
130
Patient
centered
Transmit
Negotiate
Share
the decision
Motivate
Therapeutic patient education
Knowledge
Skills
Behavior
Reinforce
success
Use
errors
Work on
relapses
Fig. 3. Therapeutic patient education.

now, these psycho-pedagogical approaches have contributed to a clearimprovement in the effectiveness of therapeutic education [23].
Therapeutic Patient Education of Obese Patients
Much of our experience has come through the treatment of type-2 diabeticpatients suffering from obesity [24]. More than 80% of our type-2 diabeticpatients are overweight, very often due to dietary behavior of a binge-eatingdisorder. The usual nutritional approach is insufficient, since even ideal teach-ing of dietary knowledge, and the fat contents of foods does not bring about alasting loss of weight. Even multiplying the number of practical teaching exer-cises on food management, shopping habits, slimming recipes, etc., only bringsa very slight improvement in long-term results. The cognitive-behavioralapproach has allowed us to make a great step forward in our interdisciplinaryapproach and to maintain behavioral changes in the long term [12, 24, 25].
The cognitive-behavioral approach is above all interested in the mechanismsbehind the triggers of binges and emotions, as well as automatic negativethoughts (I’m no good, ugly, incapable). The final step of what is called a func-tional analysis (fig. 4) of a binge episode consists of helping patients to findtheir own strategies and evaluate the positive consequences arising from them.
The functional analysis (fig. 4) of a food binge allows patients to break thevicious circle. For example: frustration at work (trigger) associated withanger (emotion) and negative thought, such as ‘I’m silly to let myself be
Diet and Obesity
131
Food binge
Anger
I’m not good
incapable
Trigger
Frustration
at work
Weight gain
decompensate
the diabetes
Guilt
Automatic negative
thought
Emotion
Behavior
Consequences
Fig. 4. Food binges – the vicious circle.

insulted’, will induce a binge disorder as usual strategy: ‘I get stuck into foodas soon as I get home’. Finally, the consequences of this vicious circle areweight gain, bad glycemic control, a lot of guilt, and even more frustration.
By analyzing the flow from trigger to consequence, patients will gain a bet-ter understanding of the underlying mechanisms involved. They will moveprogressively from a vicious circle into a virtuous circle (fig. 5). For example,frustration at work will be reduced by patients learning to be more assertive,to say no politely, to step back, to express their emotions, etc. Expressedemotions will grow less painful and thoughts will become less negative.Meanwhile, replacement strategies for binges will be found which will becomeboth rewarding and pleasurable. As a result, food binges will decrease in num-ber. Finally, the consequences for quality of life and biological results willbecome more tangible and increasingly felt by the patient.
How to Motivate Patients
Too often, poor adherence to treatment is due to the lack of motivation.This is very easy to say, but it is very difficult for healthcare professionals toput themselves in question and realize that they are also partly responsiblefor patients’ poor compliance! A motivational interview requires certainpsycho-pedagogical skills which Miller and Rollnick [26] have proposed anddescribed in full. In addition, clearly defined principles as well as an appropri-ate attitude and techniques exist for these motivational interviews.
Golay
132
Replacement
pleasure
Less anger
Less negative
Trigger
Frustration
at work reduced by stress
management, negotiation
and self-affirmation
Loss of weight
stabilized diabetes
less guilt
Thought
Emotion
Behavior
Consequences
Fig. 5. The virtuous circle following treatment.

Motivational Interviewing
Motivational interviewing to change a behavior can be used in all therapeu-tic situations where motivation is central to the change process and whereambivalence exists. Firstly, Miller and Rollnick [26] insist that this interview isa ‘way of being’ with patients and not a varied collection of psychologicaltechniques used to get people to do what they do not want to. The interviewaims at exploring patients’ ambivalence in a semi-structured and nonjudg-mental manner. During the motivational interviewing, healthcare profession-als select information through reflective listening, use the dissonance in theconversation and facilitate change.
As such, the principles of the motivational interviewing are above all aRogerian-type [27] empathic communication which aims to help elaboratepatients’ discrepancies and reinforce their feelings of personal efficacy.Another interesting principle involved here is that of rolling with patients’resistance when they are ambivalent.
A typical ambivalence in our obese patients is that they do not follow theirdietary plan when they know perfectly well what they have to do to loseweight. Hence, a discrepancy occurs between a value and behavior. Theobjective of healthcare professionals is to bring patients to consider anotherpoint of view and therefore become actors in their own decision-making:‘What is the least they can change at the lowest psychological cost and great-est benefit?’ A major principle involved in motivational interviewing is rein-forcing patients’ personal efficacy and increasing their faith in change.
In conclusion, therapeutic education is a patient-centered humanisticapproach which allows patients to be actors in their own treatment, toimprove their quality of life, their success of weight loss and reduce the risk ofpotential complications. The motivational interviewing and cognitive behav-ioral approaches are perfect complements to therapeutic education for long-term weight loss maintenance.
References
1 Alford BB, Blankenship AC, Hagen RD: The effects of variations in carbohydrate, protein andfat content of the diet upon weight loss, blood values and nutrient intake of adult obesewomen. Am J Diet Assoc 1990;90:534–540.
2 Golay A, Allaz AF, Morel Y, et al: Similar weight loss with low or high-carbohydrate diet. Am JClin Nutr 1996;63:174–178.
3 Golay A, Allaz AF, Ybarra J, et al: Similar weight loss with low-energy food combining or bal-ancing diets. Int J Obes 2000;24:492–496.
4 Samaha FF, Iqbal N, Seshadri P, et al: A low-carbohydrate as compared with a low-fat diet insevere obesity. N Engl J Med 2003;348:2074–2081.
5 Stern L, Iqbal N, Seshadri P, et al: The effects of low-carbohydrate versus conventional weightloss diets in elderly obese adults. Ann Intern Med 2004;140:778–785.
6 Klem ML, Wing RR, McGuire MT, et al: A descriptive study of individuals successful at long-term maintenance of substantial weight loss. Am J Clin Nutr 1997;66:239–246.
Diet and Obesity
133

7 Clinical Guidelines on the Identification, Evaluation and Treatment of Overweight andObesity in Adults – the Evidence Report. Obes Res 1998;6(suppl 2):51S–209S.
8 Meyers AW, Graves TJ, Whelan JP, et al: An evaluation of television-delivered behavioralweight loss program: are the ratings acceptable. J Consult Clin Psychol 1996;64:172–178.
9 Pavlou KN, Krey S, Steffee W: Exercise as an adjunct to weight loss and maintenance in mod-erately obese subjects. Am J Clin Nutr 1989;49:1115–1123.
10 Klem ML, Wing RR, McGuire MT, et al: A descriptive study of individuals successful at long-term maintenance of substantial weight loss. Am J Clin Nutr 1997;66:239–246.
11 Golay A, Bobbioni E: The role of dietary fat in obesity. Int J Obes Relat Metab Disord1997;21(suppl 3):S2–S11.
12 Fossati M, Amati F, Painot D, et al: Cognitive-behavioral therapy with simultaneous nutri-tional and physical activity education in obese patients with binge eating disorder. EatingWeight Disord 2004;9:134–138.
13 Golay A, Buclin S, Ybarra J, et al: New interdisciplinary cognitive-behavioral-nutritionalapproach to obesity treatment: a 5-year follow-up study. Eating Weight Disord 2004;9:29–34.
14 Wadden TA, Berkowitz RI, Womble FG, et al: Randomized trial of lifestyle modification andpharmacotherapy for obesity. N Engl J Med 2005;353:2111–2120.
15 Golay A, Bloise D, Maldonato A: The education of people with diabetes; in Pickup J, Williams G(eds): Textbook of Diabetes, ed 2. Oxford, Blackwell, 2002, chapt. 38, pp 1–13.
16 Maldonato A, Segal P, Golay A: The diabetes education study group and its activities toimprove the education of people with diabetes in Europe. Patient Educ Couns 2001;44:87–97.
17 Bourbeau J, Julien M, Maltais F, et al: Reduction of hospital utilization in patients with chronicobstructive pulmonary disease: a disease-specific self-management intervention. Arch InternMed 2003;163:585–591.
18 Engleman HM, Wild MR: Improving CPAP use by patients with the sleep apnea/hypopneasyndrome (SAHS). Sleep Med Rev 2003;7:81–99.
19 Golay A, Girard A, Grandin S, et al: A new educational program for patients suffering fromsleep apnea syndrome. Patient Educ Couns 2005, in press.
20 Eriksson S, Kaati G, Bygren LO: Personal resources, motives and patient education leading tochanges in cardiovascular risk factors. Patient Educ Couns 1998;34:159–168.
21 WHO Regional Office for Europe: Therapeutic Patient Education, Continuing EducationPrograms for Healthcare Providers in the Field of Prevention of Chronic Diseases. Report of aWHO Working Group. Copenhagen, WHO, 1998.
22 Assal JP, Albeanu A, Peter-Riesch B, et al: The cost of training a diabetic patient: effects onprevention of amputation. Diab Metab 1993;19:491–495.
23 Giordan A, Golay A, Jacquemet S, et al: Communication thérapeutique. L’impact d’un mes-sage dans le processus d’apprendre. Psychothérapies 1996;16:189–193.
24 Golay A, Volery M, Rieker A, et al: Approche cognitivo-comportementale; in Basdevant A,Guy-Grand B (eds): Médecine de l’obésité. Paris, Médecine-Sciences Flammarion, 2004, pp 246–252.
25 Fossati M, Rieker A, Golay A: Thérapie cognitive en groupe de l’estime de soi chez des patientsobèses, un nouvel outil: la fleur de l’estime. J Thér Comportement Cogn 2004;14:29–34.
26 Miller W, Rollnick S: Motivational Interviewing: Preparing People for Change, ed 2. New York,Guilford Press, 2002.
27 Rogers C: Counseling and Psychotherapy: Newer Concept in Practice. Boston, HoughtonMiffling, 1957.
Discussion
Dr. Chiasson: I would like to come back to the sympathetic nervous systemresponse. It is very interesting because it is one of the reasons why when an extremelylow diet is used it doesn’t work. What is the mechanism; how is that regulated? How doyou measure that, and what do you think is the problem with the autonomous nervoussystem?
Golay
134

Dr. Golay: We have two different techniques. The first one is laser Doppler meas-urement of the microvascular in the finger and the second one is heart rate monitor-ing. We have 24-hour heart rate monitoring with a spectral analysis. For the secondquestion, the reason for this unbalance is the many questions behind it. It is knownthat the sympathetic nervous system is higher in obese patients. Thus, obese patientscannot further increase their system, and then they have no possibility of increasingtheir fat oxidation. So we have many hypotheses behind this; we are also measuringdifferent hormones. A new one is apelin which can connect the periphery and theheart and perhaps the brain. But this is a new area and is quite interesting.
Dr. Katsilambros: I would like to make a comment on the question of Dr. Chiasson.We also had the possibility of measuring heart rate variability in obese and non-obesepeople under different circumstances. In the last years we have published some papersshowing that after a meal the activation of the heart sympathetic nervous system is dif-ferent depending on whether a person is obese or non-obese. If a person is obese theactivation of the heart sympathetic nervous system is low as compared to a lean controlperson. In addition, if obese and lean people are given fat meals, you observe that theydo not react at all, but there is a very slow and nonsignificant increase in the heart sym-pathetic activity. But if you give an isoenergetic carbohydrate meal to these personsthen there is a clear-cut activation of the heart sympathetic activity in the lean peoplewhich, however, is not present in the obese people.
Dr. Golay: I know your studies and we are doing the same thing. Carbohydrate andproteins are very important for increasing the sympathetic nervous system, but this isnot the case for fat. It is even worse with saturated fat. And as we discussed before,n-3 and n-6 are very much better for increasing the sympathetic nervous system. Sothe key answer is in the fat content of the diet.
Dr. T. Wilkin: Can I clarify in relation to spectral analysis? Is it a feature of obesityor is it a feature of insulin resistance that variability is lost? In other words, are thereindividuals who have a distribution of body fat which is not cause of insulin resistance?
Dr. Golay: It is an interesting question. I am a diabetologist and the first measure-ment I made was in diabetic patients. However, in insulin-resistant patients, we alsofound a defect. Now we are looking at children from obese patients and I cannot givethe data today, but my feeling is that it is probably before insulin resistance or dia-betes. Today, it is only a hypothesis.
Dr. Zhao: We know that in general vegetarian animals are less aggressive thanmeat-eating species. So I am just curious if there could be a relationship between thefood consumed and the emotional and behavioral responses. So my question is, arethere any papers available to show this association?
Dr. Golay: I totally agree with you but I don’t have any data showing that hypoth-esis. We are smiling about this but it is probably true, especially with high sugar.Patients are probably more active and more excited if they are more sugar free. Butwe need a lot of research in this field. I am sure nutrition is related to emotion, per-haps to depression, etc.; when you have a lack of tryptophan you have a lack of sero-tonin and then depression. In some studies we have tried to improve the tryptophanintake, and to decrease other proteins. The humor and depression are improved andespecially also sugar craving. So a lot of research is needed in this field. Nutrition is acompletely open field of research.
Dr. Hill: I have two questions about your energy economy concept. First it wasdone in bariatric patients and there is a lot of speculation that with the surgery you getsome changes in the gut hormones which in fact can affect metabolism. Have youfound the same results in weight loss produced without bariatric surgery? And thesecond question is that it looks as though after a year the expected and the actualenergy expenditure are the same, suggesting that the energy economy may be moreimportant for weight loss, not so much for weight loss maintenance.
Diet and Obesity
135

Dr. Golay: You are totally right. As to the second question, the energy economy ismuch smaller at the beginning, and after a weight loss program it is around 200 cal.When you lose weight you also decrease your total energy expenditure so the energyeconomy at that time for weight maintenance is even more crucial and important. Asto your first question, of course we were looking for a normal body weight loss pro-gram and we had the same type of results. However, it is more difficult because thevariation is bigger. With the bypass weight loss program, we are quite confident withour results from this type of surgical operation. We have at least the same size of stom-ach and almost the same size of meals, and thus the variation is smaller. One questionstill remains open: ghrelin suppression after this type of bypass.
Dr. T. Wilkin: One of the observations of that energy economy is the reduced con-version peripherally of thyroxin to triiodothyronine, from T4 to T3, which can be quitea striking change for a period of time. Is there any therapeutic potentially possible andadvantageous intervention to prevent that occurring?
Dr. Golay: Concerning the first comment, it is probably true that the conversionbetween T4 and T3 is one of the reasons. The second reason is also thermogenesispathways. What the treatment should be is difficult to say at this time, but definitelynot thyroid hormones. We need different studies with leptin replacement. The leptinconcentration really drops during a weight loss program in this kind of economyphase, but we were not successful. We have other possibilities, but we have to under-stand that weight loss during the first months is almost the same for everybody, butthe difference is between 3 and 12 months for the second phase, the slow phase. Andphysical exercise is crucial in this phase.
Dr. Ott: I have a question regarding Singapore. As you know Singapore performsnutritional surveys at regular intervals to assess the health status of its population. Asa result of this, using television, radio and so on, they recommend consuming fourservings of fruits and vegetables per day and physical exercise. They also implementschool programs. Do we have any evidence that this kind of activity is effective? Ibelieve the prevalence of diabetes is low in Singapore. Do you have any data?
Dr. Golay: In fact, we are doing this kind of program in Geneva today. There aremany dieticians in schools, so every teenager can receive this kind of advice, which ispart of the program now in schools. We are also trying to have a program for physicalexercise paid for by the government. The results are not yet known but I am quite con-fident that it is the right way to go because we have to start as early as possible. Justbefore we were talking about economy. We published two papers recently on economyin Switzerland [1, 2]. 98% of our costs for obese patients are due to complications; wepaid only 1.5–2% for an obesity program, which is really nothing. We publishedanother paper where we were looking for the effect of weight loss in diabetic patients[3]. We pooled some data with Swedish friends and were able to prove that EUR14,000/patient/year is saved when a diabetic patient loses 9 kg. It costs a huge amountof money to treat diabetes, myocardial infarctions and all these kind of complications.
Dr. Haschke: I am not familiar with the situation in Asia but in Germany the samerecommendation has been on the table for several years; i.e. to eat 4–5 servings of veg-etables and fruits per day. Two years ago there was the first big population survey onpublic awareness of the recommendation, how people feel about it, and how theyadhere to it. The awareness was very high; 80% of the population knew of this recom-mendation, but only 5% adhered to it. So I cannot comment on the Asian populationsbut in Germany it is rather difficult to move forward. Perhaps the recommendationsshould be phrased in a different way.
Dr. Golay: This is exactly what we think. The information is not enough, we shoulddo more than that. We need really to implement behavior courses. Everybody knowsthat it is very difficult to put into practice. It is like smoking, if you have a lot of people
Golay
136

smoking around you, you are more prone to smoke and it is difficult to stop. So I thinkwe need time, we need more publicity, we are fighting against big companies likeMcDonalds and Coca Cola.
Dr. Wuersch: Can you comment on your experience with the low glycemic indexfoods in your treatments?
Dr. Golay: There was a big discussion yesterday. For me, the low glycemic index isa good tool, at least for diabetic patients. However, today we are more convinced thatit is also helping satiety, and by giving snacks to our obese patients suffering frombinge eating disorders (allowed snacks, not nibbling), it is working very well forsatiety. When a snack is given they eat less at the next meal. This is important to havea structure for your meals.
Dr. L. Wilkin: I want to talk about children for a moment. I am wondering whetherit is easier or harder for children to maintain a healthy weight than adults. Perhapsthere are a fewer children with so-called eating disorders, binge eating and so on, butmaybe children are more susceptible to our obesogenic environment. Would you liketo comment?
Dr. Golay: It depends on age. For teenagers I think it is easier because you can puta teenager in a certain position to be against the parents, to eat differently from theirparents, so it is much easier. But for children, they eat in the family so we need tochange the eating habits and behavior of a child with the whole family. That is why weneed to go for nutrition courses in school, and to bring the parents into this kind ofcourse. But I know it is a very difficult task.
Dr. Eshki: Weight loss programs and weight loss studies have been focusing on theefficacy of the diet alone and not on the safety of the diet. The safety parameters I amreferring to are the daily recommended intakes. Don’t you think this missing marginmay have big effects on the results of your study and other similar studies in the long-term?
Dr. Golay: The safety of a diet for me is the amount of protein, and first you shouldhave enough protein. You can find very strange diets without any proteins and thepatients lose lean body mass. In terms of safety, restrictive diets should not be given.
Dr. Eshki: When you are talking about protein, and it is used a lot, and you want toreduce or increase it, you can’t ignore the calcium intake for instance because it couldcause osteoporosis in the future. So what I am trying to say is that we should not takea narrow view but try to look at the micronutrients also. That is what I mean by safety.
Dr. Golay: For the last 5 years we have been doing some studies on micronutri-ents. I think it is a really interesting field. In obese patients I always found a deficit foroligo elements, for vitamins, for different types of fats. And one of our suggestionstoday is to supplement n-3. I think in the near future we will have to be more carefulwith the composition of the diet, especially in diabetes.
References
1 Schmid A, Schneider H, Golay A, Keller U: Economic burden of obesity and its comorbiditiesin Switzerland. Soz Praventivmed 2005;50:87–94.
2 Ruof J, Golay A, Berne C, et al: Orlistat in responding obese type 2 diabetic patients: meta-analysis findings and cost-effectiveness as rationales for reimbursement in Sweden andSwitzerland. Int J Obes (Lond) 2005;29:517–523.
3 Golay A, Ybarra J: Link between obesity and type 2 diabetes. Best Pract Res Clin EndocrinolMetab 2005;19:649–663.
Diet and Obesity
137


The Accelerator Hypothesis: A Unifying Explanation for Type-1 and Type-2 Diabetes
Terence J. Wilkin
Department of Medicine, Postgraduate Medical School, Derriford Hospital, Plymouth, UK
AbstractDespite 30 years of research, the cause of type-1 diabetes remains unknown.
Meanwhile, its incidence has risen three-fold, its clinical features have become increas-ingly difficult to distinguish from type-2 diabetes and the contribution of genes to itspathogenesis has changed. The accelerator hypothesis argues that type-1 and type-2
diabetes are the same disorder of insulin resistance set against different genetic
backgrounds. It identifies three processes which variably accelerate � cell loss: consti-tution, insulin resistance and the immune response to it. None of the accelerators leadsto diabetes in the absence of weight gain, a trend which the hypothesis deems centralto the rising incidence of all diabetes in the industrially developed and developingworld. Weight gain causes an increase in insulin resistance, which results in the weak-ening of glucose control. The rising blood glucose accelerates � cell apoptosis (gluco-toxicity) and, by increasing � cell immunogenicity, further accelerates apoptosis in asubset genetically predisposed to an intense immune response. Rather than overlapbetween the two types of diabetes, the accelerator hypothesis envisages overlay – onea subset of the other. Body mass is central to the development and rising incidence ofall diabetes. Only tempo distinguishes type 1 from type 2. The control of weight gain,and with it insulin resistance, could be the means of preventing both by slowing theirprogression.
Copyright © 2006 Nestec Ltd., Vevey/S. Karger AG, Basel
Introduction
In the mid 1960s, the Belgian histopathologist Gepts [1] first describedlymphocytes infiltrating the islets of children who died within a few days of
Bantle JP, Slama G (eds): Nutritional Management of Diabetes Mellitus and Dysmetabolic Syndrome.Nestlé Nutr Workshop Ser Clin Perform Program, vol 11, pp 139–153,Nestec Ltd., Vevey/S. Karger AG, Basel, © 2006.
139
Diabetes in the Life Cycle

developing diabetes. In 1974, Nerup et al. [2] found an association betweenchildhood diabetes and the immune response or HLA genes on the short armof chromosome 6. That same year, Bottazzo et al. [3] reported the presence ofantibodies to the islet cells in blood samples from people with insulin-dependentdiabetes.
Together, these observations prompted a radical revision in the under-standing of diabetes. The prevailing model of diabetes as a single disorder thatcould present either in childhood (juvenile onset) or later in life (adult onset)was replaced by a classification that clearly distinguished type-2 diabetes(then almost exclusively a disorder of later adulthood) from type-1 diabetes.Type 1 became known as autoimmune diabetes, caused by a dysregulatedimmune system that attacks, and ultimately destroys, the � cells.
The past three decades have seen an exponential rise in the incidence ofdiabetes – most noticeably of type 2, owing to the greater numbers involved,but also of type-1 diabetes. While type-2 diabetes is widely understood to belinked to obesity and the insulin resistance it causes, the rise in type 1 has notbeen satisfactorily explained.
The Issue
Diabetes is of two types, or so the textbooks say. Type-1 diabetes is anautoimmune disorder of childhood, characterized by acute onset, ketoacido-sis and insulin dependency. Type 2 is a metabolic disorder of middle life, slowin onset and non-insulin-dependent.
Once again, the definitions of diabetes need urgent revision. Nowadays,more than half of patients with type-1 diabetes present in adulthood [4], whentheir onset is slow and many neither develop acidosis nor require insulin formany years. Type-2 diabetes occurs in teenagers [5], sometimes with ketoaci-dosis [6], and insulin dependency frequently ensues given time. Clinically,there is little other than tempo to distinguish two types of diabetes.
The Hypothesis
The accelerator hypothesis argues that type-1 and type-2 diabetes are the
same disorder of insulin resistance, set against different genetic back-
grounds [7]. The first accelerator – a constitutionally (intrinsically) high rate of� cell apoptosis during life [8] – is necessary for diabetes to develop, but seldomin itself sufficient to cause it. It reflects natural variation within the population.
Insulin resistance, the second accelerator, is acquired largely from weightgain and physical inactivity. It further increases the rate of � cell apoptosisthrough glucotoxicity and lipotoxicity [9, 10]. However, those who developtype-1 diabetes are members of the same population as those who develop
Wilkin
140

type 2, exposed to the same obesogenic environment. A subset with bothintrinsic susceptibility and insulin resistance – those with genes that programa particularly intense immune response to the upregulated islets – develops �cell autoimmunity, the third accelerator. The hypothesis views autoimmunityas a response to insulin resistance, rather than the cause of the diabetes – aninflammatory response within the � cells, whose intensity is associated withsignificant collateral damage. The glucagon-secreting � cells are sparedbecause they are metabolically downregulated in hyperglycemia, rather thanupregulated.
The author has argued, like others before him [11], that the immune sys-tem evolved originally as a ‘housekeeper’, programmed to phagocytose thedetritus of natural cell death [12]. It retains that primordial function. Fromthis perspective, autoimmunity will be antigen-driven and specific, its inten-sity responsive to the rate of apoptosis (antigenic load) and modulated bygenetic influences. The issues of self-tolerance and its abrogation, which havealways made it difficult conceptually to reconcile autoimmunity with a normalimmune system, are not at issue where clones expand appropriately to removeapoptotic bodies. Antibodies in this context are classic immunological adaptors.They link the specific subparticulate molecules to be cleared to nonspecific Fcreceptors of phagocytic neutrophils, which in turn engulf the complex anddispose of it through the reticuloendothelial system [13].
Insulin dependency is the end stage towards which all diabetes moves, therate dependent on the accelerators present, and the notions of type 1 andtype 2, insulin- and non-insulin-dependent, are consequently artificial. Thedevelopment of diabetes is just a matter of time, and tempo is the only featurethat distinguishes one type from another. Of the three accelerators, the first isintrinsic and others acquired. Insulin resistance, the second accelerator, isassociated with visceral fat mass and is widely believed to explain the epi-demic rise of type-2 diabetes in the industrially developed world [14]. Theaccelerator hypothesis argues that visceral weight gain is also central to type-1diabetes, as much responsible for its rising incidence as for that of type 2, andthe environmental factor in type-1 diabetes that has eluded epidemiology forso long.
The concept of an etiological link between the two types of diabetes is notnew, and has been suggested before [15], but the evidence is now stronger.Rather than overlap between the two types of diabetes, the accelerator hypoth-esis envisages overlay. Type-1 diabetes is the same as type 2 except for oneessential add-on: intense immune response.
Pathophysiology of Diabetes
Type-1 diabetes is associated with autoantibodies and activated lympho-cytes which are reactive with � cell antigens [16]. Its course is characterized
The Accelerator Hypothesis
141

by a symptomless prediabetic phase whose presence can be inferred fromimmune markers. Pre-type-1 diabetes is a period of accelerated � cell loss,whose tempo varies from acute in those who present young to subacute orchronic in those who present later in life [17]. The differences in tempo areassumed to be under genetic control, since those who develop type-1 dia-betes in childhood tend to carry more intensely responsive HLA genes thanthose who develop it later in life [18, 19]. � cell autoimmunity appears to startearly in life, insofar as immune markers predictive of future diabetes can bepresent as early as at 9 months of age [20].
Type-2 diabetes is characterised by a combination of insulin resistance anddefective insulin response that results from it [21]. Blood insulin concentra-tions are raised, at least initially, but are never sufficient to meet the resist-ance that entrains them. Like type-1, type-2 diabetes also presents after avariable period of prediabetes, whose presence might be revealed by highfasting insulin/glucose ratios and later by glycosuria or hyperglycemia in cir-cumstances which temporarily increase insulin resistance – typically preg-nancy, thyrotoxicosis or a course of anti-inflammatory steroids. Between 17and 63% of women whose glycosuria during pregnancy is attributable to glu-cose intolerance will subsequently become diabetic, depending on the seriesquoted [22]. Of these, a proportion (around 20% according to one study [23])will develop type-1 diabetes, underscoring the principle to be established herethat the prediabetes of type 1 and type 2 differs only in tempo, not in out-come. Both represent a period of accelerated � cell loss.
It has long been recognized that islet cells are both metabolically andimmunogenically upregulated when functionally stressed by a rising bloodsugar [24]. At whatever age it emerges, insulin resistance could be expectedto increase � cell stress, and to intensify an immune response in those whoare genetically predisposed. The phenomenon of insulin resistance, which asthe response to progressively rising body weight has been largely responsiblefor reducing the age at presentation of type-2 diabetes over recent time,might be doing just the same for type-1 diabetes by promoting the immuno-logical accelerants of � cell death in a progressively younger age group. Ifthere is little clinically to distinguish the two types of diabetes nowadays,there is little fundamentally either.
Insulin Resistance
Many theories have sought to account for insulin resistance. The thrifty
genotype hypothesis argues for gene selection against muscle proteolysisduring an evolutionary history of recurring famine [25, 26]. In contrast, thethrifty phenotype hypothesis [27], which first described an associationbetween low birth weight and insulin resistance, explains the link as a gesta-tional programming of the fetus in response to poor maternal nutrition. More
Wilkin
142

recently, the fetal insulin hypothesis has cited observations in families withmaturity onset diabetes of the young to illustrate the dependence of fetalgrowth on the genetics of fetal and maternal insulin secretion [28]. It predictsthat a gene or combination of genes responsible for insulin resistance will befound which leads both to low weight at birth through insulin resistance andto glucose intolerance later in life (fig. 1).
There is a common theme to all three hypotheses: insulin resistance,which might arguably have favored survival in times of famine, leaves many intoday’s ‘coke and burger’ culture unable to control their blood sugar. None ofthe theories, however, estimates how much of today’s diabetes (the attributa-ble proportion) can be accounted for by congenital insulin resistance alreadypresent at birth, nor explains the rising incidence of type-2 diabetes which,according to the logic of all three hypotheses, should by now be stable orfalling as nutrition in pregnancy improves and gene selection operates toselect out the less fit. Insulin resistance acquired through lifestyle change ismore likely than genes or gestational experience to underlie the recent rise indiabetes and its ever-younger presentation.
Importantly for the hypothesis, glucose clamp studies 20 years ago showedthat noninsulinized adults with type-1 diabetes were as insulin resistant asmetabolic diabetics of comparable glucose tolerance [29] and there has beenfurther evidence recently. Furthermore, the rise in proinsulin/insulin ratio thathas long been the hallmark of insulin resistance in pre-type-2 diabetes hasbeen shown to characterize pre-type-1 diabetes as well [30]. Most seroposi-tive type-2 diabetic adults become type 1 more rapidly than those who are
The Accelerator Hypothesis
143
Incid
ence p
er
10
0,0
00
27
26
24
22
20
18
16
14
12
10
8
6
4
2
0
1968 1970 1972 1974 1976 1978 1980
Age-standardized annual incidence
of type 1 diabetes from 1968 to 1993
Year
1982 1984 1986 1988 1990 1992
Male
Female
Fig. 1. Scottish Study Group for the Care of Young Diabetics. One of many studiesshowing the progressive rise in incidence of type-1 diabetes over the past generation.

seronegative [31] and these observations together provide robust support forthe ‘overlay’ and ‘accelerator’ concepts. The slower tempo of progression inadults has thus provided the means of demonstrating that all diabetes is asso-ciated with insulin resistance (the second accelerator), that a subgroupadvances more rapidly to insulin dependency as a result of autoimmunity(the third accelerator), and that (by implication) this subgroup, had it beenfree of autoimmunity, would have progressed to diabetes in any case, albeit ata later date.
Susceptibility and Risk
Type-2 diabetes is prevalent in industrially developed societies. It affectsup to 30% of some populations [32], suggesting that susceptibility to diabetesis common, though not universal, in as much as some of those apparently atgreatest risk – the pathologically obese – never develop the disease.
The probability of developing a multifactorial disorder such as diabetes ismade up of genetic susceptibility and environmental risk. Both contribute a pro-portion to the probability and, if one rises, the other must inevitably fall. If therising incidence of type-1 diabetes has been the result of rising environmentalrisk (obesity and insulin resistance), the genetic contribution must have fallen.
Concordance among monozygotic twin pairs is widely believed to reflectthe genetic contribution to probability, and lies at around 75% in type-2 dia-betes (rising to 95% if those with glucose intolerance alone are included) [33]but only 20% in type 1 [34]. At least, that was historically the case. Recentdata from the Danish twin registry suggests that concordance for type-1 dia-betes in monozygotic twins is now around 50–60%, and no different fromdizygotic twins [35].
Evidence for the rising environmental risk for type-1 diabetes comes froma study in the South of England which shows a progressive rise in body massindex (BMI) at diagnosis over the past 20 years [36]. The hypothesis predictstwo outcomes of the corresponding fall in contribution from HLA genes –convergence of the clinical phenotype and loss of the difference in concor-dance rates between identical and nonidentical twins noted above.
The Epidemiology of Diabetes
Over the past 20 years, the incidence of type-2 diabetes in the westernworld has increased dramatically, a pattern that parallels closely the risingincidence of obesity and (by implication) that of insulin resistance [37].Furthermore, age at presentation has been falling, such that the incidence oftype-2 diabetes in American adolescents has increased 10-fold and inJapanese school children 36-fold within a generation [38]. Rather strikingly,
Wilkin
144

the same pattern of increasing incidence and younger age at presentation hasoccurred for type-1 diabetes over the same time period.
Several studies in Europe show a doubling in incidence of type-1 diabetesover the last generation, with a clear shift of presentation to younger agegroups [39, 40] although the data are largely restricted to children and ado-lescents. The incidence of type-1 diabetes has been highest around puberty inall populations studied [41, 42]. The earlier peak in girls is consistent withtheir earlier maturation [43]. The association between type-1 diabetes andpuberty has never been satisfactorily explained, but may once again be anexpression of insulin resistance. The hormonal changes of puberty (particu-larly the rise in growth hormone) place demands on insulin production thatalready damaged islets may be unable to meet. Again, BMI rises rapidly dur-ing puberty, and with it insulin resistance [44] (fig. 2).
If this latter were the correct explanation, the accelerator hypothesiswould predict a correspondingly earlier presentation of diabetes as the BMIpreviously associated with puberty is reached at a progressively younger age.Tuomilehto et al. [45] have reported how, over recent years, the age-at-onsetcurve for diabetes has risen to include most of early childhood, all but losingits peripubertal peak. Others have shown independently that weight gainearly in childhood is associated with a higher risk of early type-1 diabetes[46, 47] and the same appears to be true for type-2 [2]. Most recently, theChildhood Diabetes in Finland Study Group has reported that a relative
The Accelerator Hypothesis
145
�4
�3
�2
�1
0
1
2
3
4
5
1978 1980 1982 1984 1986 1988 1990 1992 1994 1996 1998 2000 2002 2004
Year
BM
I S
D s
co
re a
t d
iag
no
sis
Boys
Girls
Fig. 2. Evidence for the progressive rise in insulin resistance (body mass) deemedby the accelerator hypothesis to be the environmental trigger for type-1 diabetes[from 36].

weight in childhood of �120% is associated with a more than 2-fold greaterrisk of developing type-1 diabetes [48]. These observations provide importantsupport for the hypothesis. They point to a central role for body mass, and byimplication for insulin resistance in the development of type-1 as well as type-2diabetes.
More importantly still, there are now two full length reports to indicatethat, within a population with type-1 diabetes, the heaviest children developtype-1 diabetes the youngest – true acceleration [36, 39] (fig. 3).
Body Mass: The Elusive ‘Trigger’ of Type-1 Diabetes
If the rising incidence and earlier presentation of diabetes were to beexplained by an ever heavier population at all ages, weight gain would have asmuch a role in the changes of demography of type-1 diabetes as it does in thatof type 2. Ascribing the rising incidence of type-1 diabetes to metabolic,rather than to immunological, factors has novel and important implications.Clinical research over the past 30 years has focused almost exclusively onexogenous factors (viruses, toxins, allergens) deemed able to initiate, facili-tate or intensify autoimmune damage to the � cell. Although many have beenproposed [49], none has been confirmed. The prevalence of obesity mean-while has trebled. Insulin resistance, resulting from a combination of obesityand physical inactivity, is a serious candidate for the ‘elusive’ environmentalfactor responsible for the rising incidence of type-1 diabetes and, as such, atrue accelerator.
Wilkin
146
BM
I S
D s
co
re a
t d
iag
no
sis
�6
mo
nth
s
Age at diagnosis (years)
0
5
4
3
2
1
0
�1
�2
�3
1 2 3 4 5 6 7 8 9 10 11 12
r�0.3, p�0.001
13 14 15 16
Boys
Girls
Fig. 3. The relationship between body mass and age at onset of diabetes in anunselected group of children with type-1 diabetes; the fatter child develops type-1diabetes younger – true acceleration [from 36].

The rise in incidence of diabetes in ‘westernized’ countries over recenttime has occurred over a period too brief for changes in the gene pool to exertan influence. Similarly, there is no evidence of falling birth weight over thesame period to suggest a deterioration in fetal quality and attendant risk ofinsulin resistance, as the fetal origins hypothesis proposes – indeed, birthweights have risen. More likely, it is the progressive increase in body weightafter birth, with the rising prevalence of obesity at all ages over the past 30 ormore years, which is responsible. Most importantly, epidemiological observa-tion suggests that the progressive rise in type-1 diabetes only began in themiddle of the 20th century, the time after the end of the Second World Warwhen modern wealth and lifestyles started to involve populations rather thanmerely individuals [50].
The accelerator hypothesis at its simplest can be reduced to the unfavor-able interplay of two phenomena: insulin resistance and accelerated � cellapoptosis. Apoptosis occurs throughout life at a variable rate, but is intrinsi-cally higher in those who are susceptible to diabetes. Many people of normalbody mass, despite intrinsically more rapid � cell apoptosis, never developglucose intolerance because insulin secretory reserve remains sufficient insuch circumstances to maintain control of blood glucose concentrations.However, insulin resistance – whether present at birth or acquired throughthe accumulation of visceral fat during life – makes demands on insulin secre-tion that in some cannot be met.
Immune damage of the � cells is an additional accelerator, restricted bygenotype to small and independent minorities of the intrinsically diabetes-susceptible and nonsusceptible populations alike. At its most aggressive, theso-called autoimmunity might be sufficient to cause diabetes of itself, thoughan accelerator different from insulin resistance would be needed to accountfor the increase in apoptosis which provokes it. The hypothesis predicts thatin older patients, where � cell autoreactivity is less aggressive, those withislet cell autoimmunity most likely to develop diabetes will already have thediabetic phenotype – a low � cell mass and high insulin resistance. Those whodo not might be expected to remain seropositive but healthy, to succumb onlyas and when the intrinsic � cell mass wanes and/or insulin resistance riseswith the corpulence of advancing age.
Tempo, and tempo alone, it is argued, distinguishes what in the past havebeen viewed as two separate types of diabetes. The three phases in the pro-gression to overt diabetes – prediabetes, chemical diabetes and clinical dia-betes can all be identified in both types, differing only (though sometimessubstantially) in their relative duration. Not to take account of these phasesand their differences in tempo will make it conceptually difficult to regard asequivalent two diabetic states where insulin is needed from the outset in one,but only (if ever) after a long period of clinical diabetes in the other. The require-ment for insulin in both cases is nevertheless reached at exactly correspon-ding points in the progression of prediabetes [19]. All people with diabetes
The Accelerator Hypothesis
147

move towards this point of insulin dependence – some very quickly, othersperhaps not in a lifetime.
A hypothesis postulating body mass as a primary risk factor in the etiology oftype-1, as well as type-2, diabetes is novel, but eminently testable. Ultimately, it will be necessary to establish whether strategies to reduce the secondaccelerator (insulin resistance) in those at risk from type-1 diabetes, throughweight loss, metformin, or one of the new thiazolidinediones [51], is paralleledby a deceleration in the third – autoimmune damage to the � cells. The notionthat type 1 could represent merely the accelerated development of type-2diabetes is important if it implies that strategies currently on trial to suppressthe immunological accelerator of type-1 diabetes (e.g. anti-CD3 [52, 53])leave unchanged the insulin resistance which provoked it. The control ofweight gain, and with it insulin resistance, could be the fundamental means ofaverting both.
References
1 Gepts W: Pathologic anatomy of the pancreas in juvenile diabetes mellitus. Diabetes 1965;14:619–633.
2 Nerup J, Platz P, Anderssen OO: HLA antigens and diabetes mellitus. Lancet 1974;ii:864–866.3 Bottazzo GF, Florin-Christensen A, Doniach D: Islet-cell antibodies in diabetes mellitus with
autoimmune polyendocrine deficiencies. Lancet 1974;ii:1279–1283.4 Molbak AG, Christau B, Marner B, et al: Incidence of insulin-dependent diabetes in age
groups over 30 years in Denmark. Diabet Med 1994;11:650–655.5 Rosenbloom AL, Joe JR, Young RS, Winter WE: Emerging epidemic of type 2 diabetes in
youth. Diabetes Care 1999;22:345–354.6 Aizawa T, Funase Y, Katakura M, et al: Ketosis-onset diabetes in young adults with subse-
quent non-insulin-dependency, a link between IDDM and NIDDM? Diabet Med 1997;14:989–991.
7 Wilkin TJ: The accelerator hypothesis: weight gain as the missing link between type I andtype II diabetes. Diabetologia 2001;44:914–922.
8 Mauricio D, Mandrup-Poulsen T: Apoptosis and the pathogenesis of IDDM: a question of lifeand death. Diabetes 1998;47:537–543.
9 Maedler K, Donath MY: Beta-cells in type 2 diabetes: a loss of function and mass. Horm Res2004;62(suppl 3):67–73.
10 Robertson RP, Harmon J, Tran PO, Poitout V: Beta-cell glucose toxicity, lipotoxicity, andchronic oxidative stress in type 2 diabetes. Diabetes 2004;53(suppl 1):S119–S124.
11 Grabar P: Autoantibodies and the physiological role of immunoglobulins. Immunol Today1983;4:337–340.
12 Wilkin TJ: Autoimmunity: attack or defence? Autoimmunity 1989;3:57–73.13 Roitt I, Brostoff J, Male D: Immunology. London, Churchill Livingstone, 1995, pp 1.5–1.6.14 Zimmet P: Globalization, coca-colonization and the chronic disease epidemic: can the
Doomsday scenario be averted? J Intern Med 2000;247:301–310.15 Wilkin TJ: Early nutrition and diabetes mellitus (editorial). Br Med J 1992;306:283–284.16 Atkinson MA, Maclaren NK: The pathogenesis of insulin-dependent diabetes mellitus. N Engl
J Med 1994;331:1428–1436.17 Eisenbarth GS, Gianani R, Yu L, et al: Dual-parameter model for prediction of type I diabetes
mellitus. Proc Assoc Am Phys 1998;110:126–135.18 Demaine AG, Hibberd ML, Mangles D, Millward BA: A new marker in the HLA class I region is
associated with the age at onset of IDDM. Diabetologia 1995;38:623–628.19 Caillat-Zucman S, Garchon HJ, Timsit J, et al: Age-dependent HLA genetic heterogeneity of
type 1 insulin-dependent diabetes mellitus. J Clin Invest 1992;90:2242–2250.
Wilkin
148

20 Ziegler AG, Hummel M, Schenker M, Bonifacio E: Autoantibody appearance and risk fordevelopment of childhood diabetes in offspring of parents with type 1 diabetes: the 2-yearanalysis of the German BABYDIAB Study. Diabetes 1999;48:460–468.
21 Turner RC, Holman RR, Matthews DR, Peto J: Relative contributions of insulin deficiency andinsulin resistance in maturity-onset diabetes. Lancet 1982;i:596–598.
22 Kjos SL, Buchanan TA: Gestational diabetes mellitus. N Engl J Med 1999;341:1749–1756.23 Damm P, Kuhl C, Buschard K, et al: Prevalence and predictive value of islet cell anti-
bodies and insulin autoantibodies in women with gestational diabetes. Diabet Med 1994;11:558–563.
24 Bjork E, Kampe O, Karlsson FA, et al: Glucose regulation of the autoantigen GAD65 in humanpancreatic islets. J Clin Endocrinol Metab 1992;75:574–576.
25 Neel JV: Diabetes mellitus: a ‘thrifty’ genoype rendered detrimental by ‘progress’? Am J HumGenet 1962;14:353–362.
26 Reaven GM: Hypothesis: muscle insulin resistance is the (‘not so’) thrifty genotype. Diabetologia1998;41:482–484.
27 Hales CN, Barker DJP: Type 2 (non insulin-dependent) diabetes: the thrifty phenotypehypothesis. Diabetologia 1992;35:595–601.
28 Hattersley AT, Tooke JE: The fetal insulin hypothesis: an alternative explanation of the asso-ciation of low birth weight with diabetes and vascular disease. Lancet 1999;353:1789–1792.
29 Gray RS, Borsey DQ, Irvine WJ, et al: Non-insulin-treated ICA positive diabetics are equallyinsulin-resistant. Diabetes Metab 1983;9:292–296.
30 Rodriguez-Villar C, Conget I, Casamitjana R, et al: High proinsulin levels in late pre-IDDMstage. Diabetes Res Clin Pract 1997;37:145–148.
31 Turner R, Stratton I, Horton V, et al: UKPDS 25: autoantibodies to islet-cell cytoplasm andglutamic acid carboxylase for prediction of insulin requirement in type 2 diabetes. UKProspective Diabetes Study Group. Lancet 1997;350:1288–1293.
32 Zimmet PZ, McCarty DJ, de Courten MP: The global epidemiology of non-insulin-dependentdiabetes mellitus and the metabolic syndrome. J Diabetes Complications 1997;11:60–68.
33 Medici F, Hawa M, Ianari A, et al: Concordance rate for type 2 diabetes mellitus in monozy-gotic twins: an actuarial analysis. Diabetologia 1999;42:146–150.
34 Kaprio J, Tuomilehto J, Koskenvuo M, et al: Concordance for type 1 (insulin-dependent) andtype 2 (non-insulin-dependent) diabetes mellitus in a population-based cohort of twins inFinland. Diabetologia 1992;35:1060–1067.
35 Kyvik KO: Concordance for diabetes in 2–20 year old twins. Diabetologia 2004;47(suppl 1):A112.36 Betts P, Mulligan J, Ward P, et al: Increasing body weight predicts the earlier onset of insulin-
dependent diabetes in childhood: testing the ‘accelerator hypothesis’ (2). Diabet Med2005;22:144–151.
37 National Task Force on the Prevention and Treatment of Obesity: overweight, obesity, andhealth risk. Arch Intern Med 2000;160:898–904.
38 Kitagawa T, Owada M, Urakami T, Yamauchi K: Increased incidence of non-insulin dependentdiabetes mellitus among Japanese schoolchildren correlates with an increased intake of ani-mal protein and fat. Clin Pediatr (Phila) 1998;37:111–115.
39 Onkamo P, Vaananen S, Karvonen M, Tuomilehto J: Worldwide increase of type 1 diabetes –analysis of the data on published incidence trends. Diabetologia 1999;42:1395–1403.
40 Zhao HX, Stenhouse E, Soper C, et al: Incidence of childhood-onset type 1 diabetes mellitusin Devon and Cornwall, England, 1975–1996. Diabet Med 1999;16:1030–1035.
41 Akerblom HK, Reunanen A: The epidemiology of insulin-dependent diabetes mellitus (IDDM)in Finland and in northern Europe. Diabetes Care 1985;8(suppl 1):10–16.
42 Staines A, Bodansky HJ, Lilley HE, et al: The epidemiology of diabetes mellitus in the UnitedKingdom: the Yorkshire Regional Childhood Diabetes Register. Diabetologia 1993;36:1282–1287.
43 Staines A, Bodansky HJ, Lilley HE, et al: The epidemiology of diabetes mellitus in the United Kingdom: the Yorkshire Regional Childhood Diabetes Register. Diabetologia 1993;36:1282–1287.
44 Moran A, Jacobs DR Jr, Steinberger J, et al: Insulin resistance during puberty: results fromclamp studies in 357 children. Diabetes 1999;48:2039–2044.
45 Tuomilehto J, Virtala E, Karvonen M, et al: Increase in incidence of insulin-dependent dia-betes mellitus among children in Finland. J Epidemiol 1995;24:984–992.
The Accelerator Hypothesis
149

46 Johansson C, Samuelsson U, Ludvigsson J: A high weight gain in early life is associated with anincreased risk of type 1 (insulin-dependent) diabetes mellitus. Diabetologia 1994;37:91–94.
47 Hypponen E, Kenward MG, Virtanen SM, et al: Infant feeding, early weight gain and risk oftype 1 diabetes. Childhood Diabetes in Finland (DiME) Study Group. Diabetes Care 1999;22:1961–1965.
48 Hypponen E, Virtanen SM, Kenward MG, et al: Obesity, increased linear growth, and risk oftype 1 diabetes in children. Childhood Diabetes in Finland Study Group. Diabetes Care2000;23:1755–1760.
49 Dahlquist G: The aetiology of type 1 diabetes: an epidemiological perspective. Acta PaediatrSuppl 1998;425:5–10.
50 Gale EA: The rise of childhood type 1 diabetes in the 20th century. Diabetes 2002;51:3353–3361.
51 Day C: Thiazolidinediones. Diabet Med 1999;16:179–192.52 Harlan DM, von Herrath M: Immune intervention with anti-CD3 in diabetes. Nat Med
2005;11:716–718.53 Herold KC, Gitelman SE, Masharani U, et al: A single course of anti-CD3 monoclonal antibody
hOKT3gamma1(Ala-Ala) results in improvement in C-peptide responses and clinical parame-ters for at least 2 years after onset of type 1 diabetes. Diabetes 2005;54:1763–1769.
Discussion
Dr. Eshki: Thank you for this very informative presentation. I have witnessed thecondition in the neonatal intensive care unit in which infants develop diabetesbecause they have been given diets inappropriate for their age. There are several stud-ies looking at infant diet and type-1 diabetes [1, 2]. Does your theory cover such fac-tors?
Dr. T. Wilkin: Insulin resistance is a post receptor defect, and the child who growsup to become a type-1 child lives in exactly the same obesogenic environment as achild who grows up to become a type-2 individual. We tended to think of two separatepopulations, type-2 insulin resistance, type-1 autoimmune, but they live in the sameobesogenic world. They have exactly the same experiences which lead to increasedinsulin resistance. There is no reason to believe that there would be a different insulinresistance in the type-1 than there would be in the type-2 individual.
Dr. Eshki: It is just because insulin is formed in a different area than the insulinreceptors, that is what I was looking at. So maybe the formation of insulin receptorscould also be a factor where perhaps in some cases it is not well enough formed forthem to provide the insulin available.
Dr. T. Wilkin: I think current understanding would lead us to the argument thatinsulin resistance is indeed a post-receptor issue.
Dr. Chiasson: It is a very provocative and interesting hypothesis. I agree that it isinteresting that perhaps with a different paradigm we will approach the prevention oftype-1 differently, and we may be able to delay the development of type-1 diabetes, beit type-1 or type-2. Now in type-2 diabetes insulin resistance is mostly an environmen-tally induced factor. It is very likely, yet it still has to be proven, that the major geneticdefect in type-2 is the �-cell, maybe the �-cell mass or the �-cell susceptibility towhatever environmental factor, obesity, decreased physical activity, and insulin resist-ance. Now the fact that insulin resistance or obesity or both, because usually one cor-relates with the other, would tend to increase or accelerate the development of type-1in subjects susceptible for type-1 is not unexpected because the �-cells are understrain. If they have whatever the problem at the �-cell level then obesity would accel-erate, would increase the stress on the �-cell. So to me, the insulin resistance per sewill accelerate both type-1 and type-2, but that doesn’t necessarily mean that the
Wilkin
150

problem at the �-cell level is the same. As you said, correlations are always interestingbut do not prove a cause and effect relationship. So I challenge the hypothesis.
Dr. T. Wilkin: I think what we will always find that the individual who is moreimmune-susceptible, that is to say whose HLA genes instruct a more reactiveresponse, will always present first. The accelerator hypothesis I see as revolvingaround a gradient of �-cell loss, which we are all subject to. Most of us live our livesand �-cell loss is never sufficient to cause us diabetes. From that point on there areaccelerators. One of those accelerators, as I think we agree, is insulin resistance whichhas mechanisms which are increasingly being understood. The second of these, whichis my accelerator number 3, is the immune response which is graded according toimmune response genes. Now I believe all that is doing is to accelerate the rate, so thatof a group of individuals who is going to get diabetes, those in whom it is most accel-erated, will inevitably be children, and those in whom it is least accelerated may welldie before it ever happens. I don’t look outside that paradigm for an answer at themoment because I think that insulin resistance is driving both the non-immune andthe immune component of �-cell damage.
Dr. Chiasson: I am not an immunologist, but I understand that the HLA genes arenot diabetic genes. There are a number of genes that have been identified, butwhether it is in the same area, I don’t know. The genes themselves as well as the anti-bodies that we are looking at do not necessarily cover everything. That must be leftopen. Also in type-2, there are going to be a number of genes related to the �-cellfunction as well as perhaps insulin action. At least in the prevention studies that wehave done so far, the only thing that we have been able to modify is the insulin action,insulin sensitivity, not �-cell function.
Dr. T. Wilkin: Are you talking of type-2 prevention studies, or type-1?Dr. Chiasson: Type-1 would most likely be the same. At the present time I don’t
think that in type-1 we have any tools that can help us to modify the susceptibility ofthe �-cell, assuming that it is different than the susceptibility in type-2. We don’t haveany data one way or the other, but it is clear to me that they are susceptible, pheno-typically they are different. As a matter of fact Dr. Slama told me that a lean type-2 isa type-1 who is ignoring himself. So more and more we find antibodies in those leantype-2 individuals, and they evolve differently over time, and the insulin resistance isdifferent. The insulin resistance in type-1 exists; it does not compare to type-2.
Dr. T. Wilkin: Again I would answer by saying that you have two fundamental con-tributors to the probability of disease, one of them is insulin resistance and one ofthem is HLA genetic. In order to develop diabetes you would need to have a higherinsulin resistance if you don’t have the genetic contribution. In type-1 diabetes youwould need less insulin resistance to have the same effect because you have the helpof the third accelerator which is the immune response.
Dr. Slama: I found your hypothesis very clever. I accept your hypothesis thatthere are some accelerators in the phenomenon. But I have two arguments. First of allyou have also to show not only that the patients are a bit overweight as compared tonormal but they do have insulin resistance. When insulin resistance has been studiedby glucose clamp in type-1 diabetics it was found that it is really insulin resistance atthe beginning where the blood glucose is very high but declining to normal veryquickly when blood glucose is normalized, making this phenomenon an acceleratorbut not a causal factor. My second argument: if you try to find out if there is vitaminB12 deficiency in a large population, you will find a prevalence of X. Then in the samecommunity there will be iron deficiency, much more anemia in this population, andthe more iron deficiency the less you will find a role for autoimmune disease in thiscommunity. Does that mean that the disease is the same as iron deficiency, of coursenot. When you say that genetics is decreasing, it is decreasing relatively but in
The Accelerator Hypothesis
151

absolute value it does not change. So I accept your hypothesis of the accelerator, but Ido not accept that because the accelerator might be verified that the original diseasehas disappeared.
Dr. T. Wilkin: Let me take the first question. I would give the same response as Idid to Dr. Chiasson, that the amount of the insulin resistance you would require todevelop a diabetes is going to be less if the contribution that it makes is helped by animmune accelerator being present as well. The second question is an interesting onebecause your implication is that even though childhood diabetes is increasing, and itundoubtedly is, you will always have conventional type-1 diabetes because in absoluteterms it has not changed. I actually don’t agree with that, I think you will lose the phe-notype of a type-1 diabetic because I think he will become overweight, acanthotic,seropositive, T-cell reactive and quite impossible to distinguish from what we knownow as a type-2. I think there will be a convergence because the slim type-1 diabetic,as we have known him in the past, is now obese.
Dr. Slama: How can you say so when you say you will find T-cell activation andyou will not be able to separate them? There is T-cell stimulation, so they are different.Perhaps our tools are not fine enough to distinguish this very well, but it doesn’t meanthat it doesn’t exist.
Dr. T. Wilkin: There is T-cell stimulation for both groups now which there wasn’tpreviously. We never knew type-2 diabetes in childhood 30 years ago. The real evi-dence comes from the slide that I showed twice in which there is a secular rise in theweight at diagnosis of children who are labeled type-1, and that has been linear sincethe 1980s. The variance at each time point is much the same, the mean has progres-sively risen, we are progressively losing sight of the cachectic, scrawny, low bodyweight child that is often portrayed as the characteristic presentation of type-1 dia-betes. I think we will lose it completely if things go on the way they are.
Dr. Schiffrin: If I remember correctly, the genetic susceptibility for diabetes type-1and celiac disease shows a strong overlap. There are Swedish studies showing that thetwo diseases coexist in some patients. Now if I got your paradigm right, if the insulinresistance or the environment is becoming so important, the coexistence of type-2diabetes should be less associated with celiac disease if the genetic background is lessimportant. Is that right?
Dr. T. Wilkin: You are absolutely correct about the association between celiac dis-ease and type-1 diabetes, but the connection there is genetic. If the phenotype oftype-1 changes as Dr. Slama was saying, there will always be the same genetic distri-bution within the population. I have no doubt that there will always be an associationof celiac disease with a proportion of individuals who have diabetes. But that is agenetic association, it is not an association with the phenotype of a disease which Ithink is becoming indistinguishable for the reasons that I have indicated.
Dr. Golay: I come from the type-2 research field, and we are more and more ableto prove that we have a �-cell defect in type-2. I propose a third type (half type-1)between a clear type-1 (complete insulin defect) and type-2 with insulin resistanceand a slow partial defect.
Dr. T. Wilkin: I understand what you are saying, but I am not sure I would give itthat explanation.
Dr. Golay: We have a third group of diabetic patients instead of having the samedisease for type-1 and type-2.
Dr. T. Wilkin: The rates at which conversion occurs from type-2 to type-1 is afunction of the third accelerator. I think that conversion occurs very rapidly in child-hood and the earlier in childhood the more rapid, and that is because the tempo is sotelescoped in childhood by the intensity of the immune response; that would be myargument. When you have got through childhood you have, as it were, used up the
Wilkin
152

population with that particular genotype of extremely intense reactivity. Teenagerswho develop type-1 have a different genotype distribution than those who are 2 or 3years old when they develop type-1. When you move from teenagers into adulthood,the genotype changes again. When you come to adults, where the third accelerator iscontributing very little, then the tempo of conversion is very slow, but I see no funda-mental conceptual difference in the two.
Dr. Metzger: There are two points I wanted to make. One, I don’t believe that youranalogy of the cachectic type-1 patient is very strong evidence because that repre-sented the long-term symptomatic uncontrolled state of diabetes, and we tend to seea diagnosis made much earlier now. In analogy we see very few sustained long-termsymptomatic patients with Graves disease before we make a diagnosis, whereas 30years ago it was very different. It seems to me that the acceleration in the onset oftype-1 diabetes would not necessarily increase the true incidence of type-1 diabetes.We may simply be seeing a shift to the left in onset, and whether the lifetime risk oftype-1 diabetes has changed in the last 30 years I think would be an interesting part ofevaluating the status of type-1 diabetes.
Dr. T. Wilkin: There is some evidence that would help on that as well. There are atleast two, possibly three reports in the literature which would suggest that there isindeed a shift. I think the accelerator hypothesis would predict just that, that there isa group in the population with higher susceptibility genes who will accelerate faster ifgiven the stimulus through insulin resistance. But they would borrow from the oldergroup as a result, so that you would see a shift to an earlier age at onset, and earlierage at onset is very much the observation that we make in type-1 diabetes.
Dr. Bantle: I think there is evidence that if you treat people with early type-1 dia-betes with insulin and control glucose, you cause weight gain. Presumably you increaseinsulin resistance but, at the same time, you preserve insulin production for some time.Would the accelerator hypothesis be able to explain how that would happen?
Dr. T. Wilkin: I think it would. I think it might predict that if you give an externalsource of insulin you would rest the endogenous �-cell so it would be less antigenicbecause it would be less metabolically upregulated, and as a less antigenic �-cell itwould invite a less intense immune response and therefore might survive longer. Thatis speculation but I think it was the premise on which the DPT-1 study was based onusing low dose insulin to try and preserve the �-cell.
References
1 Strotmeyer ES, Yang Z, LaPorte RE, et al: Infant diet and type 1 diabetes in China. DiabetesRes Clin Pract 2004;65:283–292.
2 Paronen J, Knip M, Savilahti E, et al: Effect of cow’s milk exposure and maternal type 1 dia-betes on cellular and humoral immunization to dietary insulin in infants at genetic risk fortype 1 diabetes. Finnish Trial to Reduce IDDM in the Genetically at Risk Study Group.Diabetes 2000;49:1657–1665.
The Accelerator Hypothesis
153

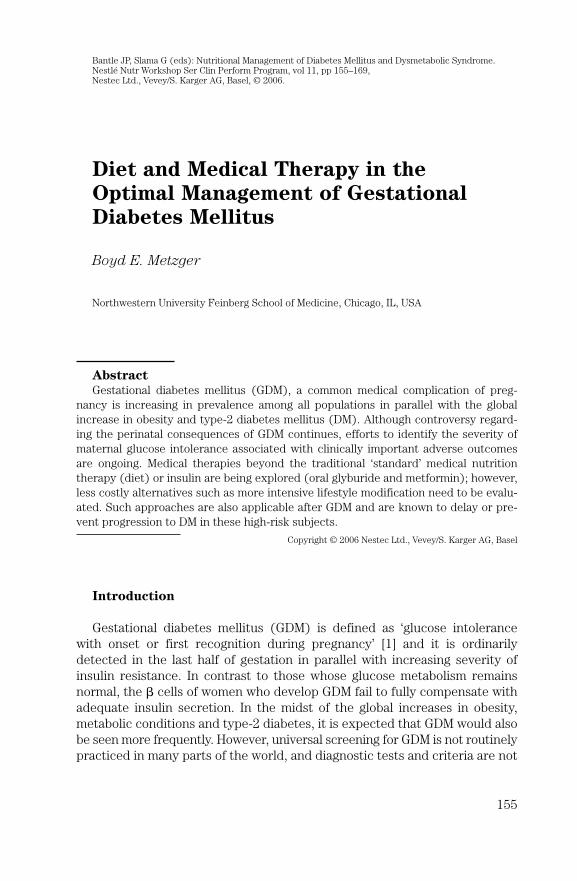
Diet and Medical Therapy in theOptimal Management of GestationalDiabetes Mellitus
Boyd E. Metzger
Northwestern University Feinberg School of Medicine, Chicago, IL, USA
AbstractGestational diabetes mellitus (GDM), a common medical complication of preg-
nancy is increasing in prevalence among all populations in parallel with the globalincrease in obesity and type-2 diabetes mellitus (DM). Although controversy regard-ing the perinatal consequences of GDM continues, efforts to identify the severity ofmaternal glucose intolerance associated with clinically important adverse outcomesare ongoing. Medical therapies beyond the traditional ‘standard’ medical nutritiontherapy (diet) or insulin are being explored (oral glyburide and metformin); however,less costly alternatives such as more intensive lifestyle modification need to be evalu-ated. Such approaches are also applicable after GDM and are known to delay or pre-vent progression to DM in these high-risk subjects.
Copyright © 2006 Nestec Ltd., Vevey/S. Karger AG, Basel
Introduction
Gestational diabetes mellitus (GDM) is defined as ‘glucose intolerancewith onset or first recognition during pregnancy’ [1] and it is ordinarilydetected in the last half of gestation in parallel with increasing severity ofinsulin resistance. In contrast to those whose glucose metabolism remainsnormal, the � cells of women who develop GDM fail to fully compensate withadequate insulin secretion. In the midst of the global increases in obesity,metabolic conditions and type-2 diabetes, it is expected that GDM would alsobe seen more frequently. However, universal screening for GDM is not routinelypracticed in many parts of the world, and diagnostic tests and criteria are not
Bantle JP, Slama G (eds): Nutritional Management of Diabetes Mellitus and Dysmetabolic Syndrome.Nestlé Nutr Workshop Ser Clin Perform Program, vol 11, pp 155–169,Nestec Ltd., Vevey/S. Karger AG, Basel, © 2006.
155

standardized. Evidence for an increase in GDM was reported in Australiamore than a decade ago. The data summarized in table 1 were reported fromthe Kaiser Permanente Health Plan of Northern California in early 2004 [2]. Inthis program, screening for GDM is standardized and applied universally.There is more than 85% compliance with the protocol. The data in table 1were derived from more than 265,000 pregnancies screened for glucose intol-erance. The key finding is that, during the 10-year period in which these datawere collected, the overall incidence (using the criteria of Carpenter andCoustan [3] throughout) showed an increase of 41%, adjusting for the influ-ences of maternal age and ethnic mix. In 2005, similar findings were reportedin a multi-ethnic population enrolled in the Kaiser Permanente of Colorado[4] in the years 1994–2002. An Increase in GDM has also been reported inIndia [5]; however, detailed data on the population-wide incidence from priorand current years are lacking.
Developing an optimal strategy for dealing with the increasing prevalenceof GDM presents major challenges. In addition to the failure to use the samecriteria for diagnosis of GDM, there has been much controversy about thespecificity of the relationships to hyperglycemia and ‘the level of hyper-glycemia, short of overt diabetes, that conveys increased risk’ [6] and, untilrecently, whether treatment of GDM can improve outcomes [7]. Historically,the treatment of GDM has focused on correcting maternal hyperglycemia asa means of slowing fetal growth in an effort to avoid macrosomia and its asso-ciated morbidities, in particular risk of birth injury, cesarean delivery andneonatal morbidities. However, as will be illustrated, the pathophysiologyand pathogenesis of GDM are complex and an optimal approach to treatmentmay involve more than simply correcting hyperglycemia. Furthermore, chil-dren who have been exposed to the intrauterine environment of diabetes or
Metzger
156
Table 1. Increasing incidence of gestational diabetes in northern California(1991–2000)
Year
1991 1993 1995 1997 2000% % % % %
All ethnic groups1 5.1 5.2 6.2 7.5 7.2White (non-Hispanic)2 3.9 4.1 5.1 5.7 5.7African American2 4.1 5.1 4.7 5.8 6.4Hispanic2 7.2 6.9 8.1 9.8 8.3Asian2 7.2 8.0 8.3 11.0 9.7
Adapted from Ferrara et al. [2].1Adjusted for age and race-ethnicity.2Adjusted for age.

GDM are at increased risk of obesity and altered glucose metabolism in laterlife [8].
Maternal Nutrition and Fetal Growth in GDM
It is well known that the state of maternal nutrition (both macro- andmicronutrient) before and during pregnancy is a critical factor influencingfetal growth and pregnancy outcome. Guidelines for optimal weight gain andrecommendations for daily intake of micronutrients during pregnancy havefor many years been offered by bodies such as the FAO/WHO/UNU [9] and theInstitute of Medicine of the National Academy of Science [10]. However, thebenefit of specific supplementations during pregnancy is, in most cases, uncer-tain (iodine and iron excepted). In April 2004, an entire Nestlé NutritionWorkshop was devoted to the topic [11]. Studies addressing these issues inpregnancy complicated by diabetes are very sparse. Nevertheless, these sameguidelines for maternal nutrient intake and weight gain are generally used inthe presence of diabetes (type 1, type 2 or GDM).
Influences of Obesity
Insulin ResistanceMaternal weight prior to pregnancy, weight gain during pregnancy, mater-
nal height, number of previous pregnancies, and gender of the fetus all influ-ence infant size at birth. Women who are obese prior to pregnancy tend togain less weight and give birth to heavy babies (large for gestational age)more frequently than those whose pre-gravid weight is normal [12]. Catalanoet al. [13] found that insulin sensitivity prior to pregnancy is an important pre-dictor of birth weight and may account for the association between maternalpre-gravid weight and birth weight. In women with GDM, there is little if anycorrelation between maternal weight gain and birth weight; however, studiesthat examine associations with the weight of babies born to mothers withGDM are all potentially confounded by treatment of hyperglycemia. As indi-cated above, obesity is associated with an increased risk of large for gesta-tional age (macrosomic) babies even when glucose levels remain normal [12].Nevertheless, a collaborative study in Chicago, Ill., and Seoul, Korea, foundthat GDM was associated with a similar increment in the number of largebabies above that of the general population in the more obese subjects inChicago and in the mostly non-obese Korean population [14].
Nutrient DeliveryCirculating concentrations of micro- and macronutrients (lipids, glucose
and free amino acids) are altered during pregnancy and they are further mod-ified by the presence of diabetes. More than 25 years ago, GDM was first char-acterized as a ‘panfuel’ metabolic disturbance with alterations in lipids (free
Optimal Management of GDM
157

Metzger
158
700
FFA
500
�m
ol/l
300
400
Triglyceride
300
mg
/dl
200
140 Serine
120
�m
ol/l
100
80
Isoleucine
80
8:00 13:00 18:00 8:000:00
�m
ol/l
60
Meals at time (h)
40
Fig. 1. Diurnal patterns of plasma free fatty acids (FFA), triglycerides and individualamino acids (serine and isoleucine) in the third trimester of normal pregnancy (�) and‘mild’ gestational diabetes (�; fasting plasma glucose �105 mg/dl [5.8 mmol/l]). Adaptedfrom Metzger et al. [15].

fatty acids (FFAs), triglycerides, lipoproteins), amino acids (especiallybranched chain amino acids) and other glucose-regulating hormones as wellas glucose [15] (fig. 1). Obesity is also associated with changes in the circulatingconcentration of multiple nutrients (glucose, FFAs, triglycerides, cholesterol,branched chain amino acids), and it is likely that insulin resistance also playsa central role in these changes. For example, it is well known that normalpregnancy is associated with a decline in the fasting plasma glucose (FPG)concentration of approximately 0.5–0.6 mmol/l, and most of the change hasoccurred by the end of the first trimester. However, Mills et al. [16] foundno decline in FPG in obese pregnant women (pre-pregnancy body massindex �30) with normal glucose tolerance. Yogev et al. [17] performed con-tinuous glucose monitoring of subcutaneous interstitial fluid via a glucosesensor for 72 h in normal weight and obese non-diabetic pregnant women inthe third trimester [17]. Compared to the normal weight subjects, the obesegroup had higher postprandial and mean values during the day, lower valuesduring the night and similar fasting and pre-meal glucose concentrations.
Pathophysiology and Pathogenesis of GDM
Normal pregnancy and GDM are states of profound insulin resistance andthe mediating factors are similar, if not identical. However, women whodevelop GDM tend also to be insulin-resistant when not pregnant and becomeeven more insulin-resistant during pregnancy [18]. GDM develops when �
cells are unable to compensate the increasing insulin resistance with suffi-ciently greater insulin secretion to maintain normal fasting and/or postpran-dial glucose concentrations [18, 19].
Placental Factors
For many years, clinical and research evidence has indicated a role for theplacenta in the development of insulin resistance and the list of putativemediators of this effect is long (table 2). The placenta is also an endocrineorgan and numerous studies have demonstrated potential mechanisms forhormones of placental origin to contribute to insulin resistance. Furthermore,insulin sensitivity is restored quickly after the placenta is expelled. In the lastseveral years, it has been demonstrated that the placenta synthesizes andpotentially secretes an array of mediators and cytokines (e.g. leptin, C-reac-tive protein, tumor necrosis factor (TNF)-�, interleukins 6 and 8) that mayinfluence maternal metabolism and insulin sensitivity directly or indirectly[20]. Radaelli et al. [21] compared patterns of gene expression in placentasfrom pregnancies with normal glucose metabolism or GDM. They found majordifferences in the expression profiles with increases in markers and media-tors of inflammation (interleukins, leptin and TNF-� receptors and down-stream adaptors) in GDM. Whether these alterations of gene expression
Optimal Management of GDM
159

represent primary events or occur as a secondary response to the increaseddelivery of nutrients, hormones and mediators from maternal tissues andtheir accumulation/storage in the placenta, e.g. triglycerides and glycogen[22], remains to be determined. Kirwan et al. [23] measured insulin sensitivityserially during pregnancy in a group of women with normal glucose toleranceor GDM and correlated these indices with measures of body composition,plasma TNF-�, leptin cortisol and reproductive hormones. Levels of TNF-�,leptin cortisol, fat mass, and all reproductive hormones measured wereincreased in late gestation compared to early in pregnancy; however, only achange in TNF-� from early to late pregnancy predicted the magnitude ofchange in insulin sensitivity over the same time (fig. 2).
Metzger
160
Table 2. Factors of placental origin that putatively contribute to insulin resistance
Large placenta size Progesterone Interleukin 6Human placental lactogen Human growth hormone Interleukin 8
(placental variant)Human chorionic gonadotropin Corticotrophin-releasing Tumor necrosis
factor/cortisol factor-�Prolactin Leptin C-reactive proteinEstradiol Resistin
2.5
0.0
�2.5
�5.0
�7.5
�10.0
�1 0 1
� TNF-� (pg/ml)
� Insulin
sensittivity
(10
�2 m
g·k
g�
1F
FM
·min
�1/�
U·m
l�1
2 3
Fig. 2. The correlation between a change in TNF-� and a change in insulin sensitivityfrom before pregnancy to late pregnancy in subjects with normal carbohydratemetabolism (�) or gestational diabetes (�) is plotted. Adapted from Kirwan et al. [23, fig. 4] with permission.
Adipocyte-Derived Mediators
Leptin is synthesized in both adipose tissue and placenta. Plasma leptinconcentrations are increased during pregnancy. Its potential contribution toinsulin resistance is uncertain [24]. Adiponectin is another adipocyte-derivedprotein that may also play a role in insulin resistance and predisposition toaltered glucose metabolism. Adiponectin levels tend to be low in insulin-resistant states including GDM and have been found to correlate with �-cellfunction in late pregnancy [25].
Treatment of GDM
Rationale
As pointed out above, there is considerable controversy about ‘the level ofhyperglycemia, short of overt diabetes that conveys increased perinatal risk’ [6].However, there is a general consensus that lowering maternal capillary bloodglucose concentrations to �95 mg/dl (5.3 mmol/l) in the fasting state, �140 mg/dl(7.8 mmol/l) at 1 h or �120 mg/dl (6.7 mmol/l) 2 h after meals may reduce therisk of excessive fetal growth to approximate the risk in the general population[1], and a major objective of treating GDM is to reduce adverse perinatalevents, primarily those associated with excess weight or adiposity of the new-born (cesarean delivery, birth trauma, neonatal morbidities).
Goals
The primary goal that is most often articulated for the treatment GDM isthe restoration of fasting and post-meal glucose values to within normalranges. Some investigators have provided evidence that it is more ‘cost-effective’to assess fetal abdominal circumference (AC) by ultrasound in all womenwith GDM to identify those at low risk of having a large baby (AC �75th per-centile) and concentrate therapeutic efforts on those at a much higher risk ofdelivering a large baby (AC �75th percentile) [26].
Metabolic Management
Lifestyle ModificationNutritional Therapy. Medical nutrition therapy (MNT) is referred to as
the ‘cornerstone’ of medical management of GDM; however, relatively littleinformation is available to allow evidence-based recommendations for spe-cific dietary approaches to management of GDM [1]. Furthermore, MNT ofGDM is not presently a major focus of research. The clinical guidelines formicro- and macronutrient intake and desired maternal weight gain closelyparallel those that are recommended for ‘normal, healthy pregnancies’ [9, 10].The significant differences are in recommendations concerning sources ofdietary carbohydrate, with emphasis placed on increasing complex carbohy-drates and reducing or eliminating monosaccharide, sucrose and other
Optimal Management of GDM
161

oligosaccharides. Calorie restriction aimed at achieving weight loss (the stan-dard initial dietary recommendation when not pregnant) continues to beviewed as experimental for GDM.
Exercise Therapy. A number of investigators have demonstrated thatexercise can effectively improve glycemia in GDM. The optimal frequencyand intensity of exercise have not been determined and the overall impact onperinatal and long-term outcomes has not been fully assessed. With 3 or moresessions of exercise (15 min duration), the maximum impact on maternalglucose levels may not be seen for 2–4 weeks [1].
Intensified Metabolic ManagementFailure to achieve or to maintain maternal glycemia within the targets
mentioned above after initiating MNT, or signs of excessive fetal growth indi-cate the need for more intensive metabolic therapy. Historically, treatmentwith insulin has been used in such instances [1]. There is no formally acceptedstandard protocol for therapy of GDM with insulin. Beneficial effects of ther-apy with insulin have been reported with a variety of regimens, includingonce daily administration of a fixed dose of ‘NPH’ insulin. It is likely that twicedaily use of combinations of biosynthetic ‘Regular’ and ‘NHP’ human insulin(in premixed fixed or flexible proportions) represents the most widely usedalgorithm.
In the last decade, additional treatment options have been advocated, includ-ing use of ‘rapid-acting’ insulin analogs (lispro and aspart, glulisine insulins), along-acting insulin analog (insulin glargine), or oral anti-diabetic medication(sulfonylurea [glyburide], metformin). The advent of new and/or alternate ther-apeutic options raises issues of cost/benefit, appropriate endpoints, safety, andefficacy. As implied in the Introduction, the time may be at hand to developindicators or measures of optimal metabolic control that go beyond indices ofhyperglycemia alone. For example, do subjects with similar levels of FPG orpostprandial glucose values that are achieved by different interventions alsohave similar levels of FFA, other lipids, individual amino acids, etc., and are theoutcomes comparable? Few studies have been designed or analyzed to addressquestions such as these. However, Langer et al. [27] have recently reportedbetter perinatal outcomes (i.e, lower rate of large for gestational age babies, lessmacrosomia (birth weight �4,000 g), lower rate of cesarean delivery, andless frequent neonatal morbidities assessed by a ‘composite outcome’ score), inpregnancies of obese GDM subjects (pre-pregnancy body mass index �30)treated with insulin and ‘well-controlled’ than in ‘well-controlled’ diet-treatedobese subjects, even though the initial and final glycemic measurements did notdiffer the 2 groups of subjects.
Rapid-Acting Insulin AnalogsThe rapid-acting insulin analogs (lispro, aspart and glulisine insulin) play
an established role outside pregnancy in the management of type-1 DM and
Metzger
162
they are commonly used in patients with type-2 DM who require multipledaily injections. When used prior to pregnancy, rapid-acting analogs are com-monly continued during gestation although their safety and efficacy duringpregnancy have not been established by controlled clinical trials. The use ofthese analogs during pregnancy varies in different regions and among individ-ual physicians.
The potential use of these analogs in the management of GDM has beenexplored to a limited extent. Jovanovic et al. [28] found no difference inimmunological response to the administration of regular human insulin orlispro insulin (Humalog™) in women with GDM, and lispro insulin was notdetectable in cord blood. The area under the glucose curve following a mealtest was less and episodes of hypoglycemia fewer with lispro insulin. HumanNPH insulin was used to provide ‘basal’ needs. No fetal or neonatal abnormal-ities were noted in either treatment group [28]. Data are not currently avail-able from pregnancies in which intermediate (insulin detemir) and/orlong-acting analogs (insulin glargine) have been used in the treatment ofGDM. The cost of treatment with an insulin analog is considerably greaterthan the cost of using regular and NPH human insulin. Therefore, the safety,efficacy and clinical benefit should be demonstrated before the wide use ofinsulin analog therapy of GDM is endorsed.
Medical Therapy with GlyburideIn the past, the American Diabetes Association [29] and the American College
of Obstetricians and Gynecologists [30] have recommended that oral medica-tions not be administered for the treatment of GDM because of concerns aboutincreased risks of congenital malformations and neonatal hypoglycemia thatmight be associated with their use. After finding very limited transplacentalpassage of glyburide in perfusion studies with term human placentas [31],Langer et al. [32] performed a randomized clinical trial comparing the results oftreating GDM (meeting their criteria for use of ‘intensified medical therapy’)with insulin and glyburide. The primary endpoint, glycemic control, was com-parable in the 2 groups, perinatal outcomes did not differ and glyburide was notdetectable in cord blood taken at delivery. Only 8/201 (4%) subjects in the gly-buride treatment group failed to have an adequate glycemic response requiringtransfer to therapy with insulin. The conclusion was reached that ‘in womenwith gestational diabetes, glyburide is a clinically effective alternative to insulintherapy’ [32]. These results have generated cautious optimism about the poten-tial use of this oral agent in the treatment of GDM. Although additional studiesof glyburide treatment by others have followed, to date none has involved asample approaching the size used in the initial clinical trial.
Medical Therapy with MetforminFor nearly 50 years, metformin has been used in the treatment of type-2
DM. Reports of its limited use during pregnancy have intermittently been
Optimal Management of GDM
163

published. Although substantial amounts of metformin cross the placenta, inrecent years interest in its use in childbearing women has increased substan-tially. A major factor in this trend is the evidence that administration of met-formin to women with the polycystic ovary syndrome enhances ovulation andimproves fertility. Some reports also suggest that administration of metforminduring pregnancy as well as during induction of ovulation can reduce fetalloss and lessen the risk of developing GDM. A prospective, double-blind, ran-domized, placebo-controlled, clinical trial has not been completed to addressthe issues regarding the benefit and safety of exposure of the mother andfetus to metformin for the duration of pregnancy [33]. The potential effects inthe offspring must be evaluated through childhood and puberty into adult-hood.
There is also renewed interest in the use of metformin for the treatment ofsome patients with type-2 DM or GDM. In Australia and New Zealand, a ran-domized clinical trial of metformin versus insulin treatment of GDM has beeninitiated and guidelines have been published in Australia regarding the poten-tial use of metformin in GDM subjects poorly controlled with diet but refusingtherapy with insulin, and as an adjunct to insulin in the presence of severeobesity and very severe insulin resistance [34]. As mentioned above, thepotential effects in the offspring must be evaluated through childhood andpuberty into adulthood.
References
1 Metzger BE, Coustan DR: Summary and recommendations of the Fourth InternationalWorkshop-Conference on Gestational Diabetes Mellitus. The Organizing Committee. DiabetesCare 1998;21(suppl 2):B161–B167.
2 Ferrera A, Kahn HS, Quesenberry CP, et al: An increase in the incidence of gestational dia-betes mellitus: Northern California 1991–2000. Obstet Gynecol 2004;103:526–533.
3 Carpenter MW, Coustan DR: Criteria for screening tests for gestational diabetes. Am J ObstetGynecol 1982;144:763–773.
4 Dabelea D, Snell-Bergeon JK, Hartsfield CL, et al: Increasing prevalence of gestational dia-betes mellitus (GDM) over time and by birth cohort. Diabetes Care 2005;28:579–584.
5 Seshiah V, Balaji V, Balaji MS, et al: Gestational diabetes mellitus in India. J Assoc PhysiciansIndia 2004;52:707–711.
6 HAPO Study Cooperative Research Group: The Hyperglycemia and Adverse PregnancyOutcome (HAPO) Study. Int J Gynaecol Obstet 2002;78:69–77.
7 Crowther CA, Hiller FE, Moss JR, et al, for the Australian Carbohydrate Intolerance Study inPregnant Women (ACHOIS) Trial Group: Effect of treatment of gestational diabetes mellituson pregnancy outcomes. N Engl J Med 2005;352:2477–2486.
8 Silverman BL, Purdy LP, Metzger BE: The intrauterine environment: implications for the off-spring of diabetic mothers. Diab Rev 1996;4:21–35.
9 Energy and Protein Requirements. Report of a joint FAO/WHO/UNU Expert Consultation.World Health Organ Tech Rep Ser 1985;724:1–206.
10 Institute of Medicine and Food and Nutrition Board: Nutrition during Pregnancy. Washington,National Academy Press, 1990.
11 Hornstra G, Uauy R, Yang X (eds): The Impact of Maternal Nutrition on the Offspring. NestléNutrition Workshop Series Pediatric Program. Vevey/Basel, Nestec/Karger, 2005, vol 55.
Metzger
164

12 Kliegman RM, Gross T: Perinatal problems of the obese mother and her infant. ObstetGynecol 1985;66:299–306.
13 Catalano PM, Drago NM, Amini SB: Maternal carbohydrate metabolism and its relationship tofetal growth and body composition. Am J Obstet Gynecol 1995;172:1464–1470.
14 Jang HJ, Cho NH, Min Y-K, et al: Increased macrosomia and perinatal morbidity independentof maternal obesity and advanced maternal age in Korean women with gestational diabetesmellitus. Diabetes Care 1997;20:1582–1593.
15 Metzger BE, Phelps RL, Freinkel N, Navickas IA: Effects of gestational diabetes on diurnalprofiles of plasma glucose, lipids, and individual amino acids. Diabetes Care 1980;3:402–409.
16 Mills JL, Jovanovic L, Knopp R, et al: Physiological reduction in fasting plasma glucose con-centration in the first trimester of normal pregnancy: the Diabetes in Early Pregnancy Study.Metabolism 1998;47:1140–1144.
17 Yogev Y, Ben-Haroush A, Chen R, et al: Diurnal glycemic profile in obese and normal weightnondiabetic pregnant women. Am J Obstet Gynecol 2004;191:949–953.
18 Catalano PM, Tyzbir ED, Roman NM, et al: Longitudinal changes in insulin release and insulinresistance in nonobese pregnant women. Am J Obstet Gynecol 1991;165:1667–1672.
19 Buchanan TA, Xiang AH: Gestational diabetes. J Clin Invest 2005;115:485–491.20 Coughlan MT, Permezel M, Georgiou HM, Rice GE: Repression of oxidant-induced nuclear
factor-kappaB activity mediates placental cytokine responses in gestational diabetes mellitus.J Clin Endocrinol Metab 2004;89:3584–3594.
21 Radaelli T, Varastehpour A, Catalano P, Haugel-De Mouzon S: Gestational diabetes inducesplacental genes for chronic stress and inflammatory pathways. Diabetes 2003;52:2951–2958.
22 Diamant YZ, Metzger BE, Freinkel N, Shafrir E: Placental lipid and glycogen content inhuman and experimental diabetes mellitus. Am J Obstet Gynecol 1982;144:5–11.
23 Kirwan JP, Haugel-De Mouzon S, Lepercq J, et al: TNF-alpha is a predictor of insulin resist-ance in human pregnancy. Diabetes 2002;51:2207–2213.
24 Ceddia RB, Koistinen HA, Zierath JR, Sweeney G: Analysis of paradoxical observations on theassociation between leptin and insulin resistance. FASEB J 2002;16:1163–1176.
25 Retnakaran R, Hanley AJG, Raif N, et al: Adiponectin and beta cell dysfunction in gestationaldiabetes: pathophysiological implications. Diabetologia 2005;48:993–1001.
26 Buchanan TA, Kjos SL, Montoro MN, et al: Use of fetal ultrasound to select metabolic therapyfor pregnancies complicated by mild gestational diabetes. Diabetes Care 1994;17:275–283.
27 Langer O, Yogev Y, Xenakis EM-J, Brustman L: Overweight and obese in gestational diabetes:the impact on pregnancy outcome. Am J Obstet Gynecol 2005;192:1768–1776.
28 Jovanovic L, Ilic S, Pettitt DJ, et al: Metabolic and immunologic effects of insulin lispro in ges-tational diabetes. Diabetes Care 1999;22:1422–1427.
29 American Diabetes Association: Gestational diabetes mellitus. Diabetes Care 2003;26(suppl 1):S103–S105.
30 Diabetes and Pregnancy. ACOG Technical Bulletin No. 200 (replaces No. 92). Washington,American College of Obstetricians and Gynecologists, 1994, pp 359–366.
31 Elliott BD, Langer O, Schenker S, Johnson RF: Insignificant transfer of glyburide occursacross the human placenta. Am J Obstet Gynecol 1991;165:807–812.
32 Langer O, Conway DL, Berkus MD, et al: A comparison of glyburide and insulin in women withgestational diabetes mellitus. N Engl J Med 2000;343:1134–1138.
33 Ehrmann DA: Polycystic ovary syndrome. N Engl J Med. 2005;352:1223–1236.34 Simmons D, Walters BNJ, Rowan JA, McIntyre HD: Metformin therapy and diabetes in preg-
nancy. Med J Aust 2004;180:462–464.
Discussion
Dr. Katsilambros: It was very interesting to note that in your initial slides it wasclearly shown that Chinese women presented much higher gestational diabetes ascompared to Caucasians. This is very curious since the diabetes rate per se in the gen-eral Chinese population is lower than that in Caucasians. Could it be that this reflectsthe fact that Chinese women are thinner? You have shown during pregnancy thin
Optimal Management of GDM
165

women tend to gain a lot of weight as compared to women who are heavier beforepregnancy. Could it also be that Chinese women produce relatively more estrogensduring pregnancy or even that their tissues are relatively more sensitive to estrogensthan the tissues of Caucasian women? Please also take into account the fact that inChina only one child per woman is the common policy. I say that because we know thatthe greater the number of pregnancies the greater the diabetic tendency.
Dr. Metzger: I failed to make it clear that these Chinese and other Asian womenwere people who were born in China or Vietnam, and then migrated and lived inAustralia. So the Westernization effect of the first generation is what we are seeing.We have seen the same thing in Korean women moving to Chicago. So the high expres-sion of diabetes is seen in the new environment. However, in other countries I dobelieve that gestational diabetes is also increased. There have been reports of anincrease in India, although I have to say that these population-base studies are notadjusted for confounding factors as those from California. In studies that have lookedat this, greater weight is associated with gestational diabetes even within populationswith relatively little obesity. So it looks as if the same factors worsen their insulinresistance as occur in the areas where there is more obesity.
Ms. Franz: Traditionally the focus of nutrition therapy for gestational diabetes hasbeen on blood glucose control and glucose outcomes. Are you suggesting that weightcontrol and/or caloric intake should receive more attention?
Dr. Metzger: I would like to see them raised. Yes, in terms of other outcomes Ibelieve in judging if glyburide therapy is equivalent to insulin, or is one form of insulinequivalent to another, we probably should be looking at some of the other metabolicchanges that are part of diabetes and gestational diabetes as well as perinataloutcomes to help us determine what really does normalize the environment mosteffectively.
Dr. Slama: Have you any experience with increased physical activity as promotedby Jovanovic in the past? More and more of our patients are treated with glargine andultra-rapid analogs. What do you do when such perfectly controlled diabetic girlsbecome pregnant while using glargine and analogs?
Dr. Metzger: There have been two approaches to physical activity in publishedstudies. One is the upper arm approach that Jovanovic has used, and other groupssimply used walking and more traditional forms of increasing physical activity withsimilar effects on improving glucose levels in patients with gestational diabetes. So Ibelieve the full component of lifestyle intervention should be encouraged more thanwe have done in the past. Your question with regard to analogs deals more with peo-ple with existing diabetes, and my approach has been as follows. The short-actinginsulin analogs have now been used for a decade although some initial concerns wereraised. There have been no systematic clinical trials, but there also has been no evi-dence that they have any adverse effects. So women who are using short-actinganalogs can continue that with very little concern and very little additional discus-sion. With the long-acting analogs such glargine insulin, I would encourage my col-leagues to discuss the pros and cons of their use during pregnancy with the womenbefore they become pregnant. There have been no clinical trials, although there aresome animal data that have raised concern that high doses of glargine might increasethe levels or might interact with IgF receptors in addition to insulin receptors thatcould potentially be harmful. There are no published data in large numbers. so thesafety issues are not fully resolved. I encourage people to have a discussion with theirfemale patients before glargine insulin is started as to whether they would want touse it during pregnancy. Women that have been brought in good control and are com-fortable with a given regimen, find it very disconcerting to be asked to make achange. So if it can possibly be done before pregnancy, it is much easier. Having said
Metzger
166

that, I have never had anybody who wanted to discontinue glargine insulin once thepregnancy has started.
Dr. Chiasson: I was surprised by your conclusion suggesting that the glucagon-like peptide-1 inhibitor of dipeptidyl peptidase-4 (DPP4) could be one of the tools wecould use in the future because the enzyme DPP4 is involved in a number of metabolicpathways, and the safety has yet to be proven. In the future we may find that it is safe.In fact gestational diabetes, at least at the beginning, is a postprandial disease. I waswondering why you would not suggest an approach that specifically addresses thepostprandial plasma glucose rise, such as �-glucosidase inhibitors, which could betested? These seem, at least certainly �-glucosidase inhibitors, to be safe, non-toxicand most likely without any detrimental effects, and could be a safe drug for gesta-tional diabetes.
Dr. Metzger: I am not really optimistic that we will be using DPP4 inhibitors in thenear future unless they are very specifically known not to cross the placenta.However, glucagon-like peptide-1 agonists might be approachable in the near futureand would help restore insulin secretion. Other agents have the burden of transpla-cental delivery, and �-glucosidase inhibitors are absorbed to a limited extent. Theycarry warnings for pregnancy because the 2 or 3% that is absorbable is hepaticallyactive and potentially hepatotoxic in large doses. So they also face the burden of con-cern for introduction in pregnancy.
Dr. Velarde: You mentioned that some of the patients who were diagnosed withgestational diabetes already had substantial weight gain at the time of diagnosis. Thisimplies that perhaps they had some insulin resistance going on for weeks, maybe atthe time of conception. While the interventions that you mentioned may prevent therespiratory complications, macrosomia, large for gestational age infants, do you thinkwe should be more aggressive with the early diagnosis and treatment of these patientsto prevent the congenital malformations?
Dr. Metzger: Congenital malformations that occur in women who we label as hav-ing gestational diabetes are probably related to one of two things. One, they had dia-betes before pregnancy and had overt hyperglycemia at the time they becamepregnant which wasn’t detected. Second, there is increasing evidence that obesity,independent of hyperglycemia, is associated with a higher risk of malformations. Thetrue mediators of those malformations are not known. The background against whichwe need to compare malformations in gestational diabetes are women of the sameweight and other characteristics who don’t have abnormal glucose levels. I do thinkthat many women in whom we diagnose or who even develop gestational diabetes overthe course of pregnancy have abnormalities earlier than we can detect. Decisions con-cerning the time, or multiple times during pregnancy to screen for gestational dia-betes are made pragmatically. We have many places in the world where it is notfeasible to test once for gestational diabetes. So it is hard to make a set of recommen-dations to do earlier screening when in many instances it is not feasible to even screenonce. The focus on screening at around 28 weeks of gestation is based on a pragmaticyield versus cost basis with still enough time to intervene for potential benefit.
Dr. T. Wilkin: At the NIH earlier this year in Bethesda there was a presentationsuggesting that there may be gene methylation of the germline of the offspring thatmay have long-term transgenerational effects. I just wonder if you could comment onwhether you look beyond the next generation, to the one after that, and after that,because the impact of hyperglycemia and insulin resistance in the gestationally dia-betic female doesn’t just stop with the early effects on the offspring.
Dr. Metzger: This is a topic about gestational diabetes that I am very interestedin. There is certainly strong evidence that the exposure to the intrauterine environ-ment of diabetes has lasting consequences. The animal model data have supported
Optimal Management of GDM
167

this for a couple of decades; there have been very good epidemiological studies fromthe Pima population that Dabelea et al. [1] conducted, and we have done a long-termstudy of children from diabetic mothers, a cohort we followed for 20 years [2]. Thefindings are complementary. So there is strong evidence that exposure in theintrauterine environment to diabetes accelerates or promotes both obesity and glu-cose intolerance in the next generation. I believe that preventing the long-term con-sequences of diabetes is as important as the perinatal issues. We are prettysuccessful with the perinatal issues, we don’t know that we can successfully inter-vene to prevent the long-term effects.
Dr. Hill: Are high levels of physical activity or high physical fitness protectiveagainst gestational diabetes?
Dr. Metzger: I think they are. Of course the data come from long-term observa-tional studies, not from prospective trials of any kind. I believe the Nurses HealthStudy has shown a reduced prevalence in gestational diabetes associated with higherlevels of physical activity [3]. Many years ago I was in communication with an investi-gator in an African country where physical activity remained extremely high andwomen remained in the field until they delivered and came back to the field a fewhours later. They performed a series of studies during pregnancy in which there wasvery little weight gain, no increase in body fat, and glucose tolerance tests whichshowed no change in glucose tolerance at all during pregnancy. So I suspect that wecan probably intervene under certain circumstances to reduce the amount of insulinresistance that occurs during normal pregnancy, and that would in a similar way prob-ably reduce the incidence in gestational diabetes.
Dr. Jianqin Sun: Do you have any data on the prevalence of the macrosomiaamong diabetic mothers and normally pregnant women?
Dr. Metzger: The incidence of macrosomia in normal pregnancy varies a lot in dif-ferent populations around the world, and one of the major factors is the amount ofobesity and insulin resistance in the normal population. In patients with gestationaldiabetes, the observed frequency of macrosomia is a very complex thing to interpretbecause once we make a diagnosis we intervene with treatment that is intended toprevent the macrosomia that we measure as an outcome. So there are very few datathat would say how much macrosomia would occur in untreated gestational diabetes.Where untreated gestational diabetes with more severe hyperglycemia exists, the inci-dence is very high. In the hyperglycemia and adverse outcome study that we are cur-rently doing, we will have data on how much macrosomia occurs with lesser levels ofhyperglycemia because that is a purely observational study. Dr. Knowler can you addsomething with regard to outcomes in untreated Pima?
Dr. Knowler: We have been studying pregnancy and pregnancy outcome in thePima Indians for a period of about 40 years during which time there have beentremendous improvements in the treatment of diabetic pregnancy. Unfortunatelysome of the adverse outcomes such as the risk of diabetes in the offspring, do notshow any sign of declining overtime. So I agree with the conclusion you made, treat-ment of diabetes in pregnancy certainly can be effective in reducing a lot of the peri-natal outcomes but it is not clear whether it would be effective in the long-termadverse outcomes in the children.
References
1 Dabelea D, Knowler WC, Pettitt DJ: Effect of diabetes in pregnancy on offspring: follow-upresearch in the Pima Indians. J Matern Fetal Med 2000;9:83–88.
Metzger
168

2 Silverman BL, Rizzo TA, Cho NH, Metzger BE: Long-term effects of the intrauterine environ-ment. The Northwestern University Diabetes in Pregnancy Center. Diabetes Care1998;21(suppl 2):B142–B149.
3 Solomon CG, Willett WC, Carey VJ, et al: A prospective study of pregravid determinants ofgestational diabetes mellitus. JAMA 1997;278:1078–1083.
Optimal Management of GDM
169


Do Meal Replacement Drinks Have aRole in Diabetes Management?
Herwig H. Ditschuneit
Medizinische Klinik, Universitätsklinikum Ulm, Ulm, Germany
AbstractThe poor effectiveness of conventional dietary treatment for weight loss and weight
maintenance in patients with type-2 diabetes may be improved by a meal replacementstrategy that provides a strong structured meal plan with reasonable opportunity fordietary variety. Typical meal replacement programs fix the intake of one or two mealsper day with a calorie-controlled, nutritionally balanced commercial formulation, andallow prudent additional meals and snacks. In obese subjects, diets with meal replace-ments have proven to be more efficient than conventional diets. Patients on the mealreplacement regimen lost 7.3 and 8.4% of initial body weight after 12 weeks and 4years, respectively, whereas the patients on the conventional diet had lost 1.4% and3.2% of initial body weight after 12 weeks and 4 years, respectively. The meal replace-ment plan has also proven to be effective in patients with type-2 diabetes. After 6 and12 months, patients in the meal replacement group achieved on average a weight lossof 5.24 and 4.35% of their initial body weight, respectively. In contrast, after 6 and 12months, patients on the individualized diet plan achieved on average a weight loss of2.85 and 2.36% of their initial body weight, respectively. Meal replacements offer apromising strategy for treating obese patients with type-2 diabetes.
Copyright © 2006 Nestec Ltd., Vevey/S. Karger AG, Basel
Obesity and Type-2 Diabetes
Epidemiological studies show that increasing body weight is associatedwith an increasing risk for type-2 diabetes (T2D) [1]. More than 90% of indi-viduals with T2D are obese. Conversely the prevalence of T2D is 46% amongindividuals with a BMI of 30 (kg/m2) and higher. Obesity is a contributing fac-tor in the development of T2D in an estimated 60–90% of patients with thiscondition [2]. The data indicate that the current epidemic obesity may be themajor causative factor in the worldwide increase of the prevalence of diabetes.
Bantle JP, Slama G (eds): Nutritional Management of Diabetes Mellitus and Dysmetabolic Syndrome.Nestlé Nutr Workshop Ser Clin Perform Program, vol 11, pp 171–181,Nestec Ltd., Vevey/S. Karger AG, Basel, © 2006.
171

Excess body fat, in particular surplus of visceral fat, is recognized to result inmetabolic disturbances. The amount of intra-abdominal fat and the waist cir-cumference have proven as independent predictors of the incidence of T2D [3].
Prevention of T2D
There are numerous studies giving evidence that weight loss in obese sub-jects and particularly in obese subjects with impaired glucose tolerance (IGT)may prevent development of T2D. In a small well-performed study in MalmöSweden [4] overweight men with IGT were enrolled in a 5-year interventionprogram emphasizing a low-calorie diet and physical training. At the 5-yearfollow-up participants showed a mean weight loss of 2.3 kg whereas controlsubjects showed a mean weight gain of 0.5 kg. In the intervention group75.8% showed improved glucose tolerance whereas 10.6% progressed toT2D. In contrast, in the control group 67.1% showed deterioration in glucosetolerance and 28.6% progressed to T2D.
In agreement with this study in large diabetes prevention trials withlifestyle changes, including calorie restriction and encouragement to increasephysical activity, the incidence of diabetes was reduced in the lifestyle inter-vention groups.
In the Da Qing IGT and Diabetes Study [5] the cumulative incidence of dia-betes at 6 years in subjects with IGT at baseline was 67.7% in the controlgroup. In the diet, exercise, and diet-plus-exercise intervention groups therisk of developing diabetes compared to the control group was reduced by 31,46 and 42%, respectively.
In the Finland Study [6], the effect of the intervention on the incidence ofdiabetes was most pronounced among subjects who made comprehensivechanges in lifestyle. Compared to subjects undergoing typical care (controlgroup) in those with weight loss the incidence of diabetes was reduced bymore than 50%.
In the Diabetes Prevention Program [7] the incidence of diabetes in per-sons at risk after a mean follow-up of 2.8 years was 11.0 cases per 100 person-years in the placebo group but only 4.8 in the lifestyle group.
Effects of Weight Loss in T2D
In patients with T2D weight loss has been demonstrated to improve bio-markers of good health, metabolic disturbances, HbA1c and vascular compli-cations [8]. The most striking results have been reported after massive weightloss induced by surgery. In one study [9], before surgery 49% of the patientshad IGT or diabetes and after 14 years with a mean weight loss of 32.8% morethan 90% maintained normal levels of plasma glucose.
Ditschuneit
172

In the Swedish SOS Study [10], after 10 years in the surgery group, 36% ofthe diabetic patients had recovered from diabetes; in contrast in the controlgroup only 13% of patients had recovered. In the surgery group after 10 years7% of patients and in the control group 24% of patients had developed dia-betes. These data emphasize the importance of obesity contributing to thepathogenesis of T2D and provide the rationale for developing appropriatemanagement strategies for patients with T2D.
It may be difficult to sort out benefits that can be attributed to medicalnutrition therapy, diabetes education, and exercise. There are three meta-analysis studies looking at diabetes education and a variety of weight lossmethods showing that nutrition interventions have the largest effect onweight loss. The weight loss again improves the metabolic control. This hasbeen demonstrated impressively in the Diabetes Treatment Study fromNorthern Ireland [11] in which a successful long-term weight low wasachieved with diet. The average weight loss of 9 kg after 6 months of treat-ment was sustained over the 6-year study. All the participating patients hadrecently diagnosed T2D, and diabetes was managed by diet alone in 87% ofthe patients at 1 year and 71% at 6 years.
Medical Nutrition Therapy in Diabetes
On the basis of the medical literature and sound clinical practice, medicalnutrition therapy with effective weight reduction improves glycemic control,metabolic disturbances and vascular complications in T2D.
But current nutritional recommendations for patients with T2D in generaldo not attach great importance to weight loss. The goals of medical nutritiontherapy aimed at by the ADA focus on attaining and maintaining optimalmetabolic outcomes, on preventing and treating the chronic complications ofdiabetes, on improving health through healthy food choices and physicalactivity, and on addressing individual nutritional needs [12]. There is evidencethat all these goals are easily reached or somewhat better reached with areduction of body weight. However, it seems to be a common belief amongphysicians that nutritional therapy in T2D is not efficient. To optimizeglycemic control physicians often start with drug or insulin therapy beforethe effects of diet treatment are assessable [13].
In view of recent consistent and strong evidence that weight reductionimproves insulin sensitivity and glycemic control in T2D, the Joslin DiabetesCenter and Joslin Clinic recommended clinical guidelines for overweightand obese adults with T2D, prediabetes or high risk of developing T2D thatconsider weight reduction as one of the prime objectives of any nutritionrecommendations for patients with diabetes. Among others the guidelinesadvise that weight reduction should be individualized and continueduntil BMI reaches �25 kg/m2 or an until a BMI goal which has been agreed
Do Meal Replacement Drinks Have a Role in Diabetes Management?
173

upon is reached, that individuals should learn and practice portion controlas an effective way of weight control, and that meal replacements may beused [14].
Management of Weight Loss in Diabetics
It has been reported that achievement of weight loss and weight mainte-nance in patients with T2D seems to be more difficult than in people withoutdiabetes. Poor adherence to the dietary recommendations and physiologicaladaptations that occur with dieting [15] may explain the poor outcomes. Inaddition, intense blood glucose control in diabetics may counteract withweight loss efforts. The results of the UK Prospective Diabetes Study show asignificant increase in weight in the intensive-treated group compared withthe conventional diet group by 3.1 kg for the cohort at 10 years [16].
There is a wide range of various dietary treatments which are offered byhealth professionals for the treatment of obese patients with T2D. Mostdietary treatments aim at a reduction of energy intake below energy needs.However, despite giving detailed recommendations patients find complianceextremely difficult and the effectiveness of standard dietary treatment ingeneral appears to be poor, particularly in the long term.
Thus, for weight loss in diabetic patients, programs are needed to increasethe amount of weight loss and to facilitate and improve long-term weightmaintenance.
Very Low Calorie Diets
One approach for effective weight reduction are very low calorie diets(VLCDs). These diets provide 600–800 kcal/day given as calorie-controlled,vitamin and mineral-fortified liquid meals taken as the sole nutrient source.
VLCDs have been proven effective in obese patients and also in obese sub-jects with T2D. In diabetic patients VLCDs induce weight loss and improveglycemic control. A meta-analysis showed that treatment with VLCDs over 12weeks decreased body weight by 9.6% of initial body weight and fastingplasma glucose values decreased to about 50% of initial values after 2 weeksand remained low for the 12 weeks of treatment [8]. Concomitant with thedecrease of plasma glucose concentrations glycosylated hemoglobin levelsand insulin levels decreased. Furthermore, excellent acceptance, complianceand safety are documented [17].
While VLCDs in obese subjects with T2D induce remarkable results ofshort-term weight loss, some observations show that VLCDs despite substan-tial initial weight loss do not maintain weight loss in the long term [18]. It can
Ditschuneit
174

be assumed that the liquid diets will not be maintained long-term becausesubjects on VLCDs are excluded from their normal daily activities.
Meal Replacements
The poor effectiveness of conventional dietary treatment may be improvedby use of a meal replacement program. Incorporating meal replacements intotraditional lifestyle interventions has been proven as a successful strategy forweight control in obese subjects.
Meal replacements are characterized by liquid formulas, powder formula-tions reconstituted with water or milk, or nutrition bars that are typically forti-fied with vitamins and minerals and with or without fiber. Meal replacementsas a tool for weight management is very popular among people trying to loseweight. In a dietician-led program more than 60% of subjects chose mealreplacements at least once daily as their preferred weight loss strategy [19].
In a typical meal replacement plan one or two full-energy meals arereplaced by a low-energy, nutritionally balanced product, while one meal isprepared with prudent self-selected conventional food. Snacks are replacedby nutrition bars or a low-fat dairy product or a piece of fruit. A weight lossprogram with meal replacements in place of one or two daily meals has beenshown to improve compliance with an energy-restricted diet in comparisonwith simply providing food plans [20].
A meal replacement plan has proven significantly more effective than con-ventional diet plans in obese subjects [21]. The use of a meal replacementplan was also effective in overweight and obese subjects working in high-stress jobs (police, hospital health professionals, flight crew members andfirefighters). After 12 months of treatment, the study participants had lost8.4% of their initial body weight and 1 year later 66% of the firefighters andaviation personnel had retained �80% of their weight loss at week 12 and halfof these weighed less than at week 12 [22].
In a meta- and pooling analysis of 6 studies weight loss induced by a partialmeal replacement plan at 3 months and at 1 year exceeded the weight lossinduced by a conventional diet plan. The weight loss of those completingthe study ranged between 2.61 and 4.35 kg (�3.7% of initial body weight) inthe conventional energy-restricted diet group, and between 6.97 and 7.31 kg(�7.8%) in the meal replacement group. At the 1-year evaluation 64% of thesubjects in the conventional diet group had dropped out compared to 47% ofsubjects in the meal replacement group [20]. The magnitude of weight loss in thepartial meal replacement group at 1 year was in the range of that often observedin effective pharmacologic weight control studies. Recently, in a review evaluat-ing the role of meal replacements in obesity treatment, the conclusion wasdrawn that meal replacements are a valid alternative dietary strategy in thetreatment of obesity and may aid long-term maintenance of weight [23].
Do Meal Replacement Drinks Have a Role in Diabetes Management?
175

A meal replacement plan has also proven effective in subjects with T2D.Weight loss with a liquid meal replacement plan was compared with anisocaloric energy-restricted diet. Maximum weight loss was achieved in bothprograms after 3 months and glycemic control improved in both groups ofpatients. However, at 1 year between the groups there were no significant dif-ferences in weight [24].
In another study with a meal replacement plan for 12 weeks subjects wererandomized into three groups using either a meal replacement containing lac-tose, fructose, and sucrose, a meal replacement in which fructose and sucrosewere replaced with oligosaccharides, or an exchange diet plan recommendedby the ADA [25]. Weight loss was significantly greater in the meal replace-ment groups than in the group with an exchange diet plan. During weightloss, there were reductions in glucose, insulin and HbA1c concentrations. Inaddition, the oral antidiabetic medications were reduced in some patients.Thus, it has been shown in this clinical study that meal replacements can beused safely as a part of a comprehensive treatment program for T2D patients.
In a meta- and pooling analysis [20], about 20% of the study population atbaseline was diabetic. There was no difference in weight loss between dia-betic and nondiabetic subjects at 3 months. However, patients with diabetesdid not maintain their weight loss at 1 year to the same extent as nondiabeticsubjects. These findings are consistent with earlier weight loss studies of dia-betic patients that have also shown a reduced long-term weight loss com-pared to nondiabetic patients [26].
The long-term efficiency of a meal replacement plan based on soy-basedmeal replacements was evaluated in a randomized prospective study in type-2diabetics. The study compared the effects of a meal replacement plan withthe effects of an individualized diet plan, as recommended by the ADA [27]. Inthis study, weight loss was achieved in both diet groups over the 12 months’study period. In the meal replacement group weight was reduced by 5.2 and4.3 kg at 6 and 12 months, respectively; in the individualized diet plan groupweight was reduced by 2.8 and 2.3 kg at 6 and 12 months, respectively. In themeal replacement group, glucose concentrations were lower than in the indi-vidualized diet group at 3, 6 and 12 months, respectively. The levels of HbA1cin the individualized diet group were reduced but were not significantly lowerthan at baseline; in contrast in the meal replacement group the mean HbA1clevel was reduced and significantly lower than in the individualized diet groupfor the entire study period.
Why Diets with Incorporated Meal Replacements
Improve Weight Loss and Weight Maintenance
Meal replacements are very popular in US adults trying to lose weight.According to a telephone survey, 15% of women and 13% of men were using
Ditschuneit
176

meal replacements for weight loss [28]. There are various reasons for thispopularity. Meal replacements help people lose weight by providing a con-trolled amount of calories and fat in a prefixed portion. They are convenient,easy to purchase, easy to store, and require little preparation. They are avail-able nearly everywhere and reasonably prized. Meal replacements reduce thenumber of decisions people have to make daily about what to eat and reducetheir exposure to tempting foods that might result in overeating. Two mealsare replaced, but the one remaining meal offers the opportunity to maintain anormal life, reduces barriers to dietary adherence, and helps to instill regulareating patterns. In addition, the remaining meal may increase the accuracy ofcalorie estimation and estimation of portion size, provides a simple guide forhealthy nutrition, and positively affects self-monitoring. Meal replacementsincorporated in the diet provide the nutrient composition necessary for long-term weight maintenance and healthy nutrition.
Within the weight management programs the meal replacement plan isallowing varying degrees of flexibility and variety in eating. The intake of oneor two meals per day with a nutritionally balanced formula means a strongstructure and the self-selection of additional meals and snacks means suffi-cient dietary variation. The meal replacement plan is a logical and easy-to-useplan for patients to follow, as supported by strong evidence.
Outlook
In contrast to the standard dietary approach, diet plans which include mealreplacements have been proved as an appropriate tool for weight reductionand for long-term weight loss maintenance in obese subjects and also in obesepatients with T2D. As individuals with diabetes appear to be less successful inweight loss and weight loss maintenance than nondiabetic individuals, themeal replacement strategy is particularly challenging in individuals with dia-betes. The weight loss results of studies with meal replacements have madefeasible a large long-term study: Action for Health in Diabetes. This study withapproximately 5,000 overweight volunteers with T2D sponsored by theNIDDK and the NIH (www.niddk.nih.gov/patient/SHOW/lookahead.htm) willevaluate the long-term health effects of an intensive lifestyle interventiondesigned to achieve and maintain weight loss. This program is compared to acontrol condition involving a program of diabetes support and education. Tohelp participants achieve and maintain weight loss, diet strategies in the formof meal replacements (e.g. prepared meals and liquid formula), exercisestrategies and optional weight loss medications are utilized. The primary out-come is the occurrence of cardiovascular events including myocardial infarc-tions and strokes and cardiovascular deaths.
The study will be conducted over a 13-year period, and the results are notavailable before the year 2012.
Do Meal Replacement Drinks Have a Role in Diabetes Management?
177

References
1 Tulloch-Reid MK, Williams DE, Looker HC, et al: Do measures of body fat distribution provideinformation on the risk of type 2 diabetes in addition to measures of general obesity? DiabetesCare 2003;26:2556–2561.
2 Colditz GA, Willett WC, Stampfer MJ, et al: Weight as a risk factor for clinical diabetes inwomen. Am J Epidemiol 1990;132:501–513.
3 Wang Y, Rimm EB, Stampfer MJ, et al: Comparison of abdominal adiposity and overall obesityin predicting risk of type 2 diabetes among men. Am J Clin Nutr 2005;81:555–563.
4 Eriksson K-F, Lindgarde F: Prevention of type 2 (non-insulin-dependent) diabetes mellitus bydiet and physical exercise. The 6-Year Malmo Feasibility Study. Diabetologia 1991;34:891–898.
5 Pan X-R, Li G-W, Hu Y, et al: Effects of diet and exercise in preventing NIDDM in people withimpaired glucose tolerance. Diabetes Care 1997;20:537–544.
6 Tuomiletho J, Lindstrom J, Eriksson JL, et al: Prevention of type 2 diabetes mellitus by changesin lifestyle among subjects with impaired glucose tolerance. N Engl J Med 2001;344:1343–1350.
7 Knowler WC, Barrett-Connor E, Fowler SE, et al: Reduction in the incidence of type 2 dia-betes with lifestyle intervention or metformin. N Engl J Med 2002;346:393–403.
8 Anderson JW, Kendall CWC, Jenkins DJA: Importance of weight management in type 2 dia-betes: review with meta-analysis of clinical studies. J Am Coll Nutr 2003;5:331–339.
9 Pories WJ, Swanson MS, MacDonald KG, et al: Who would have thought it? An operationproves to be the most effective therapy for adult-onset diabetes mellitus. Ann Surg 1995;222:339–350.
10 Sjöström L, Lindroos A-K, Peltonen M, et al: Lifestyle, diabetes, and cardiovascular risk fac-tors 10 years after bariatric surgery. N Engl J Med 2004;351:2683–2693.
11 Hadden DR, Blair ALT, Wilson EZ, et al: Natural history of diabetes presenting age 40–69years: A prospective study of the influence of intensive dietary therapy. Q J Med 1986;59:579–598.
12 American Diabetes Association: Nutrition principles and recommendations in diabetes(Position Statement). Diabetes Care 2004;27(suppl 1):S36–S46.
13 Keller U: Why does nutrition therapy so often fail in non-insulin-dependent diabetes? Whatmeasures bring success? Ther Umsch 1995;52:501–508.
14 Joslin Diabetes Center: Clinical Nutrition Guideline for Overweight and Obese Adults withType 2 Diabetes, Prediabetes or at High Risk for Developing Type 2 Diabetes. Boston, JoslinDiabetes Center, Publications Department, 2005, Publ. No. 617-226-5815.
15 Pi-Sunyer FX: Weight loss in type 2 diabetic patients. Diabetes Care 2005;28:1526–1527.16 UK Prospective Diabetes Study: Intensive blood-glucose control with sulphonylureas or
insulin compared with conventional treatment and risk of complications in patients with type2 diabetes (UKPDS 33). Lancet 1998;352:837–853.
17 Henry RR, Wallace P, Olefsky JM: Effects of weight loss on mechanisms of hyperglycemia inobese non-insulin-dependent diabetes mellitus. Diabetes 1986;35:990–999.
18 Wing RR: Use of very-low-calorie diets in the treatment of obese persons with non-insulin-dependent diabetes mellitus. J Am Diet Assoc 1995;95:569–572.
19 Bowermann S, Bellman M, Saltsman P, et al: Implementation of a primary care physician net-work obesity management program. Obes Res 221;9(suppl 4):321S–325S.
20 Heymsfield SB, van Mierlo CAJ, van der Knaap HCM, et al: Weight management using a mealreplacement strategy: meta and pooling analysis from six studies. Int J Obes 2003;27:537–549.
21 Flechtner-Mors M, Ditschuneit HH, Johnson TD, et al: Metabolic and weight loss effects oflong-term dietary intervention in obese patients: four-year results. Obes Res 2000;8:399–402.
22 Winick C, Rothacker DC, Norman RL: Four worksite weight loss programs with high-stressoccupations using a meal replacement product. Occup Med 2002;52:25–30.
23 Keogh JB, Clifton PM: The role of meal replacements in obesity treatment. Obes Rev 2005;6:229–234.
24 Hensrud DD: Dietary treatment and long-term weight loss and maintenance in type 2 dia-betes. Obes Res 2001;9(suppl 4):348S–353S.
25 Yip I, Go VL, DeShields S, et al: Liquid meal replacements and glycemic control in obese type2 diabetes patients. Obes Res 2001;9(suppl 1):341S–347S.
26 Wing RR, Marcus MD, Epstein LH, Salata R: Type II diabetic subjects lose less weight thantheir overweight nondiabetic spouses. Diabetes Care 1987;10:563–566.
Ditschuneit
178

27 Li Z, Hong K, Saltsman P, et al: Long-term efficacy of soy-based meal replacements vs an indi-vidualized diet plan in obese type 2 diabetes patients: relative effects on weight loss, meta-bolic parameters, and C-reactive protein. Eur J Clin Nutr 2005;59:411–418.
28 Levy AS, Heaton AW: Weight control practices of U.S. adults trying to lose weight. Ann InternMed 1993;119:661–666.
Discussion
Dr. Hill: I really want to congratulate you for doing the long-term studies, becausein the area of obesity treatment short-term studies tell us very little. Do you think ofmeal replacements as a drug so that their use will continue forever? If people don’tcontinue to use them, won’t they regain weight? So even though you have done a long-term study, the question is what happens over the even longer term? Will people haveto return to real foods eventually and what will happen to their weight when they do?
Dr. Ditschuneit: That is a very important issue in the treatment of obesity withmeal replacements. Meal replacements are considered to be drugs, at least by somepatients. The question when to return to conventional food is nearly always present.Many patients are doing well with the meal replacement plan and follow it to achievethe body weight that they strive for. After that, more and more they return to conven-tional meals. In the case of weight regain, they can again use meal replacements.Corresponding to the weight changes there will be a balance between meal replace-ments and real food.
Dr. Katsilambros: I would like also to congratulate you for the long-term study.How much protein and how much carbohydrate are there in the meal replacements?
Dr. Ditschuneit: In the 4-year study, each formula in the meal replacement plancontained 17 g protein and 34 g carbohydrates.
Dr. Katsilambros: The reason I am asking that is that if you combine carbohydrateand protein you have a very high insulin secretion. If you give preventively more pro-teins then the insulin secretion is less and perhaps the hunger is less.
Dr. Ditschuneit: In the weight loss phase with two meal replacements and oneconventional meal per day and also in the weight maintenance phase with one mealreplacement and two conventional meals, 45–50% of energy was derived from carbo-hydrates, 20–25% from protein and 30% from fat.
Dr. Katsilambros: What kind of carbohydrates?Dr. Ditschuneit: In the study most of the carbohydrate in the meal replacements
was sugar. The remaining conventional meals contained mainly complex carbohy-drates. We preferred putting glucose into the meal replacement because we had theimpression that the patients felt better. We think that somehow the sympathetic nerv-ous system was activated through stimulation of insulin secretion after uptake of glu-cose and amino acids.
Dr. Katsilambros: A stimulation but not high, if they are not combined with car-bohydrates.
Dr. Ditschuneit: Intensive and detailed interviews with the patients were per-formed, and the carbohydrate and protein intake was modified if needed.
Dr. Katsilambros: How good was the compliance in the conventional group? Whatwas the reason why they did not loose much weight?
Dr. Ditschuneit: Compliance was very good in both groups of patients. Because allthe patients had been transferred by a general physician to the university hospital,motivation to follow the study protocol was high. In addition the meal replacementswere free for the patients. Compliance in the conventional group was similar to that inthe meal replacement group. One reason was that the patients in the conventional
Do Meal Replacement Drinks Have a Role in Diabetes Management?
179

group were also promised the meal replacements for free after 3 months. We assumethat the weight loss in the patients of the conventional group was lower because theywere more tempted by dietary mistakes and due to the lower adherence to the dietaryprescriptions. For the patients it has been shown that it is easier to take a portion ofcontrolled meal replacement than to prepare a meal from self-selected conventionalfoods.
Dr. Katsilambros: But how was the compliance in the conventional group?Dr. Ditschuneit: Compliance was the same as in the meal replacement group. For
the reasons mentioned earlier, compliance within the first 3 months was completewith regard to visits to the hospital.
Dr. Katsilambros: It is very impressive then why they did not lose weight. Iremember long ago at the University of Ulm you used the zero diet. What happened tothese people? Did you have a follow-up? I am very curious to know.
Dr. Ditschuneit: Between 1970 and 1980 we had experience with starvation inobese patients. This situation was always transient and described as the zero diet. Thezero diet was an opportunity for morbidly obese patients to lose considerable amountsof weight within a short time. We have no long-term follow-up of these patients.
Dr. Foreyt: I agree with Dr. Hill, these data just didn’t exist before your studies onobesity, so congratulations. I have some questions regarding the maintenance phase.How much lifestyle intervention was necessary? How much counseling did they getwhen they came in every month or every 2 months? Did you just pass out the mealreplacements or did you actually do group therapy or individual treatment for an hour,what happened? Did you measure how much meal replacement they actually took?Was it the counseling or was it the meal replacements or both?
Dr. Ditschuneit: In the maintenance phase patients came in every month, andlater at least every 2 months. Group sessions were done regularly. In addition individ-ual consultations and training were done every month by a nutritionist. The timeneeded for a visit was variable and depended on individual problems. At each visit thenumber of meal replacements that the patient had used were counted and registered.The long-term outcome of the study was the result of regular and individual counsel-ing as well as the simplicity of the meal replacement program.
Dr. T. Wilkin: Did you suggest that the analysis was on the basis of cases availableor intention to treat?
Dr. Ditschuneit: The data were analyzed on the basis of all available cases, intention-to-treat. and of the last values traced back to baseline.
Dr. T. Wilkin: What percentage of those on the meal replacements did you lose at4 years?
Dr. Ditschuneit: At 4 years, of the 100 patients we lost a total of 25: 14 in the mealreplacement group and 11 in the conventional group.
Dr. Gerasimidi-Vazeou: In your study what was the volume of a meal that yougave to replace first the breakfast and second the lunch?
Dr. Ditschuneit: The volume of the meal replacement was 250 ml for breakfast aswell as lunch.
Dr. Golay: My concern is for clinicians. Most of the time the patients cannot takeliquid diets forever and they eat them on top of the regular diet so they gain weight. Interms of patient education, it is also not a really good idea to propose liquid diets for-ever. It is better to teach them to eat a regular diet. It is a big problem for me to pro-pose a liquid diet to our patients.
Dr. Ditschuneit: I agree that patients cannot take liquid diets forever and we donot propose this. With a partial meal replacement plan, patients have a structuredmeal plan and can be taught a healthy diet.
Ditschuneit
180

Dr. Golay: I am very pleased to hear that. For a mother with children it is difficultto eat a liquid diet all the time. My best patients for a liquid diet are surgeons; they likethis kind of meal because it is fast.
Dr. Ditschuneit: We do not recommend partial meal replacement for children.Dr. Bantle: I have two comments. First for Dr. Golay, I have no concern about
using these products. We use them both in research and in clinical practice and theyactually provide better nutrition than meals for many people because they are fortifiedwith vitamins and minerals. You can demonstrate that calcium intake is increased byusing meal replacements. The second comment pertains to weight loss in people withtype-2 diabetes. I agree that it is more difficult to accomplish than it is in non-diabeticpopulations. But I don’t think that is because they comply with treatment less well. Ithink the more likely explanation is that the treatment reduces urine glucose so, asthey lose weight and plasma glucose declines, the calories previously lost in the urineare retained. Said in a different way, they are actually too thin for their caloric intakebecause of glucosuria.
Do Meal Replacement Drinks Have a Role in Diabetes Management?
181


Physical Activity in Prevention and Management of Obesity and Type-2 Diabetes
James O. Hill, Jennifer Stuht, Holly R. Wyatt,
Judith G. Regensteiner
Center for Human Nutrition, University of Colorado School of Medicine, Denver, CO, USA
AbstractObesity and type-2 diabetes can be considered diseases of physical inactivity.
Physically activity protects against type-2 diabetes through its positive effects onweight management and on the metabolic pathways involved in glycemic control thatare not weight-dependent. Increasing physical activity is one of the most effectivestrategies both for preventing type-2 diabetes and for managing it once it is present.However, we still face an enormous challenge in getting people to achieve sustainableincreases in physical activity. A promising strategy is to get people walking more,starting small and increasing gradually over time.
Copyright © 2006 Nestec Ltd., Vevey/S. Karger AG, Basel
Introduction
Physical inactivity is a critical factor in the etiology and treatment of type-2diabetes. There is a clear inverse relationship between physical activity andinsulin resistance [1], and the risk of developing type-2 diabetes is decreasedwith physical activity [2–5]. The relationship between physical activity andthe risk of type-2 diabetes holds across different methods of assessing physi-cal activity from self-reports to measured cardiorespiratory fitness [2–5]. Forexample, figure 1 shows how the incidence of type-2 diabetes per 1,000 person-years varies with cardiorespiratory fitness in men [4]. Increased cardiorespi-ratory fitness (which can be increased by physical activity) reduced the risk
Bantle JP, Slama G (eds): Nutritional Management of Diabetes Mellitus and Dysmetabolic Syndrome.Nestlé Nutr Workshop Ser Clin Perform Program, vol 11, pp 183–196,Nestec Ltd., Vevey/S. Karger AG, Basel, © 2006.
183
The Role of Drugs and Diet Therapy – Alone and Together

of developing type-2 diabetes in both overweight and non-overweight individ-uals, in young and older individuals, in those with and without impaired fastingglucose, and in those with and without parents with diabetes. A similar nega-tive relationship was found between self-reported physical activity and therisk of type-2 diabetes in a group of 87,253 middle-aged women [2].
Physical activity impacts type-2 diabetes in at least two ways. First, increasedphysical activity is associated with less overweight and obesity (both throughprevention and treatment of obesity). Since overweight and obesity increasethe risk of type-2 diabetes [6], less overweight and obesity is associated withless type-2 diabetes. Second, physical activity helps in the prevention andtreatment of type-2 diabetes through weight-independent effects on meta-bolic pathways involved in diabetic control [1, 7, 8].
Obesity and Type-2 Diabetes
A strong association between indices of overweight and obesity and thedevelopment of type-2 diabetes has been reported in a great many studies. As
Hill/Stuht/Wyatt/Regensteiner
184
Age�45 years
P�0.01
Age�45 years
P�0.001
0
1
2
3
4
Rate
per
1,0
00
pers
on
-years
5
6
7
8
Parental
diabetes
P�0.004
No parental
diabetes
P�0.001
01234
Rate
per
1,0
00 p
ers
on-y
ears
56
87
9
BMI�27 kg/m2
P�0.006
BMI�27 kg/m2
P�0.001
0123456
87
9
Impaired fasting
glucose
P�0.001
Normal fasting
glucose
P�0.002
0
5
10
15
20
25
a b
c d
High fitness
Moderate fitness
Low fitness
Fig. 1. Incidence of type-2 diabetes per 1,000 person-years by cardiorespiratoryfitness levels according to age group (aa), body mass index (BMI; bb), history ofparental diabetes (cc), and impaired fasting glucose (dd).
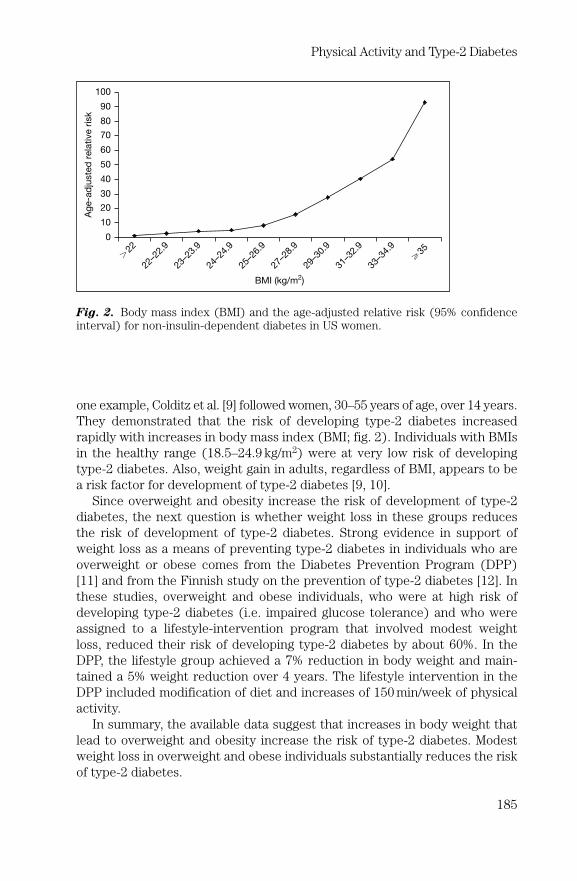
one example, Colditz et al. [9] followed women, 30–55 years of age, over 14 years.They demonstrated that the risk of developing type-2 diabetes increasedrapidly with increases in body mass index (BMI; fig. 2). Individuals with BMIsin the healthy range (18.5–24.9 kg/m2) were at very low risk of developingtype-2 diabetes. Also, weight gain in adults, regardless of BMI, appears to bea risk factor for development of type-2 diabetes [9, 10].
Since overweight and obesity increase the risk of development of type-2diabetes, the next question is whether weight loss in these groups reducesthe risk of development of type-2 diabetes. Strong evidence in support ofweight loss as a means of preventing type-2 diabetes in individuals who areoverweight or obese comes from the Diabetes Prevention Program (DPP)[11] and from the Finnish study on the prevention of type-2 diabetes [12]. Inthese studies, overweight and obese individuals, who were at high risk ofdeveloping type-2 diabetes (i.e. impaired glucose tolerance) and who wereassigned to a lifestyle-intervention program that involved modest weightloss, reduced their risk of developing type-2 diabetes by about 60%. In theDPP, the lifestyle group achieved a 7% reduction in body weight and main-tained a 5% weight reduction over 4 years. The lifestyle intervention in theDPP included modification of diet and increases of 150 min/week of physicalactivity.
In summary, the available data suggest that increases in body weight thatlead to overweight and obesity increase the risk of type-2 diabetes. Modestweight loss in overweight and obese individuals substantially reduces the riskof type-2 diabetes.
Physical Activity and Type-2 Diabetes
185
Ag
e-a
dju
ste
d r
ela
tive r
isk
0
10
20
30
40
50
60
70
80
90
100
22–2
2.9
23–2
3.9
24–2
4.9
25–2
6.9
27–2
8.9
29–3
0.9
31–3
2.9
33–3
4.9
�35
BMI (kg/m2)
�22
Fig. 2. Body mass index (BMI) and the age-adjusted relative risk (95% confidenceinterval) for non-insulin-dependent diabetes in US women.

Physical Activity and Obesity
Physical Activity in Prevention of Obesity
Results of epidemiological studies are consistent in that those who arephysically active are less likely to gain weight over time and become obesethan those who are not. Several studies [13–16] have found that individualswho remain physically active or increase physical activity over time are lesslikely to gain weight than those who remain sedentary or who reduce physicalactivity over time.
There are very few prospective, randomized trials examining the ability ofphysical activity to prevent weight gain. Such trials are solely needed in orderto establish a causal relationship between physical activity and prevention ofweight gain and in order to identify how much physical activity is required toprevent weight gain. This amount may vary between populations and betweenlife stages of individuals.
Physical Activity in Obesity Treatment
While it is possible to lose weight with physical activity alone, the amountof physical activity required for substantial weight loss is well beyond what isfeasible for most Americans. Wing [17] reviewed several studies in whichphysical activity alone was used for weight loss. While the amount of weightloss with physical activity was significantly greater than 0, it was in the orderof only a few pounds.
Similarly, Wing [17] reviewed several studies in which weight loss with dietalone was compared with weight loss with diet plus exercise. It was con-cluded that most studies found no significant differences in total weight lossbut that in just about every study the absolute amount of weight lost was a lit-tle higher when diet and exercise were used. This is not surprising given thatweight loss is a function of the degree of energy imbalance and that a muchgreater energy imbalance can be created with food restriction than withincreased physical activity.
Even though adding physical activity to food restriction adds little when itcomes to initial weight loss, there may be other advantages of engaging inphysical activity during weight loss that increase the chances that the weightloss will be maintained. Physical activity could result in a higher proportion ofweight loss coming from fat and less from fat-free mass loss [18]. This couldreduce the drop in metabolic rate that accompanies weight loss. Anotheradvantage of engaging in physical activity during weight loss is that it maybetter prepare the person to be able to engage in sufficient amounts of phys-ical activity to keep weight off.
Hill/Stuht/Wyatt/Regensteiner
186

Role of Physical Activity in Maintenance of Weight Loss
In many studies, high levels of physical activity have been found to predictsuccess in long-term weight loss maintenance [19–22]. For example, subjectsin the National Weight Control Registry who are maintaining an averageweight loss of about 30 kg for about 5.5 years, report expending about2,800 kcal/week (�60–90 min/day) in physical activity [19]. Less than 10% ofthe successful weight loss maintainers report that they are maintaining theirweight loss with diet alone. Decreases in physical activity in this group pre-dict weight regain over time. Others [20–22] have found that amounts ofphysical activity equivalent to about 60–90 min/day are associated with suc-cessful weight loss maintenance.
Role of Physical Activity in Management of
Obesity and Type-2 Diabetes
In addition to lowering the risk of type-2 diabetes, physical activity andhigh cardiorespiratory fitness can lower the risk of macrovascular disease,hypertension, and some cancers [23]. Increased physical activity is also asso-ciated with reduced all-cause mortality, even in individuals who are alreadyoverweight or obese and in those who have type-2 diabetes [23–25].
Non-Weight-Dependent Effects of Physical Activity
on Prevention and Management of Type-2 Diabetes
Physical activity has impacts on metabolism that seem to improve manage-ment of type-2 diabetes independent of weight loss [1, 7, 8]. Increased physi-cal activity reduces insulin resistance, improves insulin sensitivity, andincreases glucose disposal rates even independent of changes in body weightor body fatness [1, 7, 8]. In addition to insulin resistance and glycemic control,other factors which likely play a role in causing exercise impairments andwhich might be amenable to treatment include endothelial dysfunction, car-diac abnormalities and mitochondrial abnormalities [7, 8].
How Much Physical Activity Can Prevent
Obesity and Type-2 Diabetes
Increasing physical activity is widely recommended as a strategy for pre-vention and management of obesity and type-2 diabetes. Increasing physicalactivity levels in the population could have a major effect on reducing theincidence of both diseases. However, there are no definitive data to allow spe-cific recommendations about the amount of physical activity that may be
Physical Activity and Type-2 Diabetes
187

effective in the prevention and management of these diseases. The exceptionis that maintaining a significant weight loss seems to require about 60–90 min/day of physical activity [19–22]. It has been suggested that far less physicalactivity is required to prevent weight gain and that increases in walking assmall as 2,000 extra steps each day (about 15–20 min or about 1.6 km) canprevent the gradual weight gain seen in most of the population. The AmericanDiabetes Association recommends 30 min/day of physical activity for individ-uals with type-2 diabetes, which is based on recommendations from othercredible groups [26] and on improvements in overall health. It is likely thatthe minimum effective dose of physical activity to prevent or manage obesityand type-2 diabetes will vary somewhat from person to person. However,when it comes to the prevention/treatment of obesity and type-2 diabetes,any increase in physical activity seems beneficial. The epidemiological workby Wei et al. [4] and Blair and Brodney [23] has consistently suggested thatthe greatest benefit of physical activity on the prevention of chronic diseasesand mortality comes from getting the most sedentary individuals to makesmall increases in physical activity.
Strength training on a regular basis may also have a beneficial effect onglucose tolerance [8]. However, such training may not improve maximal oxy-gen consumption. Thus, strength training should probably be considered anadjunct rather than the primary form of training for persons with type-2 dia-betes, since aerobics produces both types of benefit.
How to Get People Active
While there is great agreement on the benefits of physical activity, there isstill a big challenge in getting people to increase physical activity. The envi-ronment we have constructed is not one that encourages physical activity,and in fact many technological advances of the last decades have likelycaused substantial declines in physical activity [27].
Increases in physical activity can be promoted in different ways. In generalthis can be though promoting planned physical activity or exercise, andthrough promoting increases in lifestyle physical activity. The latter involvesshowing people how to increase physical activity (i.e. walking) throughouttheir usual day without the need to set aside planned exercise time. For indi-viduals maintaining a significant weight loss, both strategies will likely berequired in order to achieve sufficient physical activity. For prevention of the0.45–0.90 kg of weight gained each year by the average American, either strat-egy alone could be sufficient.
Walking may be one of the best ways to get people to increase physicalactivity. A study by Hu et al. [28] suggests that vigorous exercise is not requiredto reduce the risk of type-2 diabetes. They found that walking was negativelyassociated with the risk of developing diabetes. In a prospective study,
Hill/Stuht/Wyatt/Regensteiner
188

DiLoreto et al. [29] evaluated the impact of walking on patients with type-2diabetes. They proscribed walking for their patients and, in a post hoc analy-sis, found significant health and financial benefits to increased walking. Theseincluded improvements in blood pressure, lipids, and glucose. Further, theyearly cost of medications decreased with increased walking. While anyamount of walking was beneficial, the greatest benefits occurred withincreases in physical activity of �10 metabolic equivalents (METs)/h/week.
This is consistent with the idea of helping people make small rather thanlarge behavior changes. Step counters (pedometers) have been used effec-tively to produce gradual increases in physical activity. While physical activitylevels of �30 min/day may be desirably, any increases in physical activity canbenefit health and help in the maintenance of a healthy body weight.
Special Considerations for Physical Activity and Type-2 Diabetes
Exercise testing is recommended for many persons with type-2 diabetesbefore beginning an exercise conditioning program because of the high preva-lence of occult cardiovascular disease, symptoms of which may only be mani-fested during exercise [30, 31]. Specifically, many patients with diabetes mayhave ischemia or infarction without angina. Most experts recommend thatpersons with type-2 diabetes be tested if the individual has previously beeninactive, has had diabetes for more than 10 years, or is over the age of 35 [30,31]. However, because of the potential of false-positive exercise tests, furthermore invasive testing may be required to substantiate a positive stress test.
Exercise testing can also be used to provide an exercise prescription.Although measurement of oxygen consumption is the most reliable way toassess exercise capacity and create an exercise prescription, it is often notpractical to measure it in the clinical setting. Therefore, maximal heart ratemeasured during the treadmill test can be used as a crude but reasonablesubstitute. One exception is that patients with autonomic neuropathy as acomplication of diabetes may not be able to achieve an age-predicted maxi-mal heart rate which may reduce the sensitivity of the test. In these patients,if an accurate exercise prescription is of importance, maximal oxygen con-sumption should be measured.
The presence of type-2 diabetes alone does not require a supervised exer-cise conditioning program. However, there are several specific groups ofpatients with type-2 diabetes for whom a more formal exercise conditioningprogram is desirable including patients with some types of heart disease.
Safety Considerations
As with any population, increasing physical activity has some potentialrisk for the patient with type-2 diabetes. Individuals who have underlying
Physical Activity and Type-2 Diabetes
189

coronary heart disease, as in non-diabetic patients with heart disease, exercisemay theoretically precipitate angina, myocardial infarction, arrhythmias oreven sudden death. As with other patients with coronary heart disease, physi-cal activity is contraindicated in the presence of unstable angina. High inten-sity aerobic exercise and isometric exercise are contraindicated in the patientwith proliferative retinopathy because of an increased risk of developing retinalor vitreous hemorrhages and retinal detachment. However, moderate intensityaerobic exercise, such as walking, is an acceptable modality of treatment.Patients with peripheral neuropathy should not engage in exercise which maytraumatize the insensitive foot (such as jogging). In addition, properly fittedfootwear and checking of the feet for injury after exercise are recommendedprecautions. Data evaluating the potential problem of exercise-induced hypo-glycemia in type-2 diabetes patients taking oral agents or insulin are lacking.However, non-diabetic individuals taking oral hypoglycemic drugs developedhypoglycemia during prolonged exercise. A reasonable precaution is to moni-tor blood glucose frequently upon initiating a physical activity program. Thepositive effects of physical activity in persons with type-2 diabetes may requireadjusting medications and physicians should be alert for this need when theirpatients begin increasing physical activity.
References
1 Gautier JF, Scheen A, Lefebevre PJ: Exercise in the management of non-insulin-dependent(type 2) diabetes mellitus. Int J Obes 1995;19(suppl 4):S58–S61.
2 Manson JE, Rimm EB, Stampfer MJ, et al: Physical activity and incidence of non-insulindependent diabetes mellitus in women. Lancet 1991;338:774–778.
3 Helmrich SP, Ragland DR, Leung RW, et al: Physical activity and reduced occurrence of non-insulin dependent diabetes mellitus. N Engl J Med 1991;325:147–152.
4 Wei M, Gibbons LW, Mitchell TL, et al: The association between cardiorespiratory fitness andimpaired fasting glucose and type 2 diabetes mellitus in men. Ann Intern Med 1999;130: 89–96.
5 Lynch J, Helmrich SP, Lakka TA, et al: Moderately intense physical activities and high levelsof cardiorespiratory fitness reduce the risk of non-insulin dependent diabetes mellitus inmiddle-aged men. Arch Intern Med 1996;156:1307–1314.
6 Bray GA: Contemporary Diagnosis and Management of Obesity. Newtown, Handbooks inHealth Care, 1998.
7 Colberg SR, Swain DP: Exercise and diabetes control: a winning combination. Phys Sportsmed2000;28:online version.
8 White RD, Sherman C: Exercise in diabetes management. Phys Sportsmed 1999;4:online version.9 Colditz GA, Willett WC, Rotnitzky A, et al: Weight gain as a risk factor for clinical diabetes in
women. Ann Intern Med 1995;122:481–486.10 Chan JM, Rimm EB, Colditz GA, et al: Obesity, fat distribution, and weight gain as risk factors
for clinical diabetes in men. Diab Care 1994;17:961–969.11 Diabetes Prevention Program Research Group: Reduction in the incidence of type 2 diabetes
with lifestyle intervention or metformin. N Engl J Med 2002;346;393–402.12 Tuomiletho J, Lindstrom J, Eriksson JG, et al: Prevention of type 2 diabetes mellitus by
changes in lifestyle among subjects with impaired glucose tolerance. N Engl J Med 2001;344:1343–1350.
13 Haapanen N, Miilunpalo S, Pasanen M, et al: Association between leisure time physical activ-ity and 10-yr body mass change among working-aged men and women. Int J Obes Relat MetabDisord 1997;21:288–296.
Hill/Stuht/Wyatt/Regensteiner
190

14 Dipietro L, Dziura J, Blair SN: Estimated change in physical activity levels (PAL) and predic-tion of 5-year weight change in middle-aged men: the aerobics center longitudinal study. MedSci Sports Exerc 2005, in press.
15 Schmitz KH, Jacobs DRJ, Leon AS, et al: Physical activity and body weight: associations overten years in the CARDIA Study. Coronary Artery Risk Development In Young Adults. Int JObes Relat Metab Disord 2000;24:1475–1487.
16 Williamson DF, Madans J, Anda RF, et al: Recreational physical activity and ten-year weightchange in a US national cohort. Int J Obes Relat Metab Disord 1993;17:279–286.
17 Wing RR: Physical activity in the treatment of the adulthood overweight and obesity: currentevidence and research issues. Med Sci Sports Exerc 1999;31(suppl):S547–S552.
18 Ross R, Janssen I: is abdominal fat preferentially reduced in response to exercise inducedweight loss? Med Sci Sports Exerc 1999;31(suppl):S568–S572.
19 Klem ML, Wing RR, McGuire MT, et al: A descriptive study of individuals successful at longterm maintenance of substantial weight loss. Am J Clin Nutr 1997;66:239–246.
20 Schoeller DA, Shay K, Kushner RF: How much physical activity is needed to minimize weightgain in previously obese women? Am J Clin Nutr 1997;66:551–556.
21 Weinsier WL, Hunter GR, Desmond RA, et al: Free-living activity energy expenditure inwomen successful and unsuccessful at maintaining a normal body weight. Am J Clin Nutr2002;75:499–504.
22 Jakicic JM, Winters C, Lang W, Wing RR: Effects of intermittent exercise and use of homeexercise equipment on adherence, weight loss and fitness in overweight women. JAMA 1999;282:1554–1560.
23 Blair SN, Brodney S: Effects of physical inactivity and obesity on morbidity and mortality:current evidence and research issues. Med Sci Sport Exerc 1999;31(suppl 1):S646–S662.
24 Wei M, Gibbons LS, Kampert JB, et al: Low cardiorespiratory fitness and physical inactivity aspredictors of mortality in men with type 2 diabetes. Ann Intern Med 2000;132:605–611.
25 Church TS, Cheng YJ, Earnest CP: Exercise capacity and body composition as predictors ofmortality among men with diabetes. Diabetes Care 2004;27:83–88.
26 US Department of Health and Human Services: Physical Activity and Health: Report of theSurgeon General. Atlanta, US Department of Health and Human Services, Centers for DiseaseControl and Prevention, National Center for Chronic Disease Prevention and Health Promotion,1996.
27 Hill JO, Wyatt HR, Reed GW, Peters JC: Obesity and the environment: where do we go fromhere? Science 2003;299:853–855.
28 Hu FB, Sigal RJ, Rich-Edwards JW, et al: Walking compared with vigorous physical activityand risk of type 2 diabetes in women. JAMA 1999;282:1433–1439.
29 DiLoreto CD, Fanelli C, Lucidi P: Make your diabetic patients walk. Diabetes Care 2005;28:1295–1302.
30 Sigal RJ, Kenny GP, Wasserman DH, Castaneda-Sceppa C: Physical activity/exercise and type2 diabetes. Diabetes Care 2004;27:2518–2539.
31 Consensus Development Conference on Diet and Exercise in Non-Insulin-DependentDiabetes Mellitus. National Institutes of Health. Diabetes Care 1987;10:639–644.
Discussion
Dr. Mooradian: The issue of being fit and its correlation with mortality or outcomemeasures: the data you showed, specifically the data in type-2 diabetes and any otherdata in the literature, are mostly correlations and they are very hard to pin down tofitness. A lot of the time people who tend to be fit are also healthier individuals, so over-all other co-morbidities will be less so. It is very hard to sort out fitness as an independ-ent predictor of outcome. Another issue is that, as far as I know, there are absolutely nodata to show that, as you recommend, increasing food intake and exercise actuallyimproves longevity or health, other than the non-tangible benefits of exercise that weare all aware of, and there are many benefits of exercise. In contrast, a lot of data showthat if you restrict food you improve life expectancy invariably in many species. So if
Physical Activity and Type-2 Diabetes
191

you want to make a recommendation based on outcome, it seems to me that it is betterto restrict food rather than liberalize it, and then do a lot of exercise.
Dr. Hill: Let me deal with both those issues because these are really goodquestions. I am glad you asked about the fit and fat issue. Even though people call it acontroversy, it isn’t. I believe the data suggest that whatever your fatness level it isbetter to be fitter, and whatever your fitness level it is better to be leaner. We can pro-duce significant weight loss in patients with a BMI of �40, but most will still be over-weight or obese. Our treatment for these individuals should be aimed both atproducing weight loss and increasing physical fitness. As we are more successful atdoing this, we will create more fit and fat people. The research on caloric restrictionand longevity is very interesting. There were some data presented at the obesity meet-ings in Vancouver suggesting that increased exercise may also positively impactlongevity. The question is whether it is calorie restriction or avoiding positive energybalance that increases longevity.
Dr. Metzger: Do you see any allowance for an inherent influence on the level ofphysical activity? The reason I bring this up is that there have been some reports thatalready from intrauterine time onward babies predisposed to have more body fat andindividuals predisposed to be heavy already have a reduced level of physical activity.
Dr. Hill: This is an interesting concept to consider. We are learning that theintrauterine environment can have a major impact on metabolism and weight later inlife. I don’t think we have any data about this, but it is certainly possible that theintrauterine environment could affect later physical activity.
Dr. Bantle: We commonly think of exercise as a means of expending energy andthat is the mechanism whereby it influences weight. But I wonder about another pos-sibility. Distance runners are uniformly lean and I ask myself why. Is it because theycan’t eat enough to keep up with their exercise? In fact, what they eat is absolutelyastounding in terms of amounts and calories. So my question is, could there beanother mechanism involved here? Is it possible that the hypothalamus responds tothe level of habitual physical activity and adjusts body configuration to conform to theneed? In effect, the hypothalamus might say, ‘We have to run 50 km/week and we needto stay lean to do that’.
Dr. Hill: We know the brain is very important in body weight regulation but it isnot totally clear what is being regulated. The brain could be regulating an amount ofenergy intake, an amount of physical activity (or energy expenditure) or an amount ofbody weight or body fat. Distance runners are a unique group and it is possible thatthey are regulating around a high level of physical activity. Alternatively they may beregulating a high level of energy intake and the high levels of physical activity are nec-essary to keep them lean. I think that people can modify their physical activity level tosome extent and that the level of physical activity affects the sensitivity of many meta-bolic processes in the body. I see the sedentary state as the abnormal state so ratherthan have a note from your doctor to exercise, you should have a note from your doc-tor to be sedentary. There is some evidence from the Pima Indians that leptin regula-tion may be different in the Mexican Pimas who are much more physically active thanthe Pimas in Arizona. So I think we may find that the level of physical activity plays arole in the precision of regulation of some metabolic processes. The brain and specifi-cally the hypothalamus are almost certainly involved.
Dr. Chiasson: I was wondering about the obese population that you followed inthe registry. You said that in those who maintain moderate exercise, their body weightis gradually reduced through exercise. Is that a failure to moderate exercise or a fail-ure to follow diet over time?
Dr. Hill: The short answer is we don’t know. What we know is that the people whoare successful at weight loss maintenance report high levels of physical activity and
Hill/Stuht/Wyatt/Regensteiner
192
people whose exercise decreases over time gain weight. There are several studies thatsuggest that people who are only moderately active are unable to maintain theirweight loss. It seems to take a lot of exercise to maintain large weight losses. I thinkthe amount of exercise you have to do is related to the amount of weight you lose. Themore weight you are keeping off, the more you have to exercise.
Dr. Chow: It is possible to induce someone to engage in some exercise; perhapsyou can effect a change of mind so they will be more self-disciplined which means thatthey probably will also be more compliant in diet and follow the guidelines from themedical profession. Do you agree, and do you have any evidence for this?
Dr. Hill: That is a good question and that is one of the alternative hypotheses forwhy exercise is always such a great marker of success in weight loss maintenance. Itcould simply be a marker of compliance, so if a person is exercising regularly they arealso more likely to be eating healthily. One reason I think exercise itself is important isthat when we estimate how much metabolic rate should have changed with weightloss for people in the National Weight Loss Registry, the amount of exercise they aredoing is very close to this value. Thus, I think the advantage of high levels of exerciseis that it allows these people to maintain a lower weight with having to engage in con-stant food restriction.
Dr. Slama: For the sake of the discussion I would like to recall the words ofWinston Churchill. When he was asked the recipe for his long life he said: no sport, nosport at all, Scotch and cigar every day. I would like to challenge the idea put forwardby Elliott Joslin who said that you cannot treat diabetes without exercise, insulin anddiet, and more precisely that you cannot control diabetes without exercise. We did astudy in our department showing that there is a population of diabetic people who isvery well controlled with a very low level of exercise. We also have type-1 and type-2diabetic people who are very badly controlled with a very high level of exercise. In anydirection you can find something, but you may also observe a large population ofpatients with a very low level of exercise and perfect blood glucose control. But ofcourse exercise has a much more important effect on life: cardiovascular disease pre-vention.
Dr. Hill: You make a very good point. In the National Weight Control Registry forexample there are about 9% of people who are maintaining weight loss without exer-cise. So I do think there is going to be a population for whom exercise may not beeffective and diet is critically important. I think there is probably a population forwhom exercise is tremendously important and exercise alone may be sufficient tomaintain a healthy weight. Most people are going to be in the middle where exercise isgoing to help but diet changes are also needed. The more I look at this issue, the moreI believe that exercise is more effective the earlier in the cascade of chronic diseaseyou are. I think it is the most effective in preventing obesity and diabetes in lean people.I think the more you go down the path toward diabetes and cardiovascular disease, themore exercise you have to do to positively impact health.
Ms. June Chan: You mentioned that in the National Weight Control Registry mostpeople use walking and some use resistance training. Do you have any data showingthat resistance training plus aerobic exercises is going to be better than aerobics alonein terms of weight maintenance or obesity prevention?
Dr. Hill: We looked at the proportion of people in the registry who reported engag-ing in resistance training or weight lifting versus the proportion in a general survey ofthe American population. A higher proportion of women in the National WeightControl Registry (15–20%) reported engaging in resistance training as compared towomen in the general public (5–6%). We do not know if this is a factor in their successor not. There are some data in the literature showing that resistance training has sim-ilar effects to aerobic activity in obesity treatment. I don’t think resistance training can
Physical Activity and Type-2 Diabetes
193

totally take the place of aerobic activity, but it can be a positive companion to aerobicactivity.
Dr. T. Wilkin: I was interested in Dr. Bantle’s comments on the hypothalamus andthe possibility that it censures the physical activity that is accomplished. We studyphysical activity in children, and about 18 months ago reported in the British MedicalJournal [1] a study in 3 different schools with very different opportunities for physicalactivity. In one of the schools it was 9 h and in another school under 2 h, so it was avery big range. As you might expect the activity of the children in the school that gavethe most opportunity did much more during the day time. We used accelerometers tomeasure this, so these would be reasonably objective measurements we were making.However, when these children got home in the evening they just flopped. The childrenwho got under 2 h perked up in the evening. If you added the out-of-school to the in-school activities, you got the same over the whole of the range. This lead us to do anumber of other studies, all of which put together suggest very strongly that there isan activity stat, at least in children, which regulates the amount of activity they do. Isuspect that as children become teenagers and beyond there may be social cues thatmay override this, but it is probably most strong in children.
Dr. Hill: I think it is a possibility. I know there are some data in elderly peopleshowing that when they were given a supervised exercise program that they weremore sedentary in the rest of the day. But I am very skeptical that the amount of phys-ical activity is fixed. Again, people in the National Weight Loss Registry were able tomaintain large, permanent increases in physical activity.
Dr. Barclay: You mentioned the importance of breakfast, and we often hear that itis better to get your calories more in the morning than in the evening. What is the evi-dence for that in terms of weight maintenance and weight loss?
Dr. Hill: There is a fair amount of evidence that eating breakfast has a positiveeffect on body weight. First of all there are several epidemiology studies showing thatpeople who eat breakfast are leaner than those who do not. There are studies reportingthat people who eat breakfast end up eating fewer calories during the day than thosewho do not. Finally there are studies showing that satiety is highest for food eaten earlyduring the day compared to food eaten later in the day. So we have a lot of circumstan-tial evidence suggesting the importance of breakfast for weight management.
Dr. Golay: You propose 60 min of exercise for obese patients but in fact theyshould have even less than that because they are obese. The energy expenditure inobese patients is much higher, so I would propose even less than 15 min for obesecompared to lean patients.
Dr. Hill: I don’t think 15 min is enough. You are correct that obese people have ahigher cost of exercise, but I still think it takes about an hour a day of exercise tomaintain a large weight loss. I think this may be because subjects are making up forsome sort of metabolic price of being obese.
Dr. Metzger: I want to come back to the question about the calorie distributionthrough the day. There are animal models from 45–50 years ago showing that caloriesremained constant. If a large proportion of calories is administered to experimental ani-mals in the latter half of the day, equivalent to our dinner time, body composition is sig-nificantly affected resulting in more hepatic lipid synthesis, increased body fat at thesame isocaloric intake. I think there have been some human studies that would be con-sistent with that, but obviously they can’t be as interventional as the animal studies.
Dr. Hill: I think we see that pattern. I know you all see it in your obese subjectswho skip breakfast, eat a light lunch and start eating at 3 or 4 in the afternoon and eatall through the night. This may be the worst meal pattern. I think that by eating break-fast you break up that pattern and this may be beneficial.
Dr. Ho: I have a question regarding the relationship between the exercise and thetiming of meals.
Hill/Stuht/Wyatt/Regensteiner
194

Dr. Hill: I believe that the most important decision is whether to exercise or notregardless of when you exercise. The literature is mixed regarding the interaction ofeating and exercise. My reading of the literature is that if there is an interaction, it issmall. The far bigger effect is whether you do any exercise or not.
Dr. Halimi: Regarding type-2 diabetic patients, one of the major objectives is thecontrol of glycemia, not only for reducing the high cardiovascular risk but mainly forpreventing microangiopathy. In your opinion what is the best duration for reducingglycemia if we consider that the body doesn’t burn the same fuel according to theduration of a physical exercise and what training could change?
Dr. Hill: So you asking how the interaction of exercise and meals affects glycemiaduring the day? I think that is an interesting question and that is where perhaps exer-cise and meals might play a role. If it is glycemia that is the issue, then the timing ofexercise in type-2 diabetes could be important.
Dr. Halimi: Not only because of the time of the meal. After 30 or 45 min the fuelutilized changes, and there is some evidence in favor of a longer duration of physicalexercise in type-2 diabetics when compared to obese patients.
Dr. Hill: There is a tradeoff between the duration and intensity of exercise. Theeffects depend on intensity and duration. The more intense you exercise the morecarbohydrate versus fat is oxidized. Moderate intensity longer duration exercise burnsproportionally more fat but less calories. For weight management in non-diabetics, thetotal amount of energy expended in physical activity is probably more important thanthe timing and intensity. For diabetics, the timing and intensity may be more impor-tant and could affect glycemia during the day.
Ms. Franz: A concern I have with the Weight Loss Registry is that it may lead indi-viduals to have unrealistic weight loss goals. While there are participants in weight lossprograms who will lose larger amounts of weight and those who will lose none, themajority will likely lose 4.5–7.5 kg at 12 months and, with continued support, maintaina weight loss of 3–4 kg [2, 3]. They will not be as successful at weight loss as the indi-viduals in the Weight Loss Registry but will still experience health benefits as evi-denced by participants in the Diabetes Prevention Program. Women participating in aweight loss program expected to lose 34% of their body weight, and despite a weightloss of 16%, they reported being unsatisfied with their weight loss [4]. Baseline expec-tations are also reported to be an independent predictor of attrition in obese patientsentering a weight loss program; the higher the expectations, the higher the attrition at12 months [5]. Although we can certainly learn from the participants in the WeightLoss Registry, it is important that persons attempting weight loss have realistic weightloss goals.
Dr. Hill: I agree totally. The whole point of developing the registry was not to lookat the prevalence of successful weight loss maintenance but simply to look for similarbehavior in those who are most successful. People in the registry have achieved a levelof success that most people do not achieve. However, I think the registry helps usidentify the kinds of behaviors that could help more people be successful.
References
1 Mallam KM, Metcalf BS, Kirkby J, et al: Contribution of timetabled physical education tototal physical activity in primary school children: cross sectional study. BMJ 2003;327: 592–593.
2 Curioni CC, Lourenco PM: Long-term weight loss after diet and exercise: a systematic review.Int J Obes (Lond) 2005;29:1168–1174.
3 Douketis JD, Macie C, Thabane L, Williamson DF: Systematic review of long-term weight lossstudies in obese adults: clinical significance and applicability to clinical practice. Int J Obes(Lond) 2005;29:1153–1167.
Physical Activity and Type-2 Diabetes
195

4 Foster GD, Wadden TA, Vogt RA, Brewer G: What is a reasonable weight loss? Patients’ expe-ctations and evaluations of obesity treatment outcomes. J Consult Clin Psychol 1997;65:79–85.
5 Dalle Grave R, Calugi S, Molinari E, et al, QUOVADIS Study Group: Weight loss expectationsin obese patients and treatment attrition: an observational multicenter study. Obes Res2005;13:1961–1969.
Hill/Stuht/Wyatt/Regensteiner
196

The Role of Lifestyle Modification inDysmetabolic Syndrome Management
John P. Foreyt
Department of Medicine, Baylor College of Medicine, Houston, TX, USA
AbstractLifestyle modification should be the primary therapeutic intervention in individuals
with the dysmetabolic syndrome, given the fact that obesity, unhealthy diet, and physi-cal inactivity are primary underlying risk factors for its development. Most individualswith the dysmetabolic syndrome need to lose weight through dietary changes andincreases in physical activity. Modest weight losses may significantly improve allaspects of the syndrome. Because individuals differ in their lifestyles, tailoring inter-ventions to meet the specific needs of each person will maximize the chances ofsuccess. Assessment of the individual with the dysmetabolic syndrome involves quan-tification of obesity, diets and dietary patterns, physical activity, emotional problems,and motivation. To help individuals make lifestyle changes, a number of behavior mod-ification strategies have shown good efficacy. These strategies include a tailored prob-lem-solving intervention, involving goal-setting, self-monitoring, stimulus control,cognitive restructuring, stress management, relapse prevention, social support, andcontracting. The frequency of self-monitoring is an especially important strategy forcontinued success. Research studies have clearly demonstrated the power of lifestylemodification for long-term behavioral change. Lifestyle modification appears effectivein delaying or preventing the development of the dysmetabolic syndrome.
Copyright © 2006 Nestec Ltd., Vevey/S. Karger AG, Basel
Introduction
The dysmetabolic syndrome is among the fastest growing disease entitiesin the world today. In the United States, e.g. almost 25% of adults 20 yearsand older have the syndrome [1]. Its prevalence increases with age, with itaffecting almost 50% of US adults 60 years and older. Although the syndromehas many names, including ‘Reaven’s syndrome’, ‘syndrome X’, the ‘insulinresistance syndrome’, and the ‘metabolic syndrome’, its diagnosis centers
Bantle JP, Slama G (eds): Nutritional Management of Diabetes Mellitus and Dysmetabolic Syndrome.Nestlé Nutr Workshop Ser Clin Perform Program, vol 11, pp 197–206,Nestec Ltd., Vevey/S. Karger AG, Basel, © 2006.
197

around a constellation of metabolic derangements including central obesity,dyslipidemias (i.e. high plasma levels of triglycerides and low levels of high-density lipoprotein cholesterol), hypertension, insulin resistance, and glucoseintolerance, along with increased prothrombotic and inflammatory markers[2]. The National Cholesterol Education Program, the World HealthOrganization, and other national and international organizations have delin-eated differing but related criteria for its diagnosis [2].
This constellation of metabolic abnormalities greatly increases the risk ofdeveloping cardiovascular disease [3–6]. It appears that in a few years thedysmetabolic syndrome will overtake cigarette smoking as the strongest riskfactor for the development of heart disease in the US. Sadly, the syndromealso is afflicting a growing number of children and adolescents. The preva-lence of the syndrome in US children aged 12–19 years is about 1 in 10 [7]. Inoverweight/obese children, 1 in 3 have the syndrome. Among severely obesechildren, the prevalence reaches 50%. Two thirds of all adolescents have atleast 1 metabolic abnormality [8, 9]. Given the rising prevalence in obesityamong children and adolescents, these data are not surprising.
Treatment of the Dysmetabolic Syndrome
The American Heart Association, working with the National Institutes ofHealth National Heart, Lung and Blood Institute and the American DiabetesAssociation, has provided a series of recommendations for the treatment ofthe dysmetabolic syndrome [10]. These recommendations include medica-tions for managing the dyslipidemias, hypertension, and impaired glucose tol-erance. However, the primary treatment for the dysmetabolic syndrome islifestyle modification, focusing on diet and physical activity. In particular,modest weight losses significantly improve all aspects of the syndrome.Effective lifestyle changes also will aid in its prevention.
Lifestyle Modification Works
The largest, most comprehensive and impressive study to date to docu-ment the beneficial effects of lifestyle modification is the Diabetes PreventionProgram (DPP) [11]. The DPP randomly assigned 3,234 non-diabetic individ-uals with elevated fasting and post-load plasma glucose concentrations toplacebo, metformin (850 mg twice a day), or a lifestyle modification inventionwith the goals of a 7% weight loss and 150 min of physical activity per week.Average follow-up was 2.8 years. Results were dramatic. The lifestyle modifi-cation group reduced the incidence of type-2 diabetes by 58%, the metformingroup by 31%, compared to placebo. The lifestyle modification interventionwas significantly more effective than metformin. Beneficial effects of the
Foreyt
198

lifestyle intervention were even seen on nontraditional cardiovascular riskfactors including concentrations of C-reactive protein and fibrinogen [12].
In a similar study done in Finland, 522 middle-aged, overweight men andwomen with impaired glucose tolerance were randomly assigned to either alifestyle intervention or control group [13]. Each participant in the interven-tion group received individualized counseling aimed at weight reduction,improved diet, and increased physical activity. The mean follow-up was 3.2years. The lifestyle intervention group had a significant reduction of 58% inthe relative risk of developing diabetes, similar to the results of the DPP. Thereduction in risk was directly associated with beneficial changes in lifestyle.
The DPP researchers also reported results on the 53% of participants(n � 1,711) who had the metabolic syndrome at baseline. The incidence ofthe metabolic syndrome was reduced by 41% in the lifestyle group and by17% in the metformin group, compared with placebo [14]. The researchersattributed the dramatic effect of lifestyle modification on both the preventionof incident metabolic syndrome and a reduction of its overall prevalenceprimarily to reductions in waist circumference and in blood pressure. Theyconcluded that their results demonstrate the value of lifestyle intervention inboth the prevention and treatment of the syndrome, above and beyondimprovement in glycemia alone and that lifestyle intervention may reducerisk in individuals with impaired glucose tolerance.
Currently, the ongoing Look AHEAD (Action for Health in Diabetes) studyhas as its primary hypothesis that an intensive lifestyle intervention similar toDPP to reduce weight and increase physical activity will reduce cardiovascu-lar morbidity and mortality [15]. In more than 5,000 obese adults with type-2diabetes the study is comparing the long-term (up to 11.5 years) effects of anintensive lifestyle intervention designed to achieve and maintain a modestweight loss through decreased caloric intake and increased physical activityversus a control condition of diabetes support and education on the combinedincidence of serious cardiovascular events, i.e. cardiovascular death, nonfatalmyocardial infarction, and non-fatal stroke. Additional research goals includecomparisons of cardiovascular disease risk factors, mortality, diabetes-relatedmetabolic factors and complications, intervention safety, indices of health,quality of life, and a number of economic outcomes. A significant number ofparticipants also have the dysmetabolic syndrome. This study is the first long-term randomized controlled trial to assess the effects of lifestyle interventionwith reduced mortality as a primary outcome.
The results of the DPP and Finnish Diabetes Prevention Study (FDPS) doc-ument the importance of lifestyle modification as the primary therapeutic inter-vention in individuals with the dysmetabolic syndrome, given the fact thatobesity, unhealthy diet, and physical inactivity are considered to be the primaryunderlying risk factors for the development of the syndrome. Results from theLook AHEAD trial may also help document the role of lifestyle change assignificant in reducing mortality. Through lifestyle modification aimed at the
Role of Lifestyle Modification
199

development of a healthy diet, increased physical activity, and behavior modifi-cation, weight loss is the primary key to treating the dysmetabolic syndrome.
Components of a Lifestyle Modification Intervention
Most individuals with the dysmetabolic syndrome need to lose weightthrough dietary changes and increases in physical activity. Because individu-als differ in their lifestyles, tailoring interventions to meet the specific needsof each person will maximize the chances of success (table 1).
Beginning Lifestyle Change
Assessment
Assessment of the individual with dysmetabolic syndrome involves quan-tification of obesity, diets and dietary patterns, physical activity, emotionalproblems, and motivation [16]. Lifestyle modification strategies are typicallymost helpful for individuals with a body mass index of �40. For individualswith severe obesity, much more aggressive approaches, such as bariatric sur-gery, may be required. Registered dietitians are the best professionals forassessing diets and dietary patterns. Physical activity can be assessed by ask-ing the number of minutes per day spent walking briskly or similar exercise.Emotional problems, which oftentimes make weight loss much more difficult,can be identified through the use of brief psychological questionnaires, suchas the Beck Depression Inventory [17] or similar instruments. For individualswho do not appear motivated to change their diet or physical activity levels,personalizing each of the dysmetabolic syndrome risk factors and explaininghow modest weight losses may improve them can sometimes be helpful. Forindividuals who do seem willing to make changes, encouragement from thephysician can oftentimes help. Basic education about small steps which indi-viduals can make in changing their lifestyles may help motivate them to begina program. For individuals who are already motivated the lifestyle changesdescribed next have been shown to be extremely useful.
Foreyt
200
Goal settingSelf-monitoringStimulus controlCognitive restructuringStress managementRelapse preventionSocial supportContracting
Table 1. Components of a lifestylemodification intervention

Lifestyle Change Strategies
Diet and Physical ActivityThe recognized diet for weight loss involves a balanced eating plan, includ-
ing a deficit of about 500–1,000 kcal/day, resulting in a safe weight loss of0.45–0.90 kg/week (1–2 lb) [10, 18]. Physical activity recommendations typi-cally include adding 30–60 min/day of brisk walking or the equivalent on mostdays of the week [10].
Behavior ModificationTo help individuals make these dietary and physical activity changes, a
number of behavior modification strategies have shown good efficacy. Thesestrategies include a tailored problem-solving intervention, involving goal-setting, self-monitoring, stimulus control, cognitive restructuring, stress man-agement, relapse prevention, social support, and contracting [19].
Goal-Setting
Many individuals with the dysmetabolic syndrome have unrealistic goalsregarding their ability to lose weight. Obese individuals frequently express adesire to lose more than 30% of their weight [20], although research studies indi-cate that patients who participate in a lifestyle change intervention lose about8–10%. It is important to remember that a modest loss of about 8% generally willlead to improvement in the constellation of risk factors of the dysmetabolic syn-drome. The DPP and Finnish prevention study, for example, both showed thatmodest weight losses through lifestyle change significantly reduced the inci-dence of diabetes in individuals at high risk. Unfortunately, this amount ofweight loss is disappointing to some individuals who still are overweight orobese. An emphasis on achieving small, short-term goals, such as walking anextra 20 min/day and then focusing on the increased psychological feelings ofenhanced well-being can sometimes help individuals understand and appreciatethe gains that they have made. Accomplishing modest dietary or physical activ-ity goals oftentimes improves self-esteem and serves as encouragement to trynew ones. Setting unrealistic goals, such as losing weight too quickly throughfasting or severely depriving diets, or attempting strenuous exercise, frequentlyresults in disappointment, discouragement, and ultimately failure. Reevaluationof goals should be done on a regular basis, with revisions made as needed.
Self-Monitoring
Research suggests that self-monitoring is the most important of all behavioralchange strategies [21]. In the DPP study, for example, the frequency of self-mon-itoring was related to success at achieving both the physical activity goal andthe weight loss goal [22]. Self-monitoring involves three aspects: self-observa-tion, self-recording, and feedback. The primary purpose of self-monitoring isto raise awareness. If an individual is going to successfully change physicalactivity and diet, it is important to know one’s activity level and what one is
Role of Lifestyle Modification
201

eating. The typical way to raise awareness of habits is through a diary inwhich individuals write down what they eat and the number of minutes thatthey are physically active. They then look up the number of calories they ateand calculate the number of calories burned through their brisk walking orother activity (calculating about 6 cal burned/min of walking). Pedometersare also helpful for raising awareness, with about 100 cal expended for each2,000 steps. Individuals typically do not like to keep diaries. They also tend tounderestimate their intake by about one third, and overestimate their activityby about one half. It really does not matter. The primary purpose of monitor-ing is raising awareness, not accuracy of recording. Monitoring helps remindindividuals of what they are trying to do, i.e. healthy eating and more exer-cise. Monitoring weight by weighing on a regular schedule, i.e. daily or once aweek, is also important. Food and activity diaries, and monitoring weight on aregular schedule, are essential components of long-term habit change in indi-viduals with the dysmetabolic syndrome. If an individual agrees to make asingle lifestyle change strategy, self-monitoring should be the one chosen.
Stimulus Control
Stimulus control involves identifying and confronting the individual’s idio-syncratic barriers to losing weight [23]. Frequently the food and activity diariescan help identify the problems that individuals are having when they strayfrom their healthy eating pattern or activity plan. Common problems includeeating outside the home, traveling extensively, late night eating, or weathertoo hot, too rainy, or too cold to exercise. Using a problem-solving approach byencouraging the individual to come up with a realistic plan to the specificproblem can oftentimes lead to a solution. A few ideas that individuals can beencouraged to come up with when they are confronted with barriers include:taking meals from home to the office rather than eating in the cafeteria; callingrestaurants ahead of time and asking for low-fat, low-calorie meals; carryingcalorie-controlled meals when on trips; planning sensible snacks in the home,or agreeing to exercise in a shopping mall during inclement weather.
Cognitive Restructuring
The belief that losing weight will improve all aspects of an obese individual’slife and that somehow all problems will disappear is not unusual. Unfortunately,it usually is not true. Cognitive restructuring involves strategies to help indi-viduals change the unrealistic beliefs they may think about themselves andreplace them with more positive, realistic ones [24]. Individuals are taught toidentify self-enhancing, self-affirming thoughts about themselves. Repeatinghealthy self-affirmations such as ‘I will walk for 20 min before breakfast’, ‘smallchanges can make a big difference’, ‘I am no longer putting off my life until I reach some magic weight’, and repeating them daily can be excellent motiva-tors for lifestyle change.
Foreyt
202

Stress Management
Emotional factors frequently interfere with the development of healthylifestyles. Stressful life events oftentimes lead to unwanted eating and subse-quent weight gain. Recognizing stressors and learning strategies to deal withthem can help individuals manage their eating patterns more effectively.Physical activity is an especially good strategy for reducing feelings of stressbecause it raises an individual’s sense of well being. The regular practice ofmeditation or learning techniques like progressive muscle relaxation can beuseful for managing everyday stresses [25].
Relapse Prevention
Lapses from one’s diet or exercise program are common. Unplanned events,emergencies, boredom, and other factors interfere with well-intentionedplans. Life gets in the way. Understanding that lapses occur and are to beexpected may help reduce the probability of a relapse (giving up), leading toweight regain. Learning strategies to deal with transgressions, such as thosethat likely occur during holidays, can help prevent a major collapse in one’slong-term goals. Reviewing and understanding what happened and develop-ing a strategy to deal with a situation if it occurs again can be extremely use-ful in preventing its recurrence [26].
Social Support
Family members who eat the same healthy food and exercise together canbe a strong support system for individuals with the dysmetabolic syndrome.Good friends, colleagues at work, the individual’s physician, and others canplay a major role in keeping motivation high. Social support systems workbecause supportive individuals serve as excellent role models, provide assis-tance in confronting and dealing with obstacles to change, and encourageself-acceptance [20].
Contracting
Formalizing agreements to make specific behavioral changes can be usefulfor some individuals. Contracting involves having individuals agree to one ormore specific behaviors that they will do over a short period of time. Theagreed upon behaviors should be simple, achievable, and realistic. Agreeing‘to do better’ or ‘to be a better person’ is not helpful. Agreeing to walk for20 min on Monday, Wednesday, and Friday at 8:00 in the morning is hopefullysimple, achievable, and realistic. Likewise, reducing the number of dessertsfrom every night to three times a week may also be achievable. Writing downthe agreements and signing the contract usually helps in achieving the goals.Contracting is particularly useful for motivating short-term behavioral change.Changing contracts frequently helps [20].
Role of Lifestyle Modification
203

Conclusions
Research studies have clearly demonstrated the power of lifestyle modifi-cation for long-term behavioral change. The DPP provided excellent evidenceof the potential of lifestyle modification intervention for the reduction ofrisk in individuals with the dysmetabolic syndrome. Weight loss is the key formost individuals with the syndrome. Lifestyle change strategies, includingself-monitoring, stimulus control, cognitive restructuring, stress management,relapse prevention, social support, and contracting, increase the chances foradoption of a healthy diet and a habit of regular physical activity. The fre-quency of self-monitoring is an especially important strategy for continuedsuccess. Lifestyle modification appears effective in delaying or preventing thedevelopment of the dysmetabolic syndrome [27].
Acknowledgment
This work was supported in part by grant No. DK058299 from the NationalInstitute of Diabetes and Digestive and Kidney Diseases (NIDDK).
References
1 Ford ES, Giles WH, Dietz WH: Prevalence of the metabolic syndrome among US adults: find-ings from the Third National Health and Nutrition Examination Survey. JAMA 2002;287:356–359.
2 Grundy SM, Brewer HB Jr, Cleeman JI, et al: Definition of metabolic syndrome: report of theNational Heart, Lung and Blood Institute/American Heart Association conference on scien-tific issues related to definition. Circulation 2004;109:433–438.
3 Anderson JL, Horne BD, Jones HU, et al: Which features of the metabolic syndrome predictthe prevalence and clinical outcomes of angiographic coronary artery disease? Cardiology2004;101:185–193.
4 Solymoss BC, Boruassa MG, Campeau L, et al: Effect of increasing metabolic syndrome scoreon atherosclerotic risk profile and coronary artery disease angiographic severity. Am J Cardiol2004;93:159–164.
5 Lakka HM, Laaksonen DE, Lakka TA, et al: The metabolic syndrome and total and cardiovas-cular disease mortality in middle-aged men. JAMA 2002;288:2709–2716.
6 Isomaa B, Almgren P, Tuomi T, et al: Cardiovascular morbidity and mortality associated withthe metabolic syndrome. Diabetes Care 2001;24:683–689.
7 Weiss R, Dziura J, Burgert TS, et al: Obesity and the metabolic syndrome in children and ado-lescents. N Engl J Med 2004;350:2362–2374.
8 Cook S, Weitzman M, Auinger P, et al: Prevalence of a metabolic syndrome phenotype in ado-lescents: findings from the Third National Health and Nutrition Examination Survey,1988–1994. Arch Pediatr Adolesc Med 2003;157:821–827.
9 De Ferranti SD, Gauvreau K, Ludwig DS, et al: Prevalence of the metabolic syndrome inAmerican adolescents: findings from the Third National Health and Nutrition ExaminationSurvey. Circulation 2004;110:2494–2497.
10 Grundy SM, Hansen B, Smith SC Jr, et al: Clinical management of metabolic syndrome: reportof the American Heart Association/National Heart, Lung, and Blood Institute/AmericanDiabetes Association conference on scientific issues related to management. Circulation2004;109:551–556.
Foreyt
204

11 Knowler WC, Barrett-Connor E, Fowler SE, et al, Diabetes Prevention Program ResearchGroup: Reduction in the incidence of type 2 diabetes with lifestyle intervention or metformin.N Engl J Med 2002;346:393–403.
12 Haffner S, Temprosa M, Crandall J, et al, Diabetes Prevention Program Research Group:Intensive lifestyle intervention or metformin on inflammation and coagulation in participantswith impaired glucose tolerance. Diabetes 2005;54:1566–1572.
13 Tuomilehto J, Lindstrom J, Eriksson JG, et al: Prevention of type 2 diabetes mellitus bychanges in lifestyle among subjects with impaired glucose tolerance. N Engl J Med 2001;344:1343–1350.
14 Orchard TJ, Temprosa M, Goldberg R, et al: The effect of metformin and intensive lifestyleintervention on the metabolic syndrome: the diabetes prevention program randomized trial.Ann Intern Med 2005;142:611–619.
15 Ryan DH, Espeland MA, Foster GD, et al, Look AHEAD Research Group: Look AHEAD(Action for Health in Diabetes): design and methods for a clinical trial of weight loss for theprevention of cardiovascular disease in type 2 diabetes. Control Clin Trials 2003;24:610–628.
16 Foreyt JP: Need for lifestyle intervention: how to begin. Am J Cardiol 2005;96:11E–14E.17 Steer RA, Cavalieri TA, Leonard DM, Beck AT: Use of the Beck depression inventory for pri-
mary care to screen for major depression disorders. Gen Hosp Psychiatry 1999;21:106–111.18 Krauss RM, Eckel RH, Howard B, et al: AHA dietary guidelines: revision 2000: a statement for
healthcare professionals from the Nutrition Committee of the American Heart Association.Circulation 2000;102:2284–2299.
19 Foreyt JP, Pendleton VR: Management of obesity. Prim Care Rep 2000;6:19–30.20 Foster GD, Wadden TA, Vogt RA, Brewer G: What is a reasonable weight loss? Patients’
expectations and evaluations of obesity treatment. J Consult Clin Psychol 1997;65:79–85.21 Baker RC, Kirschenbaum DS: Self-monitoring may be necessary for successful weight control.
Behav Ther 1993;24:377–394.22 Wing RR, Hamman RF, Bray GA, et al, Diabetes Prevention Program Research Group:
Achieving weight and activity goals among diabetes prevention program lifestyle participants.Obes Res 2004;12:1426–1434.
23 Foreyt JP, Goodrick GK: Attributes of successful approaches to weight loss and control. ApplPrev Psychol 1994;3:209–215.
24 Foreyt JP, Poston WS 2nd: What is the role of cognitive-behavior therapy in patient manage-ment? Obes Res 1998;6(suppl 1):18S–22S.
25 Poston WS 2nd, Foreyt JP: Successful management of the obese patient. Am Fam Physician2000;61:3615–3622.
26 Wadden TA, Foster GD, Wang J, et al: Clinical correlates of short and long-term weight loss.Am J Clin Nutr 1922;56:274–278.
27 Pritchett AM, Foreyt JP, Mann DL: Treatment of the metabolic syndrome: the impact oflifestyle modification. Curr Atheroscler Rep 2005;7:95–102.
Discussion
Dr. Slama: I have two points to make. One I don’t know if it is a joke or a philo-sophical question, and the second one is much more serious. My first point is that ifyou say that 20 years from now 100% of the people will be fat, then what will be thedefinition of normal? Will we be normal, or will they be abnormal? Do we say that ele-phants are too fat? So 20 years from now we will all be normal. My serious question isthat I read in the newspaper that for the first time in the history the increase in lifeexpectancy is leveling off and even now slightly decreasing. Might it be that we arenow paying the price for our very recent lifestyle?
Dr. Foreyt: I will answer your second question first. That came out of a paper justpublished by Olshansky et al. [1] in the New England Journal of Medicine. What theydid was take all the data and show that this extended life expectancy is starting tolevel off, and they think now it is going to start decreasing because of obesity. They
Role of Lifestyle Modification
205

particularly show data, especially in children who are developing adult risk factorsearlier and earlier, that this generation of children will die before their parents do. Soaccording to Olshansky et al. this extending lifestyle is ending. Regarding your firstpoint about 100% of Americans being obese or overweight by 2040; as you know obe-sity itself is excess body fat not weight. So the body mass index doesn’t fit for every-body, but the average man in the United States has about 20% body fat, the averagewoman has about 25% body fat. With a body mass index of 30 a woman has about 37%body fat, and a man has about 25% body fat. So that equates very well if we look atbody fat in men and women and look at that with respect to when this is going to hap-pen, and it looks as though it is going to happen by 2040 in all of us in the UnitedStates, but all the other countries are catching up quickly. That curve is not starting tolevel off yet in any of the countries. The International Obesity Task Force data showthat the lines are going up in all countries. I have not yet seen a country where it is lev-eling off or going down; not pessimistic, realistic.
Dr. Eshki: I want to make a recommendation. When looking at diseases in the pastcentury, we see that the major killers, such as heart disease, cancer, stroke, and dia-betes, are on the rise. Yet there is a lot of money being spent on research and healthcare. Looking at the preceding theory which focuses on the predisposing, reinforcingand enabling factors, I see the enabling factors as a major player when fighting thisbattle. Health professionals and the public seem to be fighting this battle alone. Thegovernment and industrial sectors seem to be watching this battle take place and don’tseem to know that their intervention would make a difference. For instance, in SaudiArabia there is a city called Medina where the governor issued a law banning smokingthere. Furthermore, there are billboards in the streets around the city which areintended to educate the public about the dangers of smoking. As a result of this in thepast 2 years health professionals have witnessed a dramatic reduction in the preva-lence of lung cancer. So do you think the other two sectors should join the battle orshould we continue to spend more money and lives, and hope for a happy ending?
Dr. Foreyt: That is a great question and it is being debated over and over; at everymeeting I go to that is the major focus of the meeting. I think it has to do with personalresponsibility. There is a role for communities, a role for local governments, and thereis a role for the federal government. What that role should be is being debated now.But ultimately it has got to do with each individual; we all have to play a part.
Reference
1 Olshansky SJ, Passaro DJ, Hershow RC, et al: A potential decline in life expectancy in theUnited States in the 21st century. N Engl J Med 2005;352:1138–1145.
Foreyt
206

Critical Review of the InternationalGuidelines: What Is Agreed upon – What Is Not?
Nicholas Katsilambros, Stavros Liatis, Konstantinos Makrilakis
First Department of Propaedeutic Medicine, University of Athens Medical School, LaikoGeneral Hospital, Athens, Greece
AbstractThe nutrition recommendations of 6 major scientific organizations (the American
Diabetes Association, the Diabetes and Nutrition Study Group of the EuropeanAssociation for the Study of Diabetes, the Canadian Diabetes Association, theJoslin Diabetes Center and Joslin Clinic, the American Association of ClinicalEndocrinologists and Diabetes UK) are reviewed. They all agree that weight loss (withreduction in energy intake and increase in physical activity) is an important therapeuticstrategy in all overweight/obese individuals who have or are at risk of type-2 diabetes.Very low carbohydrate diets are not considered appropriate. The recommended propor-tion varies slightly (from 40 to 65%). The concept of the glycemic index is stressed asimportant in nearly all guidelines. Fiber intake is advised, up to 50 g/day, if tolerated.Protein intake (for normal kidney function) is advised to range from 10 to 20% of totalenergy. A low fat diet (�30–35%) is recommended by all. Saturated fat and trans-fatty acids should be restricted to �10% and dietary cholesterol to �300 mg/day.Monounsaturated fatty acids are generally considered beneficial and should replace sat-urated fat or carbohydrates in low-fat diets. Polyunsaturated fatty acids (PUFAs) shouldcomprise about 10%, with the n � 3 PUFAs being more beneficial, especially for hightriglyceride levels. Alcohol intake has cardioprotective effects when used in moderation.Routine supplementation of the diet with antioxidants and vitamins is not necessary.
Copyright © 2006 Nestec Ltd., Vevey/S. Karger AG, Basel
Introduction
Type-2 diabetes mellitus is one of the most costly and burdensome chronicdiseases of our time and a condition that is increasing in epidemic propor-tions worldwide [1]. Its complications are a significant cause of morbidity and
Bantle JP, Slama G (eds): Nutritional Management of Diabetes Mellitus and Dysmetabolic Syndrome.Nestlé Nutr Workshop Ser Clin Perform Program, vol 11, pp 207–218,Nestec Ltd., Vevey/S. Karger AG, Basel, © 2006.
207

mortality and a tremendous economic burden to society. Some of the risk fac-tors for its development, such as obesity, physical inactivity and high energydiet, can potentially be modified. Compelling evidence now exists, from well-designed randomized studies [2–4], that the disease can be prevented ordelayed in subjects at high risk of its development, i.e. subjects with impairedglucose tolerance or impaired fasting glucose. The interventions studiedinclude lifestyle modifications (with diet and exercise) and drug treatment.Weight loss with lifestyle modification seems to be the most effective wayof preventing diabetes mellitus so far, given the fact that it addresses othercardiovascular disease risk factors as well (hypertension and dyslipidemia).In the established diabetic also, physical activity and diet continue to be afundamental form of therapy.
Medical nutrition therapy (MNT) guidelines for persons with diabetes havechanged a lot over the previous few decades. Before the discovery of insulin,in 1921, starvation therapies were applied, with nearly total restriction offood. After the introduction of insulin in the treatment regimen, the fear that‘sugar is bad in diabetes’ led to the adoption of low carbohydrate diets whichwere consequently high in fat. Later on, it was realized that high fat dietswere the ones causing problems, leading to increased cardiovascular risk.Thus, a whole array of studies was initiated in search of the optimal composi-tion of the diet in diabetic persons. Since many issues are still topics of scien-tific debate, they endorse the principle of individualization in MNT for diabetesand set guidelines accordingly.
Today there is no one ‘diabetic’ diet. The recommended diet can only bedefined as a prescription based on the assessment of treatment goals and out-comes, taking into consideration the individual needs and preferences of thepeople. Nutrition recommendations represent a thoughtful synthesis of amultitude of current data. The nutrition recommendations of the major scientificorganizations, the American Diabetes Association (ADA) [5], the Diabetes andNutrition Study Group (DNSG) of the European Association for the Study ofDiabetes (EASD) [6], the Canadian Diabetes Association [7], the Joslin DiabetesCenter and Joslin Clinic [8], the American Association of Clinical Endocri-nologists (AACE) [9] and Diabetes UK [10], will be reviewed here and theirsimilarities and disagreements analyzed.
It should be emphasized that the recommendations are based on the bestavailable evidence of these scientific organizations, categorized according totheir strength. The ADA grades their recommendations into four categories:those with strong supporting evidence, those with some supporting evidence,those with limited supporting evidence and those based on expert consensus.The DNSG of the EASD grade their recommendations according to theirstrength of evidence based on 5 evidence classes (Ia, Ib, IIa, IIb, III) and aseparate class (IV) reserved for statements from expert committees based onthe Scottish Intercollegiate Guidelines Network [11].
The classes of the recommendations are:
Katsilambros/Liatis/Makrilakis
208

Ia Meta-analysis of randomized controlled trialsIb At least one randomized controlled trialIIa At least one well-designed controlled study without randomizationIIb At least one other type of well-designed quasi-experimental studyIII Well-designed nonexperimental descriptive studies, such as compar-
ative studies, correlation studies and case studiesIV Expert committee reports or opinions and/or clinical experiences of
respected authoritiesThe grades of the recommendations are as follows:
(A) Requires at least one randomized controlled trial as part of a body of lit-erature of overall good quality and consistency addressing the specificrecommendation (evidence levels Ia, Ib).
(B) Requires the availability of well-conducted clinical studies but no ran-domized clinical trials on the topic of recommendation (evidence levelsIIa, IIb, III).
(C) Requires evidence obtained from expert committee reports or opinionsand/or clinical experiences of respected authorities. Indicates an absenceof directly applicable clinical studies of good quality (evidence level IV).
The Joslin Diabetes Center follows the same pattern of evidence as theADA, whereas the Canadian Diabetes Association and the AACE do not pro-vide a grading system for their recommendations. The Diabetes UK recom-mendations are based on the ADA and DNSG technical reviews.
Aims and Goals of Nutritional Advice
There is a general agreement among the various scientific organizationsmentioned above regarding the goals of MNT in diabetes. These goals aregenerally the following, as addressed in the ADA statement [5]:• Attain and maintain recommended metabolic outcomes, including
glucose and HbA1c levels, LDL cholesterol, HDL cholesterol, triglyceridelevels, blood pressure and body weight.
• Prevent and treat the chronic complications and comorbidities ofdiabetes. Modify nutrient intake and lifestyle as appropriate for the pre-vention and treatment of obesity, dyslipidemia, cardiovascular disease,hypertension and nephropathy.
• Improve health through healthy food choices and physical activity.• Address individual nutritional needs, taking into consideration personal
and cultural preferences and lifestyle, while respecting the individual’swishes and willingness to change.
Goals of MNT that apply to specific situations include the following:• For youth with type-1 diabetes mellitus, MNT should provide adequate
energy to ensure normal growth and development. Insulin regimensshould be integrated into usual eating and physical activity habits.
Critical Review of the International Guidelines
209

• For youth with type-2 diabetes mellitus, who are usually overweight/obese, appropriate changes in eating and physical activity habits shouldbe facilitated.
• For pregnant and lactating women, adequate energy and nutrientsneeded for optimal outcomes should be provided.
• For older adults, nutritional and psychological needs of an aging individ-ual should be addressed.
• For individuals treated with insulin or insulin secretagogues, self-management education for treatment (and prevention) of hypoglycemia,acute illness and exercise-related blood glucose problems should be provided.
• For individuals at risk of diabetes, physical activity and food choices thatfacilitate moderate weight loss, or at least prevent weight gain, should beencouraged.
The DNSG of the EASD does not provide specific aims and goals of nutri-tional advice in its most recent publication [6], although the previous one in1999 generally – albeit briefly – agrees with the aforementioned statements ofADA [12]. The Canadian Diabetes Association [7], the AACE [9] and DiabetesUK [10] also generally and briefly agree with them. The Joslin DiabetesCenter and Joslin Clinic additionally emphasizes the goals of improving post-prandial hyperglycemia, postprandial hypertriglyceridemia, body fat distribu-tion with reduction of visceral fat and reduction of cardiovascular risk, asevidenced by improvement of endothelial function and endothelial markersand reduction of inflammatory cytokines [8].
All the scientific organizations (with the exception of the DNSG of theEASD, which does not make any specific recommendation) generally agreethat, given the complexity of the dietary issues, a registered dietitian, familiarwith the components of diabetes MNT should be part of the team that pro-vides dietary advice to the diabetic individual.
Body Weight and Energy Balance
There is a general consensus among the various scientific organizationsthat weight loss is an important therapeutic strategy in all overweight orobese individuals who have type-2 diabetes or are at risk of developing type-2diabetes. The primary approach to achieving weight loss, in the vast majorityof cases, is a therapeutic lifestyle change, which includes a reduction inenergy intake and an increase in physical activity.
The ADA recommends a moderate decrease in caloric balance (by500–1,000 kcal/day) that will result in a slow but progressive weight loss ofabout 1–2 lb/week. For most patients, a weight loss diet is advised to provideat least 1,000–1,200 kcal/day for women and 1,200–1,600 kcal/day for men.
The DNSG of the EASD does not make specific caloric recommendations,but stresses that a weight reduction of as little as 10% of the initial body
Katsilambros/Liatis/Makrilakis
210

weight will have very beneficial effects on insulin sensitivity, blood pressureand lipid levels in overweight diabetic persons. The goal should be todecrease BMI under 25 kg/m2 and to prevent weight regain thereafter. Theyalso stress that overweight patients with type-1 diabetes may also becomeinsulin resistant and weight loss may lead to a reduction in insulin dose andimproved glycemic control.
The Joslin Diabetes Center and Joslin Clinic recommends a modest andgradual weight reduction of 1 lb every 1–2 weeks as an optimal therapeutictarget, with a reduction of daily caloric intake by 250–500 kcal. Total dailycaloric intake should not be less than 1,000–1,200 kcal/day for women and1,200–1,600 kcal/day for men.
The AACE emphasizes the fact that simply a negative caloric balance candecrease insulin resistance in type-2 diabetes and that loss of as few as10–20 lb (4.5–9 kg) will be helpful. For patients with type-1 diabetes, thepatient must understand the action and duration of the insulin being used aswell as the effect of the timing of the intake of food on the insulin action.Flexibility of insulin dosing and timing must be taught to the patient.
Diabetes UK recommends that a loss of 1–2 kg per month by means of asustained energy deficit of approximately 500 kcal/day should be regarded assatisfactory. Furthermore, given the fact that body weight tends to increasewith aging up to the sixth decade, avoidance of further weight gain may beconsidered a success in some patients.
The Canadian Diabetes Association does not have specific recommenda-tions regarding the total amount of energy that needs to be consumed by dia-betic persons in order to lose weight.
It should be noted that although weight loss is a major objective in theguidelines of all scientific organizations, there is actually a lack of prospectivetrials with hard end points (mortality). Also, no specific recommendations areprovided on how to lose weight. Consequently, there is obviously a need forlong-term, well-designed trials in order to assess the benefit from weightmanagement in patients with diabetes. In this regard, the Look AHEAD:Action for Health in Diabetes Program aims to examine, in overweight volun-teers with type-2 diabetes, the long-term effects of an intensive lifestyle inter-vention program, designed to achieve and maintain weight loss by decreasedcaloric intake and increased physical activity. The composite end pointincludes: cardiovascular death (including fatal myocardial infarction andstroke), nonfatal myocardial infarction, and nonfatal stroke.
Macronutrient Composition of the Diet
The various scientific organizations have small differences in their recom-mendations for the macronutrient composition of the diet (including carbo-hydrates, protein and fat) in diabetic persons (table 1).
Critical Review of the International Guidelines
211

Katsilambros/Liatis/Makrilakis
212
Table 1. Recommendations of the various scientific organizations regardingmacronutrient content of the diet in diabetes
Organization CHO Protein Fat
ADA 45–65% 15–20% Low fat diet(at least 130 g/day; (microalbuminuria: SAFA �10% previously 0.8–1.0 g/kg/day; (SAFA �7% if60–70% overt LDL-C �100 mg/dl)combined nephropathy: 0.8 PUFA �10%with MUFA) g/kg/day) Trans-FAs
minimizedGI important Cholesterol �300
mg/day Fiber up to 50 (cholesterol �200 g/day mg/day if LDL-C
�100 mg/dl)
DNSG of EASD 45–60% 10–20% �35%(�30% in
GI important (T1DM with overt overweight nephropathy: 0.8 persons)
Fiber �40 g/day g/kg/day; SAFA � trans-FAs:microalbuminuria �10% [lower intake
Free sugars in T1DM/T2DM or (�8%) if LDL-C is �50 g/day macroalbuminuria elevated]
in T2DM: no firm MUFA 10–20%recommendation) PUFA �10%
Cholesterol �300 mg/day
Joslin Clinic �40% 20–30% 30–35%(at least 130 g/day) SAFA �10% (�7% GI important Patients with if LDL-C �100 mg/dl)Fiber up to 50 g/day nephropathy: Cholesterol(minimum consult a �300 mg/day 20–35 g/day) nephrologist (�200 mg/day if
LDL-C �100 mg/dl)
AACE 55–60% 15–20% �30% (�15% ifIn overweight ormicroalbuminuria: dyslipidemic)10–15%
Canadian 50–55% 15–20% �30%
Diabetes GI important SAFA � trans-FAs: �10%Association PUFA �10% (n-3
Sucrose �10% PUFA preferred)MUFA preferred

Critical Review of the International Guidelines
213
The ADA have, in their most recent clinical practice recommendations [5],changed their guidelines regarding the carbohydrate content of the diet. Intheir previous recommendations [13, 14] they stated that carbohydrate andmonounsaturated fat combined should provide 60–70% of the total dailyenergy intake (based on an expert consensus statement), without giving spe-cific individual figures for the carbohydrates or the monounsaturated fat.(They recommend that contribution of carbohydrates and monounsaturatedfat in energy intake should be individualized, based on nutrition assessment,metabolic profiles and weight and treatment goals.) In their 2005 recommen-dations [5], however, the amount of carbohydrate in the diet is specified as45–65% of total energy intake, with the provision that the absolute quantityof carbohydrate is at least 130 g/day, due to the absolute requirement of thebrain and the central nervous system for glucose as an energy source. Therecommendations for protein and fat intake are not mentioned in the newguidelines of the ADA and are assumed to be the same as the previous ones,based on the 2002 Technical Review [14]. Protein intake is recommended at15–20% of total energy (provided that renal function is normal) and total fatshould be reduced to facilitate weight loss. The primary dietary fat goal inpersons with diabetes is mentioned as a decrease in saturated fat intake to�10% of total energy (�7% if low density lipoprotein cholesterol is�100 mg/dl) and dietary cholesterol to �300 mg/day (�200 mg/day if lowdensity lipoprotein cholesterol is �100 mg/dl). It is still considered as desir-able that monounsaturated fat should replace saturated fat. Trans-unsatu-rated fat intake should be minimized and polyunsaturated fat reduced to�10% of total energy.
A great deal of scientific debate was generated over the previous yearsregarding the utility and importance of the glycemic index (GI) and its incor-poration in the dietary recommendations [15–20]. The ADA, in their previouspractice guidelines [13, 14], did not consider that there was sufficient data of
Diabetes UK 45–60% Not �1 g/kg/day �35%(combined with SAFA � trans-FAs: �10%MUFA: 60–70%) n-6 PUFA �10%GI important n-3 PUFA: twice weeklyFiber: no MUFA 10–20% (MUFAquantitative combined with recommendation CHO: 60–70%)Sucrose �10%
CHO � Carbohydrates; FAs � fatty acids; LDL-C � low density lipoproteincholesterol; SAFA � saturated fatty acids; T1DM � type-1 diabetes mellitus.
Table 1. (continued)
Organization CHO Protein Fat

long enough duration, to justify the incorporation of the GI into the nutri-tional guidelines. The total amount of carbohydrates in meals and snacks wasconsidered more important than their source or type. In their most recentguidelines however [5], based on a review of new evidence [21], the ADA con-cludes that both the amount (grams) of carbohydrate as well as the type ofcarbohydrate in a food influence the blood glucose level, and that the use ofthe GI can provide an additional benefit over that observed when total carbo-hydrate is considered alone. The GI concept is adopted by the DNSG of theEASD, the Joslin Diabetes Center and Joslin Clinic, the Canadian DiabetesAssociation and Diabetes UK as well and is considered able to discriminatefoods in quite a satisfactory way [22].
In conclusion, as regards macronutrient composition of the diet (table 1),all scientific organizations agree that very low carbohydrate diets are notappropriate for people with diabetes. The recommended proportion variesslightly among them (from 40 to 65%), being lowest in the Joslin DiabetesCenter recommendation (�40%). The concept of the GI is stressed as impor-tant in almost all guidelines now. Fiber intake is advised up to an amount of50 g/day, as long as it can be tolerated. Foods containing carbohydrates fromwhole grains, fruits, fresh vegetables, legumes and low-fat milk should be pre-ferred, because of their high fiber and low GI contents. If desired, and if bloodglucose levels are satisfactory, moderate intakes of free sugars (up to 50 g/dayof sucrose) may be incorporated in the diet of individuals with diabetes aswell. It should be noted that the recommended range of carbohydrate intake(40–65% total energy for most experts) is based on the limits for total fat andprotein intakes. For patients with persistently raised triglyceride levels a trialof carbohydrate intake at the lower end of the recommended intake rangemay be appropriate. Carbohydrate-rich, low GI foods are suitable as carbohy-drate-rich choices provided the other attributes of the foods are appropriate[23].
Protein intake (for people with normal kidney function) is advised to rangefrom 10 to 20% of total energy, with the exception of the Joslin Clinic thatrecommends 20–30% of total caloric intake to be provided by protein(although not based on strong scientific evidence). According to the JoslinClinic recommendations, emerging data suggest that these diets aid in thesensation of fullness, whereas low protein meal plans are associated withincreased hunger. Thus, lean protein together with healthy fats may serve toreduce appetite and assist patients in achieving and maintaining a lower calo-rie level [24]. For type-1 diabetic persons with established nephropathy (pro-teinuria) a lower amount of protein intake (0.8 g/kg/day) is recommended bythe ADA and the DNSG of the EASD. In individuals with microalbuminuria,the ADA recommends 0.8–1.0 g/kg/day of protein intake, whereas the DNSGof the EASD state that there is not sufficient evidence to make a firm recom-mendation for them, as well as for type-2 diabetic persons with macroalbu-minuria. The Joslin Clinic recommends that patients with nephropathy
Katsilambros/Liatis/Makrilakis
214

should consult a nephrologist before they increase total or percentage proteinin their diet.
Regarding fat intake, a low fat diet (�30–35%) is recommended by all sci-entific organizations. There is an unanimous consensus that saturated fat andtrans-fatty acids should be restricted to �10% of total energy intake anddietary cholesterol to �300 mg/day. Monounsaturated fatty acids (MUFA) aregenerally considered beneficial and should replace saturated fat or carbohy-drates in low fat diets. Olive oil consumption (the richest MUFA-containingfat and an indispensable component of the Mediterranean diet [25]) is equiv-alent to polyunsaturated fatty acids (PUFA) when compared as regards bloodglucose and blood lipid levels [26]. PUFA should comprise about 10% of totalcaloric intake with the n-3 PUFA (from oily fish and plant sources) beingmore beneficial, especially for high triglyceride levels. It should also be notedthat no controlled intervention studies in subjects with diabetes mellitushaving sufficient power to demonstrate that effects of dietary fat on cardio-vascular or other disease endpoints exist. We only have very limited data fromobservational studies. These recommendations are mainly based on studiesin nondiabetic subjects. The percentage of people who actually adhere tothese recommendations of nutrient intake is very limited in the various coun-tries [27].
Alcohol Intake
The ADA recommend that if individuals choose to drink alcohol, dailyintake should be limited to one drink for adult women and two drinks foradult men. It should be avoided by pregnant women and people with othermedical problems, like pancreatitis, advanced neuropathy, severe hyper-triglyceridemia or alcohol abuse. Since it can have both hypoglycemic orhyperglycemic effects in people with diabetes, alcohol should be consumedduring meals. It has been shown that moderate amounts of alcohol ingestion(5–15 g/day) is associated with a decreased risk of coronary heart disease.The DNSG also agrees with the recommendation of moderate alcohol intakein diabetes (10 g/day for women, 20 g/day for men) provided that it is con-sumed during meals (especially by patients using insulin). The Joslin Clinicdoes not have any specific recommendations for alcohol, whereas the AACErecommends that patients with diabetes should avoid or limit the use of alco-hol, because predicting or anticipating its effect on blood glucose is difficult.The Canadian Diabetes Association recommends limiting intake to 1–2drinks/day, whereas Diabetes UK suggests sensible drinking for the generalpopulation. Moderate alcohol consumption of 1–3 units daily probably has acardioprotective effect.
In conclusion, it looks like alcohol intake does have a cardioprotectiveeffect when used in moderation by diabetic persons [28] and as long as it is
Critical Review of the International Guidelines
215

consumed sensibly (especially with meals by people using insulin) has nodetrimental effect.
Antioxidants and Vitamins
It is generally agreed by all scientific organizations that routine supplemen-tation of the diet with antioxidants and vitamins is not necessary. The DNSG ofthe EASD recommends that the consumption of foods naturally rich in dietaryantioxidants (tocopherols, carotenoids, vitamin C, flavonoids, polyphenols,phytic acid), trace elements and other vitamins should be encouraged. Thedaily consumption of a range of vegetables and fruit is encouraged as well asregular consumption of wholegrain breads, cereal and oily fish. Salt intake isadvised to be limited to �6 g/day.
Prevention of Type-2 Diabetes
During the last few years well-conducted, randomized studies haveunequivocally shown that type-2 diabetes mellitus can be effectively pre-vented or delayed by lifestyle modification programs in people at risk ofdeveloping it [2–4]. The ADA, the DNSG of the EASD and Diabetes UK haveincorporated diabetes prevention guidelines in their nutritional recommen-dations. The ADA gives emphasis to the fact that structured programs thatfocus on lifestyle changes, including education, reduced fat and energyintake, regular physical activity and regular participant contact, can reducethe risk of developing diabetes. The DNSG of the EASD state that weightreduction and maintenance of weight loss in overweight individuals is a crit-ical component of the lifestyle modification program, which may beexpected to reduce the risk of developing type-2 diabetes. The appropriatemacronutrient composition of the diet is a total fat �30% of energy intake,saturated fat �10% and fiber intake �15 g/1,000 kcal. Diabetes UK state thatstructured programs of lifestyle change which emphasize weight loss byreduced energy and fat intake and increased physical activity can reduce therisk of overweight people with impaired glucose tolerance to develop type-2diabetes.
In both studies of diabetes prevention mentioned above [3, 4] frequentingestion of wholegrain products, vegetables, fruits, low-fat milk and meatproducts, soft margarines and vegetable oils rich in MUFAs was the means offacilitating the appropriate macronutrient composition of the diet for achiev-ing a weight loss of 5–7% of the initial body weight. Thus, for people who areoverweight/obese, especially if there is a strong family history of diabetes or ifthey have impaired glucose metabolism, weight loss with diet and exerciseshould be strongly advised.
Katsilambros/Liatis/Makrilakis
216

References
1 King H, Aubert RE, Herman WH: Global burden of diabetes, 1995–2025. Prevalence, numeri-cal estimates and projections. Diabetes Care 1998;21:1414–1431.
2 Pan XR, Li GW, Hu YH, et al: Effects of diet and exercise in preventing NIDDM in people withimpaired glucose tolerance. The Da Qing IGT and Diabetes Study. Diabetes Care 1997;20:537–544.
3 Tuomilehto J, Lindstrom J, Ericsson JG, et al, Finnish Diabetes Prevention Study Group:Prevention of type 2 diabetes mellitus by changes in lifestyle among subjects with impairedglucose tolerance. N Engl J Med 2001;344:1343–1350.
4 Knowler WC, Barrett-Connor E, Fowler S, et al, Diabetes Prevention Program ResearchGroup: Reduction in the incidence of type 2 diabetes with lifestyle intervention or metformin.N Engl J Med 2002;346:393–403.
5 American Diabetes Association: Position Statement: Standards of medical care in diabetes.Diabetes Care 2005;28(suppl 1):S4–S36.
6 Mann JI, De Leeuw I, Hermansen K, et al, Diabetes and Nutrition Study Group (DNSG) of theEuropean Association for the Study of Diabetes (EASD): Evidence-based nutritionalapproaches to the treatment and prevention of diabetes mellitus. Nutr Metab Cardiovasc Dis2004;14:373–394.
7 Wolever T, Gougeon R, Freeze C, et al: Nutrition therapy. Canadian Diabetes Association.Clinical Practice Guidelines Expert Committee, 2003 (accessed online at www.diabetes.ca).
8 Joslin Diabetes Center and Joslin Clinic: Clinical nutrition guidelines for overweight andobese adults with type 2 diabetes, prediabetes or at high risk of developing type 2 diabetes,2005, pp 1–5 (accessed online at www.joslin.org).
9 The American Association of Clinical Endocrinologists Medical Guidelines for theManagement of Diabetes Mellitus: The AACE system of intensive diabetes self-management –2002 update. Endocr Pract 2002;8(suppl 1):45–48.
10 Connor H, Annan F, Bunn E, et al, Nutrition Subcommittee of the Diabetes Care AdvisoryCommittee of Diabetes UK: The implementation of nutritional advice for people with dia-betes. Diabet Med 2003;20:786–807.
11 Scottish Intercollegiate Guidelines Network. SIGN Guidelines: An introduction to SIGNmethodology for the development of evidence-based clinical guidelines, 1999 (www.show.scot.nhs.uk/sign/home.htm).
12 The Diabetes and Nutrition Study Group (DNSG) of the European Association for the Studyof Diabetes (EASD), 1999: Recommendations for the nutritional management of patientswith diabetes mellitus. Eur J Clin Nutr 2000;54:353–355.
13 American Diabetes Association: Clinical Practice Recommendations 2004: Nutrition princi-ples and recommendations in diabetes. Diabetes Care 2004;27(suppl 1):S36–S46.
14 Franz MJ, Bantle JP, Beebe CA, et al: Evidence-based nutrition principles and recommenda-tions for the treatment and prevention of diabetes and related complications. Diabetes Care2002;25:148–198.
15 Mann J, Hermansen K, Vessby B, Toeller M, Diabetes Nutrition Study Group of the EuropeanAssociation for the Study of Diabetes: Evidence-based nutritional recommendations for thetreatment and prevention of diabetes and related complications. A European perspective(letter). Diabetes Care 2002;25:1256–1258.
16 Franz MJ, Bantle JP: Response to the Diabetes Nutrition Study Group of the EuropeanAssociation for the Study of Diabetes. Diabetes Care 2002;25:1258–1259.
17 Irwin T: New dietary guidelines from the American Diabetes Association (letter). DiabetesCare 2002;25:1262.
18 Franz MJ, Bantle JP: Response to Irwin. Diabetes Care 2002;25:1262–1263.19 Wolever T: American Diabetes Association evidence-based nutrition principles and recom-
mendations are not based on evidence (letter). Diabetes Care 2002;25:1263–1264.20 Franz MJ, Bantle JP: Response to Wolever. Diabetes Care 2002;25:1264–1265.21 ADA Statement: Dietary carbohydrate (amount and type) in the prevention and management of
diabetes. A statement by the American Diabetes Association. Diabetes Care 2004;27:2266–2271.22 Bornet FR, Costagliola D, Rizkalla et al: Insulinemic and glycemic indexes of six starch-rich
foods taken alone and in a mixed meal by type 2 diabetics. Am J Clin Nutr 1987;45:588–595.
Critical Review of the International Guidelines
217

23 Katsilambros N, Philippides P, Davoulos G, et al: Sesame-derived candies and glycaemicresponse in type II diabetic subjects. Diabetes Nutr Metab 1991;4:325–327.
24 Brinkworth GD, Noakes M, Parker B, et al: Long-term effects of advice to consume a high-protein, low-fat diet, rather than a conventional weight-loss diet, in obese adults with type 2diabetes: one-year follow-up of a randomized trial. Diabetologia 2004;47:1677–1686.
25 Trichopoulou A, Costacou T, Bamia C, Trichopoulos D: Adherence to a Mediterranean dietand survival in a Greek population. N Engl J Med 2003;348:2599–2608.
26 Katsilambros N, Kostalas G, Michalakis N, et al: Metabolic effects of long-term diets enrichedin olive oil or sunflower oil in non-insulin-dependent diabetes. Nutr Metab Cardiovasc Dis1996;6:164–167.
27 Thanopoulou A, Karamanos B, Angelico F, et al, Multi-Centre Study of the MediterraneanGroup for the Study of Diabetes (MGSD): Nutritional habits of subjects with type 2 diabetesmellitus in the Mediterranean basin: comparison with the non-diabetic population and thedietary recommendations. Multi-Centre Study of the Mediterranean Group for the Study ofDiabetes (MGSD). Diabetologia 2004;47:367–376.
28 Pitsavos C, Makrilakis K, Panagiotakos DB, Chrysohoou C, et al: The J-shape effect of alcoholintake on the risk of developing acute coronary syndromes in diabetic subjects: the CAR-DIO2000 II Study. Diabet Med 2005;22:243–248.
Discussion
Ms. Franz: It is essential that nutrition recommendations be evidence-based, butit is also important to have evidence that recommendations can be implemented in the‘real world’ and that outcomes from free-living subjects are similar to the findings fromsubjects in controlled research settings. For example, a number of small, short-termstudies have reported benefits from a diet with 30% of energy intake from protein [1].However, in a study comparing long-term compliance to diets low in fat and high ineither protein or carbohydrate, at the 52-week follow-up protein intake was similar ineach group suggesting that long-term it is difficult to change protein intake [2].
Dr. Katsilambros: Thank you very much for your comments.
References
1 Gannon MC, Nuttall FQ, Saeed A, et al: An increase in dietary protein improves the blood glu-cose response in persons with type 2 diabetes. Am J Clin Nutr 2003;78:734–741.
2 Brinkworth GD, Noakes M, Keogh JB, et al: Long-term effects of a high-protein, low-carbohy-drate diet on weight control and cardiovascular risk markers in obese hyperinsulinemic sub-jects. Int J Obes Relat Metab Disord 2004;28:661–670.
Katsilambros/Liatis/Makrilakis
218

Acarbose, diabetes prevention trials 32,33, 40–42
Accelerator hypothesisaccelerators
beta cell autoimmunity 140, 141,147, 150, 151
insulin resistance 140, 142–144, 150obesity 145–148
diabetes risk and susceptibility 144epidemiology of diabetes 144–146overview 139–141pathophysiology of diabetes
type-1 141, 142, 150, 151type-2 142, 150, 151
Adiponectin, gestational diabetesmellitus pathophysiology 161
Alcohol, dietary guidelines 215, 216Angiotensin-converting enzyme (ACE),
diabetes prevention trials withinhibitors and receptor antagonists35, 36
Antioxidants, see also specificantioxidantsdiet considerations 124, 125dietary guidelines 216intervention trials in diabetes
114–118, 124observational studies in diabetes
109–114oxidative stress and hyperglycemia
108, 109
postprandial glycemia andsuppression in serum 51
recommendations 119, 120supplementation pros and cons 118,
119
Bariatric surgerycosts 40diabetes prevention trials 34, 35, 40effects on hypertension 10energy economy in patients 135, 136
Beta cell apoptosis, acceleratorhypothesis 140, 141, 147, 150, 151
Body mass index, see Obesity
Celiac disease, type-1 diabetesassociation 152
Cortisol, adipose tissue production 8
Diet, see also Glycemic index; Mealreplacement drinks; Obesity; Weightlossantioxidants 124, 125breakfast effect on body weight 194diabetes prevention trials 99, 100,
103, 104, 216exercise interactions with meals 194,
195fiber effects 100guidelines for diabetics
alcohol 215, 216
219
Subject Index

American Diabetes Association 98,99, 208, 209, 213–215
American Heart Association 99Chinese Ministry of Health 99energy balance and weight loss
210, 211European Association for the Study
of Diabetes 99, 208, 209fatty acids 104goals 209, 210macronutrients 211–215
mortality studies 99popular weight loss diets 101, 104, 105salt intake 105very low calorie diets 174, 175
Dipeptidyl peptidase-4 (DDP4),inhibitors in gestational diabetesmellitus management 167
Dyslipidemia, see Low-densitylipoprotein; Triglycerides
Dysmetabolic syndrome, see Metabolicsyndrome
Exercise, see also Lifestyle modificationchildren 194diabetes type-2
exercise testing and prescription189
intensity and modes of physicalactivity 187, 188, 193
management 187metabolism effects 187safety 189, 190
duration versus intensity 195gestational diabetes mellitus
management 162, 166–168meal interactions 194, 195obesity
exercise prescription 194prevention 186treatment 186weight loss
goals 195maintenance 187, 193mechanisms 192
physical activity increase strategies188, 189, 193
physical inactivity and diabetes risks183, 184
Fatdietary guidelines 213, 215limiting in diet 71, 105
Fiberdietary fiber hypothesis 43, 44effects in diet 100
Free fatty acids (FFAs)low glycemic index food effects 46, 47metabolic syndrome levels 5–7, 10–12
Fructosecorn syrup production 84, 85diet responses in diabetics 85–87food sources 84, 85glycemic index 85metabolism 84obesity relationship 88–90, 92, 93, 101rat studies 94, 95sex differences in response 92, 93sweetness 84
Gestational diabetes mellitus (GDM)definition 155generational effects 167, 168incidence trends 156, 165, 166macrosomia prevalence 168maternal nutrition and fetal growth
effects of obesityinsulin resistance 157nutrient delivery 157, 159
pathophysiologyadipocyte factors 161placental factors 159, 160
screening 155, 156treatment
dipeptidyl peptidase-4 inhibitors167
exercise 162, 166–168glyburide 163, 166goals 161insulin therapy 162, 163medical nutrition therapy 161, 162,
166metformin 163, 164rationale 161
Glucor®, mechanism and prescription76
�-Glucosidase inhibitors, see Glucor®
Glutathione, status in diabetes 122, 123Glyburide, gestational diabetes mellitus
management 163, 166Glycemic control
antioxidant supplementation 51
Subject Index
220
Diet (continued)guidelines for diabetics (continued)

importance in complicationprevention 50, 51
traditional Chinese medicine trials20, 21
Glycemic index (GI)classification 54, 58, 59definition 57, 58dietary fiber hypothesis 43, 44dietary recommendation utilization
213, 214energy expenditure effects 54examples of foods 59, 85, 86food company labeling 64, 65, 71fructose 85limitations 45, 59–61low glycemic food effects
blood lipid response 55, 56, 61, 74
clinical effects 48, 49, 54clinical recommendations 77, 78,
80, 81epidemiological evidence for health
effects 49, 62, 100free fatty acid response 46, 47glucose absorption 45, 46, 55, 74HbA1c response 61, 62, 71weight loss studies 63, 64, 69, 70
measurement of food response 44,45, 53
HbA1c, low glycemic index food effects61, 62, 71
Herbal therapy, see Traditional Chinesemedicine
Hormone replacement therapy, diabetesprevention trials 36, 37
Hypertensionbariatric surgery effects 10metabolic syndrome 12
Insulin resistanceaccelerator hypothesis 140, 150body mass index and risks 145–148diabetes treatment implications
153fetal insulin hypothesis 143gestational diabetes mellitus 157metabolic syndrome 5–8oxidative stress and hyperglycemia
108, 109thrifty genotype hypothesis 142thrifty phenotype hypothesis 142
Insulin therapygestational diabetes mellitus 162, 163preprandial use 76
Leptinbody weight regulation 192gestational diabetes mellitus
pathophysiology 159–161Life expectancy, trends 205, 206Lifestyle modification, see also Diet;
Exercise;; Weight lossbenefits over pharmacotherapy 39, 40components
assessment 200behavior modification 201cognitive restructuring 202contracting 203diet and physical activity 201goal-setting 201relapse prevention 203self-monitoring 201, 202, 204social support 203stimulus control 202stress management 203
diabetes prevention studies 49, 50metabolic syndrome studies 198–200prospects for study 204
Low-density lipoprotein (LDL)fructose response 87, 88low glycemic index food effects 55,
56, 61, 74
Macrosomia, see Gestational diabetesmellitus
Meal replacement drinkschildren 181composition 175, 179duration of use 179, 180popularity 176prospects for study 177weight loss
compliance 179, 180efficacy 175, 176, 180mechanisms 176, 177
Medical nutrition therapy (MNT)benefits in type-2 diabetes 173, 174diabetes trials 66gestational diabetes mellitus 161, 162,
166goals 209, 210guidelines, see Dietindividualization 208
Subject Index
221

Metabolic syndromeblood pressure 12China 16definitions 1–3, 5, 9, 10diagnosis 198epidemiology 3, 4, 197etiology 5–8free fatty acid levels 5–7, 10–12insulin resistance 5–8lifestyle modification intervention
trials 198–200obesity role 7, 8, 11, 12traditional Chinese medicine,
see Traditional Chinese medicinetreatment 6, 7
Metformindiabetes prevention trials 32, 33, 40–42gestational diabetes mellitus
management 163, 164mechanism of action 76
Motivational interviewing, weight losspatients 133
National Weight Control Registry 193,195
Novonorm®, hypoglycemic activity 76
Obesity, see also Diet; Weight lossbariatric surgery effects on
hypertension 10body mass index and insulin
resistance risks 145–148breakfast effect on body weight 194diabetes risks 171, 172, 184, 185etiology 41exercise
prescription 194prevention trials 186weight loss
goals 195maintenance 187, 193mechanisms 192
fructose effects 88–90, 92, 93, 101low glycemic index food weight loss
studies 63, 64, 69, 70metabolic syndrome role 7, 8, 11, 12trends 205, 206
Orlistat, diabetes prevention trials 33, 34Oxidative stress, see Antioxidants
Physical activity, see ExercisePioglitazone, diabetes prevention trials 38
Pravastatin, diabetes prevention trials 36Protein, dietary guidelines 214, 215
Rehmannia six recipe, diabetesmanagement 25–28
Salt intake guidelines 105Starlix®, hypoglycemic activity 76Stress management, lifestyle
modification 203Syndrome X, see Metabolic syndrome
Thyroid hormone, energy economyregulation 136
Traditional Chinese medicine (TCM),diabetes managementadverse effects 22antidiabetic drug therapy combination
20, 21, 27–29glycemic control trials 20, 21herbs 17–19, 25–28modes 16, 17overview 15, 16recommendations 22symptom relief trials 17
Triglycerides, fructose effects 88–90,92, 94
Troglitazone, diabetes prevention trials33
Tumor necrosis factor-� (TNF-�),gestational diabetes mellituspathophysiology 159, 160
Very low calorie diets (VLCDs), weightloss 174, 175
Vitamin A, intervention trials in diabetes118
Vitamin C, intervention trials in diabetes118
Vitamin Eintervention trials in diabetes 114, 118mortality impact in diabetes 125observational studies in diabetes 109supplementation in glycemic control
51
Weight lossbenefits in type-2 diabetes 172, 173children 137diabetes prevention studies 172diet, see also Diet; Meal replacement
drinks
Subject Index
222

guidelines for energy balance 210,211
low carbohydrate versus low fat127, 128
low glycemic index food studies63, 64, 69, 70, 137
popular weight loss diets 101, 104,105
recommendations 136, 137safety 137very low calorie diets 174, 175
difficulty in diabetics 174exercise in maintenance 187, 192maintenance 128, 129
motivational interviewing 133sympathetic nervous system response
in obese patients 134, 135therapeutic patient education
diet compliance 129, 130food binge cycle breaking 131,
132obese patients 131, 132quality of life outcomes 130
Xenical®, diabetes prevention trials34, 40
Zinc, status in diabetes 123
Subject Index
223
Copyright © 2022 FDOKUMEN