Relationship between biochemical markers and radiographic scores in the evaluation of the...
10
Relationship between biochemical markers and radiographic scores in the evaluation of the osteoarticular status of Warmblood stallions Denis Verwilghen a, * , Valeria Busoni b , Monika Gangl f , Thierry Franck c , Jean-Philippe Lejeune e , Laurent Vanderheyden e , Johann Detilleux d , Sigrid Grulke a , Michelle Deberg g , Yves Henrotin c,g , Didier Serteyn a,c,e a Department of Clinical Sciences, Equine Clinic, Faculty of Veterinary Medicine of Liege, Bld de Colonster 20 B41, Sart-Tilman B41, B-4000 Liege, Belgium b Department of Medical Imaging, Faculty of Veterinary Medicine of Liege, Sart-Tilman B41, B-4000 Liege, Belgium c Centre for Oxygen Research and Development, University of Liege, Belgium d Department of Genetics, Faculty of Veterinary Medicine of Liege, Sart-Tilman B41, B-4000 Liege, Belgium e European Horse Centre, Mont le Soie, Vielsalm, Belgium f Ecole Nationale Vétérinaire de Lyon, Equine Department, Marcy l’Etoile F-69280, France g Bone and Cartilage Research Unit, University of Liege, Belgium article info Article history: Accepted 9 February 2009 Keywords: Biochemical markers Horse Radiological scoring Myeloperoxidases Collagen degradation Insulin growth factor-I abstract Establishing the osteoarticular status of the horse is often performed by means of radiological screening of the animals. Widespread blood sampling could reveal to be an interesting alternative to this procedure which is time consuming and sometimes technically difficult. The aim of this study was to investigate the relationship between the radiological status of the horses and the levels of biochemical markers of car- tilage degradation and synovial inflammation. A specific radiological scoring and classification system was therefore developed and applied on 63 stallions presented for studbook admission. Additionally, groups of horses were established according to the occurrence of osteochondrosis, degenerative joint dis- ease and distal interphalangeal joint effusion. Insulin growth factor-I, myeloperoxidases, Coll2-1 and Coll2-1NO 2 were used as blood markers. The combination of the blood parameters did not seem to cor- relate with the used scoring system. Coll2-1NO 2 levels however tended to increase with poorer radiolog- ical class and this could therefore potentially be a useful predictor of the osteoarticular status in the horse. Coll2-1 levels were significantly higher in the degenerative joint disease group. A high percentage of horses with distal interphalangeal joint effusion was present in this study and was associated with decreased IGF-I and increased Coll2-1 levels. Ó 2009 Elsevier Ltd. All rights reserved. 1. Introduction The health status of a horse and in particular of its musculoskel- etal system is of paramount importance to determine its durability, usability and suitability for future athletic performance. Radio- graphic evaluation has therefore become a common part of health screenings of young animals, especially those enrolled in future breeding or performance programs. The radiological status of a horse has gained considerable impact on the economical value of the animal. Firstly, it was shown a useful predictor of future sound- ness and performance (Courouce-Malblanc et al., 2006; van Hoo- gmoed et al., 2003). And secondly, it can reveal the necessity of surgical intervention before the start of a career, preventing career interruption later on. Developmental orthopaedic disorders and early joint disease are one of the frequently diagnosed findings on radiology (Todhunter and Lust, 1990). Detection of these dis- eases is a crucial point when applying these radiographic screen- ings, especially because joint disease often leads to lameness and causes considerable wastage among animals and direct economic losses for owners and breeders (Jeffcott, 1991, 1996; Olivier et al., 1997; Rossdale et al., 1985; Todhunter and Lust, 1990). Establishing the osteoarticular status of horses by widespread blood sampling (Donabedian et al., 2008) could potentially be an alternative to imaging techniques. For this study, four biochemical markers were chosen which have been shown to allow evaluation of modifications of cartilage metabolism as well as having a role in the inflammatory process coinciding with joint diseases. Alterations in plasma concentrations of Insulin growth factor-I (IGF-I) have been shown to be related to the appearance of osteochondrosis (OC) and degenerative joint disease (DJD) in a number of studies (Lejeune et al., 2007a; Semevolos et al., 2004; 0034-5288/$ - see front matter Ó 2009 Elsevier Ltd. All rights reserved. doi:10.1016/j.rvsc.2009.02.002 * Corresponding author. Tel.: +32 4 366 41 03; fax: +32 4 366 41 08. E-mail addresses: [email protected], [email protected] (D. Ver- wilghen). Research in Veterinary Science 87 (2009) 319–328 Contents lists available at ScienceDirect Research in Veterinary Science journal homepage: www.elsevier.com/locate/rvsc
Transcript of Relationship between biochemical markers and radiographic scores in the evaluation of the...
Research in Veterinary Science 87 (2009) 319–328
Contents lists available at ScienceDirect
Research in Veterinary Science
journal homepage: www.elsevier .com/locate / rvsc
Relationship between biochemical markers and radiographic scoresin the evaluation of the osteoarticular status of Warmblood stallions
Denis Verwilghen a,*, Valeria Busoni b, Monika Gangl f, Thierry Franck c, Jean-Philippe Lejeune e,Laurent Vanderheyden e, Johann Detilleux d, Sigrid Grulke a, Michelle Deberg g, Yves Henrotin c,g,Didier Serteyn a,c,e
a Department of Clinical Sciences, Equine Clinic, Faculty of Veterinary Medicine of Liege, Bld de Colonster 20 B41, Sart-Tilman B41, B-4000 Liege, Belgiumb Department of Medical Imaging, Faculty of Veterinary Medicine of Liege, Sart-Tilman B41, B-4000 Liege, Belgiumc Centre for Oxygen Research and Development, University of Liege, Belgiumd Department of Genetics, Faculty of Veterinary Medicine of Liege, Sart-Tilman B41, B-4000 Liege, Belgiume European Horse Centre, Mont le Soie, Vielsalm, Belgiumf Ecole Nationale Vétérinaire de Lyon, Equine Department, Marcy l’Etoile F-69280, Franceg Bone and Cartilage Research Unit, University of Liege, Belgium
a r t i c l e i n f o
Article history:Accepted 9 February 2009
Keywords:Biochemical markersHorseRadiological scoringMyeloperoxidasesCollagen degradationInsulin growth factor-I
0034-5288/$ - see front matter � 2009 Elsevier Ltd. Adoi:10.1016/j.rvsc.2009.02.002
* Corresponding author. Tel.: +32 4 366 41 03; fax:E-mail addresses: [email protected], den
wilghen).
a b s t r a c t
Establishing the osteoarticular status of the horse is often performed by means of radiological screeningof the animals. Widespread blood sampling could reveal to be an interesting alternative to this procedurewhich is time consuming and sometimes technically difficult. The aim of this study was to investigate therelationship between the radiological status of the horses and the levels of biochemical markers of car-tilage degradation and synovial inflammation. A specific radiological scoring and classification systemwas therefore developed and applied on 63 stallions presented for studbook admission. Additionally,groups of horses were established according to the occurrence of osteochondrosis, degenerative joint dis-ease and distal interphalangeal joint effusion. Insulin growth factor-I, myeloperoxidases, Coll2-1 andColl2-1NO2 were used as blood markers. The combination of the blood parameters did not seem to cor-relate with the used scoring system. Coll2-1NO2 levels however tended to increase with poorer radiolog-ical class and this could therefore potentially be a useful predictor of the osteoarticular status in thehorse. Coll2-1 levels were significantly higher in the degenerative joint disease group. A high percentageof horses with distal interphalangeal joint effusion was present in this study and was associated withdecreased IGF-I and increased Coll2-1 levels.
� 2009 Elsevier Ltd. All rights reserved.
1. Introduction
The health status of a horse and in particular of its musculoskel-etal system is of paramount importance to determine its durability,usability and suitability for future athletic performance. Radio-graphic evaluation has therefore become a common part of healthscreenings of young animals, especially those enrolled in futurebreeding or performance programs. The radiological status of ahorse has gained considerable impact on the economical value ofthe animal. Firstly, it was shown a useful predictor of future sound-ness and performance (Courouce-Malblanc et al., 2006; van Hoo-gmoed et al., 2003). And secondly, it can reveal the necessity ofsurgical intervention before the start of a career, preventing careerinterruption later on. Developmental orthopaedic disorders and
ll rights reserved.
+32 4 366 41 [email protected] (D. Ver-
early joint disease are one of the frequently diagnosed findingson radiology (Todhunter and Lust, 1990). Detection of these dis-eases is a crucial point when applying these radiographic screen-ings, especially because joint disease often leads to lameness andcauses considerable wastage among animals and direct economiclosses for owners and breeders (Jeffcott, 1991, 1996; Olivieret al., 1997; Rossdale et al., 1985; Todhunter and Lust, 1990).Establishing the osteoarticular status of horses by widespreadblood sampling (Donabedian et al., 2008) could potentially be analternative to imaging techniques.
For this study, four biochemical markers were chosen whichhave been shown to allow evaluation of modifications of cartilagemetabolism as well as having a role in the inflammatory processcoinciding with joint diseases.
Alterations in plasma concentrations of Insulin growth factor-I(IGF-I) have been shown to be related to the appearance ofosteochondrosis (OC) and degenerative joint disease (DJD) in anumber of studies (Lejeune et al., 2007a; Semevolos et al., 2004;
320 D. Verwilghen et al. / Research in Veterinary Science 87 (2009) 319–328
Sloet van Oldenruitenborgh-Oosterbaan et al., 1999). IGF-I is alsorelated to the metabolic activity of the bone (Davicco et al., 1994).
Coll2-1, a recently introduced marker of type II collagen degra-dation in equine osteochondral lesions was also measured (Deberget al., 2005; Gangl et al., 2007; Henrotin et al., 2004). Type II colla-gen is specific for cartilage and is the most abundant protein in itsextra-cellular matrix. Measurement of its fragments can thereforebe taken as a good marker of cartilage degradation. Moreover,Coll2-1 is now recognized as a diagnostical, prognostical and bur-den of disease marker in human osteoarthritis (OA) (Henrotinet al., 2007).
As synovitis is one of the clinical symptoms usually accompany-ing joint disease in horses, two inflammatory markers, Coll2-1NO2
and myeloperoxidase (MPO) were measured. Coll2-1NO2, is the ni-trated form of Coll2-1 and was found to be elevated in sera of hu-man patients with knee OA (Deberg et al., 2005; Henrotin et al.,2004) and in horses suffering from OC (Gangl et al., 2007) and juve-nile degenerative digital osteoarthropathy (Lejeune et al., 2007b).Nitrated peptides are considered to be specific markers for proteinoxidation by peroxynitrite (ONOO�), an unstable oxidant formedby the reaction of superoxide anion (O�2 ) and nitric oxide (NO)(Beckman and Koppenol, 1996). In situations mimicking inflamma-tory joint diseases, NO and O�2 are produced by a large number ofcells including macrophages, neutrophiles, synoviocytes and chon-drocytes (Henrotin et al., 1993, 1998; Schneider et al., 2005). Car-tilage matrix components were shown to be nitrated in situ or insynovial fluid after which they are released into the bloodstream(Kaur and Halliwell, 1994). More recently, other pathways of pep-tide nitration have been suggested. MPO-catalysed tyrosine nitra-tion is currently the most frequently discussed alternativemechanism involved in this process (Baldus et al., 2002; Brennanet al., 2002; Burner et al., 2000; Gaut et al., 2002).
MPO, is a specific enzyme of neutrophils, which is released bythese cells after stimulation during inflammatory processes. In hu-man medicine, MPO has been measured as marker of neutrophilactivation and tissue infiltration in a broad variety of pathologies(Serteyn et al., 2003), including OA (Deberg et al., 2008). In equinemedicine, increased levels have been found in horses sufferingfrom recurrent airway obstruction (Art et al., 2006b), intestinalpathologies (Grulke et al., 1999) and OC (Gangl et al., 2008). In-creased MPO activity was also observed in antigen-induced arthri-tis in guinea pigs and was attributed to neutrophils attracted tosynovial tissue (Kuwabara et al., 2002). In order to evaluate plasmaMPO levels in various equine pathologies, an ELISA for equine MPOwas recently developed by Franck et al. (2005).
The aim of this study is to investigate the relationship betweenthe radiological status of the horses and the levels of biochemicalmarkers (IGF-I, MPO, Coll2-1 and Coll2-1NO2) of cartilage degrada-tion and synovial inflammation. Moreover, it was hypothesisedthat the radiological score could be predicted by the combinationof the four biochemical markers used.
2. Material and methods
2.1. Examined horse population, age and weight groups
All horses included in the study were presented to the EquineClinic of the Faculty of Veterinary Medicine of Liege for veterinaryexamination as part of the stallion admission to the Walloon Bel-gian Warmblood Studbook (sBs) between September 2006 and Jan-uary 2007. A total of sixty three stallions underwent a standardstudbook admission examination protocol, consisting of a generalclinical examination, an orthopaedic assessment, an upper airwayendoscopy and a radiographic protocol. For the current study onlythe radiographic protocol was considered.
All horses were non-gelded males with a mean of 2.55 years ofage. Only two animals were 6 years old and one 5 years old, all oth-ers ranged between 2 and 4 years of age. Twenty two were of sBs(Belgian sport horses) origin, eleven were BWP’s (Belgian Warm-blood horses), five KWPN (Dutch Warmblood horses), three Hano-verian, seven Holstein, seven Selle Francais and nine were fromother Studbooks. Their mean weight was 570 ± 60 kg.
Informed owner’s consent was obtained before enrolling thehorses in the study.
Three age and weight groups were established to process thedata. The first age group comprised all 2 year olds (n = 43), thesecond age group all 3 year old (n = 10), and the third groupthe 4 year olds and older (n = 10). The first weight group com-prised horses below 550 kg (n = 14), the second group those be-tween 550 and 600 kg (n = 24) and the third group those above600 kg (n = 25).
2.2. Clinical examination
All presented stallions underwent a clinical and orthopaedicexamination always performed by the same clinician, duringwhich they were scored on presence of lameness according tothe AAEP grading system.
All animals underwent a classical general examination to ex-clude any obvious signs of disease.
2.3. Radiographic examination and radiological classification
All radiographic examinations were performed following astandardised procedure. All horses were sedated for the radio-graphic examination using detomidine (10 ug/kg IV) alone or com-bined with butorphanol (0.02 mg/kg IV).
The following views were taken: dorso 60� proximo-palmaro-distal oblique and weight bearing lateromedial views of the frontfeet, lateromedial views of the four fetlocks, lateromedial andplantarolateral–dorsomedial oblique views of the hocks and a lat-eromedial view of the stifles. The choice of the number of radio-graphic views and of the radiographic projections used wasdictated by three main reasons: working with young horses some-times difficult to manipulate, reducing the irradiation risks for thestaff and detecting a maximal number of developmental orthopae-dic lesions on a given radiograph. Supplementary views were how-ever taken when doubts arose on the obtained findings.
Radiographs were read and scored by consensus opinion of twoexperienced readers (a senior ECVDI certified radiologist and a fi-nal-year radiology resident). Scores were allocated to all radio-graphic findings recorded using a severity grading systemadapted from the one described by Robert et al. (2006). Higherscores indicate greater severity of radiographic changes and higherpresumed clinical significance. The severity grades and their corre-sponding scores are reported in Table 1.
A review of the most common radiographic findings was madeand noted on a score sheet. They were then attributed to one of thefive severity grades (I–V) as defined in Table 2. The correspondingscore (see Table 1) ranging between 0 and 8 was then allocated toeach radiographic finding according to its severity group. An over-all radiographic score for each individual horse was then obtainedby adding all the scores of all the radiographic findings of that indi-vidual. Based on the total radiographic score obtained, each horsewas then allocated an osteoarticular class. Horses having a totalscore between 0 and 3 were assigned to class A = excellent/good,those having a total score between 4 and 6 were assigned to classB = average/fair and those having a total score equal or superiorthan 7 were assigned to class C = poor.
Additionally to the scoring system, three separate groups werecreated. One group consisting of horses with OC lesions, including
Table 1Radiographic findings classification system.
Severitygrade
Radiographic finding Score
I Anatomical variation or accidental finding with no clinicalsignificance
0
II Minimal radiographic change currently found in sound horses 1III Mild radiographic change that may be found in sound horses
or associated with lameness2
IV Moderate radiographic change commonly responsible forjoint pain and lameness
4
V Severe radiographic finding currently responsible forlameness and impairing a future sport career
8
D. Verwilghen et al. / Research in Veterinary Science 87 (2009) 319–328 321
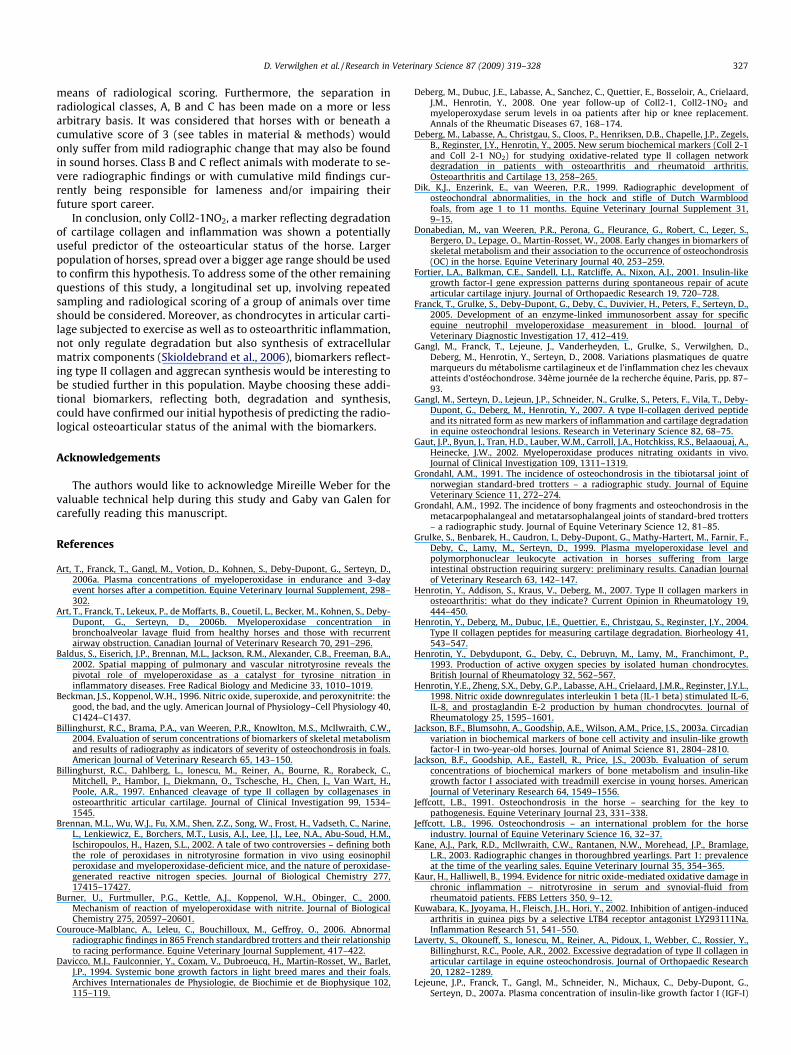
horses with radiological signs of osteochondrosis, osteochondrosisdissecans, cyst-like lesions, osteochondral fragments at the distalborder of the navicular bone, the processus extensorius and inthe fetlock, together with well defined defects of the sagittal ridgeof the third metacarpus/tarsus. Another group of horses sufferingfrom degenerative joint disease (DJD) was established. This groupincluded all horses suffering from degenerative joint disease inany of the examined joints, not taking severity of the lesions intoaccount. A third group was made including all horses showingradiographic evidence of distal interphalangeal joint (DIPJ) effusionon the lateromedial view of one or both front feet (Fig. 1), not tak-ing the severity of the effusion into account.
2.4. Blood samples
Venous blood samples were collected from the jugular veinsinto tubes (Monovette 9 ml, Sarstedt) containing EDTA (1.6 mg/ml blood) for the Coll 2-1, Coll 2-1NO2 and MPO assays or heparin(15 I.U./ml blood) for the IGF-I assay in all but seven horses. Samplecollection took place in the morning in order to exclude any effectsof possible circadian variation (Jackson et al., 2003a). Blood wascentrifuged at 7000g for 10 min at room temperature. The plasmawas aliquoted and frozen at �20 �C within 60 min from sampling.Plasma samples were only thawed immediately prior to assays.
2.5. IGF-I assay
After acidic extraction, as described in the instructions of theEquine IGF-I ELISA kit (BiopTis, Liege, Belgium), the total IGF-I (freeIGF-I and IGF-I separated from its binding proteins) was measuredin the plasma with a specific enzyme-linked immunosorbent assay,using two monoclonal antibodies (one coated on 96 micro wellsand the other coupled to alkaline phosphatase). Twenty five micro-litre of the sample and the conjugated monoclonal antibody wereadded at the same time into the wells and incubated for 90 minat 25 �C. After washing, phosphatase activity was detected by incu-bation (30 min at 25 �C) with paranitrophenyl phosphate solution.The reaction was stopped and the absorbance (405 nm) was readusing the Multiscan Ascent (Labsystem).
2.6. MPO assay
The plasma aliquots were diluted 40 times in a 20 mM phos-phate buffer saline (PBS) at pH 7.4 containing 5 g/L of bovine serumalbumin (BSA) and 0.1% Tween 20. MPO was assayed with an ori-ginal specific enzyme-linked immunosorbent assay (Equine MPO-ELISA kit, BiopTis, Liege, Belgium) developed by Franck et al.(2005) using two specific polyclonal antibodies obtained from rab-bit (primary antibody) and guinea pig (secondary antibody) cou-pled to alkaline phosphatase. Phosphatase activity was detectedby incubation (30 min, 37 �C, in darkness) with a 2.7 mM parani-trophenyl phosphate solution (phosphatase substrate). The
reaction was stopped with 2.5 M NaOH and the absorbance(405 nm) was read with the Multiscan Ascent.
2.7. Coll2-1. and Coll2-1NO2 assays
The Coll2-1 and Coll2-1NO2 assays are two competitive immu-noassays previously described in detail by Deberg et al. (2005).Briefly, microplates were coated with 200 ll of streptavidine0.5 mg/ml during at least 48 h. After washing (washing buffer: Tris25 M, NaCl 50 mM, Tween 20 0.2% pH 7.3), microtiter plates weresubsequently blocked with 400 ll/well of blocking buffer (KH2PO4
1.5 mM, Na2HPO4 8 mM, KCl 2 mM, NaCl 138 mM, BSA 0.5 pH 7.4)overnight at 4 �C. Coll2-1 and Coll2-1NO2 were conjugated to bio-tin. After washing, 100 ll of these biotinylated peptides either Coll2-1 at 2.5 ng/ml or Coll 2-1 NO2 at 1.25 ng/ml, were added to eachwell of streptavidine-coated plates and incubated for 2 h at roomtemperature. Fifty microlitre of calibrators (synthetic peptide) orunknown samples, diluted 8-fold in dilution buffer (10 mM phos-phate buffer saline, 138 mM NaCl, 7% BSA, 0.1% Tween 20 pH 7.0for the Coll 2-1 immunoassay and in 50 mM Tris, 138 mM NaCl,7% BSA, 0.1% Tween 20 pH 8.0 for the Coll2-1 NO2 immunoassay)were applied to the wells, followed by either 100 ll of anti-Coll2-1 antibody, diluted to 1/40,000 or 100 ll of anti-Coll2-1NO2 antibody, diluted to 1/500.000, and incubated 1 h at roomtemperature. The dilutions of the antisera and of the secondaryantibody were made in 10 mM PBS, 138 mM NaCl, 0.2% BSA, 0.1%Tween 20, pH 7.0, for the Coll2-1 immunoassay and in 50 mM Tris,138 mM NaCl, 0.2% BSA, 0.1% Tween 20, pH 8.0, for the Coll2-1NO2immunoassay. After washing, 100 ll of peroxidase-conjugatedgoat antibodies to rabbit IgG (Biosource Europe S.A., Nivelles, Bel-gium), diluted 1/5000, were incubated 1 h at room temperature.After washing, 100 ll of freshly prepared enzyme substrate wereadded into each well. After 15 min, the reaction was stopped with100 ll of 4 M H3PO4. The absorption was read with a microplatereader at 450 nm, corrected for absorbance at 650 nm.
2.8. Statistical analysis
All data was analysed using SAS commercial software (Statisti-cal Analysis System, SAS Institute GmbH Heidelberg, Germany).Normality of data was checked using univariate procedure.
The radiographic data used for statistical analyses included theOC, DJD and DIPJ effusion group and the overall radiological scoreof the horse (sum of all scores of each individual finding of a horse)and his attributed A, B or C class and the AAEP lameness grade.
The effects of age and weight on the biochemical markers and ofthe biochemical markers on the radiological score and class weremeasured using GLM procedure. Correlations between biochemicalmarkers and radiological grade and class and AAEP lameness gradewere measured using Pearson’s correlations.
Mean values of biochemical markers between groups of OC po-sitive versus negative, DJD positive versus negative and joint effu-sion of the DIPJ positive versus negative were compared using t-test procedure.
Significance was set at P < 0.05.The same statistical procedure was also applied only on the
group of 2 year old horses (n = 43).
3. Results
3.1. Prevalence of lesions, distribution of classes and grades, lamenessgrades, mean blood values for IGF-I, MPO, Coll2-1 and Coll2-1NO2
Forty stallions (63.49%) were attributed a class A, 15 (23.81%)a class B and 8 (12.70%) a class C after adding their individual
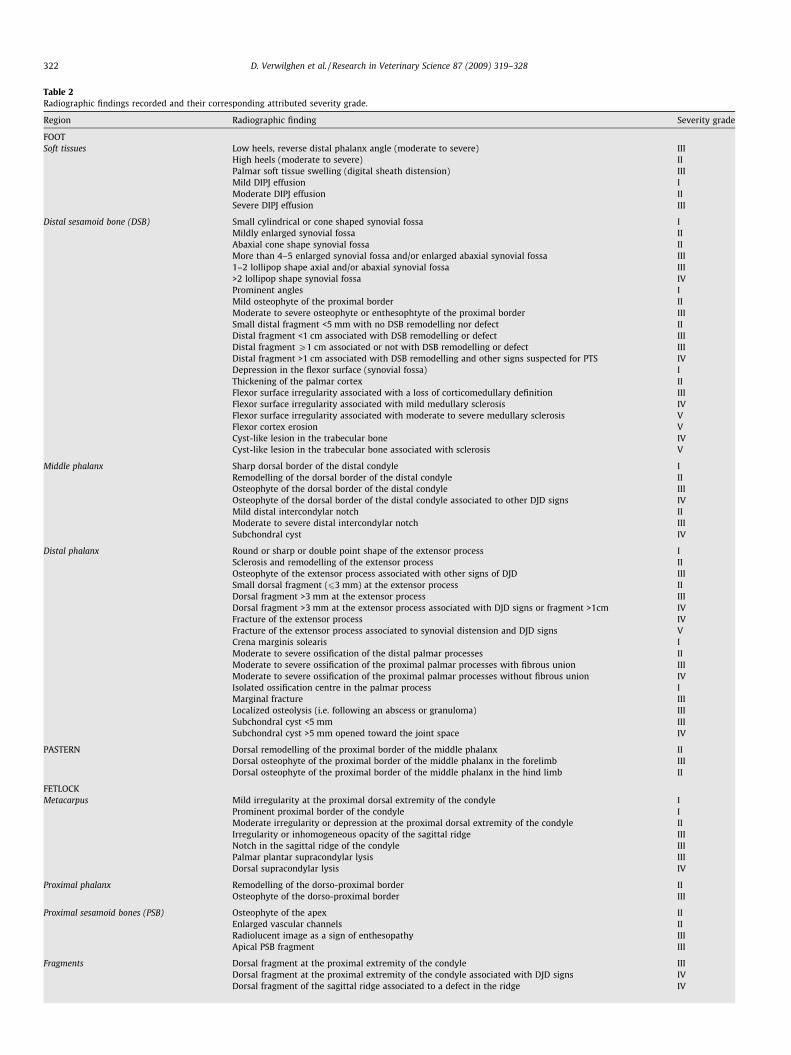
Table 2Radiographic findings recorded and their corresponding attributed severity grade.
Region Radiographic finding Severity grade
FOOTSoft tissues Low heels, reverse distal phalanx angle (moderate to severe) III
High heels (moderate to severe) IIPalmar soft tissue swelling (digital sheath distension) IIIMild DIPJ effusion IModerate DIPJ effusion IISevere DIPJ effusion III
Distal sesamoid bone (DSB) Small cylindrical or cone shaped synovial fossa IMildly enlarged synovial fossa IIAbaxial cone shape synovial fossa IIMore than 4–5 enlarged synovial fossa and/or enlarged abaxial synovial fossa III1–2 lollipop shape axial and/or abaxial synovial fossa III>2 lollipop shape synovial fossa IVProminent angles IMild osteophyte of the proximal border IIModerate to severe osteophyte or enthesophtyte of the proximal border IIISmall distal fragment <5 mm with no DSB remodelling nor defect IIDistal fragment <1 cm associated with DSB remodelling or defect IIIDistal fragment P1 cm associated or not with DSB remodelling or defect IIIDistal fragment >1 cm associated with DSB remodelling and other signs suspected for PTS IVDepression in the flexor surface (synovial fossa) IThickening of the palmar cortex IIFlexor surface irregularity associated with a loss of corticomedullary definition IIIFlexor surface irregularity associated with mild medullary sclerosis IVFlexor surface irregularity associated with moderate to severe medullary sclerosis VFlexor cortex erosion VCyst-like lesion in the trabecular bone IVCyst-like lesion in the trabecular bone associated with sclerosis V
Middle phalanx Sharp dorsal border of the distal condyle IRemodelling of the dorsal border of the distal condyle IIOsteophyte of the dorsal border of the distal condyle IIIOsteophyte of the dorsal border of the distal condyle associated to other DJD signs IVMild distal intercondylar notch IIModerate to severe distal intercondylar notch IIISubchondral cyst IV
Distal phalanx Round or sharp or double point shape of the extensor process ISclerosis and remodelling of the extensor process IIOsteophyte of the extensor process associated with other signs of DJD IIISmall dorsal fragment (63 mm) at the extensor process IIDorsal fragment >3 mm at the extensor process IIIDorsal fragment >3 mm at the extensor process associated with DJD signs or fragment >1cm IVFracture of the extensor process IVFracture of the extensor process associated to synovial distension and DJD signs VCrena marginis solearis IModerate to severe ossification of the distal palmar processes IIModerate to severe ossification of the proximal palmar processes with fibrous union IIIModerate to severe ossification of the proximal palmar processes without fibrous union IVIsolated ossification centre in the palmar process IMarginal fracture IIILocalized osteolysis (i.e. following an abscess or granuloma) IIISubchondral cyst <5 mm IIISubchondral cyst >5 mm opened toward the joint space IV
PASTERN Dorsal remodelling of the proximal border of the middle phalanx IIDorsal osteophyte of the proximal border of the middle phalanx in the forelimb IIIDorsal osteophyte of the proximal border of the middle phalanx in the hind limb II
FETLOCKMetacarpus Mild irregularity at the proximal dorsal extremity of the condyle I
Prominent proximal border of the condyle IModerate irregularity or depression at the proximal dorsal extremity of the condyle IIIrregularity or inhomogeneous opacity of the sagittal ridge IIINotch in the sagittal ridge of the condyle IIIPalmar plantar supracondylar lysis IIIDorsal supracondylar lysis IV
Proximal phalanx Remodelling of the dorso-proximal border IIOsteophyte of the dorso-proximal border III
Proximal sesamoid bones (PSB) Osteophyte of the apex IIEnlarged vascular channels IIRadiolucent image as a sign of enthesopathy IIIApical PSB fragment III
Fragments Dorsal fragment at the proximal extremity of the condyle IIIDorsal fragment at the proximal extremity of the condyle associated with DJD signs IVDorsal fragment of the sagittal ridge associated to a defect in the ridge IV
322 D. Verwilghen et al. / Research in Veterinary Science 87 (2009) 319–328
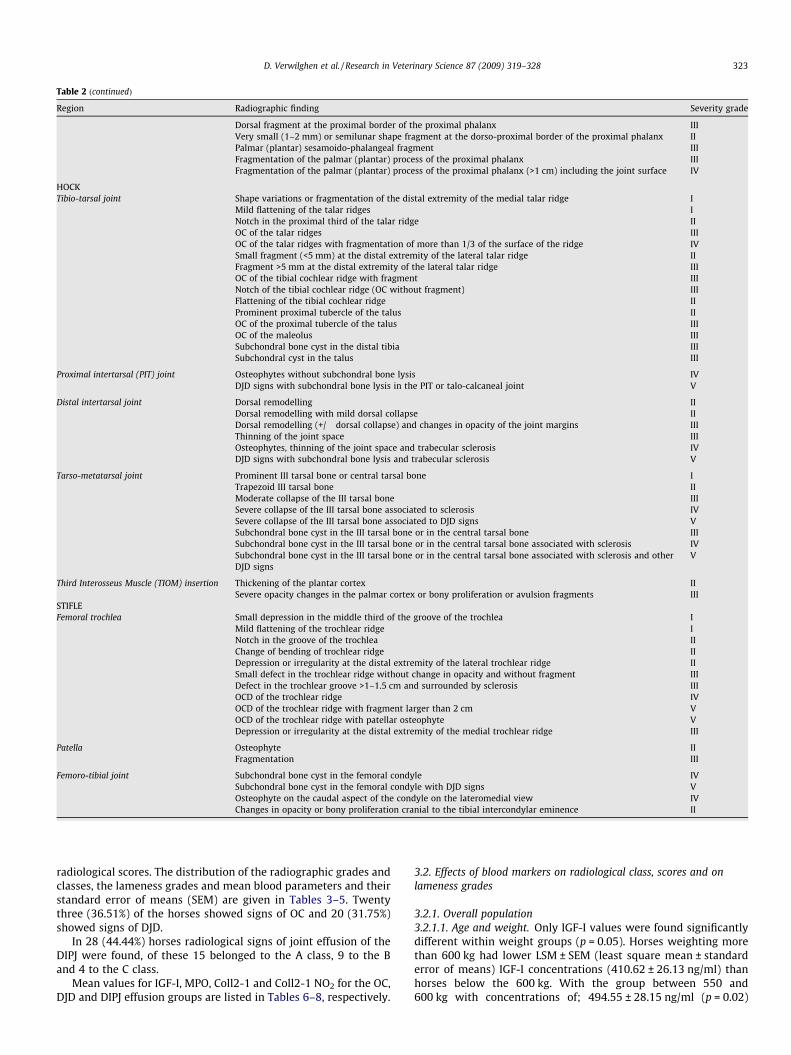
Table 2 (continued)
Region Radiographic finding Severity grade
Dorsal fragment at the proximal border of the proximal phalanx IIIVery small (1–2 mm) or semilunar shape fragment at the dorso-proximal border of the proximal phalanx IIPalmar (plantar) sesamoido-phalangeal fragment IIIFragmentation of the palmar (plantar) process of the proximal phalanx IIIFragmentation of the palmar (plantar) process of the proximal phalanx (>1 cm) including the joint surface IV
HOCKTibio-tarsal joint Shape variations or fragmentation of the distal extremity of the medial talar ridge I
Mild flattening of the talar ridges INotch in the proximal third of the talar ridge IIOC of the talar ridges IIIOC of the talar ridges with fragmentation of more than 1/3 of the surface of the ridge IVSmall fragment (<5 mm) at the distal extremity of the lateral talar ridge IIFragment >5 mm at the distal extremity of the lateral talar ridge IIIOC of the tibial cochlear ridge with fragment IIINotch of the tibial cochlear ridge (OC without fragment) IIIFlattening of the tibial cochlear ridge IIProminent proximal tubercle of the talus IIOC of the proximal tubercle of the talus IIIOC of the maleolus IIISubchondral bone cyst in the distal tibia IIISubchondral cyst in the talus III
Proximal intertarsal (PIT) joint Osteophytes without subchondral bone lysis IVDJD signs with subchondral bone lysis in the PIT or talo-calcaneal joint V
Distal intertarsal joint Dorsal remodelling IIDorsal remodelling with mild dorsal collapse IIDorsal remodelling (+/� dorsal collapse) and changes in opacity of the joint margins IIIThinning of the joint space IIIOsteophytes, thinning of the joint space and trabecular sclerosis IVDJD signs with subchondral bone lysis and trabecular sclerosis V
Tarso-metatarsal joint Prominent III tarsal bone or central tarsal bone ITrapezoid III tarsal bone IIModerate collapse of the III tarsal bone IIISevere collapse of the III tarsal bone associated to sclerosis IVSevere collapse of the III tarsal bone associated to DJD signs VSubchondral bone cyst in the III tarsal bone or in the central tarsal bone IIISubchondral bone cyst in the III tarsal bone or in the central tarsal bone associated with sclerosis IVSubchondral bone cyst in the III tarsal bone or in the central tarsal bone associated with sclerosis and otherDJD signs
V
Third Interosseus Muscle (TIOM) insertion Thickening of the plantar cortex IISevere opacity changes in the palmar cortex or bony proliferation or avulsion fragments III
STIFLEFemoral trochlea Small depression in the middle third of the groove of the trochlea I
Mild flattening of the trochlear ridge INotch in the groove of the trochlea IIChange of bending of trochlear ridge IIDepression or irregularity at the distal extremity of the lateral trochlear ridge IISmall defect in the trochlear ridge without change in opacity and without fragment IIIDefect in the trochlear groove >1–1.5 cm and surrounded by sclerosis IIIOCD of the trochlear ridge IVOCD of the trochlear ridge with fragment larger than 2 cm VOCD of the trochlear ridge with patellar osteophyte VDepression or irregularity at the distal extremity of the medial trochlear ridge III
Patella Osteophyte IIFragmentation III
Femoro-tibial joint Subchondral bone cyst in the femoral condyle IVSubchondral bone cyst in the femoral condyle with DJD signs VOsteophyte on the caudal aspect of the condyle on the lateromedial view IVChanges in opacity or bony proliferation cranial to the tibial intercondylar eminence II
D. Verwilghen et al. / Research in Veterinary Science 87 (2009) 319–328 323
radiological scores. The distribution of the radiographic grades andclasses, the lameness grades and mean blood parameters and theirstandard error of means (SEM) are given in Tables 3–5. Twentythree (36.51%) of the horses showed signs of OC and 20 (31.75%)showed signs of DJD.
In 28 (44.44%) horses radiological signs of joint effusion of theDIPJ were found, of these 15 belonged to the A class, 9 to the Band 4 to the C class.
Mean values for IGF-I, MPO, Coll2-1 and Coll2-1 NO2 for the OC,DJD and DIPJ effusion groups are listed in Tables 6–8, respectively.
3.2. Effects of blood markers on radiological class, scores and onlameness grades
3.2.1. Overall population3.2.1.1. Age and weight. Only IGF-I values were found significantlydifferent within weight groups (p = 0.05). Horses weighting morethan 600 kg had lower LSM ± SEM (least square mean ± standarderror of means) IGF-I concentrations (410.62 ± 26.13 ng/ml) thanhorses below the 600 kg. With the group between 550 and600 kg with concentrations of; 494.55 ± 28.15 ng/ml (p = 0.02)
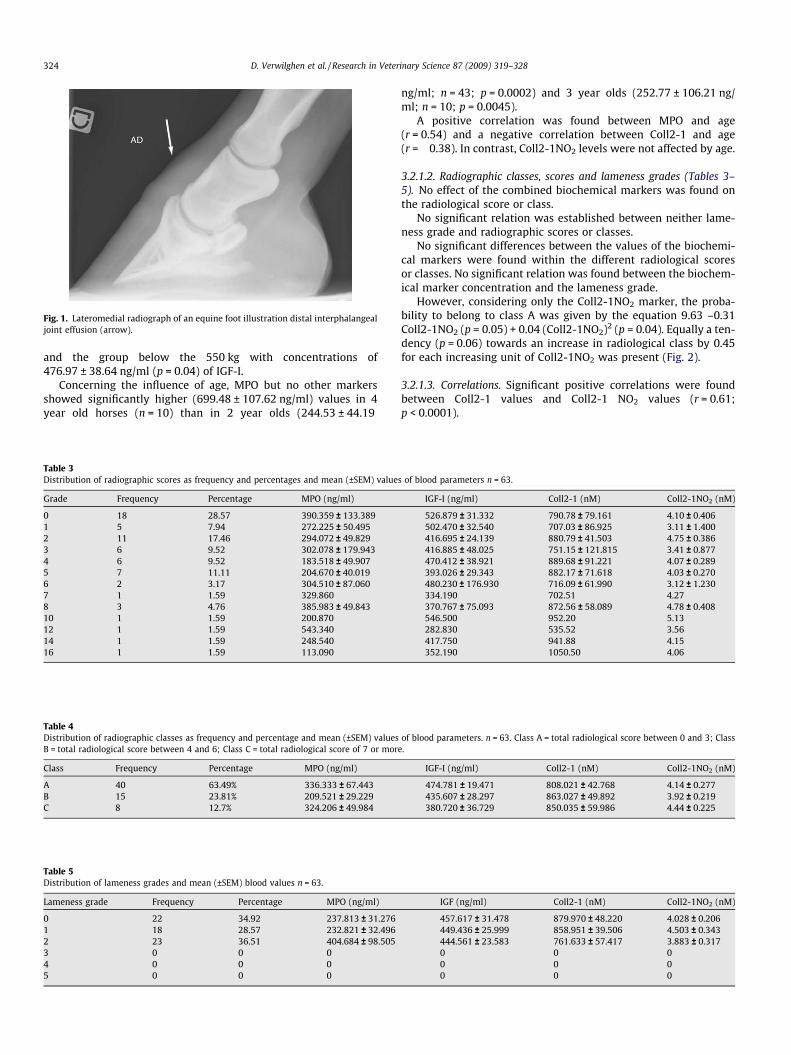
Fig. 1. Lateromedial radiograph of an equine foot illustration distal interphalangealjoint effusion (arrow).
324 D. Verwilghen et al. / Research in Veterinary Science 87 (2009) 319–328
and the group below the 550 kg with concentrations of476.97 ± 38.64 ng/ml (p = 0.04) of IGF-I.
Concerning the influence of age, MPO but no other markersshowed significantly higher (699.48 ± 107.62 ng/ml) values in 4year old horses (n = 10) than in 2 year olds (244.53 ± 44.19
Table 3Distribution of radiographic scores as frequency and percentages and mean (±SEM) value
Grade Frequency Percentage MPO (ng/ml)
0 18 28.57 390.359 ± 133.3891 5 7.94 272.225 ± 50.4952 11 17.46 294.072 ± 49.8293 6 9.52 302.078 ± 179.9434 6 9.52 183.518 ± 49.9075 7 11.11 204.670 ± 40.0196 2 3.17 304.510 ± 87.0607 1 1.59 329.8608 3 4.76 385.983 ± 49.84310 1 1.59 200.87012 1 1.59 543.34014 1 1.59 248.54016 1 1.59 113.090
Table 4Distribution of radiographic classes as frequency and percentage and mean (±SEM) valuesB = total radiological score between 4 and 6; Class C = total radiological score of 7 or mor
Class Frequency Percentage MPO (ng/ml)
A 40 63.49% 336.333 ± 67.443B 15 23.81% 209.521 ± 29.229C 8 12.7% 324.206 ± 49.984
Table 5Distribution of lameness grades and mean (±SEM) blood values n = 63.
Lameness grade Frequency Percentage MPO (ng/ml)
0 22 34.92 237.813 ± 31.2761 18 28.57 232.821 ± 32.4962 23 36.51 404.684 ± 98.5053 0 0 04 0 0 05 0 0 0
ng/ml; n = 43; p = 0.0002) and 3 year olds (252.77 ± 106.21 ng/ml; n = 10; p = 0.0045).
A positive correlation was found between MPO and age(r = 0.54) and a negative correlation between Coll2-1 and age(r = �0.38). In contrast, Coll2-1NO2 levels were not affected by age.
3.2.1.2. Radiographic classes, scores and lameness grades (Tables 3–5). No effect of the combined biochemical markers was found onthe radiological score or class.
No significant relation was established between neither lame-ness grade and radiographic scores or classes.
No significant differences between the values of the biochemi-cal markers were found within the different radiological scoresor classes. No significant relation was found between the biochem-ical marker concentration and the lameness grade.
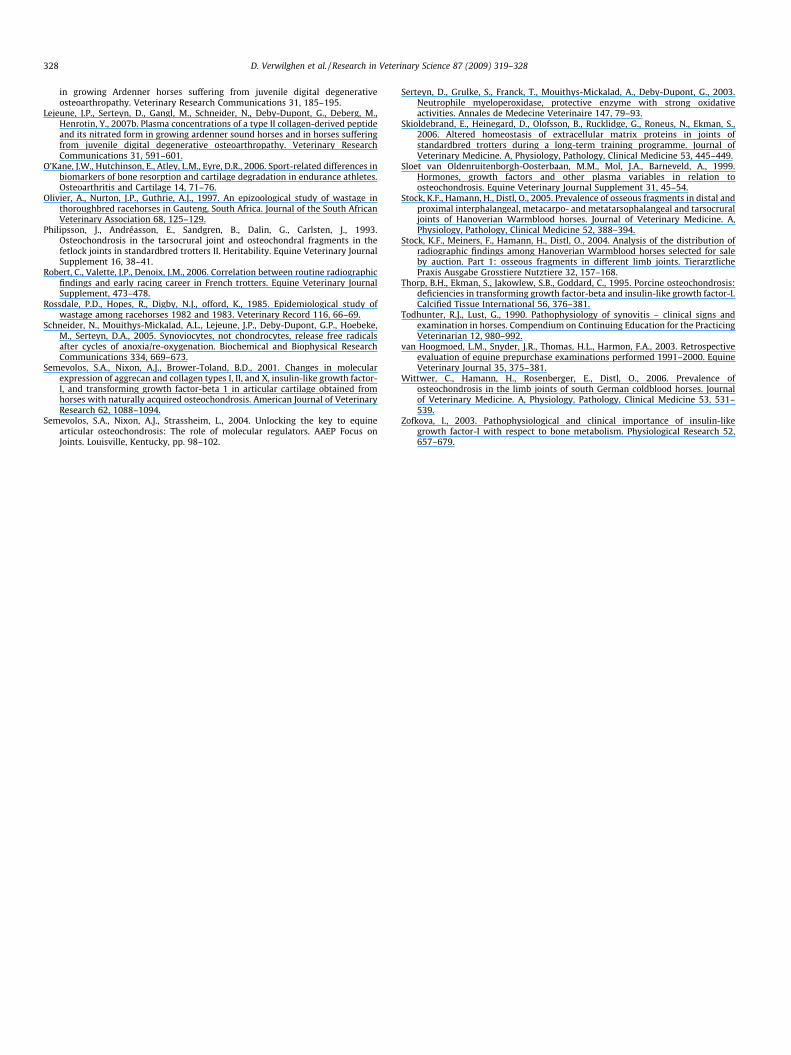
However, considering only the Coll2-1NO2 marker, the proba-bility to belong to class A was given by the equation 9.63 –0.31Coll2-1NO2 (p = 0.05) + 0.04 (Coll2-1NO2)2 (p = 0.04). Equally a ten-dency (p = 0.06) towards an increase in radiological class by 0.45for each increasing unit of Coll2-1NO2 was present (Fig. 2).
3.2.1.3. Correlations. Significant positive correlations were foundbetween Coll2-1 values and Coll2-1 NO2 values (r = 0.61;p < 0.0001).
s of blood parameters n = 63.
IGF-I (ng/ml) Coll2-1 (nM) Coll2-1NO2 (nM)
526.879 ± 31.332 790.78 ± 79.161 4.10 ± 0.406502.470 ± 32.540 707.03 ± 86.925 3.11 ± 1.400416.695 ± 24.139 880.79 ± 41.503 4.75 ± 0.386416.885 ± 48.025 751.15 ± 121.815 3.41 ± 0.877470.412 ± 38.921 889.68 ± 91.221 4.07 ± 0.289393.026 ± 29.343 882.17 ± 71.618 4.03 ± 0.270480.230 ± 176.930 716.09 ± 61.990 3.12 ± 1.230334.190 702.51 4.27370.767 ± 75.093 872.56 ± 58.089 4.78 ± 0.408546.500 952.20 5.13282.830 535.52 3.56417.750 941.88 4.15352.190 1050.50 4.06
of blood parameters. n = 63. Class A = total radiological score between 0 and 3; Classe.
IGF-I (ng/ml) Coll2-1 (nM) Coll2-1NO2 (nM)
474.781 ± 19.471 808.021 ± 42.768 4.14 ± 0.277435.607 ± 28.297 863.027 ± 49.892 3.92 ± 0.219380.720 ± 36.729 850.035 ± 59.986 4.44 ± 0.225
IGF (ng/ml) Coll2-1 (nM) Coll2-1NO2 (nM)
457.617 ± 31.478 879.970 ± 48.220 4.028 ± 0.206449.436 ± 25.999 858.951 ± 39.506 4.503 ± 0.343444.561 ± 23.583 761.633 ± 57.417 3.883 ± 0.3170 0 00 0 00 0 0
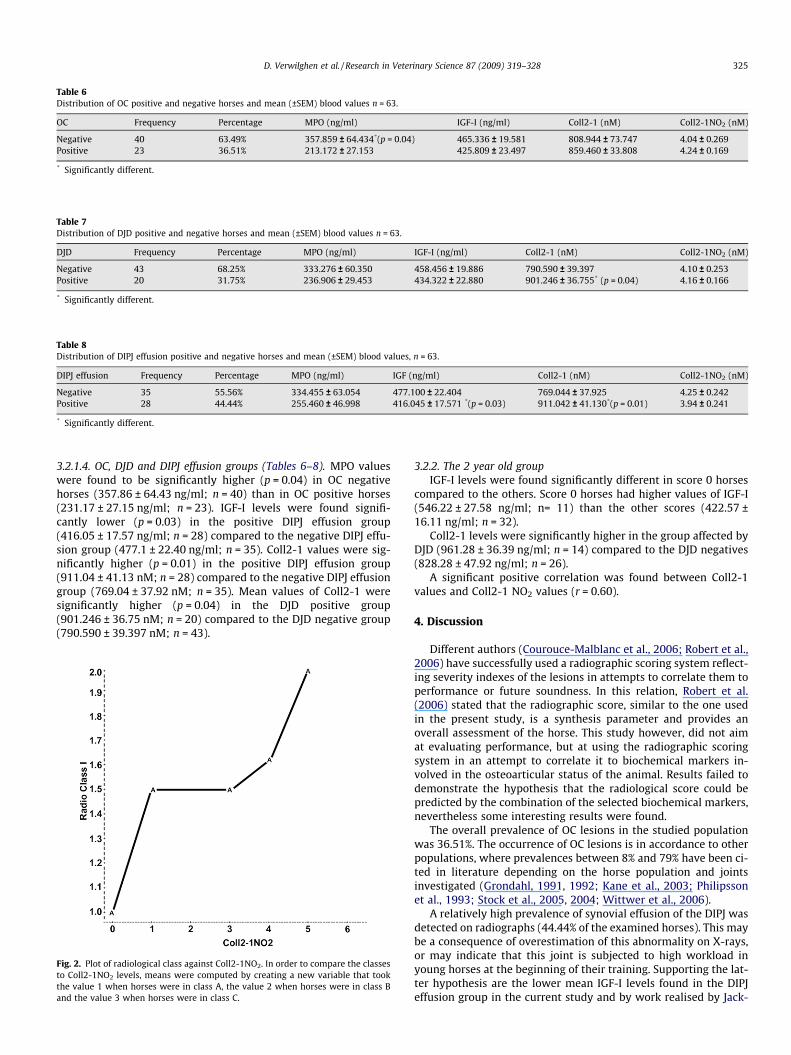
Table 6Distribution of OC positive and negative horses and mean (±SEM) blood values n = 63.
OC Frequency Percentage MPO (ng/ml) IGF-I (ng/ml) Coll2-1 (nM) Coll2-1NO2 (nM)
Negative 40 63.49% 357.859 ± 64.434*(p = 0.04) 465.336 ± 19.581 808.944 ± 73.747 4.04 ± 0.269Positive 23 36.51% 213.172 ± 27.153 425.809 ± 23.497 859.460 ± 33.808 4.24 ± 0.169
* Significantly different.
Table 7Distribution of DJD positive and negative horses and mean (±SEM) blood values n = 63.
DJD Frequency Percentage MPO (ng/ml) IGF-I (ng/ml) Coll2-1 (nM) Coll2-1NO2 (nM)
Negative 43 68.25% 333.276 ± 60.350 458.456 ± 19.886 790.590 ± 39.397 4.10 ± 0.253Positive 20 31.75% 236.906 ± 29.453 434.322 ± 22.880 901.246 ± 36.755* (p = 0.04) 4.16 ± 0.166
* Significantly different.
Table 8Distribution of DIPJ effusion positive and negative horses and mean (±SEM) blood values, n = 63.
DIPJ effusion Frequency Percentage MPO (ng/ml) IGF (ng/ml) Coll2-1 (nM) Coll2-1NO2 (nM)
Negative 35 55.56% 334.455 ± 63.054 477.100 ± 22.404 769.044 ± 37.925 4.25 ± 0.242Positive 28 44.44% 255.460 ± 46.998 416.045 ± 17.571 *(p = 0.03) 911.042 ± 41.130*(p = 0.01) 3.94 ± 0.241
* Significantly different.
D. Verwilghen et al. / Research in Veterinary Science 87 (2009) 319–328 325
3.2.1.4. OC, DJD and DIPJ effusion groups (Tables 6–8). MPO valueswere found to be significantly higher (p = 0.04) in OC negativehorses (357.86 ± 64.43 ng/ml; n = 40) than in OC positive horses(231.17 ± 27.15 ng/ml; n = 23). IGF-I levels were found signifi-cantly lower (p = 0.03) in the positive DIPJ effusion group(416.05 ± 17.57 ng/ml; n = 28) compared to the negative DIPJ effu-sion group (477.1 ± 22.40 ng/ml; n = 35). Coll2-1 values were sig-nificantly higher (p = 0.01) in the positive DIPJ effusion group(911.04 ± 41.13 nM; n = 28) compared to the negative DIPJ effusiongroup (769.04 ± 37.92 nM; n = 35). Mean values of Coll2-1 weresignificantly higher (p = 0.04) in the DJD positive group(901.246 ± 36.75 nM; n = 20) compared to the DJD negative group(790.590 ± 39.397 nM; n = 43).
Fig. 2. Plot of radiological class against Coll2-1NO2. In order to compare the classesto Coll2-1NO2 levels, means were computed by creating a new variable that tookthe value 1 when horses were in class A, the value 2 when horses were in class Band the value 3 when horses were in class C.
3.2.2. The 2 year old groupIGF-I levels were found significantly different in score 0 horses
compared to the others. Score 0 horses had higher values of IGF-I(546.22 ± 27.58 ng/ml; n= 11) than the other scores (422.57 ±16.11 ng/ml; n = 32).
Coll2-1 levels were significantly higher in the group affected byDJD (961.28 ± 36.39 ng/ml; n = 14) compared to the DJD negatives(828.28 ± 47.92 ng/ml; n = 26).
A significant positive correlation was found between Coll2-1values and Coll2-1 NO2 values (r = 0.60).
4. Discussion
Different authors (Courouce-Malblanc et al., 2006; Robert et al.,2006) have successfully used a radiographic scoring system reflect-ing severity indexes of the lesions in attempts to correlate them toperformance or future soundness. In this relation, Robert et al.(2006) stated that the radiographic score, similar to the one usedin the present study, is a synthesis parameter and provides anoverall assessment of the horse. This study however, did not aimat evaluating performance, but at using the radiographic scoringsystem in an attempt to correlate it to biochemical markers in-volved in the osteoarticular status of the animal. Results failed todemonstrate the hypothesis that the radiological score could bepredicted by the combination of the selected biochemical markers,nevertheless some interesting results were found.
The overall prevalence of OC lesions in the studied populationwas 36.51%. The occurrence of OC lesions is in accordance to otherpopulations, where prevalences between 8% and 79% have been ci-ted in literature depending on the horse population and jointsinvestigated (Grondahl, 1991, 1992; Kane et al., 2003; Philipssonet al., 1993; Stock et al., 2005, 2004; Wittwer et al., 2006).
A relatively high prevalence of synovial effusion of the DIPJ wasdetected on radiographs (44.44% of the examined horses). This maybe a consequence of overestimation of this abnormality on X-rays,or may indicate that this joint is subjected to high workload inyoung horses at the beginning of their training. Supporting the lat-ter hypothesis are the lower mean IGF-I levels found in the DIPJeffusion group in the current study and by work realised by Jack-
326 D. Verwilghen et al. / Research in Veterinary Science 87 (2009) 319–328
son et al. (2003b). In their treadmill exercise study on 2 year oldthoroughbred horses, similar lower serum IGF-I levels wereencountered in the group of horses that had been exercised for20 weeks compared to controls. And by using bone turnover mark-ers, bone turnover was shown to be lower in heavily exercisedhorses (Jackson et al., 2003b). Horses from the DIPJ effusion groupin the present study also showed higher values of Coll2-1, suggest-ing collagen type II degradation in this group. Human researchersin sports medicine (O’Kane et al., 2006) found increased levels ofcartilage degradation biomarkers (C telopeptide of collagen II:CTx-II) in heavily exercised human athletes compared to non-ath-letic controls. A study measuring Coll2-1 levels in exercised versusnon-exercised horses should be used to confirm this hypothesis inhorses. The findings above are moreover further strengthened bythe observation that more than half of the animals in this DIPJ effu-sion group were part of the class A radiographic group, i.e. horseswith an excellent/good radiographic status therefore not sufferingfrom pathologies commonly causing joint effusion.
When comparing IGF-I levels from the 2 year olds with a radio-logical score above 0 to 2 year olds with scores of 0, horses withhigher radiological scores showed significantly lower IGF-I levels.These results coincide with low IGF-I serum levels found in youngArdenner horses suffering from juvenile digital degenerative oste-oarthropathy (Lejeune et al., 2007a) and foals and young pigs suf-fering from OC (Sloet van Oldenruitenborgh-Oosterbaan et al.,1999; Thorp et al., 1995) and 2 year old thoroughbred group ofJackson et al. (2003b). These results indicate the relation betweenIGF-I and the osteoarticular status of the animal in this age period.Horses with no radiological signs seem to have higher IGF-I valuesthan horses with radiological findings (radiological score differentfrom 0). The fact that this relation could not be found in other agegroups can be explained by the many variables affecting IGF-I lev-els, amongst which are age, sex, nutritional status, and season(Lejeune et al., 2007a; Zofkova, 2003). Differences in serum IGF-Ilevels could not be found when only taking OC affected horses ofthe group of 2 year olds or the whole population into account.From reports suggesting elevation of IGF-I levels as a response tocartilage damage and thus as a part of the healing process (Fortieret al., 2001; Semevolos et al., 2001), it could be postulated that to-gether with many other factors regulating IGF-I levels, possible dif-ferences between the radiological scores are flattened out over theyears. In consequence, the establishment of a longitudinal studyinvolving repeated blood sampling and measurements of markerscould be helpful in a better interpretation of the providedinformation.
A tendency for decreasing Coll2-1 levels, a marker of type II-col-lagen degradation, with increasing age was found in the currentstudy. This interesting observation supports the discussion ofGangl et al. (2007), where Coll2-1 levels were measured in OC af-fected horses. Lower values of Coll2-1 were found in OC affectedhorses in Gangl’s study, which was in conflict with other reports(Billinghurst et al., 2004; Laverty et al., 2002) where increased val-ues for collagen type-II degradation markers were found in OC af-fected horses. This discrepancy was explained by the difference inage of the used groups with the study conducted by Gangl et al.(2007) using mature animals compared to immature ones in theother two studies (Billinghurst et al., 2004; Laverty et al., 2002).The negative correlation found between Coll2-1 levels and age inthe current study supports the latter hypothesis.
No significant correlation was found between Coll2-1 and theradiological score. Horses from the current study ranged from 2to 6 year old (mean age 2.56 year) and primary joint disease withremodelling of the articular surface and loss of cartilage mostly oc-curs in older horses or is in relation with OC lesions found in younganimals. OC, a disease specific for developing animals, has shownto develop at very young age (Dik et al., 1999) also beneath the
age range of this studied population. Cartilage breakdown and col-lagen degradation in relation with OC pathologies might already becompleted in the age group studied here. Billinghurst et al. (2004)supported this theory by finding loss of correlation between type-IIcollagen markers of degradation and OC lesions at 11 months incontrast to lesions at 5 months.
The elevated values of Coll2-1 found in the horse group suffer-ing from DJD are totally in accordance with the processes involvedin DJD pathology, where an increased denaturation of type II colla-gen takes place (Billinghurst et al., 1997) and is corroborated bythe increased levels of Coll2-1 found in human patients with OA(Deberg et al., 2005). However, these findings are opposed to theones found in previous equine research where juvenile DJD wasstudied in draught horses and no effect of Coll2-1 was found (Leje-une et al., 2007b), although using the same age population.
No direct correlation or significant differences in values wasfound between Coll2-1NO2 and the radiological class. However atendency towards an increase in radiological class with increaseof Coll2-1NO2 was present. Interestingly the observed tendencyformed a curve on a dot plot (Fig. 2) indicating an increased prob-ability to be associated with a less favourable radiological classwhen presented with higher Coll2-1NO2 values. The tendency forColl2-1NO2 to be more elevated in a less favourable radiologicalclass coincides with all the findings previously described on thismarker. In human medicine, this marker was shown to be in-creased in patients with OA and rheumatoid arthritis and to be agood marker for OA progression over a 1 year evaluation (Deberget al.,2008, 2005). In the equine population, the marker was shownto be significantly higher in populations suffering from OC (Ganglet al., 2007) and juvenile DJD (Lejeune et al., 2007b) indicating itis a useful marker for both diseases diagnosed by radiology. Posi-tive correlation between Coll2-1 and Coll2-1NO2 was found in thisstudy which coincides with observations made in primary osteoar-thritis in humans (Henrotin et al., 2004), but not with those madein OC affected horses using the same markers (Gangl et al., 2007).
Mean MPO levels in all groups in the present study were withinrange of normal MPO values in horses as described by Franck et al.(2005). Regarding MPO, two observations could be made. Firstly, awide variability in the MPO levels was observed between individ-uals (mean 299.98 ± 304.32 ng/ml). Secondly, however still withinnormal value ranges, OC negative horses showed slightly highervalues than OC positive. No explanation could be found to supportthis finding, but considering the first observation or the wide var-iability between individuals in MPO levels, this could well not berelated to the OC pathology. MPO is considered a marker for neu-trophil activation in several conditions involving inflammation inthe horse (Art et al., 2006b; Franck et al., 2005; Grulke et al.,1999) and variations in MPO levels in horses suffering from airwaydisease has been demonstrated before (Art et al., 2006b). The highgrade signs of pharyngitis found in several horses at endoscopyduring the admission protocol could explain these findings. It canalso be pointed out that exercise levels may play a role in theMPO levels as shown by Art et al. (2006a) in endurance and threeday eventing horses.
Measuring MPO levels in plasma might not reflect the true val-ues as neutrophil degranulation takes place in the tissues. Synovialsampling is probably much more reliable in reflecting the effectiveconcentrations of MPO related to osteoarticular status. However,synovial taps are technically more demanding, not without riskand therefore not widely applicable in this kind of studies.
Radiographic examination of the horses was not exhaustive.Cervical vertebrae and shoulder, sites which can also be affectedby OC albeit less frequently, were not included in the protocol, nei-ther was the carpus. Besides, only a limited amount of views weretaken per joint. Unfortunately this could have led to misinterpreta-tion of the overall osteoarticular status of the studied stallions by
D. Verwilghen et al. / Research in Veterinary Science 87 (2009) 319–328 327
means of radiological scoring. Furthermore, the separation inradiological classes, A, B and C has been made on a more or lessarbitrary basis. It was considered that horses with or beneath acumulative score of 3 (see tables in material & methods) wouldonly suffer from mild radiographic change that may also be foundin sound horses. Class B and C reflect animals with moderate to se-vere radiographic findings or with cumulative mild findings cur-rently being responsible for lameness and/or impairing theirfuture sport career.
In conclusion, only Coll2-1NO2, a marker reflecting degradationof cartilage collagen and inflammation was shown a potentiallyuseful predictor of the osteoarticular status of the horse. Largerpopulation of horses, spread over a bigger age range should be usedto confirm this hypothesis. To address some of the other remainingquestions of this study, a longitudinal set up, involving repeatedsampling and radiological scoring of a group of animals over timeshould be considered. Moreover, as chondrocytes in articular carti-lage subjected to exercise as well as to osteoarthritic inflammation,not only regulate degradation but also synthesis of extracellularmatrix components (Skioldebrand et al., 2006), biomarkers reflect-ing type II collagen and aggrecan synthesis would be interesting tobe studied further in this population. Maybe choosing these addi-tional biomarkers, reflecting both, degradation and synthesis,could have confirmed our initial hypothesis of predicting the radio-logical osteoarticular status of the animal with the biomarkers.
Acknowledgements
The authors would like to acknowledge Mireille Weber for thevaluable technical help during this study and Gaby van Galen forcarefully reading this manuscript.
References
Art, T., Franck, T., Gangl, M., Votion, D., Kohnen, S., Deby-Dupont, G., Serteyn, D.,2006a. Plasma concentrations of myeloperoxidase in endurance and 3-dayevent horses after a competition. Equine Veterinary Journal Supplement, 298–302.
Art, T., Franck, T., Lekeux, P., de Moffarts, B., Couetil, L., Becker, M., Kohnen, S., Deby-Dupont, G., Serteyn, D., 2006b. Myeloperoxidase concentration inbronchoalveolar lavage fluid from healthy horses and those with recurrentairway obstruction. Canadian Journal of Veterinary Research 70, 291–296.
Baldus, S., Eiserich, J.P., Brennan, M.L., Jackson, R.M., Alexander, C.B., Freeman, B.A.,2002. Spatial mapping of pulmonary and vascular nitrotyrosine reveals thepivotal role of myeloperoxidase as a catalyst for tyrosine nitration ininflammatory diseases. Free Radical Biology and Medicine 33, 1010–1019.
Beckman, J.S., Koppenol, W.H., 1996. Nitric oxide, superoxide, and peroxynitrite: thegood, the bad, and the ugly. American Journal of Physiology–Cell Physiology 40,C1424–C1437.
Billinghurst, R.C., Brama, P.A., van Weeren, P.R., Knowlton, M.S., McIlwraith, C.W.,2004. Evaluation of serum concentrations of biomarkers of skeletal metabolismand results of radiography as indicators of severity of osteochondrosis in foals.American Journal of Veterinary Research 65, 143–150.
Billinghurst, R.C., Dahlberg, L., Ionescu, M., Reiner, A., Bourne, R., Rorabeck, C.,Mitchell, P., Hambor, J., Diekmann, O., Tschesche, H., Chen, J., Van Wart, H.,Poole, A.R., 1997. Enhanced cleavage of type II collagen by collagenases inosteoarthritic articular cartilage. Journal of Clinical Investigation 99, 1534–1545.
Brennan, M.L., Wu, W.J., Fu, X.M., Shen, Z.Z., Song, W., Frost, H., Vadseth, C., Narine,L., Lenkiewicz, E., Borchers, M.T., Lusis, A.J., Lee, J.J., Lee, N.A., Abu-Soud, H.M.,Ischiropoulos, H., Hazen, S.L., 2002. A tale of two controversies – defining boththe role of peroxidases in nitrotyrosine formation in vivo using eosinophilperoxidase and myeloperoxidase-deficient mice, and the nature of peroxidase-generated reactive nitrogen species. Journal of Biological Chemistry 277,17415–17427.
Burner, U., Furtmuller, P.G., Kettle, A.J., Koppenol, W.H., Obinger, C., 2000.Mechanism of reaction of myeloperoxidase with nitrite. Journal of BiologicalChemistry 275, 20597–20601.
Courouce-Malblanc, A., Leleu, C., Bouchilloux, M., Geffroy, O., 2006. Abnormalradiographic findings in 865 French standardbred trotters and their relationshipto racing performance. Equine Veterinary Journal Supplement, 417–422.
Davicco, M.J., Faulconnier, Y., Coxam, V., Dubroeucq, H., Martin-Rosset, W., Barlet,J.P., 1994. Systemic bone growth factors in light breed mares and their foals.Archives Internationales de Physiologie, de Biochimie et de Biophysique 102,115–119.
Deberg, M., Dubuc, J.E., Labasse, A., Sanchez, C., Quettier, E., Bosseloir, A., Crielaard,J.M., Henrotin, Y., 2008. One year follow-up of Coll2-1, Coll2-1NO2 andmyeloperoxydase serum levels in oa patients after hip or knee replacement.Annals of the Rheumatic Diseases 67, 168–174.
Deberg, M., Labasse, A., Christgau, S., Cloos, P., Henriksen, D.B., Chapelle, J.P., Zegels,B., Reginster, J.Y., Henrotin, Y., 2005. New serum biochemical markers (Coll 2-1and Coll 2-1 NO2) for studying oxidative-related type II collagen networkdegradation in patients with osteoarthritis and rheumatoid arthritis.Osteoarthritis and Cartilage 13, 258–265.
Dik, K.J., Enzerink, E., van Weeren, P.R., 1999. Radiographic development ofosteochondral abnormalities, in the hock and stifle of Dutch Warmbloodfoals, from age 1 to 11 months. Equine Veterinary Journal Supplement 31,9–15.
Donabedian, M., van Weeren, P.R., Perona, G., Fleurance, G., Robert, C., Leger, S.,Bergero, D., Lepage, O., Martin-Rosset, W., 2008. Early changes in biomarkers ofskeletal metabolism and their association to the occurrence of osteochondrosis(OC) in the horse. Equine Veterinary Journal 40, 253–259.
Fortier, L.A., Balkman, C.E., Sandell, L.J., Ratcliffe, A., Nixon, A.J., 2001. Insulin-likegrowth factor-I gene expression patterns during spontaneous repair of acutearticular cartilage injury. Journal of Orthopaedic Research 19, 720–728.
Franck, T., Grulke, S., Deby-Dupont, G., Deby, C., Duvivier, H., Peters, F., Serteyn, D.,2005. Development of an enzyme-linked immunosorbent assay for specificequine neutrophil myeloperoxidase measurement in blood. Journal ofVeterinary Diagnostic Investigation 17, 412–419.
Gangl, M., Franck, T., Lejeune, J., Vanderheyden, L., Grulke, S., Verwilghen, D.,Deberg, M., Henrotin, Y., Serteyn, D., 2008. Variations plasmatiques de quatremarqueurs du métabolisme cartilagineux et de l’inflammation chez les chevauxatteints d’ostéochondrose. 34ème journée de la recherche équine, Paris, pp. 87–93.
Gangl, M., Serteyn, D., Lejeun, J.P., Schneider, N., Grulke, S., Peters, F., Vila, T., Deby-Dupont, G., Deberg, M., Henrotin, Y., 2007. A type II-collagen derived peptideand its nitrated form as new markers of inflammation and cartilage degradationin equine osteochondral lesions. Research in Veterinary Science 82, 68–75.
Gaut, J.P., Byun, J., Tran, H.D., Lauber, W.M., Carroll, J.A., Hotchkiss, R.S., Belaaouaj, A.,Heinecke, J.W., 2002. Myeloperoxidase produces nitrating oxidants in vivo.Journal of Clinical Investigation 109, 1311–1319.
Grondahl, A.M., 1991. The incidence of osteochondrosis in the tibiotarsal joint ofnorwegian standard-bred trotters – a radiographic study. Journal of EquineVeterinary Science 11, 272–274.
Grondahl, A.M., 1992. The incidence of bony fragments and osteochondrosis in themetacarpophalangeal and metatarsophalangeal joints of standard-bred trotters– a radiographic study. Journal of Equine Veterinary Science 12, 81–85.
Grulke, S., Benbarek, H., Caudron, I., Deby-Dupont, G., Mathy-Hartert, M., Farnir, F.,Deby, C., Lamy, M., Serteyn, D., 1999. Plasma myeloperoxidase level andpolymorphonuclear leukocyte activation in horses suffering from largeintestinal obstruction requiring surgery: preliminary results. Canadian Journalof Veterinary Research 63, 142–147.
Henrotin, Y., Addison, S., Kraus, V., Deberg, M., 2007. Type II collagen markers inosteoarthritis: what do they indicate? Current Opinion in Rheumatology 19,444–450.
Henrotin, Y., Deberg, M., Dubuc, J.E., Quettier, E., Christgau, S., Reginster, J.Y., 2004.Type II collagen peptides for measuring cartilage degradation. Biorheology 41,543–547.
Henrotin, Y., Debydupont, G., Deby, C., Debruyn, M., Lamy, M., Franchimont, P.,1993. Production of active oxygen species by isolated human chondrocytes.British Journal of Rheumatology 32, 562–567.
Henrotin, Y.E., Zheng, S.X., Deby, G.P., Labasse, A.H., Crielaard, J.M.R., Reginster, J.Y.L.,1998. Nitric oxide downregulates interleukin 1 beta (IL-1 beta) stimulated IL-6,IL-8, and prostaglandin E-2 production by human chondrocytes. Journal ofRheumatology 25, 1595–1601.
Jackson, B.F., Blumsohn, A., Goodship, A.E., Wilson, A.M., Price, J.S., 2003a. Circadianvariation in biochemical markers of bone cell activity and insulin-like growthfactor-I in two-year-old horses. Journal of Animal Science 81, 2804–2810.
Jackson, B.F., Goodship, A.E., Eastell, R., Price, J.S., 2003b. Evaluation of serumconcentrations of biochemical markers of bone metabolism and insulin-likegrowth factor I associated with treadmill exercise in young horses. AmericanJournal of Veterinary Research 64, 1549–1556.
Jeffcott, L.B., 1991. Osteochondrosis in the horse – searching for the key topathogenesis. Equine Veterinary Journal 23, 331–338.
Jeffcott, L.B., 1996. Osteochondrosis – an international problem for the horseindustry. Journal of Equine Veterinary Science 16, 32–37.
Kane, A.J., Park, R.D., McIlwraith, C.W., Rantanen, N.W., Morehead, J.P., Bramlage,L.R., 2003. Radiographic changes in thoroughbred yearlings. Part 1: prevalenceat the time of the yearling sales. Equine Veterinary Journal 35, 354–365.
Kaur, H., Halliwell, B., 1994. Evidence for nitric oxide-mediated oxidative damage inchronic inflammation – nitrotyrosine in serum and synovial-fluid fromrheumatoid patients. FEBS Letters 350, 9–12.
Kuwabara, K., Jyoyama, H., Fleisch, J.H., Hori, Y., 2002. Inhibition of antigen-inducedarthritis in guinea pigs by a selective LTB4 receptor antagonist LY293111Na.Inflammation Research 51, 541–550.
Laverty, S., Okouneff, S., Ionescu, M., Reiner, A., Pidoux, I., Webber, C., Rossier, Y.,Billinghurst, R.C., Poole, A.R., 2002. Excessive degradation of type II collagen inarticular cartilage in equine osteochondrosis. Journal of Orthopaedic Research20, 1282–1289.
Lejeune, J.P., Franck, T., Gangl, M., Schneider, N., Michaux, C., Deby-Dupont, G.,Serteyn, D., 2007a. Plasma concentration of insulin-like growth factor I (IGF-I)
328 D. Verwilghen et al. / Research in Veterinary Science 87 (2009) 319–328
in growing Ardenner horses suffering from juvenile digital degenerativeosteoarthropathy. Veterinary Research Communications 31, 185–195.
Lejeune, J.P., Serteyn, D., Gangl, M., Schneider, N., Deby-Dupont, G., Deberg, M.,Henrotin, Y., 2007b. Plasma concentrations of a type II collagen-derived peptideand its nitrated form in growing ardenner sound horses and in horses sufferingfrom juvenile digital degenerative osteoarthropathy. Veterinary ResearchCommunications 31, 591–601.
O’Kane, J.W., Hutchinson, E., Atley, L.M., Eyre, D.R., 2006. Sport-related differences inbiomarkers of bone resorption and cartilage degradation in endurance athletes.Osteoarthritis and Cartilage 14, 71–76.
Olivier, A., Nurton, J.P., Guthrie, A.J., 1997. An epizoological study of wastage inthoroughbred racehorses in Gauteng, South Africa. Journal of the South AfricanVeterinary Association 68, 125–129.
Philipsson, J., Andréasson, E., Sandgren, B., Dalin, G., Carlsten, J., 1993.Osteochondrosis in the tarsocrural joint and osteochondral fragments in thefetlock joints in standardbred trotters II. Heritability. Equine Veterinary JournalSupplement 16, 38–41.
Robert, C., Valette, J.P., Denoix, J.M., 2006. Correlation between routine radiographicfindings and early racing career in French trotters. Equine Veterinary JournalSupplement, 473–478.
Rossdale, P.D., Hopes, R., Digby, N.J., offord, K., 1985. Epidemiological study ofwastage among racehorses 1982 and 1983. Veterinary Record 116, 66–69.
Schneider, N., Mouithys-Mickalad, A.L., Lejeune, J.P., Deby-Dupont, G.P., Hoebeke,M., Serteyn, D.A., 2005. Synoviocytes, not chondrocytes, release free radicalsafter cycles of anoxia/re-oxygenation. Biochemical and Biophysical ResearchCommunications 334, 669–673.
Semevolos, S.A., Nixon, A.J., Brower-Toland, B.D., 2001. Changes in molecularexpression of aggrecan and collagen types I, II, and X, insulin-like growth factor-I, and transforming growth factor-beta 1 in articular cartilage obtained fromhorses with naturally acquired osteochondrosis. American Journal of VeterinaryResearch 62, 1088–1094.
Semevolos, S.A., Nixon, A.J., Strassheim, L., 2004. Unlocking the key to equinearticular osteochondrosis: The role of molecular regulators. AAEP Focus onJoints. Louisville, Kentucky, pp. 98–102.
Serteyn, D., Grulke, S., Franck, T., Mouithys-Mickalad, A., Deby-Dupont, G., 2003.Neutrophile myeloperoxidase, protective enzyme with strong oxidativeactivities. Annales de Medecine Veterinaire 147, 79–93.
Skioldebrand, E., Heinegard, D., Olofsson, B., Rucklidge, G., Roneus, N., Ekman, S.,2006. Altered homeostasis of extracellular matrix proteins in joints ofstandardbred trotters during a long-term training programme. Journal ofVeterinary Medicine. A, Physiology, Pathology, Clinical Medicine 53, 445–449.
Sloet van Oldenruitenborgh-Oosterbaan, M.M., Mol, J.A., Barneveld, A., 1999.Hormones, growth factors and other plasma variables in relation toosteochondrosis. Equine Veterinary Journal Supplement 31, 45–54.
Stock, K.F., Hamann, H., Distl, O., 2005. Prevalence of osseous fragments in distal andproximal interphalangeal, metacarpo- and metatarsophalangeal and tarsocruraljoints of Hanoverian Warmblood horses. Journal of Veterinary Medicine. A,Physiology, Pathology, Clinical Medicine 52, 388–394.
Stock, K.F., Meiners, F., Hamann, H., Distl, O., 2004. Analysis of the distribution ofradiographic findings among Hanoverian Warmblood horses selected for saleby auction. Part 1: osseous fragments in different limb joints. TierarztlichePraxis Ausgabe Grosstiere Nutztiere 32, 157–168.
Thorp, B.H., Ekman, S., Jakowlew, S.B., Goddard, C., 1995. Porcine osteochondrosis:deficiencies in transforming growth factor-beta and insulin-like growth factor-I.Calcified Tissue International 56, 376–381.
Todhunter, R.J., Lust, G., 1990. Pathophysiology of synovitis – clinical signs andexamination in horses. Compendium on Continuing Education for the PracticingVeterinarian 12, 980–992.
van Hoogmoed, L.M., Snyder, J.R., Thomas, H.L., Harmon, F.A., 2003. Retrospectiveevaluation of equine prepurchase examinations performed 1991–2000. EquineVeterinary Journal 35, 375–381.
Wittwer, C., Hamann, H., Rosenberger, E., Distl, O., 2006. Prevalence ofosteochondrosis in the limb joints of south German coldblood horses. Journalof Veterinary Medicine. A, Physiology, Pathology, Clinical Medicine 53, 531–539.
Zofkova, I., 2003. Pathophysiological and clinical importance of insulin-likegrowth factor-I with respect to bone metabolism. Physiological Research 52,657–679.