Carstairs Scores for Scottish Postcode Sectors, Datazones ...
43
Carstairs Scores for Scottish Postcode Sectors, Datazones & Output Areas from the 2011 Census Denise Brown, Mirjam Allik, Ruth Dundas, Alastair H Leyland October 2014 www.glasgow.ac.uk/sphsu
-
Upload
khangminh22 -
Category
Documents
-
view
0 -
download
0
Transcript of Carstairs Scores for Scottish Postcode Sectors, Datazones ...

Carstairs Scores for Scottish Postcode Sectors, Datazones & Output Areas from the 2011 Census
Denise Brown, Mirjam Allik, Ruth Dundas, Alastair H Leyland
October 2014
www.glasgow.ac.uk/sphsu
MRC/CSO Social and Public Health Sciences Unit, University of Glasgow
Executive summary
Carstairs scores were originally created for Scottish postcode sectors in 1981 as a measureof material deprivation. The scores were created from four census variables: car ownership,male unemployment, overcrowding and low social class. Since then, scores have been updateddecennially. Although there have been changes in some of the census variable definitions overtime, the variables used in subsequent years have been kept as similar as possible to thoseused in 1981.
This report details the creation of the 2011 Carstairs scores. As in previous years, eachcensus variable is standardised to ensure that is has an equal influence on the final score andthe final score is just the sum of the standardised values of the four variables. Carstairs scoresfor postcode sectors range from -7.53 to 13.24 (with high positive values indicating a mate-rially deprived area and high negative values indicating an area with low levels of materialdeprivation). Population-weighted quintiles are used here instead of deprivation categories(DEPCATs) which were used more commonly in previous Carstairs reports. Population-weighted quintiles for 2011 Carstairs scores are ordered from quintile 1 (most deprived) toquintile 5 (least deprived). This is in line with the ordering of quintiles in the Scottish Indexof Multiple Deprivation. The data files associated with this report do, however, includeDEPCATS, population-weighted quintiles, population-weighted deciles, and most and leastdeprived 15% of the population.
The report highlights the high concentration of materially deprived areas within GreaterGlasgow & Clyde health board (NHS Greater Glasgow & Clyde was formed in 2006, followinga merger of Greater Glasgow with part of NHS Argyll and Clyde). Nearly 44% of thepopulation of Greater Glasgow & Clyde live in the most deprived quintile. At council arealevel, nearly 64% of the population in Glasgow City and 55% of the population in DundeeCity live in the most deprived quintile.
The relationship between Carstairs deprivation scores and all-cause mortality remainsstrong. As in previous decades, all-cause mortality rates decreased between 2001 and 2011for those aged 0-64. In the past, the tendency has been for rates to decline across all Carstairsquintiles but with the largest decreases seen in the least deprived quintiles. Between 2001and 2011, however, rates of decline have been similar across all deprivation quintiles (around20-22% for all people aged 0-64). Despite this, mortality rates for those aged under 65 werestill higher in the most deprived quintile in 2011 (320 per 100,000 population) than in theleast deprived quintile in 1981 (284 per 100,000 population).
There is some discussion around the choice of variables used to construct the Carstairsscore as the validity of some variables has been questioned in recent years. The prevalence ofovercrowding, for example, has decreased to just 3% of the population. The methodologicalissues around creating the deprivation score are also considered. A measure of uncertaintybased on varying the weights attached to each of the four census variables is provided alongwith a measure of uncertainty due to population size.
Page i - Carstairs Scores from the 2011 Census

MRC/CSO Social and Public Health Sciences Unit, University of Glasgow
For this first time, scores have been created for datazones and output areas in additionto postcode sectors. This allows deprivation, based on Carstairs scores, to be examined ata much smaller geography than in previous years. As areas become geographically smaller,inequalities in all-cause mortality rates between the most and least deprived populationsappear greater. This could be due to smaller areas being more homogenous in nature. Thecreation of scores at datazone level has also allowed for an initial comparison to the ScottishIndex of Multiple Deprivation (SIMD) to be carried out. There are some geographicaldifferences in the boundaries of SIMD datazones and the census datazone output (whichis provided on a best-fit basis from census output areas). Despite this, findings suggestthat there is reasonably good agreement (59%) in terms of the categorisation of SIMD andCarstairs scores into quintiles at datazone level for those areas where the SIMD datazonesand best-fit census datazones overlap by at least 95%.
Overall, despite questions about the validity of some of the variables used in the con-struction of the Carstairs deprivation score, the score remains a good predictor of all-causemortality in Scotland. The addition of scores at datazone and output area level is an im-portant development and allows users to choose which small area level they wish to analysetheir data.
Page ii - Carstairs Scores from the 2011 Census

MRC/CSO Social and Public Health Sciences Unit, University of Glasgow
MRC/CSO Social and Public Health Sciences Unit,University of Glasgow,200 Renfield Street,Glasgow,G2 3QB
Tel: 0141 353 7500
email: [email protected]
*The front page shows a map of output areas in the Glasgow area. Output areas in redlie in the most deprived population-weighted quintile. Output areas in pink lie in thesecond most deprived population-weighted quintile.
Page iii - Carstairs Scores from the 2011 Census

MRC/CSO Social and Public Health Sciences Unit, University of Glasgow
Contents
Introduction 1The Carstairs score . . . . . . . . . . . . . . . . . . . . . . . . . . . . . . . . 1
Creating the score from the 2011 Census 2Variables used in constructing the score . . . . . . . . . . . . . . . . . . . . . 2Population-weighted summary . . . . . . . . . . . . . . . . . . . . . . . . . . 2Standardisation and z-scores . . . . . . . . . . . . . . . . . . . . . . . . . . . 5The distribution of Carstairs deprivation scores . . . . . . . . . . . . . . . . 7Comparison of 2011 scores with previous years . . . . . . . . . . . . . . . . . 10
Relationship with all-cause mortality 14
Methodological issues 17Choice of variables . . . . . . . . . . . . . . . . . . . . . . . . . . . . . . . . 17Robustness and uncertainty . . . . . . . . . . . . . . . . . . . . . . . . . . . 19
What do deprivation scores identify? 24Carstairs deprivation scores at datazone and output area level . . . . . . . . 25Comparison to the Scottish Index of Multiple Deprivation (SIMD) . . . . . . 28
Conclusions 31
References 33
Appendix A 34
Appendix B 35
Appendix C 37
Page iv - Carstairs Scores from the 2011 Census

MRC/CSO Social and Public Health Sciences Unit, University of Glasgow
Introduction
The Carstairs score
Carstairs deprivation scores are used as a measure of material deprivation and aim to reflectaccess to “those goods and services, resources and amenities and of a physical environmentwhich are customary in society” (Carstairs and Morris, 1991). The scores tend to be con-structed at postcode sector level and provide a summary measure of area based deprivationrather than individual level deprivation. Postcode sectors (with an average population ofaround 5,000 people) were chosen as they were believed to be of sufficient size to providereasonably reliable rates in respect to most health events.
1981 Census
Castairs deprivation scores were originally created in 1981 although their creation was based,in part, on an earlier analysis of 1971 census data for Glasgow and Edinburgh. Four variables,each thought to represent or be a determinant of material disadvantage, were selected for in-clusion in the calculation of the 1981 scores. These were overcrowding, male unemployment,low social class and no car ownership.
1991 Census
Similar variables, to those used in 1981, were used in the construction of 1991 Carstairs scores(McLoone, 1994). There were changes, however, to the way overcrowding was defined in thecensus after 1981. Kitchens of at least two meters wide were now included within the censusroom count and so overcrowding decreased substantially between 1981 and 1991. Despitethis, there was a high correlation between Carstairs scores in 1981 and 1991 (correlationcoefficient r=0.958) with most areas having little change in their scores over the 10-yearperiod.
2001 Census
As near as possible, the census variables used in 1981 and 1991 were used to construct 2001Carstairs scores (McLoone, 2004). Variables that were not available in standard 2001 censusoutput were commissioned from National Records of Scotland (NRS), formerly the GeneralRegister Office for Scotland (GROS). The main change to variables between 1991 and 2001was the move from Social Class based on Occupation (formerly Registrar General’s Social
Page 1 - Carstairs Scores from the 2011 Census

MRC/CSO Social and Public Health Sciences Unit, University of Glasgow
Class) to the National Statistics Socio-economic Classification (NS-SeC), which was codedusing the Standard Occupational Classification (SOC). NS-SeC moved away from the conceptof the manual/non-manual divide that characterised the old Social Class scheme with the aimof reflecting employment relations and conditions. To overcome changes in classifications,the Office for National Statistics (ONS) recommended aggregating operational categories ofthe SOC2000 version of NS-SeC to produce approximated Social Class based on Occupation.These approximations achieved a high (87%) continuity rate.1 The concept of a householdreference person was also introduced in 2001, replacing the traditional concept of a head ofhousehold.
Creating the score from the 2011 Census
Variables used in constructing the score
As in previous years, Carstairs scores for 2011 have been calculated from a combination offour variables derived from the 2011 census. The four variables used here are as similar aspossible to those used in the 1981 census by Carstairs and Morris, and in following censuses,and are defined in Table 1. Variables which were not available in standard census outputwere commissioned from NRS. See Appendix A for the list of census variables used to create2011 Carstairs scores. The NS-SeC Operational Categories used to create the low social classvariable used in construction of the 2001 and 2011 Carstairs scores are shown in Table 2.
Population-weighted summary
Population-weighted mean percentages and standard deviations (SD) are calculated for eachcomponent variable. The weights, used to take into account differences in population size,are based on the total number of people in each postcode sector, that is, the total numberof people in a postcode sector is divided by the total population of Scotland. This ensuresconsistency with scores weighted previously. Alternative weights can be used (e.g. householdpopulation-weights or weights based on the number of people economically active), howevermaking these changes to the weights has only a small effect on the overall weighted meansand SDs obtained.
The number of postcode sectors, or part-postcode sectors 2, at each census in 1981, 1991,2001 and 2011 were 1,011, 1,001, 1,010 and 1,012 respectively. The percentage of peopleliving in households with no access to a car or van has consistently decreased over time,
1http://www.ons.gov.uk/ons/guide-method/classifications/current-standard-classifications/soc2010/soc2010-volume-3-ns-sec–rebased-on-soc2010–user-manual/index.html
2See Appendix B for more details about part-postcode sectors.
Page 2 - Carstairs Scores from the 2011 Census

MRC/CSO Social and Public Health Sciences Unit, University of Glasgow
Table 1: Census variables used to create Carstairs scores
Variable Description
No car ownership Persons living in private households with no car,as a proportion of all people in private households
Male unemployment Economically active males seeking or waiting tostart work, as a proportion of all economicallyactive males
Overcrowding Persons living in private households at a density ofmore than one person per room, as a proportion ofall people in private households
Low social class Persons living in private households with thehousehold reference person in social class IV or V,as a proportion of all people in private householdswith an economically active household referenceperson
from 41.2% in 1981 to 22.7% in 2011 (Table 3). The percentage of overcrowding has alsodecreased, to just 3.3% of the population in 2011. Both male unemployment and low socialclass have increased slightly since 2001. While male unemployment also saw an increasebetween 1981 and 1991, this is the first time that the percentage of those in low social classhouseholds has increased over the four-decade period, although it is still lower than it wasin 1981 and 1991. Variation has decreased since 2001 for each variable, with the exceptionof low social class which saw a slight increase between 2001 and 2011.
Note that the wording of the question relating to economic activity (used in creating themale unemployment variable) changed a little between the 2001 census and 2011 census inorder to improve clarity, and this may have caused slight differences in the responses given.There were also some changes to how NS-SeC (used in creating the low social class variable)was coded between 2001 and 2011.3
The relationship between the four variables is shown in Figure 1. Postcode sectors withless than 1,000 residents have been excluded from the plots to reduce the effect of outlyingvalues and so plots are based on 850 postcode sectors.4 The correlation coefficients for the850 postcode sectors range from 0.62 to 0.84 so for each pair of variables there is evidence of apositive association (the correlation coefficients for the relationship between the variables for
3In 2001 NS-SeC was coded using SOC2000, while in 2011 it was coded using SOC2010. Also, anyonewithout occupation details was put into the ‘not classified’ category (19% of the total population) in 2001.In 2011, however, rules were used to estimate a NS-SeC category. These changes mean that caution shouldbe taken when making comparisons between the two censuses.
4Figures 1 and 4 are based on the 850 postcode sectors with populations less than 1,000 excluded. Unlessotherwise specified, all other Figures and Tables are based on all 1,012 2011 postcode sectors.
Page 3 - Carstairs Scores from the 2011 Census

MRC/CSO Social and Public Health Sciences Unit, University of Glasgow
Table 2: NS-SeC operational categories used to construct a measure of low social class(Source: ONS)
National Statistics Socio-economic Approximate
Classification Operational Categories Social Class
L11.2 Lower technical process operative IV - Semi-skilled
L12.2 Semi-routine service IV - Semi-skilled
L12.4 Semi-routine operative IV - Semi-skilled
L12.5 Semi-routine agricultural IV - Semi-skilled
L12.7 Semi-routine childcare IV - Semi-skilled
L13.1 Routine sales and service IV - Semi-skilled
L13.2 Routine production IV - Semi-skilled
L13.4 Routine operative V - Unskilled
L13.5 Routine agricultural IV - Semi-skilled
all postcode sectors ranges from 0.54 to 0.80). The relationships are not necessarily linear,however, and there are several postcode sectors with particularly high levels of overcrowding.
Table 3: Population-weighted mean percentages and standard deviations (SD) for each com-ponent variable used to create the Carstairs scores
1981 1991 2001 2011
Mean SD Mean SD Mean SD Mean SD
No car ownership 41.2 18.5 33.8 17.8 25.6 14.9 22.7 13.9
Male unemployment 12.5 7.3 13.0 8.4 7.9 4.6 8.5 4.2
Overcrowding 25.3 11.4 7.4 4.4 4.6 2.6 3.3 1.9
Low social class 24.1 10.4 20.8 8.6 18.2 7.8 18.8 7.9
Carstairs score 0.0 3.6 0.0 3.5 0.0 3.6 0.0 3.5
Page 4 - Carstairs Scores from the 2011 Census

MRC/CSO Social and Public Health Sciences Unit, University of Glasgow
Standardisation and z-scores
The deprivation scores are an unweighted combination of the four census variables. Toensure that all components have an equal influence on the final score, each variable wasstandardised to have a population-weighted mean of zero and a variance of one (Carstairs andMorris, 1991). Standardising involves subtracting the population mean from each variableand dividing the result by the SD (z-score method).
The Carstairs score for each postcode sector is the sum of the standardised values of thecomponents. An example of how the score is derived for a single postcode sector, G12 8,is given in Table 4. Shown is the observed value of each variable, the overall population-weighted mean and SD, and the calculation of the standardised values. The score for G12 8is the sum of the standardised values: 1.89 + (−0.46) + 0.19 + (−1.12) = 0.50.
The percentage of the population in G12 8 with no access to a car or van is more thantwice that of the Scottish population-weighted mean. There is a slightly higher prevalence ofovercrowding, a lower prevalence of male unemployment and the percentage of people livingin households with the household reference person in social class IV or V is around half thatof the Scottish mean. Scores may be negative or positive, with a negative score indicating anarea with low levels of deprivation and a high positive score indicating very deprived areas.The average score in Scotland in 2011 was −0.60. A score of 0.50 would suggest that G12 8is slightly more deprived than the Scottish average. Scores were calculated for each of the1, 012 postcode sectors in Scotland in 2011 (see Appendix B).
Table 4: Observed percentages and z-scores for postcode sector G12 8
Observed percentage Mean SD Standardisation (z-score)
No car ownership 49.00 22.71 13.88 (49.00 − 22.71)/13.88 = 1.89
Male unemployment 6.55 8.50 4.24 (6.55 − 8.50)/4.24 = −0.46
Overcrowding 3.61 3.26 1.86 (3.61 − 3.26)/1.86 = 0.19
Low social class 9.94 18.77 7.90 (9.94 − 18.77)/7.90 = −1.12
Page 5 - Carstairs Scores from the 2011 Census

MRC/CSO Social and Public Health Sciences Unit, University of Glasgow
●
●
●
● ●●
●
●
●
●
● ●
●
●
●
●
●
●
●
●
●
● ●
●
●
●
●
●
●
●
●●
●
●
●
●
●
●
● ●
●
●
●●
●
●
●●
●●
●
●
●●
●
●
●●
●●●
●
●
●
●
●
●
●
●
●
●
●
●
●
●
●
●
●
●● ●●
●
●
●
●●
●
●
●
●
●
●
●
●
●●●●
●● ●
●
●
●●
●
●●
●
●
●
●
●
●●
●●
●
●
●●●
●
●
●●
●
●●
●
●
●
●
●
●
●● ●
●●●●
●
●●
●
●
●
●
● ●
●
●
●●●
●
●
● ●
●
●
●
●
●●
●●
●
●
●
●
●
●●
●
●●●
●
● ●●●
●
●●
●
●
●●●
●
●
●●
●
●●
●
●
●●
●●● ●● ●
●
●
●
●
●
●
●
●
●
●
●●
●
●
●
●
●
●●
●
●
●
●
●
●
●
●
●
●
●
●
●
●
●
●
●
●
●
●
●
●
●
●
●●
●
●
●
●
●
●
●
●
●
●
●●
●●
●
●
●●
●
●●●
●
●
●
●
●
●
●●
●
●
●
●
●
●
●
●
●
●●
●
●
●
●
●
●
●
●
●
●
●
●
●
●
● ●●
● ●
●
● ●
●
●● ● ●●
●
●
●
●
● ●
●
●
●
●
●
●
●
●●
●●
●
●●
●
●
●● ●
●
●
●
●
●
●
●
●
●
●
● ●
●●
●
●
●●
●
●●●●
●
●●
●
●
●
●
●
●
●
●●
●
●●
●
●
●●
●●
●●●
●
●●
●
●
●
●
●
●
●
●
●
●
●
●
●
●
●● ●
●
●
●
●
●
●
●
●
●
●
●
●
●
●
●●
●
●
●
●●
●
●
●
●
●
●
●
●
●
●
●●●
●
●
●
●
●
●
●
●
●
●
●
●
●
●
●
●
●
●●
●
●
●
●
●●
●
●
●
●
● ●
●
●
●
●
●
●
●●
●
●●
●
●
●
●
●
●
●●●
●
●
●
●
●
●
●
●
●
●
●
●●
●
●
●
●
●
●
●
●●
●
●
●
●●●
●
● ●
●
●
●
●● ●●
●
●
●
●
●●
●
●
●
●
●
●
●
●
●
●
●
●●
●
●
●
●●
●
●
●
●
●
●
●
●
●
●
●
●
●
●
●
●
●
●
●
●●
●
●
●
●
●
●
●
●
●
●
●
●
●
●
●
●
●●
●
●●
●
●
●
●
●
●●
●●
●
●●
●
●
●
●
●
●
●
●●
●
●
●
●
●
●
●●
●●
●
●
●
●
●
●
●
●●
●
●
●
●
●
●
●●
●
●
●●
●
●●
●●
●●●
●
●
●
●
●●
●
●
●
●
●
●●
●
●
●
●
●
● ●
●
●
●
●
●●
●●
●
●
●
●
●
●
●
●●
●●
●●
●
●
●●
●
●●
●
●
●
●
●
●●
●
●
●
●
●
●
●●
●
●
●
●
●
●
●
●
●
●
●●
●
●●
●
●
●●
●
●
●
●
●
●
●
●
●
●
●
●
●●
●
●●
●
●
●
●
●
●
●●
●
●
●
●
●
●●
●
●
●
●
●
●
●
●
● ●●
●
●●
●●
●
●
●●
●●
●
●
●
●
●
●
●
●
●
●
●
●
●
●●
●
●
●
●
●
●
●
●
●●
●
●
●
●●
●
●
●
●●●
●●
●●
●●
●
●
●●
●
●
●
0 20 40 60 80 100
05
1015
2025
30
No car (%)
Une
mpl
oym
ent (
%)
●
●●●
●
● ●
●●
●
● ●
●●
●
●
●
●
●
●
●●
●
●●
●
●●
●
●
●
●
●
●
●
●
●
●
●
●●●
●
●
●
●
●
●
●
●●●
●●
●
●
●
●
●
●
●
●
●
●
●●
●
●●
●
●
●
●
●
●
●
●
●
●●
●
●●
●
●●●
●
●●
●●
●
●
●
●
●
●
●
●●
●
●
● ●
●
●
●
●●
●
●
●
●●●●
●
●
● ●
●
●
●●
●
●
●●
●●●●
●
●
●
●●
●
●
●
●
●
●●
●
●
●
●
●●
●
●
●●
●
● ●
●●
●●●
●●
●●
● ●
●
●
●
●
●
●
●
●
●
●●
●
●
●
●
●
●
●
●● ●●
●
●
●
●
●
●
●
●● ●
●
●
●
●
●●
●●
●
●
●
●
●
●
●
●
●
●
●
●
●
●
●
●
●
●
●
●
●
●
●
●
●
●
● ●
●
●
●
●
●
●
●●
●
●
●
●
●
●
●
●
●●
●
●
●
●
●
●
● ●
●
●
●
●
●
●
●
●
●
●
●
●
●●
●
●
●
●
●
●
●●
●
●
●
●
●
●
●
●●
●●
●
●
●
●●
●
●●
●
●
●●
●
●
●
●
●
●●
●
●
●
●
●
●●
●
●
●
●
●●
●
●
●
●
●
●
●●
●
●●
●
●
●
●
●
●
●
●
●
●
●
●
●
●
●
●
●
●
●
●
●
●
●
●
●
●
●
●
●
●●
●
● ●●●
●
●
●
● ●
●
●
●
●●
●
●
●
●
●
●
●
●
●
●
●
●
●
●
●
●
●
●
●
●
●
●
●
●
●
●
●
●●●
●●
●
●
●
●
●
●
●●
●
●
●
●
●
●●
●
●
●
●
●
●
●●
●
●
●
●
●
●
●
●
●
●
●
●
●
●
●
●
●
●
●
●
●
●
●
●
●●
●
●
●
●
●
●
●
●
●
●
●
●
●
●
●
●
● ●
● ●
●●
●
●
●
●●
●
●
●
●
●
●
●
●
●
●
●
●
●
●
●
●
●
●
●
●
●
●
●
●●
●
●
●
●●
●
●
●
●
●●
●●
●
●
●
●●
●
●
●
●●
●
●
●●
●
●
●
●
●
●●●
●
●
●
●●
●
●
●
●
●
●
●
●●
●
●
●
●
●
●
●
●
●
●●
●
●
●
●
●
●
●●
●●
●
●
●
●
●●
●
●
●
●
●
●
●
●
●
●
●
●
●
●
●
●●
●
●
●
●
●●
●
●
●
●
●
●
●
●●
●
●
●
●●
●
●●
●
●
●
●
●
●
●
●
●●
●
●
●
●
●
●
●
● ●
●
●●
●
●
●●●
●
●
●
●
●
●
●
●
●●
●
●
●
●●
●
●
●
●
●
●
●
●
●
●
● ●
●
●●
●
●●
●
●●
●●
●
●
●
●●
●
●
●
●
●●
●
●
●
●
●
●
●
●
●
●
●
●
●
●
●
●
●
●
●
●●
●
●
●
●
●●
●●●
●
●●●
●
●●●●
●
●
●
●
●
●
●
●
●
●
●
●●
●
●
●
●
●●
●
●
●
●
●
●
●
●
●
●
●
●
●
●
●●
●
●
●
● ●
●
●
●●●
●
●
●
●
●
●
●
●
●
●
●
●
●
●
●
●
●●
●
●
●
●
●
●
●
●
●
●
●
●
●●●
●
●
●●
●
●
●
●●
●
●
●
●
●
●
●●
●
●
●●
●
●
0 20 40 60 80 100
010
2030
4050
No car (%)
Low
soc
ial c
lass
(%
)
●
●●●
●
● ●
●●
●
●●
●●
●
●
●
●
●
●
●●
●
●●
●
●●
●
●
●
●
●
●
●
●
●
●
●
● ●●
●
●
●
●
●
●
●
●●●
● ●
●
●
●
●
●
●
●
●
●
●
●●
●
●●
●
●
●
●
●
●
●
●
●
●●
●
●●
●
●●●
●
●●
●●
●
●
●
●
●
●
●
●●
●
●
● ●
●
●
●
●●
●
●
●
● ●●●
●
●
● ●
●
●
●●
●
●
●●
●●●●
●
●
●
●●
●
●
●
●
●
●●
●
●
●
●
●●
●
●
●●
●
●●
●●
●●
●
●●
●●
● ●
●
●
●
●
●
●
●
●
●
●●
●
●
●
●
●
●
●
●● ●
●
●
●
●
●
●
●
●
●● ●
●
●
●
●
●●●●
●
●
●
●
●
●
●
●
●
●
●
●
●
●
●
●
●
●
●
●
●
●
●
●
●
●
● ●
●
●
●
●
●
●
●●
●
●
●
●
●
●
●
●
●●
●
●
●
●
●
●
● ●
●
●
●
●
●
●
●
●
●
●
●
●
●●
●
●
●
●
●
●
●●
●
●
●
●
●
●
●
●●
●●
●
●
●
● ●
●
●●
●
●
●●
●
●
●
●
●
●●
●
●
●
●
●
●●
●
●
●
●
●●
●
●
●
●
●
●
●●
●
●●
●
●
●
●
●
●
●
●
●
●
●
●
●
●
●
●
●
●
●
●
●
●
●
●
●
●
●
●
●
●●
●
●●●●
●
●
●
● ●
●
●
●
●●
●
●
●
●
●
●
●
●
●
●
●
●
●
●
●
●
●
●
●
●
●
●
●
●
●
●
●
●●●
● ●
●
●
●
●
●
●
●●
●
●
●
●
●
●●
●
●
●
●
●
●
●●
●
●
●
●
●
●
●
●
●
●
●
●
●
●
●
●
●
●
●
●
●
●
●
●
●●
●
●
●
●
●
●
●
●
●
●
●
●
●
●
●
●
● ●
● ●
●●
●
●
●
●●
●
●
●
●
●
●
●
●
●
●
●
●
●
●
●
●
●
●
●
●
●
●
●
●●
●
●
●
●●
●
●
●
●
●●
●●
●
●
●
●●
●
●
●
●●
●
●
●●
●
●
●
●
●
●●●
●
●
●
●●
●
●
●
●
●
●
●
● ●
●
●
●
●
●
●
●
●
●
●●
●
●
●
●
●
●
●●
●●
●
●
●
●
●●
●
●
●
●
●
●
●
●
●
●
●
●
●
●
●
●●
●
●
●
●
●●
●
●
●
●
●
●
●
●●
●
●
●
●●
●
●●
●
●
●
●
●
●
●
●
●●
●
●
●
●
●
●
●
●●
●
●●
●
●
●●●
●
●
●
●
●
●
●
●
●●
●
●
●
●●
●
●
●
●
●
●
●
●
●
●
● ●
●
●●
●
●●
●
● ●
●●
●
●
●
●●
●
●
●
●
●●
●
●
●
●
●
●
●
●
●
●
●
●
●
●
●
●
●
●
●
●●
●
●
●
●
●●
● ●●
●
●● ●
●
●●●●
●
●
●
●
●
●
●
●
●
●
●
●●
●
●
●
●
●●
●
●
●
●
●
●
●
●
●
●
●
●
●
●
●●
●
●
●
●●
●
●
●●●
●
●
●
●
●
●
●
●
●
●
●
●
●
●
●
●
●●
●
●
●
●
●
●
●
●
●
●
●
●
●●●
●
●
●●
●
●
●
●●
●
●
●
●
●
●
●●
●
●
●●
●
●
0 5 10 15 20 25 30
010
2030
4050
Unemployment (%)
Low
soc
ial c
lass
(%
)
●
●●●
●
●
●
●
●
●
●●
●●
●
●●
●
● ●●
● ●
●●
●
●●
●●
●●
●
●
●
●●
●
● ●
●●
●
●●
●
●●
●
●●●
●●
●
●
●
● ●
●
●
●
●
●●
●
●
●
●
●
●
●●
●
●●
●
●
●
●
●
●●●
●
●
●
●
●
● ●
●●
●●
●●
● ●●●●●
●
●●
●
● ●
●
●●
●
●●
● ●●●●●
●
●
● ●
●
●
●
●
●●
●
●
●
●
●
●●
●
●●
●
●
●●
●
●●●●
●
●
●●
●
●
●
●●
●
●
●
●●
●
●
●●
●
●
●
●●
●●●
●
●
●
●●
●
●
●
●
●● ●
●
●
●●
●
●
● ●● ●●
●
●
●●●●
●●
●●
●
●
●●●●
●
●
● ●●
●
●● ●
●
●
●●●
●
●
●
●
●
●
●●●
●●● ●
●●
●●
●
●●
●
●
●
●
●
●
●
●
●
●●
●
●
●
●●
● ●
●
●
● ●
●●
●
●
●●
●●
●
●
●
●
●●
●
●
●
●
●
●
●●
●
●
● ●
●
● ●●
●
●●● ●
● ●
●
●
● ● ●
●
●
●●●
●
●● ● ●
●
●
●
● ●
●
●●
●
●
●●
●
●
●
●●●
●
●
●
●
●
●●
●
●●
●
●●
●
●●
●
●●
●
●
●
●
●
●
● ●●
●
●
● ●●
●
●
●●
●
●●
●
●
●●
●
●
●
● ●●
●
●●
●●
●
●
●●
●
●●
●
●
●
●
●
●
●
●
●
● ●● ●
●
●
●●
●
●●
●●
●
●
●●
●
●●
●
●
●
●●
●
●
●
●
●
●
●
●●
●
●● ●● ●
●
●
●
●
●●
●
●●
●●
●
●
●
●
●
●
●●●
●●
●
●
●
●
●
●●
● ● ●
●●
●
●
●●
●
●
●
●
●
●●
●
●●●
●
●
● ●
●●
●●
●
●
●
●●
●
●
●
●●
●
●
●●
● ●
●
●
●
●
●● ● ●
●●●
●
●
●
●●
●
●
●
●
●
●
●
●
●
●● ●●●
●
●
●
●
●
●
●
●
●
● ●
●
●
●●
● ●
●
●
●●●
●
●●
●
●
●
● ●
● ●●
●
●
●
●●
●●●
●
●
●
●
●
●
●
● ●
●
●
●
●●
●
●
●
●●
●●
●
●
●●
● ●●
●
● ●
●
● ●
●●
●●
●●
●
●
●●
●
●
●●●
●
●
●
●
●
●
●●
●
●●●
●
●●●
●●●
●
●
●
●●
●●●
●
●
●
●
●
●●
● ●
● ●●
●
●●
●
●
●
●●●
●
●
●● ●
●
●
●●
●●
●
●
●
●
●●
●●
●
●
●● ●●
●●
●
●●
●
●
●
●
●
●●
●●
●●
●
● ●
●●
● ●
●●● ●
●
●
●●
●
●
●
●
●
●
●
●
●
●● ●●
●●
●
●
●
●
●
● ●
●
●●
●● ●
●●●
●
●
●●
●
●● ●
●●
●
●●
● ●●
● ●●●
●●
●
●
●
●
●
●
●
●●
●
●
●●
●●
●
●
●
●
●
●
●
●
●
●
●
●
●
●●● ●●
●
●
●
●
●
●
●●
●●
●●
●
●
●
0 20 40 60 80 100
05
1015
20
No car (%)
Ove
rcor
wdi
ng (
%)
●
● ●●
●
●
●
●
●
●
●●
●●
●
●●
●
● ●●
●●
●●
●
●●
●●
●●
●
●
●
●●
●
●●
●●
●
●●
●
●●
●
●●●
●●
●
●
●
● ●
●
●
●
●
●●
●
●
●
●
●
●
●●
●
●●
●
●
●
●
●
●● ●
●
●
●
●
●
● ●
●●
●●
●●
●●●●● ●
●
●●
●
●●
●
●●
●
●●
●●● ●●●
●
●
● ●
●
●
●
●
●●
●
●
●
●
●
●●
●
●●
●
●
●●
●
● ●●●
●
●
●●
●
●
●
●●
●
●
●
●●
●
●
●●
●
●
●
●●
●●●
●
●
●
●●
●
●
●
●
●● ●
●
●
●●
●
●
● ●●● ●
●
●
●●●●
●●●
●●
●
●●● ●
●
●
●● ●
●
●● ●
●
●
●●●
●
●
●
●
●
●
●●●
● ●● ●
● ●
●●
●
●●
●
●
●
●
●
●
●
●
●
●●
●
●
●
●●
●●
●
●
● ●
●●
●
●
●●
●●
●
●
●
●
●●
●
●
●
●
●
●
●●
●
●
● ●
●
● ●●
●
● ●● ●
● ●
●
●
●● ●
●
●
● ●●
●
●●●●
●
●
●
● ●
●
●●
●
●
●●
●
●
●
●●
●
●
●
●
●
●
●●
●
●●
●
●●
●
●●
●
●●
●
●
●
●
●
●
● ●●●
●
●●●
●
●
●●
●
●●
●
●
●●
●
●
●
●●●
●
●●
●●
●
●
●●
●
●●
●
●
●
●
●
●
●
●
●
● ●●●
●
●
●●
●
●●
●●
●
●
●●
●
●●
●
●
●
●●
●
●
●
●
●
●
●
●●
●
●●●● ●
●
●
●
●
●●
●
●●
● ●
●
●
●
●
●
●
●●●
●●
●
●
●
●
●
●●
●● ●
●●
●
●
●●
●
●
●
●
●
● ●
●
●●●
●
●
●●
●●
●●
●
●
●
●●
●
●
●
●●
●
●
●●
● ●
●
●
●
●
●●● ●
● ●●●
●
●
●●
●
●
●
●
●
●
●
●
●
●● ●●●
●
●
●
●
●
●
●
●
●
●●
●
●
●●
●●
●
●
●● ●
●
●●
●
●
●
● ●
● ●●
●
●
●
●●
●●
●
●
●
●
●
●
●
●
●●
●
●
●
●●
●
●
●
●●
●●
●
●
●●
● ●●
●
● ●
●
● ●
●●
●●
●●
●
●
●●
●
●
●●
●
●
●
●
●
●
●
●●
●
●●●
●
●●●
●●●
●
●
●
●●
●●●
●
●
●
●
●
●●
●●
● ●●
●
●●
●
●
●
●●●●
●
● ● ●
●
●
●●
●●
●
●
●
●
● ●
●●
●
●
●● ● ●
●●
●
●●
●
●
●
●
●
●●
●●
●●
●
●●
● ●
● ●
●● ● ●
●
●
●●
●
●
●
●
●
●
●
●
●
●●● ●●●
●
●
●
●
●
●●
●
●●
●● ●
●●●
●
●
●●
●
●● ●
●●
●
●●
●● ●
● ●●
●
●●
●
●
●
●
●
●
●
●●
●
●
●●
● ●
●
●
●
●
●
●
●
●
●
●
●
●
●
●●
● ●●
●
●
●
●
●
●
●●
●●
●●
●
●
●
0 5 10 15 20 25 30
05
1015
20
Unemployment (%)
Ove
rcor
wdi
ng (
%)
●
● ●●
●
●
●
●
●
●
●●
●●
●
●●
●
●●●
● ●
●●
●
●●
●●
●●
●
●
●
●●
●
● ●
●●
●
●●
●
●●
●
●●●
●●
●
●
●
●●
●
●
●
●
●●
●
●
●
●
●
●
●●
●
●●
●
●
●
●
●
●● ●
●
●
●
●
●
● ●
●●
●●
●●
● ● ●●● ●
●
●●
●
● ●
●
●●
●
●●
● ●●● ●●
●
●
●●
●
●
●
●
●●
●
●
●
●
●
● ●
●
●●
●
●
●●
●
● ●●●
●
●
●●●
●
●
●●
●
●
●
●●
●
●
●●
●
●
●
●●
●●●
●
●
●
●●
●
●
●
●
●●●
●
●
●●
●
●
● ●●● ●●
●
●●
● ●
●●
●●
●
●
●● ● ●
●
●
●● ●
●
●● ●
●
●
●● ●
●
●
●
●
●
●
●● ●●●
● ●
● ●
●●
●
●●
●
●
●
●
●
●
●
●
●
● ●
●
●
●
●●
● ●
●
●
● ●
●●
●
●
●●
●●
●
●
●
●
●●
●
●
●
●
●
●
●●
●
●
● ●
●
●●●
●
●●●●
●●
●
●
● ●●
●
●
● ●●
●
●●● ●
●
●
●
●●
●
●●
●
●
●●
●
●
●
●●
●
●
●
●
●
●
● ●
●
●●
●
●●
●
●●
●
●●
●
●
●
●
●
●
● ●●●
●
●●●
●
●
●●
●
●●
●
●
●●
●
●
●
●●●
●
●●
● ●
●
●
●●
●
●●
●
●
●
●
●
●
●
●
●
●●● ●
●
●
●●
●
●●
●●
●
●
●●
●
●●
●
●
●
●●
●
●
●
●
●
●
●
●●
●
●● ●● ●
●
●
●
●
●●
●
●●
● ●
●
●
●
●
●
●
●●●
●●
●
●
●
●
●
●●
● ●●
●●
●
●
●●
●
●
●
●
●
● ●
●
● ●●
●
●
●●
●●
●●
●
●
●
●●
●
●
●
●●
●
●
●●
● ●
●
●
●
●
●●● ●
● ●●
●
●
●
●●
●
●
●
●
●
●
●
●
●
●● ●●●
●
●
●
●
●
●
●
●
●
●●
●
●
●●
●●
●
●
●● ●
●
●●
●
●
●
● ●
● ●●
●
●
●
●●
●●
●
●
●
●
●
●
●
●
●●
●
●
●
●●
●
●
●
●●
●●
●
●
●●
● ●●
●
● ●
●
● ●
●●
●●
●●
●
●
●●
●
●
●●
●
●
●
●
●
●
●
●●
●
●●●
●
●●●
●●●
●
●
●
●●
●●●
●
●
●
●
●
●●
●●
●●●
●
●●●
●
●
●● ●
●
●
●● ●
●
●
● ●
● ●
●
●
●
●
●●
●●
●
●
●●● ●
●●
●
●●
●
●
●
●
●
●●
●●
●●
●
●●
●●
● ●
●●● ●
●
●
●●
●
●
●
●
●
●
●
●
●
●● ● ●
● ●
●
●
●
●
●
● ●
●
●●
●● ●
● ●●
●
●
●●
●
●● ●
●●
●
●●
●● ●
●●●
●
●●
●
●
●
●
●
●
●
●●
●
●
●●
● ●
●
●
●
●
●
●
●
●
●
●
●
●
●
●●
● ●●
●
●
●
●
●
●
●●
●●
●●
●
●
●
10 20 30 40 50
05
1015
20
Low social class (%)
Ove
rcor
wdi
ng (
%)
Figure 1: The four Carstairs component variables plotted against each other. Each pointrepresents a postcode sector. Postcode sectors with less than 1,000 residents have beenexcluded (n=850 postcode sectors included)
Page 6 - Carstairs Scores from the 2011 Census
MRC/CSO Social and Public Health Sciences Unit, University of Glasgow
The distribution of Carstairs deprivation scores
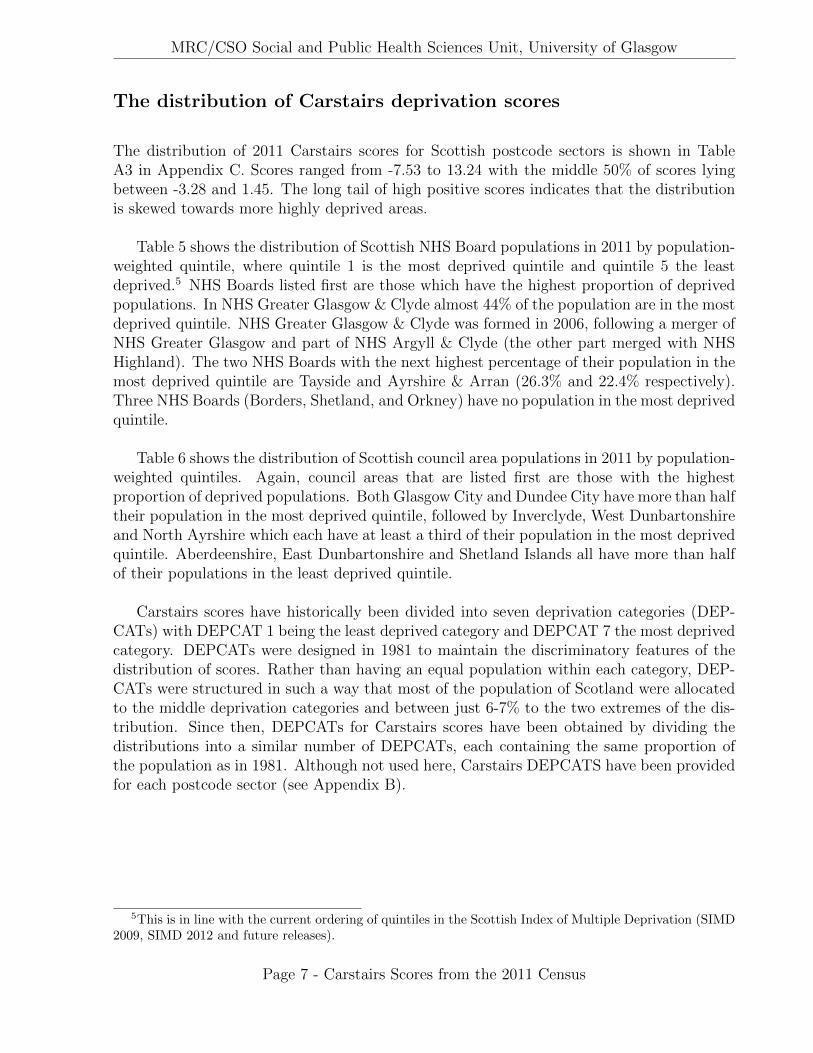
The distribution of 2011 Carstairs scores for Scottish postcode sectors is shown in TableA3 in Appendix C. Scores ranged from -7.53 to 13.24 with the middle 50% of scores lyingbetween -3.28 and 1.45. The long tail of high positive scores indicates that the distributionis skewed towards more highly deprived areas.
Table 5 shows the distribution of Scottish NHS Board populations in 2011 by population-weighted quintile, where quintile 1 is the most deprived quintile and quintile 5 the leastdeprived.5 NHS Boards listed first are those which have the highest proportion of deprivedpopulations. In NHS Greater Glasgow & Clyde almost 44% of the population are in the mostdeprived quintile. NHS Greater Glasgow & Clyde was formed in 2006, following a merger ofNHS Greater Glasgow and part of NHS Argyll & Clyde (the other part merged with NHSHighland). The two NHS Boards with the next highest percentage of their population in themost deprived quintile are Tayside and Ayrshire & Arran (26.3% and 22.4% respectively).Three NHS Boards (Borders, Shetland, and Orkney) have no population in the most deprivedquintile.
Table 6 shows the distribution of Scottish council area populations in 2011 by population-weighted quintiles. Again, council areas that are listed first are those with the highestproportion of deprived populations. Both Glasgow City and Dundee City have more than halftheir population in the most deprived quintile, followed by Inverclyde, West Dunbartonshireand North Ayrshire which each have at least a third of their population in the most deprivedquintile. Aberdeenshire, East Dunbartonshire and Shetland Islands all have more than halfof their populations in the least deprived quintile.
Carstairs scores have historically been divided into seven deprivation categories (DEP-CATs) with DEPCAT 1 being the least deprived category and DEPCAT 7 the most deprivedcategory. DEPCATs were designed in 1981 to maintain the discriminatory features of thedistribution of scores. Rather than having an equal population within each category, DEP-CATs were structured in such a way that most of the population of Scotland were allocatedto the middle deprivation categories and between just 6-7% to the two extremes of the dis-tribution. Since then, DEPCATs for Carstairs scores have been obtained by dividing thedistributions into a similar number of DEPCATs, each containing the same proportion ofthe population as in 1981. Although not used here, Carstairs DEPCATS have been providedfor each postcode sector (see Appendix B).
5This is in line with the current ordering of quintiles in the Scottish Index of Multiple Deprivation (SIMD2009, SIMD 2012 and future releases).
Page 7 - Carstairs Scores from the 2011 Census

MRC/CSO Social and Public Health Sciences Unit, University of Glasgow
Table 5: The distribution of 2011 Scottish NHS Board populations by 2011 Carstairs quintileof deprivation. The % shown is the percentage of the total NHS Board (or whole of Scotland)population within each population-weighted quintile
Carstairs quintile of deprivation
Most deprived Least deprived
1 2 3 4 5NHS Board n % n % n % n % n %
Greater Glasgow & Clyde 497,455 43.8 190,483 16.8 134,176 11.8 154,845 13.6 158,999 14.0Tayside 107,687 26.3 43,148 10.5 40,836 10.0 110,284 26.9 107,943 26.3Ayrshire & Arran 83,562 22.4 119,567 32.0 55,825 14.9 77,908 20.8 36,850 9.9Lanarkshire 108,327 16.6 201,008 30.9 200,232 30.7 89,726 13.8 52,264 8.0Lothian 133,091 15.9 161,789 19.4 215,919 25.9 152,323 18.2 171,526 20.6Dumfries & Galloway 16,509 10.9 17,079 11.3 36,260 24.0 60,985 40.3 20,491 13.5Forth Valley 28,049 9.4 72,136 24.2 73,820 24.8 40,571 13.6 83,103 27.9Fife 33,941 9.3 109,275 29.9 114,287 31.3 57,090 15.6 50,605 13.9Grampian 46,836 8.2 77,054 13.5 78,683 13.8 101,524 17.8 264,964 46.6Western Isles 291 1.1 2,594 9.4 7,226 26.1 15,653 56.5 1,920 6.9Highland 1,080 0.3 52,988 16.5 75,276 23.5 122,524 38.3 68,430 21.4Borders - - 11,789 10.4 17,456 15.3 62,241 54.7 22,384 19.7Shetland - - - - 8,436 36.4 432 1.9 14,299 61.7Orkney - - - - - - 12,162 57.0 9,187 43.0
Scotland 1,056,828 20.0 1,058,910 20.0 1,058,432 20.0 1,058,268 20.0 1,062,965 20.0
Page 8 - Carstairs Scores from the 2011 Census

MRC/CSO Social and Public Health Sciences Unit, University of Glasgow
Table 6: The distribution of 2011 Scottish council area populations by 2011 Carstairs quintileof deprivation. Shown is the percentage of the total council area population within eachpopulation-weighted quintile
Carstairs quintile of deprivation
Most deprived Least deprived
Council Area 1 2 3 4 5
Glasgow City 63.6 14.9 13.0 6.3 2.2
Dundee City 55.4 13.6 10.8 5.8 14.3
Inverclyde 40.5 27.1 8.7 14.2 9.6
West Dunbartonshire 36.8 31.3 21.4 10.5 -
North Ayrshire 35.0 32.3 11.1 18.8 2.8
North Lanarkshire 27.3 46.7 14.0 7.9 4.1
Renfrewshire 25.3 24.7 6.3 26.1 17.6
Edinburgh City 23.5 16.4 19.6 16.5 24.0
South Ayrshire 16.9 7.2 26.8 27.6 21.4
Aberdeen City 16.8 24.0 11.5 8.6 39.1
Perth & Kinross 13.8 3.0 6.3 33.7 43.3
East Ayrshire 13.1 54.4 8.3 17.0 7.1
Clackmannanshire 12.5 24.4 50.8 - 12.3
Dumfries & Galloway 10.9 11.3 24.0 40.3 13.5
Stirling 9.4 19.7 7.4 21.9 41.6
Fife 9.3 29.9 31.3 15.6 13.9
East Dunbartonshire 8.6 - 4.5 34.2 52.6
Falkirk 8.4 26.8 26.3 13.4 25.2
West Lothian 8.2 22.9 38.0 14.3 16.6
Midlothian 7.8 24.1 40.9 15.6 11.6
South Lanarkshire 5.1 13.8 48.8 20.0 12.2
Angus 5.0 16.1 13.5 45.1 20.1
Aberdeenshire 3.7 6.5 6.7 19.1 64.1
Eilean Siar 1.1 9.4 26.1 56.5 6.9
East Renfrewshire 0.5 9.6 16.3 16.3 57.3
Highland 0.4 17.4 18.0 41.5 22.7
Argyll & Bute 0.1 14.3 38.1 29.6 17.9
East Lothian - 23.8 21.8 35.8 18.7
Scottish Borders - 10.4 15.3 54.7 19.7
Moray - 7.8 38.6 36.7 16.8
Shetland Islands - - 36.4 1.9 61.7
Orkney Islands - - - 57.0 43.0
Scotland 20.0 20.0 20.0 20.0 20.0
Page 9 - Carstairs Scores from the 2011 Census

MRC/CSO Social and Public Health Sciences Unit, University of Glasgow
Comparison of 2011 scores with previous years
The comparison of Carstairs scores over time can provide important insights into changesin material deprivation in Scotland. A couple of important points should be kept in mindbefore proceeding with the comparison. First, the Carstairs score is a relative, not an absolutemeasure of deprivation. In other words, if a postcode sector receives a score of zero in both2001 and 2011 the area is average in relation to others, but the absolute level of deprivationmay have changed over time. For this reason comparing the average Carstairs scores overtime makes little sense. Another option, and one that is considered here, is to compare thespread of the distribution over time, particularly at the extremes, to see if the differencesbetween the most and least deprived areas in Scotland have increased or decreased.
Secondly, postcodes change and so do postcode sectors, meaning that the areas for whichthe scores are provided do not stay constant. This makes comparisons across time method-ologically unsound as any change in the deprivation score could result from changes in thepostcode sector’s geography and not in actual socioeconomic conditions of the people inthose places. A valid over time analysis is only possible for those postcode sectors that haveexperienced little change across censuses. Using census boundary files for 1991, 2001 and2011 6, 431 postcode sectors that have remained largely unchanged have been identified. Theanalysis of these postcode sectors will be the second focal point here.
Table 7: Percentage of individuals in areas as defined by the areas’ Carstairs deprivationscore, 1981-2011
Low levels of deprivation High levels of deprivation
(-10, -6] (-6, -2] (-2, 2] (2, 6] (6, 10] (10, 14] (14, 18]
1981 2.5 28.2 44.1 18.5 5.5 1.3 0.0
1991 1.2 29.5 45.0 17.3 5.4 1.5 0.0
2001 0.4 31.5 43.7 18.1 4.6 1.5 0.1
2011 0.4 31.1 43.8 18.6 5.1 1.0 0.0
Figure 2 shows the distribution of Carstairs scores for the first (most deprived) and fifth(least deprived) quintiles over four decades. Between 1981 and 2001 the distribution shiftedslightly towards more extreme deprivation. In the most deprived quintile the range andinterquartile range increased, meaning that there were more areas that were very deprivedcompared to the Scottish average. On the other hand, the range and interquartile range ofthe least deprived quintile decreased meaning that fewer areas were less deprived comparedto the average. Between 2001 and 2011 there has been less change in the overall distribution,but there is some evidence of decreasing numbers of extremely deprived postcode sectors.
6Boundary files for 1981 census were not available.
Page 10 - Carstairs Scores from the 2011 Census

MRC/CSO Social and Public Health Sciences Unit, University of Glasgow
●●
●●
●
●
●
●●
●
1981 1991 2001 2011
−10
−5
05
1015
Car
stai
rs s
core
● ●●●
First quintileFifth quintile
Figure 2: Distribution of Carstairs scores among the first (most deprived) and fifth (leastdeprived) quintiles of deprivation, 1981-2011
Table 7 shows the distribution of individuals living in areas with various levels of depri-vation. In 1981, 2.5% of people lived in the least deprived areas (Carstairs score range -10to -6). By the next decade this percentage had decreased to 1.2 and by 2001 to 0.4, whereit has stayed since. At the other end of the scale (Carstairs score ranges 10 to 14 and 14 to18) there was a slight increase between 1981 and 2001 in the percentage of people who livedin very deprived areas. In 2011, the trend reversed and fewer people now live in areas witha Carstairs score above 10.
The above comparison of scores over time shows that by 2011 areas have become slightlyless extreme in terms of deprivation. Fewer people live in what could be considered verydeprived or much less deprived areas compared to the Scottish average. Changes in depri-vation over the four decades are only noticeable at the extremes of the distribution and the
Page 11 - Carstairs Scores from the 2011 Census

MRC/CSO Social and Public Health Sciences Unit, University of Glasgow
percentage of people living in average areas (Carstairs score range -2 to 2) is roughly 44%across all four time periods. Finally, from these results it is not possible to say that there ismore or less deprivation now than 30 years ago, but rather it appears that the areas peoplelive in today are somewhat more diverse in terms of economic conditions.
Carstairs scores of individual postcode sectors from 1991 to 2011 were also analysed. Onlythose postcode sectors that remained roughly similar across the three censuses were included.A postcode sector was classified as similar across time if the union (i.e. the overlapping areaacross the three time points 1991, 2001 and 2011) was more than 90% of the postcode sectorarea at each of the three time points. Using census boundary files, 431 postcode sectors(approximately 43%) were identified that met this criteria. While the number of similarpostcode sectors is sufficiently large for quantitative analysis, it should be kept in mind thatthe majority of postcode sectors can not be reliably compared across time.7
●
●●
●
●
●●
●
●
●
●
●
●
●
●
●
●
●●●
●
●
●
●
●
●
●●
●
●●
●
●
●
●
●●
●
●
●
●
●
●
●●
●●
●
●
●
●
●
●
●
●●●
●
●
●●
●●
●
●●
●
●
●●
●
●
●● ●
●
●
●
●
●
●
●
●
●
●
●
●●
●●
●
●
●
●
●
●
●
●
●
● ●●
●
●
●
● ●
●
●
●
●
●
●
●
●
●
●
●
●
●
●
●
●
●
●
●
●
●
●
●
●
●
●●
●
●
●
●
●
●
●
●
●●●
●
●●
●
●
●
●
●
●
●
●
●
●
●●
●
●
●
●
●
●
●
●
●
●
●
●
●
●
●●
●
●
●
●●
●
●
●
●
●
●
●
●
●
●
●
●
●
●
●●
●
●
●
●
●
●
●
●
●●
●
●
●
●
●
●
●
●●
●
●
●
●
●
●
●
● ●
●●
●
●
●
●●
●
● ●
●
●
●
●
●
●● ●
●●
●
●
●
●
●
●
●
●
●●
●
●
●
●
●
●
●
●
●
●
●
●
●
●
●
●
●
●
●
●
●
●
●
●●
●
●
●
●
●
●
●
●
●●
●
●
●
●
●
●
●
●
● ●
●●
●
●
●
●
●●●
●
●
●
●
●
●
●
●
●
●●
●
●
●
●
●
●
●
● ●●
●
●
●
●
●
●●
●
●
●
●
●
●
●
●
●
●
●
●
●
●
●
●
●
● ●
●
●
●
●
●
●
●
●●
●●
●
●
●
●
●
●
●
●
●
●
●
●
●
●
●
●
●
●
●
●
●
●
●●
●
●
●
●
●
●
●
●
●
●●
●
●
●
●
●
●
● ●●
●
●
●●
●●
●
●
●
●●
●
●●
●
●
●
●
●●
−5 0 5 10 15
−5
05
1015
1991 Carstairs score
2001
Car
stai
rs s
core
DD3 0
IV43 8
PA73 6
PA76 6
IV41 8
KA3 2PA38 4
PA66 6
PH36 4
PH38 4
PH42 4
G1 5PA45 7
G40 4
G34 9
EH27 8
●
●●
●
●
●
●
●●
●●
●
●
●
●
●
●
●
●●
●
●
●
●
●
●
●
●
●
●
●
●
●
●
●
●●
●
●
●
●
●
●
●●
●
●
●
●
●
●
●
●
●
●●
●
●
●
●
●
●●
●
●●
●
●
●
●
●
●●
●●
●
●
●
●
●
●
●
●
●
●
●
●●
●
●
●
●
●●●
●
●●
●
●●
●
●
●
●
●
●
●
●
●
●
●
●
●
●
●●
●●
●
●
●
●
●
●
●
●
●
●
●
●
●
●
●
●
●●
●
●
●
●
●
●●●●
●
●
●
●
●
●
●
●
●
●
●
●
●
●
●
●
●
●
●
●
●
●
●
●
●
●
●
●●●
●
●
●
●
●
●
●
●
●
●
●●
●
●
●
●
●
●
●
●
●
●
●
●
●
●
●
●
●
●
●
●
●
●
●
●
●
●
●●
●
●
●
●
●
●
●●●
●
●
●
●
●
●
●
● ●
●
●
●
●●
●
●●
●
●
●●
●●
●●
●
●
●
●
●
●
●
●
●
●
● ●
●
●
●
● ●
●
●
●
●
●
●
●
● ●●
●
●●
● ●
●
●
● ●
●
●
●
●
●
●
●
●
●
●
●
●
●
●
●●
●●
●
●
●●
●
●
●
●
● ●
●
●
●
●
●
●
●
●
●
●
●
●
●
●
●
●
●
●
●
●
●
●
●
●
●
●
●
●
●
●
●
●
●
●
●
● ●
●
●
●
●●
●
●
●●
●
●
●●
●
●
●
●
●
●
●
●
●●●
●
●
●
●
●
●
●
●
●
●
●
●
●
●
●
●
●
●
●
●
●
●●
●
●
●
●
●
●
●●
●
●●
●●
●●
●● ●
●
●
●
●
●
●
●
●
● ●
●
●
●
●
●
−5 0 5 10 15
−5
05
1015
2001 Carstairs score
2011
Car
stai
rs s
core
G20 9
G34 9
G40 4
IV44 8IV46 8
KY6 3
PH42 4
EH22 2
FK1 2
HS4 3
IV45 8
PA25 8
Figure 3: Carstairs scores for the 431 largely unchanged postcode sectors, 1991-2011
Figure 3 compares 1991 Carstairs scores to 2001 scores (left plot), and 2001 Carstairsscores to 2011 scores (right plot). Table 8 also shows the quintile comparisons for thesame years. All changes should again be interpreted in relative terms, with respect tothe Scottish average. Both Figure 3 and Table 8 show that most areas have roughly thesame Carstairs score and deprivation quintile across the three time points. The correlation
7A brief technical note on the ‘comparison of postcode sectors over time’ will be made available onlinealongside this report.
Page 12 - Carstairs Scores from the 2011 Census

MRC/CSO Social and Public Health Sciences Unit, University of Glasgow
coefficient between 1991 and 2001 scores is 0.85, between 2001 and 2011 scores is 0.93, andbetween 1991 and 2011 scores is 0.82. Comparing 1991 and 2001 Carstairs scores, Table 8shows that the majority of postcode sectors fall either into the same or to a similar quintile(65% of postcode sectors fall on the diagonal and 28% are only one quintile apart). For 2001and 2011 scores, both percentages are higher (67% and 29% respectively). Thus, most areashave remained at roughly the same level of deprivation with respect to the Scottish average.
Table 8: Comparison of Carstairs quintiles, 1991-2011
Carstairs 2001 2011quintile 1 2 3 4 5 1 2 3 4 5
Most deprived 1 48 4 3 3 4 56 8 1 0 02 15 37 9 7 3 11 33 8 1 23 1991 1 13 49 20 4 2001 0 10 50 21 64 0 1 22 62 19 1 2 12 66 30
Least deprived 5 1 0 4 19 83 0 1 2 25 85
A small percentage of postcode sectors have experienced visible shifts in deprivation (e.g.PA73 6, PH38 4 and KY6 3) between 1991 and 2001 and between 2001 and 2011. These tendto be fairly small areas, with a population of around 100-300 in most cases. For small areas,the uncertainty around the Carstairs score is often quite large and even sizable increases ordecreases in the score might be within uncertainty bounds (see the subsection “Robustnessand uncertainty”). Some variation in scores may be observed over time, but this could becaused by the uncertainty in the measure, rather than actual change in levels of materialdeprivation. A closer analysis of these postcode sectors (e.g. looking at the changes in each ofthe four Carstairs components) should be conducted before determining whether significantincreases or decreases in deprivation have occurred.
Page 13 - Carstairs Scores from the 2011 Census

MRC/CSO Social and Public Health Sciences Unit, University of Glasgow
Relationship with all-cause mortality
There has always been a strong association between deprivation and mortality in Scotland(see e.g. Carstairs and Morris, 1989). Figure 4 shows the relationship between all-causemortality (2010-2012) and 2011 Carstairs scores for those aged under 65. Standardised ratesin postcode sectors with less than 1,000 residents were not plotted, since mortality ratesare often unstable in small populations. There is evidence of a positive linear association,with mortality rates increasing as the deprivation score increases. Some postcode sectorswith relatively high mortality rates have been identified. These are all areas with a higherthan average percentage of communal establishment residents and all had high mortalityrates at the time of the census in 2001, that is mortality rates in these postcode sectorswere all within the top ten highest mortality rates for all postcode sectors in Scotland inthe three-year period 2000-2002. The only exception is ML7 5 (part) postcode sector (inWest Lothian). This part-postcode sector has no communal establishment residents and hadaverage mortality around the time of the last census.
●
●
●
●
●
●
●
●
●
●
●
●
●
●●
●
●
● ●●
●
●●
●
●
●
●
●
●
●●
●●
●
●
●
●
●
●●
●
●
●
●
●
●
● ●●●
●●
●
●
●●
●
●
●
● ●●●
●
●
●
●
●
●
●
●
●
●
●●
●
●
●●
●
●
●
●
●
●●
● ●
●
●
●
●
●
●
●
●
●
●
●
●
●●
●
●
●
●
●
●
●
●
●
●
●
● ●●
●
●
●
●
●
●
●
●
●
●
●
●
●
●
●
●
●●●
●●
●
●
●
●
●
●
●
●
●●
●●
●
●
●
●
●
●
●●
●
●●
●
●
●
●
●
●
●
●
●
●
●
●
●
●
●●
●
●
●
●●
●
●●
●●
●
●
●
●
●
●
●
●
●
●
●
●
●
●●
●
●
●
●
●
●
●●
●
●●
●
●
●
●
●
● ●
●
●
●
●
●●
●
●
●●
●
●
●
●●
●●
●
●
●●
●
●
●
●
●
●●
●
●●
●
●
●
●
●●
●●
●●
●
●●
●
●
●
●
●
●
●
●
●●
●
●
●
●
●
●
●
●●
●
●
●
●●
●
●
●
●
●
●●
●
●●
●
●
●
●
●
●●
●●
●
●
●
●
●
●
●
●
●
●
●
●
●●
●
●
● ●
●
●
●
●
●
●
●
●
●
●
●
●
●
●
●
●
●
●
●
●
●
●●
●
●
●
●
●
●
●
●
●
●●
●
●
●
●
●
●
●
●
●
●
●
●
●
●
●
●
●
●
●
●
●
●
●
●
●
●
●
●
●
●
●
●
●
●
●●
●
●
●
●
●● ●
●
●
●
●
●
●●
●●
●
●
●
●
●
●
●
●
● ●
●
●
●
●
●
●
●●
●●
●
●
●
●
●●
●
● ●
●
●
●●
●
●
●
●
●
●
●
●
●
●
●
●
●
●
●
●
●
●
●
●
●
●
●
●
●●
●
●
●
●
●
●
●
● ●
●●
●●
●
●
●
●
●
●
●
●
●
●
●
●
●
●
●
●
●
●
●
●
●
●
●
● ●
●
●
●
●
●
●●
●
●
●
●
●
●
●
●●
●
●
●
●
●
●
●
●
●
●
●
●
●
●
●●
●
●
●
●
●●
●●
● ●●
●
●
●
●●
●
●
●●
●
●
●
●●
●
●
●
●
●
●
●
●
●
●
●
●
●
●
●
●
●
●
●
●
●●
●●
●
●
●
●
●
●
●
●
●
●
●
●
●
●
●
●
●
●
●
●
●
●
●
●●
●
●
●
●
●
●
●
●
●●
●
●
●●
●
●
●
●
●
●
●
●
●
●●
●●
●●
●
● ●●
●●
●
●
●
●
●●
●
●
●●
●
●
●●
●
●
●●
●●
●
●
● ●
●
●●
●
●
●●●
●
●
●
●
●
●
●
●
●
●
●
●
●
●
●
●
●
●
●
●●
●
●
●
●
●
● ●
●
●
●
● ●
●
●
●
●
●
●●
●
●
●
●
●
●
●●
●● ●
●
●
●
●
●
●●
●
●
●
●
●
●
●
●
●
●
●
● ●
●
●
●
●●
●●
●
●●● ●
●
●
●
●
●●
●
●
●
●
●
●
●
●
●●
●
●
●
●
●
●
●
●
●
●
●
●
●●
●
●
●
●●
●
●
●
●
●
●
●
●●
●
●
●
●
●
●
●
●●●
●
●
● ●
●
●●
●
●
●
●
●●
● ●
●
●
●
●
●
●●
●
●
●
●
●
●
●●
●●
●
−10 −5 0 5 10 15
020
040
060
080
010
00
Carstairs scores 2011
Sta
ndar
dise
d m
orta
lity
rate
(pe
r 10
0,00
0 po
pula
tion)
−10 −5 0 5 10 15
020
040
060
080
010
00
DD1 1
G1 5
G4 0
G40 2
ML7 5 (part)
PA15 1
Figure 4: Postcode sector age- and sex-standardised all-cause mortality rates (per 100,000population) for all people aged 0-64 (years 2010-2012) by 2011 Carstairs scores. Postcodesectors with less than 1,000 residents have been excluded (n=850 postcode sectors included)
Page 14 - Carstairs Scores from the 2011 Census

MRC/CSO Social and Public Health Sciences Unit, University of Glasgow
The correlation coefficient is 0.79 for the 850 postcode sectors plotted. This is a slightdecrease on the 2001 correlation coefficient of 0.81 (based on 840 postcode sectors withpopulations of at least 1,000 in 2001).
Table 9 shows age-standardised all-cause mortality rates for males and females, andage- and sex-standardised all-cause mortality rates for all people aged 0-64 grouped withinCarstairs population-weighted quintiles. Rates are shown for 1980-82, 1991-92 8, 2000-02 and2010-12. All-cause mortality rates for all people, aged under 65, decreased by 21% between1981 and 1991, by 13% between 1991 and 2001 and by 22% between 2001 and 2011. Muchof the reduction in rates between 2001 and 2011 has been driven by lower mortality in maleswith the reduction in the most deprived quintile being particularly high (26%), following aslight increase between 1991 and 2001.
Table 9: Age-standardised all-cause mortality rates (per 100,000 population) for males,females and all people aged 0-64 within population-weighted quintiles
Death rate per 100,000 population % change
1980-82 1991-92 2000-02 2010-12 81 to 91 91 to 01 01 to 11 81 to 11
Males
Most deprived 1 642 538 550 407 -16 2 -26 -37
2 533 434 387 298 -19 -11 -23 -44
3 476 365 318 241 -23 -13 -24 -49
4 439 329 270 202 -25 -18 -25 -54
Least deprived 5 364 260 195 152 -29 -25 -22 -58
All Scotland 491 384 340 256 -22 -11 -25 -48
Females
Most deprived 1 367 316 281 235 -14 -11 -16 -36
2 310 250 214 181 -19 -14 -15 -42
3 274 218 189 156 -20 -13 -17 -43
4 260 187 157 133 -28 -16 -15 -49
Least deprived 5 213 172 131 107 -19 -24 -18 -50
All Scotland 285 229 193 160 -20 -16 -17 -44
All
Most deprived 1 498 423 411 320 -15 -3 -22 -36
2 416 338 298 238 -19 -12 -20 -43
3 371 289 252 198 -22 -14 -21 -47
4 346 256 213 167 -26 -17 -22 -52
Least deprived 5 284 214 163 130 -25 -24 -20 -54
All Scotland 383 304 264 207 -21 -13 -22 -46
8Some postcodes in the Grampian region were restructured in 1990. As a result, it was not possible toassign death records to the new sector boundaries so deaths in 1990 were excluded from analysis.
Page 15 - Carstairs Scores from the 2011 Census

MRC/CSO Social and Public Health Sciences Unit, University of Glasgow
Figure 5 shows, graphically, the change in age-standardised all-cause mortality rates formales and females, aged 0-64, over the last decade. Rates are grouped within Carstairspopulation-weighted quintiles. Between 2001 and 2011, there was a decrease in mortalityrates across quintiles for both males and females. Although the reduction in rates wasbroadly similar across all quintiles, for males the percentage reduction in rates was highestin the most deprived quintile (26%) and for females the percentage reduction in rates washighest in the least deprived quintile (18%).
Q1 Q2 Q3 Q4 Q5
Males
Sta
ndar
dise
d m
orta
lity
rate
(pe
r 10
0,00
0 po
pula
tion)
010
020
030
040
050
060
00
200
400
600
Q1 Q2 Q3 Q4 Q5
Females
010
020
030
040
050
060
00
200
400
600
2000−20022010−2012
Figure 5: Age-standardised all-cause mortality rates for males and females aged 0-64 yearswithin postcode sectors ranked by Carstairs scores and grouped into population-weightedquintiles (Q1: most deprived quintile, Q5: least deprived quintile)
Page 16 - Carstairs Scores from the 2011 Census

MRC/CSO Social and Public Health Sciences Unit, University of Glasgow
Methodological issues
Choice of variables
The four variables that make up the Carstairs score were chosen as they captured conceptsthat closely relate to material deprivation (Carstairs and Morris, 1991). However, as societieschange, so too does what could be considered as being materially deprived. Today theCarstairs score may be less reflective of deprivation than it once was.
Overcrowding now affects a very small percentage of people (Table 3), meaning that itmay not capture material deprivation as well as it used to. The distribution of overcrowdingis also heavily skewed with a small number of postcode sectors having a high percentage ofpeople living in overcrowded homes. Skewness affects the relative contribution of overcrowd-ing to the final score. The left hand panel of Figure 6 shows the effect overcrowding has onthe final score by comparing the original Carstairs score to one where overcrowding is ex-cluded. When overcrowding is exluded, the overall range of the Carstairs score distributiondecreases, but the relative positions of most postcode sectors experience little change. Thereare, however, some noticeable exceptions, such as the Glasgow postcode sectors G42 7, G428, G41 1 and G41 2 which are all in the first quintile (most deprived) based on the originalCarstairs score. When overcrowding is excluded G41 2 falls into the third quntile and G41 1into the second quintile. While G42 7 and G42 8 are still in the first quintile, their rankingchanges from the 6th and 26th most deprived to the 45th and 140th most deprived.
The percentage of people in households with no car has steadily decreased and is nowjust over 20%, half of what it used to be in 1981. Some authors have also contested thetheoretical suitability of car ownership, because in rural areas owning a car is not so much anindication of wealth, but rather a necessity (see e.g. Farmer, Baird and Iversen, 2001; Martin,Brigham, Roderick, Barnett and Diamond, 2000), and in urban areas not having a car mightbe a lifestyle choice. The right-hand panel of Figure 6 shows the effect no car ownership hason the Carstairs score. Some postcode sectors, mostly in Glasgow, Edinburgh and Dundeecity centres, that appear as average or slightly deprived based on the original score have verylow levels of deprivation when excluding car ownership.
Changes in the labour market may also need to be considered in defining current materialdeprivation. Women’s entry into the labour force in large numbers means that female un-employment could be as useful an indicator of deprivation as male unemployment. This andother changes in the labour market have meant that the statistical classifications of SocialClass based on Occupation and Socio-economic Groups have become conceptually outmodedand have since been replaced with the NS-SeC (Rose and Pevalin, 2005). For the Carstairsscore this means that retaining the old definition of low social class has become technicallymore difficult as well as theoretically less suitable. Work is currently under way to updatethe current Carstairs deprivation score.
Page 17 - Carstairs Scores from the 2011 Census

MRC/CSO Social and Public Health Sciences Unit, University of Glasgow
●
●
●
●
●
●
●●
●
●
●
●
●●
●
●●
●
●●●
●
●●
●
●●
●
●
●
●●
●
●●
●
●
●
●
●
●
●●
●●
●●
●●
●●●
●
●
●
●
●
●●●
●
●●
●
●
●●
●●●●
●
●
●
●
●●
●
●
●
●●●●
●
●●
●●
●
●
●
●
●●●
●
●
●●
●
●
●
●●
●
●
●
●
●
●
●
●
●
●
●
●
●
●●
●
●
●●
●
●●
●
●
●
●
●
●
●●
●●
●●
●
●
●
●
●
●●●●
●
●
●
●
●●
●
●
●
●
●●
●
●
●
●
●
●
●
●●
●
●●●
●●
●
●
●
●
●
●
●
●●
●
●
●
●
●
●●
●
●
●
●●
●
●
●
●
●
●
●
●
●
●
●
●
●
●●
●
●
●
●
●
●
●●
●
●
●
●
●
●●
●●
●
●●
●
●
●
●
●
●
●
●●●
●
●
●
●
●
●
●●● ●
●
●
●●
●
●
●
●
●
●
●
●
●
●
●
●
●
●
●
●
●
●
●
●
●
●
●
●
●●
●
●
●
●
●
●
●●
●
●
●●
●
● ●●
●
●
●
●
●●
●
●
●
●
●
●
●
●
●
●●
●●
●
●
●
●
●
●
●
●
●
●
●
●●
●
●
●
●
●
●●●
●
●
●●
●●
●
●●
●●●
●
●●
●
●
●
●
●
●
●
●
●
●
●
●
●
●
●●
●
●
●
●
●
●●●
●
●
●
●
●
●
●
●●
●
●
●
●
●
●
●
●
●
●
●
●
●
●
●●
●
●
●
●
●
●
●●
●
●
●
● ●
●
●
●
●
●
●●
●
●
●
●
●
●
●●
●
●
●
●
●●
●
●
●
●
●
●
●
●
●
●
●
●
●●
●
●
●
●
●
●
●
●
●
●
●
●
●
●
●
●
●
●
●
●●
●
●
●
●●
●
●
●
●
●
●
●
●
●
●●●
●
●
●
●
●
●
●
●
●
●
●
●●
●
●
●
●
●
●
●
●
●
●
●
●
●
●
●
●
●
●
●
●●
●●
●
●
●
●
● ●
●
●
●
●●●
●
●
●
●
●
●
●
●
●
●
●
●
●
●
●
●●
●
●●
●●
●
●
●
●
●
●
●
●●
●
●
●
●
●
●
●●
●
●
●
●
●
●
●
●
●●
●
●●
●●
●
●
●●
●
●
●
●●
●
●
●●
●
●●
●●
●
●
● ●●
●●
●
●
●
●●
●●
●
●
●
●
●
●
●●●
●
●
●
●
●
●
●
●●●
●
●●
●
●●
●
●
●● ●
●
●
●
●
●
●
●
●
●
●
●
●
●
●
●
●
●
●
●
●●
●
●
●
●
●●●
●
●
●●●
● ●●
●●
●
●
●
●
●
●●
●
●
●
●
●
●
●
●
●
●
●
●
●
●●
●
●●●
●
●
●
●
●
●
●
●
●
●
●●
●
●●
●●●
●
●
●●
●●
●
●
●●●●
●
●
●
●
●●
●●
●
●
●
●●
●
●
●
●
●
●
●
●
●
●
●
●
●
●●
●
●
●
●
●
●
●
●
●
●
●●
●
●●
●
●
●
●
●●
●
●●
●●
● ●
●
● ● ●●
●
●●
●●
●
●
●
●
●
●●
●
●
●
●
●
●
●
●●
●●●
●●●
●
●●
●●
●●
●
●
●●
●●
●●
●
●●
●
●
●
●
●
●
●●
●●
●
●
●●
●
●
●
●
●
●
●
●
●●
●●
● ●
●
●
●
●
●
●
●
●
●
●●●
●●
●
●
●●
●
●
●●
● ●●
●
●
●
●
●●
●●
●
●
●●
● ●
●
●
●●
●
●●
●
●
●
●
●●●
●
●
●
●
●
●
●
●
●
●●
●
●
●●
●
●
●
●
●●
●
●●
●●
●●●
●●
●
●
●
●
●
●●
●
●●●●
●
●
●
●
●
●
●●
●●
●●
●●●
●
●●
●
●
●
●●
●
●●
●
●
●●
●
● ●●
●
● ●
−10 −5 0 5 10 15
−10
−5
05
1015
Carstairs score
Soc
re w
ithou
t ove
rcro
wdi
ng
G42 7
G41 1
G42 8
G41 2
●
●
●
●
●
●
●
●
●
●
●
●
●●
●
●●
●
●
●●
●
●●
●
●
●
●
●
●
●●●
●●
●
●
●●
●
●
●
●●●
●●
●●●
●●
●
●
●
●
●
●●●
●
●●
●
●
●●●●●●
●● ●
●
●
●
●
●●
●●
●●
●●●
●
●
●
●
●●
●●●
●
●●●
●
●●
● ●
●
●
●
●
●
●
●
●
●
●
●
●
●
●
●●
●
●
●
●
●
●
●
●
●
●
●
●
●●
●
●●●
●
●
●
●
●●●
●
●●
●
●
●
●●
●●●
●
●●
●
●
●
●
●
●
●
●●
●
●●●
●●
●
●
●
●
●●
●
●●
●●
●
●
●●●
●
●
●
●●
●
●
●
●
●
●
●
●
●
●
●
●
●
●●
●
●
●
●
●●
●●
●
●
●
●
●● ●
●
●
●
●
●
●
●
●
●
●
●
●
●
●●
●
●●●
●
●
●
●●●
●
●
●
●●
●
●
●
●
●
●
●
●
●
●
●
●
●
●
●
●
●
●
●
●
●
●●●●
●●
●
●
●
●
●
●
●
●
●
●
●
●
●
●
●
●
●
●
●●
●
●
●
●
●
●
●
●
●
●
●
●●
●
●
●
●
●
● ●
●
●
●
●
●
●
●
●●
●
●
●●
●
●
●
●
●
●●
●
●
●●
●●
●
●
●
●
●
●
●
●
●
●
●
●
●
●
●
●
●
●●
●
●
●
●
●
●
●●
●
●
●
●
●
●●
●●
●
●
●
●
●
●●
●
●
●
●
●
●
●
●●
●
●
●
●
●
●
●
●●
●
●
●●
●
●
●
● ●
●
●
●
●
●
●
●
●
●●
●
●●
●
●
●
●
●
●
●
●
●
●
●
●
●
●●
●
●●
●
●
●
●
●
●
●
●
●
●
●
●
●
●
●
●●
●
●
●
●
●
●
●
●
●
●
●
●
●
●
●
●
●
●●●●
●●
●
●
●
●
●
●
●
●●
●
●
●
●
●
●
●●
●
●●
●
●
●
●
●
●
●
●
●
●
●
●●●
●
●
●●
●
●
●
●
●●●
●
●
●
●●
●
●
●
●
●
●
●
●
●
●
●●
●
●
●
●
●
●
●
●●
●
●●
●
●
●
●●
●
●
●
●
●
●
●
●
●
●
●
●●
●●
●
●●
●
●
●
●
●●
●
●
●
●●
●
●
●●
●
●●
●●
●
●
●
●●●
●
●
●
●
●●
●
●
●
●
●
●●
●
●●●
●●
●
●
●
●
●
●●
●
●
●●
●
●●
●
●●
●
●●
●
●
●
●
●
●
●
●●
●
●
●
●●
●
●
●
●
●
●
●
●
●
●
●●●●
●
●
●●
●
●
●●
●
●
●
●
●
●
●●
●
●
●
●
●●
●
●
●
●
●
●
●
●●
●
●●
●●
●
●
●
●
●
●
●
●●
●●
●
●●
●●●
●●
●●●
●
●
●
●
●
●●
●
●●
●
●●
●●
●
●
●
●●
●
●
●
●
●
●
●
●
●
●
●
●
●
●●
●
●
●
●
●
●●
●
●
●
●●
●
●●
●
●
●
●
●●
●
●
●
●●
●
●
●
●
●
●●
●
●●●
●
●
●
●
●
●
●●●
●
●
●
●
●
●
●●
●●●
●
●●●
●●
●
●
●●
●
●
●
●
●●
●
●
●
●●
●
●
●
●
●
●
●
●
●
●
●
●
●
●
●
●
●
●
●
●
●
●●
●
●●
●
●
●●
●
●
●
●●
●
●●●
●
●●
●
●
●
●
●
●
●●●
●●
●
●
●●
●
●
●
●
●
●
●●
●
●
●
●
●
●
●
●
●
●
●
●●
●●●
●
●
●
●
●
●
●
●
●
●
●
●
●
●
●
●
●
●
●
●●
●
●●
●●
●
●●
●
●
●●
●
●
●
●●
●
●●
●●
●
●●
● ●
●
●●
●●
●●
●●●
●
●
●
●
●
●
●●●
●●
●
●
●
●●
●
●
●●
●●
−10 −5 0 5 10 15
−10
−5
05
1015
Carstairs score
Soc
re w
ithou
t no
car
owne
rshi
p
Figure 6: The effect of excluding overcrowding (left plot) and no car ownership (right plot)from the original Carstairs score
Page 18 - Carstairs Scores from the 2011 Census

MRC/CSO Social and Public Health Sciences Unit, University of Glasgow
Robustness and uncertainty
As with most measures, there is some degree of uncertainty around the Carstairs score. Inother words, it is not possible to say that the deprivation score for EH14 4 is exactly -6.62and for AB12 5 in Aberdeenshire it is -6.60, making the former area less deprived thanthe latter. A number of sources of uncertainty enter into the measure of deprivation, frompotential coding errors to the relative contribution of each of the variables on deprivation.
There are various ways to investigate uncertainty. Here two sources of uncertainty areconsidered: the effect of weights and the population size of the area of interest. In the firstcase the effect on the Carstairs score when the weight attached to each variable is varied isinvestigated. The Carstairs score standardizes the variables in an attempt to give them equalweight on the final score; the weight for each of the variables is one and the sum of the weightsis four. However, standardization does not control for situations where the distribution ofthe data is extremely skewed. As shown, the skewed distribution of overcrowding affects itscontribution to the final score. When the weights are varied the influence of some variablesare reduced while the influence of others is increased. If the change in the weights, i.e. theinfluence of individual variables, does not affect the score much there is more confidence inthe estimated level of deprivation.
To do this four random weights were drawn from a uniform distribution and then con-strained to sum to four. These weights can lie anywhere from zero to four for each variablebut the sum of these weights must be four, for each of the random draws. The new weightswere assigned to each of the variables and a new score calculated. This procedure wasrepeated 1,000 times to provide 1,000 new randomly weighted Carstairs scores for each post-code sector. To assess the extent of variation 2.5th and 97.5th percentiles of the generatedscores were observed. These percentiles give the intervals between which 95% of the gener-ated scores will fall, giving a likely deprivation score range for all areas.
Figure 7 shows the scores and their likely range for ten of the most and least deprivedareas. While postcode sectors EH14 4 and AB12 5 in Aberdeenshire have slightly differentCarstairs scores, EH14 4 does not differ to AB12 5 due to the uncertainty around the measure.Indeed, it is not possible to say that any of the ten least deprived areas is less deprived thananother. Similarly, while G15 7 has the highest Carstairs score it is not possible to say thatit is definitely more deprived than G51 3. However, the ten least and most deprived areasare clearly distinguished, even when taking account the uncertainty around the weights.
The extent of uncertainty can also be analysed by comparing the Carstairs scores quintilesto the quintiles calculated based on the lower and upper bounds of uncertainty. Table 10shows that for the majority of cases uncertainty is small enough to reliably use quintiles as acategorical measure of deprivation. About 80% of postcode sectors fall into the same quintilebased on the score and the lower bound, and 83% of postcodes are on the diagonal whencomparing the Carstairs quintiles to the quintiles based on the upper bound. However, in
Page 19 - Carstairs Scores from the 2011 Census

MRC/CSO Social and Public Health Sciences Unit, University of Glasgow
around 1.2% of cases the uncertainty bounds of the postcode sector falls two quintiles aboveor below the Carstairs score quintile. Thus, for a small number of areas the measure isunreliable.
Table 10: Comparison of the Carstairs score quintiles to the quintiles defined by the lowerand upper bounds of uncertainty
Carstairs Lower uncertainty bound Upper uncertainty bound
quintile 1 2 3 4 5 1 2 3 4 5
Most deprived 1 151 20 2 0 0 163 10 0 0 0
2 13 107 29 3 0 18 119 15 0 0
3 0 20 121 35 8 4 26 141 13 0
4 0 0 18 168 44 0 8 27 181 14
Least deprived 5 0 0 0 14 259 0 0 0 33 240
Similar variations in uncertainty are also displayed in Figure 7, where the postcodesector G42 7 has a visibly higher uncertainty range than the others. Uncertainty is highestfor areas with extremely high values on one of the four components. For example, the fourareas with very high overcrowding in Figure 6, including G42 7, also have the highest rangefor uncertainty. This again highlights the impact of extreme values and the problems theycreate in interpreting the value of the final score.
Secondly, uncertainty in the Carstairs score due to the population size of the postcodesectors was considered. Estimates, such as the percentage unemployed or living in over-crowded households, can be unreliable if based on a small number of cases. This is universalto all small area measures and thus some type of statistical method is often used to increasethe robustness of the estimated scores. Here confidence intervals have been provided to takeaccount uncertainty in instances where the number of cases are small. Random samples of1,000 draws were taken from a binomial distribution for each of the four census componentvariables, and used to calculate 1,000 new Carstairs scores.9 This was done for all 1,012postcode sectors. Just as before, the 2.5th and 97.5th percentiles of the generated scoreswere observed and these provided the 95% confidence intervals for each area.
Figure 8 shows the ten most and least deprived areas with the 95% confidence intervalsadded. Again, it is not possible to distinguish the most deprived areas from each other, norcan the ten least deprived areas be easily distinguished. The uncertainty around the scorefor the most deprived areas (especially G42 7 and G15 7) is much smaller in Figure 8 thanit was in Figure 7. This is because these are very large areas with a population of over
9For all four variables the denominator was used as the number of Bernoulli trials and the observedproportion as the success rate. For areas where the numerator was zero (e.g. there were no unemployed menin an area) the numerator was given the value of 0.5.
Page 20 - Carstairs Scores from the 2011 Census

MRC/CSO Social and Public Health Sciences Unit, University of Glasgow
4,000 (G40 3 has a population of 2,519). To the contrary, uncertainty for six of the 10 leastdeprived areas is relatively high because the total population in these areas is very small(around 100, or less).
Finally, Table 11 shows the quintile by quintile comparison between the Carstairs quin-tile and the upper and lower confidence intervals. Approximately 90% of cases fall on thediagonal, meaning that the uncertainty due to population size is small enough to confi-dently place postcode sectors into deprivation quintiles. For 13 postcode sectors (1.3%) theCarstairs quintile and the quintile based on either the upper or lower confidence interval liemore than one category apart. These are all very small postcode sectors with the number ofresidents ranging from 60 to 167. For the most part, though, the Carstairs score quintile isa reliable indicator of deprivation.
Table 11: Comparison of the Carstairs scores quintiles to the quintiles based on the lowerand upper confidence intervals
Carstairs Lower confidence interval Upper confidence interval
quintile 1 2 3 4 5 1 2 3 4 5
Most deprived 1 168 5 0 0 0 171 2 0 0 0
2 0 138 13 1 0 10 139 3 0 0
3 0 2 155 26 1 0 24 157 3 0
4 0 0 2 185 43 1 7 20 197 5
Least deprived 5 0 0 0 3 270 0 0 3 36 234
Together these two methods of assessing uncertainty show that consideration has to betaken when interpreting the Carstairs score, particularly if any of the four components takeon an extreme value or if the population of the area is very small (e.g. less than 1,000people). Both types of uncertainty estimates have been provided for each postcode sector(see Appendix B).
Page 21 - Carstairs Scores from the 2011 Census

MRC/CSO Social and Public Health Sciences Unit, University of Glasgow
●
●
●
●
●
●
●
●
●
●
●
●
●
●
●
●
●
●
●
●
KY6 3 (part) Perth & Kinross
KY13 0 (part) Clackmannanshire
KY14 6 (part) Perth & Kinross
AB12 3 (part) Aberdeenshire
EH12 0
KY14 7 (part) Perth & Kinross
EH46 7 (part) South Lanarkshire
AB21 7 (part) Aberdeenshire
EH14 4
AB12 5 (part) Aberdeenshire
G51 3
G33 4
G31 4
G51 2
G42 7
G34 9
G21 2
G22 5
G40 3
G15 7
−10 0 10Carstairs scores and uncertainty
Figure 7: Uncertainty based on varying the weights attached to each variable for the tenmost deprived (top) postcode sectors and ten least deprived (bottom) postcode sectors
Page 22 - Carstairs Scores from the 2011 Census

MRC/CSO Social and Public Health Sciences Unit, University of Glasgow
●
●
●
●
●
●
●
●
●
●
●
●
●
●
●
●
●
●
●
●
KY6 3 (part) Perth & Kinross
KY13 0 (part) Clackmannanshire
KY14 6 (part) Perth & Kinross
AB12 3 (part) Aberdeenshire
EH12 0
KY14 7 (part) Perth & Kinross
EH46 7 (part) South Lanarkshire
AB21 7 (part) Aberdeenshire
EH14 4
AB12 5 (part) Aberdeenshire
G51 3
G33 4
G31 4
G51 2
G42 7
G34 9
G21 2
G22 5
G40 3
G15 7
−10 0 10Carstairs scores and confidence intervals
Figure 8: Confidence intervals for the uncertainty due to population size for the ten mostdeprived (top) postcode sectors and ten least deprived (bottom) postcode sectors
Page 23 - Carstairs Scores from the 2011 Census

MRC/CSO Social and Public Health Sciences Unit, University of Glasgow
What do deprivation scores identify?
Carstairs deprivation scores use aggregated census data about people in small areas to quan-tify relative differences in material deprivation in those areas. Area-based measures of de-privation are often used to target deprived individuals; however, it is important to note thatnot all residents of a deprived area are deprived, and conversely, not all deprived people livein deprived areas. Areas are not necessarily homogenous and those that contain a mix ofboth deprived and less deprived individuals will have deprivation scores in the mid-range (seeFigure 9). Heterogeneous poulations are more likely to be found in rural areas and thereforearea-based deprivation scores may provide a better account of deprivation in urban areas.Postcode sectors vary considerably in size, both in terms of geographical area and populationdensity. This means that even where an area has been categorised in the mid-range of thedeprivation scale, it could contain more deprived individuals than areas classified as beingvery deprived.
Figure 9: Illustration of four homogenous/heterogenous areas ranked by deprivation. Darkcircles represent presence of indicators of deprivation and white circles absence
Homogeneity increases when individuals within areas share similar characteristics. As aresult, homogeneous areas are more likely to lie at the extremes of the deprivation scale. Itmay be reasonable to expect that smaller areas (in terms of population size) will be morehomogenous than larger areas. Geographic boundaries, however, tend not to be defined onthe basis of the characteristics of the populations within them and so this might not benecessarily true.
Page 24 - Carstairs Scores from the 2011 Census

MRC/CSO Social and Public Health Sciences Unit, University of Glasgow
Carstairs deprivation scores at datazone and output area level
In addition to census postcode sectors, Carstairs deprivation scores have been calculated in2011 for census datazones (best-fitted from 2011 census output areas) and census outputareas. This is important as it has the potential to provide useful data at a much smallergeography. Datazones and output areas have an average population size of 815 and 114respectively, compared to an average population size of 5,233 in postcode sectors. As areasbecome geographically smaller in size, it becomes possible to identify small pockets of depri-vation. The maximum deprivation score at postcode sector level is 13.2 compared to 17.7 atoutput area level (see Table 12). The variation in the distribution of scores decreases witharea size, although there is no trend in how the range of scores varies with area level.
Table 12: Descriptive statistics of 2011 Carstairs deprivation scores by area level
Descriptive Statistics
Area level N Median SD Min Max Range
Postcode sector 1,012 -1.33 3.62 -7.53 13.24 20.77
Datazone 6,5001 -0.54 3.43 -5.45 17.27 22.71
Output area 46,351 -0.43 3.11 -4.29 17.65 21.94
1 There are 6,505 datazones best-fitted from 2011 census output areas. However, five data-zones (S01002296, S01003031, S01003319, S01003505 and S01003548) have 0 population andso Carstairs deprivation scores have been calculated for 6,500 datazones in total.
Carstairs deprivation scores have been provided for every small area at postcode sector,datazone and output area level. Some of these areas are extremely small and not all variablescan be calculated reasonably for every area (there are 18 output areas with 0 economicallyactive males and therefore no male unemployment). Caution should be taken when inter-preting Carstairs deprivation scores for individual areas, at any area level. See Appendix Bfor details about Carstairs deprivation scores and associated output, calculated for the threearea levels.
Figure 10 shows the distribution of Carstairs deprivation scores at each area level. Al-though there is a shift towards higher, more deprived, scores in smaller areas, there are alsomany more small areas classified as having low levels of deprivation. At datazone and outputarea level, the distribution of scores are highly positively skewed with long tails of extremedeprivation.
Page 25 - Carstairs Scores from the 2011 Census
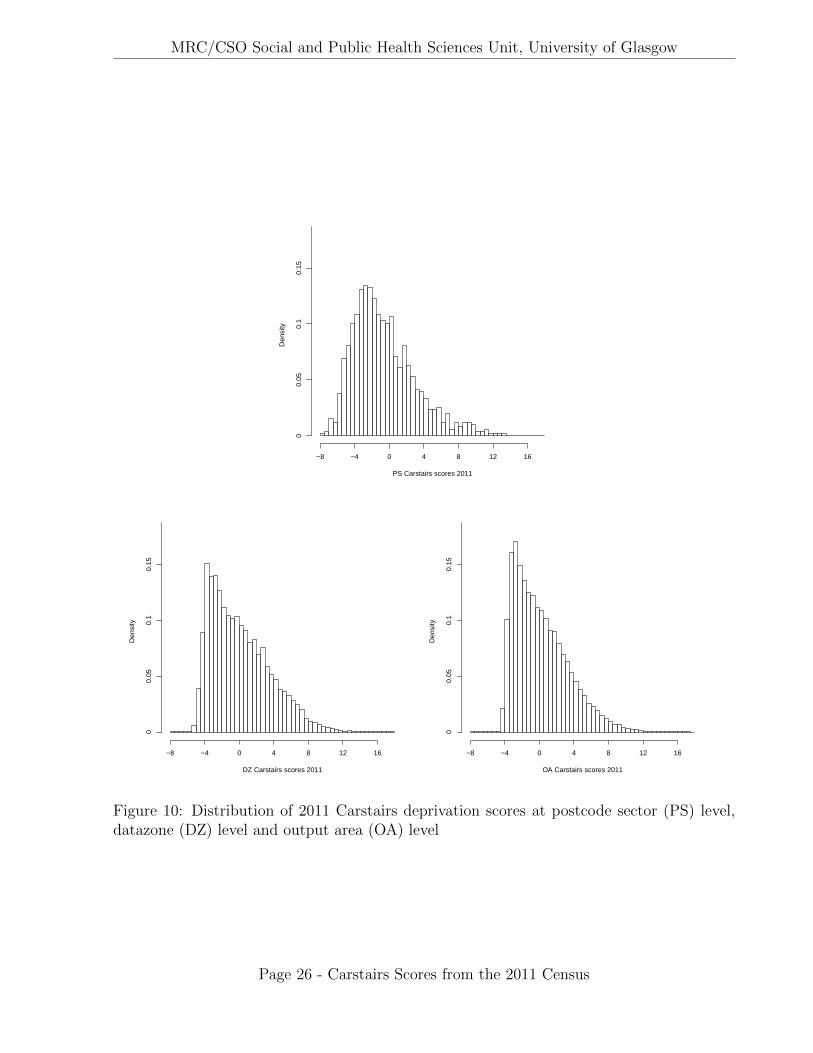
MRC/CSO Social and Public Health Sciences Unit, University of Glasgow
PS Carstairs scores 2011
Den
sity
−8 −4 0 4 8 12 16
00.
050.
10.
15
DZ Carstairs scores 2011
Den
sity
−8 −4 0 4 8 12 16
00.
050.
10.
15
OA Carstairs scores 2011
Den
sity
−8 −4 0 4 8 12 16
00.
050.
10.
15
Figure 10: Distribution of 2011 Carstairs deprivation scores at postcode sector (PS) level,datazone (DZ) level and output area (OA) level
Page 26 - Carstairs Scores from the 2011 Census

MRC/CSO Social and Public Health Sciences Unit, University of Glasgow
Table 13 shows age-standardised all-cause mortality rates for males, females and allpeople aged less than 65 grouped within population-weighted quintiles at each of the threearea levels. Rates are shown for 2010-2012. For all people, the rate ratio at postcode sectorlevel is 2.5. This means that all-cause mortality rates, for all people aged less than 65, were2.5 times as high in the most deprived postcode sectors compared to the least deprived.At datazone level the rate ratio increases to 3.2 times as high and at output area level to3.4 times as high. Greater health inequalities are observed as areas become geographicallysmaller in size. At datazone and output area level there is very little difference in mortalityrates in the least deprived areas but in the most deprived areas all-cause mortality rates arehigher in output areas. Rate ratios are higher for males than females at each area level.
Table 13: Age-standardised all-cause mortality rates (per 100,000 population) for males andfemales aged 0-64 within population-weighted quintiles for each area level 2010-2012
Population-weighted quintile
Most deprived Least deprived Rate
1 2 3 4 5 Ratio1
Males
Postcode sector 407 298 241 202 152 2.7
Datazone 457 315 235 179 127 3.6
Output area 489 315 228 161 127 3.9
Females
Postcode sector 235 181 156 133 107 2.2
Datazone 260 193 149 120 97 2.7
Output area 273 197 148 109 98 2.8
All
Postcode sector 320 238 198 167 130 2.5
Datazone 356 253 191 149 112 3.2
Output area 380 254 187 135 112 3.4
1 Ratio of the all-cause mortality rate in the most deprived quintile to the all-cause mortalityrate in the least deprived quintile.
Page 27 - Carstairs Scores from the 2011 Census

MRC/CSO Social and Public Health Sciences Unit, University of Glasgow
Comparison to the Scottish Index of Multiple Deprivation (SIMD)
While widely used, the Carstairs score is not the only means to measure small area leveldeprivation. The Scottish Index of Multiple Deprivation (SIMD) is produced and used by theScottish Government to identify deprived areas in Scotland. While the SIMD and Carstairsscore capture some similar elements of deprivation, such as (un)employment, they are alsoquite different, as the SIMD includes crime statistics, education, health and geographicalaccess in the final score. To date, the Carstairs scores and the SIMD have been issued fordifferent geographic units, the former for postcode sectors and the latter for datazones, rulingout a comparison between the two. To fill this gap Carstairs scores for datazones have nowbeen produced.
DZ S01006289
DZ S01006282
Figure 11: Two 2001 (SIMD) datazones (gray) with the 2011 output areas (black) used torecreate them overlaid
The SIMD uses the 2001 datazone boundaries. Since the census output for datazonesis provided on a best-fit basis the geographic areas covered by the datazones in the SIMDdataset and in the census data may differ. For some datazones this difference is small, butfor others it can be more substantial. Figure 11 shows two 2001 datazones and the 2011output areas that are used to recreate them. The 2001 datazone S01006282 and the 2011output areas used to recreate it overlap almost exactly, posing no problems for comparisons.However, the datazone S01006289 and the output areas used to reconstruct it do not overlapas well. In general the overlap for most areas is good, but for some the differences aresubstantial. For this reason caution should be taken when drawing final conclusions fromthe comparison of the two measures.
Page 28 - Carstairs Scores from the 2011 Census

MRC/CSO Social and Public Health Sciences Unit, University of Glasgow
The quintile by quintile comparison in Table 14 generally shows good agreement betweenthe measures (61% cases fall on the diagonal), but also substantial disagreement over thelevel of deprivation for some areas (3.5% cases are 2-3 quintiles apart). This may, in part,be caused by the boundary differences of the datazones used in the census and SIMD, butin many cases the two measures also disagree when the datazones have a close geographicaloverlay.10 For the datazones with a close geographical overlay the percentage of datazonesfor which the two measures do not agree is even higher (4.4% of cases are 2-3 quintiles apart)while the level of agreement is 59%.
Table 14: Comparison of 2011 Carstairs quintiles and SIMD 2012 quintiles
SIMD 2012 quintile
Carstairs All datazones Close geographical overlay
quintile 1 2 3 4 5 1 2 3 4 5
Most deprived 1 1096 236 17 1 0 519 127 11 1 0
2 238 767 266 35 17 100 401 142 22 10
3 7 302 622 285 73 5 148 316 160 43
4 0 22 321 604 333 0 15 206 338 195
Least deprived 5 0 1 52 328 877 0 1 48 212 505
Differences also arise due to the variables used in the construction of the two deprivationmeasures. A correlation analysis of ranks for all the components and the Carstairs and SIMDscores are shown in Table 15. While the two deprivation measures correlate highly overall,some components are only weakly related to the overall scores. Both no car ownershipand overcrowding have a correlation coefficient of less than 0.8 with SIMD. Removing nocar ownership and overcrowding from the Carstairs score visibly increases the agreementbetween the two measures. In Table 16, 63.3% of cases fall on the diagonal and only 2% are2-3 quintiles apart.
While for most datazones the two different measures of deprivation seem to providevery similar results, the reasons why 2% of cases are two or more quintiles apart is unclear.Further analysis showed that the two measures are most likely to disagree for rural areas andlarge urban areas. After removing overcrowding and car ownership the agreement betweenthe measures increased noticeably for both of these areas, but remained visibly weaker forremote areas. While some of this discrepancy is due to the SIMD including the access toservices domain, this cannot explain all differences between the two measures as the accessdomain has a small impact on the overall SIMD rank. A more detailed analysis may help toexplain better the causes of disagreement between the two measures of deprivation.
10Close geographical overlay is defined here as cases where the overlapping area covers 95% or more ofthe original and the recreated datazone. By this definition 54.2% of data zones have a close geographicaloverlay.
Page 29 - Carstairs Scores from the 2011 Census

MRC/CSO Social and Public Health Sciences Unit, University of Glasgow
Table 15: Correlation between the deprivation scores (2011 Carstairs and SIMD 2012) andindividual variables (Carstairs) and domains (SIMD)
Variable 2011 Carstairs score SIMD 2012
2011 Carstairs score 1.00 0.91
SIMD 2012 0.91 1.00
Carstairs variables
No car 0.90 0.78
Overcrowding 0.77 0.63
Low class 0.91 0.90
Male unemployment 0.88 0.85
SIMD domains
Income 0.91 0.97
Employment 0.90 0.97
Health 0.84 0.91
Education 0.90 0.92
Access -0.42 -0.23
Crime 0.73 0.72
Housing 0.77 0.70
Table 16: Comparison of the reduced 2011 Carstairs quintiles (excluding overcrowding andcar ownership variables) and SIMD 2012 quintiles
Carstairs SIMD 2012 quintile
quintile All datazones Close geographical overlay
(reduced) 1 2 3 4 5 1 2 3 4 5
Most deprived 1 1121 242 9 0 0 517 119 2 0 0
2 212 813 295 22 1 103 425 153 10 1
3 8 252 655 339 33 4 132 356 178 19
4 0 20 286 603 344 0 15 183 350 182
Least deprived 5 0 1 33 289 922 0 1 29 195 551
Page 30 - Carstairs Scores from the 2011 Census

MRC/CSO Social and Public Health Sciences Unit, University of Glasgow
Conclusions
Carstairs scores provide a summary measure of relative material deprivation in areas. As faras possible the same four census variables have been used to construct Carstairs scores eachdecade since 1981. The measure comprises an unweighted combination of four standardisedcensus indicators: male unemployment, overcrowding, lack of car ownership and low socialclass. Summing together the standardised values of the four components gives the Carstairsscore for each area. Based on the distribution of scores, areas are then divided into Carstairsdeprivation categories, quintiles or other population-weighted groups.
As in previous years, Carstairs scores for 2011 have a distribution which is skewed towardsmore highly deprived areas. NHS Greater Glasgow Board, which merged with parts of NHSArgyll & Clyde in 2006 to form NHS Greater Glasgow & Clyde Board, continues to have alarge proportion of population in the most deprived quintile. Nearly 44% of the populationin NHS Greater Glasgow & Clyde Board belongs to the most deprived 20% of the Scottishpopulation. Both Glasgow City council and Dundee City council have more than half itspopulation in the most deprived quintile.
There continues to be a strong relationship between area-based deprivation scores andall-cause mortality. Mortality rates have continued to fall since 1981. For both males andfemales aged under 65, the rate of decrease in mortality between 2001 and 2011 was broadlyequivalent across all quintiles, although highest overall for males in the most deprived quin-tile. This followed a period of little change in mortality rates for males in the most deprivedquintile. For all people, aged under 65, the reduction in all-cause mortality rates between2001 and 2011 was the largest reduction across a decade since 1981.
This report considers methodological issues that are important in creating Carstairsdeprivation scores. There is some discussion about the choice of variables used to capturematerial deprivation. Prevalence of overcrowding in Scotland has fallen to a very low rate soits usefulness as a current indicator of material deprivation is in doubt. There has also beenmuch discussion over previous decades as to the inclusion of the car ownership variable.For many in rural areas, a car is essential and may not best represent access to materialresources. Measures of uncertainty around each area’s deprivation score are provided.
For the first time, Carstairs deprivaton scores have been provided at datazone and out-put area level. Both these areas types are smaller than postcode sectors and enable smallpockets of extreme deprivation to be captured. Traditionally, area-based deprivation at thedatazone level has been captured using the SIMD. The SIMD combines a number of (mainly)non-census indicators across a number of domains. This report compares Carstairs depriva-tion scores at datazone level with the SIMD. Despite some differences in the geographicalconstruction of census datazones and SIMD datazones, findings suggest that there is reason-ably good agreement between the two approaches in terms of areas falling into equivalentquintiles of deprivation.
Page 31 - Carstairs Scores from the 2011 Census

MRC/CSO Social and Public Health Sciences Unit, University of Glasgow
Carstairs deprivation scores remain an important measure of area level material depriva-tion. The production of Carstairs deprivation scores in 2011 at postcode sector level ensurescontinuity over time, while the inclusion of scores at datazone and output area level allowsusers to analyse levels of deprivation at much smaller area levels than previously.
Page 32 - Carstairs Scores from the 2011 Census

MRC/CSO Social and Public Health Sciences Unit, University of Glasgow
References
Carstairs, V. and Morris, R. (1989). Deprivation: explaining differences in mortality betweenScotland and England and Wales, BMJ: British Medical Journal 299(6704): 886.
Carstairs, V. and Morris, R. (1991). Deprivation and health in Scotland, Aberdeen UniversityPress, Aberdeen, UK.
Farmer, J. C., Baird, A. G. and Iversen, L. (2001). Rural deprivation: reflecting reality, TheBritish Journal of General Practice 51(467): 486.
Martin, D., Brigham, P., Roderick, P., Barnett, S. and Diamond, I. (2000). The (mis)representation of rural deprivation, Environment and Planning A 32(4): 735–752.
McLoone, P. (1994). Carstairs scores for Scottish Postcode Sectors from the 1991 Census.Public Health Research Unit, University of Glasgow, UK.
McLoone, P. (2004). Carstairs scores for Scottish Postcode Sectors from the 2001 Census.MRC Social & Public Health Sciences Unit, University of Glasgow, UK.
Rose, D. and Pevalin, D. (2005). The National Statistics Socio-economic Classification:Origins, Development and Use, Basingstoke: Palgrave Macmillan.
Page 33 - Carstairs Scores from the 2011 Census

MRC/CSO Social and Public Health Sciences Unit, University of Glasgow
Appendix A
Table A1: Census tables used to calculate 2011 Carstairs scores
Census Table Census Table HeadingPopulation KS101SC Usual resident population
No car ownership CCO 004a 20141 Car or van availability
Male unemployment KS602SC Economic activity - Males
Overcrowding QS410SC Persons per room - People
Low social class CCO 004b 20111 NS-SeC of the HRP
1 These tables were commissioned from NRS and are for all people in households. Theyare available from Scotland’s Census website at http://www.scotlandscensus.gov.uk/ods-web/data-warehouse.html
Page 34 - Carstairs Scores from the 2011 Census

MRC/CSO Social and Public Health Sciences Unit, University of Glasgow
Appendix B
As in previous years, Carstairs deprivation scores have been provided for each postcodesector in Scotland (see file ‘Carstairs scores PS2011.csv’ which is available online alongsidethis report). True postcode sectors overlap council area boundaries so census postcodesectors are created which respect council area boundaries.11 In census output, postcodesectors that cross council areas are split and each is treated as a postcode sector in its ownright. For example, the postcode sector G46 7 is split across Glasgow City council area andEast Renfrewshire council area. Postcode sectors that are split are indicated by a ‘(part)’.Note that, where a postcode sector is split, knowledge of the council area is required so thatthe correct part-postcode sector can be identified. Carstairs deprivation scores will be madeavailable (on request) for ‘complete’ postcode sectors (i.e. those postcode sectors where splitparts have been merged). This may be useful in cases where the council area is unknown.
For the first time, Carstairs deprivation scores for 2011 are also provided at datazone (seefile ‘Carstairs scores DZ2011.csv’) and output area (see file ‘Carstairs scores OA2011.csv’)level. See Table A2 for a description of the data available at each area level.
11A postcode to 2011 output area (and 2011 output area to higher areas, including 2011 postcode sectors)lookup table is provided at http://www.gro-scotland.gov.uk/geography/geo-prods/census-datasets/2011-census/2011-indexes/index.html
Page 35 - Carstairs Scores from the 2011 Census

MRC/CSO Social and Public Health Sciences Unit, University of Glasgow
Table A2: Description of the data in the postcode sector (Carstairs scores PS2011.csv),datazone (Carstairs scores DZ2011.csv) and output area (Carstairs scores OA2011.csv) files
Column heading Description
A Postcode Sector/Datazone/Output Area Census geographical area
B Health Board 2014 Health Board Area
C Council Area 2011 Council Area1
D Total population 2011 Census population count
E People in households 2011 Census household population count
F People in communal establishments 2011 Census communal establishment resident count
G Quintile Population-weighted quintiles
H Decile Population-weighted deciles
I DEPCAT Carstairs DEPCATs
J Most deprived 15% Indicator for the most deprived 15% of the population
K Least deprived 15% Indicator for the least deprived 15% of the population
L Total population weight Area population / Total population of Scotland
M % Overcrowding Percentage of overcrowding in area
N % Male Unemployment Percentage of male unemployment in area
O % No Car Percentage of no car ownership in area
P % Low Social Class Percentage of low social class in area
Q Z-score overcrowding z-score for overcrowding
R Z-score male unemployment z-score for male unemployment
S Z-score no car z-score for no car ownership
T Z-score low social class z-score for low social class
U Carstairs score 2011 Carstairs scores
V Lower 95% uncertainty bound Based on varying the weights attached to each variable
W Upper 95% uncertainty bound Based on varying the weights attached to each variable
X Lower 95% confidence interval Uncertainty due to population size
Y Upper 95% confidence interval Uncertainty due to population size
Z PS Code Unique postcode sector identifier (PS file only)
AA PS Name Postcode sector in 2011 census format (PS file only)
1 Note that in the datazone (Carstairs scores DZ2011.csv) file three census datazones do not fall neatly into one single council area.The datazones are S01003502, S01001422 and S01000215. For each of these datazones the council area listed is the one where mostcensus output areas within the datazones lie. For S01003502, four output areas lie in North Lanarkshire and nine in Glasgow cityso Glasgow city is listed as the council area. For S01001422 one output area lies in East Renfrewshire and four in East Ayrshireso East Ayrshire is listed as the council area. For S01000215 one output area lies in Aberdeenshire and eight in Aberdeen city soAberdeen city is listed as the council area.
Page 36 - Carstairs Scores from the 2011 Census

MRC/CSO Social and Public Health Sciences Unit, University of Glasgow
Appendix C
Table A3: The distribution of Carstairs deprivation scores in 2011 for postcode sectors
Postcode Sectors Total Population
Score Range Number % Cumulative % Number % Cumulative %
Low (−8,−7] 3 0.30 0.30 266 0.01 0.01
levels of (−7,−6] 14 1.38 1.68 20,167 0.38 0.39
deprivation (−6,−5] 54 5.33 7.01 201,424 3.80 4.19
(−5,−4] 92 9.09 16.1 389,383 7.35 11.54
(−4,−3] 121 11.96 28.06 487,301 9.20 20.74
(−3,−2] 135 13.34 41.4 569,288 10.75 31.49
(−2,−1] 117 11.56 52.96 613,616 11.59 43.08
(−1, 0] 103 10.18 63.14 583,242 11.01 54.09
(0, 1] 90 8.89 72.03 608,179 11.49 65.58
(1, 2] 72 7.11 79.14 512,712 9.68 75.26
(2, 3] 59 5.83 84.97 408,342 7.71 82.97
(3, 4] 41 4.05 89.02 243,063 4.59 87.56
(4, 5] 29 2.86 91.88 177,873 3.36 90.92
(5, 6] 25 2.47 94.35 156,107 2.95 93.87
(6, 7] 16 1.58 95.93 101,507 1.92 95.79
(7, 8] 9 0.89 96.82 59,054 1.12 96.91
(8, 9] 10 0.99 97.81 47,002 0.89 97.80
(9, 10] 11 1.09 98.90 63,732 1.20 99.00
(10, 11] 4 0.40 99.30 20,356 0.38 99.38
High (11, 12] 4 0.40 99.70 19,657 0.37 99.75
levels of (12, 13] 2 0.20 99.90 7,341 0.14 99.89
deprivation (13, 14] 1 0.10 100.00 5,791 0.11 100.00
1,012 100.00 5,295,403 100.00
Page 37 - Carstairs Scores from the 2011 Census

MRC/CSO Social and Public Health Sciences Unit, University of Glasgow200 Renfield Street,Glasgow, G2 3QB
Tel: 0141 353 7500 email: [email protected] University Unit funded by the Medical Research Council and the Chief Scientist Office of the Scottish Government Health Directorates, at the University of Glasgow.