Understanding PSAT 10 Scores 2017 | SAT Suite of ...
20
PSAT ™ 10 Understanding Scores 2017
-
Upload
khangminh22 -
Category
Documents
-
view
3 -
download
0
Transcript of Understanding PSAT 10 Scores 2017 | SAT Suite of ...

PSAT™ 10 Understanding Scores
2017

2
Contact Us About the College Board The College Board is a mission-driven not-for-profit organization that connects students to college success and opportunity. Founded in 1900, the College Board was created to expand access to higher education. Today, the College Board’s membership is made up of over 6,000 of the world’s leading educational institutions and is dedicated to promoting excellence and equity in education. Each year, the College Board helps more than seven million students prepare for a successful transition to college through programs and services in college readiness and college success—including the SAT® and the Advanced Placement Program®. The organization also serves the education community through research and advocacy on behalf of students, educators, and schools. For further information, visit collegeboard.org.
About the PSAT 10 As one of the assessments in the College Board’s SAT Suite of Assessments, the PSAT™ 10 is designed to measure the skills and knowledge that current research shows are essential for college and career readiness and success. The PSAT 10 covers the same content areas as the PSAT/NMSQT®. Both the PSAT/NMSQT and the PSAT 10 serve as a check-in on student progress to help pinpoint areas for development. Educational Testing Service (ETS) administers the PSAT 10 for the College Board.
Contacts for Parents and Students [email protected]
866-433-7728+1-212-713-8105 (International)609-882-4118 (TTY)8 a.m. to 4 p.m. ET, Mon.–Fri.
General Contacts PSAT 10 P.O. Box 6720 Princeton, NJ 08541-6720
610-290-8979
Contacts for Educators* [email protected]
888-477-PSAT (7728)
for educators only+1-212-237-1335 (International)609-882-4118 (TTY)8 a.m. to 8 p.m. ET, Mon.–Fri.
*If your state provided theassessment as part of a statewidetesting initiative, use the contactinformation provided in your statetesting materials.

The PSAT 10 and the SAT Suite of Assessments
What is the SAT Suite of Assessments? The SAT Suite of Assessments is a group of assessments beginning with the PSAT™ 8/9 (grades 8 and 9), continuing through the PSAT 10 and the PSAT/NMSQT® (grades 10 and 11), and culminating in the SAT (grades 11 and 12). Together, these assessments measure a student’s college and career readiness from grades 8–12. The tests reflect the kinds of meaningful, engaging, and challenging work that students find in the best middle and high school courses taught today, creating and sustaining a durable bond between assessment and instruction that provides the backbone of a sound education.
What does the PSAT 10 measure? The PSAT 10 measures the knowledge andskills that research shows are most essential for college and career readiness and success. Theassessment includes the Reading Test, the Writingand Language Test, and the Math Test. A student’sscores on the Reading Test and the Writing andLanguage Test are combined to arrive at a sectionscore for Evidence-Based Reading and Writing.The Math Test score is also reported as a secondsection score. For complete test specifications,visit sat.org/k12.
How is the PSAT 10 scored? First, the student’s raw score is computed as the number of questions correctly answered. The scores included on score reports are based on raw scores. There’s no penalty for guessing, so nothing is deducted for incorrect answers or for unanswered questions.
Next, the raw score is converted to a scaled score of 160 to 760. This conversion process adjusts for slight differences in difficulty among versions of the test and provides a score that is equated, or consistent, across forms. This process ensures that no student receives an advantage or disadvantage from taking a particular form of the test on a particular day; a score of 400 on one test form is equivalent to a score of 400 on another test form. Go to psat.org/resources to see the score conversion table for the 2017 PSAT 10.
How can I use the student score report? The student score report clearly summarizes the student’s current achievement levels and offers guidance and appropriate next steps to increase college and career readiness. As you look through the report with your student, here is some information you will want to share:
Check-in: On Track for College Readiness?
§ Grade-level benchmarks show how students are progressing toward college readiness.
§ Use benchmark attainment, provided for each section score, to have a conversation with your student about college readiness and the sort of continued work they need to start doing now to prepare for college success.
§ If you have a student who is right on track, remind them to continue to take rigorous courses and work hard to stay on track.
§ If you have a student who is not meeting the benchmark, connect the student to classroom work that is focused on areas of weakness, and with Khan Academy® to supplement this work.
1

Evaluate Relative Strengths and Weaknesses:
§ Test scores, cross-test scores, and subscores provide an opportunity to evaluate a student’s relative strengths and weaknesses and highlight specific opportunities to strengthen the student’s college readiness skills.
§ Use the red/yellow/green coding on test scores and subscores to evaluate how your student is performing relative to other students who are meeting/exceeding the benchmark.
§ Highlight the areas in green as thestudent’s strengths.
§ Prioritize the areas that are furthest into the red for additional instruction and deliberate practice.
Define Next Steps — Actions to Support Skills:
The “Your Scores: Next Steps” page identifies thespecific skills that the student should address.
§ Work with your student to identify activities that could be used to develop each of the skills identified for focus and improvement.
§ Encourage your student to go online for more details and to link their College Board account to Khan Academy to strengthen skills and to evaluate progress against the skills listed.
§ For further guidance on interpreting score reports, see the Professional Development modules for K–12 educators at sat.org/k12.
Score-Reporting Features On pages 11–16 of this booklet, you’ll find a guide tothe score report, followed by a sample score report.The guide includes detailed explanations of theinformation that students receive about their collegereadiness skills. Students can access their online reports to obtain more information and guidance,including powerful Khan Academy instruction andpractice based on their results.
In addition, k12reports.collegeboard.org, the online reporting portal, offers you an array of powerful tools to assess your students’ progress and plan instruction that delivers what they need. The tools include:
§ Flexible reports that can be sorted and filtered by key demographics;
§ Instructional planning support using test subscores in specific content areas, benchmarks, information for cross-subject tasks, and data for prescribing interventions when students are behind;
§ Access to the AP Potential™ tool to pinpoint students who are likely to succeed in more challenging courses.
2

The PSAT 10 Scores
PSAT 10 Total Scores The total score shown in the report reflects thecombination (addition) of the Evidence-BasedReading and Writing section score (160–760) withthe Math section score (160–760). The reportedrange for the PSAT 10 total score is 320–1520.
Nationally representative percentiles shown in this booklet are derived from a research study.
User group percentiles are derived from students in the 10th grade who took the PSAT/NMSQT or the PSAT 10 administered in 2015-16.
PSAT 10 Section Scores Your students will receive two section scores, bothin the range of 160–760:
§ Evidence-Based Reading and Writing
§ Math
These scores reflect students’ overall performance in each section. The Evidence-Based Reading and Writing section score is a combination of the Reading Test score and the Writing and Language Test score. The Mathsection score is derived from the Math Test score (including both the Math Test – Calculator and Math Test – No Calculator portions).
PSAT 10 Test Scores and Cross-Test Scores In addition to the total and section scores, studentswill see three test scores in the range of 8–38,reflecting performance on the content covered ineach of the tests:
§ Reading
§ Writing and Language
§ Math
Students will also see two cross-test scores in the range of 8–38. These scores represent studentperformance on items across the three tests thatfall in the following two domains:
§ Analysis in History/Social Studies
§ Analysis in Science
PSAT 10 Subscores Finally, students receive subscores in the range of1–15 that offer feedback on their performance inthe following skill areas:
§ Command of Evidence
§ Words in Context
§ Expression of Ideas
§ Standard English Conventions
§ Heart of Algebra
§ Problem Solving and Data Analysis
§ Passport to Advanced Math
Standard Error of Measurement PSAT 10 scores should be interpreted asranges rather than points. The standard error ofmeasurement (SEM) indicates that a student whotook different forms of the test under identical conditions would be likely to earn scores withinthe range of the SEM on those different forms.The SEM is 46.25 for the total score, 26.24 forthe Evidence-Based Reading and Writing sectionscore, and 38.08 for the Math section score.
3

Score Scales and Score Changes
How can PSAT 10 scores be used to project SAT scores? The full SAT Suite—from PSAT 8/9 through theSAT—uses a common score scale for the total (240–1600), section (120–800), and test andcross-test scores. The ranges reported for eachassessment reflect grade-level appropriatenesswithin the common scale. Thus, while the totalrange for the SAT is 400–1600, the total range forthe PSAT 10 is 320–1520.
This common score scale means that a student who took the PSAT 10 and received a Math section score of 500 would be expected to also get a500 on the SAT or the PSAT 8/9 if that studenthad taken either of those tests on that same day; a score of 500 represents the same level ofacademic achievement on all three assessments.
This also means that student growth is easy to seeacross the full suite. If a student takes the PSAT 10 this year and receives a 500 Math section score,and then takes the SAT next year and earns a 550Math section score, that student has shown agrowth of 50 points, which likely resulted from hardwork both in and out of school.
Encourage students to focus on the section scoresif they are curious about what growth in theirscores they can expect to see over the next year.They should look at the set of projected scoreranges provided (only in online score reports) forstudents who reflect typical growth. Of course,a student’s individual growth will be shaped bythe courses taken and the practice undertakenbetween assessments.
Subscores are not on a vertical scale, and thereforecomparing performance year after year should bedone based on relative performance rather than bycalculating student growth across tests.
Students who wish to improve their performanceon the SAT should follow these guidelines:
§ Develop academic skills throughchallenging coursework.
§ Read extensively and develop strongwriting skills.
§ Engage in deliberate practice in the threemath areas that are emphasized the mostin the assessments.
§ Take practice tests and upload their results to Khan Academy for personalized practice of the skills they need to improve. To learn more, go to collegeboard.org/psatpractice.
4

Benchmarks and Red/Yellow/GreenPerformance
What are the PSAT 10 college and career readiness benchmarks? The SAT Suite offers grade-level benchmarks thatcan be used to gauge whether students are ontrack for becoming college ready each year fromgrade 8 to grade 12. College and career readinessbenchmarks represent the section scores on eachassessment that students should meet or exceed to be considered on track to be college ready.
The college and career readiness benchmarks areincluded in assessment reporting to help studentsunderstand their level of readiness for collegeand career training programs. The benchmarkshelp educators better understand how manyand also which students are on track to have the skills necessary for college-entry, credit-bearingcourses. Equipped with this information, educatorscan support students who need extra help whilethere is still time for improvement. Teachers canalso accelerate the progress of students who meetor exceed the benchmarks.
Recommended Uses College and career readiness benchmarks canhelp educators:
§ Identify students who are on track for success in college and career readiness.
§ Identify students who may need extra support while there is still time for improvement.
§ Find students who may be ready for more challenging coursework.
College and career readiness benchmarksshould not be used to assign academic tracks,to discourage students from pursuing college,or to keep students from participating inchallenging courses.
Rather, the benchmarks are to be used to help allstudents better prepare for life after high school bytaking courses that are aligned with their progressthus far and engaging in deep practice of theknowledge and skills that matter most for college.
How are the benchmarks calculated? The college and career readiness benchmarksfor the 2016-17 SAT predict a 75% likelihood ofachieving at least a C in a set of first-semester,credit-bearing college courses. The benchmarksare set at the section level, so there is a benchmarkfor Evidence-Based Reading and Writing and abenchmark for Math. The PSAT 8/9, PSAT 10,PSAT/NMSQT, and SAT benchmarks are determinedby observing how students grow from year to yearand by adjusting the SAT benchmark by using theaverage rate of progress.
PSAT 10 College and Career Readiness Benchmarks
Evidence-Based Reading and Writing Math
430 480
5

What additional information is provided to help understand progress toward college readiness? The student score report provides further contextfor understanding scores by showing a color-coded bar chart for students’ section scores. For students who met or exceeded the benchmark,the score will be in the green portion of the scoreband. If students did not meet the benchmark but were close (within one year’s growth), theirscore will be found in the yellow portion. Studentswho score more than a year’s growth below thegrade-level benchmark will see their score inthe red portion of the score band. Additionally,for each of the test scores and subscores, wehave provided a color-coded guide to a student’srelative strengths and weaknesses. The colors oneach of these score scales represent the typicalperformance of students in their grade who met(green), approached (yellow), or were further away(red) from the benchmark.
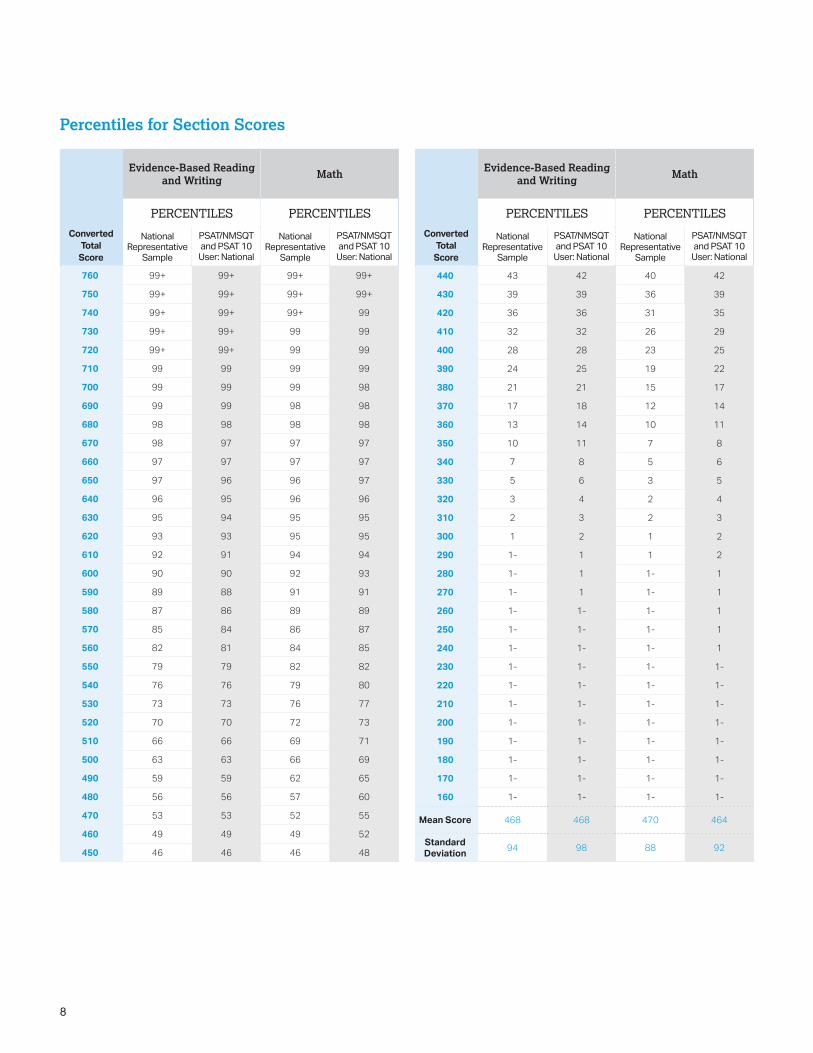
Percentiles
Percentile ranks represent the percentage ofstudents who score equal to or below the scorethe student obtained. For the total scores and the section scores, percentile ranks are providedbased on two different reference populations. Onboth the paper and online score reports, studentsreceive a nationally representative percentile rank.On the online score report, students also receivea user group percentile rank based on typical testtakers.
Nationally representative percentiles are derived via a research study sample of U.S. students in thestudent’s grade (10th), weighted to represent allU.S. students in that grade, regardless of whetherthey typically take the PSAT 10. For example, astudent’s score in the 75th percentile means that75% of the nationally representative group of U.S.students in the same grade would have had scoresat or below that student’s score.
User group percentiles are derived from students in the student’s grade (10th) who tested in the falladministration of the PSAT/NMSQT. A student’sscore in the 75th percentile means that 75% ofthe user group of U.S. students in the samegrade would have had scores at or below thatstudent’s score.
6

7
Percentiles for Total Scores
Converted Total Score
National Representative
Sample
PSAT/NMSQT and PSAT 10
User: National
1520 99+ 99+1510 99+ 99+1500 99+ 99+1490 99+ 99+1480 99+ 99+1470 99+ 99+1460 99+ 99+1450 99+ 99+1440 99+ 99+1430 99+ 99+1420 99 991410 99 991400 99 991390 99 991380 99 991370 99 991360 99 991350 98 981340 98 981330 98 981320 98 981310 97 971300 97 971290 97 971280 97 971270 96 961260 96 961250 95 951240 95 951230 94 941220 94 941210 93 931200 92 921190 91 921180 91 911170 90 901160 89 891150 88 881140 87 871130 86 861120 84 851110 83 83
Converted Total Score
National Representative
Sample
PSAT/NMSQT and PSAT 10
User: National
1100 82 821090 81 811080 79 791070 78 781060 76 761050 75 751040 73 731030 71 721020 69 701010 67 681000 65 66990 63 65980 62 63970 60 61960 58 59950 56 57940 54 55930 52 53920 50 51910 48 49900 46 47890 44 45880 42 43870 40 40860 38 38850 36 36840 33 34830 31 32820 28 30810 26 27800 24 25790 22 23780 19 21770 17 19760 15 17750 13 15740 11 13730 9 11720 8 10710 6 8700 5 7690 4 6
Converted Total Score
National Representative
Sample
PSAT/NMSQT and PSAT 10
User: National
680 3 5670 2 4660 2 3650 1 3640 1 2630 1 2620 1 2610 1- 1600 1- 1590 1- 1580 1- 1570 1- 1560 1- 1550 1- 1540 1- 1-530 1- 1-520 1- 1-510 1- 1-500 1- 1-490 1- 1-480 1- 1-470 1- 1-460 1- 1-450 1- 1-440 1- 1-430 1- 1-420 1- 1-410 1- 1-400 1- 1-390 1- 1-380 1- 1-370 1- 1-360 1- 1-350 1- 1-340 1- 1-330 1- 1-320 1- 1-
Mean Score 939 933
Standard Deviation 170 176
8
Percentiles for Section Scores
Converted Total
Score
Evidence-Based Reading and Writing Math
PERCENTILES PERCENTILES
National Representative
Sample
PSAT/NMSQT and PSAT 10
User: National
National Representative
Sample
PSAT/NMSQT and PSAT 10
User: National
760 99+ 99+ 99+ 99+
750 99+ 99+ 99+ 99+
740 99+ 99+ 99+ 99
730 99+ 99+ 99 99
720 99+ 99+ 99 99
710 99 99 99 99
700 99 99 99 98
690 99 99 98 98
680 98 98 98 98
670 98 97 97 97
660 97 97 97 97
650 97 96 96 97
640 96 95 96 96
630 95 94 95 95
620 93 93 95 95
610 92 91 94 94
600 90 90 92 93
590 89 88 91 91
580 87 86 89 89
570 85 84 86 87
560 82 81 84 85
550 79 79 82 82
540 76 76 79 80
530 73 73 76 77
520 70 70 72 73
510 66 66 69 71
500 63 63 66 69
490 59 59 62 65
480 56 56 57 60
470 53 53 52 55
460 49 49 49 52
450 46 46 46 48
Converted Total
Score
Evidence-Based Reading and Writing Math
PERCENTILES PERCENTILES
National Representative
Sample
PSAT/NMSQT and PSAT 10
User: National
National Representative
Sample
PSAT/NMSQT and PSAT 10
User: National
440 43 42 40 42
430 39 39 36 39
420 36 36 31 35
410 32 32 26 29
400 28 28 23 25
390 24 25 19 22
380 21 21 15 17
370 17 18 12 14
360 13 14 10 11
350 10 11 7 8
340 7 8 5 6
330 5 6 3 5
320 3 4 2 4
310 2 3 2 3
300 1 2 1 2
290 1- 1 1 2
280 1- 1 1- 1
270 1- 1 1- 1
260 1- 1- 1- 1
250 1- 1- 1- 1
240 1- 1- 1- 1
230 1- 1- 1- 1-
220 1- 1- 1- 1-
210 1- 1- 1- 1-
200 1- 1- 1- 1-
190 1- 1- 1- 1-
180 1- 1- 1- 1-
170 1- 1- 1- 1-
160 1- 1- 1- 1-
Mean Score 468 468 470 464
Standard Deviation 94 98 88 92

9
Reading Test
SECTION 1
1 C2 A3 B4 B5 D6 D7 B8 C9 A
10 D11 D12 B13 A14 A15 B16 B17 B18 D19 C20 D21 B22 B23 C24 D25 B26 C27 A28 D29 A30 D31 B32 A33 A34 B35 A36 D37 C38 C39 B40 D41 C42 C43 A44 C45 B46 C47 D
Writing and Language Test
SECTION 2
1 D2 A3 C4 D5 B6 D7 B8 B9 C
10 C11 C12 B13 A14 C15 A16 B17 A18 A19 B20 D21 C22 D23 A24 B25 C26 D27 B28 B29 D30 A31 B32 D33 C34 A35 D36 D37 D38 C39 D40 C41 C42 A43 B44 B
Math Test - Calculator
SECTION 4
1 C2 D3 D4 B5 A6 C7 B8 D9 B
10 A11 B12 C13 C14 D15 C16 B17 D18 A19 B20 A21 B22 C23 A24 B25 A26 A27 D28 1029 1230 145831 211, 212
Math Test - No Calculator
SECTION 3
1 B2 C3 B4 C5 C6 A7 A8 D9 A
10 D11 B12 C13 D14 415 216 U17 20
U = This question will not be scored.
2017 PSAT 10 Answer Key

Score ConversionShows how raw scores are converted into test scores, cross-test scores, and subscores.
Important to note
§ A student’s section score for the Evidence-Based Reading and Writing section is calculated by adding their Reading Test score to their Writing and Language Test score and multiplying that figure by 10.
§ A student’s section score for the Math section is calculated by multiplying their Math Test score by 20.
Raw Score (# of correct
answers)
Reading Test Score
Writing and Language Test Score
Math Test Score
47* 38 3846 38 37.545 37 3744 37 38 36.543 36 38 3642 36 38 3541 35 37 3440 35 37 3339 34 36 32.538 33 35 31.537 33 34 3136 32 34 30.535 31 33 3034 30 32 29.533 30 31 2932 29 31 28.531 28 30 28.530 28 30 2829 27 29 27.528 27 28 2727 26 28 26.526 26 27 2625 25 27 25.524 25 26 25.523 24 26 2522 24 25 24.521 23 24 2420 22 23 23.519 22 23 2318 21 22 22.517 21 21 2216 20 20 21.515 19 19 2114 19 18 2013 18 18 19.512 18 17 1911 17 16 18.510 17 16 17.59 16 15 178 16 14 167 15 14 156 14 13 145 13 12 134 12 12 123 11 11 112 10 10 101 9 9 90 8 8 8
* Due to the unscored question (see page 9), the highest possible Raw Score for Math is 47.
10
2017 PSAT 10

11
Your Evidence-Based Reading and Writing Score Your Math Score
Your Total Score
160 to 760
320 to 1520
Your Nationally Representative
Your Nationally Representative
Sample Percentile
Sample Percentile
Keep in mind, the PSAT™10, PSAT/NMSQT®,
and SAT® are on the same scale.
Your score shows you how you would have scored that day on the PSAT/NMSQT and SAT. How well you do depends on what
you do next!
The College and Career Readiness Benchmark
Test Scores 8 to 38 range* Subscores 1 to 15 range*
*The red, yellow, and green ranges in the test scores and subscores reflect your areas of strengths and weaknesses compared to the typical performance of students in your grade.
Reaching your grade-level benchmark means that you are likely on track to be ready for select first-year, credit-bearing college courses.
Need to strengthen skills Approaching Benchmark Meet or exceed Benchmark
Cross-Test Scores 8 to 38 range*
If a student were to take the same test repeatedly (with no new learning), the standard deviation of the student’s repeated test scores is called the standard error of measurement (SEM). Your score range is computed as your score +/- SEM. For PSAT 10, these ranges are approximately:
Total Score: Your score ± 40 points.Evidence-Based Reading and Writing Section Score: Your score ± 25 points.Math Section Score: Your score ± 33 points. Test Scores and Cross-Test Scores: Your score ± 2 points. Subscores: Your score ± 1 to 2 points.
Remember that you will receive scores in the same areas when you take the PSAT/NMSQT and SAT.
8 23 38
1 8 15
8
8
8
160 160760 760
38
38
38
15
15
15
15
15
15
15
1
1
1
1
1
1
1
Your Nationally Representative
Sample Percentile
160 to 760
THE BENCHMARK IS 430
YOUR SCORE IS 410
THE BENCHMARK IS 430
YOUR SCORE IS 530
THE BENCHMARK IS 480
410 940 53032nd 76th54th
Stay on track and continue your progress. Choose to share your scores on satpractice.org to receive free, personalized practice recommendations.
Let’s get you back on track, so you won’t have to take noncredit courses in college. Choose to share your scores on satpractice.org to receive free, personalized practice recommendations.
Your scores indicate you are close to being on track for college readiness, but you need to continue to strengthen your skills.
You are on track for college readiness.
23
18 8
6
6
9
12
2225
6
6
26.5
Ima B. StudentSpring 2017, Grade: 10th Grade, Student ID: 24068907
Reading
Writing and Language
Math
Analysis in History/Social Studies
Analysis in Science
Command of Evidence
Words in Context
Expression of Ideas
Heart of Algebra
Standard English Conventions
Problem Solving and Data Analysis
Passport to Advanced Math
What Are Ima’s Scores?Ima’s Evidence-Based Reading and Writing score is 410 and her Math score is 530. In Evidence-Based Reading and Writing, Ima’s score is approaching the benchmark, but she is not quite on track for college readiness. In Math, however, Ima is exceeding the benchmark and is on track. Test scores, cross-test scores, and subscores can give Ima a better understanding of the areas she needs to work on.
What Are Her Score Percentiles?Since Ima is in the 10th grade, the percentiles compare her scores with those of all 10th graders in the nation. In Evidence-Based Reading and Writing, Ima scored as well as or better than 32% of a nationally representative group of sophomores. In Math, she scored as well as or better than 76% of a nationally representative group of sophomores. Additional percentiles are available in Ima’s online score report.
How Will Ima Do on the SAT?The PSAT 10 and the SAT are scored on a common scale; therefore, if Ima had taken the SAT instead of the PSAT 10 on the same test date, she would have received the same score. When Ima takes the SAT, she will likely have had additional learning from school and practice. Her PSAT 10 results can help Ima focus her efforts in high school to be better prepared for the SAT.
What Are Her Score Ranges?No test measures precisely what someone knows, and many factors can affect results. That is why test makers think of each score as a range that extends from a few points below to a few points above the score earned.
Score Report (Page 1 of 3)
A Case Study: Ima B. Student’s PSAT 10 Score Report Take a look at Ima B. Student’s sample score report below and on the next page. Use the corresponding information to help you interpret your student’s PSAT 10 Score Report. (Note: The figures shown here are samples and do not necessarily correspond to actual results.)
The PSAT 10 Score Report

12
Reading
Que
stio
n #
Cor
rect
Your
Ans
wer
Diff
icul
ty
Subs
core
Cro
ss-T
est
Scor
e
1
2
3
4
5
6
7
8
9
10
11
12
13
14
15
16
17
18
19
20
21
22
23
24
25
26
27
28
29
30
31
32
33
34
35
36
37
38
39
40
41
42
43
44
45
46
47
Writing and Language
Que
stio
n #
Cor
rect
Your
Ans
wer
Diff
icul
ty
Subs
core
Cro
ss-T
est
Scor
e
1
2
3
4
5
6
7
8
9
10
11
12
13
14
15
16
17
18
19
20
21
22
23
24
25
26
27
28
29
30
31
32
33
34
35
36
37
38
39
40
41
42
43
44
Math Test – Calculator
Que
stio
n #
Cor
rect
Your
Ans
wer
Diff
icul
ty
Subs
core
Cro
ss-T
est
Scor
e
14
15
16
17
Que
stio
n #
Cor
rect
Your
Ans
wer
Diff
icul
ty
Subs
core
Cro
ss-T
est
Scor
e
28
29
30
31
Math Test – No Calculator
Que
stio
n #
Cor
rect
Your
Ans
wer
Diff
icul
ty
Subs
core
Cro
ss-T
est
Scor
e
1
2
3
4
5
6
7
8
9
10
11
12
13
14Q
uest
ion
#
Cor
rect
Your
Ans
wer
Diff
icul
ty
Subs
core
Cro
ss-T
est
Scor
e
15
16
17
18
19
20
21
22
23
24
25
26
27
Que
stio
n #
Cor
rect
Your
Ans
wer
Diff
icul
ty
Subs
core
Cro
ss-T
est
Scor
e
1
2
3
4
5
6
7
Que
stio
n #
Cor
rect
Your
Ans
wer
Diff
icul
ty
Subs
core
Cro
ss-T
est
Scor
e
8
9
10
11
12
13
See the questions, and the answer explanations, onlinestudentscores.collegeboard.org
SubscoreCOE Command of Evidence
WIC Words in Context
EOI Expression of Ideas
SEC Standard English Conventions
HOA Heart of Algebra
PSD Problem Solving and Data Analysis
PAM Passport to Advanced Math
Cross-Test Score:HSS Analysis in History/Social Studies
SCI Analysis in Science
Key:Correct
Ø Omitted
U Unscorable■ ■ ■ Easy■ ■ ■ Medium■ ■ ■ Hard
© 2017 The College Board. College Board, AP, SAT, and the acorn logo are registered trademarks of the College Board. PSAT is a trademark owned by the College Board. PSAT/NMSQT is a registered trademark of the College Board and National Merit Scholarship
Corporation. Visit the College Board on the web: collegeboard.org.
Khan Academy is a registered trademark in the United States and other jurisdictions.
Your Question-Level Feedback
A ■ ■ ■
B A ■ ■ ■ COE
B A ■ ■ ■
B ■ ■ ■ WIC
C A ■ ■ ■
D ■ ■ ■
B Ø ■ ■ ■ COE
A ■ ■ ■ WIC
D ■ ■ ■ WIC
A C ■ ■ ■ HSS
D C ■ ■ ■ WIC HSS
D B ■ ■ ■ WIC HSS
D A ■ ■ ■ COE HSS
A C ■ ■ ■ HSS
C B ■ ■ ■ COE HSS
B C ■ ■ ■ HSS
D C ■ ■ ■ HSS
B D ■ ■ ■ HSS
A ■ ■ ■ SCI
C ■ ■ ■ SCI
B D ■ ■ ■ COE SCI
D ■ ■ ■ SCI
B ■ ■ ■ SCI
D ■ ■ ■ WIC SCI
C ■ ■ ■ WIC SCI
B ■ ■ ■ SCI
B C ■ ■ ■ SCI
A C ■ ■ ■ COE SCI
D ■ ■ ■ WIC HSS
B A ■ ■ ■ HSS
D ■ ■ ■ COE HSS
A ■ ■ ■ HSS
C ■ ■ ■ COE HSS
A B ■ ■ ■ WIC HSS
A B ■ ■ ■ HSS
C A ■ ■ ■ HSS
B C ■ ■ ■ HSS
C D ■ ■ ■ HSS
C ■ ■ ■ SCI
C ■ ■ ■ SCI
B ■ ■ ■ SCI
B Ø ■ ■ ■ COE SCI
A B ■ ■ ■ SCI
A ■ ■ ■ WIC SCI
A ■ ■ ■ SCI
D A ■ ■ ■ COE SCI
C B ■ ■ ■ SCI
D C ■ ■ ■ SEC
B ■ ■ ■ EOI HSS
C D ■ ■ ■ SEC
C A ■ ■ ■ SEC
B D ■ ■ ■ SEC
B D ■ ■ ■ COE, EOI HSS
A D ■ ■ ■ WIC, EOI HSS
B C ■ ■ ■ EOI HSS
A B ■ ■ ■ WIC, EOI HSS
D ■ ■ ■ SEC
D ■ ■ ■ COE, EOI HSS
B ■ ■ ■ SEC
C ■ ■ ■ SEC
C B ■ ■ ■ SEC
D ■ ■ ■ WIC, EOI SCI
B A ■ ■ ■ SEC
B D ■ ■ ■ SEC
A Ø ■ ■ ■ EOI SCI
B C ■ ■ ■ EOI SCI
C D ■ ■ ■ COE, EOI SCI
A ■ ■ ■ COE, EOI SCI
A B ■ ■ ■ WIC, EOI SCI
C B ■ ■ ■ WIC, EOI
D C ■ ■ ■ SEC
C D ■ ■ ■ SEC
A Ø ■ ■ ■ COE, EOI
A ■ ■ ■ EOI
B ■ ■ ■ COE, EOI
D ■ ■ ■ WIC, EOI
C B ■ ■ ■ SEC
D A ■ ■ ■ EOI
B Ø ■ ■ ■ SEC
D ■ ■ ■ SEC
D B ■ ■ ■ EOI
D ■ ■ ■ SEC
B A ■ ■ ■ EOI
C D ■ ■ ■ COE, EOI
A ■ ■ ■ SEC
C ■ ■ ■ SEC
D A ■ ■ ■ WIC, EOI
D B ■ ■ ■ SEC
A C ■ ■ ■ SEC
C B ■ ■ ■ COE, EOI
B C ■ ■ ■ WIC, EOI
B ■ ■ ■ PSD HSS
A ■ ■ ■ HOA
B ■ ■ ■ PSD SCI
D ■ ■ ■ HOA
B C ■ ■ ■ PSD
A ■ ■ ■ PSD
B ■ ■ ■ PSD
C ■ ■ ■ PSD
A Ø ■ ■ ■ PAM
D C ■ ■ ■ HOA
D ■ ■ ■ PSD HSS
A ■ ■ ■ PSD
B ■ ■ ■ PSD
C ■ ■ ■ PSD SCI
C ■ ■ ■
B ■ ■ ■ PSD HSS
D ■ ■ ■ PSD
B A ■ ■ ■ PSD HSS
C A ■ ■ ■ HOA
B D ■ ■ ■ PAM
B ■ ■ ■ HOA
D C ■ ■ ■ PAM
D B ■ ■ ■ HOA SCI
C B ■ ■ ■ PAM SCI
B A ■ ■ ■ PSD SCI
D Ø ■ ■ ■ PAM
D A ■ ■ ■ HOA
2 0 ■ ■ ■ HOA
90 80 ■ ■ ■ HOA
1 2 ■ ■ ■ PAM
0 1 ■ ■ ■ PAM
65 60 ■ ■ ■ HOA
0, 12 2 ■ ■ ■ PAM
1368 ■ ■ ■ PSD HSS
85 ■ ■ ■ PSD HSS
D B ■ ■ ■ PAM
A ■ ■ ■ PAM SCI
B A ■ ■ ■ PAM
C B ■ ■ ■ PAM
C ■ ■ ■ HOA
B ■ ■ ■ HOA SCI
A ■ ■ ■ HOA
B ■ ■ ■ HOA
C ■ ■ ■ HOA
D ■ ■ ■ HOA HSS
A ■ ■ ■
C B ■ ■ ■ PAM
B A ■ ■ ■ PAM
Access CodeA02670146P
Ima B. Student Spring 2017, Grade: 10th Grade
Score Report (Page 3 of 3)
SAT Practice Connect to Khan Academy for FREE, world-class SAT practice on satpractice.org.
Reading Test
Your Scores: Next StepsAdditional skills and improvement suggestions can be found in your online score report.
Writing and Language Test
Math Test
Your score indicates that you are already likely able to: Improve your skills by focusing on the following suggestions:
Get more next steps onlinestudentscores.collegeboard.org
AP and Course WorkSee which AP courses may be good matches for you.
Register for the SATSelect an SAT test date, and register for it now.
8 to 38
8 to 38
8 to 38
Ima B. Student Spring 2017, Grade: 10th Grade
23
18
26.5
Revise text as needed to improve the exactness or content appropriateness of word choices within somewhat challenging texts
Retain or add information or ideas to a piece of a text to support claims or points in somewhat challenging text
Revise somewhat challenging text to ensure that information is presented in the most logical order
Revise text as needed to improve the exactness or content appropriateness of word choices within somewhat challenging texts
Draw reasonable conclusions from somewhat challenging texts
Describe the overall structure of a somewhat challenging text
Identify claims and counterclaims explicitly stated in a somewhat challenging passage
Revise text as needed to improve the exactness or content appropriateness of word choices within somewhat challenging texts
Interpret a linear inequality in one variable with rational coefficients that represents a context. Select the equation of a line of best fit and interpret the slope and intercept of the line in the context of the situation (when a linear model is appropriate)
Interpret sample statistics understanding and use margin of error
Solve and interpret a quadratic function or equation that represents a context and requires multiple steps
Calculate and interpret frequency distributions using tables and other representational methods
Retain or add information or ideas to a piece of text to support claims or points in challenging text
Use a variety of sentence structures to accomplish a rhetorical purpose such as persuading an audience
Revise text as needed to improve the exactness or content appropriateness of word choices within challenging texts
Retain or add information or ideas to a piece of text to support claims or points in challenging text
Use a variety of sentence structures to accomplish a rhetorical purpose such as persuading an audience
Draw reasonable inferences and logical conclusions from challenging texts
Analyze information presented quantitatively in such forms as graphs, tables, and charts and relate that information to information presented in somewhat challenging text
Determine how the selection of specific words shapes meaning and tone in a challenging passage
Use a variety of sentence structures to accomplish a rhetorical purpose such as persuading an audience
Retain or add information or ideas to a piece of text to support claims or points in challenging text
Determine how a graph may be affected by a change to its equation
Determine the value of a constant or coefficient for an equation with no solution or infinitely many solutions
Using a specified model, make a prediction and compare the predicted values with the actual values in the data set
Within a context, compare the center of two separate data sets with different spreads
Determine whether two events are independent given their probabilities
Use a variety of sentence structures to accomplish a rhetorical purpose such as persuading an audience
Score Report (Page 2 of 3)
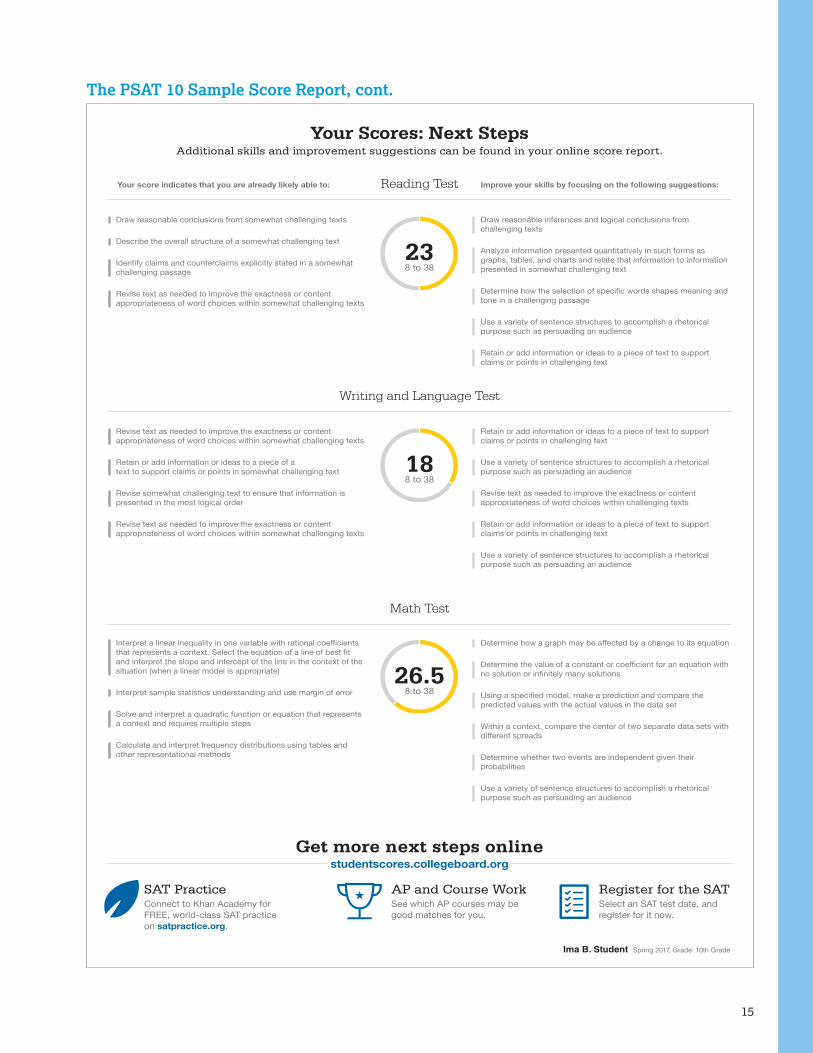
How Can Ima Improve Her Academic Skills?“Your Scores: Next Steps” are based on Ima’s test scores, and on the general skills that similarly performing students understand. Ima can see which skills she performed well on and those on which she needs to improve. When she goes online and logs in to the full report, she can see additional skills and improvement steps. Ima can also link her account to Khan Academy for personalized practice recommendations.
What Are Ima’s Next Steps?Under Get more next steps online, Ima is directed to studentscores.collegeboard.org to learn how to prepare for the SAT and to see her potential for AP® coursework.
When Should Ima Take the SAT?As a sophomore, Ima should begin planning when she will take the SAT. Most students take the SAT for the first time in their junior year. By planning now, Ima can ensure that she has adequate time to practice for the SAT. She can register for the test and take advantage of practice resources by visiting studentscores.collegeboard.org.
What Can We Learn fromIma’s Answers?
The score report is designed to be used with the student’s PSAT 10 test booklet. It lists all of Ima’s answers and allows her to see the correct answer and difficulty level for each question. Ima can use her online score report to review the questions she answered incorrectly or omitted and see detailed explanations of why her responses were correct or incorrect.

13
Your Score Report
Get your full report onlinestudentscores.collegeboard.org
SAT® PracticeConnect to Khan Academy® for FREE, world-class SAT practice
on satpractice.org.
AP® and Course WorkSee which AP courses may be good matches for you.
Register for the SAT Select an SAT test date, and
register for it now.
db
Hi,
School Name:Spring 2017, Grade:Student ID:Optional Code:Access Code:
Access Code
Ima B. Student
John F. Kennedy High School, School Code: 123456 10th Grade 24068907 00 A02670146P
A02670146P
The PSAT 10 Sample Score Report

14
Your Evidence-Based Reading and Writing Score Your Math Score
Your Total Score
160 to 760
320 to 1520
Your Nationally Representative
Your Nationally Representative
Sample Percentile
Sample Percentile
Keep in mind, the PSAT™10, PSAT/NMSQT®,
and SAT® are on the same scale.
Your score shows you how you would have scored that day on the PSAT/NMSQT and SAT. How well you do depends on what
you do next!
The College and Career Readiness Benchmark
Test Scores 8 to 38 range* Subscores 1 to 15 range*
*The red, yellow, and green ranges in the test scores and subscores reflect your areas of strengths and weaknesses compared to the typical performance of students in your grade.
Reaching your grade-level benchmark means that you are likely on track to be ready for select first-year, credit-bearing college courses.
Need to strengthen skills Approaching Benchmark Meet or exceed Benchmark
Cross-Test Scores 8 to 38 range*
If a student were to take the same test repeatedly (with no new learning), the standard deviation of the student’s repeated test scores is called the standard error of measurement (SEM). Your score range is computed as your score +/- SEM. For PSAT 10, these ranges are approximately:
Total Score: Your score ± 40 points.Evidence-Based Reading and Writing Section Score: Your score ± 25 points.Math Section Score: Your score ± 33 points. Test Scores and Cross-Test Scores: Your score ± 2 points. Subscores: Your score ± 1 to 2 points.
Remember that you will receive scores in the same areas when you take the PSAT/NMSQT and SAT.
8 23 38
1 8 15
8
8
8
160 160760 760
38
38
38
15
15
15
15
15
15
15
1
1
1
1
1
1
1
Your Nationally Representative
Sample Percentile
160 to 760
THE BENCHMARK IS 430
YOUR SCORE IS 410
THE BENCHMARK IS 430
YOUR SCORE IS 530
THE BENCHMARK IS 480
410 940 53032nd 76th54th
Stay on track and continue your progress. Choose to share your scores on satpractice.org to receive free, personalized practice recommendations.
Let’s get you back on track, so you won’t have to take noncredit courses in college. Choose to share your scores on satpractice.org to receive free, personalized practice recommendations.
Your scores indicate you are close to being on track for college readiness, but you need to continue to strengthen your skills.
You are on track for college readiness.
23
18 8
6
6
9
12
2225
6
6
26.5
Ima B. StudentSpring 2017, Grade: 10th Grade, Student ID: 24068907
Reading
Writing and Language
Math
Analysis in History/Social Studies
Analysis in Science
Command of Evidence
Words in Context
Expression of Ideas
Heart of Algebra
Standard English Conventions
Problem Solving and Data Analysis
Passport to Advanced Math
The PSAT 10 Sample Score Report, cont.
15
SAT Practice Connect to Khan Academy for FREE, world-class SAT practice on satpractice.org.
Reading Test
Your Scores: Next StepsAdditional skills and improvement suggestions can be found in your online score report.
Writing and Language Test
Math Test
Your score indicates that you are already likely able to: Improve your skills by focusing on the following suggestions:
Get more next steps onlinestudentscores.collegeboard.org
AP and Course WorkSee which AP courses may be good matches for you.
Register for the SATSelect an SAT test date, and register for it now.
8 to 38
8 to 38
8 to 38
Ima B. Student Spring 2017, Grade: 10th Grade
23
18
26.5
Revise text as needed to improve the exactness or content appropriateness of word choices within somewhat challenging texts
Retain or add information or ideas to a piece of a text to support claims or points in somewhat challenging text
Revise somewhat challenging text to ensure that information is presented in the most logical order
Revise text as needed to improve the exactness or content appropriateness of word choices within somewhat challenging texts
Draw reasonable conclusions from somewhat challenging texts
Describe the overall structure of a somewhat challenging text
Identify claims and counterclaims explicitly stated in a somewhat challenging passage
Revise text as needed to improve the exactness or content appropriateness of word choices within somewhat challenging texts
Interpret a linear inequality in one variable with rational coefficients that represents a context. Select the equation of a line of best fit and interpret the slope and intercept of the line in the context of the situation (when a linear model is appropriate)
Interpret sample statistics understanding and use margin of error
Solve and interpret a quadratic function or equation that represents a context and requires multiple steps
Calculate and interpret frequency distributions using tables and other representational methods
Retain or add information or ideas to a piece of text to support claims or points in challenging text
Use a variety of sentence structures to accomplish a rhetorical purpose such as persuading an audience
Revise text as needed to improve the exactness or content appropriateness of word choices within challenging texts
Retain or add information or ideas to a piece of text to support claims or points in challenging text
Use a variety of sentence structures to accomplish a rhetorical purpose such as persuading an audience
Draw reasonable inferences and logical conclusions from challenging texts
Analyze information presented quantitatively in such forms as graphs, tables, and charts and relate that information to information presented in somewhat challenging text
Determine how the selection of specific words shapes meaning and tone in a challenging passage
Use a variety of sentence structures to accomplish a rhetorical purpose such as persuading an audience
Retain or add information or ideas to a piece of text to support claims or points in challenging text
Determine how a graph may be affected by a change to its equation
Determine the value of a constant or coefficient for an equation with no solution or infinitely many solutions
Using a specified model, make a prediction and compare the predicted values with the actual values in the data set
Within a context, compare the center of two separate data sets with different spreads
Determine whether two events are independent given their probabilities
Use a variety of sentence structures to accomplish a rhetorical purpose such as persuading an audience
The PSAT 10 Sample Score Report, cont.

16
Reading
Que
stio
n #
Cor
rect
Your
Ans
wer
Diff
icul
ty
Subs
core
Cro
ss-T
est
Scor
e
1
2
3
4
5
6
7
8
9
10
11
12
13
14
15
16
17
18
19
20
21
22
23
24
25
26
27
28
29
30
31
32
33
34
35
36
37
38
39
40
41
42
43
44
45
46
47
A ■ ■ ■
B A ■ ■ ■ COE
B A ■ ■ ■
B ■ ■ ■ WIC
C A ■ ■ ■
D ■ ■ ■
B Ø ■ ■ ■ COE
A ■ ■ ■ WIC
D ■ ■ ■ WIC
A C ■ ■ ■ HSS
D C ■ ■ ■ WIC HSS
D B ■ ■ ■ WIC HSS
D A ■ ■ ■ COE HSS
A C ■ ■ ■ HSS
C B ■ ■ ■ COE HSS
B C ■ ■ ■ HSS
D C ■ ■ ■ HSS
B D ■ ■ ■ HSS
A ■ ■ ■ SCI
C ■ ■ ■ SCI
B D ■ ■ ■ COE SCI
D ■ ■ ■ SCI
B ■ ■ ■ SCI
D ■ ■ ■ WIC SCI
C ■ ■ ■ WIC SCI
B ■ ■ ■ SCI
B C ■ ■ ■ SCI
A C ■ ■ ■ COE SCI
D ■ ■ ■ WIC HSS
B A ■ ■ ■ HSS
D ■ ■ ■ COE HSS
A ■ ■ ■ HSS
C ■ ■ ■ COE HSS
A B ■ ■ ■ WIC HSS
A B ■ ■ ■ HSS
C A ■ ■ ■ HSS
B C ■ ■ ■ HSS
C D ■ ■ ■ HSS
C ■ ■ ■ SCI
C ■ ■ ■ SCI
B ■ ■ ■ SCI
B Ø ■ ■ ■ COE SCI
A B ■ ■ ■ SCI
A ■ ■ ■ WIC SCI
A ■ ■ ■ SCI
D A ■ ■ ■ COE SCI
C B ■ ■ ■ SCI
Writing and Language
Que
stio
n #
Cor
rect
Your
Ans
wer
Diff
icul
ty
Subs
core
Cro
ss-T
est
Scor
e
1
2
3
4
5
6
7
8
9
10
11
12
13
14
15
16
17
18
19
20
21
22
23
24
25
26
27
28
29
30
31
32
33
34
35
36
37
38
39
40
41
42
43
44
D C ■ ■ ■ SEC
B ■ ■ ■ EOI HSS
C D ■ ■ ■ SEC
C A ■ ■ ■ SEC
B D ■ ■ ■ SEC
B D ■ ■ ■ COE, EOI HSS
A D ■ ■ ■ WIC, EOI HSS
B C ■ ■ ■ EOI HSS
A B ■ ■ ■ WIC, EOI HSS
D ■ ■ ■ SEC
D ■ ■ ■ COE, EOI HSS
B ■ ■ ■ SEC
C ■ ■ ■ SEC
C B ■ ■ ■ SEC
D ■ ■ ■ WIC, EOI SCI
B A ■ ■ ■ SEC
B D ■ ■ ■ SEC
A Ø ■ ■ ■ EOI SCI
B C ■ ■ ■ EOI SCI
C D ■ ■ ■ COE, EOI SCI
A ■ ■ ■ COE, EOI SCI
A B ■ ■ ■ WIC, EOI SCI
C B ■ ■ ■ WIC, EOI
D C ■ ■ ■ SEC
C D ■ ■ ■ SEC
A Ø ■ ■ ■ COE, EOI
A ■ ■ ■ EOI
B ■ ■ ■ COE, EOI
D ■ ■ ■ WIC, EOI
C B ■ ■ ■ SEC
D A ■ ■ ■ EOI
B Ø ■ ■ ■ SEC
D ■ ■ ■ SEC
D B ■ ■ ■ EOI
D ■ ■ ■ SEC
B A ■ ■ ■ EOI
C D ■ ■ ■ COE, EOI
A ■ ■ ■ SEC
C ■ ■ ■ SEC
D A ■ ■ ■ WIC, EOI
D B ■ ■ ■ SEC
A C ■ ■ ■ SEC
C B ■ ■ ■ COE, EOI
B C ■ ■ ■ WIC, EOI
Math Test – Calculator
Que
stio
n #
Cor
rect
Your
Ans
wer
Diff
icul
ty
Subs
core
Cro
ss-T
est
Scor
e
28
29
30
31
Que
stio
n #
Cor
rect
Your
Ans
wer
Diff
icul
ty
Subs
core
Cro
ss-T
est
Scor
e
1
2
3
4
5
6
7
8
9
10
11
12
13
14
Que
stio
n #
Cor
rect
Your
Ans
wer
Diff
icul
ty
Subs
core
Cro
ss-T
est
Scor
e
15
16
17
18
19
20
21
22
23
24
25
26
27
B ■ ■ ■ PSD HSS
A ■ ■ ■ HOA
B ■ ■ ■ PSD SCI
D ■ ■ ■ HOA
B C ■ ■ ■ PSD
A ■ ■ ■ PSD
B ■ ■ ■ PSD
C ■ ■ ■ PSD
A Ø ■ ■ ■ PAM
D C ■ ■ ■ HOA
D ■ ■ ■ PSD HSS
A ■ ■ ■ PSD
B ■ ■ ■ PSD
C ■ ■ ■ PSD SCI
C ■ ■ ■
B ■ ■ ■ PSD HSS
D ■ ■ ■ PSD
B A ■ ■ ■ PSD HSS
C A ■ ■ ■ HOA
B D ■ ■ ■ PAM
B ■ ■ ■ HOA
D C ■ ■ ■ PAM
D B ■ ■ ■ HOA SCI
C B ■ ■ ■ PAM SCI
B A ■ ■ ■ PSD SCI
D Ø ■ ■ ■ PAM
D A ■ ■ ■ HOA
65 60 ■ ■ ■ HOA
0, 12 2 ■ ■ ■ PAM
1368 ■ ■ ■ PSD HSS
85 ■ ■ ■ PSD HSS
Que
stio
n #
Cor
rect
Your
Ans
wer
Diff
icul
ty
Subs
core
Cro
ss-T
est
Scor
e
14
15
16
17
Math Test – No Calculator
Que
stio
n #
Cor
rect
Your
Ans
wer
Diff
icul
ty
Subs
core
Cro
ss-T
est
Scor
e
1
2
3
4
5
6
7
Que
stio
n #
Cor
rect
Your
Ans
wer
Diff
icul
ty
Subs
core
Cro
ss-T
est
Scor
e
8
9
10
11
12
13
SubscoreCOE Command of Evidence
WIC Words in Context
EOI Expression of Ideas
SEC Standard English Conventions
HOA Heart of Algebra
PSD Problem Solving and Data Analysis
PAM Passport to Advanced Math
Key:
2 0 ■ ■ ■ HOA
90 80 ■ ■ ■ HOA
1 2 ■ ■ ■ PAM
0 1 ■ ■ ■ PAM
D B ■ ■ ■ PAM
A ■ ■ ■ PAM SCI
B A ■ ■ ■ PAM
C B ■ ■ ■ PAM
C ■ ■ ■ HOA
B ■ ■ ■ HOA SCI
A ■ ■ ■ HOA
B ■ ■ ■ HOA
C ■ ■ ■ HOA
D ■ ■ ■ HOA HSS
A ■ ■ ■
C B ■ ■ ■ PAM
B A ■ ■ ■ PAM
See the questions, and the answer explanations, onlinestudentscores.collegeboard.org
Cross-Test Score:HSS Analysis in History/Social Studies
SCI Analysis in Science
Correct
Ø Omitted
U Unscorable■ ■ ■ Easy■ ■ ■ Medium■ ■ ■ Hard
© 2017 The College Board. College Board, AP, SAT, and the acorn logo are registered trademarks of the College Board. PSAT is a trademark owned by the College Board. PSAT/NMSQT is a registered trademark of the College Board and National Merit Scholarship
Corporation. Visit the College Board on the web: collegeboard.org.
Khan Academy is a registered trademark in the United States and other jurisdictions.
Your Question-Level Feedback
Access CodeA02670146P
Ima B. Student Spring 2017, Grade: 10th Grade
The PSAT 10 Sample Score Report, cont.


20
© 2017 The College Board. College Board, Advanced Placement Program, AP, SAT, and the acorn logo are registered trademarks of the College Board. AP Potential and PSAT are trademarks owned by the College Board. PSAT/NMSQT is a registered trademark of the College Board and National Merit Scholarship Corporation. For more information visit the College Board on the web: collegeboard.org.
Khan Academy is a registered trademark in the United States and other jurisdictions.00689-002 160041383