testing. The ccntent validity and scores for particular cultural ...

Original Articlehttp://mjiri.iums.ac.ir Medical Journal of the Islamic Republic of Iran (MJIRI)
Iran University of Medical Sciences
____________________________________________________________________________________________________________________1. MD, MPH, General Physician, Research Fellow, Endocrinology and Metabolism Research Center, Vali–Asr Hospital, Tehran University ofMedical Sciences, Tehran, Iran. [email protected]. MD, PhD by Research Student, Endocrinology & Metabolism Research Center, Endocrinology and Metabolism Clinical Sciences Institute,Tehran University of Medical Sciences, Tehran, Iran. [email protected]. MD, PhD, Epidemiologist, Assistant Professor, Rasul-Akram Hospital, Iran University of Medical Sciences Tehran, [email protected]. MD, General Physician, Research Fellow, Endocrinology & Metabolism Research Center, Endocrinology and Metabolism Clinical SciencesInstitute, Tehran University of Medical Sciences, Tehran, Iran. [email protected]. (Corresponding author) MD, Associate Professor, Endocrinology & Metabolism Research Center, Endocrinology and Metabolism ClinicalSciences Institute, Tehran University of Medical Sciences, Tehran, Iran. [email protected]. MD, Professor, Endocrinology & Metabolism Research Center, Endocrinology and Metabolism Clinical Sciences Institute, Tehran Universityof Medical Sciences, Tehran, Iran. [email protected]
Dual-energy X-ray absorptiometry diagnostic discordance be-tween Z-scores and T-scores in a young Iranian population
Behnam Heidari1, Patricia Khashayar2, Mohsen Rezai Homami3,Atieh Pajouhi4, Akbar Soltani5, Bagher Larijani6
Received: 6 December 2013 Accepted: 24 June 2014 Published: 22 December 2014
AbstractBackground: Dual-energy X-ray Absorptiometry (DXA) is considered the gold standard for non-invasive
measurement of bone mass. T-scores and Z-scores are used to present the results of bone mass. The presentstudy was designed to evaluate the discordance between T-scores and Z-scores calculated at a same level and itsrelation with age, gender and body mass index (BMI) in a representative sample of normal population.
Methods: This cross-sectional study was conducted as a part of a comprehensive survey, Iranian MulticenterOsteoporosis Study (IMOS), designed to assess bone health among healthy adults. Each individual underwentboth L1–L4 antero-posterior lumbar spine and hip DXA scan. The difference between the T- and Z-scoresmeasured at each of the four skeletal sites was then calculated.
Results: A -1.21 to 1.21 point difference was noted in the Z- and T- scores measured at each site. While thedifference between the T- and Z-scores was less than 0.5 SD in most of the cases, the difference was higher than1 SD in about 5% of the subjects.
Conclusion: Standardization of Z-score definition and calculation techniques as well as developing an ethnici-ty-matched reference population is needed to improve the reliability of DXA-generated Z-scores.
Keywords: Osteoporosis, Bone Mineral Density, T-scores, Z-scores, Iran.
Cite this article as: Heidari B, Khashayar P, Rezai Homami M, Pajouhi A, Soltani A, Larijani B. Dual-energy X-ray absorptiometry diag-nostic discordance be-tween Z-scores and T-scores in a young Iranian population. Med J Islam Repub Iran 2014 (22 December. Vol.28:151.
IntroductionDual-energy X-ray Absorptiometry
(DXA) is considered the gold standard fornon-invasive measurement of bone mass(1-4); its use, therefore, is widely accepted be-cause of its high safety and reliability(2, 5-7). While DXA measures bone density ing/cm2, T- and/or Z-scores are commonlyused to present the results.
The normal aging process is associatedwith physiologic bone loss, characterized
by reduced T-score values; Z-score, on theother hand, is believed to remain almostunchanged over time. In fact, this is be-cause T-score reports the number of stand-ard deviation difference away from a youngadult reference population presumably atpeak bone mass, whereas Z-score shows thedivergence noted when comparing the indi-vidual with the an age-matched referencepopulation (1, 8).
Considering the abovementioned defini-

T-scores and Z-scores discordance in young adults
2 MJIRI, Vol. 28.151. 22 December 2014http://mjiri.iums.ac.ir
tion previous publications have suggestedthat T- and Z-scores should be similar oridentical in young adults as the relevant ref-erence populations should be the same(6,9). Although T- and Z-score values meas-ured using DXA had long been used inter-changeably in young adults, recent ISCDguidelines have not universally accepted theuse of Z-scores instead of T-scores inpremenopausal women and men aged 20-49years (6, 9-12).
Some authors have also pointed out unex-pectedly large differences between thesevalues in the clinical practice, a fact whichmay lead to amendments in the diagnosisand treatment of osteoporosis (13, 14).Apart from the abovementioned studies, themagnitude of the discordance in the normalpopulation and its relation with other varia-bles remains unclear. The present study wastherefore designed to assess this discord-ance and its relation with age, gender andbody mass index (BMI) in a representativesample of normal population.
MethodsStudy design and subjectsThis cross-sectional study was conducted
as a part of a comprehensive survey, IranianMulticenter Osteoporosis Study (IMOS),designed to assess bone health amonghealthy adults between February and March2001. Details on the survey design andmethods have been reported previously(15). Briefly, the IMOS used a randomcluster sampling design in five representa-tive cities (Tehran, Tabriz, Mashhad, Shirazand Booshehr); independent samples ofhealthy Iranian adults excluding those withmetabolic bone disease, history of rheuma-toid arthritis, type 1 diabetes mellitus, hy-percortisilism, malabsorption, renal and he-patic diseases along with pregnant and lac-tating woman and those with a history ofinfertility, oligomenorrhea, malignancy,immobility for more than a week. Thosewith alcoholism, cigarette smokers and in-dividuals taking drugs affecting bone me-tabolism were also excluded. A written in-formed consent was taken from each partic-
ipant. The study was approved by the Ethi-cal Board Committee of Tehran Universityof Medical Sciences (TUMS) and Ministryof Health and Medical Education.
Men and women aged between 20 to 49years were drawn from this comprehensivesurvey and recruited in the present study.
Data collection and BMD measurementsThe subjects were asked to complete a
questionnaire on physical activity, durationof sun exposure, diet, drug history, and pastmedical history, before they underwent thebone mineral density analysis.
Anthropometric values, including weightand height, were measured with individualswearing light clothing and no shoes bytrained technicians based on the interna-tional guidelines (16, 17). The height (to thenearest 0.1 cm) and weight (to the nearest0.1 kg) measurements were performed us-ing the same technique by a single wall-mounted stadiometer (Seca) and a mobiledigital scale (Seca, Hamburg, Germany),respectively. The BMI was calculated bydividing the body weight by the heightsquared (kg/m2). Quality control for allmeasurements was regularly monitored.
Each individual underwent both L1–L4antero-posterior lumbar spine and hip (total,femoral neck, and trochanter) with a dualenergy x-ray absorptiometry (DXA) scanusing a Lunar DPXMD densitometer (Lu-nar 7164, GE, Madison, WI) based on themanufacturer's guidelines. Adjusted Z-scorein each subject was calculated for bodyweight and height in addition to age. Preci-sion error for BMD measurements was cal-culated to be 1–1.5% at the lumbar and 2–3% at the femoral regions. Quality controlprocedures were carried out regularly basedon the manufacturer’s recommendationsand the instrument was weekly calibratedusing appropriate phantoms supplied by themanufacturer.
Statistical analysisAll the gathered data were entered in Mi-
crosoft Access Databank, checked, andcleaned before analysis; participants withincomplete data were excluded from the

B. Heidari, et al.
3MJIRI, Vol. 28.151. 22 December 2014 http://mjiri.iums.ac.ir
study. The statistical analysis was per-formed using SPSS 13.0 for Windows(SPSS, Chicago, IL). The difference be-tween the T- and Z-scores measured at eachof the four skeletal sites, the total hip, fem-oral neck, trochanter, and lumbar spine (an-tero-posterior spine L1-L4) were calculatedfor every individual and presented in meanand standard deviation (SD). The individu-als were then classified into three maingroups based on the difference rates (be-tween 0- 0.5, 0.5- 1 & more than 1). Theeffect of age, sex, and BMI on the differ-ence was thereafter assessed. Correlationcoefficient (r) was used to display the uni-variate strength and direction of the rela-tionship between the studied variables. Theanalysis was performed in the whole popu-lation and then in each gender and agegroup (20- 29, 30- 39 & 40- 49) separately.Finally, we performed multivariable regres-sion analysis to assess the association ofage, sex, and BMI with the discordance ofT-scores and Z-scores for each skeletal site.As data were derived from 5 different cities,the multivariable model was adjusted forclustering effect (city of living). P valuesless than 0.05 were considered as statistical-ly significant.
ResultsThe scans of 2947 individuals including
1200 male (40.7%) and 1747 female(59.3%) were analyzed. The mean age ofthe studied men and women was 34 and 35years, correspondingly. The mean ± SD ofBMI was 25.6 ± 4.73 kg/cm2, ranging from14.10 to 44.51kg/cm2.
The measured Z-scores ranged from -7.25to 4.33 in men and -6.09 to 4.48 in women.T-score values, on the other hand, rangedfrom -6.57 to 4.30 and -5.04 to 3.59 in thetwo genders, respectively. The highest T-score was reported in male total hip (-6.57to 4.30) and the least was seen in femaleneck of femur (-2.64 to 3.16). As for Z-score, however, the highest amount wassimilarly found in male total hip (-7.25 to4.27) but the least was seen in female lum-bar spine (-3.02 to 3.75).
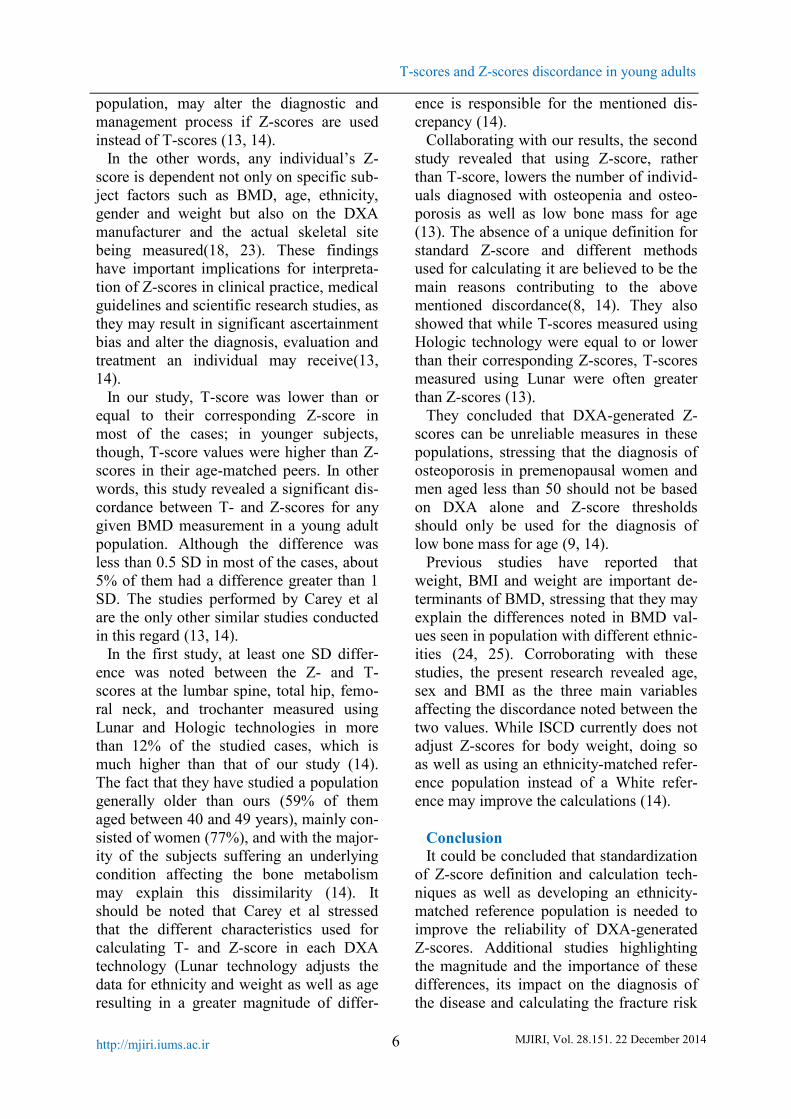
A -1.21 to 1.21 point difference was notedin the Z- and T- scores measured at eachsite. While the difference between the T-and Z-scores was less than 0.5 SD in mostof the cases, the difference was higher than1 SD in about 5% of the subjects (Fig. 1).Total hip, with the least discrepancy be-tween the two values, was the most reliablesite whereas the contrary was reported forthe femoral neck. Individuals in their 40s(aged between 40 and 49 years) had thehighest number of discrepancies in themeasured values (Table 1).
A significant correlation was found be-
Fig. 1. The magnitude of difference between Z- and T-scores in the whole study population stratified by skeletel sites.
T-scores and Z-scores discordance in young adults
4 MJIRI, Vol. 28.151. 22 December 2014http://mjiri.iums.ac.ir
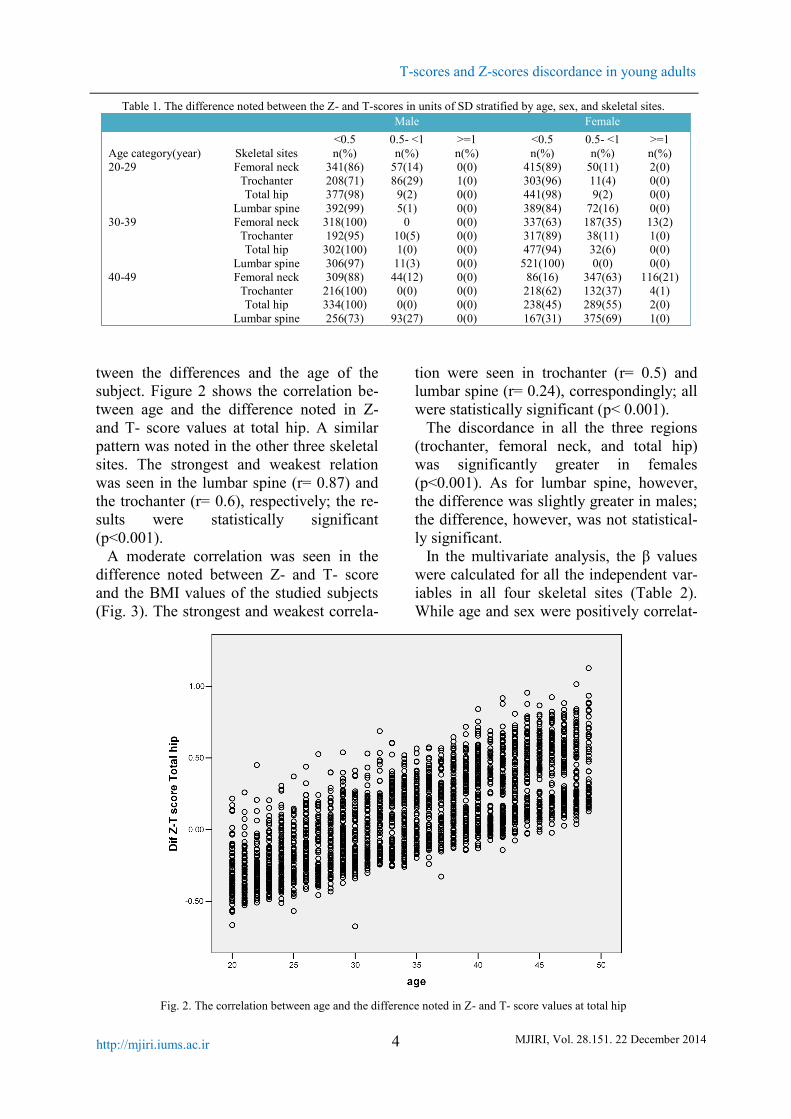
tween the differences and the age of thesubject. Figure 2 shows the correlation be-tween age and the difference noted in Z-and T- score values at total hip. A similarpattern was noted in the other three skeletalsites. The strongest and weakest relationwas seen in the lumbar spine (r= 0.87) andthe trochanter (r= 0.6), respectively; the re-sults were statistically significant(p<0.001).
A moderate correlation was seen in thedifference noted between Z- and T- scoreand the BMI values of the studied subjects(Fig. 3). The strongest and weakest correla-
tion were seen in trochanter (r= 0.5) andlumbar spine (r= 0.24), correspondingly; allwere statistically significant (p< 0.001).
The discordance in all the three regions(trochanter, femoral neck, and total hip)was significantly greater in females(p<0.001). As for lumbar spine, however,the difference was slightly greater in males;the difference, however, was not statistical-ly significant.
In the multivariate analysis, the β valueswere calculated for all the independent var-iables in all four skeletal sites (Table 2).While age and sex were positively correlat-
Table 1. The difference noted between the Z- and T-scores in units of SD stratified by age, sex, and skeletal sites.Male Female
<0.5 0.5- <1 >=1 <0.5 0.5- <1 >=1Age category(year) Skeletal sites n(%) n(%) n(%) n(%) n(%) n(%)20-29 Femoral neck 341(86) 57(14) 0(0) 415(89) 50(11) 2(0)
Trochanter 208(71) 86(29) 1(0) 303(96) 11(4) 0(0)Total hip 377(98) 9(2) 0(0) 441(98) 9(2) 0(0)
Lumbar spine 392(99) 5(1) 0(0) 389(84) 72(16) 0(0)30-39 Femoral neck 318(100) 0 0(0) 337(63) 187(35) 13(2)
Trochanter 192(95) 10(5) 0(0) 317(89) 38(11) 1(0)Total hip 302(100) 1(0) 0(0) 477(94) 32(6) 0(0)
Lumbar spine 306(97) 11(3) 0(0) 521(100) 0(0) 0(0)40-49 Femoral neck 309(88) 44(12) 0(0) 86(16) 347(63) 116(21)
Trochanter 216(100) 0(0) 0(0) 218(62) 132(37) 4(1)Total hip 334(100) 0(0) 0(0) 238(45) 289(55) 2(0)
Lumbar spine 256(73) 93(27) 0(0) 167(31) 375(69) 1(0)
Fig. 2. The correlation between age and the difference noted in Z- and T- score values at total hip

B. Heidari, et al.
5MJIRI, Vol. 28.151. 22 December 2014 http://mjiri.iums.ac.ir
ed with the discordance in all four skeletalsites (p<0.001), the positive correlation be-tween BMI and discordance was only rec-ognized in total hip, femoral neck, and tro-chanter (p<0.001). The lowest β values re-ferred to BMI and the greatest ones be-longed to gender.
DiscussionOsteoporosis, defined as having low bone
density, is characterized by having T scorevalues equal to or lower than 2.5 standarddeviations (SD) below the normal peak val-ues for young adults in the reference popu-lation(2, 10, 18). In 1994, the WHO rec-ommended the use of T-score in diagnosingosteoporosis in postmenopausal wom-en(18). The International Society for Clini-cal Densitometry (ISCD), however, recently
urged physicians to use Z-score, rather thanT-score, for diagnosing low bone mass inchildren, premenopausal women, and menyounger than 50 years(9, 18, 19).
The definite prevalence of low bone massand osteoporosis in this population, howev-er, remains unknown for several reasons.Lack of validated DXA or any other univer-sally accepted diagnostic criteria forpremenopausal women or men mainly dueto the low number of published scientificstudies on this age group is the main factorhampering the accurate diagnosis of thecondition in these populations(18, 20-22).
More recent studies have revealed a sub-stantial and significant difference betweenthese two values. This, mainly caused dueto various definitions and calculation meth-ods used for Z-score) and perhaps reference
Fig. 3. The correlation between BMI and the difference noted in Z- and T- score values at total hip
Table 2. Multivariable regression analysis for each skeletal site considering the discordance between Z- score and T-scoresas dependent variable.
Skeletal sites Independentvariables
Total Hip Femoral Neck Trochanter Lumbar Spine
Age (yr) 0.023 0.032 0.016 0.036BMI (kg/m2) 0.012 0.015 0.017 -0.005
Sex (female/male) 0.33 0.35 0.47 0.21The presented data are β values of each independent variable in any skeletal site. All β values were statistically significant (P val-ue<0.001). The analyses are adjusted for city of living.
T-scores and Z-scores discordance in young adults
6 MJIRI, Vol. 28.151. 22 December 2014http://mjiri.iums.ac.ir
population, may alter the diagnostic andmanagement process if Z-scores are usedinstead of T-scores (13, 14).
In the other words, any individual’s Z-score is dependent not only on specific sub-ject factors such as BMD, age, ethnicity,gender and weight but also on the DXAmanufacturer and the actual skeletal sitebeing measured(18, 23). These findingshave important implications for interpreta-tion of Z-scores in clinical practice, medicalguidelines and scientific research studies, asthey may result in significant ascertainmentbias and alter the diagnosis, evaluation andtreatment an individual may receive(13,14).
In our study, T-score was lower than orequal to their corresponding Z-score inmost of the cases; in younger subjects,though, T-score values were higher than Z-scores in their age-matched peers. In otherwords, this study revealed a significant dis-cordance between T- and Z-scores for anygiven BMD measurement in a young adultpopulation. Although the difference wasless than 0.5 SD in most of the cases, about5% of them had a difference greater than 1SD. The studies performed by Carey et alare the only other similar studies conductedin this regard (13, 14).
In the first study, at least one SD differ-ence was noted between the Z- and T-scores at the lumbar spine, total hip, femo-ral neck, and trochanter measured usingLunar and Hologic technologies in morethan 12% of the studied cases, which ismuch higher than that of our study (14).The fact that they have studied a populationgenerally older than ours (59% of themaged between 40 and 49 years), mainly con-sisted of women (77%), and with the major-ity of the subjects suffering an underlyingcondition affecting the bone metabolismmay explain this dissimilarity (14). Itshould be noted that Carey et al stressedthat the different characteristics used forcalculating T- and Z-score in each DXAtechnology (Lunar technology adjusts thedata for ethnicity and weight as well as ageresulting in a greater magnitude of differ-
ence is responsible for the mentioned dis-crepancy (14).
Collaborating with our results, the secondstudy revealed that using Z-score, ratherthan T-score, lowers the number of individ-uals diagnosed with osteopenia and osteo-porosis as well as low bone mass for age(13). The absence of a unique definition forstandard Z-score and different methodsused for calculating it are believed to be themain reasons contributing to the abovementioned discordance(8, 14). They alsoshowed that while T-scores measured usingHologic technology were equal to or lowerthan their corresponding Z-scores, T-scoresmeasured using Lunar were often greaterthan Z-scores (13).
They concluded that DXA-generated Z-scores can be unreliable measures in thesepopulations, stressing that the diagnosis ofosteoporosis in premenopausal women andmen aged less than 50 should not be basedon DXA alone and Z-score thresholdsshould only be used for the diagnosis oflow bone mass for age (9, 14).
Previous studies have reported thatweight, BMI and weight are important de-terminants of BMD, stressing that they mayexplain the differences noted in BMD val-ues seen in population with different ethnic-ities (24, 25). Corroborating with thesestudies, the present research revealed age,sex and BMI as the three main variablesaffecting the discordance noted between thetwo values. While ISCD currently does notadjust Z-scores for body weight, doing soas well as using an ethnicity-matched refer-ence population instead of a White refer-ence may improve the calculations (14).
ConclusionIt could be concluded that standardization
of Z-score definition and calculation tech-niques as well as developing an ethnicity-matched reference population is needed toimprove the reliability of DXA-generatedZ-scores. Additional studies highlightingthe magnitude and the importance of thesedifferences, its impact on the diagnosis ofthe disease and calculating the fracture risk

B. Heidari, et al.
7MJIRI, Vol. 28.151. 22 December 2014 http://mjiri.iums.ac.ir
are also needed. Until such data are availa-ble, however, DXA-generated Z-scoresshould be interpreted and used with cautionin premenopausal women and men agedless than 50 years.
References1. Lane NE. Epidemiology, etiology, and
diagnosis of osteoporosis. American journal ofobstetrics and gynecology 2006; 194,S3-S11.
2. Nanes MS, Kallen CB. Osteoporosis. Seminarsin nuclear medicine 2014; 44,439-50.
3. Kendler DL, Borges JL, Fielding RA, et al. TheOfficial Positions of the International Society forClinical Densitometry: Indications of Use andReporting of DXA for Body Composition. Journalof clinical densitometry : the official journal of theInternational Society for Clinical Densitometry2013; 16,496-507.
4. Andreopoulou P, Bockman RS. Management ofPostmenopausal Osteoporosis. Annual review ofmedicine 2014;
5. Johnell O, Kanis J. Epidemiology ofosteoporotic fractures. Osteoporosis international2005; 16,S3-S7.
6. Bates DW, Black DM, Cummings SR. Clinicaluse of bone densitometry: clinical applications.Jama 2002; 288,1898-900.
7. Cauley JA, Lui L-Y, Ensrud KE, et al. Bonemineral density and the risk of incident nonspinalfractures in black and white women. Jama 2005;293,2102-8.
8. Kanis JA, Melton LJ, Christiansen C, et al. Thediagnosis of osteoporosis. Journal of Bone andMineral Research 1994; 9,1137-41.
9. Leslie WD, Adler RA, El-Hajj Fuleihan G, et al.Application of the 1994 WHO classification topopulations other than postmenopausal Caucasianwomen: the 2005 ISCD Official Positions. Journalof Clinical Densitometry 2006; 9,22-30.
10. Bonnick S. Bone Densitometry in ClinicalPractice Totowa. NJ: Humana Press; 2004.
11. Kanis JA, Seeman E, Johnell O, et al. Theperspective of the International OsteoporosisFoundation on the official positions of theInternational Society for Clinical Densitometry.Journal of Clinical Densitometry 2005; 8,145-7.
12. Lewiecki EM, Miller PD, Leib ES, et al.Response to “The perspective of the InternationalOsteoporosis Foundation on the official positions ofthe International Society for Clinical Densitometry”by John A. Kanis et al. Osteoporosis international2005; 16,579-80.
13. Carey JJ, Delaney MF, Love TE, et al. Dual-energy X-ray absorptiometry diagnostic discordancebetween Z-scores and T-scores in young adults.Journal of Clinical Densitometry 2009; 12,11-6.
14. Carey JJ, Delaney MF, Love TE, et al. DXA-generated Z-scores and T-scores may differsubstantially and significantly in young adults.Journal of Clinical Densitometry 2007; 10,351-8.
15. Meybodi HA, Heshmat R, Maasoumi Z, et al.Iranian Osteoporosis Research Network:Background, mission and its role in osteoporosismanagement. Iranian Journal of Public Health 2008;37,1-6.
16. Lohman T, Roache A, Martorell R.Anthropometric standardization reference manual.Medicine & Science in Sports & Exercise 1992;24,952.
17. Lau D, Douketis JD, Morrison KM, et al.Obesity Canada Clinical Practice Guidelines ExpertPanel 2006 Canadian clinical practice guidelines onthe management and prevention of obesity in adultsand children [summary]. CMAJ 2007; 176,1-117.
18. Organization WH. Assessment of fracture riskand its application to screening for postmenopausalosteoporosis: report of a WHO study group [meetingheld in Rome from 22 to 25 June 1992]. 1994;
19. Densitometry ISfC. Updated 2005 officialpositions for the international society for clinicaldensitometry. 2006 Nov 1;
20. Wainwright SA, Marshall LM, Ensrud KE, etal. Hip fracture in women without osteoporosis. TheJournal of Clinical Endocrinology & Metabolism2005; 90,2787-93.
21. Burge R, Dawson‐Hughes B, Solomon DH, etal. Incidence and economic burden of osteoporosis‐related fractures in the United States, 2005–2025.Journal of Bone and Mineral Research 2007;22,465-75.
22. Melton LJ, Chrischilles EA, Cooper C, et al.How many women have osteoporosis? Journal ofBone and Mineral Research 2005; 20,886-92.
23. Lim LS, Hoeksema LJ, Sherin K. Screeningfor osteoporosis in the adult US population: ACPMposition statement on preventive practice. Americanjournal of preventive medicine 2009; 36,366-75.
24. Finkelstein JS, Lee M-LT, Sowers M, et al.Ethnic variation in bone density in premenopausaland early perimenopausal women: effects ofanthropometric and lifestyle factors. The Journal ofClinical Endocrinology & Metabolism 2002;87,3057-67.
25. De Laet C, Kanis J, Odén A, et al. Body massindex as a predictor of fracture risk: a meta-analysis.Osteoporosis international 2005; 16,1330-8.
Copyright © 2022 FDOKUMEN