Carstairs Scores for Scottish Postcode Sectors, Datazones ...
Upload
khangminh22Category
view
0download
0
1
The impact of international diversification on
credit scores: Evidence from the UK
Hussein Halabi
Swansea University, UK
E-Mail: [email protected]
Ahmad Alshehabi
International Business School Suzhou
Xi'an Jiaotong-Liverpool University, China 215123
E-Mail: [email protected]
Geoffrey Wood
DAN Department of Management & Organizational Studies
London, Ontario, Canada
E-mail: [email protected]
Zaheer Khan*
University of Aberdeen Business School
King’s College, University of Aberdeen
Aberdeen AB24 3FX, UK
* Corresponding author email: [email protected]
&
School of Marketing and Communication, University of Vaasa, Finland
Dr. Godfred Afrifa
Lecturer in Accounting
University of Kent
Canterbury, CT2 7FS, UK
E-Mail: [email protected]
Note: This is a pre-print post review accepted version, please cite:
Halabi, H., Alshehabi, A., Wood, G., Khan, Z., & Afrifa, G. (2021). The impact of
international diversification on credit scores: Evidence from the UK. International Business
Review, in press.

2
Abstract
Despite the great deal of previous research into international diversification, we know little about the
impact of international diversification on firms’ credit scores. Drawing upon the resource-based view
and transaction cost economics, we examine the relationship between international diversification and
credit scores by using a large sample of 6,557 UK firms between 2016 and 2017. We find an inverted
U-shaped relationship between international diversification and firms’ credit scores, indicating that firm
credit score is initially positive but eventually levels off and becomes negative as international
diversification increases. In addition, we find that R&D intensity positively moderates the relationship
between international diversification and credit score, implying that the credit scores of highly
diversified firms improve as they increase their investment in R&D. Further analysis suggests that a
firm’s credit score becomes less dependent on international diversification for large firms, firms in
concentrated industries, firms in the manufacturing sector, and firms distant from key metropolitan
areas, such as London.
Keywords: International diversification, credit score, innovation, competition, exporting firm, SMEs

3
“There are opportunities all over the world for ambitious businesses. If you are looking to build your
business at a faster rate, then it is worth seriously considering the benefits exporting can bring”
– Matt Legon, Gnaw Chocolate’s Founder.
1 Introduction
An increasing number of British firms have internationalised their business activities in recent years.
According to a report published by the Office for National Statistics (ONS), the number of small and
medium-sized enterprises (SMEs) exporting abroad increased in 2017 by almost 10% on the previous
year, while the number of large firms exporting abroad increased by around 42% (DIT, 2018). This
provides vindication of firms’ understanding/awareness of the (direct and indirect) benefits of
diversifying the geographical scope of their sales and operations. This is in part due to the work being
done by the government and industry in raising awareness of the opportunities in international trade, as
well as the increasing attention that international diversification has received in academic and policy
debates1. As a UK Trade & Investment (UKTI) report suggests, UK firms exporting abroad not only
increase their levels of turnover and profitability but are also 11% more likely to survive than those that
are purely domestic (UKTI, 2012).2 Existing research also provides evidence that international
diversification is a growth strategy open to both large firms and SMEs and is deemed beneficial to firms
through the exploitation of global market opportunities and imperfections (Jong & van Houten, 2014;
Rugman, 1979). For instance, many studies in international business (e.g., Almodóvar, 2012; Benito-
Osorio, Colino, Guerras-Martín, & Zúñiga-Vicente, 2016; Boehe & Jiménez, 2016; Brock, Yaffe, &
Dembovsky, 2006; Lee, 2010; Pisani, Garcia-Bernardo, & Heemskerk, 2020) have shown notable
effects of internalisation on firm performance (e.g., linear, curvilinear, and threshold relationships).
Despite the wealth of empirical studies on the net performance benefits of international diversification,
we still know relatively little about its effects on firm risk and hence creditworthiness, so further
research on the relationship between international diversification and firms’ credit scores3 is warranted.
On the one hand, it has been suggested that diversification offsets risks (Kim, Hwang, & Burgers, 1993)
and increases a firm’s market power (Kogut, 1985); on the other hand, it has been linked to managerial
empire-building and inefficiency (Jiraporn, Kim, Davidson, & Singh, 2006; Prezas, 2009).
In this paper, we argue that international diversification not only brings benefits but also comes with
costs and risks, with the net benefits depending on these aspects combined. In other words, international
diversification is a coin with two sides: benefits and costs/risks. An analysis that ignores either side of
1 Internationalisation and international diversification are both used in this paper interchangeably to mention to
the expansion of the firms across national borders through their foreign sales. 2 UK Trade and Investment (UKTI) has been replaced by Department for International Trade (DIT) since July 2016. 3 In this study, we use the credit scores available on the FAME database to capture firm failure risk. More
specifically, these credit scores capture the likelihood of a business becoming insolvent over a period of 12
months, ranging from 0 to 100, with lower scores indicating a greater probability of default risk.

4
this coin is an incomplete analysis. That is, the advantages of international diversification are not
limitless, as beyond a certain level of diversification, the costs/risks will outweigh the potential benefits,
thus decreasing the net benefits that multinationality brings (Hitt, Hoskisson, & Kim, 1997). The
resource-based view (RBV) highlights the positive effects of international diversification through using
internal resources and capabilities to exploit global markets’ imperfections and opportunities (Barney,
1991), thus achieving economies of scale, scope, and learning. With higher levels of diversification,
transaction cost economics (TCE) predicts that firms will experience increasing costs offsetting the
benefits achieved (Hitt et al., 1997; Kotabe, Srinivasan, & Aulakh, 2002; Batsakis & Mohr, 2017).
However, firms with unique internal capabilities and resources, such as investment in R&D, will
achieve differential benefits from international diversification.
We combine the RBV and TCE to investigate the effects of international diversification on firms’ credit
scores. Specifically, we address two key interrelated research questions: (1) Does an increase in
international diversification enhance firms’ credit scores? and (2) What is the role of R&D intensity in
moderating the relationship between international diversification and firms’ credit scores? We argue
that the benefits, costs, and risks are the three channels through which international diversification
influences credit scores. We use the RBV logic to explain the benefits of international diversification
and the moderating impact of R&D intensity, and we use TCE to explain the increasing environmentally
associated costs/risks that come with over-diversification. Credit scoring assumes particular salience
here, in that it reflects external assessments of the worth of an organization and its potential (Berg, Burg,
Gombović, & Puri, 2020), and, as such, may place assessments of the impact of transaction costs on a
more equal footing with perceptions of resource endowments.
Using a large sample of 6,557 UK firms, first, we find an inverted U-shaped relationship between
international diversification and credit scores. That is, firms benefit from low and moderate levels of
international diversification; however, the increasing transaction costs and risks resulting from intensive
international diversification have a negative impact on firms’ credit scores. This might indicate that
credit raters are effectively factoring in the risks that come with over-diversification. Second, we
document that the negative impact of high international diversification on credit scores, however,
decreases for innovative firms, indicating a positive moderating impact of innovation on the relationship
between international diversification and credit scores. This would suggest that firms’ spending on
innovation seems to make for more-optimistic creditor sentiments on the firms’ abilities to achieve the
greater benefits of high international diversification that exceed the costs and risks. Third, the results of
our additional tests indicate greater sensitivity to the level of competitive intensity within an industry.
In particular, the relationship between international diversification and credit scores is only significant
for firms in competitive industries. They also show that a firm’s credit score becomes less dependent
on international diversification for large firms, firms in the manufacturing sector, and firms distant from

5
key metropolitan areas, such as London. There is an extensive body of existing work that seeks to bring
together TCE and the RBV (Ancarani, Di Mauro, & Mascali, 2019; Silverman, 1999). What this study
adds to this literature is that it explores how RBV effects are most pronounced at the earlier stages of
internationalisation and TCE ones at the later ones. Although it might be presumed that the
consequences of internationalisation are non-linear, this study highlights how transaction costs
gradually overwhelm any influences – and abilities to offset risks – that might come with greater
international exposure. In other words, we seek to explore the fullest possible effects of transaction
costs, not only where their consequences seemingly override resource advantages (Foss, 2003), but also
when the latter are augmented through greater R&D; they may alleviate such tendencies.
The remainder of the paper proceeds as follows. Section 2 develops the theoretical framework and
hypotheses to test the impact of international diversification on credit scores. Section 3 describes the
methods and data used in this study. Section 4 provides the results of the main analyses, robustness
checks, and additional tests. Section 5 presents the discussion and conclusion, including the implications
and limitations of the study.
2 Theoretical framework and hypothesis development
A great deal of previous studies in international business literature has examined (and provided mixed
evidence on) the relationship between the degree of international diversification and firm’s financial
performance. Some researchers (e.g., Denis, Denis, & Yost, 2002; Lu & Beamish, 2001) posit linear
effects of international diversification on performance, while others (Almodóvar, 2012; Benito-Osorio
et al., 2016; Boehe & Jiménez, 2016; Brock et al., 2006; Lee, 2010) suggest threshold effects (e.g., U-
shaped, inverted U-shaped, S-shaped, and M-shaped curves). However, a considerable amount of
international business studies use return on equity as a performance measure, without taking into
consideration the effect of financial leverage in the firm’s capital structure. According to Nguyen (2017,
pp.329-330), “the higher the level of debt, the higher the ROE, but it also implies higher bankruptcy
risks, financial distress and cost of capital for the firm”. Hence, studies on international diversification-
performance relationship that do not consider risks may suffer from deep flaws in their methodology
(Bowe et al., 2010). In this study, we contribute to the literature by using a multidimensional measure
that does not only capture the firm’s profitability but also captures the dimension of default risk.4
We argue that the link between international diversification and credit scores is determined by the
benefits, costs, and risks associated with going international. While the arguments about the benefits of
international diversification are largely drawn from the RBV logic (Barney, 1991), the arguments
4 In this study, we adopt firms’ credit scores from the Bureau Van Dijk Financial Analysis Made Easy (FAME)
database. In addition to profitability, the calculation of these credit scores is based on firm’s solvency, leverage,
liquidity, business structure, capitalisation, working capital, cash flow, productivity, shareholder funds, lateness
in filing accounts, and the presence on the public file of any adverse documents against the company.

6
related to the increasing costs and risks associated with over-diversification are based on TCE (Hitt et
al., 1997). It is worth noting that there is no consensus on the contributions of employing theoretical
triangulations in accounting and business research. For instance, Kirca et al. (2011) criticise the
approach of using multiple theories to advocate for a particular shape of the international diversification
and firm performance relationship on the grounds that it becomes very difficult to link the results back
to the confirmation, extension, or rejection of any theory.
Despite these criticisms, the deployment of multiple theories is not without its merits. That is, using a
single theory may constrain the discussion of any elements outside of it (Lukka & Mouritsen, 2002). In
this study, we provide new insights on an understudied phenomenon: the impact of international
diversification on credit scores, drawing upon the RBV and TCE propositions. These two theories do
not structurally contradict each other and, indeed, may complement each other, illuminating the
complexity of the phenomenon under study. As Lampel and Giachetti (2013, p. 214) argue, “although
each may take a different view of the factors that drive and limit international diversification, a careful
reading of the explanations they advance suggests these factors are often two sides of the same coin.”
Combining both TCE and the RBV enriches our understanding of the externalisation of activities; whilst
the RBV focuses on firm-specific resources and capabilities, TCE focuses on external governance issues
and how these affect interfirm relationships (Ancarani et al., 2019; Lo, Frias, & Ghosh, 2012; McIvor,
2009; Peris Bonet, Peris-Ortiz, & Gil-Pechuan, 2010). In interacting with each other, firms may align
two different elements of value creation: “heterogenous, firm-specific capabilities/resources” and what
is imparted by governance structures (Lo et al., 2012, p. 1282). Intrafirm resource may indeed exist
interdependent of cooperative external relations yet together may impact back on the wider context (Lo
et al., 2012). It can also be argued that resources can be exploited through both diversification and
efficiency in contracting (Silverman, 1999).
In support of our argument, for example, some argue that combining TCE with the RBV would provide
more-encompassing explanations of managers’ decisions to enter foreign markets than employing either
logic solely (e.g., Li, Eden, Hitt, & Ireland, 2008; Martin & Salomon, 2003). This is because the entry
decision depends not only on risk and control considerations (TCE) but also on the firm’s capabilities
and hard-to-imitate resources (RBV), such as experience and knowledge, which can influence
managers’ perceptions of host market costs (Surdu & Mellahi, 2016). The RBV and TCE can also be
combined to obtain a better understanding of the benefits and costs associated with greater diversity at
different levels of international diversification (e.g., Hitt et al., 1997), thus complementing the
deficiencies of using either perspective alone. Similarly, Mohr, Wang, and Goerzen (2016) hold the
view that the RBV and TCE provide complementary, rather than competing, explanations of the effects
of greater diversity within multiparty international joint ventures. As such, combining these two theories

7
offers a much finer-grained view of the link between international diversification and credit scores than
using them in isolation.
From the RBV logic, international diversification helps firms to use their internal resources and
capabilities effectively to exploit the inefficiencies in international markets (e.g., differences in national
resources), thereby achieving greater returns (e.g., Barney, 1991; Peng, 2001; Robins & Wiersema,
1995; Silverman, 1999). Internationally diversified firms can also exploit economies of scale with their
internal resources (Hitt et al., 1997) and realise potential locational advantages by applying innovations
and diverse ideas, often generated in divisions/units operating in different geographical locations
(increasing the knowledge spillover between divisions).
Firms can effectively utilise their intangible hard-to-imitate resources in cross-border operations in
order to offset risks and enhance their performance (e.g., Silverman, 1999; Wan, Hoskisson, Short, &
Yiu, 2011). By engaging in cross-border operations, firms can benefit by gaining knowledge about
foreign markets and can also apply the knowledge and skills gained in their home country operations in
different global markets to improve their financial performance (Kostova & Roth, 2002; Love, 1995;
Porter, 1990; Zahra, Ireland, & Hitt, 2000). Existing literature suggests that profitable firms have
significantly higher credit ratings (Alissa, Bonsall IV, Koharki, & Penn Jr., 2013; Ashbaugh-Skaife,
Collins, & LaFond, 2006). Thus, we would expect a positive relationship between international
diversification and credit scores. However, this impact may not be linear, given the increasing costs and
risks associated with high levels of international diversification which will offset the benefits achieved
(Batsakis & Mohr, 2017).
Based on TCE, highly diversified firms are likely to experience higher transaction costs (e.g., logistical
costs, trade barriers, cultural diversity, and information-processing costs); as such, firms have to
coordinate their value chains’ activities across diverse markets. In this regard, scholars (Gupta, Wilson,
Gregoriou, & Healy, 2014; Hitt et al., 1997; Jones & Hill, 1988; Krapl, 2015; Kwok & Reeb, 2000; Lu,
Liu, Filatotchev, & Wright, 2014; Roth, 1992; Tsai, 2014) argue that firms tend to overstretch their
internal resources as they continue to diversify internationally. At high levels of diversification, the
transaction costs will exceed the benefits derived from international diversification, which requires
coordination across different and isolated geographical regions (Capar & Kotabe, 2003; Kim & Mathur,
2008), leading to a decrease in the returns on their investments and thus diminishing profits (Hitt et al.,
1997).
It has been argued that moderately diversified firms yield higher returns than their highly diversified
counterparts (Zúñiga-Vicente, Benito-Osorio, Guerras-Martín, & Colino, 2019). Hence, firms enjoy a
higher financial performance at low and moderate levels of international diversification, but their
performance slows down and eventually becomes negative as international diversification intensifies
8
(Hitt et al., 1997), which may lead to lower credit scores at higher levels of diversification. In addition,
the costs associated with international diversification may increase the level of firm risk. In reference
to transaction costs, Hitt and his colleagues suggest that these costs may differ greatly across different
geographical regions, which in turn increases firms’ risks (and exposure to environmental uncertainty),
and “these risks cannot be easily hedged” (1997, p. 773). Along the same lines, Clemons, Reddi, and
Row (1993) suggest that transaction risks represent a major component of transaction costs. Three
factors can lead to an increase in the transaction risks associated with internationalisation, namely
environmental uncertainty, information asymmetry (especially in offshoring and outsourcing
situations), and the risks associated with the investments in asset specificity necessary to support the
transaction (Stratman, 2008).
Studies on international diversification and risk (e.g., Krapl, 2015; Olibe, Michello, & Thorne, 2008;
Reeb, Kwok, & Baek, 1998) have suggested that international diversification increases the systematic
risk5. This is because internationally diversified firms are exposed to more-complex operating
environments, unfavourable tax regimes, political risk, corruption, fluctuations in foreign exchange rate,
and the opportunistic behaviour of local actors (Mahajan, Muller, & Bass, 1990; Michel & Shaked,
1986; Pantzalis et al., 2008; Reeb et al., 1998). Such institutional challenges increase the uncertainty
about the firm’s growth prospects (Reeb, Mansi, & Allee, 2001), thus increasing firm-unique risk which
could absorb the international diversification benefits. In the words of Nguyen (2017, p. 325), “financial
risks, such as exchange rate fluctuations and inflation … might offset the benefits of earnings stability
derived from worldwide portfolio diversification”. The impact of such risks depends on the level of
diversification as the risks associated with international diversification are higher for highly diversified
firms (Krapl, 2015).
In light of all the above discussions, we argue that low and moderate levels of international
diversification are associated with higher credit scores. This is because in firms that are not highly
diversified, the benefits outweigh the costs (Pantzalis et al., 2008), diversification is less complex or
less difficult to manage (Lu et al., 2014), and the level of risk is lower (Krapl, 2015). However, at high
levels of diversification, the benefits of international diversification begin to decrease with the
increasing costs and risks, which could have a negative impact on firms’ credit scores. Thus, we propose
an inverse U-shaped curvilinear relationship between international diversification and credit scores; the
slope and shape of this nonlinear relationship between international diversification and credit scores
varies with the level of international diversification.
5 The systematic risks arising from international diversification include exchange rate, political, and cross-cultural
risks (Reeb et al., 1998; Strange, 2018).

9
H1. The relationship between international diversification and firms’ credit scores is nonlinear, with
the slope positive at low and moderate levels of international diversification but negative at high levels
of international diversification.
Although our proposed curvilinear relationship between international diversification and credit scores
should hold for all firms, the net influence of international diversification could vary across firms due
to the heterogeneity in firms’ resources and capabilities. Under the RBV, firms are bundles of unique
resources and capabilities (Barney, 1991; Peteraf, 1993). With these unique resources and capabilities,
firms are better able to realise the advantages of international diversification through maximising the
gains while minimising the associated costs/risks (Kotabe et al., 2002). Firms with innovative
capabilities can also mitigate the liability of foreignness due to the acquisition of foreign markets
knowledge and experience as they expand into different host markets by leveraging their knowledge
and capabilities (cf. Grant, 1996). Thus, innovation in products and/or processes can moderate the
relationship between international diversification and credit scores.
Extant studies have suggested that innovation is a key driver of better firm performance (e.g., Jiménez-
Jiménez & Sanz-Valle, 2011). When going international, innovation becomes important to produce
greater organisational efficiencies (Grant, Jammine, & Thomas, 1988) and to gain competitive
advantages in international markets (Franko, 1989; Porter, 1990). To produce innovation, firms invest
in long-term capabilities such as R&D (Hitt et al., 1997). These firms should be able to generate
abnormally high returns from their international expansion through economies of scale and scope,
learning economies, and the exploitation of market imperfections (Kotabe et al., 2002).
Empirically, McGuinness and Little (1981) found that innovative new products that have certain new
product characteristics enjoy better export performance. Based on a sample of US firms, Braymen,
Briggs, and Boulware (2011) suggest that innovation in processes and products helps firms to reduce
production costs and produce a variety of goods with rising demand in global markets. In export
markets, therefore, innovative firms can increase the sale volumes of their better-quality goods or obtain
a higher mark-up, resulting in sales growth (Golovko & Valentini, 2011).
On the other hand, in spite of the previously mentioned benefits, innovation can be a risky undertaking
(Eisenhardt & Martin, 2000). More advanced technologies bring with them greater challenges in
understanding, communicating, and integrating their effects (Cheah, Bellavitis, & Muscio, 2020).
Again, as R&D is often more commonly organised via hierarchies, rather than markets, greater intensity
may make for complexity in exchange relations (Wang, Libaers, & Park, 2017). Hence, greater R&D
intensity is likely to raise transaction costs (Cheah et al., 2020).
However, recent applied evidence suggests different outcomes. For example, Purkayastha, Manolova,
and Edelman (2018) conclude that greater R&D intensity is associated with greater internationalisation,

10
as any problems may be mitigated through internal structures and governance. Booltink and Saka-
Helmhout (2018) argue that internationalisation seems to create more opportunities to exploit R&D
advantages more effectively. As Hitt, Hoskisson, and Ireland (1994, p. 307) state, “international
diversification provides the potential for firms to achieve greater returns on innovations (larger and/or
a greater number of markets with different demand characteristics) and thus, lowers the risks of R&D
investments.” This is in line with the contention of Golovko and Valentini (2011) that exports and
innovation are complementary strategies for firms’ growth. Thus, the returns on innovations will be
greater in highly diversified firms.
In this study, we posit that firms with innovative capabilities, measured by R&D intensity, will be able
to achieve greater advantages from international diversification that exceed the associated costs and
risks, thereby having higher credit scores. In particular, highly diversified firms, which experience
higher transaction costs, including both coordination costs and transaction risks, will benefit from the
investment in R&D such that the transaction costs do not exceed the benefits of multinationality. As
such, high levels of internationalisation associated with R&D intensity will have a positive influence
on credit scores. Furthermore, investment in R&D contributes to the development of firm-level
absorptive capacity (Cohen & Levinthal, 1990), which in turn enables firms to acquire external
knowledge and generate innovation (e.g., Khan, Lew, & Marinova, 2019). Thus, we suggest that:
H2. R&D intensity positively moderates the curvilinear relationship between international
diversification and firms’ credit scores.
Figure 1 illustrates the conceptual framework of this study.
Figure 1. Conceptual framework and hypothesis
To summarise, we propose a curvilinear relationship between international diversification and firms’
credit scores that begins positive but eventually becomes negative with high levels of international
diversification. While the RBV highlights the benefits of international diversification, TCE explains
how the increasing costs and risks associated with high levels of international diversification will offset
the benefits achieved, thus explaining the proposed inverse U-shaped relationship between international
diversification and credit scores. Firms with unique capabilities and resources, according to the RBV,

11
will be able to achieve the greater benefits of international diversification; therefore, we propose that
R&D intensity moderates the relationship between international diversification and credit scores.
3 Methods
3.1 Data collection and sample
To conduct our empirical analysis, we collected data on UK firms from FAME database, which provides
data for the largest number of UK companies in comparison with other databases. Our sample consisted
of 11,118 UK firms that had credit scores between 2016 and 2017 and had filed their full accounts in
accordance with International Financial Reporting Standards (IFRS). We excluded 3,408 firms
operating in the financial industry, as they are subject to different regulations from other industries. We
also excluded 1,153 firms with missing data on the control variables. Our final sample, therefore,
included 6,557 firms. Table 1 reports the sample distribution by industry. The sample consisted of eight
broad industries defined according to the Standard Industrial Classification (SIC) code. The largest
portion came from ‘Services’ (46.58%), followed by ‘Manufacturing’ (14.47%) and ‘Transportation,
Communications, and Utilities’ (13.82%).
[Insert Table 1 here]
3.2 Variable measurement
The dependent variable in the study was the credit score (𝐶𝑟𝑒𝑑𝑖𝑡_𝑆𝑐𝑜𝑟𝑒) provided by the FAME
database, which captures the likelihood of a business becoming insolvent over a period of 12 months,
ranging from 0 to 100, with lower scores indicating a greater probability of default risk. This proxy has
been used in previous accounting and finance studies (e.g., Dedman & Kausar, 2012; Peel, 2018) and
is preferred over other ratings, such as those developed by Standard and Poor’s (S&P), Moody’s, and
Fitch, as these ratings are only available for a small number of UK firms (i.e., for those that voluntarily
choose to get rated). The majority of companies decide not to get rated because the cost of getting rated
is asymmetrically severe if the rating is later downgraded (Palepu, Healy, & Peek, 2016).
For the independent variables, the two main variables were international diversification (Int_Div),
measured as the percentage of international sales to total sales, and Int_Div_SQ, measured as the
squared percentage of Int_Div. We also included RD_Intensity in the analysis to examine the
moderating impact of innovation on the relationship between international diversification and credit
scores. Similar to prior research (e.g., Block, 2012; Fratianni & Oh, 2009), RD_Intensity was measured
as the ratio of R&D expenditure to total assets.

12
In addition to the independent variables, we included a number of control variables suggested in earlier
literature (e.g., Alissa et al., 2013; Dedman & Kausar, 2012; Florou, Kosi, & Pope, 2017; Peel, 2018).
The return on capital employed (ROCE) is the ratio of profit before tax to capital employed. Sales
growth (Sales_Growth) is the percentage change in the firm’s sales from period t-1 to t. The firm’s net
working capital ratio (WC_TA) is calculated by dividing working capital by total assets. The firm’s
leverage (LEV) is the ratio of long-term debt to total assets. Firm size (SME) is an indicator that takes
the value of 1 if the firm is classified as a small or medium-sized enterprise by the FAME database and
0 otherwise6. Firm age (AGE) is the natural logarithm of the years since the firm’s incorporation. We
also included an indicator variable (NEG_EQTY) that took the value of 1 for firms with negative equity
and 0 otherwise. In addition, we included a regional classification variable (Geographic_Locus) ranging
from domestic to global, which captures the geographical locus in which firms’ international activities
are carried out (for all models, the reference group is domestic). We provide detailed variable definitions
in Appendix I.
3.3 Estimation methods
We first employed the following model to examine whether international diversification affects firms’
credit scores:
𝐶𝑟𝑒𝑑𝑖𝑡_𝑆𝑐𝑜𝑟𝑒 = 𝛼 + 𝛽1𝐼𝑛𝑡_𝐷𝑖𝑣 + 𝛽2𝐼𝑛𝑡_𝐷𝑖𝑣_𝑆𝑄 + 𝛽3𝑅𝑂𝐶𝐸 + 𝛽4𝑆𝑎𝑙𝑒𝑠_𝐺𝑟𝑜𝑤𝑡ℎ + 𝛽5𝑁𝐸𝐺_𝐸𝑄𝑇𝑌 + 𝛽6𝑊𝐶_𝑇𝐴+ 𝛽7𝐿𝐸𝑉 + 𝛽8𝐴𝐺𝐸 + + 𝛽9𝑆𝑀𝐸 + 𝛽10𝐺𝑒𝑜𝑔𝑟𝑎𝑝ℎ𝑖𝑐_𝐿𝑜𝑐𝑢𝑠 + 𝐼𝑛𝑑𝑢𝑠𝑡𝑟𝑦 𝑓𝑖𝑥𝑒𝑑 𝑒𝑓𝑓𝑒𝑐𝑡𝑠+ 𝜀 (1)
Our variables of interest in model 1 were Int_Div and Int_Div_SQ. The positive coefficient of 𝛽1 and
the negative coefficient of 𝛽2 support H1.
To test the moderating impact of innovation on the relationship between international diversification
and credit scores, we estimated the following regression equation:
𝐶𝑟𝑒𝑑𝑖𝑡_𝑆𝑐𝑜𝑟𝑒 = 𝛼 + 𝛽1𝐼𝑛𝑡_𝐷𝑖𝑣 + 𝛽2𝐼𝑛𝑡_𝐷𝑖𝑣_𝑆𝑄 + 𝛽3𝑅𝐷_𝐼𝑛𝑡𝑒𝑛𝑠𝑖𝑡𝑦 + 𝛽4𝐼𝑛𝑡_𝐷𝑖𝑣 × 𝑅𝐷_𝐼𝑛𝑡𝑒𝑛𝑠𝑖𝑡𝑦 + 𝛽5𝐼𝑛𝑡_𝐷𝑖𝑣_𝑆𝑄× 𝑅𝐷_𝐼𝑛𝑡𝑒𝑛𝑠𝑖𝑡𝑦 + 𝛽6𝑅𝑂𝐶𝐸 + 𝛽7𝑆𝑎𝑙𝑒𝑠_𝐺𝑟𝑜𝑤𝑡ℎ + 𝛽8𝑁𝐸𝐺_𝐸𝑄𝑇𝑌 + 𝛽9𝑊𝐶_𝑇𝐴 + 𝛽10𝐿𝐸𝑉 + 𝛽11𝐴𝐺𝐸+ + 𝛽12𝑆𝑀𝐸 + 𝛽13𝐺𝑒𝑜𝑔𝑟𝑎𝑝ℎ𝑖𝑐_𝐿𝑜𝑐𝑢𝑠 + 𝐼𝑛𝑑𝑢𝑠𝑡𝑟𝑦 𝑓𝑖𝑥𝑒𝑑 𝑒𝑓𝑓𝑒𝑐𝑡𝑠 + 𝜀 (2)
In model 2, our variables of interest were Int_Div×RD_Intensity and Int_Div_SQ×RD_Intensity, which
measured the effect of innovation on the relationship between international diversification and credit
scores. The positive coefficients of 𝛽4 and 𝛽5 support H2.
In both models, we included industry fixed-effects dummy variables to control for heterogeneity across
industries. We further ran several robustness tests (as reported in Section 4.2) to test for the existence
6 The total assets variable is not always a good measure of firm size because not all assets contribute equally to a reduction in
credit risk. Intangible assets and current assets (e.g., accounts receivable) are more likely to be the major causes of a company’s
financial difficulties, rather than risk-reducing factors (Palepu et al., 2016).

13
of a sigmoid function, reverse causality, and endogeneity. In addition, we conducted additional tests (as
reported in Section 4.3) to examine whether the impact of international diversification on credit scores
differed according to industry competition, industry sector, firm’s distance to London, and firm size.
4 Results
4.1 Main results
Table 2 reports the descriptive statistics for the variables used in the regressions. To mitigate the
influence of outliers, all continuous variables were winsorised at the top and bottom 1% of their
respective distributions. The mean value of Int_Div was 0.129, suggesting that foreign sales accounted
for 12.9% (or approximately 13%) of total sales, which is somewhat comparable to the figures reported
in prior studies (e.g., Berrill, Kearney, & O’Hagan-Luff, 2019; Capar & Kotabe, 2003).7 The mean
value of SME was 0.602, indicating that about 60% of the sample firms were small or medium-sized.
[Insert Table 2 here]
Table 3 reports the correlation coefficients among the variables used in the regressions. Most of the
correlations between the dependent variable (Credit_Score) and other variables were significant at the
5% level and below. The correlations among the independent variables indicate no problem of
multicollinearity. In support of this assertion, the untabulated results of the variation inflation factor
(VIF) test show that all VIF values were much lower than the critical cut-off point of 10.8
[Insert Table 3 here]
Table 4 reports the empirical results of the regression analyses testing the effect of international
diversification on credit scores. The F-tests indicate that all model coefficients were jointly significant,
indicating that the model was well specified overall. The variables in each of the regressions were jointly
significant, according to the F-tests. The first column of Table 4 shows that the effect of international
diversification (Int_Div) on firms’ credit scores (Credit_Score) was statistically significant, and the
regression model accounted for 26% of the variance in firms’ credit scores, which is comparable to
prior research (e.g., Capar & Kotabe, 2003).
7 As a follow-up, we ran a one-way analysis of variance (ANOVA) to see if there was any group difference in credit scores
for firms below and above the 13% threshold level. The untabulated results reveal that the high international diversification
group of firms had a higher average credit score (µ=81.88, σ=21.60) than the low international diversification group of firms
(µ=77.05, σ=22.76), and the difference was statistically significant (F=47.97, p=0.000). 8 However, it is important to note that multicollinearity or a high VIF score does not necessarily lead to spuriously significant
results. This is particularly true because multicollinearity does not violate any regression assumptions (Wooldridge, 2014) and
does not deflate (but rather inflates) the standard errors of coefficients, making it harder to find statistical evidence for
relationships between the independent and dependent variables. As Lindner, Puck, and Verbeke (2020) suggest, “the higher
the collinearity, i.e., the higher the VIFs, the harder it is to find statistical evidence of a relationship” (p. 287).

14
In particular, there was a statistically significant and positive relationship between Int_Div and
Credit_Score (β=0.125, t-statistic=3.47) whereas there was a negative relationship between
international diversification squared (Int_Div_SQ) and Credit_Score (β=-0.132, t-statistic=-3.246).9
These two relationships combined indicate that a curvilinear (inverted U-shaped) relationship exists
between international diversification and firms’ credit scores. This result provides support for H1.
[Insert Table 4 here]
As far as the firm-level control variables are concerned, firms with higher WC_TA and Sales_Growth
had higher credit scores. Among the control variables, LEV and NEG_EQTY were negatively
associated with Credit_Score. This is consistent with the findings of a number of studies (e.g., Alali,
Anandarajan, & Jiang, 2012; Choi, Kim, & Lee, 2011; Dedman & Kausar, 2012; Kim, Simunic, Stein,
& Yi, 2011), demonstrating that credit scores are lower for firms with higher leverage and negative
equity due to higher borrowing costs. Firm age was positively associated with Credit_Score, suggesting
that credit scores are higher for mature, well-established, or widely recognised firms, which is consistent
with earlier work (Pittman & Fortin, 2004). The association between Credit_Score and SME was
negative, indicating that larger enterprises have higher credit scores than SMEs do.
To examine the curvilinear relationship between international diversification and credit scores in more
depth, we cluster-analysed the sample of firms, grouping them by their international diversification
scores following a procedure used by Hitt et al. (1997). The analysis suggested two subgroups: subgroup
1 consisted of 1,340 highly diversified firms (with scores of 0.11 and above and an average value of
0.62), while subgroup 2 consisted of 5,217 non-diversified, lowly/moderately diversified firms (with
scores below 0.11). We then ran a one-way ANOVA to see if the group means were significantly
different from each other. The ANOVA test results (untabulated) show that the highly diversified group
had an average credit score that was higher (µ=82.14, σ=21.37) than the low/moderate group (µ=76.94,
σ=22.80), and the difference was statistically significant (F=56.84, p=0.000).
We also developed regression models for each group to examine the relationship between international
diversification and credit scores. The untabulated results of the analysis based on clustering the firms
into two subgroups, the lowly and moderately diversified group and the high diversified group, show
that the relationship between Int_Div and Credit_Score was positive for the low and moderate
diversified group but negative for the highly diversified group. This confirms the hypothesised inverse
U-shaped curvilinear relationship. Our findings suggest that firms can, indeed, take advantage of their
diversification. However, the effect of diversification eventually levels off and then becomes negative
9 We performed additional regression to check whether scaling foreign sales by total assets instead of total sales affected our
results. The results were essentially the same as when scaling by total sales.

15
(the inflection point for the curve is 0.473); after this point the diversification benefits will be
depreciated as the costs that comes with over-diversification outweigh the benefits.
Columns 2 and 3 of Table 4 report the results of the regression analysis testing the moderating impact
of innovation on the relationship between international diversification and firms’ credit scores.
Consistent with our prediction, our results show that RD_Intensity had a statistically significant and
positive impact on the relationship between Int_Div_SQ and Credit_Score (β=0.469, t-statistic=2.942),
while its impact on Int_Div was only marginally significant at the 10% level (β=0.142, t-
statistic=1.651).10 As such, innovative firms are better able to maximise the (net) benefits of
international diversification at the point where the total benefits of multinationality exceed the total
costs. This result provides support for H2.
4.2 Robustness checks
We also performed a battery of robustness checks. First, we tested for the existence of a sigmoid
function (S-curve) using the cubic term of the international diversification variable (Int_Div_cubic).
Our untabulated results show that the linear and quadratic regression coefficients for Int_Div and
Int_Div_SQ were significant, but the coefficient for Int_Div_cubic was insignificant (β=0.249, t-
statistic=1.516). These results confirm our earlier findings on the inverted U-shaped relationship
between international diversification and credit scores, with all signs and levels of significance closely
corresponding to those found for the coefficients in Table 4. Thus, we found no evidence of an S-shaped
pattern.11
We also plotted the relationship between international diversification and credit scores using the actual
(and predicted) values from our sample, as shown in Figure 2. The figure shows that credit scores first
increase as firms diversify internationally and then decrease at extremely high levels of diversification.
Second, similar to prior research (e.g., Ren, Eisingerich, & Tsai, 2015), we examined the possibility of
‘reverse causality’ by running a reverse regression in which the international diversification variable
was viewed as endogenous to firms’ credit scores and the other variables. The model assumed that
10 We replaced R&D_Intensity with the ratio of intangible assets to total assets, but we could not find any significant effect
(either direct or indirect) on firms’ credit scores. Perhaps that is because although intangible assets represent an important
input into the innovative process, the intangible assets/total assets ratio is not an accurate measure of innovation than R&D
(R&D_Intensity has emerged as the most robust/reliable measure of innovation in the multinationality literature). From an
accounting perspective, the concept of ‘intangible assets’ has a much broader sense than the strict technical one it has in R&D.
For instance, it includes items that are not related to R&D, such as goodwill. More critically, R&D rarely meet the criteria for
being recognised as an intangible asset. According to IAS 38 (Intangible Assets), all expenditure incurred at the research stage
is to be written off to the income statement as an expense when incurred, and hence it will never be capitalised as an intangible
asset; whereas the development expenditure is capitalised as an intangible asset if certain criteria are met. This means that only
a proportion of the development costs during the development stage is capitalised. 11 The evidence in this study corroborates the findings of prior research (e.g., Berry & Kaul, 2016; Pisani et al., 2020)
examining the multinationality–performance relationship but failing to find evidence of an S-shaped relationship.

16
firms’ credit scores affect their international diversification and not the other way around.12 The
untabulated results show that the coefficient on Credit_Score was statistically insignificant (β=0.019, t-
statistic=1.104). This evidence suggests that the direction of causality runs from international
diversification to credit scores, rather than the other way around; thus, we rejected the possibility of
reverse causality.13
Figure 2. International diversification versus credit scores
The graph plots the relationship between international diversification and credit scores in a sample of UK
firms, showing credit scores first increasing as firms expand internationally then decreasing at extremely high
levels of diversification (creating an inverted U-shaped curvilinear relationship).
Another concern with our inference was that it might have been affected by the potential sample
selection and the endogeneity of a firm’s internationalisation (see, for example, Reeb, Sakakibara, &
Mahmood, 2012). In particular, firms may self-select to go international, and this choice may be driven
by factors that also affect their credit scores. We addressed this concern by adopting one-to-one
12 We also re-estimated model 1 using the lagged values of Int_Div and Int_Div_SQ. The results were qualitatively the same
as those tabulated. 13 In further analysis (untabulated), we conducted a path analysis to establish whether internationalisation affects credit scores
indirectly through firm performance (mediation effect). We found that the ‘direct’ effect of international diversification on
credit scores remained statistically significant, whereas the ‘indirect’ effect running from international diversification to credit
scores through firm performance was insignificant, suggesting that there was no mediation.

17
propensity score matching (PSM), which controlled for sample selection based on observable
differences in firm characteristics and unobservable industry heterogeneity among highly and
lowly/moderately diversified firms. As we had more observations for lowly/moderately diversified
firms, we considered highly diversified firms to be the treated group and lowly/moderately diversified
firms to be the control group. The propensity scores were estimated using probit regression based on all
the control variables in our baseline regression (given by equation 1), as well as industry effects. Panel
A in Table 5 presents the pairwise differences between the mean credit scores of the treated and control
firms. We found that the credit scores for highly diversified firms were, on average, 5.20 and 1.47
percentage points higher than those for lowly/moderately diversified firms. Panel B presents the results
from our re-estimation of the baseline regression model using the PSM sample, and the results confirm
our earlier baseline findings.
[Insert Table 5 here]
4.3 Additional tests
To provide a more comprehensive picture of the effect of international diversification on firms’ credit
scores, we investigated whether this effect is sensitive to the degree of competitiveness in an industry.
The extant literature indicates that increasing competition has a negative effect on profits (Boubaker,
Saffar, & Sassi, 2018; Bowen & Wiersema, 2005; Peress, 2010; Slade, 2004), which in turn increases
the liquidation risk, thereby affecting managerial incentives (Schmidt, 1997). Under the threat of
liquidation, corporate executives will have strong incentives to increase profits and reduce costs to avoid
going into insolvent liquidation. To this end, the executives of firms in competitive industries tend to
expand internationally to buffer the effects of competition (Hitt, Tihanyi, Miller, & Connelly, 2006).
On the other hand, the executives of firms in concentrated/highly concentrated industries will have
different incentives than those in competitive industries due to their monopolistic position. We
calculated the Herfindahl–Hirschman Index (HHI) to measure the degree of industry competition. The
HHI is computed by summing the squared market shares of all firms competing in an industry. A firm’s
market share is given as a ratio of the firm’s sales to total sales in its industry. The HHI can range from
close to 0 to 10,000, with higher values indicating greater industry concentration. We split the sample
firms into two subgroups: subgroup 1 consisted of firms operating in highly competitive industries
(HHI≤1,500), while subgroup 2 consisted of firms operating in concentrated or highly concentrated
industries (HHI>1,500). We then ran model 1 for each group to examine whether the level of
competition within the industry influences the impact of international diversification on credit scores.
Columns 1 and 2 of Table 6 show that the relationship between international diversification and credit
scores was significant only for firms operating in industries with higher levels of competitive intensity

18
(Int_Div, β=0.131, t-statistic=3.09; Int_Div_SQ, β=-0.149, t-statistic=-3.06). However, the relationship
between international diversification and credit scores was not significant for firms operating in
concentrated and highly concentrated industries. This means that low and moderate levels of
international diversification are beneficial for firms in industries with high levels of competition,
whereas high levels of international diversification have a negative impact on their credit scores,
indicating an inverted U-shaped relationship. The credit scores of firms operating in concentrated or
highly concentrated industries, however, are less dependent on international diversification.
[Insert Table 6 here]
We also ran the analysis (model 1) for manufacturing firms and services separately, as these two sectors
behave differently (Farok, Vikas, Sumit, et al., 2007). The results in columns 3 and 4 of Table 6 show
that the inverted U-shaped relationship we found in our main analysis stood only for services;
international diversification had an insignificant impact on the credit scores of manufacturing-based
firms.
Further, we investigated the sensitivity of the relationship between international diversification and
credit scores to the firm’s distance from London, being the main financial centre in the UK. Prior studies
have investigated different topics related to the distances between firms and their lenders or financial
centres. For example, DeYoung, Glennon, and Nigro (2008) analysed borrower–lender distance, credit
scoring, and loan performance using a sample of SMEs in the US, while Saunders and Steffen (2011)
investigated the impact of firm distance from central London on SMEs’ tendency to go public. In the
present study, the distance variable was the driving distance between the headquarters of the firm in the
postcode area and the centre of London using the road network measured in miles, as in the work of
Saunders and Steffen (2011). We clustered the firms into ‘close to London’ and ‘distant from London’
based on the median of the distance variable (31.4 miles).14 In Table 7, columns 1 and 2 reveal that the
impact of international diversification was significant only for firms close to London. Column 3 in
Table 7 shows that firms distant from London tended to have higher credit scores.15
Although we controlled for firm size in model 1, we re-ran the model for SMEs and large firms
separately. This is because SMEs may benefit from international diversification more than larger firms
do (Loth & Parks, 2002). By doing so, we investigated whether the impact of international
14 To examine the difference between the mean values of the credit scores across the two distance groups (distant vs. close), a
one-way ANOVA was carried out, and the untabulated results of the ANOVA reveal that there was a statistically significant
difference between the two means (F=20.56, p=0.000). In addition, Appendix II (Panels A and B) reports the results from a
Tukey post hoc test performed to determine the mean difference between the two distance groups and whether the difference
between the group means was statistically significant. The results reveal that the mean difference between the two groups
(distant vs. close) was 3.06 and was statistically significant. Our results indicate that firms that were geographically close to
London had credit scores that were statistically significantly lower (µ=77.34, σ=23.12) compared to distant firms (µ=80.40,
σ=20.55). 15 Model 3 reveals the direct impact of distance from London on firms’ credit scores.

19
diversification on credit scores is sensitive to firm size. Columns 4 and 5 in Table 7 show that
international diversification had a significant impact on SMEs’ credit scores but not on the credit scores
of large firms.
[Insert Table 7 here]
5 Discussion and conclusion
In this paper, we have argued that the benefits, costs, and risks associated with international
diversification are the three channels through which international diversification influences credit
scores. The arguments about the benefits of international diversification were based on the RBV logic
(Barney, 1991; Peteraf, 1993), whereas the arguments related to the increasing costs and risks associated
with over-diversification were drawn from TCE (Hitt et al., 1997). Using a large sample of 6,557 UK
firms, we found that low and moderate levels of international diversification were associated with
higher credit scores; however, high levels of international diversification were associated with lower
credit scores.
As per the RBV logic, firms can create economies of scale advantages through leveraging their firm-
specific resources and capabilities in new markets (Teece, 1982), which influences firms’ performance
positively, thus lowering their credit risk. Firms can also benefit from international diversification by
spreading their fixed costs across international markets, achieving economies of scale (Kobrin, 1991).
It is not surprising that realising economies of scope and scale via international diversification has a
positive impact on credit scores, as it contributes to better firm performance. This is consistent with the
findings of Griffin, Hong, and Ryou (2018), who suggest that “firms’ economies of scale and
profitability associate with better credit ratings” (p. 361). Furthermore, operating in foreign markets can
also improve firms’ capabilities and knowledge bases through experiential learning (Vermeulen &
Barkema, 2001; Puthusserry et al., 2020), thereby improving their financial performance.
Another possible explanation of the positive effect of international diversification on credit scores is
that firms operating across international markets have operational flexibilities that contribute to risk
diversification and lower earnings fluctuations (Kim et al., 1993), which translate into lower credit risk.
This is because operating in multiple national markets helps a firm to face the aggressive challenges of
its local competitors (Kim & Mauborgne, 1988). Firms that engage in international diversification can
also minimise the impacts of adverse changes in a country’s goods and raw materials prices, wage rates,
and interest rates through shifting production and other sites to more-favourable markets (Porter, 1986).
The lower earnings fluctuations of firms that engage in international diversification stem from their
ability to face the fluctuations in the supply and demand of one national market through their operations
in other national markets (Kim et al., 1993).

20
At a certain point, however, the increasing costs and risks of diversification outweigh the benefits due
to the complexities of managing the communication and information needed among the widespread
units operating in diverse institutional settings (Capar & Kotabe, 2003; Contractor, Kundu, & Hsu,
2003; Kim & Mathur, 2008). As such highly diversified firms are more likely to be hit by foreign
exchange uncertainty, in addition to the uncertainty that comes with the complexity of cross-border
operations; therefore, the risk involved in international diversification is higher for highly diversified
firms (Krapl, 2015).
Combining the RBV and TCE explains the inverted U-shaped relationship between international
diversification and credit scores. That is, at low and moderate levels of international diversification,
firms benefit from leveraging their unique resources across global markets by achieving economies of
scope and scale and increasing their foreign market knowledge. By leveraging their diverse host markets
knowledge—firms can mitigate their liability of foreignness and reap the benefits of diversification by
lowering transaction costs of their value chains activities. When the level of international diversification
becomes high, however, the increasing transaction costs and risks outweigh the benefits realised from
going international, and therefore the relationship between international diversification and credit score
reverses to become negative. It would be quite predictable that greater exposure to multiple institutional
regimes makes for a greater scale and scope of contextual pressures, and greater complexity in
transactions (Ancarani et al., 2019). However, it might also be presumed that as the firm becomes a
more significant international player, it may be better equipped to impact back on structural dynamics,
and mould the behaviour of other actors (cf. Lo et al., 2012). Yet, the study indicates that this is not the
case: complexity in transacting ultimately seems to overwhelm the influence—and ability to hedge
risks—that might come from greater international exposure.
We also found that innovation, captured by R&D intensity, has a positive moderating impact on the
relationship between international diversification and credit scores. R&D intensity is a reflection of the
innovative capabilities of a firm in designing unique products and improving product quality (Tsai,
2014). Unique and high-quality products provide a firm with a competitive advantage when going
international, mitigating the negative effects of high international diversification on firm performance
and risk. As such, firms with innovative capabilities can generate high abnormal returns when operating
internationally through economies of scale and scope (Kotabe et al., 2002). Why is this seemingly at
odds with earlier work that suggests that transaction costs may rise with greater R&D intensity (Wang
et al., 2017)? Quite simply, it is possible that resources and (lower) transaction costs may not simply be
complementary in making for organisational effectiveness, but that each may serve in a compensatory
role for the other. In other words, higher transaction costs may be offset through greater internal
resources and capabilities. Earlier work suggests that resource utilisation may be facilitated through

21
efficiency in contracting (Silverman, 1999; Wang et al., 2017); this article suggests that the converse
may also be true.
Again, there is much evidence of improvement and then diminishing returns from R&D intensity (Kim,
2018), and this holds true for SMEs whose activities span national boundaries (Booltink & Saka-
Helmhout, 2018). Hence, this would suggest that taking account of R&D spend would not significantly
change the inverted U-shaped relationship between diversification and credit scores. However,
confirming our second hypothesis, this was not the case in our study; rather, R&D spend had the effect
of ameliorating the tendency of credit scores to diminish as diversification increases. This might suggest
that sentiments play a more important role when R&D enters the picture (Shin & Subramanian, 2019).
In turn, managers in heavily diversified firms may have the incentive to invest in R&D if they believe
that this will improve their firms’ credit scores, regardless of whether the investment pays off or not.
Again, this might suggest that exuberance may be followed by disillusionment, with speedy corrections
to credit scores.
Interestingly, we found that the effect of international diversification on credit scores is sensitive to the
degree of competition in the industry, as international diversification only influences credit scores for
firms in competitive industries. Similar to our main results, a higher level of international diversification
is not optimal for firms in competitive industries, given the costs associated with higher levels of
international diversification. It is suggested that firms facing intense competition are likely to go
bankrupt (Schmidt, 1997). This is because competition is associated with lower profits (Boubaker et
al., 2018; Bowen & Wiersema, 2005; Peress, 2010; Slade, 2004), lower firm value (Beiner, Schmid, &
Wanzenried, 2011), and increased profit/cash flow volatility (Mueller, 1977; Safdar, 2016). These
factors could affect the firm’s credit risk or creditworthiness through their negative impacts on the
accuracy or reliability of the forecasts of its future profits (Krapl, 2015). There is an extensive body of
economic history literature that suggests that the role of monopolies and oligopolies in national
economies is often underestimated (Kellner, 2019; Wallerstein, 1991). It seems that credit analysts are
well aware of this and duly reward firms that attain such a status.
When operating in international markets, however, firms in competitive industries have an advantage
over their rivals. International diversification gives firms the chance to enjoy better performance when
diversifying their operations across global markets (Kim et al., 1993; Kim & Mauborgne, 1988). As
such, international diversification seems to be a solution to face competitors in the local market, as firms
in competitive industries tend to have better performance when expanding their activities across
international markets because they can effectively utilise their firm-specific advantages. On the other
hand, our findings show that international diversification has no impact on the credit scores of firms in
concentrated/highly concentrated industries, as their monopolistic position enables these firms to
achieve high performance. Either these firms may not feel the need to seek international diversification,

22
given their dominance in the local market, or international diversification has a marginal impact on their
performance, as national sales may represent the majority of their overall sales.
An additional industry analysis showed that the relationship between international diversification and
credit scores is only significant for service-based firms. This is in part due to the fact that firms in the
service industry can reap the positive benefits of international expansion and achieve learning
advantages, as well as due to their ability to generate and assimilate new foreign knowledge (i.e., they
are knowledge-intensive). This creates a knowledge base conducive to rapid growth in international
markets in which they have little or no previous experiential knowledge (Autio, Sapienza, & Almeida,
2000). In stable manufacturing industries, the additional costs of internationalisation can, however, put
firms at a price disadvantage relative to their domestic and foreign competitors (Autio et al., 2000), thus
having a detrimental impact on their sales (Miller & Shamsie, 1996).
For firms distant from London, lenders may be more likely to use ‘hard’ information such as annual
reports and credit scores in evaluating their loan applications, rather than ‘soft’ information that may
better inform the bank’s understanding of the applicant’s business model (Udell, 2015). For this reason,
firms distant from London may have higher incentives to obtain higher credit scores. For such firms,
the impact of international diversification on credit scores could be significantly lower. This is because
such firms may employ alternative strategies to improve their credit scores, making the impact of
international diversification alone insignificant.
Finally, there are two possible explanations for the finding on the impact of firm size on credit scores.
First, SMEs could benefit from the advantages of economies of scale more than larger firms do (Loth
& Parks, 2002). Second, larger firms are more likely to have higher credit scores than SMEs, making
the impact of international diversification on their credit scores marginal.
5.1 Contributions and implications
The findings of this study offer several contributions and implications for the research on international
diversification and firm performance. First, we have contributed to the extant literature on international
diversification and firm performance by examining an understudied phenomenon of credit score,
despite growing concern among investors regarding the creditworthiness of firms. Prior studies on
international diversification and firm performance have provided contradictory findings: positive,
negative, and even mixed effects of diversification on performance. These contradictory findings may
suggest the presence of moderating variables. Thus, in this study, we introduced R&D intensity as a
moderating variable to account for the contradictory findings of previous studies on the benefits of
international diversification.

23
Second, we have supplemented the RBV logic with TCE and suggested that these theories are
complementary in explaining the relationship between international diversification and firms’ credit
scores. In foreign markets, firms face particularly severe challenges in minimising transaction costs. By
utilising internal resources – in this case R&D capabilities – firms can offset the costs and risks of
operating in international markets and enhance their credit scores through diversification.
Third, the results of this study support the idea that firms benefit from the early efforts of international
diversification, especially when the competition in the local market is high. These benefits, however,
decrease with high levels of international diversification due to the increasing transaction costs (e.g.,
logistical costs) and information-processing demands. Although excessive R&D spend may lead to
diminishing returns, it may nonetheless help to prop up credit scores.
This raises a fundamental problem: most theories incorporate many dimensions, and if one focuses on
a specific sub-dimension of economic or organisational behaviour, it may be possible to prove at least
some aspects of more than one theory ‘right’. Moreover, as Kirca et al. (2011) argue, the deployment
of multiple theories to understand the manifold dimensions of international diversification may make it
challenging to contribute to the overall development and extension of the theory. Again, Hennart (2007)
notes that if intangibles are controlled for, the relationship between international diversification and
performance becomes less clear cut than it might otherwise seem. This might suggest that there may be
a poor alignment between extrapolated theoretical predictions and the actual measurement of complex
phenomena (Verbeke, Li, & Goerzen, 2009). TCE is really about the costs of organising
interdependencies within the wider market versus within the firm (Hennart, 2007), which would suggest
that a focus on more meso- or micro-level phenomena may be more appropriate than the broad
aggregation undertaken in large-scale tests of TCE.
Again, the RBV logic tends to take significant account of unique organisational features, whereby the
understanding of the wider condition can be viewed on quite an abstract or remote level. However,
rather than too many theories, the problem may be that of too little theorising. Recent consolidations of
theory – most notably the emerging theory of interconnectedness – have highlighted the complex
interplay among physical and institutional environments, internal organisational dynamics, and firm-
level outcomes. In this particular study, we have linked theories of internal organisational capabilities
and advantages with theories that explicitly explore firms’ interactions with others in the outside world,
as well as investigated the extent to which each might influence creditworthiness, the former in terms
of innovative capabilities and the latter in terms of the scale and scope of activities.

24
5.2 Limitations and future research
Our study is subject to limitations, which suggest further opportunities for future research. First, due to
the limited availability of historical data on FAME credit scores, we were unable to examine the
association between international diversification and annual changes in credit scores. A longitudinal
examination would therefore be important to test whether our findings will hold over time, and hence
advance our understanding of how international diversification affects credit score trends. Second, as
with all econometric studies, this research might have been subject to omitted variable bias. Although
the variables included in the models were carefully chosen, they were not comprehensive of all the
potential moderators of the relationship between international diversification and credit scores, such as
the institutions in the host country wherein a firm diversifies its operations or the firm’s age at entry
(i.e., its first foreign sales). So further studies, which take these variables into account, will need to be
undertaken. Third, in this study we did not fully capture the benefits and costs associated with
international diversification, thus future studies could examine such issues. Finally, more studies are
needed, which can take the home-host country context into account and explore diversification and its
impact on credit scores. Such studies could also compare firms from different industries and countries,
and examine their level of diversification, credit scores and performance.

25
References
Alali, F., Anandarajan, A., & Jiang, W. (2012). The effect of corporate governance on firm’s credit
ratings: further evidence using governance score in the United States. Accounting & Finance,
52(2), 291–312.
Alissa, W., IV, S. B. B., Koharki, K., & Jr, M. W. P. (2013). Firms’ use of accounting discretion to
influence their credit ratings. Journal of Accounting and Economics, 55(2–3), 129–147.
Almodóvar, P. (2012). The international performance of standardizing and customizing Spanish firms.
Multinational Business Review.
Ancarani, A., Di Mauro, C., & Mascali, F. (2019). Backshoring strategy and the adoption of Industry
4.0: Evidence from Europe. Journal of World Business, 54(4), 360–371.
Ashbaugh-Skaife, H., Collins, D. W., & LaFond, R. (2006). The effects of corporate governance on
firms’ credit ratings. Journal of Accounting and Economics, 42(1–2), 203–243.
Autio, E., Sapienza, H. J., & Almeida, J. G. (2000). Effects of age at entry, knowledge intensity, and
imitability on international growth. Academy of Management Journal, 43(5), 909–924.
Barney, J. (1991). Firm resources and sustained competitive advantage. Journal of Management,
17(1), 99–120.
Batsakis, G., & Mohr, A. T. (2017). Revisiting the relationship between product diversification and
internationalization process in the context of emerging market MNEs. Journal of World
Business, 52(4), 564–577.
Beiner, S., Schmid, M. M., & Wanzenried, G. (2011). Product market competition, managerial
incentives and firm valuation. European Financial Management, 17(2), 331–366.
Benito-Osorio, D., Colino, A., Guerras-Martín, L. Á., & Zúñiga-Vicente, J. Á. (2016). The
international diversification-performance link in Spain: Does firm size really matter?
International Business Review, 25(2), 548–558.
Berg, T., Burg, V., Gombović, A., & Puri, M. (2020). On the rise of fintechs: Credit scoring using
digital footprints. The Review of Financial Studies, 33(7), 2845–2897.
Berrill, J., Kearney, C., & O’Hagan-Luff, M. (2019). Measuring the diversification benefits of
investing in highly internationalised firms. International Business Review, 28(4), 672–684.
Berry, H., & Kaul, A. (2016). Replicating the multinationality‐performance relationship: Is there an S‐
curve? Strategic Management Journal, 37(11), 2275–2290.
Block, J. H. (2012). R&D investments in family and founder firms: An agency perspective. Journal of
Business Venturing, 27(2), 248–265.
Boehe, D. M., & Jiménez, A. (2016). How does the geographic export diversification–performance
relationship vary at different levels of export intensity? International Business Review, 25(6),
1262–1272.
Booltink, L. W. A., & Saka-Helmhout, A. (2018). The effects of R&D intensity and
internationalization on the performance of non-high-tech SMEs. International Small Business
Journal, 36(1), 81–103.
Boubaker, S., Saffar, W., & Sassi, S. (2018). Product market competition and debt choice. Journal of
Corporate Finance, 49, 204–224.
Bowen, H. P., & Wiersema, M. F. (2005). Foreign‐based competition and corporate diversification
strategy. Strategic Management Journal, 26(12), 1153–1171.
Braymen, C., Briggs, K., & Boulware, J. (2011). R&D and the export decision of new firms. Southern
Economic Journal, 78(1), 191–210.
Brock, D. M., Yaffe, T., & Dembovsky, M. (2006). International diversification and performance: A
study of global law firms. Journal of International Management, 12(4), 473–489.
Capar, N., & Kotabe, M. (2003). The relationship between international diversification and
performance in service firms. Journal of International Business Studies, 34(4), 345–355.
Caves, R. E. (1982). Multinational enterprises and technology transfer. New Theories of the
Multinational Enterprise, 254–279.
Cheah, S., Bellavitis, C., & Muscio, A. (2020). The impact of technology complexity on the financial
performance of R&D projects: Evidence from Singapore. The Journal of Technology Transfer,
1–28.

26
Choi, J.-H., Kim, J.-B., & Lee, J. J. (2011). Value relevance of discretionary accruals in the Asian
financial crisis of 1997–1998. Journal of Accounting and Public Policy, 30(2), 166–187.
Clemons, E. K., Reddi, S. P., & Row, M. C. (1993). The impact of information technology on the
organization of economic activity: The “move to the middle” hypothesis. Journal of
Management Information Systems, 10(2), 9–35.
Cohen, W. M., & Levinthal, D. A. (1990). Absorptive capacity: A new perspective on learning and
innovation. Administrative Science Quarterly, 128–152.
Contractor, F. J., Kundu, S. K., & Hsu, C.-C. (2003). A three-stage theory of international expansion:
The link between multinationality and performance in the service sector. Journal of
International Business Studies, 34(1), 5–18.
Dedman, E., & Kausar, A. (2012). The impact of voluntary audit on credit ratings: evidence from UK
private firms. Accounting and Business Research, 42(4), 397–418.
Denis, D. J., Denis, D. K., & Yost, K. (2002). Global diversification, industrial diversification, and
firm value. The Journal of Finance, 57(5), 1951–1979.
DeYoung, R., Glennon, D., & Nigro, P. (2008). Borrower–lender distance, credit scoring, and loan
performance: Evidence from informational-opaque small business borrowers. Journal of
Financial Intermediation, 17(1), 113–143.
Eisenhardt, K. M., & Martin, J. A. (2000). Dynamic capabilities: what are they? Strategic
Management Journal, 21(10‐11), 1105–1121.
Farok, J. C., Vikas, K., & Sumit, K. K. (2007). Nature of Relationship between International
Expansion and Performance: A Case of Emerging Markets. The Journal of World Business, 42,
401–417.
Farok, J. C., Vikas, K., Sumit, K. K., Contractor, F. J., Kumar, V., Kundu, S. K., … Sumit, K. K.
(2007). Nature of Relationship between International Expansion and Performance: A Case of
Emerging Markets. The Journal of World Business, 42(4), 401–417.
Florou, A., Kosi, U., & Pope, P. F. (2017). Are international accounting standards more credit
relevant than domestic standards? Accounting and Business Research, 47(1), 1–29.
Foss, N. J. (2003). The strategic management and transaction cost nexus: past debates, central
questions, and future research possibilities. Strategic Organization, 1(2), 139–169.
Franko, L. G. (1989). Global corporate competition: Who’s winning, who’s losing, and the R&D
factor as one reason why. Strategic Management Journal, 10(5), 449–474.
Golovko, E., & Valentini, G. (2011). Exploring the complementarity between innovation and export
for SMEs’ growth. Journal of International Business Studies, 42(3), 362–380.
Grant, R. M. (1996). Toward a knowledge‐based theory of the firm. Strategic Management Journal,
17(S2), 109–122.
Grant, R. M., Jammine, A. P., & Thomas, H. (1988). Diversity, diversification, and profitability
among British manufacturing companies, 1972–1984. Academy of Management Journal, 31(4),
771–801.
Griffin, P. A., Hong, H. A., & Ryou, J. W. (2018). Corporate innovative efficiency: Evidence of
effects on credit ratings. Journal of Corporate Finance, 51(June), 352–373.
https://doi.org/10.1016/j.jcorpfin.2018.06.007
Gupta, J., Wilson, N., Gregoriou, A., & Healy, J. (2014). The effect of internationalisation on
modelling credit risk for SMEs: Evidence from UK market. Journal of International Financial
Markets, Institutions and Money, 31, 397–413.
Hennart, J.-F. F. (2007). The theoretical rationale for a multinationality-performance relationship.
Management International Review, 47(3), 423–452. https://doi.org/10.1007/s11575-007-0023-3
Hitt, M. A., Hoskisson, R. E., & Ireland, R. D. (1994). A mid-range theory of the interactive effects of
international and product diversification on innovation and performance. Journal of
Management, 20(2), 297–326.
Hitt, M. A., Hoskisson, R. E., & Kim, H. (1997). International diversification: Effects on innovation
and firm performance in product-diversified firms. Academy of Management Journal, 40(4),
767–798. https://doi.org/10.2307/256948
Hitt, M. A., Tihanyi, L., Miller, T., & Connelly, B. (2006). International diversification: Antecedents,
outcomes, and moderators. Journal of Management, 32(6), 831–867.
Jiménez-Jiménez, D., & Sanz-Valle, R. (2011). Innovation, organizational learning, and performance.

27
Journal of Business Research, 64(4), 408–417.
Jiraporn, P., Kim, Y. S., Davidson, W. N., & Singh, M. (2006). Corporate governance, shareholder
rights and firm diversification: An empirical analysis. Journal of Banking & Finance, 30(3),
947–963.
Jones, G. R., & Hill, C. W. L. (1988). Transaction cost analysis of strategy‐structure choice. Strategic
Management Journal, 9(2), 159–172.
Jong, G. De, & van Houten, J. (2014). The impact of MNE cultural diversity on the
internationalization-performance relationship: Theory and evidence from European
multinational enterprises. International Business Review, 23(1), 313–326.
Kellner, H. (2019). Durable goods. History and Theory, 57, S9–S14.
Khan, Z., Lew, Y. K., & Marinova, S. (2019). Exploitative and exploratory innovations in emerging
economies: The role of realized absorptive capacity and learning intent. International Business
Review, 28(3), 499–512.
Kim, J., Simunic, D. A., Stein, M. T., & Yi, C. H. (2011). Voluntary audits and the cost of debt capital
for privately held firms: Korean evidence. Contemporary Accounting Research, 28(2), 585–615.
Kim, K. (2018). Diminishing returns to R&D investment on innovation in manufacturing SMEs: do
the technological intensity of industry matter? International Journal of Innovation Management,
22(07), 1850056.
Kim, W. C., Hwang, P., & Burgers, W. P. (1993). Multinationals’ diversification and the risk‐return
trade‐off. Strategic Management Journal, 14(4), 275–286.
Kim, W. C., & Mauborgne, R. A. (1988). Becoming an effective global competitor. The Journal of
Business Strategy, 9(1), 33.
Kim, Y. S., & Mathur, I. (2008). The impact of geographic diversification on firm performance.
International Review of Financial Analysis, 17(4), 747–766.
Kirca, A. H., Hult, G. T. M., Roth, K., Cavusgil, S. T., Perryy, M. Z., Akdeniz, M. B., … Hoppner, J.
J. (2011). Firm-specific assets, multinationality, and financial performance: A meta-analytic
review and theoretical integration. Academy of Management Journal, 54(1), 47–72.
Kobrin, S. J. (1991). An empirical analysis of the determinants of global integration. Strategic
Management Journal, 12(S1), 17–31.
Kogut, B. (1985). Designing global strategies: Comparative and competitive value-added chains.
Sloan Management Review (Pre-1986), 26(4), 15.
Kostova, T., & Roth, K. (2002). Adoption of an organizational practice by subsidiaries of
multinational corporations: Institutional and relational effects. Academy of Management
Journal, 45(1), 215–233.
Kotabe, M., Srinivasan, S. S., & Aulakh, P. S. (2002). Multinationality and firm performance: The
moderating role of R&D and marketing capabilities. Journal of International Business Studies,
33(1), 79–97.
Krapl, A. A. (2015). Corporate international diversification and risk. International Review of
Financial Analysis, 37, 1–13.
Kwok, C. C. Y., & Reeb, D. M. (2000). Internationalization and firm risk: An upstream-downstream
hypothesis. Journal of International Business Studies, 31(4), 611–629.
Lampel, J., & Giachetti, C. (2013). International diversification of manufacturing operations:
Performance implications and moderating forces. Journal of Operations Management, 31(4),
213–227.
Lee, I. H. (2010). The M curve: the performance of born‐regional firms from Korea. Multinational
Business Review.
Li, D., Eden, L., Hitt, M. A., & Ireland, R. D. (2008). Friends, acquaintances, or strangers? Partner
selection in R&D alliances. Academy of Management Journal, 51(2), 315–334.
Lindner, T., Puck, J., & Verbeke, A. (2020). Misconceptions about multicollinearity in international
business research: Identification, consequences, and remedies. Journal of International Business
Studies, 51, 283–298.
Lo, D., Frias, K. M., & Ghosh, M. (2012). Price formats for branded components in industrial
markets: An integration of transaction cost economics and the resource-based view.
Organization Science, 23(5), 1282–1297.
Loth, F., & Parks, T. (2002). The impact of foreign operations on organizational performance.

28
International Journal of Management, 19(3), 418.
Love, J. H. (1995). Knowledge, market failure and the multinational enterprise: a theoretical note.
Journal of International Business Studies, 26(2), 399–407.
Lu, J., Liu, X., Filatotchev, I., & Wright, M. (2014). The impact of domestic diversification and top
management teams on the international diversification of Chinese firms. International Business
Review, 23(2), 455–467.
Lu, J. W., & Beamish, P. W. (2001). The internationalization and performance of SMEs. Strategic
Management Journal, 22(6‐7), 565–586.
Lukka, K., & Mouritsen, J. (2002). Homogeneity or heterogeneity of research in management
accounting? European Accounting Review, 11(4), 805–811.
Mahajan, V., Muller, E., & Bass, F. M. (1990). New product diffusion models in marketing: A review
and directions for research. Journal of Marketing, 54(1), 1–26.
Martin, X., & Salomon, R. (2003). Knowledge transfer capacity and its implications for the theory of
the multinational corporation. Journal of International Business Studies, 34(4), 356–373.
McGuinness, N. W., & Little, B. (1981). The influence of product characteristics on the export
performance of new industrial products. Journal of Marketing, 45(2), 110–122.
McIvor, R. (2009). How the transaction cost and resource-based theories of the firm inform
outsourcing evaluation. Journal of Operations Management, 27(1), 45–63.
Michel, A., & Shaked, I. (1986). Multinational corporations vs. domestic corporations: Financial
performance and characteristics. Journal of International Business Studies, 17(3), 89–100.
Miller, D., & Shamsie, J. (1996). The resource-based view of the firm in two environments: The
Hollywood film studios from 1936 to 1965. Academy of Management Journal, 39(3), 519–543.
Mohr, A., Wang, C., & Goerzen, A. (2016). The impact of partner diversity within multiparty
international joint ventures. International Business Review, 25(4), 883–894.
Mueller, D. C. (1977). The persistence of profits above the norm. Economica, 44(176), 369–380.
Nguyen, Q. T. K. (2017). Multinationality and performance literature: A critical review and future
research agenda. Management International Review, 57(3), 311–347.
Olibe, K. O., Michello, F. A., & Thorne, J. (2008). Systematic risk and international diversification:
An empirical perspective. International Review of Financial Analysis, 17(4), 681–698.
Palepu, K. G., Healy, P. M., & Peek, E. (2016). Business analysis and valuation: IFRS edition (4th
ed.). Cengage learning.
Pantzalis, C., Park, J. C., & Sutton, N. K. (2008). Legal environment, internalization, and US acquirer
gains in foreign takeovers. Journal of Financial Research, 31(2), 167–191.
Peel, M. J. (2018). The impact of filing micro-entity accounts and the disclosure of reporting
accountants on credit scores: an exploratory study. Accounting and Business Research, 1–34.
Peng, M. W. (2001). The resource-based view and international business. Journal of Management,
27(6), 803–829.
Peress, J. (2010). Product market competition, insider trading, and stock market efficiency. The
Journal of Finance, 65(1), 1–43.
Peris Bonet, F. J., Peris-Ortiz, M., & Gil-Pechuan, I. (2010). Integrating transaction cost economics
and the resource-based view in services and innovation. The Service Industries Journal, 30(5),
701–712.
Peteraf, M.A. (1993). The cornerstones of competitive advantage: a resource‐based view. Strategic
Management Journal, 14(3), 179-191.
Pisani, N., Garcia-Bernardo, J., & Heemskerk, E. (2020). Does it pay to be a multinational? A large-
sample, cross-national replication assessing the multinationality–performance relationship.
Strategic Management Journal, 41(1), 152–172. https://doi.org/10.1002/smj.3087
Pisani, N., Garcia‐Bernardo, J., & Heemskerk, E. (2020). Does it pay to be a multinational? A large‐
sample, cross‐national replication assessing the multinationality–performance relationship.
Strategic Management Journal.
Pittman, J. A., & Fortin, S. (2004). Auditor choice and the cost of debt capital for newly public firms.
Journal of Accounting and Economics, 37(1), 113–136.
Porter, M. (1990). Competitive advantage of nations. New York: The Free Pres. PorterThe
Competitive Advantages of Nations1990.
Porter, M. E. (1986). Changing patterns of international competition. California Management Review,

29
28(2), 9–40.
Prezas, A. P. (2009). Internal capital markets, empire building, and capital structure. Journal of
Economics and Business, 61(3), 173–188.
Purkayastha, S., Manolova, T. S., & Edelman, L. F. (2018). Business group effects on the R&D
intensity-internationalization relationship: Empirical evidence from India. Journal of World
Business, 53(2), 104–117.
Puthusserry, P., Khan, Z., Knight, G., & Miller, K. (2020). How do rapidly internationalizing SMEs
learn? Exploring the link between network relationships, learning approaches and post-entry
growth of rapidly Internationalizing SMEs from Emerging Markets. Management International
Review, 60(4), 515-542.
Reeb, D. M., Kwok, C. C. Y. Y., & Baek, H. Y. (1998). Systematic risk of the multinational
corporation. Journal of International Business Studies, 29(2), 263–279.
https://doi.org/10.1057/palgrave.jibs.8490036
Reeb, D. M., Mansi, S. A., & Allee, J. M. (2001). Firm internationalization and the cost of debt
financing: Evidence from non-provisional publicly traded debt. Journal of Financial and
Quantitative Analysis, 36(3), 395–414.
Reeb, D., Sakakibara, M., & Mahmood, I. P. (2012). From the editors: Endogeneity in international
business research. Springer.
Ren, S., Eisingerich, A. B., & Tsai, H.-T. (2015). How do marketing, research and development
capabilities, and degree of internationalization synergistically affect the innovation performance
of small and medium-sized enterprises (SMEs)? A panel data study of Chinese SMEs.
International Business Review, 24(4), 642–651.
Robins, J., & Wiersema, M. F. (1995). A resource‐based approach to the multibusiness firm:
Empirical analysis of portfolio interrelationships and corporate financial performance. Strategic
Management Journal, 16(4), 277–299.
Roth, K. (1992). International configuration and coordination archetypes for medium-sized firms in
global industries. Journal of International Business Studies, 23(3), 533–549.
Rugman, A. M. (1979). International diversification and the multinational enterprise.
Safdar, I. (2016). Industry competition and fundamental analysis. Journal of Accounting Literature,
37, 36–54.
Saunders, A., & Steffen, S. (2011). The costs of being private: Evidence from the loan market. The
Review of Financial Studies, 24(12), 4091–4122.
Schmidt, K. M. (1997). Managerial incentives and product market competition. The Review of
Economic Studies, 64(2), 191–213.
Shin, J. K., & Subramanian, C. (2019). Asset Price Bubbles and Technological Innovation. Economic
Inquiry, 57(1), 482–497.
Silverman, B. S. (1999). Technological resources and the direction of corporate diversification:
Toward an integration of the resource-based view and transaction cost economics. Management
Science, 45(8), 1109–1124.
Slade, M. E. (2004). Competing models of firm profitability. International Journal of Industrial
Organization, 22(3), 289–308.
Strange, R. (2018). Corporate ownership and the theory of the multinational enterprise. International
Business Review, 27(6), 1229–1237.
Stratman, J. K. (2008). Facilitating offshoring with enterprise technologies: Reducing operational
friction in the governance and production of services. Journal of Operations Management,
26(2), 275–287.
Surdu, I., & Mellahi, K. (2016). Theoretical foundations of equity based foreign market entry
decisions: A review of the literature and recommendations for future research. International
Business Review, 25(5), 1169–1184.
Teece, D. J. (1982). Towards an economic theory of the multiproduct firm. Journal of Economic
Behavior & Organization, 3(1), 39–63.
Tsai, H.-T. (2014). Moderators on international diversification of advanced emerging market firms.
Journal of Business Research, 67(6), 1243–1248.
Udell, G. F. (2015). SME Access to intermediated credit: What do we know and what don’t we know.
In Small Business Conditions and Finance Conference Volume (pp. 61–109).

30
UKTI. (2012). UK Trade & Investment (UKTI). Bringing home the benefits How to grow through
exporting. Retrieved from
http://www.biopartner.co.uk/documents/BringingHomeTheBenefits.pdf
Verbeke, A., Li, L., & Goerzen, A. (2009). Toward more effective research on the multinationality-
performance relationship. Management International Review, 49(2), 149–161.
Vermeulen, F., & Barkema, H. (2001). Learning through acquisitions. Academy of Management
Journal, 44(3), 457–476.
Wallerstein, I. (1991). Braudel on capitalism, or everything upside down. The Journal of Modern
History, 63(2), 354–361.
Wan, W. P., Hoskisson, R. E., Short, J. C., & Yiu, D. W. (2011). Resource-based theory and corporate
diversification: Accomplishments and opportunities. Journal of Management, 37(5), 1335–1368.
Wang, T., Libaers, D., & Park, H. D. (2017). The Paradox of Openness: How Product and Patenting
Experience Affect R&D Sourcing in C hina? Journal of Product Innovation Management, 34(3),
250–268.
Wooldridge, J. M. (2014). Introduction to Econometrics: Europe, Middle East and Africa Edition.
Cengage Learning.
Zahra, S. A., Ireland, R. D., & Hitt, M. A. (2000). International expansion by new venture firms:
International diversity, mode of market entry, technological learning, and performance. Academy
of Management Journal, 43(5), 925–950.
Zúñiga-Vicente, J. Á., Benito-Osorio, D., Guerras-Martín, L. Á., & Colino, A. (2019). The effects of
international diversification on the link between product diversification and performance in a
boom and bust cycle: Evidence from Spanish firms (1994–2014). Journal of International
Management, 25(4), 100687.

31
Table 1 Sample distribution by industry
Categories of industrial sectors Freq. Percent Cum.
Agriculture, Forestry, and Fishing 231 3.52 3.52
Mining 248 3.78 7.31
Construction 418 6.37 13.68
Manufacturing 949 14.47 28.15
Transportation, Communications, and Utilities 906 13.82 41.97
Wholesale and Retail Trade 716 10.92 52.89
Services 3,054 46.58 99.47
Public Administration 35 0.53 100
Total 6,557 100 This table presents the sample distribution by industry. Eight categories of industrial sectors are defined according to the Standard Industrial
Classification (SIC) code.

32
Table 2 Descriptive statistics
Variable Obs. Mean Std. Dev. Min Q1 Median Q3 Max Skewness Kurtosis
Credit_Score 6,557 0.78 0.226 0 0.68 0.88 0.92 0.99 -1.436 4.208
Int_Div 6,557 0.129 0.284 0 0 0 0.016 1 2.143 6.119
ROCE 6,557 0.17 0.387 -0.593 0 0.103 0.307 1.142 0.643 3.888
Sales_Growth 6,557 0.02 0.324 -0.768 -0.061 0.013 0.138 0.727 -0.314 4.132
NEG_EQTY 6,557 0.169 0.375 0 0 0 0 1 1.762 4.106
WC_TA 6,557 0.038 0.844 -5.054 -0.043 0.141 0.443 1 -3.736 21.133
LEV 6,557 0.382 0.556 -0.865 0.058 0.36 0.752 1.499 -0.075 2.944
AGE 6,557 2.72 0.867 0 2.197 2.773 3.296 4.7 -0.065 2.778
SME 6,557 0.602 0.49 0 0 1 1 1 -0.417 1.174
R&D_Intensity 6,557 0.274 1.432 0 0 0 0 10.389 6.005 39.563
Geographic_Locus 6,557 0.185
0.562
0 0 0 0 2
2.812
9.096
This table presents descriptive statistics for the variables in the empirical models. Credit_Score is the firm i’s credit score as developed by FAME, capturing the likelihood of a business becoming insolvent over a period of 12 months. Int_Div is the percentage of firm i’s foreign sales to total sales. ROCE is the ratio of profit before tax to capital employed. Sales_Growth is the percentage change in firm i’s sales from period t-
1 to t. NEG_EQTY is a dummy variable, coded 1 if firm i’s total liabilities exceed the book value of its total assets, and 0 otherwise. WC_TA is the ratio of firm i’s net working capital (measured as current assets
minus current liabilities) to total assets. LEV is the ratio of firm i’s long-term debt to total assets. AGE is the natural logarithm of the number of years since firm i’s founding year. SME is a dummy variable, coded 1 if firm is classified as a small- and medium-sized enterprise by the FAME, and 0 otherwise. R&D_Intensity is the ratio of R&D expenditures to firm i’s total assets. Geogrpahic_Locus is the geographical locus in
which firms’ international activities are carried out. See Appendix I for all variable definitions.

33
Table 3 Correlation matrix
Variable 1 2 3 4 5 6 7 8 9 10 11
1. Credit_Score 1
2. Int_Div 0.0695* 1
3. ROCE -0.0197 -0.0750* 1
4. Sales_Growth 0.1198* 0.0082 0.0982* 1
5. NEG_EQTY -0.4116* -0.0648* -0.0138 -0.018 1
6. WC_TA 0.3295* 0.0433* -0.0384* 0.0285* -0.5540* 1
7. LEV -0.3127* -0.0452* 0.1787* -0.0605* 0.2917* -0.7039* 1
8. AGE 0.2101* 0.1174* -0.0197 -0.1139* -0.2038* 0.1121* -0.0201 1
9. SME -0.2258* -0.0810* 0.0435* -0.0736* 0.1720* -0.0865* 0.1700* -0.1924* 1
10. R&D_Intensity 0.0327* 0.1566* -0.0938* 0.0181 -0.0256* 0.0158 -0.0152 0.02 0.004 1
11. Geographic_Locus 0.0756*
0.2265*
-0.0712* 0.0142 -0.0718* 0.0420* -0.0474* 0.1574* -0.1871* 0.1065* 1
This table presents the correlation coefficients between the variables in the empirical model. Credit_Score is the firm i’s credit score as developed by FAME, capturing the likelihood of a business becoming insolvent
over a period of 12 months. Int_Div is the percentage of firm i’s foreign sales to total sales. ROCE is the ratio of profit before tax to capital employed. Sales_Growth is the percentage change in firm i’s sales from
period t- 1 to t. NEG_EQTY is a dummy variable, coded 1 if firm i’s total liabilities exceed the book value of its total assets, and 0 otherwise. WC_TA is the ratio of firm i’s net working capital (measured as current assets minus current liabilities) to total assets. LEV is the ratio of firm i’s long-term debt to total assets. AGE is the natural logarithm of the number of years since firm i’s founding year. SME is a dummy variable,
coded 1 if firm is classified as a small- and medium-sized enterprise by the FAME, and 0 otherwise. R&D_Intensity is the ratio of R&D expenditures to firm i’s total assets. Geogrpahic_Locus is the geographical
locus in which firms’ international activities are carried out. See Appendix I for all variable definitions. * indicate statistical significance at p < 5% using two-sided t-statistics.

34
Table 4 International diversification, R&D Intensity, and credit scores
16 Domestic is the reference category.
Variables (1) (2) (3)
Int_Div RD×Int_Div RD×Int_Div_SQ
Int_Div 0.125*** 0.149*** 0.127***
(3.47) (4.167) (3.51)
Int_Div_SQ -0.132*** -0.160*** -0.137*** (-3.246) (-3.934) (-3.348)
R&D_Intensity -0.042 -0.037
(-1.015) (-0.989) Int_Div× R&D_Intensity 0.144*
(1.692)
Int_Div_SQ× R&D_Intensity 0.188** (2.569)
ROCE 0.012 0.013* 0.012 (1.643) (1.714) (1.623)
Sales_Growth 0.080*** 0.082*** 0.080***
(10.106) (10.287) (10.109) NEG_EQTY -0.179*** -0.178*** -0.178***
(-20.426) (-20.320) (-20.384)
WC_TA 0.017*** 0.018*** 0.018*** (4.45) (4.595) (4.584)
LEV -0.068*** -0.068*** -0.068***
(-11.957) (-12.047) (-11.907) AGE 0.031*** 0.034*** 0.031***
(10.782) (11.984) (10.772)
SME -0.048*** -0.049*** -0.048*** (-9.193) (-9.535) (-9.217)
Geographic_Locus (Europe)16 -0.008 -0.008 -0.008
(-0.477) (-0.458) (-0.458) Geographic_Locus (Global) -0.001 -0.003 -0.002
(-0.164) (-0.295) (-0.173)
Intercept 0.765*** 0.757*** 0.765*** (33.9) (39.183) (33.935)
Sample size 6,557 6,557 6,557
Adj. R-squared 0.26 0.256 0.261 F-test 148.28*** 200.91*** 134.35***
Industry fixed effects Yes Yes Yes
Credit_Score is the firm i’s credit score as developed by FAME, capturing the likelihood of a business becoming insolvent over a period of
12 months. Int_Div is the percentage of firm i’s foreign sales to total sales. Int_Div_SQ is the squared percentage of firm i’s foreign sales to total sales. R&D_Intensity is the ratio of R&D expenditures to firm i’s total assets. ROCE is the ratio of profit before tax to capital
employed. Sales_Growth is the percentage change in firm i’s sales from period t- 1 to t. NEG_EQTY is a dummy variable, coded 1 if firm i’s total liabilities exceed the book value of its total assets, and 0 otherwise. WC_TA is the ratio of firm i’s net working capital (measured
as current assets minus current liabilities) to total assets. LEV is the ratio of firm i’s long-term debt to total assets. AGE is the natural
logarithm of the number of years since firm i’s founding year. SME is a dummy variable, coded 1 if firm is classified as a small- and medium-sized enterprise by the FAME, and 0 otherwise. Geogrpahic_Locus is the geographical locus in which firms’ international activities
are carried out. See Appendix I for all variable definitions. All continuous variables are winsorised at the 1st and 99th percentiles.
Coefficients are unbracketed, with heteroscedastic robust t statistics in parentheses. * Significance at the 10% level.
** Significance at the 5% level.
*** Significance at the 1% level.
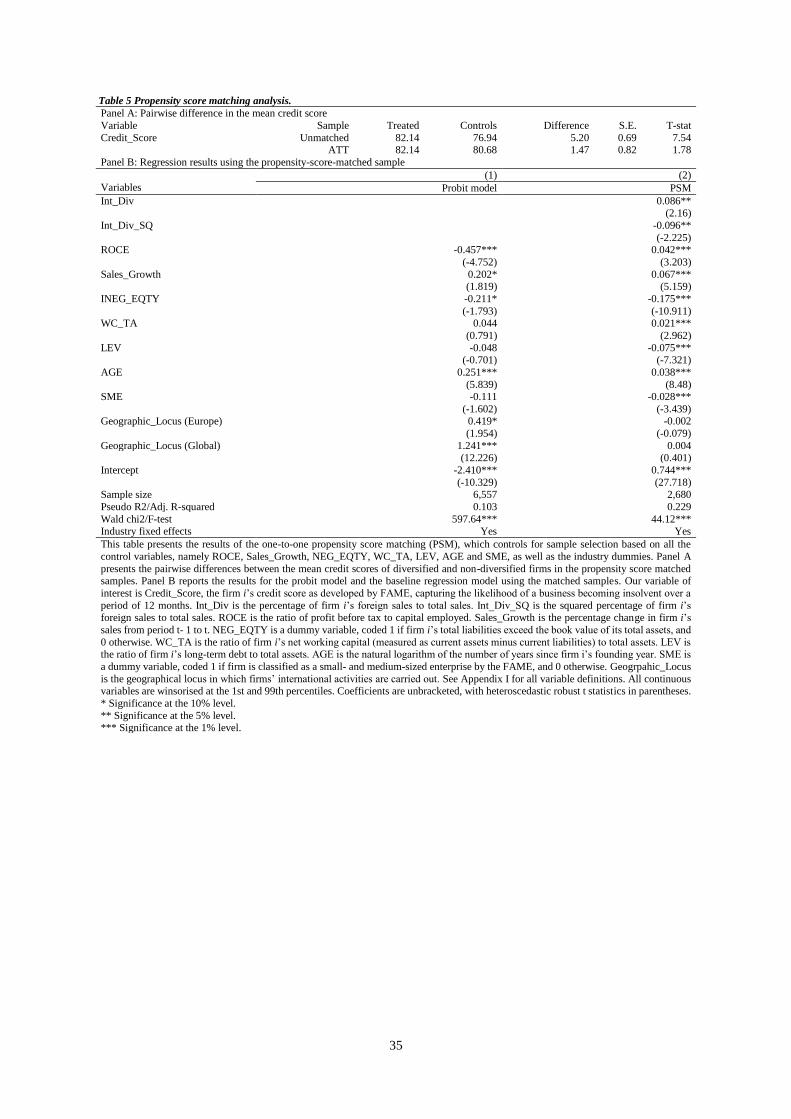
35
Table 5 Propensity score matching analysis.
Panel A: Pairwise difference in the mean credit score
Variable Sample Treated Controls Difference S.E. T-stat
Credit_Score Unmatched 82.14 76.94 5.20 0.69 7.54 ATT 82.14 80.68 1.47 0.82 1.78
Panel B: Regression results using the propensity-score-matched sample
Variables
(1) (2)
Probit model PSM
Int_Div 0.086** (2.16)
Int_Div_SQ -0.096**
(-2.225) ROCE -0.457*** 0.042***
(-4.752) (3.203)
Sales_Growth 0.202* 0.067*** (1.819) (5.159)
INEG_EQTY -0.211* -0.175***
(-1.793) (-10.911)
WC_TA 0.044 0.021***
(0.791) (2.962)
LEV -0.048 -0.075*** (-0.701) (-7.321)
AGE 0.251*** 0.038***
(5.839) (8.48) SME -0.111 -0.028***
(-1.602) (-3.439) Geographic_Locus (Europe) 0.419* -0.002
(1.954) (-0.079)
Geographic_Locus (Global) 1.241*** 0.004 (12.226) (0.401)
Intercept -2.410*** 0.744***
(-10.329) (27.718) Sample size 6,557 2,680
Pseudo R2/Adj. R-squared 0.103 0.229
Wald chi2/F-test 597.64*** 44.12***
Industry fixed effects Yes Yes
This table presents the results of the one-to-one propensity score matching (PSM), which controls for sample selection based on all the
control variables, namely ROCE, Sales_Growth, NEG_EQTY, WC_TA, LEV, AGE and SME, as well as the industry dummies. Panel A
presents the pairwise differences between the mean credit scores of diversified and non-diversified firms in the propensity score matched samples. Panel B reports the results for the probit model and the baseline regression model using the matched samples. Our variable of
interest is Credit_Score, the firm i’s credit score as developed by FAME, capturing the likelihood of a business becoming insolvent over a
period of 12 months. Int_Div is the percentage of firm i’s foreign sales to total sales. Int_Div_SQ is the squared percentage of firm i’s foreign sales to total sales. ROCE is the ratio of profit before tax to capital employed. Sales_Growth is the percentage change in firm i’s
sales from period t- 1 to t. NEG_EQTY is a dummy variable, coded 1 if firm i’s total liabilities exceed the book value of its total assets, and
0 otherwise. WC_TA is the ratio of firm i’s net working capital (measured as current assets minus current liabilities) to total assets. LEV is the ratio of firm i’s long-term debt to total assets. AGE is the natural logarithm of the number of years since firm i’s founding year. SME is
a dummy variable, coded 1 if firm is classified as a small- and medium-sized enterprise by the FAME, and 0 otherwise. Geogrpahic_Locus
is the geographical locus in which firms’ international activities are carried out. See Appendix I for all variable definitions. All continuous variables are winsorised at the 1st and 99th percentiles. Coefficients are unbracketed, with heteroscedastic robust t statistics in parentheses.
* Significance at the 10% level.
** Significance at the 5% level. *** Significance at the 1% level.

36
Table 6 The impact of industry characteristics on the international diversification - credit scores relationship
Variables (1) (2) (3) (4)
Competition effect Industry effect
High Low Services Manufacturing
Int_Div 0.131** 0.106 0.159** 0.007
(3.09) (1.47) (2.90) (0.10) Int_Div_SQ -0.149** -0.087 -0.191** 0.026
(-3.06) (-1.13) (-3.03) (0.36)
ROCE 0.008 0.022 0.013 0.014 (0.90) (1.49) (1.33) (0.58)
Sales_Growth 0.068** 0.131** 0.072** 0.088**
(7.66) (7.45) (6.11) (4.18) NEG_EQTY -0.190** -0.143** -0.190** -0.184**
(-18.87) (-8.27) (-15.15) (-6.67)
WC_TA 0.020** 0.010 0.012* 0.018 (4.23) (1.44) (2.21) (1.22)
LEV -0.061** -0.084** -0.078** -0.056**
(-9.09) (-7.89) (-9.18) (-2.99)
AGE 0.031** 0.030** 0.037** 0.037**
(9.25) (5.32) (7.62) (5.30)
SME -0.042** -0.059** -0.057** -0.030* (-7.17) (-5.49) (-7.51) (-2.38)
Geographic_Locus (Europe) -0.015 0.000 0.018 -0.023
(-0.71) (0.01) (0.75) (-0.56) Geographic_Locus (Global) 0.007 -0.026 0.017 -0.032*
(0.65) (-1.44) (1.19) (-1.82) Intercept 0.790** 0.780** 0.760** 0.770**
(23.81) (38.12) (51.18) (30.01)
Sample size 4,996 1,561 3,054 949 Adj. R-squared 0.262 0.275 0.264 0.210
F-test 124.37*** 44.47*** 123.32*** 21.39***
Industry fixed effects - - - -
Credit_Score is the firm i’s credit score as developed by FAME, capturing the likelihood of a business becoming insolvent over a period of 12 months. Int_Div is the percentage of firm i’s foreign sales to total sales. Int_Div_SQ is the squared percentage of firm i’s foreign sales
to total sales. ROCE is the ratio of profit before tax to capital employed. Sales_Growth is the percentage change in firm i’s sales from period
t- 1 to t. NEG_EQTY is a dummy variable, coded 1 if firm i’s total liabilities exceed the book value of its total assets, and 0 otherwise. WC_TA is the ratio of firm i’s net working capital (measured as current assets minus current liabilities) to total assets. LEV is the ratio of
firm i’s long-term debt to total assets. AGE is the natural logarithm of the number of years since firm i’s founding year. SME is a dummy
variable, coded 1 if firm is classified as a small- and medium-sized enterprise by the FAME, and 0 otherwise. Geogrpahic_Locus is the geographical locus in which firms’ international activities are carried out. See Appendix I for all variable definitions. All continuous
variables are winsorised at the 1st and 99th percentiles. Coefficients are unbracketed, with heteroscedastic robust t statistics in parentheses.
* Significance at the 10% level. ** Significance at the 5% level.
*** Significance at the 1% level.

37
Table 7 The impact of distance from London and size on the international diversification – credit scores relationship
Variables (1) (2) (3) (4) (5)
Distance effect Size effect
Close Distant Distance from
London
SMEs Large
Int_Div 0.146** 0.040 0.120** 0.176** 0.062 (3.47) (0.60) (3.32) (3.36) (1.27)
Int_Div_SQ -0.153** -0.043 -0.126** -0.185** -0.066
(-3.23) (-0.59) (-3.09) (-3.12) (-1.20) LN_Distance 0.005**
(4.21)
ROCE 0.020* -0.016 0.013* 0.003 0.042** (2.39) (-1.02) (1.76) (0.32) (3.02)
Sales_Growth 0.080** 0.085** 0.081** 0.088** 0.062**
(8.73) (5.38) (10.18) (8.74) (4.98) NEG_EQTY -0.173** -0.192** -0.178** -0.165** -0.215**
(-17.43) (-10.71) (-20.36) (-16.43) (-12.36)
WC_TA 0.019** 0.009 0.017** 0.019** 0.021*
(4.43) (1.00) (4.39) (4.35) (1.77)
LEV -0.070** -0.065** -0.069** -0.065** -0.079**
(-10.71) (-5.84) (-12.14) (-8.89) (-8.97) AGE 0.034** 0.024** 0.030** 0.038** 0.024**
(10.07) (4.19) (10.24) (8.56) (6.52)
SME -0.054** -0.026* -0.047** (-9.00) (-2.55) (-9.17)
Geographic_Locus (Europe) 0.004 -0.033 -0.008 0.012 -0.015 (0.18) (-0.91) (-0.45) (0.38) (-0.73)
Geographic_Locus (Global) -0.000 -0.003 0.000 -0.001 0.001
(-0.01) (-0.17) (0.05) (-0.04) (0.06) Intercept 0.774** 0.775** 0.763** 0.693** 0.826**
(50.02) (21.57) (52.06) (35.96) (43.93)
Sample size 5,128 1,429 6,557 3,948 2,609 Adj. R-squared 0.259 0.279 0.262 0.235 0.201
F-test 120.84*** 32.84*** 141.72*** 88.70*** 25.49***
Industry fixed effects Yes Yes Yes Yes Yes
Credit_Score is the firm i’s credit score as developed by FAME, capturing the likelihood of a business becoming insolvent over a period of 12 months. Int_Div is the percentage of firm i’s foreign sales to total sales. Int_Div_SQ is the squared percentage of firm i’s foreign sales
to total sales. ROCE is the ratio of profit before tax to capital employed. Sales_Growth is the percentage change in firm i’s sales from period
t- 1 to t. NEG_EQTY is a dummy variable, coded 1 if firm i’s total liabilities exceed the book value of its total assets, and 0 otherwise. WC_TA is the ratio of firm i’s net working capital (measured as current assets minus current liabilities) to total assets. LEV is the ratio of
firm i’s long-term debt to total assets. AGE is the natural logarithm of the number of years since firm i’s founding year. SME is a dummy
variable, coded 1 if firm is classified as a small- and medium-sized enterprise by the FAME, and 0 otherwise. LN_Distance is the natural logarithm of the driving distance between the headquarters of the firm in the postcode area and the centre of London, using the road network
measured in miles. Geogrpahic_Locus is the geographical locus in which firms’ international activities are carried out. See Appendix I for
all variable definitions. All continuous variables are winsorised at the 1st and 99th percentiles. Coefficients are unbracketed, with heteroscedastic robust t statistics in parentheses.
* Significance at the 10% level.
** Significance at the 5% level. *** Significance at the 1% level.

38
Appendix I: Variable definitions
Dependent variable
𝐶𝑟𝑒𝑑𝑖𝑡_𝑆𝑐𝑜𝑟𝑒 The credit scores as developed by the Financial Analysis Made Easy (FAME), capturing the likelihood of a
business becoming insolvent over a period of 12 months. Scores range from 0 to 100, with lower scores
indicating a greater probability of default risk.
Main variables
𝐼𝑛𝑡_𝐷𝑖𝑣 The percentage of firm’s foreign sales to total sales.
𝐼𝑛𝑡_𝐷𝑖𝑣_𝑆𝑄 The squared percentage of firm’s foreign sales to total sales.
Firm-level controls
𝑅𝑂𝐶E The firm’s ratio of profit before tax to capital employed.
𝑆𝑎𝑙𝑒𝑠_𝐺𝑟𝑜𝑤𝑡ℎ The percentage change in firm’s sales from period t- 1 to t.
𝑊𝐶_𝑇𝐴 The ratio of firm’s net working capital (measured as current assets minus current liabilities) to total assets.
𝐿𝐸𝑉 The ratio of firm’s long-term debt to total assets.
𝐴𝐺𝐸 The natural logarithm of the number of years since firm’s founding year.
𝑁𝐸𝐺_𝐸𝑄𝑇𝑌 A dummy variable, coded 1 if a firm’s total liabilities exceed the book value of its total assets, and 0 otherwise.
𝑆𝑀𝐸 A dummy variable, coded 1 if firm is classified as a small- and medium-sized enterprise by the FAME, and 0
otherwise.
Additional variables
R&D_Intensity The ratio of research and development expenditures to firm’s total assets.
𝐻𝐻𝐼 HHI is the Herfindahl-Hirschman index (HHI), which is a measure of market concentration. The HHI is computed by summing the squared market shares of all firms competing in an industry. A firm’s market share
is given as a ratio of the firm’s sales to total sales in its industry. The HHI can range from close to zero to
10,000 with higher values of this index indicate greater industry concentration.
𝐿𝑁_𝐷𝑖𝑠𝑡𝑎𝑛𝑐𝑒 The natural logarithm of the driving distance between the headquarters of the firm in the postcode area and
the centre of London, using the road network measured in miles
Geographic_Locus
A regional classification variable (ranging from domestic to global), which captures the geographic locus in which firms’ international activities are carried out.
Appendix II: Post-hoc Test Panel A: Descriptive statistics for each distance groups (Distant vs Close)
Cluster Obs Mean Std. Dev. Std. Error Min Max
Close 5,128 77.34 23.12 0.32 0 99
Distant 1,429 80.40 20.55 0.54 0 99
Total 6,557 78.01 22.62 0.28 0 99
Panel B: Tukey Simultaneous Tests for Differences of Means
Difference of levels Difference of Means SE of Difference 95% Confidence Interval T-Value Adjusted P-Value
Lower Bound Upper Bound
Distant – Close 3.06 0.68 1.74 4.39 4.53 0.000
Copyright © 2022 FDOKUMEN