Surface and interface properties of BaTiO3 ferroelectric thin ...
Upload
independentCategory
view
0download
0
E L S E V I E R Journal of Applied Geophysics 32 (1994) 55-72
I FFLIEI GEI FI 51C5
Investigation of ferroelectric effects in two sulfide deposits*
Charles E. Corry Woods Hole Oceanographic Institution, Clark 424, Woods Hole, MA 02543, USA
(Received June 29, 1993; accepted after revision November 1, 1993)
Abstract
Laboratory studies by different investigators using various techniques have expanded the number of known ferroelectric ore minerals to about twenty at present from the first discovery of makedonite (PbTiO3) in 1950. These include such common ore minerals as bismuthinite ( B i2S 3), cassiterite (SnO2), chalcocite (Cu2S), pyrrhotite (Fe i - xS), and stibnite ( Sb2S 3 ). Two field investigations of sulfide ore bodies that contain known ferroelectric minerals were undertaken to investigate possible in-situ effects in these deposits. These deposits, at Mount Emmons (38°53'N, 107°03'W), Colorado, and Three R Canyon (31°28'N, 110°46'W) in the Patagonia Mountains, Arizona, demonstrate ferroelectric effects that include directional polarization and apparent resistivity, electrically-excited resonance, and lack of reciprocity. Other phenomena include history-dependent electrical behavior and inductive effects.
Ferroelectrics polarize as a function of applied potential. It is much easier to generate a large potential than the high currents commonly used in IP surveys. Thus, in electrical surveys of deposits known, or suspected, to contain ferroelectric minerals it may be advantageous to maximize the applied potential. It may also be relatively easy to induce electrical resonance in these deposits that could provide an inexpensive reconnaissance technique.
In IP and CR surveys, ferroelectric effects can mask the deposit since Pa may approach zero in the polar direction, or chargeability may be undetectable. Phase relations will most likely be uninterpretable in CR surveys over such deposits. In CSAMT surveys, directional resonance effects may preclude depth interpretation. Frequency-dependent inductive and capacitive effects may be observed in CR and CSAMT surveys over deposits containing significant quantities of ferroelectric minerals.
Ferroelectricity may also be useful in exploitation efforts for electrical beneficiation during ore processing.
1. Introduct ion
A series of detailed electrical surveys have been con- ducted over known porphyry sulfide deposits in the cordillera of the United States and the results were presented by Corry (1985) and Corry et al. (1987, 1988). Many of these surveys encountered unexplai- ned electrical behavior associated with the sulfides. These deposits consistently exhibited distinctly direc- tional apparent resistivity, Pa, despite a known radial distribution of the sulfides. Addit ional ly, controlled
*WHOI Contribution No. 8403.
0926-9851/94/$07.00 © 1994 Elsevier Science B.V. All rights reserved SSD10926-985 1 (93)E0040-G
source audio-frequency magnetotelluric ( C S A M T ) survey data over mineralization in Colorado and Nevada, plotted as log frequency (f) vs. log apparent resistivity (Pa), exceeded the theoretical maximum slope of 45 ° for a layered earth with a perfectly con- ducting basement (Corry et al., 1987).
Some sulfide deposits exhibited history-dependent response to applied electrical fields for periods of at least 12 h. The dominant effect was a frequency- dependent leading edge ( induction) spike on the received signal when the transmitter output was a clean square wave. When present, leading edge spikes pre- vented induced polarization (IP) measurements, but

56 C.E. Corry /Journal of Applied Geophysics 32 (1994) 55-72
Table 1 Alphabetic tabulation of known ferroelectric ore minerals
Mineral Composition Crystal class Space group Reference
Alexandrite Cr2BeO4 Orthorhombic Pnam Newnham et al. (1978) (Cr-chrysoberyl) Altaite PbTe Cubic Fm3m Lines and Glass ( 1977,
pp. 522 524) Pbt -~SnxTe Pbl _xGe~Te
Bismuthinite Bi2S3 Orthorhombic Pna21 Yuodvirishis et al. (1969) Boracite Mg3BvO~3CI Orthorhombic Pca2~ LeCorre (1957) Cassiterite SnO2 Tetragonal P42/mnm Deshpande and Bhide ( 1961 ) Chalcocite Cu2S Monoclinic P2~/c Bieniulis et al. (1987) Chalcostibite CuSbS2 Orthorhombic Pna2~ Grigas et al. (1976) Colemanite CaB3Oa(OH) 3' H20 or Monoclinic P2~ Goldsmith (1956)
CazB6O11.5H20 Lewisite (Ti-rom6ite) ? Fefa2Sb207 Cubic Fd3m Parkhomenko ( 1971 ) Makedonite PbTiO3 Tetragonal P4/mmm Shirane et al. (1950) Niter KNO 3 Orthorhombic Pnma Sawada et al. (1958) Nitrokalite? Ca(H20) ( NO 3) 2 Monoclinic P2t/c Parkhomenko ( 1971 ) Polianite-pyrolusite MnO2 Orthorhombic P42/mmm Bhide and Damle ( 1960a, b) Pyrrhotite Fe~ _ xS Hexagonal P63 / mmc Van den Berg ( 1970, 1972) Russelite Bi2WO 6 Tetragonal 14t2d Wolfe et al. (1969) Rutile TiO2 Tetragonal P4z/mmm Nicolini (1959) Stibiotantalite or Sb(Ta, Nb)O4 Orthorhombic Pna21 Gavrilova et al. ( 1971 ) stibiocolumbite Stibnite or antimonite Sb2S 3 Orthorhombic Pna2~ Rinkyavichyus and
Mikalkevichyus (1967) Troilite FeS Hexagonal P62c Van den Berg et al. ( 1969 ) Water ( hexagonal ice ) H20 Hexagonal P63/mmc Dengel et al. (1964) Water (cubic ice) Cubiotti and Geracitano
(1967)
Except for altaite, references given are for original discovery. A wide variety of techniques were used to demonstrate ferroelectricity in these minerals, and the individual papers should be consulted for details. The ferroelectric behavior of altaite in a solid solution series is summarized by Lines and Glass (1977) and they give the relevant references. The crystal structure given here is for ~ 25°C. The minerals with centrosymmetric structure, altaite and lewisite, have Curie temperatures Tc < 25°C. Extended bibliographies for these minerals can be found in Hellwege and Hellwege (1982) including supplementary work done since the discovery of ferroelectricity in the mineral. They also summarize the known physical properties.
exper iments showed that g rounding the sulfide system
by connec t ing an e lec t rode (s) inside the sulfide system
to an e l ec t rode ( s ) wel l outs ide the sys tem for about 12
h e l imina ted the leading edge spike long enough to
make the IP survey. Ground ing the sulfide system also
reduced the spontaneous polar izat ion ( S P ) for per iods
o f at least 12 h (Cor ry , 1985).
Conven t iona l models , based upon the assumption
that sulfides behave pure ly resis t ively and that capaci-
t ive effects are due to membrane polar izat ion at the
grain boundaries, were unable to reproduce the fo l low-
ing observat ions in the surveys referenced above:
(1) L o w Pa ( < 1 12. m) underlying high pa ( 100-500
S2. m) at a single C S A M T station,
(2) Resonance effects. Around some center f requency
a small shift in f requency resulted in a large, non-
linear change in p,.
(3) Direct ional properties, including resonance and p~
measured in different direct ions away from known
boundaries in deposits where the sulfides are
known to be radially distributed.
(4) Long relaxat ion times. Graphi te exhibi ts relaxa-
tion t imes o f 102 to 104 s (Pel ton et al., 1978, p.
602) , but graphite was not present in the sulfide
deposits surveyed.
C.E. Corry /Journal of Applied Geophysics 32 (1994) 55-72 57
(5) Frequency- and history-dependent inductive effects.
(6) Uninterpretable phase relations in the complex resistivity (CR) data.
Initially, to account for these observations, a model was proposed in which the sulfide system behaved as a solid plasma. That model ran into the difficulty of maintaining the required charge separation, or space charge, over time. The search for a mechanism that would allow charge separation over geologic time led to consideration of ferroelectric behavior.
Twenty ore minerals are presently known to be fer- roelectric (Table 1), and include such common min- erals as pyrrhotite, chalcocite (an important copper ore mineral), stibnite (the chief ore of antimony), and bismuthinite. Since ferroelectric behavior of these min- erals has been demonstrated in a number of laboratories by various investigators there seems to be little question that they are, in fact, ferroelectric.
The remaining question is how ferroelectricity affects electrical surveys of sulfide deposits that contain these minerals? The presence of an inherent spontane- ous electric polarization and the extremely high dielec- tric permittivity of ferroelectric minerals makes their investigation fundamental regarding electrical methods of geophysical exploration. However, ferroelectric effects have not been accounted for in the mining geo- physical literature, e.g. see Olhoeft ( 1981, p. 263) or Nabighian (1987), although Schloessin and Timco (1977), Litov and Anderson (1978), and Shirane et al. (1950) have shown that minerals with perovskite structure, such as ferroelectric makedonite (PbTiO3), may be ferroelectric in planetary interiors.
The recognition of ferroelectric behavior may improve the ease of exploring for sulfides using elec- trical methods. Polarization and resonance phenomena appear to be relatively easy to excite and the logistics for measuring these should be less than for conven- tional techniques.
2. Ferroelectricity
2.1 Review of definitions and characteristics of ferroelectrics
Ferroelectrics may be new to many and I have sum- marized characteristic properties here for interested
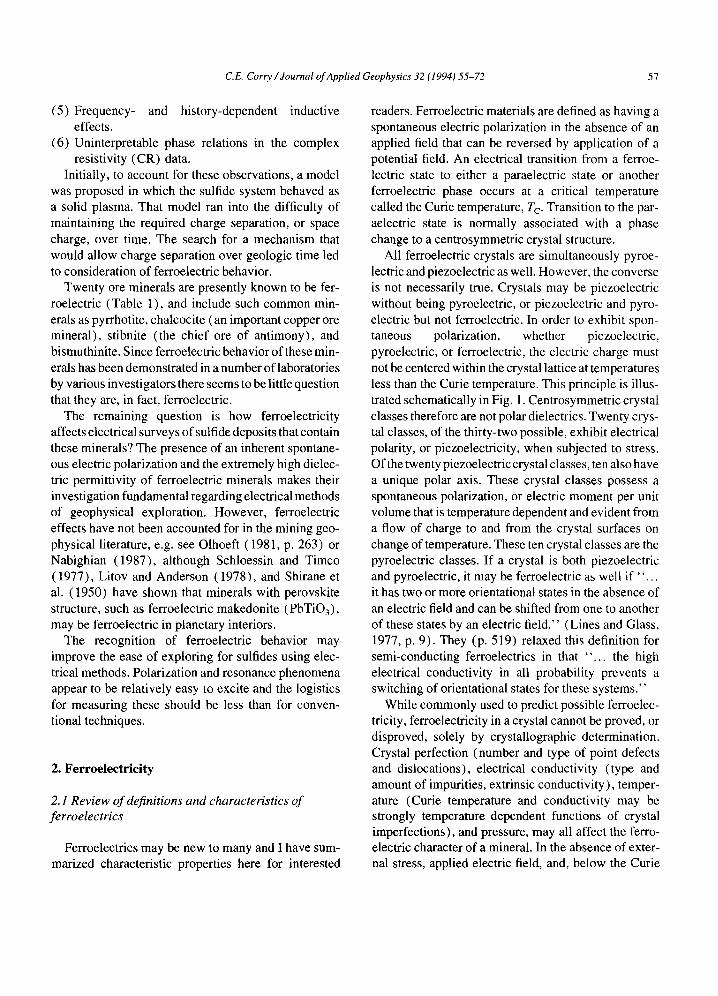
readers. Ferroelectric materials are defined as having a spontaneous electric polarization in the absence of an applied field that can be reversed by application of a potential field. An electrical transition from a ferroe- lectric state to either a paraelectric state or another ferroelectric phase occurs at a critical temperature called the Curie temperature, Tc. Transition to the par- aelectric state is normally associated with a phase change to a centrosymmetric crystal structure.
All ferroelectric crystals are simultaneously pyroe- lectric and piezoelectric as well. However, the converse is not necessarily true. Crystals may be piezoelectric without being pyroelectric, or piezoelectric and pyro- electric but not ferroelectric. In order to exhibit spon- taneous polarization, whether piezoelectric, pyroelectric, or ferroelectric, the electric charge must not be centered within the crystal lattice at temperatures less than the Curie temperature. This principle is illus- trated schematically in Fig. 1. Centrosymmetric crystal classes therefore are not polar dielectrics. Twenty crys- tal classes, of the thirty-two possible, exhibit electrical polarity, or piezoelectricity, when subjected to stress. Of the twenty piezoelectric crystal classes, ten also have a unique polar axis. These crystal classes possess a spontaneous polarization, or electric moment per unit volume that is temperature dependent and evident from a flow of charge to and from the crystal surfaces on change of temperature. These ten crystal classes are the pyroelectric classes. If a crystal is both piezoelectric and pyroelectric, it may be ferroelectric as well if " . . . it has two or more orientational states in the absence of an electric field and can be shifted from one to another of these states by an electric field." (Lines and Glass, 1977, p. 9). They (p. 519) relaxed this definition for semi-conducting ferroelectrics in that " . . . the high electrical conductivity in all probability prevents a switching of orientational states for these systems."
While commonly used to predict possible ferroelec- tricity, ferroelectricity in a crystal cannot be proved, or disproved, solely by crystallographic determination. Crystal perfection (number and type of point defects and dislocations), electrical conductivity (type and amount of impurities, extrinsic conductivity), temper- ature (Curie temperature and conductivity may be strongly temperature dependent functions of crystal imperfections), and pressure, may all affect the ferro- electric character of a mineral. In the absence of exter- nal stress, applied electric field, and, below the Curie

58 C.E. Corry /Journal of Applied Geophysics 32 (1994) 55-72
Ferrodistortive
Antidistortive
Pyroelectric
Ferroelectric
Antipolar
Antiferroelect ric
T>Tc T<T,. T<T,
Applied field
FT¢ Q Q Charged atoms or groups
Q Uncharged atoms or groups
Fig. 1. Schematic representation of some fundamental types of structural phase transitions from a centrosymmetric prototype at a temperature greater than the Curie temperature (T > To). In order to exhibit spontaneous polarization, whether piezoelectric, pyroelectric, or ferroelectric, the electric charge must not be centered within the crystal lattice for T< T c. (From Lines and Glass, 1977.)
temperature, the polar orientation states of domains within a ferroelectric crystal are stable with time.
Ferroelectrics exhibit hysteresis when polarized by an electric field, as illustrated in Fig. 2, and form polar- ization domains within their crystalline structure in the same way as ferromagnetic minerals. The electrical domains are frequently characterized by twinning in the crystal. As with piezoelectric and pyroelectric min- erals, ferroelectric minerals may also exhibit a surface charge. Ferroelectrics are commonly antiferromag- netic, rarely ferromagnetic. Alexandrite, or Cr-chrys-
oberyl (Cr2BeO4), is an example of a magnetoferroelectric mineral (Newnham et al., 1978).
Minerals may be antiferroelectric (see Fig. 1 ), rather than ferroelectric. For example, Ismailzade and Mir- ishli (1970) cited evidence that russelite (BizWO6) is antiferroelectric. Other ore minerals may not prove to be ferroelectric at real, i.e. T>~ 0 K, temperatures, or they are ferroelectric only at cryogenic temperatures ( Tc < 0°C). Altaite (PbTe) is an example of a "near" ferroelectric that is not ferroelectric at " rea l" ( T > 0 K) temperatures (Lines and Glass, 1977, pp. 522-

C.E. Corry / Journal of Applied Geophysics 32 (1994) 55-72 59
D
D-E / Fig. 2. Ferroelectric hysteresis loop for a single domain illustrating the coercive field, Ec, spontaneous polarization, Ps, and remanent polarization, Pr. The applied electric field and electric displacement are E and D, respectively. Within a single domain D has two possible stable values for E = 0 corresponding to the opposite orientations of the spontaneous polarization (Lines and Glass, 1977). This is the saturated value of displacement, + Ps. In a multi-domain crystal (the normal case) the average zero-field displacement can have any value between the two extremes, + Ps. For an applied field >/Ec (typically hundreds of volts/cm) polarization reversal occurs and the crystal exhibits large dielectric non-linearity through the reversal. Hysteresis loops such as this can usually only be obtained with insulating fer- roelectric materials. The high electrical conductivity of semi-con- ducting and metallic ferroelectrics generally precludes applying a sufficiently high potential (>~E~) to switch the orientation state (Lines and Glass, 1977, p. 519).
524). However, with the addition of Sn or Ge to the crystal lattice the Curie temperature for altaite moves to positive values (Tc > 0°K).
Dielectric permittivity (or dielectric constant), E, as shown in Fig. 3 for chalcocite, and resistivity, p, of a ferroelectric are very non-linear near the Curie temper- ature. Above the Curie temperature, the hysteresis loop (Fig. 2) should ideally collapse to a straight line for the paraelectric phase of the mineral. The hysteresis is frequency dependent, and ferroelectric hysteresis can be easily confused with non-linear lossy dielectric behavior, which is particularly troublesome with semi- conductor ferroelectrics. As a result, it is very difficult, if not impossible, to obtain unambiguous hysteresis curves for semi-conducting and metallic ferroelectrics.
A ferroelectric ceramic was defined by Lines and Glass (1977) as an aggregate of ferroelectric single
crystal grains (or crystallites) with dimensions typi- cally between 0.5 and 50 ~m. However, ceramics may have grain sizes larger than this, depending upon the stability of individual domains within the aggregate. Thus, a sulfide deposit, where the crystals are stable over geologic time, can be modeled as a ceramic.
Ferroelectric ceramics virtually always pole, that is, they acquire a preferred directional electrical polari- zation of the grains when cooled through their Curie temperature. Poling can be enhanced by, or may require, application of an external electric field, stress field, or temperature gradient.
The polar direction of a ferroelectric is imprinted in the structure of the contained crystals and, hence, is stable with time so long as the mineral remains below its Curie temperature. Because of the similarities in domain structure, twinning, etc. within the crystal, fer- roelectrics are often referred to as the electrical analog
O
x
).- F-
1 5 I--
UJ o_
02 I - 1 0
U.I _..1 UJ
0
.E W
z
I
u.l
n~ 0
53 1~0 r - -
1 5 0 2(30
TEMPERATURE (°C)
Fig. 3. Relative dielectric permittivity as a function of temperature in a natural sample of polycrystalline chalcocite showing the non- linear behavior near the Curie temperature (105°C) typical of fer- roelectrics. A~/~ was measured at 1 kHz. Because of possible inductive effects from the electric furnace coils, only the cooling cycle is shown. (From Bieniulis et al., 1987. )

60 C.E. Corry /Journal of Applied Geophysics 32 (1994) 55-72
(1)
-._~+Electrlc dipole direct ion
within a domain Mo~lpont lnoouSasured l p o l a r i z a t i o n
i ~ _ q~. ~pt / .,~\ P o l a r i z a t i o n d i rect ion P"6 ~'~- ~ ~ l f "~" J(~'~"l ~'~of indiv idual domains
+4 I S t i t i l t i c l l a v l r I g o POLEO DIRECTION with zero i p p l l o d f ie ld
E f i e l d e p p l l e d l t o I " - . * - " . .4 . - , , - t _ / ~-~---I ( 2 ) . r i d . 0 , ' . , o c . I - I " : : _ " - - ..- " E I
\ I . . 3 " . - " " . . - ' - ' , ' I \ I ~ ~ " ~ - .,*.-. -,-- I
" q " - -,,-- . - - ~¢+.. " - 1
E f ie ld eppl lod In P~LED DIRECTI'ON poled d i rec t ion
(3) I • 12 ..-" 2 i 7 1 I I J " " " " , , . - ' t I
. J_ Appl ied E f ie ld o p p o a e l .i
POLED DIRECTION poled d i rect ion
Fig. 4. Schematic diagram of a poled semi-conducting ferroelectric ceramic block. In ( 1 ), the block has zero applied external field. An electrode at the midpoint O measures the spontaneous polarization (in practice the electrochemical potential) relative to ground. The poled direction is the statistical average of the electric dipole moment of each domain. In (2), a constant potential field ( << Ec) is applied to the ends of the block as shown in Fig. 5, and in a direction that causes additional electric dipole moments to align in the poled direction. The measured polarization at midpoint O then increases. In (3) the applied potential opposes the poled direction. Fewer electric dipole moments are then aligned with the poled direction, and the measured polarization at midpoint O decreases. An E field applied perpendicular to the poled direction would also cause a lesser change in the polarization measured at midpoint O, since fewer electric dipole moments are favorably oriented.
of ferromagnetism. In this respect, poling is the elec- trical analog of thermal remanent magnetization in fer- romagnetic materials.
Electrets include all materials in which persistent polarization is observed following the application of an electric field. Ferroelectrics are a subgroup of electrets. The relaxation times of electrets may range from sec- onds to years and ferroelectrics may exhibit secondary electret behavior (Parkhomenko, 1971; Lines and Glass, 1977). If an external field is applied for long time periods, domains with favorably oriented dipole
moments may grow at the expense of less favorably oriented domains. On removal of the applied field, the polarization may slowly relax to its previous state. This is the electrical analog of viscous remanent magneti- zation.
All polar dielectrics exhibit directional polarization when an external electric field is applied. Only within a single domain can the spontaneous polarization reach the saturation value +Ps (Fig. 2). In a poled ferroe- lectric ceramic, the spontaneous polarization will be much less than saturation. Thus, the poled direction

C.E. Corry I Journal of Applied Geophysics 32 (1994) 55-72 61
® SURFACE A I O ,~OCK B
', ," Yll\\ " J / i ~ , , \ \ / / / /
,,. .-J L.
/ ~ / j
Ii \~\"\ /" '\,, / i I ~ \ \ / I
, / ~ L _ _ . _ J ~ "\ I / \
/ I - /
Fig. 5. Potential surface distribution (- -) and current flow ( - - ) lines in a purely resistive solid about two transmitter electrodes, A and B. In a purely resistive body, the induced potential would be zero at the midpoint O between A and B relative to a point at infinity. In the field experiments at Mount Emmons and Three R Canyon, a block of ferroelectric material, as illustrated in Fig. 4, lies between points A and B in the position shown. (Modified from Sumner, 1976.)
will be the favorable direction for further polarization by application of an external E field, as shown sche- matically in Fig. 4. Application of an external field in other than the polar direction will still result in polari- zation of the body, but with reduced amplitude, as fewer electric dipole moments are favorably oriented. The amount and direction of poling is a function of the applied E field, temperature gradients, and stress field at the time the ceramic is cooled. Because the original domain orientation is frozen into the crystal lattice, the polarization returns to its initial value when the applied field is removed, although there may be a time delay due to electret effects. For a lossy dielectric other than a ferroelectric, a transient voltage would be observed at midpoint O in Fig. 5 when the field is applied at points A and B, but would quickly decay to the original value. For a purely resistive body, no change in poten- tial would be observed at midpoint O as illustrated in Fig. 5. Note that ferroelectrics polarize as a function of applied potential, not current.
2.2 Ferroelectricity in ore minerals
While twenty ore minerals are presently recognized as ferroelectrics (Table 1), it is also possible to predict other ore minerals that may be ferroelectric by extrap-
olation from known characteristics and such methods have been quantified by Thomas ( 1991 ). Crystals with the same space group as a known ferroelectric com- monly prove to also be ferroelectric. In addition to being isostructural with a known ferroelectric, other characteristics such as optical anisotropy, known struc- tural phase changes, piezoelectricity or pyroelectricity, etc. may also suggest that a mineral is ferroelectric. New ferroelectrics are thus often discovered by looking at crystals that have the same space group and other characteristics of a known ferroelectric. An example of using an isostructural space group to discover a new ferroelectric sulfide was given by Grigas et al. (1976) for chalcostibite, which is isostructural (space group Pna21) with bismuthinite and stibnite. Stibiotantilite is another ferroelectric mineral (Gavrilova et al., 1971 ) with space group Pna2~. By inference, bismutotantilite, dimorphite, emplectite, horobetsuite, lautite, pierrotite, and other ore minerals with space group Pna21 may also prove to be ferroelectric, since they are isostruc- tural and share other ferroelectric characteristics with bismuthinite, chalcostibite, stibnite, and stibiotantilite.
Matthias (1967) pointed out that sulfur has the same high electronic polarizability as oxygen octahedra and the same propensity to form ferroelectric crystals. Examples of isostructural oxide and sulfide ferroelec-

62 C.E. Corry /Journal of Applied Geophysics 32 (1994) 55-72
trics can be found in Table 1. Thus, sulfides that are isostructural with oxide ferroelectrics may also be fer- roelectric. By the same reasoning, telluride (GeTe is a well-known ferroelectric), selenide, and arsenide ore minerals are also included. Sixty-six ore minerals that are isostructural with the known ferroelectric minerals in Table 1 have been identified. With twenty known ferroelectric ore minerals and sixty-six minerals isos- tructural with the known ferroelectrics, ferroelectricity should be regarded as a common property of ore min- erals. Given the large number of known and probable ferroelectric ore minerals most deposits are likely to contain at least some ferroelectric minerals.
3. Geophysical effects of ferroelectricity in sulfides
3.1 Statement of problems
It is comparatively straightforward to determine fer- roelectric effects in single crystals and single-phase polycrystalline or ceramic materials in a laboratory (e.g. see Bieniulis et al., 1987). However, transfer from the laboratory to measurements of ferroelectric effects in the earth is not a trivial task.
Ideally, field experiments to test for ferroelectric effects would produce results uniquely distinguishable from other effects such as membrane polarization, ter- rain, and piezoelectric effects. Major unknowns in the field surveys also include questions of how much of a ferroelectric mineral must be present before ferroelec- tric behavior is evident, and how much must be present before ferroelectric effects dominate? In most field electrical surveys, a lower bound of detectability for a mineral like pyrrhotite is often taken to be 0.1 wt%. One percent or greater pyrrhotite usually dominates the electrical response of a system if the resistivity of the barren country rock is reasonably high (e.g. >50 S2.m).
Further complicating field measurement of ferroe- lectric effects is the fact that the same mineral may be ferroelectric in one deposit and not in another, or only in one part of a sulfide system and not in another. For example, pyrrhotite (Fe~-xS) is ferroelectric at ordi- nary temperatures ( Tc > 100°C) forx ~< 0.04, and tends toward the troilite (FeS, x = 0 ) end-member when formed at high temperatures. In a low-temperature sys- tem, there may not be any ferroelectric pyrrhotite. In a
porphyry stockwork sulfide system, the pyrrhotite near the center (high temperature) of the system may be ferroelectric, while in the outer halo (low temperature) the pyrrhotite will be ferrimagnetic, not ferroelectric.
Measurements of ferroelectric effects also contain electrochemical potentials and the effects of telluric currents and other noise sources, e.g. cultural effects.
3.2 Basis for field experiments
Much of the basic theory for the measurement of polar dielectric properties in the earth was given in Parkhomenko ( 1971 ) with an emphasis on piezoelec- tric effects. Since ferroelectrics must also be piezoelec- tric, piezoelectric effects will also be evident in ferroelectric systems. Piezoelectric effects in sulfide deposits in Canada have been reported by Sobolev et al. (1984) and Maxwell et al. (1987).
Possible pyroelectric effects in ore bodies are neglected here, although in an active hydrothermal sys- tem, e.g. "black smokers", such properties may have important applications.
Polarization at the central point of a dipole If a steady-state E field is applied to a resistive body
using a dipole source as shown in Fig. 5, the induced potential will be zero at the midpoint between the trans- mitter electrodes relative to a point at infinity. If, instead, the body is a polar dielectric, the induced volt- age at the midpoint will be non-zero and proportional to the polarization induced in the body by the applied field. Because semi-conducting ore minerals are lossy dielectrics, piezoelectric and pyroelectric effects would quickly be compensated by a flow of free electrons. Only at relatively high frequencies ( >> 1 Hz) would piezoelectric or pyroelectric charge transfer be apparent in earth materials. Membrane polarization due to elec- trochemical charge transfer on grain boundaries (see review by Sumner, 1976) behaves in a similar way, except it should not be directional or steady state in a disseminated stockwork porphyry deposit. Thus, only a ferroelectric body should show constant potential (DC) polarization effects at the center electrode. Extant electrochemical potentials are a constant DC bias on these polarization effects. Ferroelectric effects are expected to directionally add to or subtract from that bias potential. Two field experiments to test this concept are described below.

C.E. Corry / Journal of Applied Geophysics 32 (1994) 55-72 63
Effects on apparent resistivity and dielectric permittiv- ity
Maxwell-Wagner effects and Schottky barriers at the grain boundaries in any semi-conducting ceramic affect both the apparent resistivity of the material and the apparent dielectric permittivity. Following the devel- opment given in Lines and Glass ( 1977, pp. 534-537), the apparent resistivity, Pa, and apparent dielectric per- mittivity, ca, of a ceramic of semi-conducting sulfide grains of resistivity Ps and dielectric permittivity e~, surrounded by isotropic country rock of resistivity Pc >> P~ and dielectric permittivity Ec can be described by equations of Debye form:
)(Pc Pa =Ps q- 1 + w2r~ ? (1)
and
ec/ X ~a=es + - (2)
1 + ~o2r 2
Resonance, plasma, reciprocity, and history-dependent effects
Resonance phenomena, e.g. quartz crystal oscilla- tors, are well known response effects in polar dielec- trics. Sobolev et al. (1984) reported explosively-excited piezoelectric resonance frequen- cies at 6-10 kHz, 40 kHz, and 320-340 kHz, as shown in Fig. 6, in sulfide deposits in Canada. A similar, elec- trically-excited ferroelectric resonance experiment at Three R Canyon, Arizona, is described below. All modes for plasma frequencies associated with the semi- conductor ferroelectrics are probably too high to prop- agate significant distances in the earth although this problem has not been thoroughly investigated. Induc- tion waves (Fridkin, 1980) in the 1-100 Hz range can be excited by application of external fields and are of low enough frequency to be detectable outside or above the sulfide system.
It seems very unlikely that the principle of reciproc- ity (Sumner, 1976, pp. 29-30) will hold across the boundary of a ferroelectric system because of non-lin-
where rl=eo(pcPs~fflx) 1/2 and re=eops~fflx are relaxation times, X is the ratio of the barrier thickness to the grain thickness, oJ is the angular frequency, and
is the electric permittivity of free space. The bound- ary layer resistance and capacitance are assumed to be much greater than those within the sulfide grain. Since the barrier thickness may be very small relative to grain thickness (X << 1 ), a large multiplication factor of ec/ X can result in a very large apparent dielectric permit- tivity, Ca. The apparent resistivity is reduced in a similar manner since Pa ~ Ps as X ~ 0. In a poled ferroelectric ceramic, Pa, Ps, Ca, and Es, are tensors. The polar axis is an eigenvector and the eigenvalues represent maxima and minima in the polar directions.
Eq. (2) suggests that ore bodies containing signifi- cant amounts of ferroelectric sulfides may have an apparent dielectric permittivity of 10 6 to 107 or more at the low frequencies ( < 10 kHz) typically used in most geophysical surveys and relaxation times > 10 s. Sim- ilarly, the apparent resistivity may approach p~ in the polar direction. The dispersion frequency, f = 1/72, decreases as the low-frequency capacitance increases. At the frequencies used for most electrical surveys ( < 10 kHz) this effect will be negligible, and bound- ary-layer effects dominate the rock response.
O.E
w a o . 4 m
< 0 . 2
z O.C l * * O 1 0 0 2 0 0 3 0 0 4 0 0
F R E Q U E N C Y ( k H z ) G I A N T Y E L L O W N K I F E M I N E , N . W . T .
O.E
O.E
O . 4
~ 0 . 2
~ °°o ,;o I O 0 l O 0 3OO F R E Q U E N C Y [ k H z )
S U L L I V A N M I N E , K I M B E R L Y , B . C .
P I E Z O E L E C T R I C R E S O N A N C E IN S U L F I D E D E P O S I T S
1.0,
Fig. 6. Amplitude spectra of explosively-excited piezoelectric reso- nance observed by Sobolev et al. (1984) at the Giant Yellowknife mine, N.W.T. and Sullivan mine, Kimberly, B.C. in Canada.

64 CE. Corry / Journal of Applied Geophysics 32 (1994) 55-72
ear effects. In particular, measurements made with the transmitting dipole entirely inside the ferroelectric sul- fide system would couple non-linearly and weakly to the surrounding country rock.
History-dependent electrical behavior observed at some deposits may be either electret effects or an inher- ent ferroelectric phenomenon, but were not studied fur- ther in the field tests described below.
4. Field tests
4.1 Mount Emmons, Colorado (38~53'N, 107°OYW)
The initial field test site was the Red Lady, a dissem- inated porphyry sulfide stockwork deposit capping an intrusive stock within Mount Emmons, Colorado. The geology was described by Thomas and Galey (1978) and White et al. ( 1981 ). The deposit and surrounding area were penetrated by about 200 cored diamond drill holes. An extensive suite of geophysical, geologic, and geochemical surveys were conducted at this site prior to these experiments. Electrical surveys included self- potential (Corry, 1985), complex resistivity (CR), and CSAMT (Corry et al., 1987, 1988). Other geophysical surveys included seismic reflection, airborne and ground magnetic surveys, and regional as well as detailed and underground gravity surveys. These sur- veys were run independently of the polarization study and were not repeated. In addition, nearly 50 drill holes in and around the deposit were logged with a variety of slimhole tools, including resistivity, self-potential, density, magnetic susceptibility, and natural gamma. The lateral electrical boundary of the deposit was known from the CSAMT survey (Corry et al., 1987) and coincides with the geologic and geochemical boundary. No faults were evident on a high-resolution seismic survey across the deposit. Sulfides at Red Lady are known from geochemical surveys to be radially distributed with a maximum concentration of 8 wt% total ( ~ 1 wt% pyrrhotite) at the surface in the center of the deposit, and grade radially outward to ~ 2 wt% total at the margin of the deposit. The sulfides are prin- cipally pyrite and pyrrhotite at the surface. The ore mineral capping the stock is molybdenite, with pyrite and magnetite included. No graphite was found. A magnetic anomaly associated with magnetite and pyr- rhotite in the mineralized cap on the stock is symmetric
about the center of the deposit. No preferred orientation of the sulfide crystals is known. With stockwork emplacement, and no known fault control, a preferred orientation of the mineralization seems very unlikely.
Results of these surveys demonstrated that the self- potentials were electrochemical in nature and not the result of current flow in the ground (Corry, 1985). Also, both inductive and capacitive effects were observed in the CR and CSAMT surveys. Further, whether the response of the sulfides to an applied elec- trical field was inductive or capacitive was frequency dependent. The deposit is above timberline and the climate is arctic so that corrosion of the sulfides is an unlikely explanation for any observed electrical effects. This is borne out by the preservation of the sulfides over geologic time.
The known ferroelectric mineral in the central part of the Red Lady deposit is pyrrhotite. Isostructural molybdenite in the deposit is also probably ferroelec- tric.
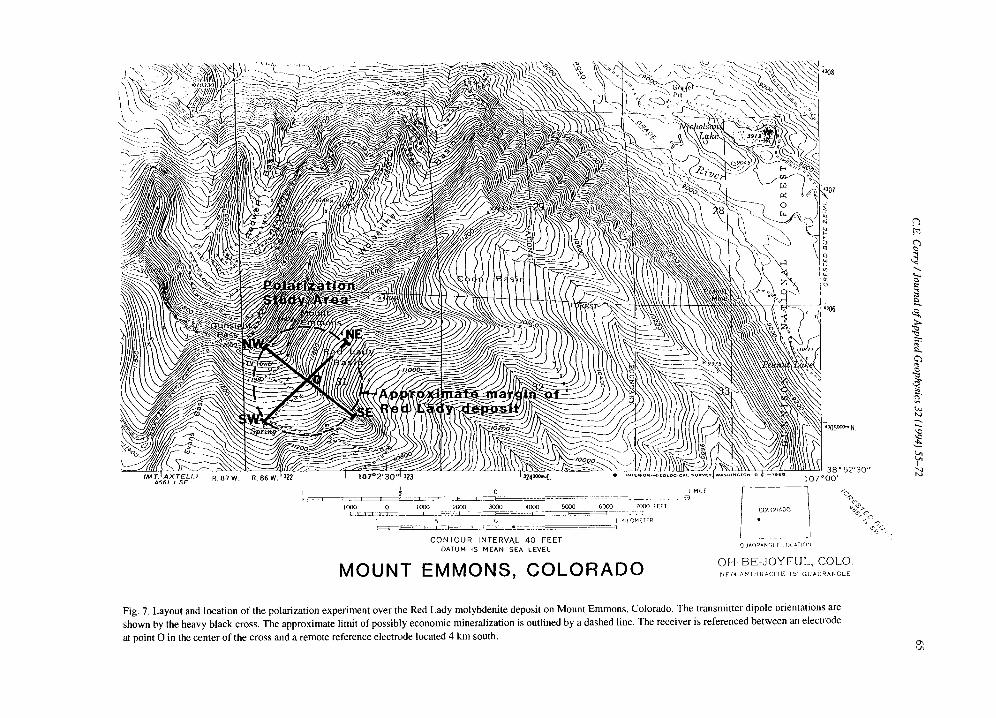
As described previously, and illustrated in Fig. 4, one ferroelectric effect that should be observable in the field is directional polarization. To test that hypothesis, two roughly perpendicular transmitter dipoles of the same length were emplaced on the electrical margin of the Red Lady deposit as shown in Fig. 7. One dipole was oriented in a NW-SE direction, and the second in a NE-SW direction. The layout of the dipoles was determined by terrain conditions and the NW-SE line runs down a ridge, while the NE-SW line runs over the ridge into a cirque on the NE end (Fig. 7). The refer- ence voltage electrode was placed in the center of the deposit, coincident with the center of the transmitter dipoles, and the ground electrode for the receiver was located 4 km south of the center, essentially at infinity. Each transmitter dipole was symmetrically polarized first in one direction ( + ~ - ) , then the other ( - ~ + ). The superimposed change in potential, rel- ative to the extant spontaneous polarization of - 803 mV, was measured at the reference voltage electrode in the center of the system. The electrochemical mech- anism for the spontaneous polarization observed in the absence of an applied field was discussed by Corry (1985). The sequence of polarization and the observed polarization is tabulated in Table 2.
As shown in Fig. 5, the change in potential measured at the center of the dipole would be zero for a resistive earth with the symmetric applied potential on the trans-
~ee., N
I M~I E I 0
1000 0 1003 2000 3000 4000 5000 6000 7000 FEEl
l 5 0 i KILOMETER
C O N T O U R I N T E R V A L 4 0 F E E T DATUM IS MEAN SEA LEVEL
MOUNT EMMONS, COLORADO
* 5 2 ' 3 0 "
COLORADO ~L~, • I .O
I
QIJAD~ANr;I f I ()f:ATIC~I
O H - B E - J O Y F U L , COLO. INE/¢ A N F f t R A C I T E IS' Q U A D R A N G L E
Fig. 7. Layout and location of the polarization experiment over the Red Lady molybdenite deposit on Mount Emmons, Colorado. The transmitter dipole orientations are shown by the heavy black cross. The approximate limit of possibly economic mineralization is outlined by a dashed line. The receiver is referenced between an electrode
at point O in the center of the cross and a remote reference electrode located 4 km south.
& C~ e~
t .a

66 CE. Corry /Journal of Applied Geophysics 32 (1994) 55-72
Table 2 Constant potential directional polarization of the Mount Emmons porphyry sulfide deposit in central Colorado
Transmitter dipole Sequence of Transmitter polarization
Change in polarization after 15 min
Orientation Polarity Voltage Current Observed Normalized to 700 V
NE-SW SW + 1st 625 V 4.0 A + 84 mV + 94 mV NE-SW NE + 2nd 625 V 4.0 A - 74 mV - 83 mV NW-SE NW + 3rd 700 V 2.0 A - 230 mV - 230 mV NW-SE SE + 4th 700 V 2.0 A + 245 mV + 245 mV
The field layout is shown in Fig. 7. The basis for the experiment is illustrated in Figs. 4 and 5. The transmitting dipoles are of equal length and arranged in a cross, with the electrodes at the electrical boundary of the ore grade mineralization. The change in polarization is measured with the transmitter on at the center of the transmitter dipole, relative to a ground point 4 km to the south (a dipole-pole array). The spontaneous polarization at this central point was - 803 mV with the transmitter off. The stated change in polarization voltage is with respect to the initial potential. Measurements are repeatable to _ 5 mV.
mit ter d ipole used for the exper iment . Instead, as meas-
ured at the cen te r o f the t ransmit ter dipole , the entire
sys tem proved to be ex t remely polar izable ( see Table
2) , and it is clear f rom the data that this sulfide sys tem
polar izes preferent ia l ly to the N W - S E relat ive to the
N E - S W dipole. I f the polar iza t ion were s imply elec-
t rochemica l it would not be direct ional because the
sulfides are k n o w n to be radially dis t r ibuted. The direc-
tion o f m a x i m u m polar iza t ion is unknown , but N W -
SE mus t be reasonably close.
Resonance is ano ther p h e n o m e n a c o m m o n l y asso-
c ia ted with polar dielectr ics . Red Lady C S A M T line 2
Table 3
( see Corry et al., 1987) lies approx imate ly a long the
N E - S W dipole s h o w n in Fig. 7, and the resonance at
stat ion 0, shown by the m i n i m u m in Pa at 7 0 - 1 0 0 Hz
in Fig. 8, is approximate ly at the center o f the cross
(Fig. 7) . The direct ion ( N W - S E ) o f m a x i m u m polar-
ization is perpendicular to the C S A M T line di rect ion
where r e sonance (Fig. 8) is observed. S lopes exceed-
ing 45 ° in l o g f v s , log/9 a space are c o m m o n l y at tr ibuted
to two- or th ree -d imens iona l (2 -D or 3-D) effects , and
especia l ly "cu r r en t c h a n n e l i n g " ( for r ev iew see Jones ,
1983), when measu remen t s are made near boundar ies
having sharply d i f ferent resist ivit ies. At the Red Lady
Constant potential directional polarization at the Three R porphyry sulfide deposit in the Patagonia Mountains, Arizona
Transmitter dipole Sequence of Transmitter Change in polarization Apparent Magnetic field polarization voltage after 2 min resistivity at center of
(p~2- m) cross Orientation Polarity Voltage Current Observed Normalized ( nT )
to 800 V
NW-SE NW + I st 800 V 2 A + 178 mV + 178 mV 62 + 29 NW-SE SE + 2nd 790 V 2 A - 103 mV - 104 mV 62 -28 NE-SW NE + 3rd 420 V 2 A + 82 mV + 156 mV 288 + 18 NE-SW SW+ 4th 430V 2A - 7 4 m V - 138 mV 288 -23
The field layout is shown in Fig. 9. The basis for the experiment is illustrated in Figs. 4 and 5. The transmitting dipoles are arranged in a cross with the NE, SE, and SW electrodes on or near the margin of the known deposit. The NE electrode approaches that edge of the deposit. The change in polarization is measured with the transmitter on at the center of the transmitter dipole, relative to the SP base 2.7 km to the east (a dipole-pole array). The spontaneous polarization at the center of the cross was -543 mV with the transmitter off. The stated change in polarization voltage is with respect to the initial potential. Measurements are repeatable to +_ 5 inV. Resistivities and chargeability were measured using a Schlumberger array with the same dipole length in both directions. In contrast to Pa, the chargeabilities at 0.125 Hz were independent of direction and very low, ~ 0.025 mV s/V. The magnetic field measurement also reflects directional polarization with the same preferred direction as the electric field. The magnetic field was measured with a Geometrics model G816/826A proton precession magnetometer at the center of the cross, and is affected an undetermined amount by current flow in the transmitter wire. The change in the magnetic field with the transmitter on is stated relative to total field of 48,832nT with the transmitter off.

C.E. Corry /Journal of Applied Geophysics 32 (1994) 55-72 67
103 I
i 0 2
E
u
o,-
k
,_10 c 7 ua
L
\
\ \
i 0 -'e \ \ ,
I0" I O . S I
I I
0
'\.
I*'\ I !
\ "\
\ • '..\.
. . . . \
•. 11\ . . o - " " . . . . . •
\ "... .. . . ,~/ "" \ .. \ . . .e '"
".. \ . £ / o r . - Xe,\ • ~ . /
\ . • ~ ~ / ' ~ . . • .. ... / . ~ . . . . . • ? e~." / \ . - ,% / ~ : / "
• z . • .. / . / /
• Q : /e" e /
c~.' ". ~ : / ~ / "
~ . ~...-.....- / /
/ ~ o / ,," ~,/
2i z i Z.
~/ - I
~.1 /
o . . /
t l I
/
/ I /
~,f,I I g I I q ~'r '~¢~ e~ For Field *°N,.
- v ~ % - ~ , . ~ t, / " / 4. t'"
/ e
/
3/ 2/
I
I I I I I | I I I I I 2 4 8 16 3 2 6 4 128 2 5 6 5 1 2 1 0 2 4 2 0 4 8
F R E Q U E N C Y - H Z
Fig. 8. Log-log plot of frequency vs. Pa for CSAMT surveys over the Red Lady porphyry molybdenite deposit at Mount Emmons (38°53'N. 107°03'W), Colorado and the Pine Nut (38°47'N, 119°32'W), Nevada deposit. Line locations are shown in Corry et al. (1987). Stations taken over Red Lady and Pine Nut show slopes greater than the theoretical maximum of 45 ° observed over a layered earth with a perfectly conducting basement. The notch extends over several frequencies, with a minimum Pa between 64 and 128 Hz at Red Lady, and 1 Hz at Pine Nut. An equivalent electrical circuit for such a curve is a series resonant tuned circuit. The resonance effect is largest at the center of the Red Lady deposit (station 0) and diminishes towards the boundaries of the deposit, as evident at stations - 4 and 4 at Red Lady. For comparison, the transition between far field (transmitter >3 skin depths from the receiver) and near field ( <3 skin depths) is plotted for a station at Bald Mountain (38°47'N, 106°02'W), Colorado. At Red Lady, the transition from near field to far field occurs at < 8 Hz in the sulfides outside of the resonance stations• Thus, no apparent similarity exists between the resonance and the near field-far field transition effects, and the resonance effect is more than two orders of magnitude larger than the near field-far field transition effect• (From Corry et al., 1987.)
d e p o s i t the e f f e c t is m o s t e v i d e n t a t s t a t i on 0 in the
c e n t e r o f t he d e p o s i t a n d t h e n o n l y in the N E - S W
d i r ec t i on . S t a t i o n s - 4 a n d 4 are n e a r e r t he b o u n d a r i e s
o f t h e d e p o s i t , b u t s h o w r e d u c e d r e s o n a n c e . N o r e s o -
n a n c e w a s o b s e r v e d at s t a t i o n s t a k e n n e a r t he ac tua l
b o u n d a r i e s o f the d e p o s i t o r on t h e p p e r p e n d i c u l a r
( N W - S E ) l ine d e n o t e d R e d L a d y 1. T h u s , 2 - D or 3 - D
c u r r e n t c h a n n e l i n g e f f e c t s s e e m an un l ike ly
e x p l a n a t i o n fo r t he o b s e r v a t i o n s . A s e c o n d p o s s i b l e
e x p l a n a t i o n is a n e a r f i e l d - f a r f ie ld t r ans i t ion . A s s h o w n

, , ~, ~ ~ o, ,...., T H R E E R C A N Y O N , A R I Z O N A
~ ~ ~ ~ ,o ~,...om-rt. C U M E R O C A N Y O N Q U A D R A N G L E , "¢..4 ~'~' CONTOUR INTERVAL 40 FEET A R I Z O N A - S A N T A C R U Z CO. _ , r .
SUPPLEMENTARY CONTOUR INTERVAL 20 FEET 7 .5 M I N U T E S E R I E S (TOPOGRAPHIC) 4,~. NATIONAL GEOOErE VERTICAL DATUM OF 1929
QU,~DRM~GLE LO(~TION NFJ4 NOGALES 15' QUADRANGLE
Fig. 9. Layout and location of the polarization experiment in Three R Canyon in the Patagonia Mountains, Arizona. The transmitter dipole orientations are shown by the heavy black cross. The NW, SW, and SE transmitter electrodes are near the margin of the deposit and the NE electrode approaches the margin in that direction. The receiver is referenced to an electrode at point O in the center of the cross and to the SP base west of the cross.
?

C.E. Corry /Journal of Applied Geophysics 32 (1994) 55-72 69
in Fig. 8, the resonance is two orders of magnitude larger than the near field-far field transition effect illus- trated in the example from Bald Mountain. No reso- nance was observed at either locality on perpendicular lines. Thus, the resonance is present in one direction only. The resonance thus appears to be a function of the direction of the CSAMT survey, the amount and kind of sulfides, and distance from the boundary of the deposit. While a ferroelectric mechanism is proposed, a quantitative description of that mechanism awaits further work.
4.2 Three R Canyon, Arizona (31°28'N, 110°46'W)
Building on the lessons of the initial study at Mount Emmons, a second field study was conducted in Three R Canyon in the Patagonia Mountains, Arizona. Min- erals in those deposits that are known ferroelectrics include chalcocite, chalcostibite, and pyrrhotite (Table 1). Probable (isostructural) ferroelectrics found at Three R Canyon include acanthite, arsenopyrite, azur-
T H R E E R C A N Y O N , AZ
I I I I I
DC 500kHz 1MHz
Fig. 10. Amplitude spectrum showing apparent ferroelectric reso- nance at ~400 kHz electrically-excited by a 4,096 Hz square wave input at a porphyry sulfide deposit in Three R Canyon, Patagonia Mountains, Arizona. For comparison, Sobolev et al. (1984) reported explosively-excited piezoelectric resonance frequencies in the range of 320 to 340 kHz (Fig. 6) in sulfides. The transmitter layout is shown in Fig. 9 and the spectrum analyzer is referenced to an elec- trode at the center of the transmitter dipole and SP base outside the sulfide system• With the transmitter turned off, noise from natural and artificial sources was less than 10 mV. The transmitter used was a Zonge Engineering and Research Organization model GGT-25 with frequencies tunable by a factor of 2" in the range 2 -4 to 213 Hz. Sketched from a photo by Dudley Emer.
ite, chalcopyrite, covellite, cubanite, dimorphite, mal- achite, orpiment, and realgar. The total and relative concentrations of these minerals in this deposit are not known, but certainly exceed 1 wt% in aggregate.
The NW, SW, and SE electrodes were located on or near the margin of the deposit and the center of the deposit is to the ENE of the crossed dipole transmitter array. The field layout is shown in Fig. 9. In addition to directional polarization, at this deposit we also meas- ured Pa, chargeability, and magnetic effects. The results are shown in Table 3. The observed preferred polari- zation is to the NW-SE.
Ferroelectrics polarize as a function of the applied potential, not current. However, the transmitter used was a conventional constant current device. Hence, if the polarization is calculated for 800 V (Table 3), the preferred direction of polarization is less evident. Since the poled directions are not known a priori, it is also possible that the transmitter dipoles are near 45 ° from the poled direction of the sulfides. While the directional polarization is not as apparent at Three R Canyon as at Mount Emmons, the apparent resistivity, Pa, is very directional (Table 3). The minimum apparent resistiv- ity is in the direction of maximum apparent polariza- tion, as would be expected in a poled ferroelectric ceramic, and the apparent resistivities differ by a factor of five. Also, it seems unlikely that these are maxima and minima directions. Since the survey does not extend past one dipole-length it is probable that terrain effects can be discounted (Fox et al., 1980).
Resonance can be excited by electrical energy in a ferroelectric ceramic. At Three R Canyon we observed apparent resonance at about 400 kHz, as shown in Fig. 10, when we electrically-excited the sulfide system with a 4,096 Hz square wave across the NW-SE trans- mitter dipole shown in Fig. 9 with 800 V and 2 A applied. 400 kHz is on the same order as the explo- sively-excited piezoelectric resonant frequencies of in the range of 320 to 340 kHz (Fig. 6) reported by Sobolev et al. (1984) in Canada. Electrically-excited resonance in sulfide deposits in the 10 kHz and 40 kHz range has not yet been observed, although explosively- excited resonances at these frequencies have been reported by Sobolev et al. (1984). That may be due to equipment limitations as the transmitter frequency was not continuously tunable and could only be changed as a function of 2". Lower frequency, electrically-excited resonance observed over sulfide deposits in CSAMT

70 C.E. Corry / Journal of Applied Geophysics 32 (1994) 55-72
surveys over other sulfide deposits is shown in Fig. 8, but CSAMT data are not available for the Three R Canyon site.
5. Conclusions
Conventional models based on the assumption that sulfides behave purely resistively and that capacitive effects are due to membrane polarization at the grain boundaries do not account for the observed low Pa, resonance effects, history- and frequency-dependent effects, directional effects, long relaxation time, induc- tive effects, or the phase relations in the complex resis- tivity surveys observed at a number of known sulfide deposits. An investigation of possible physical mech- anisms suggests the unexplained observations are of ferroelectric origin. Many ore minerals are known (Table 1 ) or probable ferroelectrics, and known fer- roelectric minerals occur in the deposits surveyed.
There is a strong correlation between ore minerals that are known to cause electrical anomalies in field surveys (e.g. pyrrhotite) and minerals that are known (Table 1 ) or probable ferroelectrics. A model of fer- roelectric minerals in a sulfide deposit as a semi-con- ducting ceramic in an insulating medium is appropriate since the electrical domains in ferroelectfic sulfides can be assumed to be stable over geologic time. Poling of the ferroelectric minerals in a sulfide deposit can occur while cooling during emplacement of the deposit due to electrochemical potentials, thermal gradients, or tec- tonic stresses.
The presence of known ferroelectric minerals and the data presented in Tables 2 and 3 from field experi- ments are interpreted as a ferroelectric response to applied potentials within the Red Lady deposit at Mount Emmons, Colorado and Three R Canyon in the Patagonia Mountains, Arizona. Measured effects attributed to ferroelectricity include directional polari- zation, directional Pa, and electrically excited reso- nance. Other observations that apparently relate to ferroelectricity, or secondary electret behavior, are inductive and history-dependent effects of the sulfide system.
Apparent resonance at ~ 400 kHz (Fig. 10) occurs at Three R Canyon when the system is electrically excited and this is on the same order as explosively- excited piezoelectric resonance frequencies of 320-340
kHz (Fig. 6) reported by Sobolev et al. (1984). Res- onance was also observed in CSAMT surveys, as shown in Fig. 8, and the mechanism for the lower fre- quency responses is speculatively thought to be asso- ciated with induction waves in semi-conducting ferroelectrics as described by Fridkin (1980).
While ferroelectric effects can account for the observed directional resistivities there is, unfortu- nately, no present method of determining the polar directions a priori. However, experience to date sug- gests that, in the polar direction, apparent resistivities may be so low as to preclude resistivity measurements with a dipole-dipole array, and, conversely, in a non- polar direction, a conventional electrical survey might not recognize any sulfide mineralization.
In a more positive sense, ferroelectric minerals polar- ize as a function of applied potential, rather than cur- rent. The logistics of applying large potentials are considerably less than inducing large currents. Thus, in electrical surveys of deposits known, or suspected, to contain ferroelectric minerals it may be advantageous to maximize the applied potential rather than the current as is presently done.
It would also seem possible to test for sulfide min- eralization by simply shorting out the system and watching the self-potential decay, a kind of passive depolarization. Such depolarization is known to persist for at least 12 h, and passive depolarization has been used to eliminate inductive effects in IP surveys. The last precaution involves the probable lack of reciprocity in a ferroelectric system, so that not only transmitter direction, but its location must be evaluated in order to interpret the results.
It may also be relatively easy to induce electrical resonance in these deposits and that would provide an inexpensive reconnaissance technique using magne- tometers and relatively short electrical arrays for explo- ration.
In IP and CR surveys ferroelectric effects can mask the deposit since Pa may approach 0 in the polar direc- tion. Chargeabilities, as measured in a conventional IP survey, may be negligible as at Three R Canyon (Table 3) even though sulfides are present. Phase relations will most likely be uninterpretable in CR surveys over such deposits, as they were at Mount Emmons. In CSAMT surveys directional resonance effects may pre- clude depth interpretation. Both inductive and capaci-

C.E. Corry /Journal of Applied Geophysics 32 (1994) 55-72 71
tive effects may be observed in IP, CR, and CSAMT surveys over ferroelectric sulfide deposits.
Because electrowinning (e.g. see Jordan et al., 1980) is a common technique in ore processing, fer- roelectric properties also may have broad application in ore recovery and processing. Ferroelectricity also accounts for many of the optical properties of ore min- erals and the disparity in crystal structure noted by different investigators of the same mineral.
The field experiments to test for ferroelectric effects reported here are clearly preliminary and more exper- iments are required. Suggested experiments would include explosive- and electrically-excited tests for res- onance at the same site, since ferroelectric minerals must be piezoelectric as well. Perhaps better test sites could also be found. An ideal test site would have a uniformly radial distribution of sulfides and a fiat sur- face.
In addition to more field studies, a great deal of laboratory work to find additional ferroelectric miner- als remains to be done.
Acknowledgements
The field work at Mount Emmons was done while I was employed by the Climax Molybdenum division of AMAX, Inc. I would like to thank AMAX, Inc. for their kind permission to publish the included Mount Emmons field survey data. The field polarization exper- iments would have been impossible without the enthu- siastic support of Zonge Engineering and Research Organization of Tucson, Arizona. The efforts of Dud- ley Emer, then chief geophysicist for Zonge, were often essential in the field program and his help is gratefully acknowledged. Bobbie Baird helped with the field work and data reduction at Three R Canyon.
This work was originally stimulated by a series of discussions and experiments on surface charges of sul- fides with Art Bookstrom. Earl Hoskins provided sup- port and facilities at Texas A&M University for the ferroelectric research on chalcocite and Anthony Gangi read an early draft of the manuscript and provided much useful criticism and support. The paper has greatly ben- efited from the work of, and discussions with, M.Z. Bieniulis. Comments by Douglas J. LaBrecque, Gary Olhoeft, Ralph Shuey, and Maurice Tivey, as well as
the editor, proved very valuable in clarifying my ideas. However, the conclusions are solely those of the author.
References
Bhide, V.G. and Damle, R.V., 1960a. Dielectric properties of man- ganese dioxide, I. Physica, 26: 33--42.
Bhide, V.G. and Damle, R.V., 1960b. Dielectric properties of man- ganese dioxide, II. Physica, 26:513-519.
Bieniulis, M.Z., Corry, C.E. and Hoskins, E.R., 1987. Ferroelectricity in natural samples of chalcocite, Cu2S. Geophys. Res. Lett., 14: 135-138.
Corry, C.E., 1985. Spontaneous polarization associated with por- phyry sulfide mineralization. Geophysics, 50: 1020-1034.
Corry, C.E., Emer, D. and Zonge, K.L., 1987. Controlled source audio-frequency magnetotelluric surveys of porphyry sulfide deposits and prospects in the cordillera of the United States: Proc. N. Am. Conf. Tectonic Control of Ore Deposits and the Vertical and Horizontal Extent of Ore Systems. Univ. Missouri-Rolla, Dep. Geol. & Geophys., pp. 204-213.
Cony, C.E., Carlson, N.R. and Zonge, K.L., 1988. Case histories of controlled source audio-frequency magnetotelluric surveys. 58th Annu. Int. Meet., Soc. Explor. Geophys., Expanded Abstr., pp. 415-418.
Cubiotti, G. and Geracitano, R., 1967. Ferroelectric behavior of cubic ice. Phys. Lea., 24A: 179-180.
Dengel, O., Plitz, U. and Riehl, H., 1964. Ferroelectric behavior of ice. Phys. Lett., 9: 291-292.
Deshpande, L.V. and Bhide, V.G., 1961. Dielectric properties of SnO2. Nuovo Cimento, 10( 19): 816-817.
Fox, R.C., Hohmann, G.W., Killpack, T.J. and Rijo, L., 1980. Top- ographic effects in resistivity and induced-polarization surveys. Geophysics, 45 ( 1 ): 75-93.
Fridkin, VM., 1980. Ferroelectric Semiconductors. Consultants Bureau, New York, NY, 307 pp.
Gavrilova, N.D., Karyakina, N.F., Koptsik, V.A. and Novik, V.K., 197 I. Ferroelectric behavior of the mineral stibiotantalite. Soy. Phys. Dokl., 15: 1075-1077.
Goldsmith, G.J., 1956. Ferroelectricity in colemanite. Bull. Am. Phys. Soc., 1:322 (Abstr.).
Grigas, I., Mozgova, N.N., Orlyuk~s, A. and Samulenis, V., 1976. The phase transitions in CuSbS2 crystals. Sov. Phys. Crystallogr., 20: 741-742.
Hellwege, K.H. and Hellwege, A.M. (Editors), 1982. Ferroelectrics and related substances, subvolume b, non-oxides. Landolt-BiSrn- stein, New Ser., Group III, 16. Springer, New York, NY, 792 pp.
Ismailzade, I.G. and Mirshli, F.A., 1970. High temperature X-ray and dielectric investigation of Bi2WO 6. Sov. Phys, Crystallogr., 14: 636-637.
Jones, A.G., 1983. The problem of "current channelling"; a critical review. Geophys. Surv., 6: 79-122.
Jordan, C.E., Sullivan, G.V., Davis, B.E. and Weaver, C.P., 1980. A continuous dielectric separator for mineral benificiation. R18437, US Bur. Min., 18 pp.

72 C.E. Corry /Journal of Applied Geophysics 32 (1994) 55-72
LeCorre, Y., 1957. I~tude optique et di61ectric de la boracite. J. Phys. Radium, 18: 629-631.
Lines, M.E. and Glass, A.M., 1977. Principles and Applications of Ferroelectrics and Related Materials. Clarendon, Oxford, 680 pp.
Litov, E. and Anderson, O.L., 1978. Possibility of ferroelectric-like phenomena in the mantle of the earth. J. Geophys. Res., 83:1692- 1698.
Matthias, B.T., 1967. The search for new materials. In: E.F. Weller (Editor), Ferroelectricity. Elsevier, Amsterdam, pp. 176-182.
Maxwell, M., Russell, R.D., Narod, B.B. and Ghomsei, M.M., 1987. Piezoelectric and electromechanical exploration methods. EOS, Trans. Am. Geophys. Union, 68: 45.
Nabighian, M. (Editor), 1987. Electromagnetic methods in applied geophysics--Theory, I. Soc. Explor. Geophys., Tulsa, OK, 513 pp.
Newnham, R.E., Kramer, J.J., Schulze, W.A. and Cross, L.E., 1978. Magnetoferrolectricity in Cr2BeO4. J. Appl. Phys., 49: 6088- 6091.
Nicolini, L., 1959. Ferroelectric properties of a material made of titanium oxide. Nuovo Cimento, 10(13): 257-264.
Olhoeft, G.R., 1981. Electrical properties of rocks. In: Y.S. Toulou- klan, W.R. Judd, and R.F. Roy (Editors), Physical Properties of Rocks and Minerals, II-2. McGraw-Hill, New York, NY, pp. 257-329.
Parkhomenko, E.I., 1971. Electricfication Phenomena in Rocks. Ple- num Press, New York, NY, 314 pp,
Pelton, W.H., Ward, S.H., Hallof, P.G., Sill, W.R. and Nelson, P.H., 1978. Mineral discrimination and removal of inductive coupling with multifrequency 1P. Geophysics, 43: 588~509.
Rinkyavichyus, V.S. and Mikalkevichyus, M.P., 1967. Pyroelectric effect in antimony trisulfide single crystals. Soy. Phys. Solid State, 9: 2360-2361.
Sawada, S., Nomura, S. and Fujii, S., 1958. Ferroelectricity in phase II1 of KNO3. J. Phys. Soc. Jpn., 13: 1549.
Schloessin, H.H. and Timco, G.W., 1977. The significance of fer- roelectric phase transitions for the earth and planetary interiors. Phys. Earth Planet. Inter., 14: P6-PI2.
Shirane, G., Hoshino, S. and Suzuki, K., 1950. X-ray study of the phase transition in lead titanate. Phys. Rev., 80:1105-1106.
Sobolev, G.A., Demin, V.M., Narod, B.B. and Whaite, P., 1984. Tests of piezoelectric and pulsed-radio methods for quartz vein and base metal sulfides and Giant Yellowknife mine, N.W.T., and Sullivan mine, Kimberley, Canada. Geophysics, 49: 2178- 2185.
Sumner, J.S., 1976. Principles of Induced Polarization for Geophys- ical Exploration. Elsevier, Amsterdam, 277 pp.
Thomas, N.W., 1991. A computerised method of searching for new ceramic compositions with ferroelectric and piezoelectric prop- erties. Ferroelectr. Lett., 13: 1-12.
Thomas, J.A. and Galey, J.T., Jr., 1978. Mt. Emmons, Colorado molybdenum deposit. Am. Inst. Min. Metall. Pet. Eng., 107th Annu. Meet., Prog., p. 44 (Abstr.).
Van den Berg, C.B., 1970. Ferroelectricity in the system Fe~ _,S. Phys. Status Solidi, 40: K65-K68.
Van den Berg, C.B., 1972. Model for the semiconducting uniaxial ferroelectric Fel _~S. Ferroelectrics, 4:103-116, 195-212.
Van den Berg, C.B., van Delden, J.E. and Bouman, J., 1969. a- transition in FeS--a ferroelectric transition. Phys. Status Solidi, 36: K89-K93.
White, W.H., Bookstrom, A.A., Kamilli, R.J., Ganster, M.W., Smith, R,P., Ranta, D.E. and Steininger, R.C., 198 I. Character mad ori- gin of Climax-type molybdenum deposits. Econ. Geol., 75th Anniv. Vol., pp, 270-316.
Wolfe, R.W., Newnham, R.E. and Kay, M.I., 1969. Crystal structure of Bi2WO 6 . Solid State Commun., 7:1797-1801.
Yuodvirshis, A.V., Kadavichus, V.V. and Pipinis, P.A., 1969, Elec- tron emission, pyroelectric effect, and dielectric properties of bismuth tfisulfide. Soy. Phys. Solid State, 11:1158-I 159
Copyright © 2022 FDOKUMEN