
Hydrogen production from ethanol over Ir/CeO 2 catalysts: A comparative study of steam reforming,...
12
Journal of Catalysis 257 (2008) 96–107 Contents lists available at ScienceDirect Journal of Catalysis www.elsevier.com/locate/jcat Hydrogen production from ethanol over Ir/CeO 2 catalysts: A comparative study of steam reforming, partial oxidation and oxidative steam reforming Weijie Cai a , Fagen Wang a , Ensheng Zhan a , A.C. Van Veen b , Claude Mirodatos b , Wenjie Shen a,∗ a State Key Laboratory of Catalysis, Dalian Institute of Chemical Physics, Chinese Academy of Sciences, Dalian 116023, China b University of Lyon; Institut de Recherches sur la Catalyse et l’Environnement de Lyon (IRCELYON, UMR 5256, CNRS; Université Claude Bernard Lyon 1), 69626 Villeurbanne Cedex, France article info abstract Article history: Received 2 February 2008 Revised 15 April 2008 Accepted 16 April 2008 Available online 21 May 2008 Keywords: Ethanol Hydrogen Ir/CeO 2 Reaction pathway Stability Steam reforming, partial oxidation, and oxidative steam reforming of ethanol over Ir/CeO 2 catalysts were studied to elucidate the reaction pathway and determine catalytic stability. Temperature-programmed desorption and surface reaction revealed that ethoxy species were immediately formed on ethanol adsorption at room temperature, and were mainly further oxidized to acetate and carbonate species that finally decomposed into CH 4 /CO and CO 2 , respectively. Under reaction conditions, acetaldehyde was the primary product below 673 K, which decomposed mainly to methane and carbon monoxide at higher temperatures, whereas methane reforming and the water–gas shift were the major reactions above 773 K. The Ir/CeO 2 catalyst demonstrated rather high stability for the reactions at 823 and 923 K with no apparent deactivation for 60 h on stream; the mean size of Ir particles was stable at around 2–3 nm, but the ceria particles sintered significantly from 6–8 to 14–27 nm. CeO 2 likely prevented the highly dispersed Ir particles from sintering and inhibited coke deposition through strong Ir–CeO 2 interactions. © 2008 Elsevier Inc. All rights reserved. 1. Introduction Bioethanol, a mixture of water and ethanol produced by fer- mentation of biomass, is considered as an attractive feedstock for the sustainable production of hydrogen for fueling polymer elec- trolyte fuel cells [1–3]. Steam reforming (SR), partial oxidation (POX), and oxidative steam reforming (OSR) are effective routes for producing hydrogen from bioethanol. Most studies have focused on the SR of ethanol using supported Ni, Co, and Rh catalysts oper- ated at relatively high temperatures, typically 873–1073 K [4–14]. Among these catalysts, Rh is the most effective system with re- spect to ethanol conversion and hydrogen selectivity [4–7], proba- bly due to its strong capacity for breaking the C–C bond of ethanol, CH 3 CH 2 OH + 3H 2 O → 6H 2 + 2CO 2 . (1) But this reaction is highly endothermic, requiring large amounts of energy, which is a serious drawback to the cost and practicality of hydrogen production, especially for on-board applications. POX of ethanol is an alternative route for the production of hy- drogen using supported Ni, Ru, Pt, and Rh catalysts [15–17]. Ni catalysts exhibited adequate activity for ethanol conversion, but resulted in lower hydrogen productivity [17]. Again, Rh/CeO 2 cat- * Corresponding author. Fax: +86 411 84694447. E-mail address: [email protected] (W. Shen). alysts were significantly more active and selective at 873–1273 K [15], CH 3 CH 2 OH + 1.5O 2 → 3H 2 + 2CO 2 . (2) POX is exothermic and fast, making it suitable for coping with rapid load variations, such as those required for on-board reform- ers, which often work under non-steady-state conditions. However, the yield of hydrogen is much lower than that from SR. OSR of ethanol, being a combination of SR and POX, constitutes a reasonable compromise between energy efficiency and hydro- gen productivity. With a suitable mixture of ethanol, water, and oxygen, the exothermic POX of ethanol provides the heat neces- sary for the endothermic SR of ethanol. Moreover, the presence of oxygen in the reaction mixture also promotes the efficient re- moval of carbon species formed during the course of reaction. Using ethanol, water, and oxygen at a molar ratio of 1:1.8:0.6, the overall reaction can be thermally neutral (H o 298 =+4.4 kJ mol −1 ), and the concentration of hydrogen can approach ∼70% in the out- let stream [18]. Supported Ni, Pt, Rh, and Ir catalysts were reported to be effective for this reaction [18–26], CH 3 CH 2 OH + 1.8H 2 O + 0.6O 2 → 4.8H 2 + 2CO 2 . (3) The reaction mechanism has been extensively examined for the foregoing reactions, and adequate properties in terms of activity and hydrogen productivity have been achieved. But the catalytic stability, which is adversely affected by coke formation during the course of reaction, is rarely addressed and remains an open issue 0021-9517/$ – see front matter © 2008 Elsevier Inc. All rights reserved. doi:10.1016/j.jcat.2008.04.009
-
Upload
independent -
Category
Documents
-
view
1 -
download
0
Transcript of Hydrogen production from ethanol over Ir/CeO 2 catalysts: A comparative study of steam reforming,...
Journal of Catalysis 257 (2008) 96–107
Contents lists available at ScienceDirect
Journal of Catalysis
www.elsevier.com/locate/jcat
Hydrogen production from ethanol over Ir/CeO2 catalysts: A comparative studyof steam reforming, partial oxidation and oxidative steam reforming
Weijie Cai a, Fagen Wang a, Ensheng Zhan a, A.C. Van Veen b, Claude Mirodatos b, Wenjie Shen a,∗a State Key Laboratory of Catalysis, Dalian Institute of Chemical Physics, Chinese Academy of Sciences, Dalian 116023, Chinab University of Lyon; Institut de Recherches sur la Catalyse et l’Environnement de Lyon (IRCELYON, UMR 5256, CNRS; Université Claude Bernard Lyon 1), 69626 Villeurbanne Cedex, France
a r t i c l e i n f o a b s t r a c t
Article history:Received 2 February 2008Revised 15 April 2008Accepted 16 April 2008Available online 21 May 2008
Keywords:EthanolHydrogenIr/CeO2
Reaction pathwayStability
Steam reforming, partial oxidation, and oxidative steam reforming of ethanol over Ir/CeO2 catalysts werestudied to elucidate the reaction pathway and determine catalytic stability. Temperature-programmeddesorption and surface reaction revealed that ethoxy species were immediately formed on ethanoladsorption at room temperature, and were mainly further oxidized to acetate and carbonate species thatfinally decomposed into CH4/CO and CO2, respectively. Under reaction conditions, acetaldehyde was theprimary product below 673 K, which decomposed mainly to methane and carbon monoxide at highertemperatures, whereas methane reforming and the water–gas shift were the major reactions above 773 K.The Ir/CeO2 catalyst demonstrated rather high stability for the reactions at 823 and 923 K with noapparent deactivation for 60 h on stream; the mean size of Ir particles was stable at around 2–3 nm,but the ceria particles sintered significantly from 6–8 to 14–27 nm. CeO2 likely prevented the highlydispersed Ir particles from sintering and inhibited coke deposition through strong Ir–CeO2 interactions.
© 2008 Elsevier Inc. All rights reserved.
1. Introduction
Bioethanol, a mixture of water and ethanol produced by fer-mentation of biomass, is considered as an attractive feedstock forthe sustainable production of hydrogen for fueling polymer elec-trolyte fuel cells [1–3]. Steam reforming (SR), partial oxidation(POX), and oxidative steam reforming (OSR) are effective routes forproducing hydrogen from bioethanol. Most studies have focused onthe SR of ethanol using supported Ni, Co, and Rh catalysts oper-ated at relatively high temperatures, typically 873–1073 K [4–14].Among these catalysts, Rh is the most effective system with re-spect to ethanol conversion and hydrogen selectivity [4–7], proba-bly due to its strong capacity for breaking the C–C bond of ethanol,
CH3CH2OH + 3H2O → 6H2 + 2CO2. (1)
But this reaction is highly endothermic, requiring large amounts ofenergy, which is a serious drawback to the cost and practicality ofhydrogen production, especially for on-board applications.
POX of ethanol is an alternative route for the production of hy-drogen using supported Ni, Ru, Pt, and Rh catalysts [15–17]. Nicatalysts exhibited adequate activity for ethanol conversion, butresulted in lower hydrogen productivity [17]. Again, Rh/CeO2 cat-
* Corresponding author. Fax: +86 411 84694447.E-mail address: [email protected] (W. Shen).
0021-9517/$ – see front matter © 2008 Elsevier Inc. All rights reserved.doi:10.1016/j.jcat.2008.04.009
alysts were significantly more active and selective at 873–1273 K[15],
CH3CH2OH + 1.5O2 → 3H2 + 2CO2. (2)
POX is exothermic and fast, making it suitable for coping withrapid load variations, such as those required for on-board reform-ers, which often work under non-steady-state conditions. However,the yield of hydrogen is much lower than that from SR.
OSR of ethanol, being a combination of SR and POX, constitutesa reasonable compromise between energy efficiency and hydro-gen productivity. With a suitable mixture of ethanol, water, andoxygen, the exothermic POX of ethanol provides the heat neces-sary for the endothermic SR of ethanol. Moreover, the presenceof oxygen in the reaction mixture also promotes the efficient re-moval of carbon species formed during the course of reaction.Using ethanol, water, and oxygen at a molar ratio of 1:1.8:0.6, theoverall reaction can be thermally neutral (�Ho
298 = +4.4 kJ mol−1),and the concentration of hydrogen can approach ∼70% in the out-let stream [18]. Supported Ni, Pt, Rh, and Ir catalysts were reportedto be effective for this reaction [18–26],
CH3CH2OH + 1.8H2O + 0.6O2 → 4.8H2 + 2CO2. (3)
The reaction mechanism has been extensively examined for theforegoing reactions, and adequate properties in terms of activityand hydrogen productivity have been achieved. But the catalyticstability, which is adversely affected by coke formation during thecourse of reaction, is rarely addressed and remains an open issue
W. Cai et al. / Journal of Catalysis 257 (2008) 96–107 97
for practical applications. We previously reported that Ir/CeO2 cat-alysts showed excellent stability for SR and OSR of ethanol at rel-atively low temperatures using approximately stoichiometric feedstreams [4,23].
In the present work, we extended our studies to the reactionpathway and catalytic stability for SR, POX, and OSR of ethanolover the Ir/CeO2 catalyst. We first performed infrared spectroscopyof adsorbed ethanol and temperature-programmed surface reac-tion of ethanol studies to establish the key features of the reactionmechanism, and then compared the temperature-dependence ofSR, POX and OSR of ethanol in terms of hydrogen yield and prod-uct distribution. Finally, we investigated the stability of the Ir/CeO2catalyst under stoichiometric reaction conditions in terms of struc-tural changes derived from X-ray power diffraction (XRD) patternsand high-resolution transmission electron microscopy (HRTEM).
2. Experimental
2.1. Catalyst preparation
CeO2 was prepared by precipitation of ammonia cerium nitratewith urea in an aqueous solution. First, 60 g of (NH4)2Ce(NO3)6and 200 g of urea were dissolved into 2000 ml of water, andthe mixture was heated gradually to 363 K under stirring andkept at this temperature for 27 h. After filtration and thoroughwashing with water, the precipitate was dried at 373 K for 12 h,then calcined for at 673 K for 5 h in air. The Ir/CeO2 cat-alyst with an Ir nominal loading of 2 wt% was prepared bya deposition-precipitation method. CeO2 powder was suspendedin aqueous solution containing appropriate amounts of Ir precur-sor (H2IrCl6·6H2O), and the mixture was heated to 348 K understirring. A 0.25 M Na2CO3 aqueous solution was added graduallyuntil the pH value of the mixture reached 9.0, followed by furtheraging at 348 K for 1 h, during which the precipitate was exclu-sively deposited on the ceria surface. After filtration and washingwith water, the solid obtained was dried at 373 K overnight andfinally calcined at 673 K for 5 h in air.
2.2. Catalyst characterization
N2 adsorption–desorption isotherms were recorded at 77 K us-ing a Quantachrome Nova 4200e instrument. Before the measure-ments, the sample was degassed at 573 K for 2 h. The specific sur-face area was calculated by multipoint Braunauer–Emmett–Teller(BET) analysis of the nitrogen adsorption isotherms. The actualloading of Ir was analyzed by inductively coupled plasma atomicemission spectrometry (ICP-AES), using a PLASMA-SPEC-II device.An appropriate amount of sample was dissolved in aqua regia, andthe resulting mixture was diluted with nitric acid to meet the de-tection range of the instrument.
XRD patterns were recorded using a Rigaku D/MAX-RB diffrac-tor with CuKα radiation source operating at 40 kV and 100 mA.Measurements of the reduction of the Ir/CeO2 catalyst were per-formed in a high-temperature cell installed in the diffractometer.The sample was pressed into a pellet and mounted in the cham-ber. After heating to 473 K under a stream of He, the 5 vol% H2/Hemixture was introduced to the chamber for stepwise heating to thedesired temperature (between 473 and 873 K) for 1 h before theXRD patterns were recorded. The mean crystallite size of ceria wascalculated using Scherrer’s equation [27].
HRTEM images were obtained using a Philips Tecnai G220 mi-croscope operating at 300 kV. Specimens were prepared by ultra-sonically suspending the sample in ethanol. A drop of the suspen-sion was deposited to a thin carbon film supported on a standardcopper grid and dried in air.
Oxygen storage capacity (OSC) was measured in a microreac-tor coupled to a quadrupole mass spectrometer (Omnistar, Balzers).Before analysis, the samples (100 mg) were reduced with 5% H2/Ar(50 ml/min) at 923 K. The sample was purged for 15 min at 923 Kusing flowing Ar, and then cooled to 723 K. A 5% O2/Ar mix-ture (50 ml/min) was then passed through the sample, and theoxygen consumption was measured with a mass spectrometer atm/e = 32.
Fourier transform infrared (FTIR) spectroscopy analysis of ad-sorbed ethanol was performed with a Brucker Vector 22 spec-trometer in diffuse reflectance infrared Fourier transform (DRIFT)mode. Before the analysis, the sample was reduced with 5% H2/Heat 673 K for 1 h. After reduction, the system was purged with He at673 K for 30 min and cooled to room temperature. The adsorptionof ethanol was carried out at room temperature with a flowingmixture of ethanol/He for 1 h, which was obtained by passing Hethrough a saturator containing ethanol at 273 K. After adsorption,the sample was purged with He for 30 min and then heated ata rate of 15 K/min up to 673 K. The spectra were recorded at roomtemperature and at 373, 473, 573, and 673 K.
2.3. Temperature-programmed desorption, surface reaction, andoxidation
Temperature-programmed desorption (TPD) and surface reac-tion (TPSR) of ethanol on the Ir/CeO2 catalyst were conducted ina microreactor equipped with an online mass spectrometer (Om-nistar, Balzers). Before testing, the catalyst (100 mg) was reducedwith 5% H2/He (40 ml/min) at 673 K for 1 h. After reduction,the system was purged with He at 673 K for 30 min and thencooled to room temperature. The adsorption of ethanol was car-ried out at room temperature with a flow of ethanol/He mixturefor 1 h, obtained by passing He through a saturator containingethanol at 273 K. After adsorption, the sample was purged with He(40 ml/min) for 30 min, and then heated at a rate of 15 K/minup to 973 K with flows of pure He (for TPD), 3.0% H2O/He,1.0% O2/He, and 3.0% H2O/1.0% O2/He (for TPSR). The relative yieldsof C-containing products were calculated following the proceduredescribed by Yee et al. [28].
Temperature-programmed oxidation (TPO) of the used catalystwas conducted in the same apparatus. Here 100 mg of the usedcatalyst was loaded, and the system was heated from 298 K to973 K at a rate of 5 K/min with a flow of 5.0% O2/Ar mixture(100 ml/min). The effluent was detected by mass spectrometry.
2.4. Catalytic measurements
Catalytic reactions were conducted in a continuous-flow fixed-bed quartz microreactor at atmospheric pressure. For this, 300 mgof catalyst (40–60 mesh) was loaded and sandwiched by two lay-ers of quartz wool. Before the reaction, the catalyst was reducedwith 5 vol% H2/He (30 ml/min) at 673 K for 1 h. SR and OSRreactions were carried out with stoichiometric feed compositionsof ethanol/water (1:3 molar ratio) and ethanol/water/O2 (1:1.8:0.6molar ratio), respectively. For comparison, POX was carried out us-ing a feed composition of ethanol/O2 (1:0.6 molar ratio). The gashourly space velocity (GHSV) was 6000 ml/gcat/h. Pure ethanol oraqueous ethanol solution were fed by a micropump to a vapor-izer heated to 473 K, and the vapors were mixed with the oxygenstream coming from a mass-flow controller. The effluent from thereactor was analyzed by online gas chromatography. H2, CO, andCO2 were separated by a packed column (HayeSep D) and ana-lyzed by a thermal conductivity detector (TCD) using He as carriergas. Hydrocarbons and oxygenates were separated with a capillarycolumn (INNOWAX) and analyzed with a flame ionization detector(FID).
98 W. Cai et al. / Journal of Catalysis 257 (2008) 96–107
3. Results and discussion
3.1. Structural properties of the Ir/CeO2 catalyst
ICP analysis revealed that the amount of Ir in the Ir/CeO2 cat-alyst was 2.1 wt%, as targeted. The loading of Ir decreased thespecific surface area of ceria only slightly, from 158 to 153 m2/g.
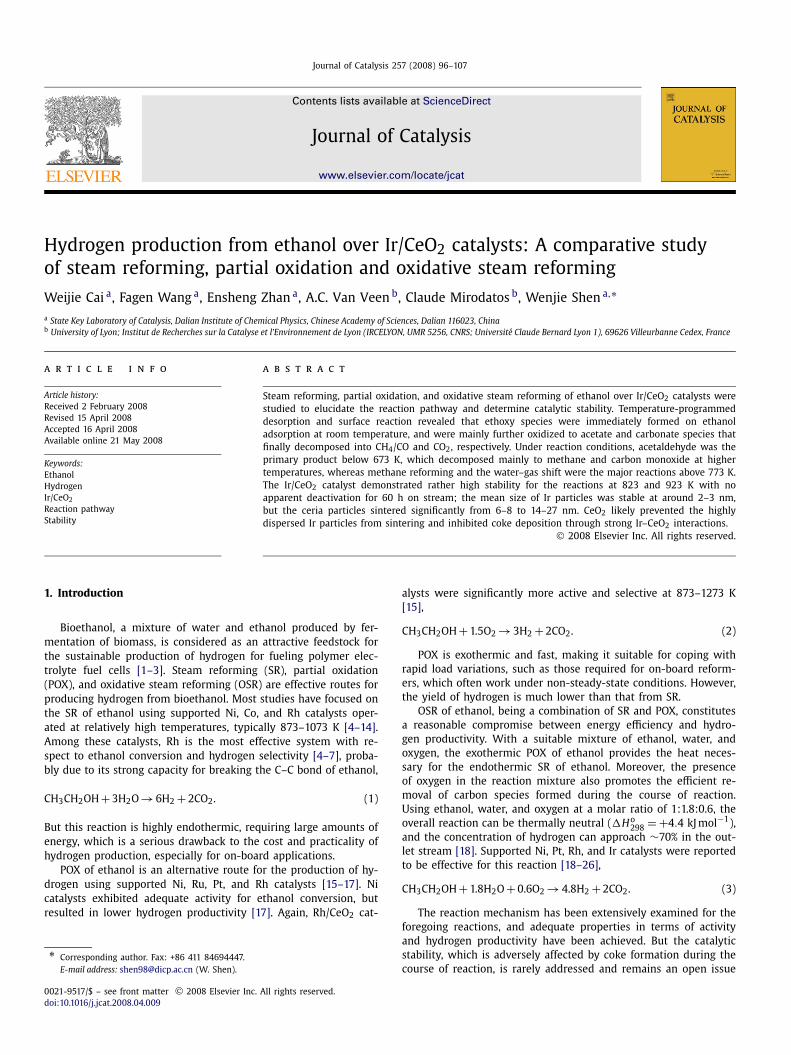
Fig. 1. XRD patterns of CeO2 (a), the as-prepared Ir/CeO2 catalyst (b) and the Ir/CeO2
catalysts after reduction with hydrogen at 473 K (c), 673 K (d) and 873 K (e).
Fig. 1 shows the XRD patterns of the Ir/CeO2 catalysts. Only thediffraction peaks of ceria with fluorite structure were observed forthe as-prepared catalyst, and the average crystalline size was about6 nm. This is in good agreement with the value (5.2 nm) estimatedfrom the surface area. The absence of diffraction peaks from Irspecies indicated that Ir crystalline was highly dispersed on CeO2and was too small to be detected. When the Ir/CeO2 catalyst wasreduced with hydrogen at 473 and 673 K, the crystallite sizes ofceria were still ∼6 nm, suggesting that no sintering had occurred.But the position of diffraction peaks shifted to lower 2θ values,and the diffraction intensities became weaker. This was causedby defects formed through the reduction of surface CeO2, becausethe radius of Ce3+ ions produced by ceria reduction was greaterthan that of Ce4+ ions (0.114 nm vs 0.097 nm) [29]. At 873 K, thediffraction peaks of CeO2 in the reduced catalyst became sharper,and the crystallite size of ceria increased to 9.6 nm. In all cases,no diffraction peaks of Ir metal were detected, however, suggest-ing that the Ir particles were highly dispersed on ceria.
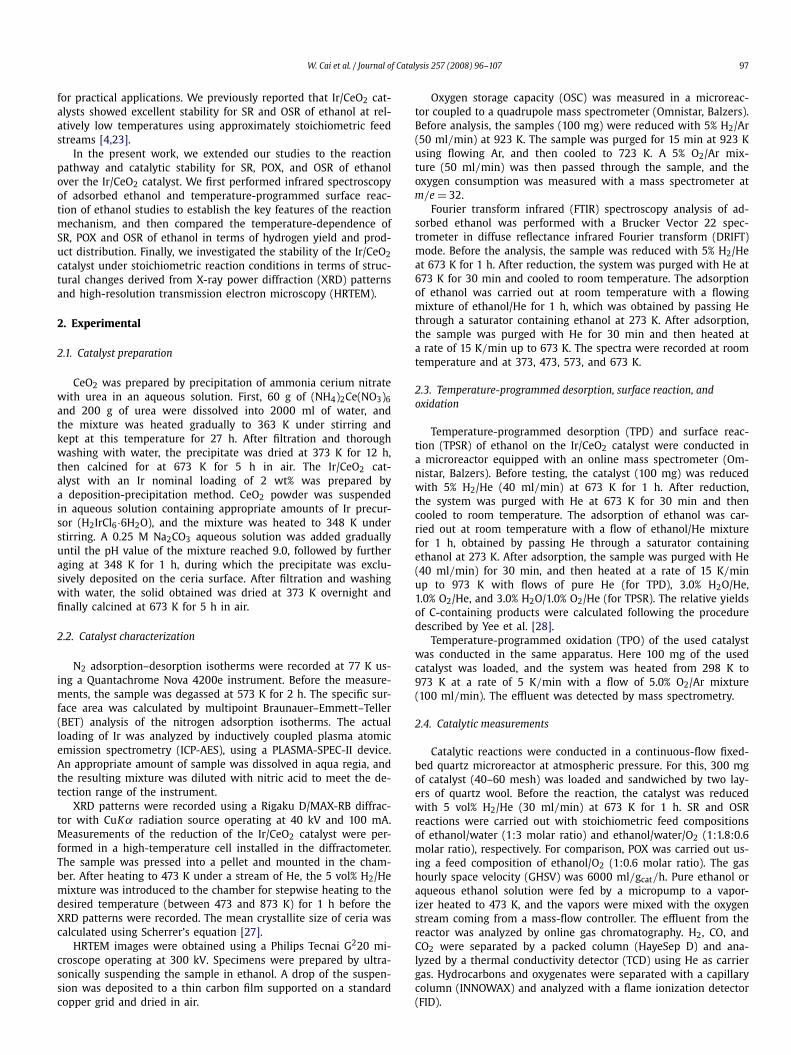
Fig. 2 shows the HRTEM images of the as-prepared Ir/CeO2catalyst. Ceria particle size ranged from 5 to 10 nm, in good accor-dance with XRD and BET measurements. Spherical ceria particleswere poorly crystalline, and their composites were oriented ran-domly and interfaced epitaxially. Ir particles were difficult to see,likely due to their rather small size, but EDX analysis confirmedthe presence of Ir on the CeO2 surface.
OSC of the Ir/CeO2 catalyst indicated a strong interaction be-tween Ir and ceria. Oxygen uptake was 235 μmol O2/g for the pureceria and 596 μmol O2/g for the Ir/CeO2 catalyst. In fact, ceria isknown to have an intrinsically high OSC, and the addition of no-ble metals could promote this property significantly [29–31]. This
Fig. 2. HRTEM images of the as-prepared Ir/CeO2 catalyst.
W. Cai et al. / Journal of Catalysis 257 (2008) 96–107 99
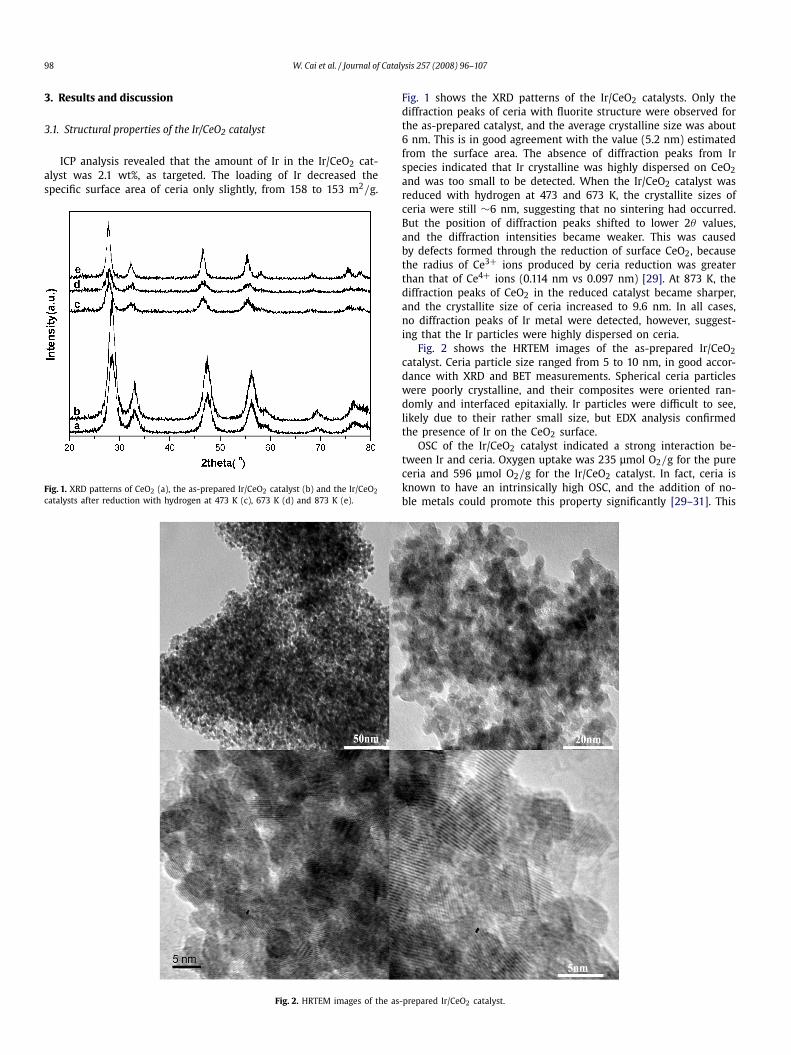
Fig. 3. FTIR spectra of ethanol adsorption on CeO2 (A) and Ir/CeO2 (B).
capacity is associated to the storage/release of oxygen through theCe4+/Ce3+ redox cycle. The specific role of the noble metal in OSCenhancement remains a matter of debate. One possible explana-tion is that part of the added metal forms small oxide clusterswithin the ceria fluorite structure, acting as privileged pathway foroxygen diffusion and storing [30,31]. Our previous temperature-programmed reduction (TPR) results with the Ir/CeO2 catalyst in-dicated that the reduction of ceria was much easier after the ad-dition of Ir, likely due to the strong Ir–ceria interaction [23]. Weproposed that Ir effectively activated hydrogen molecules, whichsubsequently spilled over to the surface CeO2 and reduced it atlow temperatures. This observation is in good agreement with pre-vious findings concerning the reduction of ceria-supported noblemetal catalysts [29–31].
3.2. FTIR of ethanol activation
Fig. 3A shows the IR spectra of adsorbed ethanol on pure CeO2.At room temperature, two types of ethoxy species were formed,characterized by (C–O) bands at 1099 and 1058 cm−1 as monoden-tate and bidentate species, respectively [32,34]. These two bandscorresponded to a combination of νC–C and νC–O stretching vibra-tions, and to the νC–O stretching vibration of a bidentate systemin which the O atom was shared between two adjacent ceriumcations (Table 1). Indeed, adsorption of ethanol on ceria may oc-cur readily through activation of the O–H bond to form an ethoxyspecies bonded to a surface cation of ceria [32–34].
Adsorbed acetate species were observed as a band at 1591 cm−1.Most likely, the adsorbed ethoxy species underwent dehydro-genation to acetaldehyde, which further reacted with the sur-face –OH groups on ceria and produced acetate species [34,35].Thus, both ethoxy and acetate species were readily formed on theCeO2 surface on adsorption of ethanol at room temperature. Thisdemonstrates that the dissociation of ethanol and the reaction ofadsorbed ethoxy species were quite rapid and occurred simulta-neously on the ceria surface. The intensity of the ethoxy speciesdecreased progressively on heating, almost vanishing by 673 K.The intensity of the acetate species increased with increasing tem-perature up to 573 K and then decreased, indicating their decom-position. But no bands associated with carbonates appeared in theνC–O stretching range of 1000–1200 cm−1, even at 673 K, con-
Table 1Bands (in cm−1) of surface species produced by the adsorption of ethanol on CeO2
and Ir/CeO2
Vibrational mode Ir/CeO2 CeO2
Ethoxy speciesνCO-monodentate 1116 1099νCO-bidentate 1053 1058δsCH3 1378 –
Acetate speciesδCH3 1308 –νsOCO 1417 –νasOCO 1550 1591
Carbonate speciesνsOCO-monodentate 1347 –
COνCO linear 2022 –νCO bridging 1926 –
firming that ethoxy and acetate species were the only adsorbedintermediates formed on ceria after adsorption of ethanol.
Fig. 3B shows the IR spectra of adsorbed ethanol on the Ir/CeO2catalyst. As mentioned above, the bands at 1094 and 1053 cm−1
are assigned to monodentate and bidentate ethoxy species, respec-tively, adsorbed on CeO2 at room temperature. The bands at 1116and 1378 cm−1 represent νCO and δsCH3 in ethoxy species [28],respectively. The bands at 1308, 1417, and 1550 cm−1 representthe acetate species formed through the surface reaction of ethoxyspecies. The new band at 1347 cm−1, characteristic of monoden-tate carbonates (Table 1), indicates that further reaction of theacetate species produced carbonate species [34,35]. According tothe assignments of vibrational modes for acetate and carbonatespecies, although it is difficult to identify a species simply by itsvibrational modes in the C–O stretching region, evidence for theformation of carbonate species was obtained by heating the sur-face. As shown in Fig. 3B, the intensity of the bands attributed toethoxy species decreased greatly on heating. At 473 K, the band at1116 cm−1 almost disappeared, and the bands characteristic of lin-ear carbonyl species adsorbed on Ir appeared at 1926 cm−1, indi-cating the decomposition of ethoxy species on Ir particles [31,35].When the temperature was increased to 573 K, the ethoxy speciesadsorbed on the ceria were decomposed to CO. As a result, car-
100 W. Cai et al. / Journal of Catalysis 257 (2008) 96–107
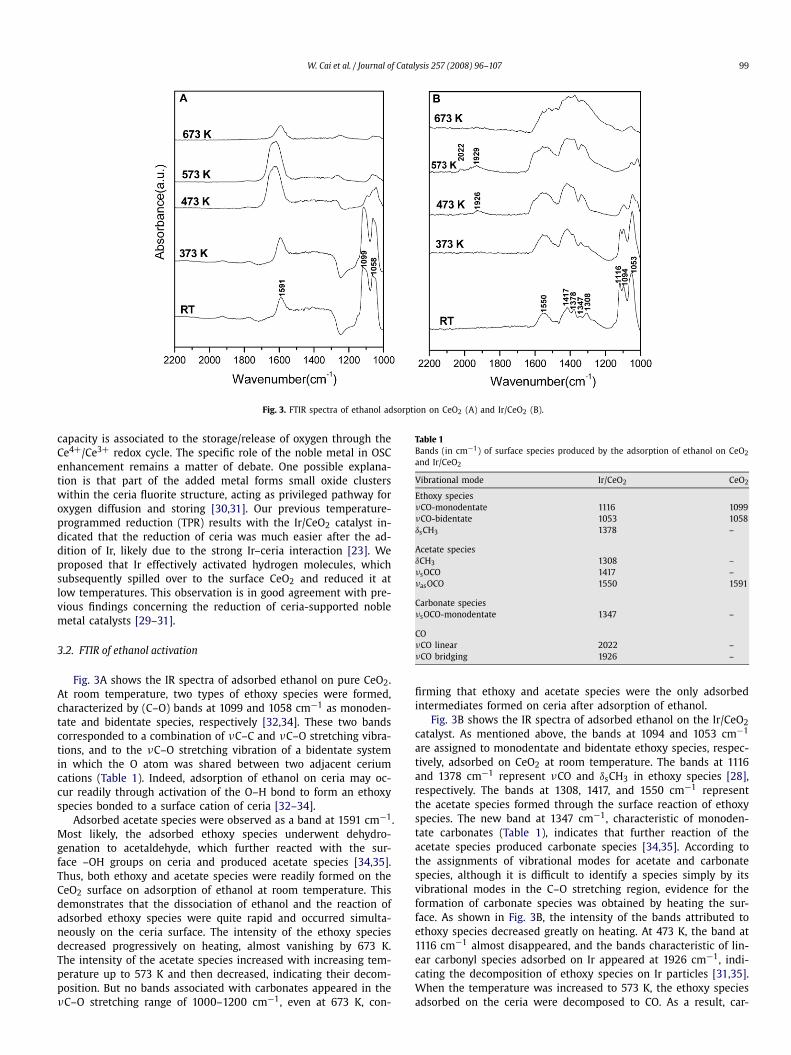
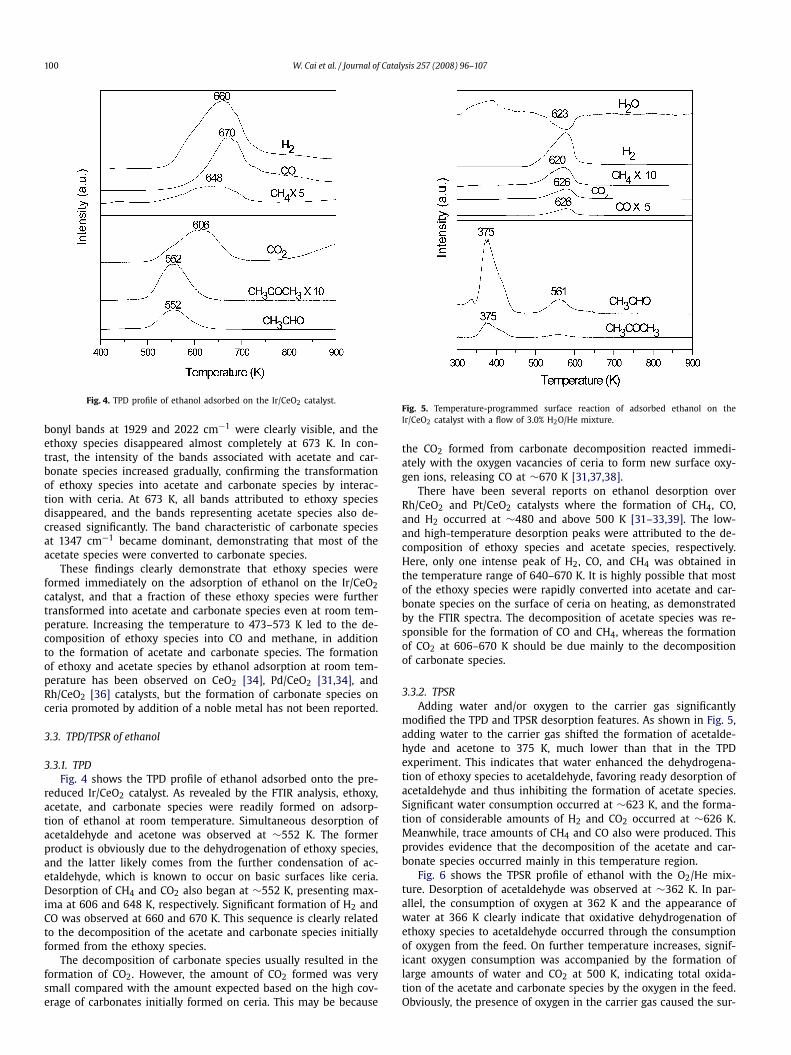
Fig. 4. TPD profile of ethanol adsorbed on the Ir/CeO2 catalyst.
bonyl bands at 1929 and 2022 cm−1 were clearly visible, and theethoxy species disappeared almost completely at 673 K. In con-trast, the intensity of the bands associated with acetate and car-bonate species increased gradually, confirming the transformationof ethoxy species into acetate and carbonate species by interac-tion with ceria. At 673 K, all bands attributed to ethoxy speciesdisappeared, and the bands representing acetate species also de-creased significantly. The band characteristic of carbonate speciesat 1347 cm−1 became dominant, demonstrating that most of theacetate species were converted to carbonate species.
These findings clearly demonstrate that ethoxy species wereformed immediately on the adsorption of ethanol on the Ir/CeO2catalyst, and that a fraction of these ethoxy species were furthertransformed into acetate and carbonate species even at room tem-perature. Increasing the temperature to 473–573 K led to the de-composition of ethoxy species into CO and methane, in additionto the formation of acetate and carbonate species. The formationof ethoxy and acetate species by ethanol adsorption at room tem-perature has been observed on CeO2 [34], Pd/CeO2 [31,34], andRh/CeO2 [36] catalysts, but the formation of carbonate species onceria promoted by addition of a noble metal has not been reported.
3.3. TPD/TPSR of ethanol
3.3.1. TPDFig. 4 shows the TPD profile of ethanol adsorbed onto the pre-
reduced Ir/CeO2 catalyst. As revealed by the FTIR analysis, ethoxy,acetate, and carbonate species were readily formed on adsorp-tion of ethanol at room temperature. Simultaneous desorption ofacetaldehyde and acetone was observed at ∼552 K. The formerproduct is obviously due to the dehydrogenation of ethoxy species,and the latter likely comes from the further condensation of ac-etaldehyde, which is known to occur on basic surfaces like ceria.Desorption of CH4 and CO2 also began at ∼552 K, presenting max-ima at 606 and 648 K, respectively. Significant formation of H2 andCO was observed at 660 and 670 K. This sequence is clearly relatedto the decomposition of the acetate and carbonate species initiallyformed from the ethoxy species.
The decomposition of carbonate species usually resulted in theformation of CO2. However, the amount of CO2 formed was verysmall compared with the amount expected based on the high cov-erage of carbonates initially formed on ceria. This may be because
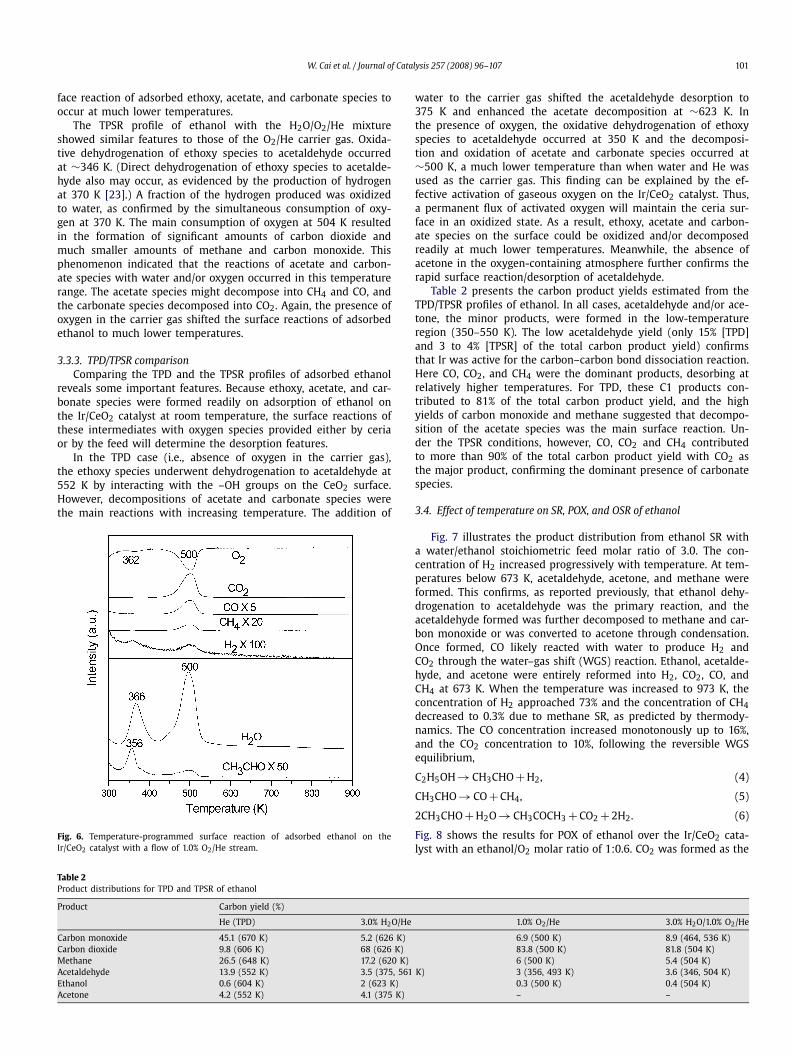
Fig. 5. Temperature-programmed surface reaction of adsorbed ethanol on theIr/CeO2 catalyst with a flow of 3.0% H2O/He mixture.
the CO2 formed from carbonate decomposition reacted immedi-ately with the oxygen vacancies of ceria to form new surface oxy-gen ions, releasing CO at ∼670 K [31,37,38].
There have been several reports on ethanol desorption overRh/CeO2 and Pt/CeO2 catalysts where the formation of CH4, CO,and H2 occurred at ∼480 and above 500 K [31–33,39]. The low-and high-temperature desorption peaks were attributed to the de-composition of ethoxy species and acetate species, respectively.Here, only one intense peak of H2, CO, and CH4 was obtained inthe temperature range of 640–670 K. It is highly possible that mostof the ethoxy species were rapidly converted into acetate and car-bonate species on the surface of ceria on heating, as demonstratedby the FTIR spectra. The decomposition of acetate species was re-sponsible for the formation of CO and CH4, whereas the formationof CO2 at 606–670 K should be due mainly to the decompositionof carbonate species.
3.3.2. TPSRAdding water and/or oxygen to the carrier gas significantly
modified the TPD and TPSR desorption features. As shown in Fig. 5,adding water to the carrier gas shifted the formation of acetalde-hyde and acetone to 375 K, much lower than that in the TPDexperiment. This indicates that water enhanced the dehydrogena-tion of ethoxy species to acetaldehyde, favoring ready desorption ofacetaldehyde and thus inhibiting the formation of acetate species.Significant water consumption occurred at ∼623 K, and the forma-tion of considerable amounts of H2 and CO2 occurred at ∼626 K.Meanwhile, trace amounts of CH4 and CO also were produced. Thisprovides evidence that the decomposition of the acetate and car-bonate species occurred mainly in this temperature region.
Fig. 6 shows the TPSR profile of ethanol with the O2/He mix-ture. Desorption of acetaldehyde was observed at ∼362 K. In par-allel, the consumption of oxygen at 362 K and the appearance ofwater at 366 K clearly indicate that oxidative dehydrogenation ofethoxy species to acetaldehyde occurred through the consumptionof oxygen from the feed. On further temperature increases, signif-icant oxygen consumption was accompanied by the formation oflarge amounts of water and CO2 at 500 K, indicating total oxida-tion of the acetate and carbonate species by the oxygen in the feed.Obviously, the presence of oxygen in the carrier gas caused the sur-
W. Cai et al. / Journal of Catalysis 257 (2008) 96–107 101
face reaction of adsorbed ethoxy, acetate, and carbonate species tooccur at much lower temperatures.
The TPSR profile of ethanol with the H2O/O2/He mixtureshowed similar features to those of the O2/He carrier gas. Oxida-tive dehydrogenation of ethoxy species to acetaldehyde occurredat ∼346 K. (Direct dehydrogenation of ethoxy species to acetalde-hyde also may occur, as evidenced by the production of hydrogenat 370 K [23].) A fraction of the hydrogen produced was oxidizedto water, as confirmed by the simultaneous consumption of oxy-gen at 370 K. The main consumption of oxygen at 504 K resultedin the formation of significant amounts of carbon dioxide andmuch smaller amounts of methane and carbon monoxide. Thisphenomenon indicated that the reactions of acetate and carbon-ate species with water and/or oxygen occurred in this temperaturerange. The acetate species might decompose into CH4 and CO, andthe carbonate species decomposed into CO2. Again, the presence ofoxygen in the carrier gas shifted the surface reactions of adsorbedethanol to much lower temperatures.
3.3.3. TPD/TPSR comparisonComparing the TPD and the TPSR profiles of adsorbed ethanol
reveals some important features. Because ethoxy, acetate, and car-bonate species were formed readily on adsorption of ethanol onthe Ir/CeO2 catalyst at room temperature, the surface reactions ofthese intermediates with oxygen species provided either by ceriaor by the feed will determine the desorption features.
In the TPD case (i.e., absence of oxygen in the carrier gas),the ethoxy species underwent dehydrogenation to acetaldehyde at552 K by interacting with the –OH groups on the CeO2 surface.However, decompositions of acetate and carbonate species werethe main reactions with increasing temperature. The addition of
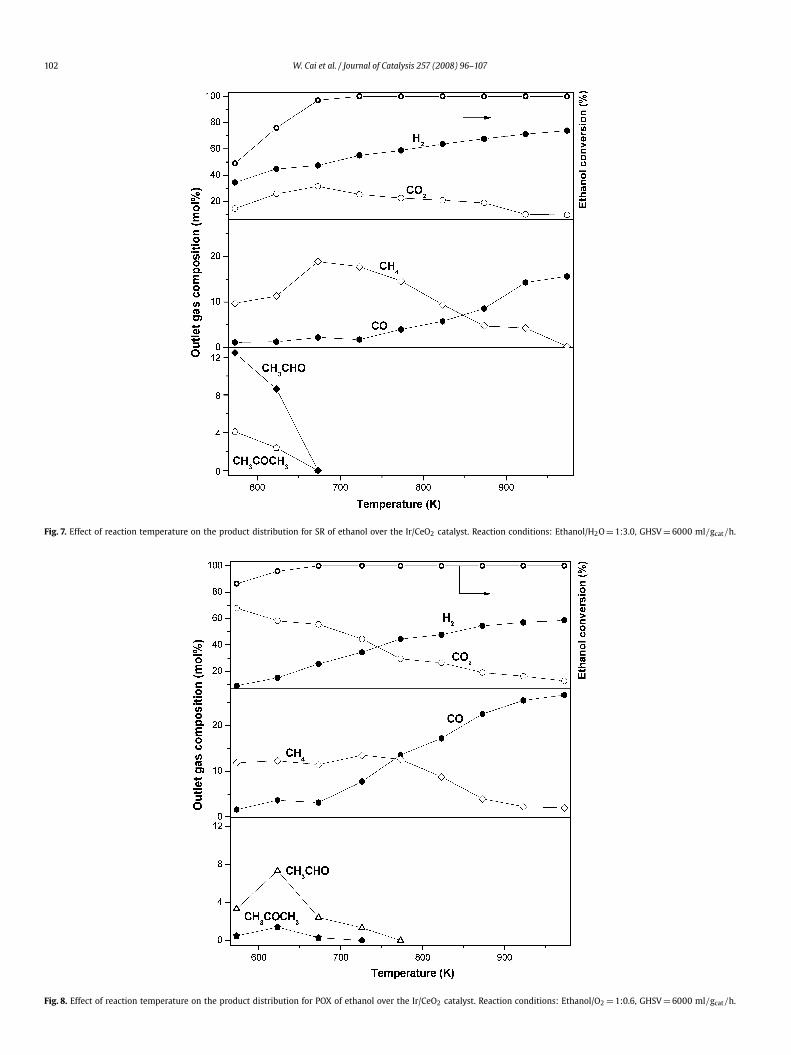
Fig. 6. Temperature-programmed surface reaction of adsorbed ethanol on theIr/CeO2 catalyst with a flow of 1.0% O2/He stream.
water to the carrier gas shifted the acetaldehyde desorption to375 K and enhanced the acetate decomposition at ∼623 K. Inthe presence of oxygen, the oxidative dehydrogenation of ethoxyspecies to acetaldehyde occurred at 350 K and the decomposi-tion and oxidation of acetate and carbonate species occurred at∼500 K, a much lower temperature than when water and He wasused as the carrier gas. This finding can be explained by the ef-fective activation of gaseous oxygen on the Ir/CeO2 catalyst. Thus,a permanent flux of activated oxygen will maintain the ceria sur-face in an oxidized state. As a result, ethoxy, acetate and carbon-ate species on the surface could be oxidized and/or decomposedreadily at much lower temperatures. Meanwhile, the absence ofacetone in the oxygen-containing atmosphere further confirms therapid surface reaction/desorption of acetaldehyde.
Table 2 presents the carbon product yields estimated from theTPD/TPSR profiles of ethanol. In all cases, acetaldehyde and/or ace-tone, the minor products, were formed in the low-temperatureregion (350–550 K). The low acetaldehyde yield (only 15% [TPD]and 3 to 4% [TPSR] of the total carbon product yield) confirmsthat Ir was active for the carbon–carbon bond dissociation reaction.Here CO, CO2, and CH4 were the dominant products, desorbing atrelatively higher temperatures. For TPD, these C1 products con-tributed to 81% of the total carbon product yield, and the highyields of carbon monoxide and methane suggested that decompo-sition of the acetate species was the main surface reaction. Un-der the TPSR conditions, however, CO, CO2 and CH4 contributedto more than 90% of the total carbon product yield with CO2 asthe major product, confirming the dominant presence of carbonatespecies.
3.4. Effect of temperature on SR, POX, and OSR of ethanol
Fig. 7 illustrates the product distribution from ethanol SR witha water/ethanol stoichiometric feed molar ratio of 3.0. The con-centration of H2 increased progressively with temperature. At tem-peratures below 673 K, acetaldehyde, acetone, and methane wereformed. This confirms, as reported previously, that ethanol dehy-drogenation to acetaldehyde was the primary reaction, and theacetaldehyde formed was further decomposed to methane and car-bon monoxide or was converted to acetone through condensation.Once formed, CO likely reacted with water to produce H2 andCO2 through the water–gas shift (WGS) reaction. Ethanol, acetalde-hyde, and acetone were entirely reformed into H2, CO2, CO, andCH4 at 673 K. When the temperature was increased to 973 K, theconcentration of H2 approached 73% and the concentration of CH4decreased to 0.3% due to methane SR, as predicted by thermody-namics. The CO concentration increased monotonously up to 16%,and the CO2 concentration to 10%, following the reversible WGSequilibrium,
C2H5OH → CH3CHO + H2, (4)
CH3CHO → CO + CH4, (5)
2CH3CHO + H2O → CH3COCH3 + CO2 + 2H2. (6)
Fig. 8 shows the results for POX of ethanol over the Ir/CeO2 cata-lyst with an ethanol/O2 molar ratio of 1:0.6. CO2 was formed as the
Table 2Product distributions for TPD and TPSR of ethanol
Product Carbon yield (%)
He (TPD) 3.0% H2O/He 1.0% O2/He 3.0% H2O/1.0% O2/He
Carbon monoxide 45.1 (670 K) 5.2 (626 K) 6.9 (500 K) 8.9 (464, 536 K)Carbon dioxide 9.8 (606 K) 68 (626 K) 83.8 (500 K) 81.8 (504 K)Methane 26.5 (648 K) 17.2 (620 K) 6 (500 K) 5.4 (504 K)Acetaldehyde 13.9 (552 K) 3.5 (375, 561 K) 3 (356, 493 K) 3.6 (346, 504 K)Ethanol 0.6 (604 K) 2 (623 K) 0.3 (500 K) 0.4 (504 K)Acetone 4.2 (552 K) 4.1 (375 K) – –
102 W. Cai et al. / Journal of Catalysis 257 (2008) 96–107
Fig. 7. Effect of reaction temperature on the product distribution for SR of ethanol over the Ir/CeO2 catalyst. Reaction conditions: Ethanol/H2O = 1:3.0, GHSV = 6000 ml/gcat/h.
Fig. 8. Effect of reaction temperature on the product distribution for POX of ethanol over the Ir/CeO2 catalyst. Reaction conditions: Ethanol/O2 = 1:0.6, GHSV = 6000 ml/gcat/h.
W. Cai et al. / Journal of Catalysis 257 (2008) 96–107 103
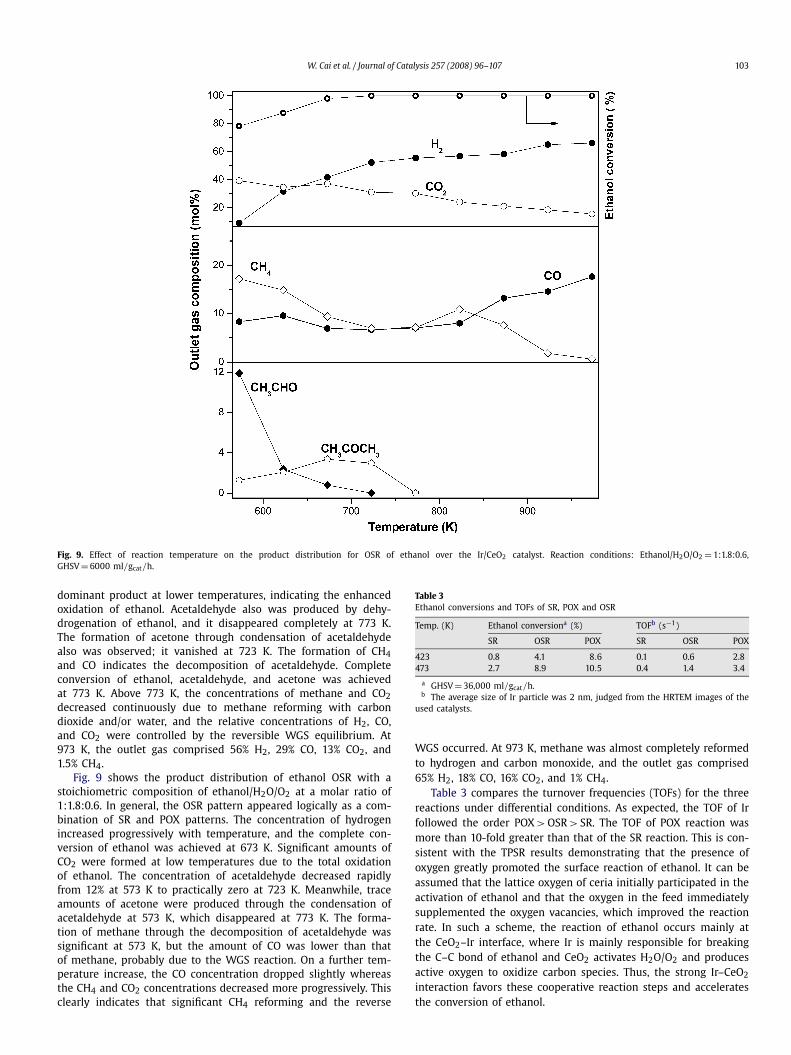
Fig. 9. Effect of reaction temperature on the product distribution for OSR of ethanol over the Ir/CeO2 catalyst. Reaction conditions: Ethanol/H2O/O2 = 1:1.8:0.6,GHSV = 6000 ml/gcat/h.
dominant product at lower temperatures, indicating the enhancedoxidation of ethanol. Acetaldehyde also was produced by dehy-drogenation of ethanol, and it disappeared completely at 773 K.The formation of acetone through condensation of acetaldehydealso was observed; it vanished at 723 K. The formation of CH4and CO indicates the decomposition of acetaldehyde. Completeconversion of ethanol, acetaldehyde, and acetone was achievedat 773 K. Above 773 K, the concentrations of methane and CO2decreased continuously due to methane reforming with carbondioxide and/or water, and the relative concentrations of H2, CO,and CO2 were controlled by the reversible WGS equilibrium. At973 K, the outlet gas comprised 56% H2, 29% CO, 13% CO2, and1.5% CH4.
Fig. 9 shows the product distribution of ethanol OSR with astoichiometric composition of ethanol/H2O/O2 at a molar ratio of1:1.8:0.6. In general, the OSR pattern appeared logically as a com-bination of SR and POX patterns. The concentration of hydrogenincreased progressively with temperature, and the complete con-version of ethanol was achieved at 673 K. Significant amounts ofCO2 were formed at low temperatures due to the total oxidationof ethanol. The concentration of acetaldehyde decreased rapidlyfrom 12% at 573 K to practically zero at 723 K. Meanwhile, traceamounts of acetone were produced through the condensation ofacetaldehyde at 573 K, which disappeared at 773 K. The forma-tion of methane through the decomposition of acetaldehyde wassignificant at 573 K, but the amount of CO was lower than thatof methane, probably due to the WGS reaction. On a further tem-perature increase, the CO concentration dropped slightly whereasthe CH4 and CO2 concentrations decreased more progressively. Thisclearly indicates that significant CH4 reforming and the reverse
Table 3Ethanol conversions and TOFs of SR, POX and OSR
Temp. (K) Ethanol conversiona (%) TOFb (s−1)
SR OSR POX SR OSR POX
423 0.8 4.1 8.6 0.1 0.6 2.8473 2.7 8.9 10.5 0.4 1.4 3.4
a GHSV = 36,000 ml/gcat/h.b The average size of Ir particle was 2 nm, judged from the HRTEM images of the
used catalysts.
WGS occurred. At 973 K, methane was almost completely reformedto hydrogen and carbon monoxide, and the outlet gas comprised65% H2, 18% CO, 16% CO2, and 1% CH4.
Table 3 compares the turnover frequencies (TOFs) for the threereactions under differential conditions. As expected, the TOF of Irfollowed the order POX > OSR > SR. The TOF of POX reaction wasmore than 10-fold greater than that of the SR reaction. This is con-sistent with the TPSR results demonstrating that the presence ofoxygen greatly promoted the surface reaction of ethanol. It can beassumed that the lattice oxygen of ceria initially participated in theactivation of ethanol and that the oxygen in the feed immediatelysupplemented the oxygen vacancies, which improved the reactionrate. In such a scheme, the reaction of ethanol occurs mainly atthe CeO2–Ir interface, where Ir is mainly responsible for breakingthe C–C bond of ethanol and CeO2 activates H2O/O2 and producesactive oxygen to oxidize carbon species. Thus, the strong Ir–CeO2
interaction favors these cooperative reaction steps and acceleratesthe conversion of ethanol.
104 W. Cai et al. / Journal of Catalysis 257 (2008) 96–107
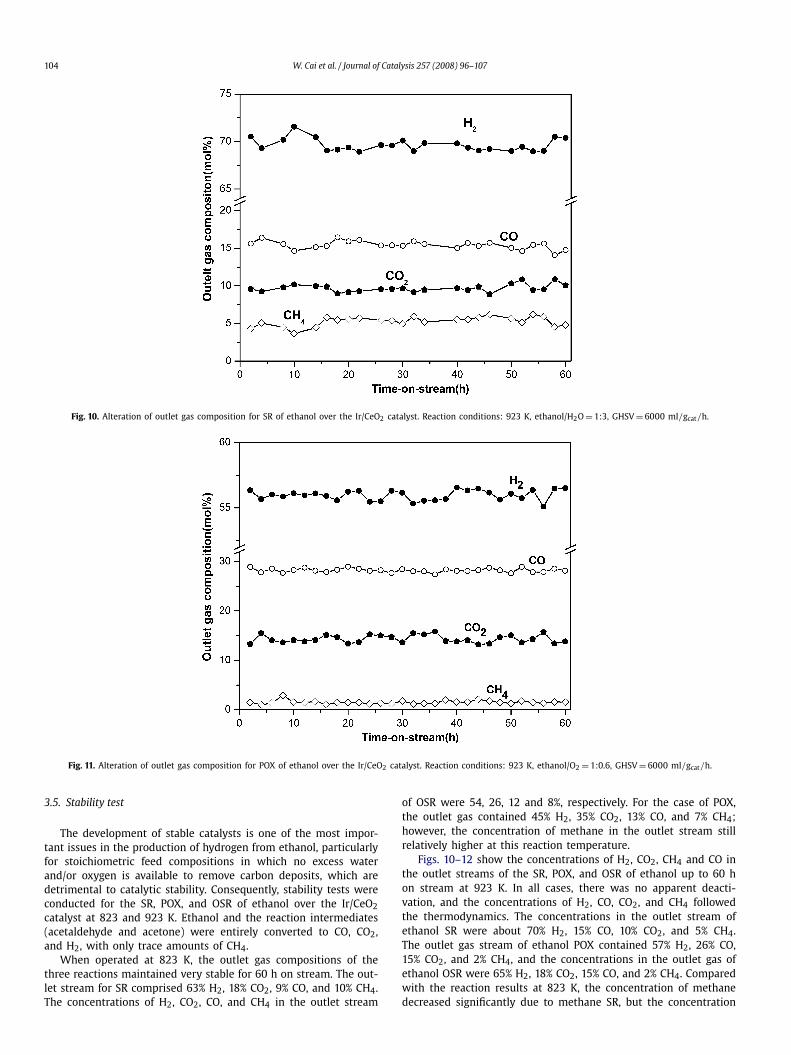
Fig. 10. Alteration of outlet gas composition for SR of ethanol over the Ir/CeO2 catalyst. Reaction conditions: 923 K, ethanol/H2O = 1:3, GHSV = 6000 ml/gcat/h.
Fig. 11. Alteration of outlet gas composition for POX of ethanol over the Ir/CeO2 catalyst. Reaction conditions: 923 K, ethanol/O2 = 1:0.6, GHSV = 6000 ml/gcat/h.
3.5. Stability test
The development of stable catalysts is one of the most impor-tant issues in the production of hydrogen from ethanol, particularlyfor stoichiometric feed compositions in which no excess waterand/or oxygen is available to remove carbon deposits, which aredetrimental to catalytic stability. Consequently, stability tests wereconducted for the SR, POX, and OSR of ethanol over the Ir/CeO2catalyst at 823 and 923 K. Ethanol and the reaction intermediates(acetaldehyde and acetone) were entirely converted to CO, CO2,and H2, with only trace amounts of CH4.
When operated at 823 K, the outlet gas compositions of thethree reactions maintained very stable for 60 h on stream. The out-let stream for SR comprised 63% H2, 18% CO2, 9% CO, and 10% CH4.The concentrations of H2, CO2, CO, and CH4 in the outlet stream
of OSR were 54, 26, 12 and 8%, respectively. For the case of POX,the outlet gas contained 45% H2, 35% CO2, 13% CO, and 7% CH4;however, the concentration of methane in the outlet stream stillrelatively higher at this reaction temperature.
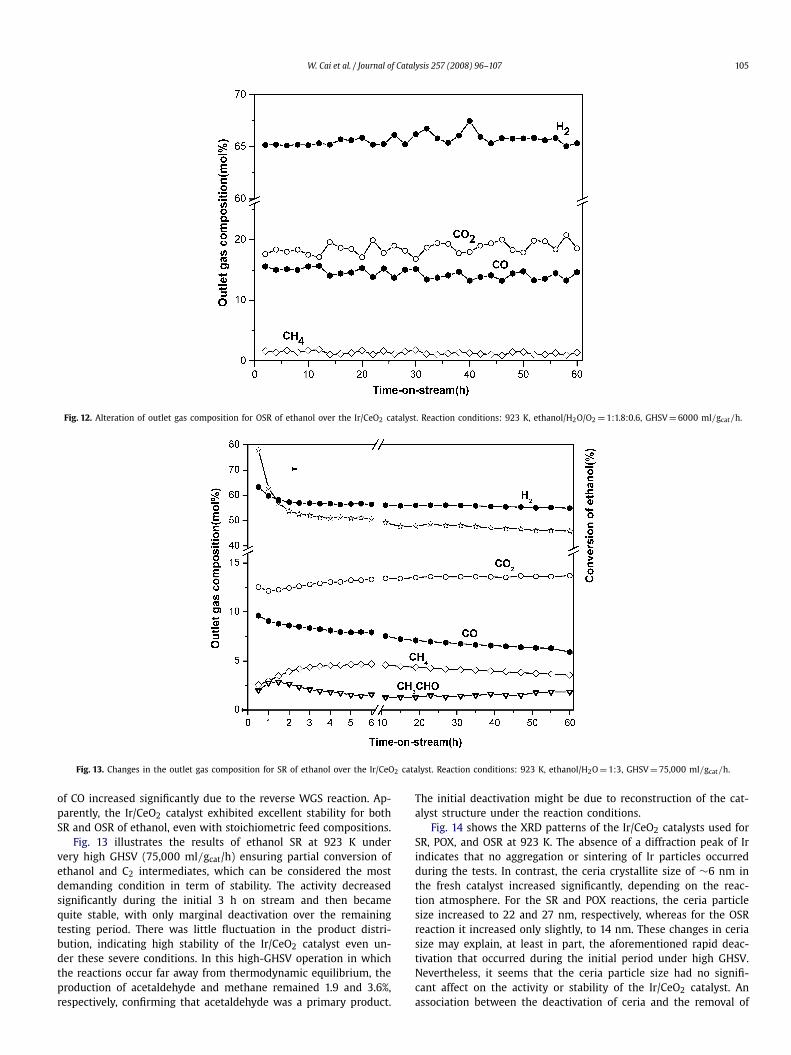
Figs. 10–12 show the concentrations of H2, CO2, CH4 and CO inthe outlet streams of the SR, POX, and OSR of ethanol up to 60 hon stream at 923 K. In all cases, there was no apparent deacti-vation, and the concentrations of H2, CO, CO2, and CH4 followedthe thermodynamics. The concentrations in the outlet stream ofethanol SR were about 70% H2, 15% CO, 10% CO2, and 5% CH4.The outlet gas stream of ethanol POX contained 57% H2, 26% CO,15% CO2, and 2% CH4, and the concentrations in the outlet gas ofethanol OSR were 65% H2, 18% CO2, 15% CO, and 2% CH4. Comparedwith the reaction results at 823 K, the concentration of methanedecreased significantly due to methane SR, but the concentration
W. Cai et al. / Journal of Catalysis 257 (2008) 96–107 105
Fig. 12. Alteration of outlet gas composition for OSR of ethanol over the Ir/CeO2 catalyst. Reaction conditions: 923 K, ethanol/H2O/O2 = 1:1.8:0.6, GHSV = 6000 ml/gcat/h.
Fig. 13. Changes in the outlet gas composition for SR of ethanol over the Ir/CeO2 catalyst. Reaction conditions: 923 K, ethanol/H2O = 1:3, GHSV = 75,000 ml/gcat/h.
of CO increased significantly due to the reverse WGS reaction. Ap-parently, the Ir/CeO2 catalyst exhibited excellent stability for bothSR and OSR of ethanol, even with stoichiometric feed compositions.
Fig. 13 illustrates the results of ethanol SR at 923 K undervery high GHSV (75,000 ml/gcat/h) ensuring partial conversion ofethanol and C2 intermediates, which can be considered the mostdemanding condition in term of stability. The activity decreasedsignificantly during the initial 3 h on stream and then becamequite stable, with only marginal deactivation over the remainingtesting period. There was little fluctuation in the product distri-bution, indicating high stability of the Ir/CeO2 catalyst even un-der these severe conditions. In this high-GHSV operation in whichthe reactions occur far away from thermodynamic equilibrium, theproduction of acetaldehyde and methane remained 1.9 and 3.6%,respectively, confirming that acetaldehyde was a primary product.
The initial deactivation might be due to reconstruction of the cat-alyst structure under the reaction conditions.
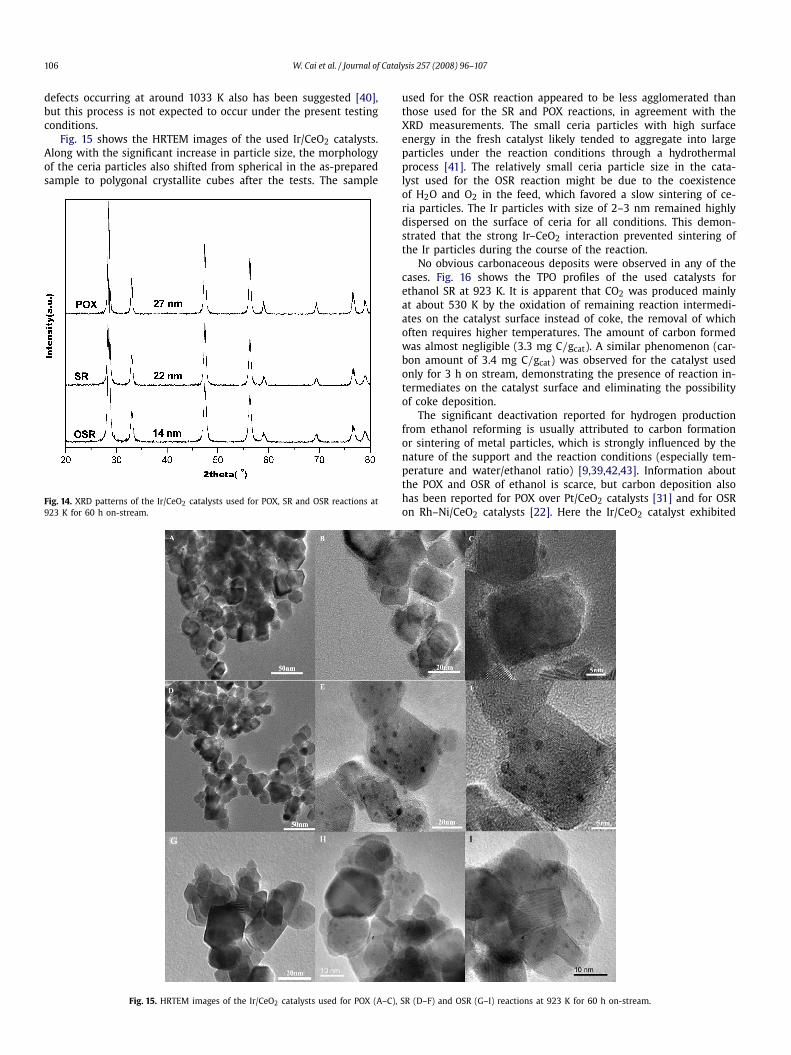
Fig. 14 shows the XRD patterns of the Ir/CeO2 catalysts used forSR, POX, and OSR at 923 K. The absence of a diffraction peak of Irindicates that no aggregation or sintering of Ir particles occurredduring the tests. In contrast, the ceria crystallite size of ∼6 nm inthe fresh catalyst increased significantly, depending on the reac-tion atmosphere. For the SR and POX reactions, the ceria particlesize increased to 22 and 27 nm, respectively, whereas for the OSRreaction it increased only slightly, to 14 nm. These changes in ceriasize may explain, at least in part, the aforementioned rapid deac-tivation that occurred during the initial period under high GHSV.Nevertheless, it seems that the ceria particle size had no signifi-cant affect on the activity or stability of the Ir/CeO2 catalyst. Anassociation between the deactivation of ceria and the removal of
106 W. Cai et al. / Journal of Catalysis 257 (2008) 96–107
defects occurring at around 1033 K also has been suggested [40],but this process is not expected to occur under the present testingconditions.
Fig. 15 shows the HRTEM images of the used Ir/CeO2 catalysts.Along with the significant increase in particle size, the morphologyof the ceria particles also shifted from spherical in the as-preparedsample to polygonal crystallite cubes after the tests. The sample
Fig. 14. XRD patterns of the Ir/CeO2 catalysts used for POX, SR and OSR reactions at923 K for 60 h on-stream.
used for the OSR reaction appeared to be less agglomerated thanthose used for the SR and POX reactions, in agreement with theXRD measurements. The small ceria particles with high surfaceenergy in the fresh catalyst likely tended to aggregate into largeparticles under the reaction conditions through a hydrothermalprocess [41]. The relatively small ceria particle size in the cata-lyst used for the OSR reaction might be due to the coexistenceof H2O and O2 in the feed, which favored a slow sintering of ce-ria particles. The Ir particles with size of 2–3 nm remained highlydispersed on the surface of ceria for all conditions. This demon-strated that the strong Ir–CeO2 interaction prevented sintering ofthe Ir particles during the course of the reaction.
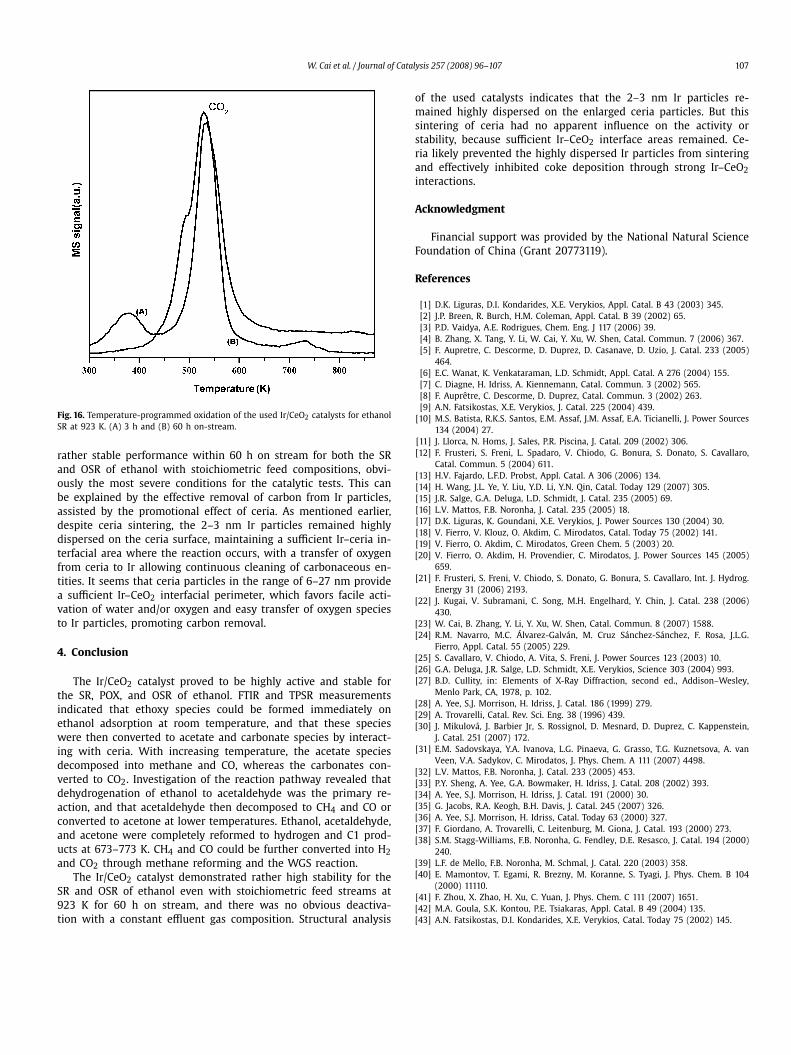
No obvious carbonaceous deposits were observed in any of thecases. Fig. 16 shows the TPO profiles of the used catalysts forethanol SR at 923 K. It is apparent that CO2 was produced mainlyat about 530 K by the oxidation of remaining reaction intermedi-ates on the catalyst surface instead of coke, the removal of whichoften requires higher temperatures. The amount of carbon formedwas almost negligible (3.3 mg C/gcat). A similar phenomenon (car-bon amount of 3.4 mg C/gcat) was observed for the catalyst usedonly for 3 h on stream, demonstrating the presence of reaction in-termediates on the catalyst surface and eliminating the possibilityof coke deposition.
The significant deactivation reported for hydrogen productionfrom ethanol reforming is usually attributed to carbon formationor sintering of metal particles, which is strongly influenced by thenature of the support and the reaction conditions (especially tem-perature and water/ethanol ratio) [9,39,42,43]. Information aboutthe POX and OSR of ethanol is scarce, but carbon deposition alsohas been reported for POX over Pt/CeO2 catalysts [31] and for OSRon Rh–Ni/CeO2 catalysts [22]. Here the Ir/CeO2 catalyst exhibited
Fig. 15. HRTEM images of the Ir/CeO2 catalysts used for POX (A–C), SR (D–F) and OSR (G–I) reactions at 923 K for 60 h on-stream.
W. Cai et al. / Journal of Catalysis 257 (2008) 96–107 107
Fig. 16. Temperature-programmed oxidation of the used Ir/CeO2 catalysts for ethanolSR at 923 K. (A) 3 h and (B) 60 h on-stream.
rather stable performance within 60 h on stream for both the SRand OSR of ethanol with stoichiometric feed compositions, obvi-ously the most severe conditions for the catalytic tests. This canbe explained by the effective removal of carbon from Ir particles,assisted by the promotional effect of ceria. As mentioned earlier,despite ceria sintering, the 2–3 nm Ir particles remained highlydispersed on the ceria surface, maintaining a sufficient Ir–ceria in-terfacial area where the reaction occurs, with a transfer of oxygenfrom ceria to Ir allowing continuous cleaning of carbonaceous en-tities. It seems that ceria particles in the range of 6–27 nm providea sufficient Ir–CeO2 interfacial perimeter, which favors facile acti-vation of water and/or oxygen and easy transfer of oxygen speciesto Ir particles, promoting carbon removal.
4. Conclusion
The Ir/CeO2 catalyst proved to be highly active and stable forthe SR, POX, and OSR of ethanol. FTIR and TPSR measurementsindicated that ethoxy species could be formed immediately onethanol adsorption at room temperature, and that these specieswere then converted to acetate and carbonate species by interact-ing with ceria. With increasing temperature, the acetate speciesdecomposed into methane and CO, whereas the carbonates con-verted to CO2. Investigation of the reaction pathway revealed thatdehydrogenation of ethanol to acetaldehyde was the primary re-action, and that acetaldehyde then decomposed to CH4 and CO orconverted to acetone at lower temperatures. Ethanol, acetaldehyde,and acetone were completely reformed to hydrogen and C1 prod-ucts at 673–773 K. CH4 and CO could be further converted into H2and CO2 through methane reforming and the WGS reaction.
The Ir/CeO2 catalyst demonstrated rather high stability for theSR and OSR of ethanol even with stoichiometric feed streams at923 K for 60 h on stream, and there was no obvious deactiva-tion with a constant effluent gas composition. Structural analysis
of the used catalysts indicates that the 2–3 nm Ir particles re-mained highly dispersed on the enlarged ceria particles. But thissintering of ceria had no apparent influence on the activity orstability, because sufficient Ir–CeO2 interface areas remained. Ce-ria likely prevented the highly dispersed Ir particles from sinteringand effectively inhibited coke deposition through strong Ir–CeO2interactions.
Acknowledgment
Financial support was provided by the National Natural ScienceFoundation of China (Grant 20773119).
References
[1] D.K. Liguras, D.I. Kondarides, X.E. Verykios, Appl. Catal. B 43 (2003) 345.[2] J.P. Breen, R. Burch, H.M. Coleman, Appl. Catal. B 39 (2002) 65.[3] P.D. Vaidya, A.E. Rodrigues, Chem. Eng. J 117 (2006) 39.[4] B. Zhang, X. Tang, Y. Li, W. Cai, Y. Xu, W. Shen, Catal. Commun. 7 (2006) 367.[5] F. Aupretre, C. Descorme, D. Duprez, D. Casanave, D. Uzio, J. Catal. 233 (2005)
464.[6] E.C. Wanat, K. Venkataraman, L.D. Schmidt, Appl. Catal. A 276 (2004) 155.[7] C. Diagne, H. Idriss, A. Kiennemann, Catal. Commun. 3 (2002) 565.[8] F. Auprêtre, C. Descorme, D. Duprez, Catal. Commun. 3 (2002) 263.[9] A.N. Fatsikostas, X.E. Verykios, J. Catal. 225 (2004) 439.
[10] M.S. Batista, R.K.S. Santos, E.M. Assaf, J.M. Assaf, E.A. Ticianelli, J. Power Sources134 (2004) 27.
[11] J. Llorca, N. Homs, J. Sales, P.R. Piscina, J. Catal. 209 (2002) 306.[12] F. Frusteri, S. Freni, L. Spadaro, V. Chiodo, G. Bonura, S. Donato, S. Cavallaro,
Catal. Commun. 5 (2004) 611.[13] H.V. Fajardo, L.F.D. Probst, Appl. Catal. A 306 (2006) 134.[14] H. Wang, J.L. Ye, Y. Liu, Y.D. Li, Y.N. Qin, Catal. Today 129 (2007) 305.[15] J.R. Salge, G.A. Deluga, L.D. Schmidt, J. Catal. 235 (2005) 69.[16] L.V. Mattos, F.B. Noronha, J. Catal. 235 (2005) 18.[17] D.K. Liguras, K. Goundani, X.E. Verykios, J. Power Sources 130 (2004) 30.[18] V. Fierro, V. Klouz, O. Akdim, C. Mirodatos, Catal. Today 75 (2002) 141.[19] V. Fierro, O. Akdim, C. Mirodatos, Green Chem. 5 (2003) 20.[20] V. Fierro, O. Akdim, H. Provendier, C. Mirodatos, J. Power Sources 145 (2005)
659.[21] F. Frusteri, S. Freni, V. Chiodo, S. Donato, G. Bonura, S. Cavallaro, Int. J. Hydrog.
Energy 31 (2006) 2193.[22] J. Kugai, V. Subramani, C. Song, M.H. Engelhard, Y. Chin, J. Catal. 238 (2006)
430.[23] W. Cai, B. Zhang, Y. Li, Y. Xu, W. Shen, Catal. Commun. 8 (2007) 1588.[24] R.M. Navarro, M.C. Álvarez-Galván, M. Cruz Sánchez-Sánchez, F. Rosa, J.L.G.
Fierro, Appl. Catal. 55 (2005) 229.[25] S. Cavallaro, V. Chiodo, A. Vita, S. Freni, J. Power Sources 123 (2003) 10.[26] G.A. Deluga, J.R. Salge, L.D. Schmidt, X.E. Verykios, Science 303 (2004) 993.[27] B.D. Cullity, in: Elements of X-Ray Diffraction, second ed., Addison–Wesley,
Menlo Park, CA, 1978, p. 102.[28] A. Yee, S.J. Morrison, H. Idriss, J. Catal. 186 (1999) 279.[29] A. Trovarelli, Catal. Rev. Sci. Eng. 38 (1996) 439.[30] J. Mikulová, J. Barbier Jr, S. Rossignol, D. Mesnard, D. Duprez, C. Kappenstein,
J. Catal. 251 (2007) 172.[31] E.M. Sadovskaya, Y.A. Ivanova, L.G. Pinaeva, G. Grasso, T.G. Kuznetsova, A. van
Veen, V.A. Sadykov, C. Mirodatos, J. Phys. Chem. A 111 (2007) 4498.[32] L.V. Mattos, F.B. Noronha, J. Catal. 233 (2005) 453.[33] P.Y. Sheng, A. Yee, G.A. Bowmaker, H. Idriss, J. Catal. 208 (2002) 393.[34] A. Yee, S.J. Morrison, H. Idriss, J. Catal. 191 (2000) 30.[35] G. Jacobs, R.A. Keogh, B.H. Davis, J. Catal. 245 (2007) 326.[36] A. Yee, S.J. Morrison, H. Idriss, Catal. Today 63 (2000) 327.[37] F. Giordano, A. Trovarelli, C. Leitenburg, M. Giona, J. Catal. 193 (2000) 273.[38] S.M. Stagg-Williams, F.B. Noronha, G. Fendley, D.E. Resasco, J. Catal. 194 (2000)
240.[39] L.F. de Mello, F.B. Noronha, M. Schmal, J. Catal. 220 (2003) 358.[40] E. Mamontov, T. Egami, R. Brezny, M. Koranne, S. Tyagi, J. Phys. Chem. B 104
(2000) 11110.[41] F. Zhou, X. Zhao, H. Xu, C. Yuan, J. Phys. Chem. C 111 (2007) 1651.[42] M.A. Goula, S.K. Kontou, P.E. Tsiakaras, Appl. Catal. B 49 (2004) 135.[43] A.N. Fatsikostas, D.I. Kondarides, X.E. Verykios, Catal. Today 75 (2002) 145.